Article

Prediction of Compressive Behavior of Laser-Powder-Bed Fusion-Processed TPMS Lattices by Regression Analysis

1
General Electric Aerospace, Gebze 41400, Turkey
2
Department of Mechanical Engineering, University of Bath, Bath BA2 7AY, UK
*
Author to whom correspondence should be addressed.
J. Manuf. Mater. Process. 2024, 8(1), 16; https://doi.org/10.3390/jmmp8010016
Submission received: 26 December 2023 / Revised: 16 January 2024 / Accepted: 19 January 2024 / Published: 21 January 2024

Abstract

:
Triply periodic minimal surface (TPMS) structures offer lightweight and high-stiffness solutions to different industrial applications. However, testing of these structures to calculate their mechanical properties is expensive. Therefore, it is important to predict the mechanical properties of these structures effectively. This study focuses on the effectiveness of using regression analysis and equations based on experimental results to predict the mechanical properties of diamond, gyroid, and primitive TPMS structures with different volume fractions and build orientations. Gyroid, diamond, and primitive specimens with three different volume fractions (0.2, 0.3, and 0.4) were manufactured using a laser powder bed fusion (LPBF) additive manufacturing process using three different build orientations (45°, 60°, and 90°) in the present study. Experimental and statistical results revealed that regression analysis and related equations can be used to predict the mass, yield stress, elastic modulus, specific energy absorption, and onset of densification values of TPMS structures with an intermediate volume fraction value and specified build orientation with an error range less than 1.4%, 7.1%, 19.04%, 21.6%, and 13.4%, respectively.

1. Introduction

Triply periodic minimal surface (TPMS) lattice structures have recently attracted great attention due to their superior characteristics such as low weight, high energy absorption, and favorable thermal capabilities. These structures have zero mean curvatures and are modelled by mathematical equations [1]. Diamond, gyroid, and primitive structures are three different types of TPMS structures mostly used in different industrial applications [2]. Table 1 shows the mathematical equations used to generate these structures and Figure 1 shows the three-dimensional representation of diamond, gyroid, and primitive structures.
TPMS lattice structures can be manufactured by conventional manufacturing methods; however, due to its need for molds, fixtures, or machining, the manufacturing of these structures with these methods is expensive. Thanks to the advancements in different additive manufacturing (AM) technologies, the manufacturing of these lattice structures is easier and less expensive today [4]. The LPBF process is one of the metal AM processes where laser energy is used to melt the metal powders on a build plate based on computer-aided-design geometry. After melting one metal powder layer, the machine platform lowers by the amount of one layer thickness and fresh powder is spread onto the previous layer. The process finishes when the whole part is fully melted, layer by layer [5]. LPBF is a thermal process; therefore, support structures are needed, especially under overhanging surfaces, to prevent the part from distortion and dimensional deviation due to high thermal residual stresses [6]. Since TPMS lattices have inclined and three-dimensionally connected surfaces, support structures are not needed during manufacturing of these structures in LPBF process since each layer will be supported by the previous layers [7].
In most of the industrial applications where TPMS lattices are used, these structures undergo compressive loading. Under compressive loading, these structures show three different behaviors: (i) elastic behavior where structures undergo elastic deformation; (ii) plastic behavior where structures show constant or oscillating stress; and (iii) finally, densification behavior, above which a very high stress is needed to deform the structures, meaning that the structures behave like a solid structure. In the scientific literature, different studies focused on the behavior of different types of TPMS lattices under compressive loading. Zheng et al.’s study [8] presented that primitive structures showed higher strength and stiffness as compared to gyroid and diamond structures under compressive loading. A similar conclusion was also drawn by Maskery et al. [9]. Yu et al. investigated the mechanical and energy absorption behaviors of functionally graded gyroid and primitive structures and stated that using grading enhanced the energy absorption characteristics of primitive structures but had little effect on gyroid structures [10]. Novak et al. investigated the mechanical response of longitudinally and radially graded hybrid (containing both gyroid and diamond) structures experimentally and numerically, and proposed a computational model in LS-DYNA that had good agreement with the experimental results [11]. Novak et al. tested 316L stainless-steel diamond, gyroid, primitive, and I-graph and wrapped package (IWP) structures produced by an LPBF process under compression loading. They reported that diamond and primitive lattices showed the highest and the lowest plateau stress and specific energy absorption, respectively [12]. Sokullu et al.’s study compared different lattices produced using electron beam powder bed fusion and reported that the diamond lattices showed the highest plateau stress, whereas the primitive lattice showed the lowest. However, for specific energy absorption, gyroid lattices outperformed when compared with diamond and primitive lattices [13]. Gülcan et al. stated that for different volume fractions, generally, diamond lattices showed higher yield stress and specific energy absorption than gyroid and primitive lattices produced by LPBF from CoCr material [14]. Zhang et al.’s study revealed that LPBF-produced 316L stainless-steel diamond lattices showed more favorable mechanical properties than gyroid and primitive lattices [15]. Al Mahri et al.’s study on LPBF-produced 316L stainless-steel TPMS lattices showed similar results; diamond and primitive lattices showed the highest and lowest energy absorption, respectively [16]. Naghavi et al. stated that LPBF-produced Ti6Al4V diamond lattices showed nearly a 65% higher stiffness and nearly a 48% greater strength than gyroid structures at the same pore size [17]. Teng et al.’s experimental study on LPBF-produced 316L stainless-steel TPMS structures revealed that gyroid lattices had a higher energy absorption, plateau stress, yield stress, elastic modulus than primitive structures [18].
Although TPMS structures offer lightweight and high-stiffness solutions to different industrial applications, the testing of these structures is expensive. Therefore, modelling and simulation of these structures to understand the mechanical properties is essential. However, since TPMS structures have very complex features, the modelling of these structures requires time-consuming computational efforts [19]. For this reason, alternative approaches to effectively predict the compressive behavior of TPMS structures seems to be an urgent issue.
This study focused on predicting the compressive behavior of TPMS structures using regression analysis. Gyroid, diamond, and primitive specimens with three different volume fractions (0.2, 0.3, and 0.4) were manufactured using the LPBF process using three different build orientations (45°, 60°, and 90°) in the present study. Apart from the TPMS type, volume fraction and build orientation were also selected as design variables since they play an important role in the compressive behavior of TPMS lattice structures produced by the LPBF process [20]. Statistical evaluations based on regression analysis were compared with the test results for TPMS lattices with a 0.35 volume fraction and 90° build orientation angle.
The structure of the remainder of this paper is as follows: Section 2 explains the materials and methods used in the study. In Section 3, the results from the manufacturing, compression testing, regression analysis, and validation analysis based on an intermediate volume fraction are given. The related test result discussions are also included in Section 3. The paper is concluded in Section 4 by giving the main findings.

2. Materials and Methods

2.1. TPMS Lattice Structure Design

Gyroid, diamond, and primitive specimens with an 8 mm unit cell size and 32 × 32 × 32 mm outer dimensions were modelled using MSLattice software v1.0 developed by Oraib Al-Ketan et al. [21]. Three different volume fractions (0.2, 0.3, and 0.4) and three different build orientations (45°, 60°, and 90°) were used. Volume fractions were selected to be less than 0.5, since above that value, the specimens became nearly solid structures. Under each TPMS structure, line supports, where the interaction between the support structure and the part is along a line, with related build orientation angles were used. The geometries were obtained using the design of experiments method. Among different design of experiments methods in the literature, the Taguchi design of experiments method was used to reduce the number of experiments. In the Taguchi method, different orthogonal arrays representing a different number of specimens with different design variables can be used. Since there were three design variables (TPMS type, volume fraction, and build orientation) with three levels in the present study, an L9 Taguchi orthogonal array was implemented. In this array, there are 9 specimens with design variables as shown in Table 2.

2.2. Additive Manufacturing of the TPMS Lattice Structures

A spherical CoCrMo powder (GE Additive, Mölnlycke, Sweden) with a 10–45 µm particle size (<10 µm: max. 5% < 45 µm: min. 95%) produced by the gas atomization technique was used in manufacturing. A Concept Laser M2 LPBF machine (Concept Laser GmbH, Lichtenfels, Germany) was used to manufacture the specimens. Before manufacturing, the build plate was heated to 70 °C. During the process, layer thickness, laser power, scanning speed, and hatch spacing values were set to 50 µm, 180 W, 1500 mm/s and 60 µm, respectively. For each of the 9 different specimens, two repetitions, hence a total of 18 specimens, were manufactured and tested, and average values of the results were used in the experiments.
Manufactured specimens with the build plate were removed from the LPBF machine and placed in a Solukon SFM-AT800 machine (Solukon Maschinenbau GmbH, Augsburg, Germany) to remove the excess powder inside the TPMS structures. After the powder removal process, the TPMS structures were removed from the build plate using a wire electrical discharge machine (Agie Charmilles Ltd., Biel, Switzerland). Then, line supports were removed from the TPMS structures manually. A Zeiss Merlin FE-SEM scanning electron microscope (Carl Zeiss AG, Jena, Germany) was used for metallographic studies.

2.3. Compression Test

The Instron 5985 universal testing machine (Instron Inc., Norwood, MA, USA) was used for compression tests with a crosshead displacement of 0.5 mm/min. A 100 kN load cell was utilized during the tests. The test results were in the form of load–displacement curves. Using a 1024 mm2 (32 mm × 32 mm) cross-sectional area of the specimens, these curves were converted into stress–strain curves. Yield stress, elastic modulus, energy absorption (the area under the load–displacement curve up to densification strain), and the onset of densification of different TPMS types with different volume fractions and build orientations were calculated based on these curves using Matlab software (R2019b, MathWorks, Natick, MA, USA). A Sartorius GC 1603 SOCE model weight-measuring device was used to measure the weight of each specimen. These weight results were then used to calculate the specific energy absorption values.
Experimental results were imported into Minitab software (19.2020.1, Minitab Inc., State College, PA, USA) and regression analyses were performed. Obtained regression equations were then used to predict the mass, yield stress, elastic modulus, specific energy absorption, and the onset of densification of TPMS structures with intermediate volume fractions. As a validation study, gyroid, diamond, and primitive specimens with a 90° build orientation and 0.35 volume fraction were produced and tested. Two repetitions for each of the specimens and a total of six specimens were manufactured for the validation study. Then, predicted results based on regression equations were compared with the experimental results of these specimens.

2.4. Compression and Energy Absorption Indicators

Some key performance indicators for lattice structures are required to evaluate the compression results. In general, the specific energy absorption capacity (SEA) is used to underline the energy absorption capacity of lattice structures of a unit weight in order to define their usefulness in weight-bearing applications. For this reason, first, the total energy absorption value (EA) is calculated by multiplying the outbox volume (V) of the lattice structure with the area under the stress–stain curve to the onset of the densification strain (εd), as seen in Equation (1).
E A = V 0 ε d σ ( ε ) d ε
Then, the SEA value is calculated based on the absorbed energy per mass (m) using Equation (2).
S E A = E A m
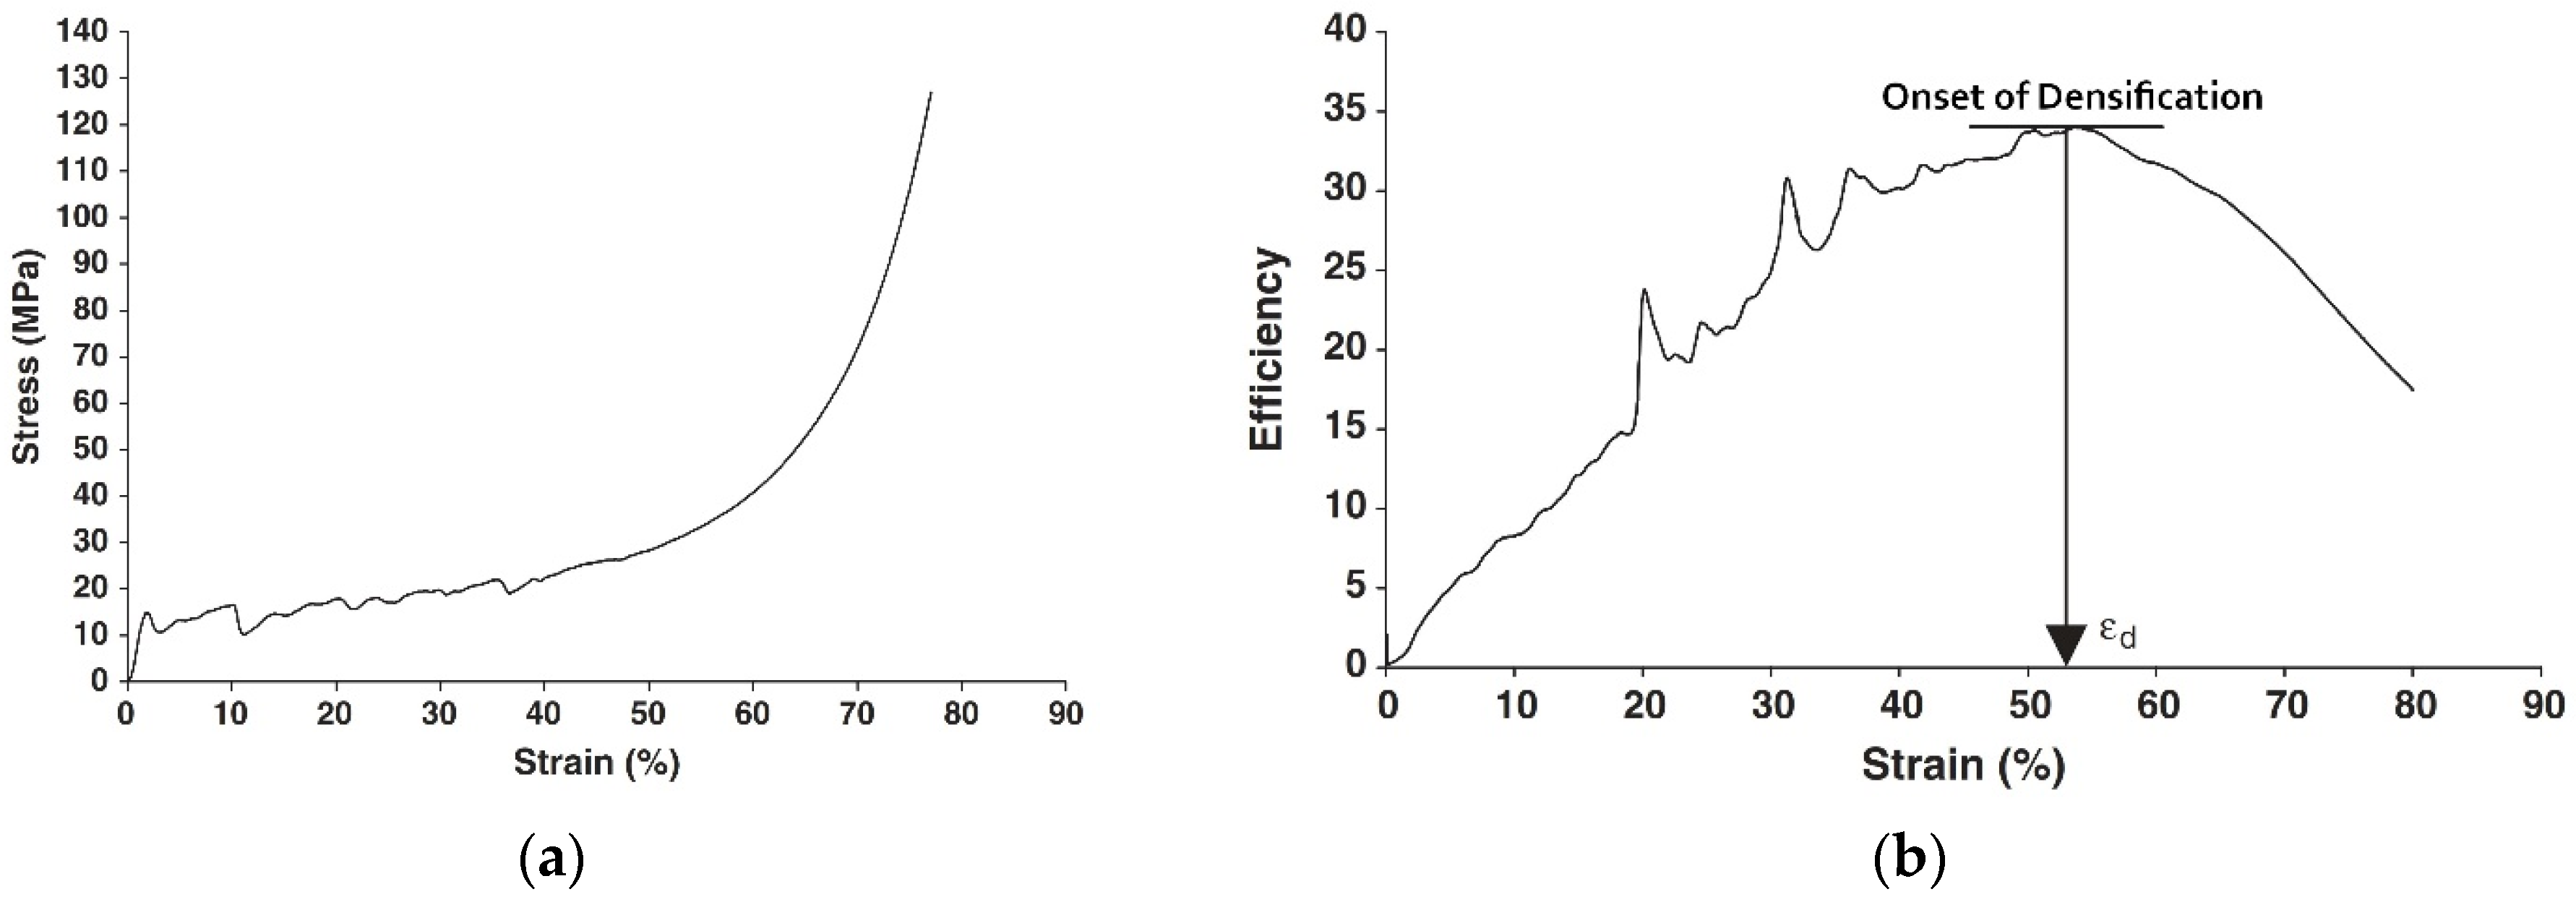
In order to define the onset of densification, determine the optimal energy absorption of the lattice structure, and provide a numerical method for better comparison of the SEA of different lattice structures, an energy efficiency parameter is calculated based on the stress–strain curve (Figure 2a) and is defined by Equation (3).
η ε = 1 σ ( ε ) 0 ε σ ε d ε
A representative strain value showing the onset of densification is calculated using Equation (4), which demonstrates the maximum point of the efficiency–strain curve of the lattice structure (Figure 2b) [22,23].
d η ε d ε ε = ε d = 0

3. Results and Discussions

3.1. Manufacturing and Inspection Results

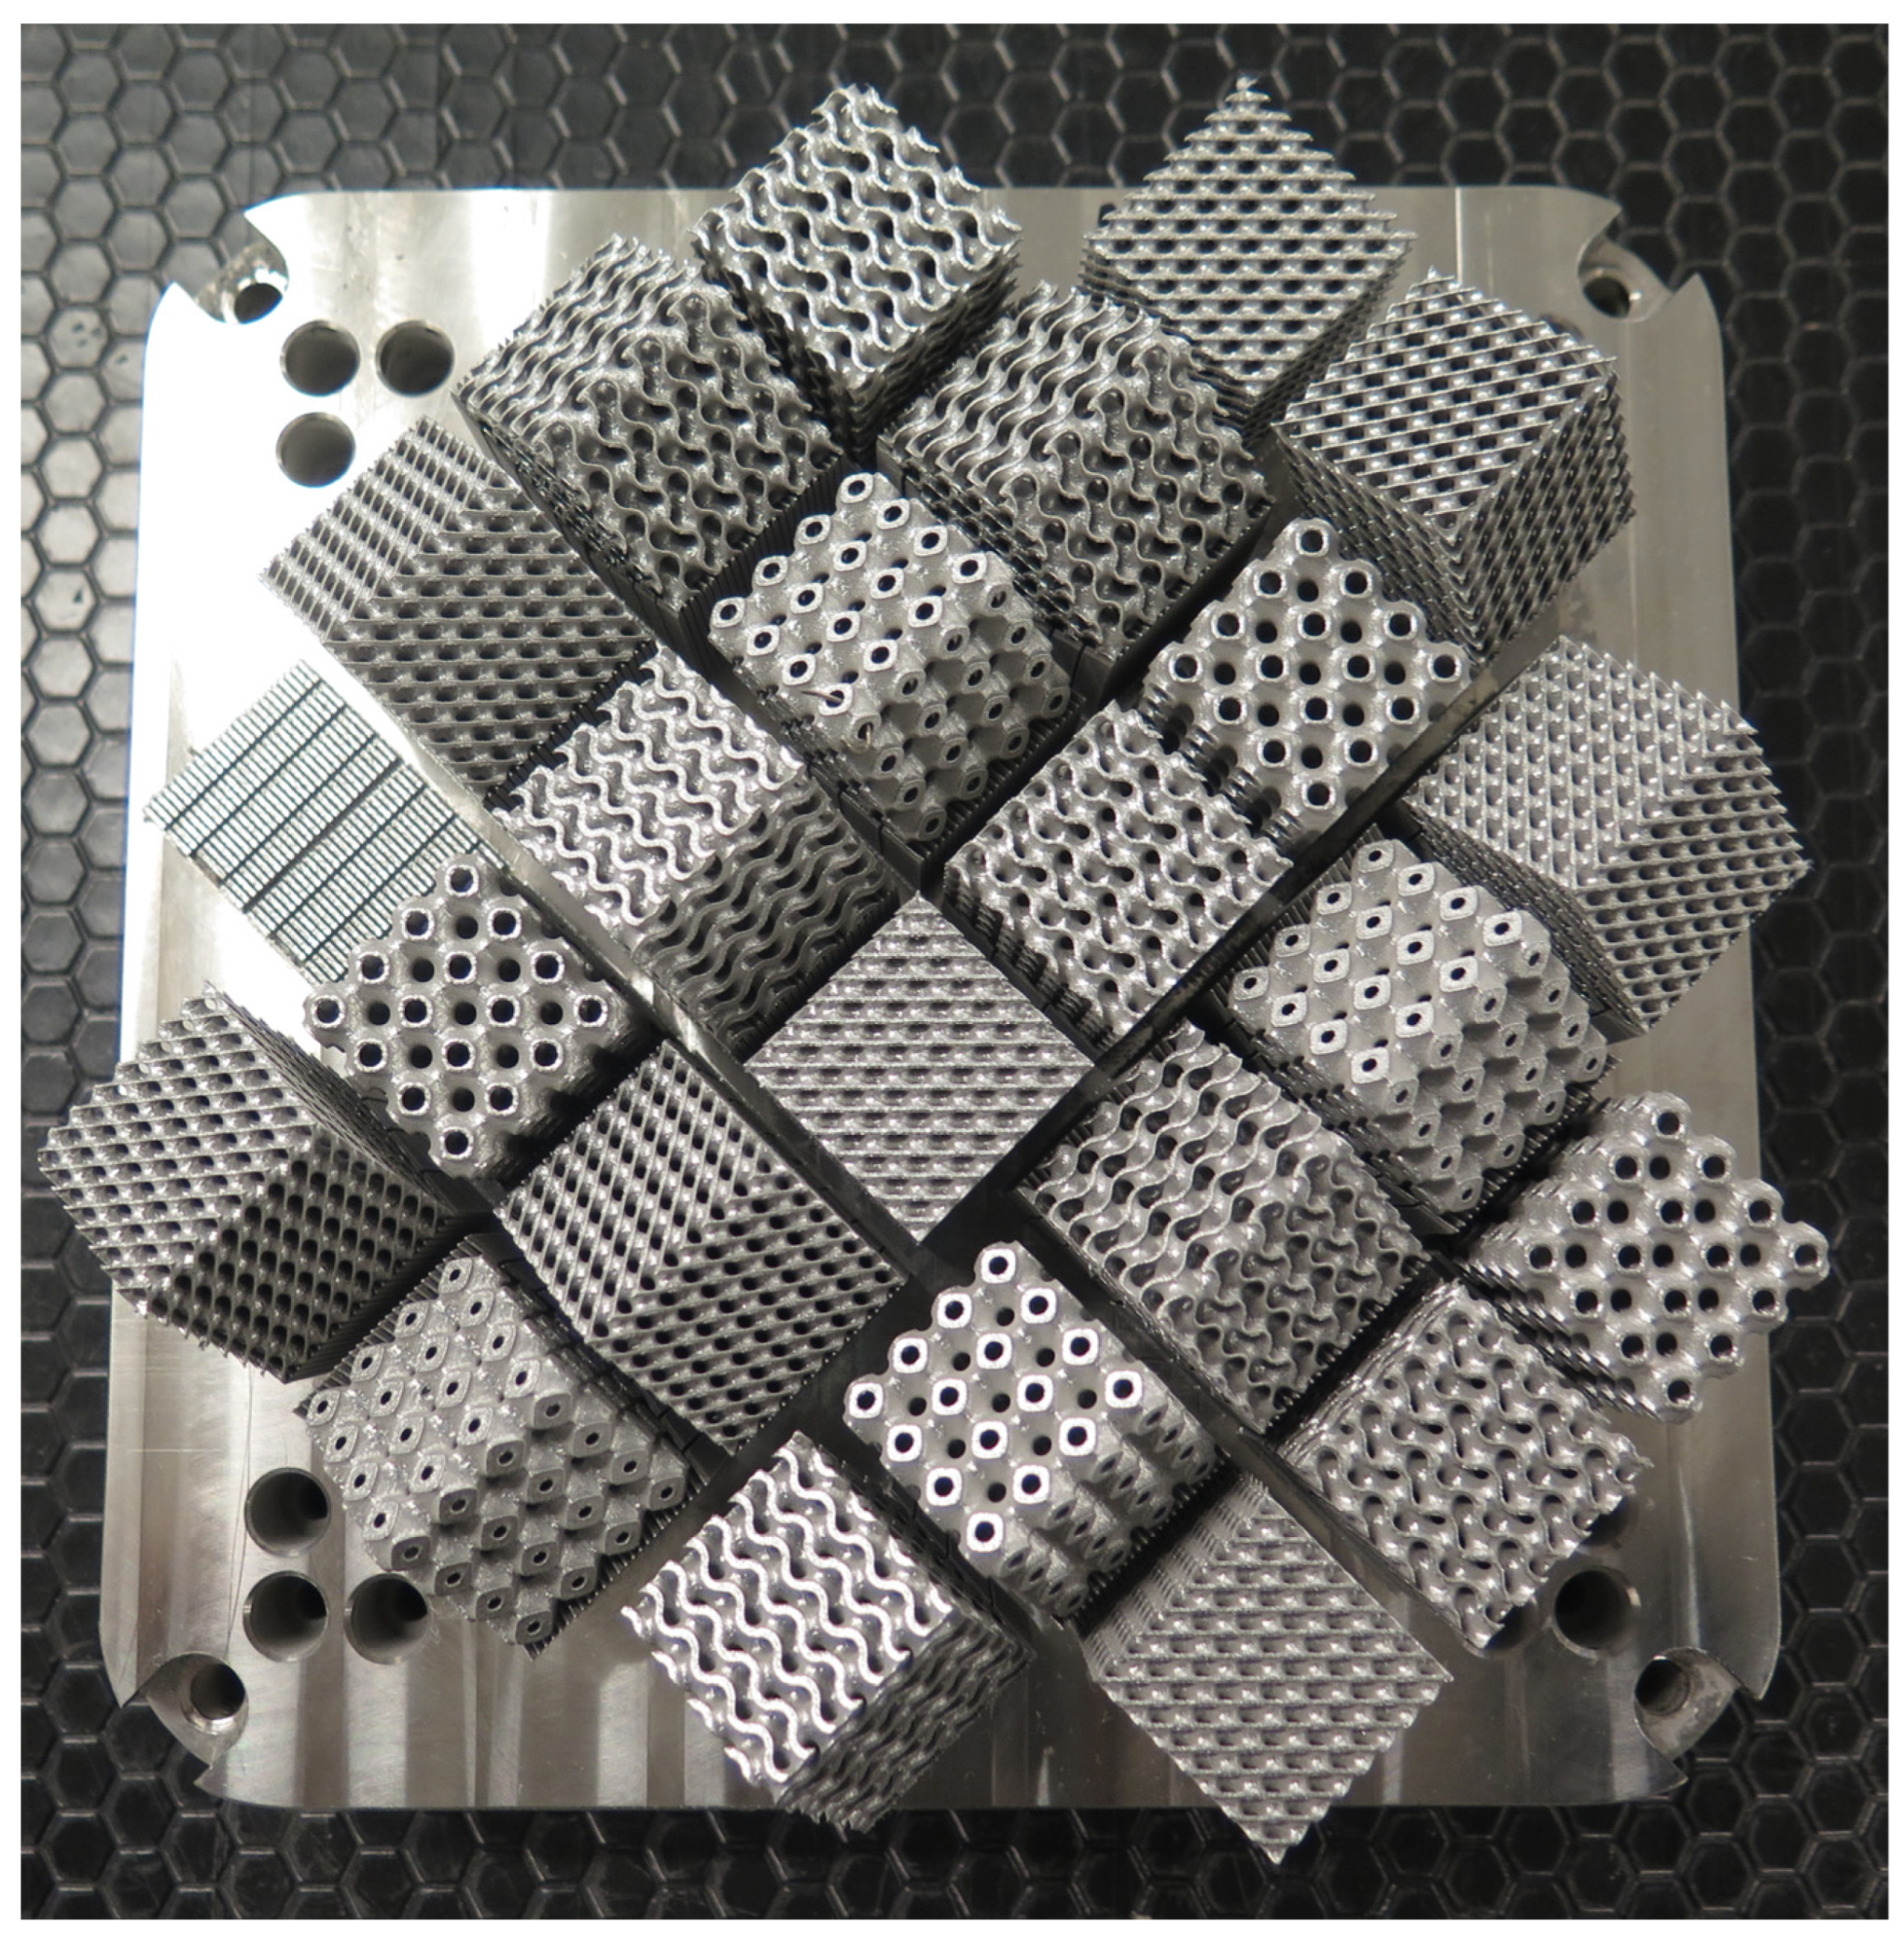
All of the 24 manufactured specimens on the build plate are shown in Figure 3. TPMS structures and line supports were successfully built without any observed failures with the exception of one validation study specimen.

3.2. Compression Test Results

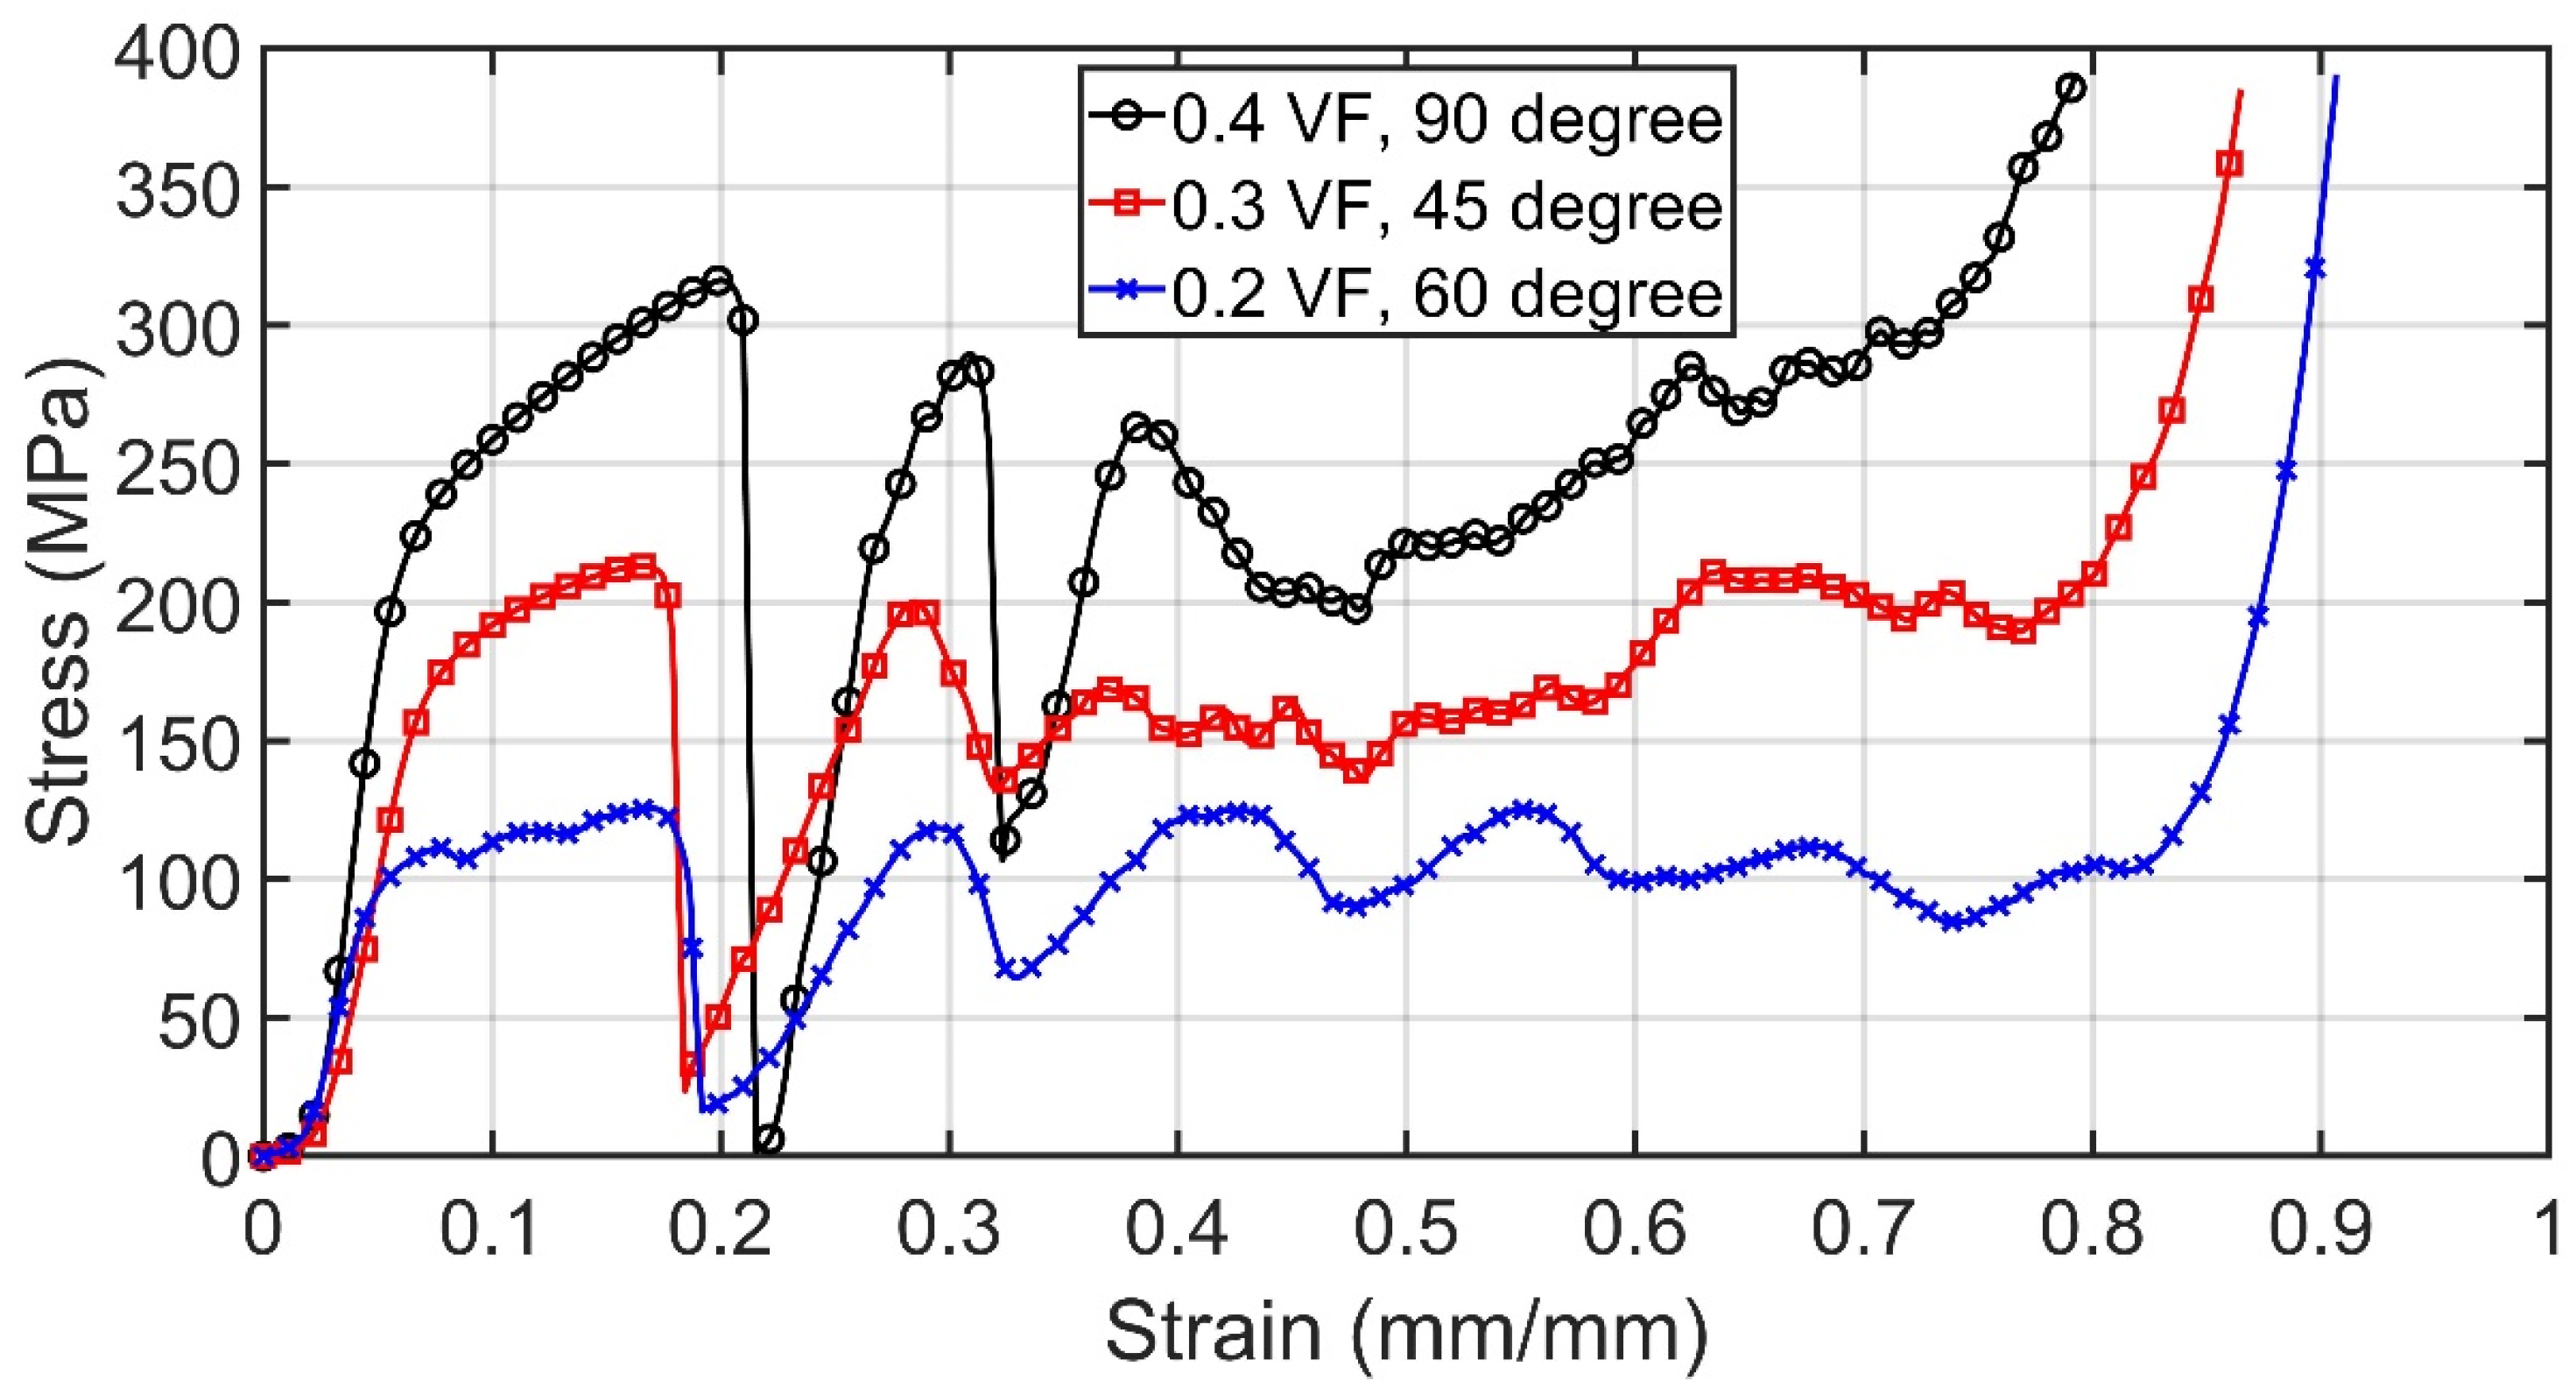
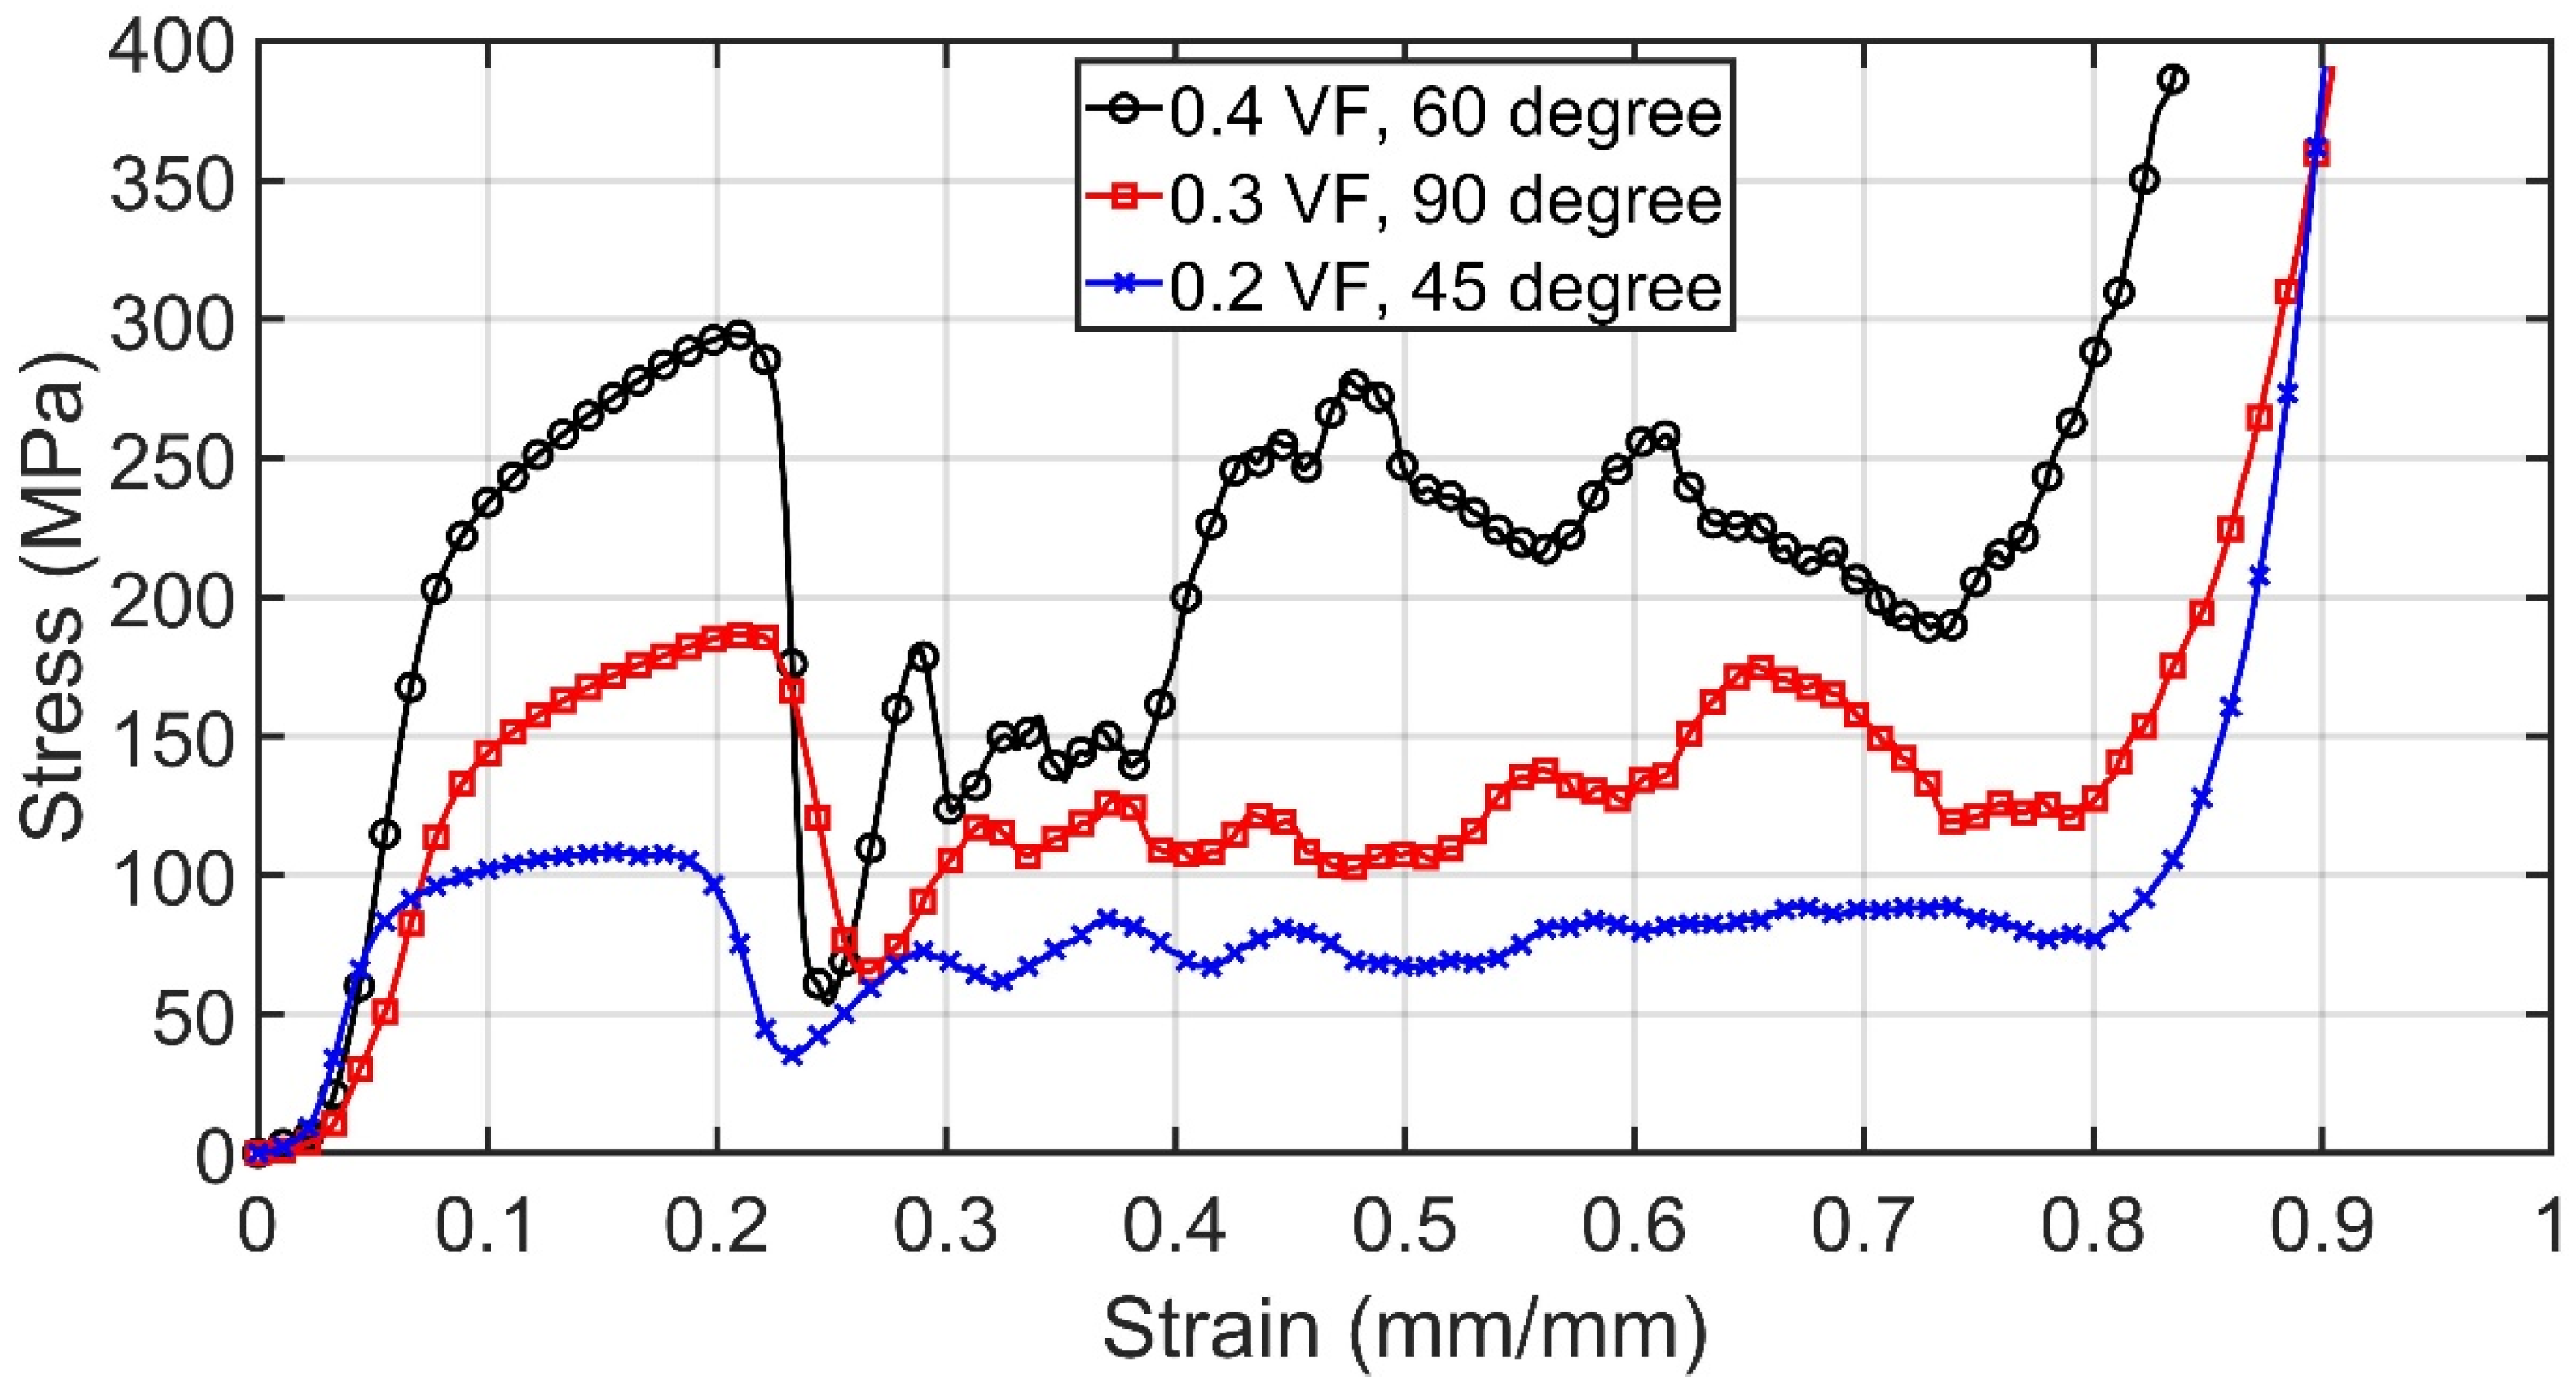
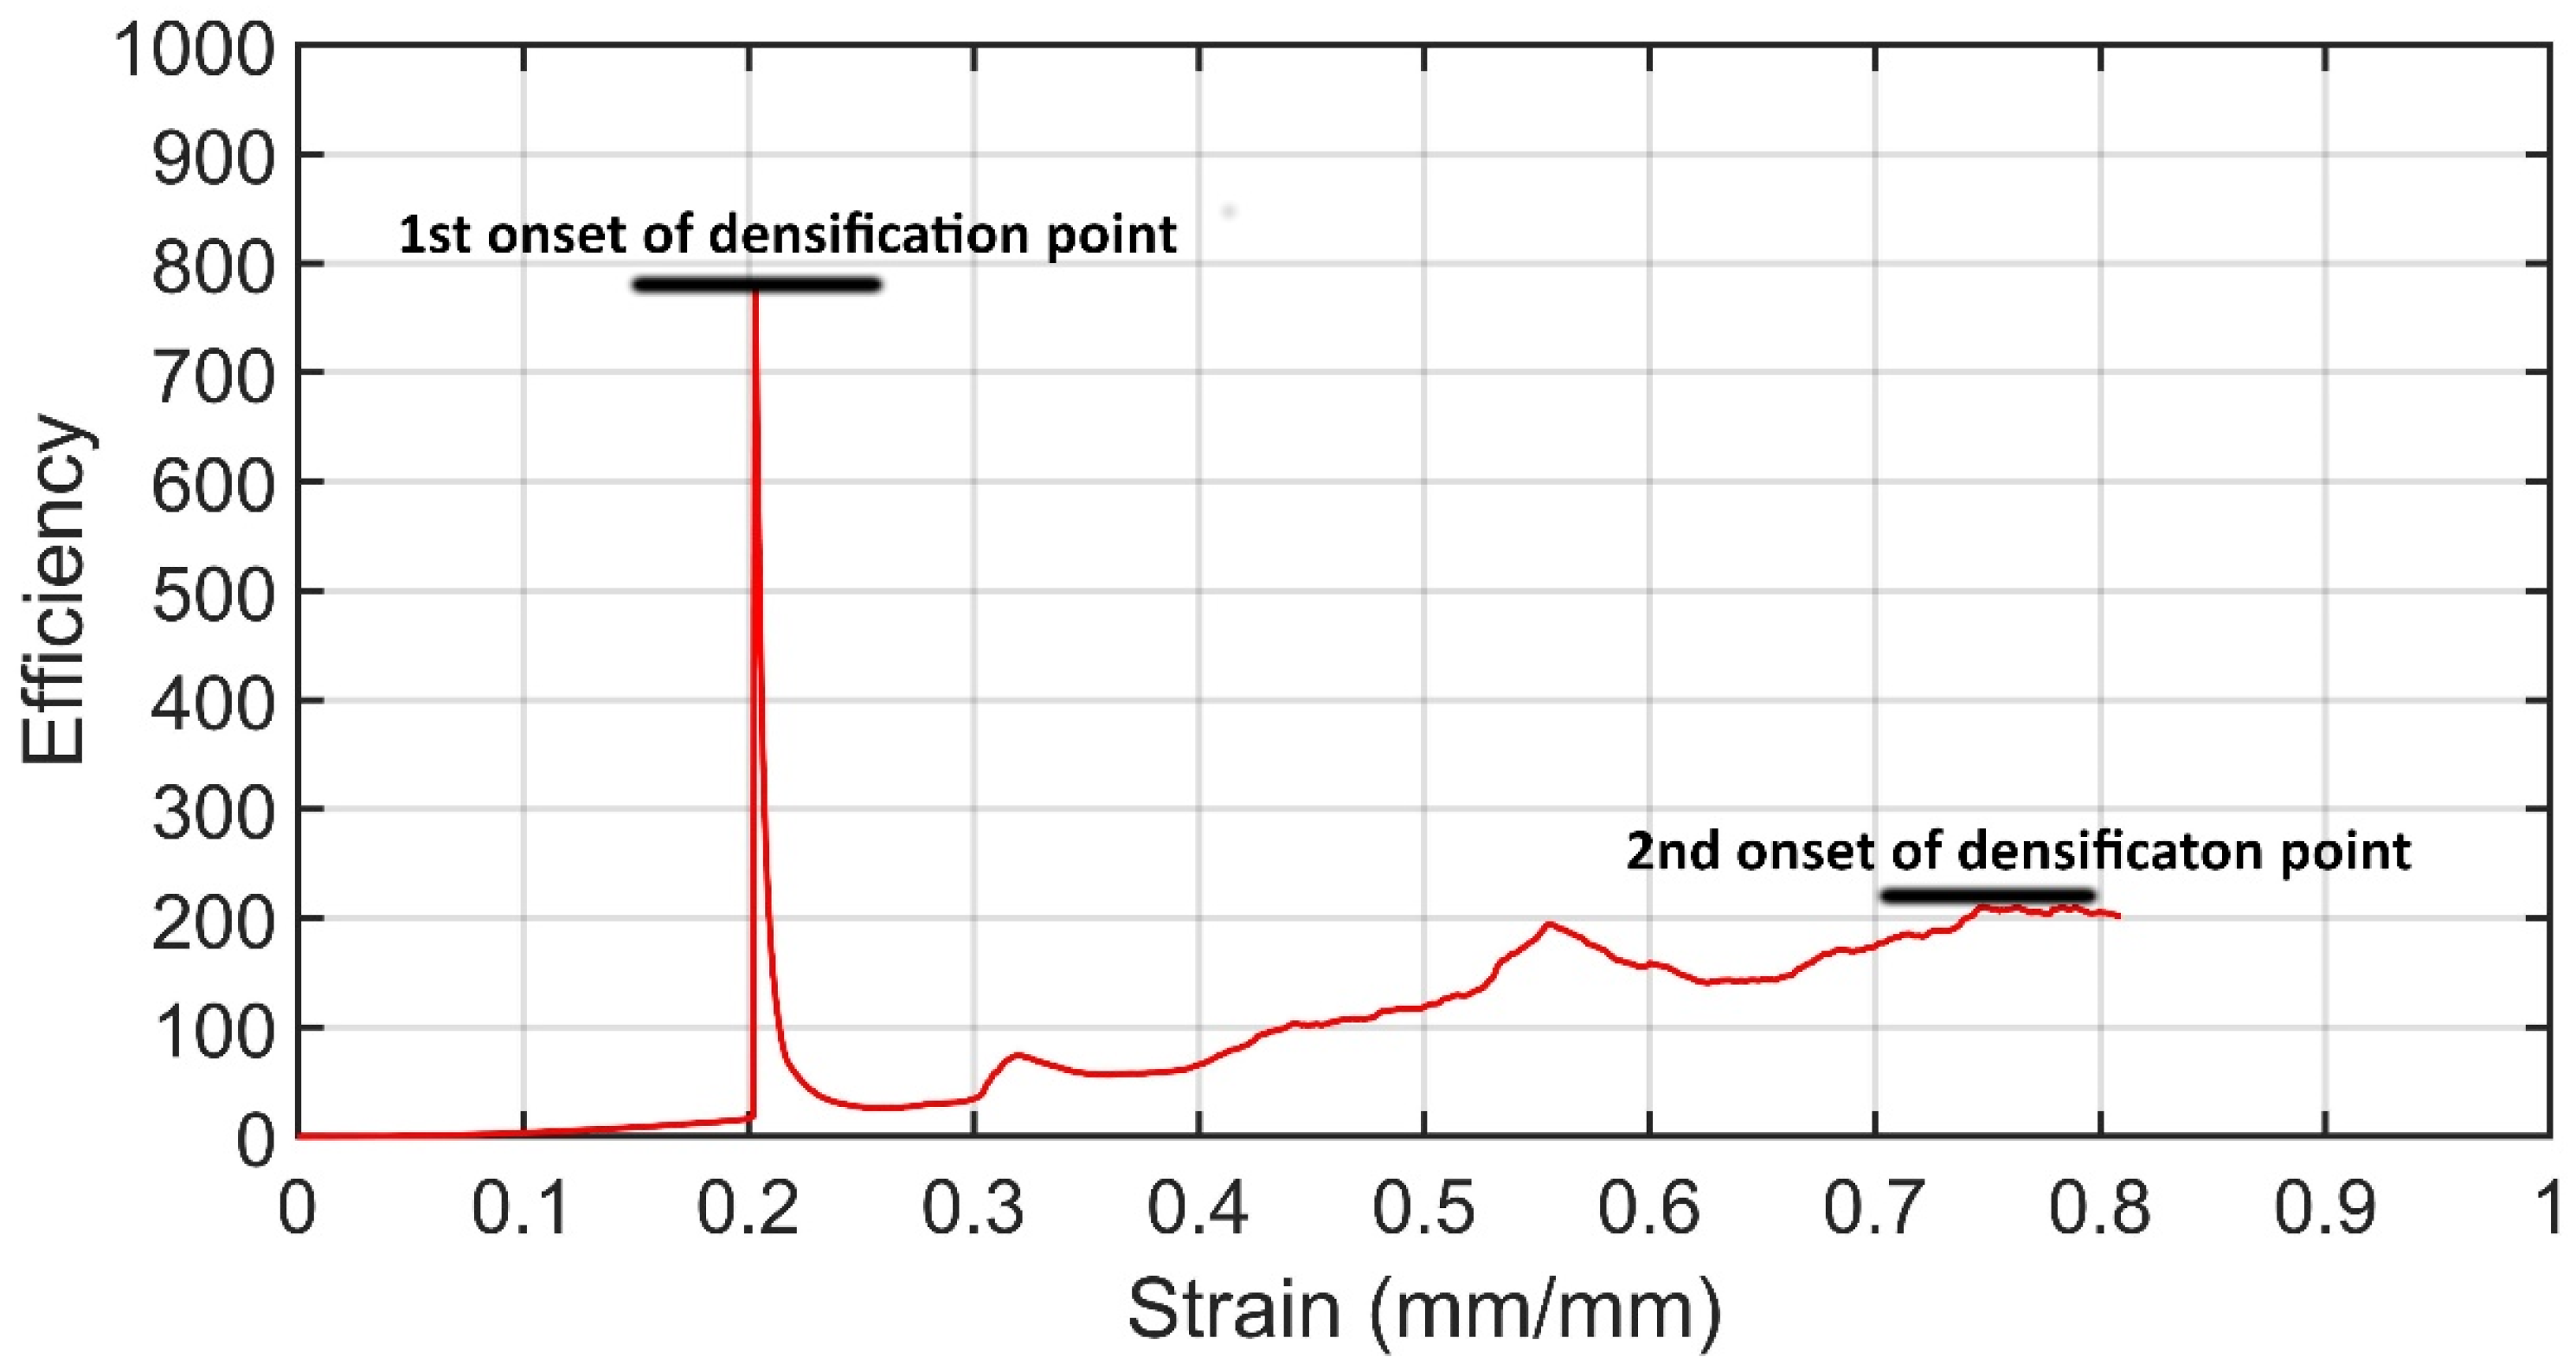
Quasi-static compression test results are shown in Figure 4, Figure 5 and Figure 6 for diamond, gyroid, and primitive structures, respectively, and the efficiency–strain plots are shown in Figure 7. In the efficiency–strain plots, two different types of onset of densification points are observed in contrast to the typical efficiency–strain plot as shown in Figure 2b. As is seen in Figure 2b, the maximum point on the efficiency–strain curve is selected where the general curve behavior is also changing. In Figure 7, there is a maximum point called the first onset of densification point, caused by the instant fracture of a large part in the TMPS structures. However, there is no change in the general curve behavior. Even though it has the maximum value, it cannot be used as the onset of the densification point. Thus, another point should be sought after. At the point between the 0.5 and 0.6 mm/mm strain range, it is neither the maximum point nor the point at which the curve behavior is changing. Therefore, there is no need to skip the value between 0.7 and 0.8, and searching for another point is not necessary. Additionally, the onset of the densification point indicates the point at which the structure behaves as a bulky structure, and a steep stress increase in this region is expected. Also, the onset of the densification point obtained from the numerical calculation can be validated by monitoring the stress–strain curve. Based on these graphs, yield stress, elastic modulus, specific energy absorption values, and the onset of densification points are shown in Table 3.
Elastic, plateau, and densification regimes are clearly visible for diamond, gyroid, and primitive specimens in Figure 4, Figure 5 and Figure 6. The stress in the elastic regime increased with an increase in strain for all TPMS types and reached its first maximum value [24]. At the onset of the plateau regime, the stress suddenly dropped due to the shear band failure [25]. For diamond specimens, the plateau regime starts at a strain of nearly 0.18−0.20, whereas for gyroid and primitive specimens, it starts at nearly 0.20−0.23 and 0.15−0.17, respectively. Gyroid and diamond specimens showed nearly stable stress values, and no sudden stress drops were observed in the plateau regime. On the other hand, distinct stress drops or fluctuations were observed in the plateau regime of primitive specimens corresponding to four unit cells [26]. For all specimens, the densification regime starts at strains of nearly 0.7−0.8. Since TPMS lattices consist of continuous walls, during compressive loading, these walls squeeze and crash, which results in a sudden decrease in stress at the onset of plateau regime. At the plateau regime, the squeezing and crashing of successive layers results in similar behavior that causes oscillating stress at the plateau regime [27]. This oscillating stress behavior at the plateau regime is clearly visible for diamond, gyroid, and primitive specimens in Figure 4, Figure 5 and Figure 6. It is also clear that for the same TPMS type, an increase in the volume fraction resulted in an increase in yield stress and elastic modulus, in addition to the number of fluctuations in the plateau regime due to the higher stiffness at higher volume fractions [16].
From Table 3, it can be concluded that diamond specimens outperformed in terms of yield stress and specific energy absorption when compared with gyroid and primitive specimens. The highest and the lowest yield stresses and specific energy absorptions were observed for diamond specimens with a 0.4 volume fraction and 90° build orientation, and for primitive specimens with a 0.2 volume fraction and 90° build orientation. In terms of the elastic modulus, the highest and the lowest values were observed for primitive specimens with a 0.4 volume fraction and 45° build orientation, and for primitive specimens with 0.2 volume fraction and 90° build orientation. These experimental results are consistent with the literature [12,13,15]. However, no direct correlation was found between TPMS type and elastic modulus for the same volume fractions.
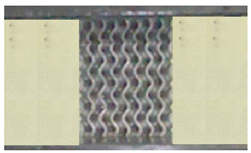
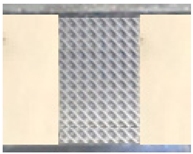
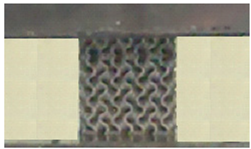
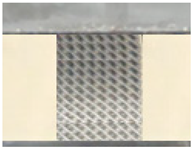
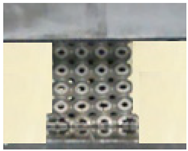
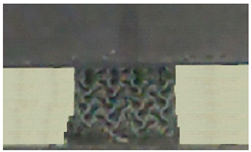
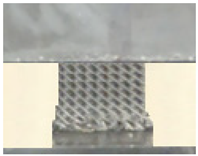
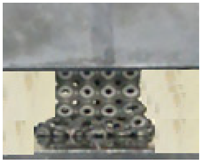
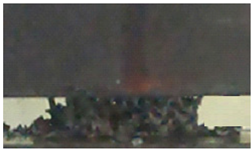
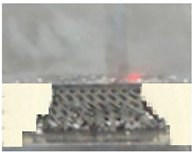
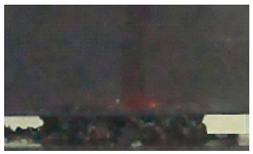
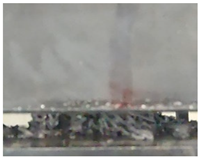
Table 4 shows the video images of gyroid, diamond and primitive lattices captured with a 0.2 mm/mm strain interval. It is clear from the images that specimens showed an elastic–brittle failure mechanism [28]. In the elastic regime up to a ~0.2 mm/mm strain, all TPMS lattices showed uniform deformation. However, in the plateau regime where the strain is between ~0.2 mm/mm and ~0.7–0.8 mm/mm, primitive specimens showed progressive collapse of the layers starting from the bottom unit cell. Above a ~0.7 mm/mm strain, all layers of the primitive specimen were collapsed, and the specimen behaved like a solid bulk material [29]. On the other hand, gyroid and diamond specimens showed shear band failure in the oblique directions [13].

3.3. Regression Analysis Results

Regression equations based on the test results for different TPMS lattices are shown in Table 5 in terms of mass, yield stress, elastic modulus, specific energy absorption, and the onset of densification.

3.4. Validation Study Results

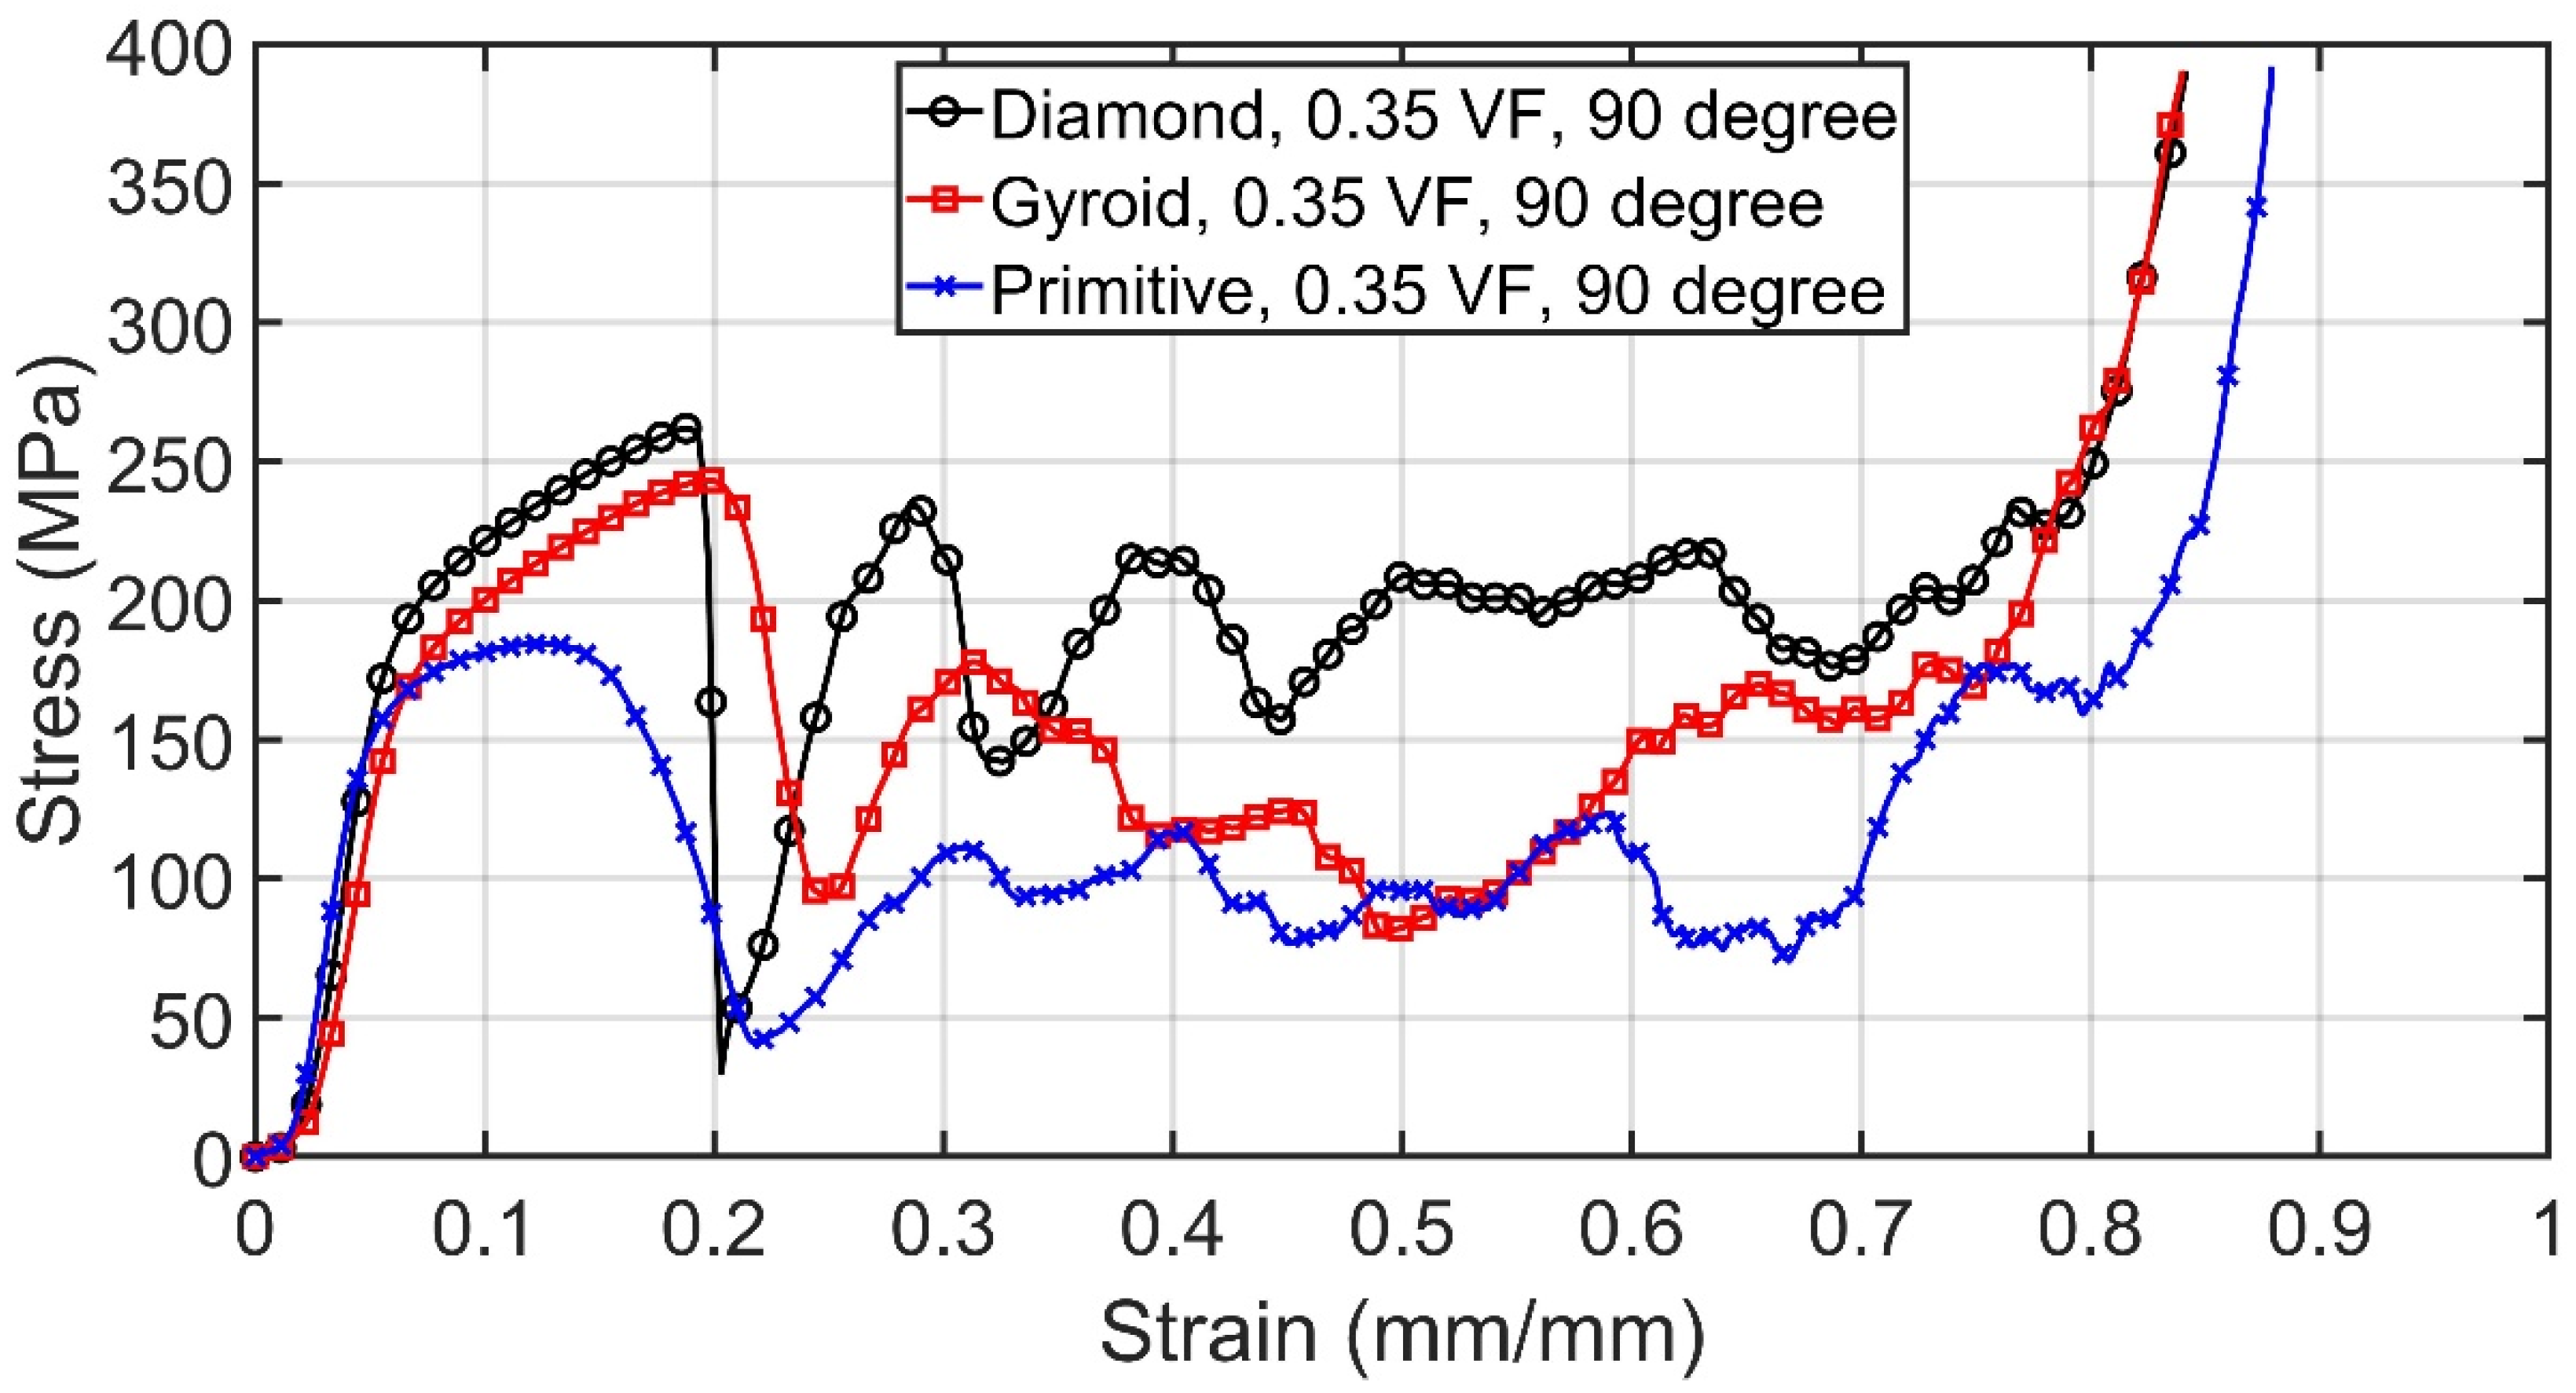
Quasi-static compression test results for three different TPMS types with a 0.35 volume fraction and 90° build orientation are shown in Figure 8. Based on this graph, yield stress, elastic modulus, specific energy absorption, and the onset of densification values were calculated. Table 6 shows the predicted results from the regression equations and calculated results based on the test values.
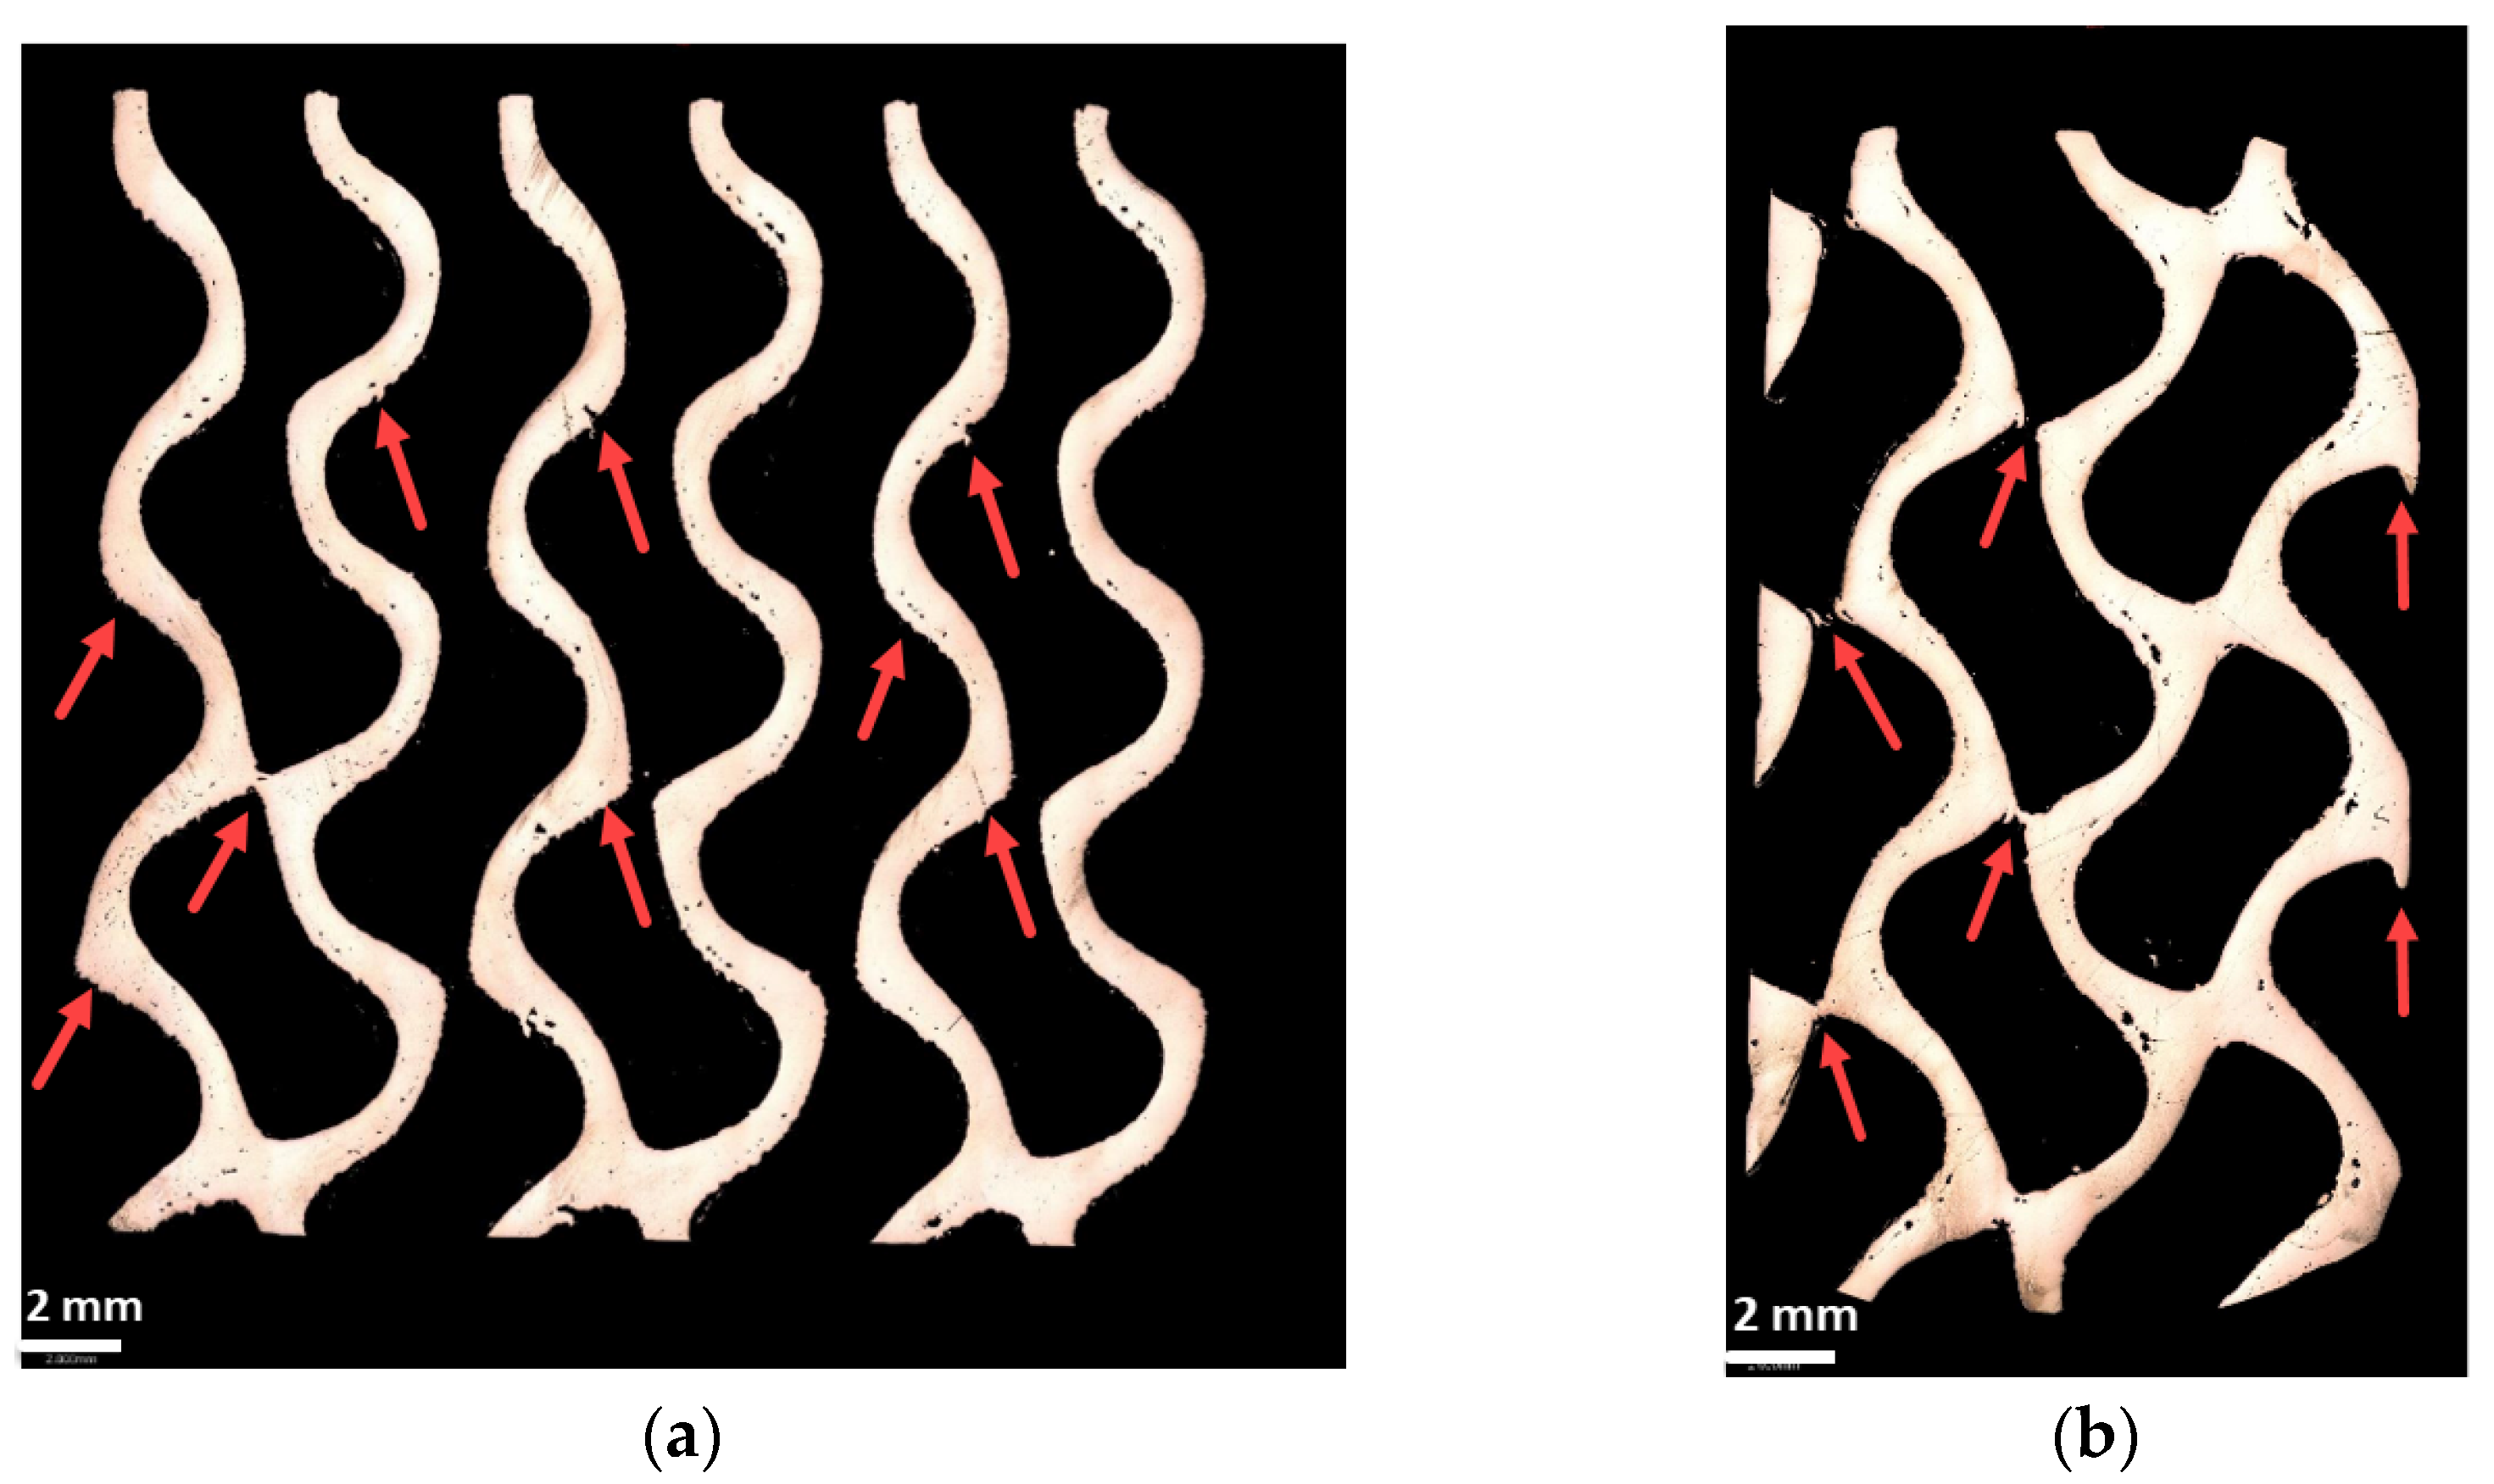
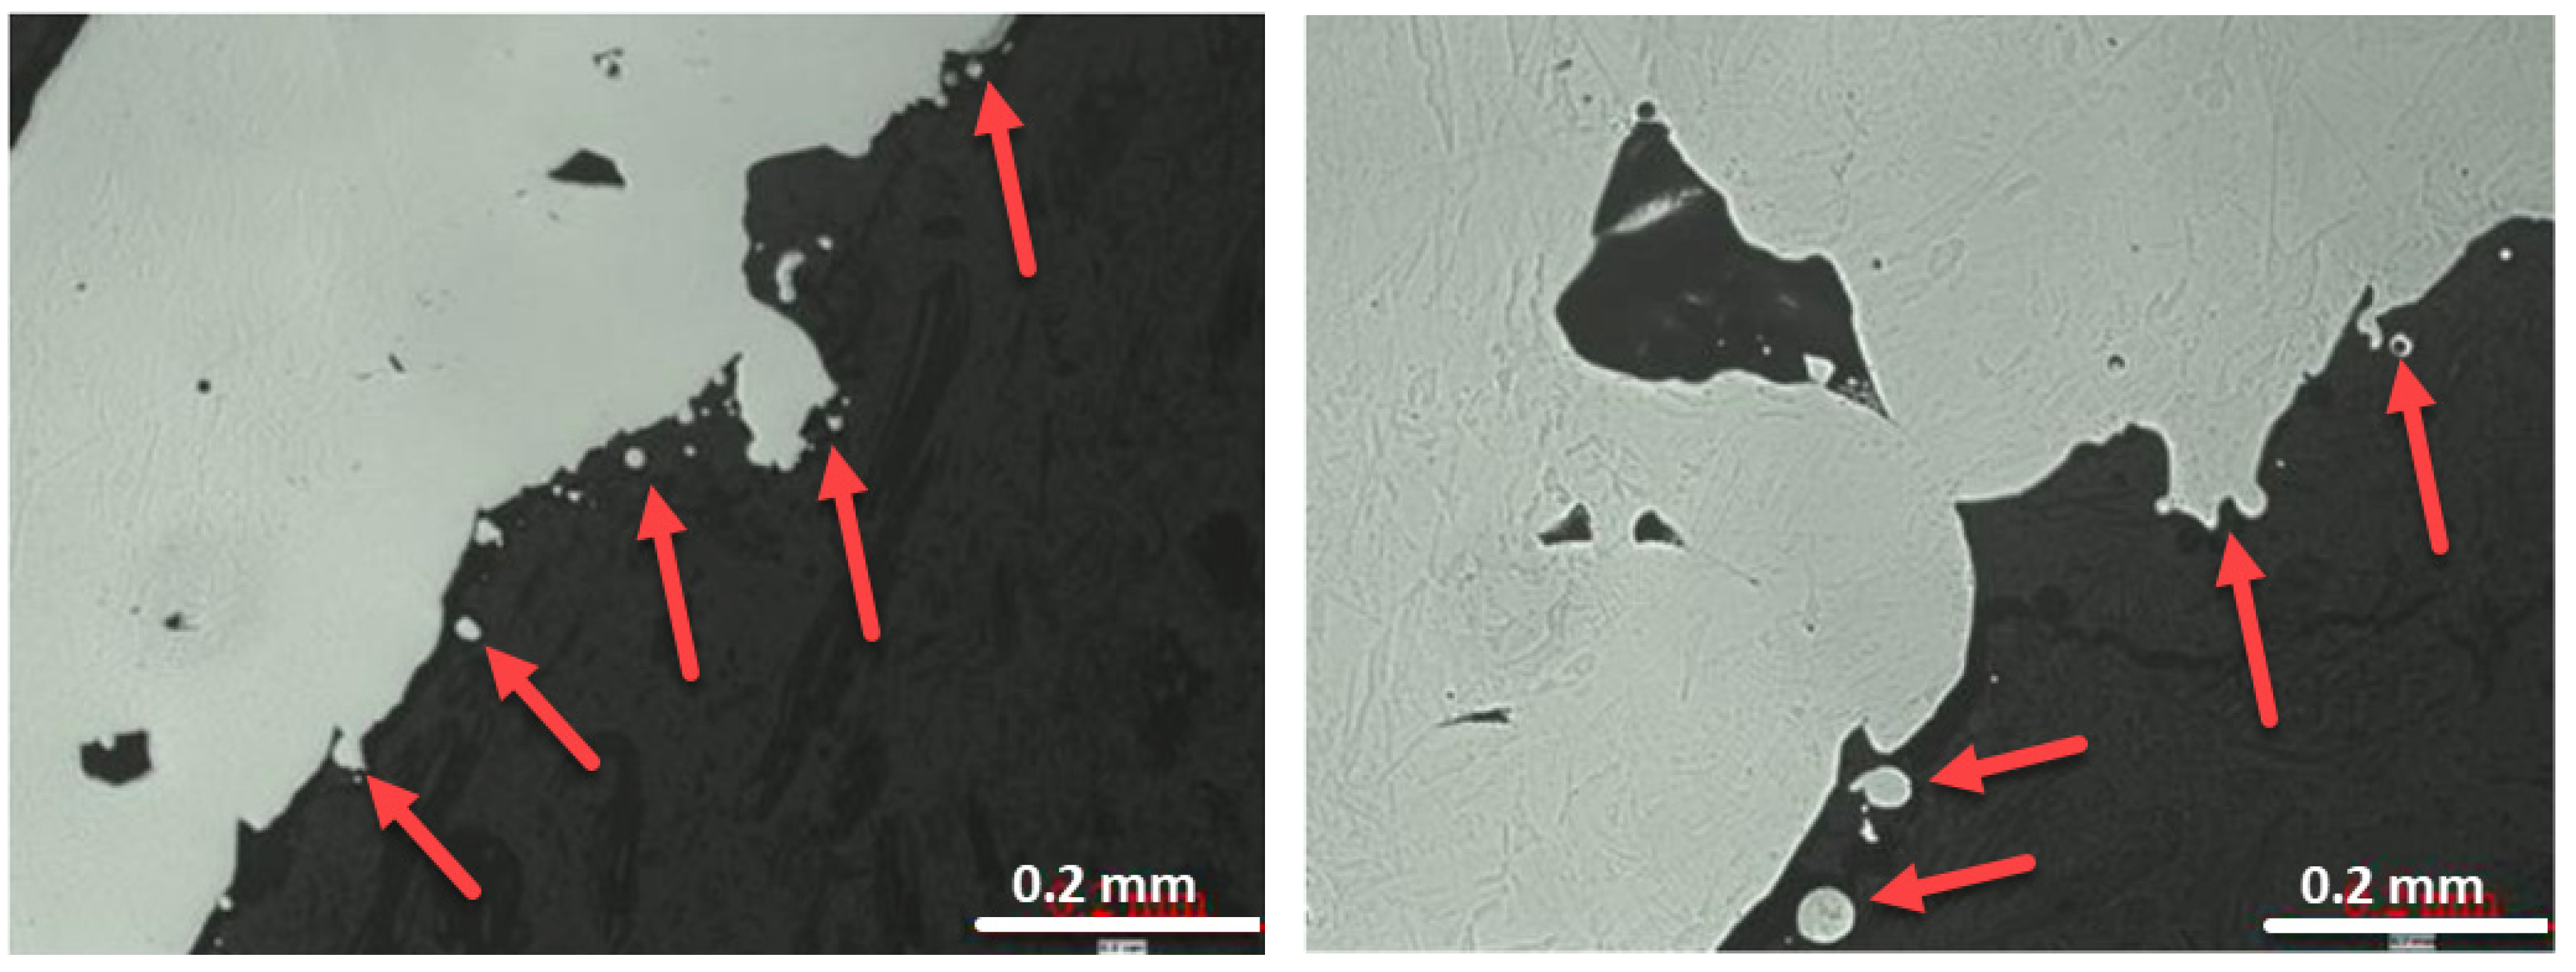
From Table 6, it can be concluded that there is less than a 1.4% error in the prediction of the mass value of a TPMS structure with an intermediate volume fraction value and specified build orientation. The predicted and tested yield stress values also demonstrate good consistency with an error value less than 7.1%. The error range between predicted and tested values in terms of the elastic modulus and specific energy absorption was below 21.6%. The max. error values for the elastic modulus and specific energy absorption were found to be 19.04% for the diamond specimen and 21.6% for the primitive specimen, respectively. These large differences can be attributed to the dimensional deviations of TPMS walls from the original geometry. During the LPBF process, melt pools at the TPMS walls try to sag towards the powder bed underneath, since there are no support structures at these locations. This affects the geometrical differences between the produced geometry and original geometry, which results in different mechanical properties from those expected [30]. This phenomenon is obvious from the SEM images in Figure 9 and Figure 10. Non-fully melted particle adhesion to the overhanging gyroid ligaments and dimensional deviation were observed (red arrows), which resulted in different mechanical properties between the predicted and test results. In terms of the onset of densification, there was a very good correlation between the predicted and tested values for the diamond specimen and the max. error was observed in the primitive specimen with an error range of 13.4%.

4. Conclusions

This study investigated the effectiveness of regression analysis in predicting the mechanical properties of different types of TPMS lattices. Experimental and statistical findings can be summarized as follows:
  • All specimens (gyroid, diamond, and primitive) showed similar compressive behaviors. There was a rapid decrease in stress at the onset of yielding and stress fluctuated at the plateau regime. These fluctuations increased at higher volume fraction values.
  • Diamond specimens outperformed in terms of yield stress and specific energy absorption when compared with gyroid and primitive specimens. This makes diamond structures good candidates for applications where higher strains are needed before plastic deformations [9].
  • Regression analysis and related equations can be used for predicting mass, yield stress, elastic modulus, specific energy absorption, and the onset of densification values of TPMS specimens with intermediate volume fraction values. The present study showed that mass, yield stress, elastic modulus, specific energy absorption, and the onset of densification of TPMS lattices can be predicted with an error value less than 1.4%, 7.1%, 19.04%, 21.6%, and 13.4%, respectively.
In this study, quasi-static compression tests were performed on different types of TPMS lattices with different volume fractions and build orientations. Future studies will focus on the dynamic behavior of these types of lattices, both experimentally and numerically. Moreover, for the validation study, an intermediate volume fraction value (0.35) was selected for three types of TPMS lattices. To carry out further assessments, different TPMS lattices with intermediate build orientation values will be manufactured, tested, and compared with the predicted values.

Author Contributions

Conceptualization, O.G. and U.Ş.; methodology, O.G. and K.G.; test, K.G., validation, O.G., U.Ş. and K.G.; investigation, O.G.; resources, O.G. and K.G.; data curation, K.G. and A.T.; writing—original draft preparation, O.G.; writing—review and editing, U.Ş., K.G. and A.T. All authors have read and agreed to the published version of the manuscript.

Funding

This research received no specific grant from any funding agency in the public, commercial, or not-for-profit sectors.

Data Availability Statement

The data presented in this study are available on request from the corresponding author.

Conflicts of Interest

The authors declare no conflicts of interest.

References

  1. Xi, H.; Zhou, Z.; Zhang, H.; Huang, S.; Xiao, H. Multi-morphology TPMS structures with multi-stage yield stress platform and multi-level energy absorption: Design, manufacturing, and mechanical properties. Eng. Struct. 2023, 294, 116733. [Google Scholar] [CrossRef]
  2. Bouakaz, I.; Dehkord, E.S.; Meille, S.; Schrijnemakers, A.; Boschini, F.; Preux, N.; Hocquet, S.; Geris, L.; Nolens, G.; Grossin, D.; et al. 3D printed triply periodic minimal surfaces calcium phosphate bone substitute: The effect of porosity design on mechanical properties. Ceram. Int. 2024, 50, 2623–2636. [Google Scholar] [CrossRef]
  3. Sauermoser-Yri, M.; Veldurthi, N.; Wölfle, C.H.; Svartvatn, P.J.; Hoem, S.O.F.; Lid, M.J.; Bock, R.; Palko, J.W.; Torgersen, J. On the porosity-dependent permeability and conductivity of triply periodic minimal surface based porous media. J. Mater. Res. Technol. 2023, 27, 585–599. [Google Scholar] [CrossRef]
  4. Maconachie, T.; Leary, M.; Lozanovski, B.; Zhang, X.; Qian, M.; Faruque, O.; Brant, M. SLM lattice structures: Properties, performance, applications and challenges. Mater. Des. 2019, 183, 108–137. [Google Scholar] [CrossRef]
  5. Sefene, E.M. State-of-the-art of selective laser melting process: A comprehensive review. J. Manuf. Syst. 2022, 63, 250–274. [Google Scholar] [CrossRef]
  6. Gülcan, O.; Günaydın, K.; Çelik, A.; Yasa, E. Mechanical properties of laser powder bed fusion produced overhang parts with different support geometries: An experimental study. Prog. Addit. Manuf. 2023. [CrossRef]
  7. Gong, G.; Ye, J.; Chi, Y.; Zhao, Z.; Wang, Z.; Xia, G.; Du, X.; Tian, H.; Yu, H.; Chen, C. Research status of laser additive manufacturing for metal: A review. J. Mater. Res. Technol. 2021, 15, 855–884. [Google Scholar] [CrossRef]
  8. Zheng, X.; Fu, Z.; Du, K.; Wang, C.; Yi, Y. Minimal surface designs for porous materials: From microstructures to mechanical properties. J. Mater. Sci. 2018, 53, 10194–10208. [Google Scholar] [CrossRef]
  9. Maskery, I.; Sturm, L.; Aremu, A.O.; Panesar, A.; Williams, C.B.; Tuck, C.J.; Wildman, R.D.; Ashcroft, I.A.; Hague, R.J.M. Insights into the mechanical properties of several triply periodic minimal surface lattice structures made by polymer additive manufacturing. Polymer 2018, 152, 62–71. [Google Scholar] [CrossRef]
  10. Yu, S.; Sun, J.; Bai, J. Investigation of functionally graded TPMS structures fabricated by additive manufacturing. Mater. Des. 2019, 182, 108021. [Google Scholar] [CrossRef]
  11. Novak, N.; Al-Ketan, O.; Borovinsek, M.; Krstulovic-Opara, L.; Rowshan, R.; Vesenjak, M.; Ren, Z. Development of novel hybrid TPMS cellular lattices and their mechanical characterization. J. Mater. Res. Technol. 2021, 15, 1318–1329. [Google Scholar] [CrossRef]
  12. Novak, N.; Al-Ketan, O.; Krstulović-Opara, L.; Rowshan, R.; Abu Al-Rub, R.K.; Vesenjak, M.; Ren, Z. Quasi-static and dynamic compressive behaviour of sheet TPMS cellular structures. Compos. Struct. 2021, 266, 113801. [Google Scholar] [CrossRef]
  13. Sokollu, B.; Gulcan, O.; Konukseven, E.I. Mechanical properties comparison of strut-based and triply periodic minimal surface lattice structures produced by electron beam melting. Addit. Manuf. 2022, 60, 103199. [Google Scholar]
  14. Gülcan, O.; Simsek, U.; Cokgunlu, O.; Özdemir, M.; Şendur, P.; Yapici, G.G. Effect of build parameters on the compressive behavior of additive manufactured CoCrMo lattice parts based on experimental design. Metals 2022, 12, 1104. [Google Scholar] [CrossRef]
  15. Zhang, L.; Feih, S.; Daynes, S.; Chang, S.; Wang, M.Y.; Wei, J.; Lu, W.F. Energy absorption characteristics of metallic triply periodic minimal surface sheet structures under compressive loading. Addit. Manuf. 2018, 23, 505–515. [Google Scholar] [CrossRef]
  16. Al Mahri, S.; Santiago, R.; Lee, D.W.; Ramos, H.; Alabdouli, H.; Alteneiji, M.; Guan, Z.; Cantwell, W.; Alves, M. Evaluation of the dynamic response of triply periodic minimal surfaces subjected to high strain-rate compression. Addit. Manuf. 2021, 46, 102220. [Google Scholar]
  17. Naghavi, S.A.; Tamaddon, M.; Marghoub, A.; Wang, K.; Babamiri, B.B.; Hazel, K.; Xu, W.; Lu, X.; Sun, C.; Wang, L.; et al. Mechanical characterisation and numerical modelling of tpms-based gyroid and diamond Ti6Al4V scaffolds for bone implants: An integrated approach for translational consideration. Bioengineering 2022, 9, 504. [Google Scholar] [CrossRef]
  18. Teng, F.; Sun, Y.; Guo, S.; Gao, B.; Yu, G. Topological and mechanical properties of different lattice structures based on additive manufacturing. Micromachines 2022, 13, 1017. [Google Scholar] [CrossRef]
  19. Li, Z.; Nie, Y.; Liu, B.; Kuai, Z.; Zhao, M.; Liu, F. Mechanical properties of AlSi10Mg lattice structures fabricated by selective laser melting. Mater. Des. 2020, 192, 108709. [Google Scholar] [CrossRef]
  20. Al-Ketan, O.; Lee, D.-W.; Rowshan, R.; Abu Al-Rub, R.K. Functionally graded and multi-morphology sheet TPMS lattices: Design, manufacturing, and mechanical properties. J. Mech. Behav. Biomed. Mater. 2020, 102, 103520. [Google Scholar] [CrossRef]
  21. Available online: https://www.oraibkhitan.com/mslattice/ (accessed on 30 January 2023).
  22. Li, Q.M.; Magkiriadis, I.; Harrigan, J.J. Compressive strain at the onset of the densification of cellular solids. J. Cell Plast. 2006, 42, 371–392. [Google Scholar] [CrossRef]
  23. Günaydın, K.; Eren, Z.; Kazancı, Z.; Scarpa, F.; Grande, A.M.; Türkmen, H.S. In-plane compression behavior of anti-tetrachiral and re-entrant lattices. Smart Mater. Struct. 2019, 28, 115028. [Google Scholar] [CrossRef]
  24. Feng, G.; Wang, J.; Li, X.; Xiao, L.; Song, W. Mechanical behavior of Ti–6Al–4V lattice-walled tubes under uniaxial compression. Def. Technol. 2022, 18, 1124–1138. [Google Scholar] [CrossRef]
  25. Liu, J.; Guo, K.; Sun, J.; Sun, Q.; Wang, L.; Li, H. Compressive behavior and vibration-damping properties of porous Ti-6Al-4V alloy manufactured by laser powder bed fusion. J. Manuf. Process 2021, 66, 1–10. [Google Scholar] [CrossRef]
  26. Zhao, M.; Zhang, D.Z.; Liu, F.; Li, Z.; Ma, Z.; Ren, Z. Mechanical and energy absorption characteristics of additively manufactured functionally graded sheet lattice structures with minimal surfaces. Int. J. Mech. Sci. 2020, 167, 105262. [Google Scholar] [CrossRef]
  27. Yan, C.; Hao, L.; Hussein, A.; Bubb, S.L.; Young, P.; Raymont, D. Evaluation of light-weight AlSi10Mg periodic cellular lattice structures fabricated via direct metal laser sintering. J. Mater. Process Technol. 2014, 4, 856–864. [Google Scholar] [CrossRef]
  28. Zhang, M.; Yang, Y.; Wang, D.; Xiao, Z.; Song, C.; Weng, C. Effect of heat treatment on the microstructure and mechanical properties of Ti6Al4V gradient structures manufactured by selective laser melting. Mater. Sci. Eng. A 2018, 736, 288–297. [Google Scholar] [CrossRef]
  29. Sun, Q.; Sun, J.; Guo, K.; Wang, L. Compressive mechanical properties and energy absorption characteristics of SLM fabricated Ti6Al4V triply periodic minimal surface cellular structures. Mech. Mater. 2022, 166, 104241. [Google Scholar] [CrossRef]
  30. Ran, Q.; Yang, W.; Hu, Y.; Shen, X.; Yu, Y.; Xiang, Y.; Cai, K. Osteogenesis of 3D printed porous Ti6Al4V implants with different pore sizes. J. Mech. Behav. Biomed. Mater. 2018, 84, 1–11. [Google Scholar] [CrossRef]
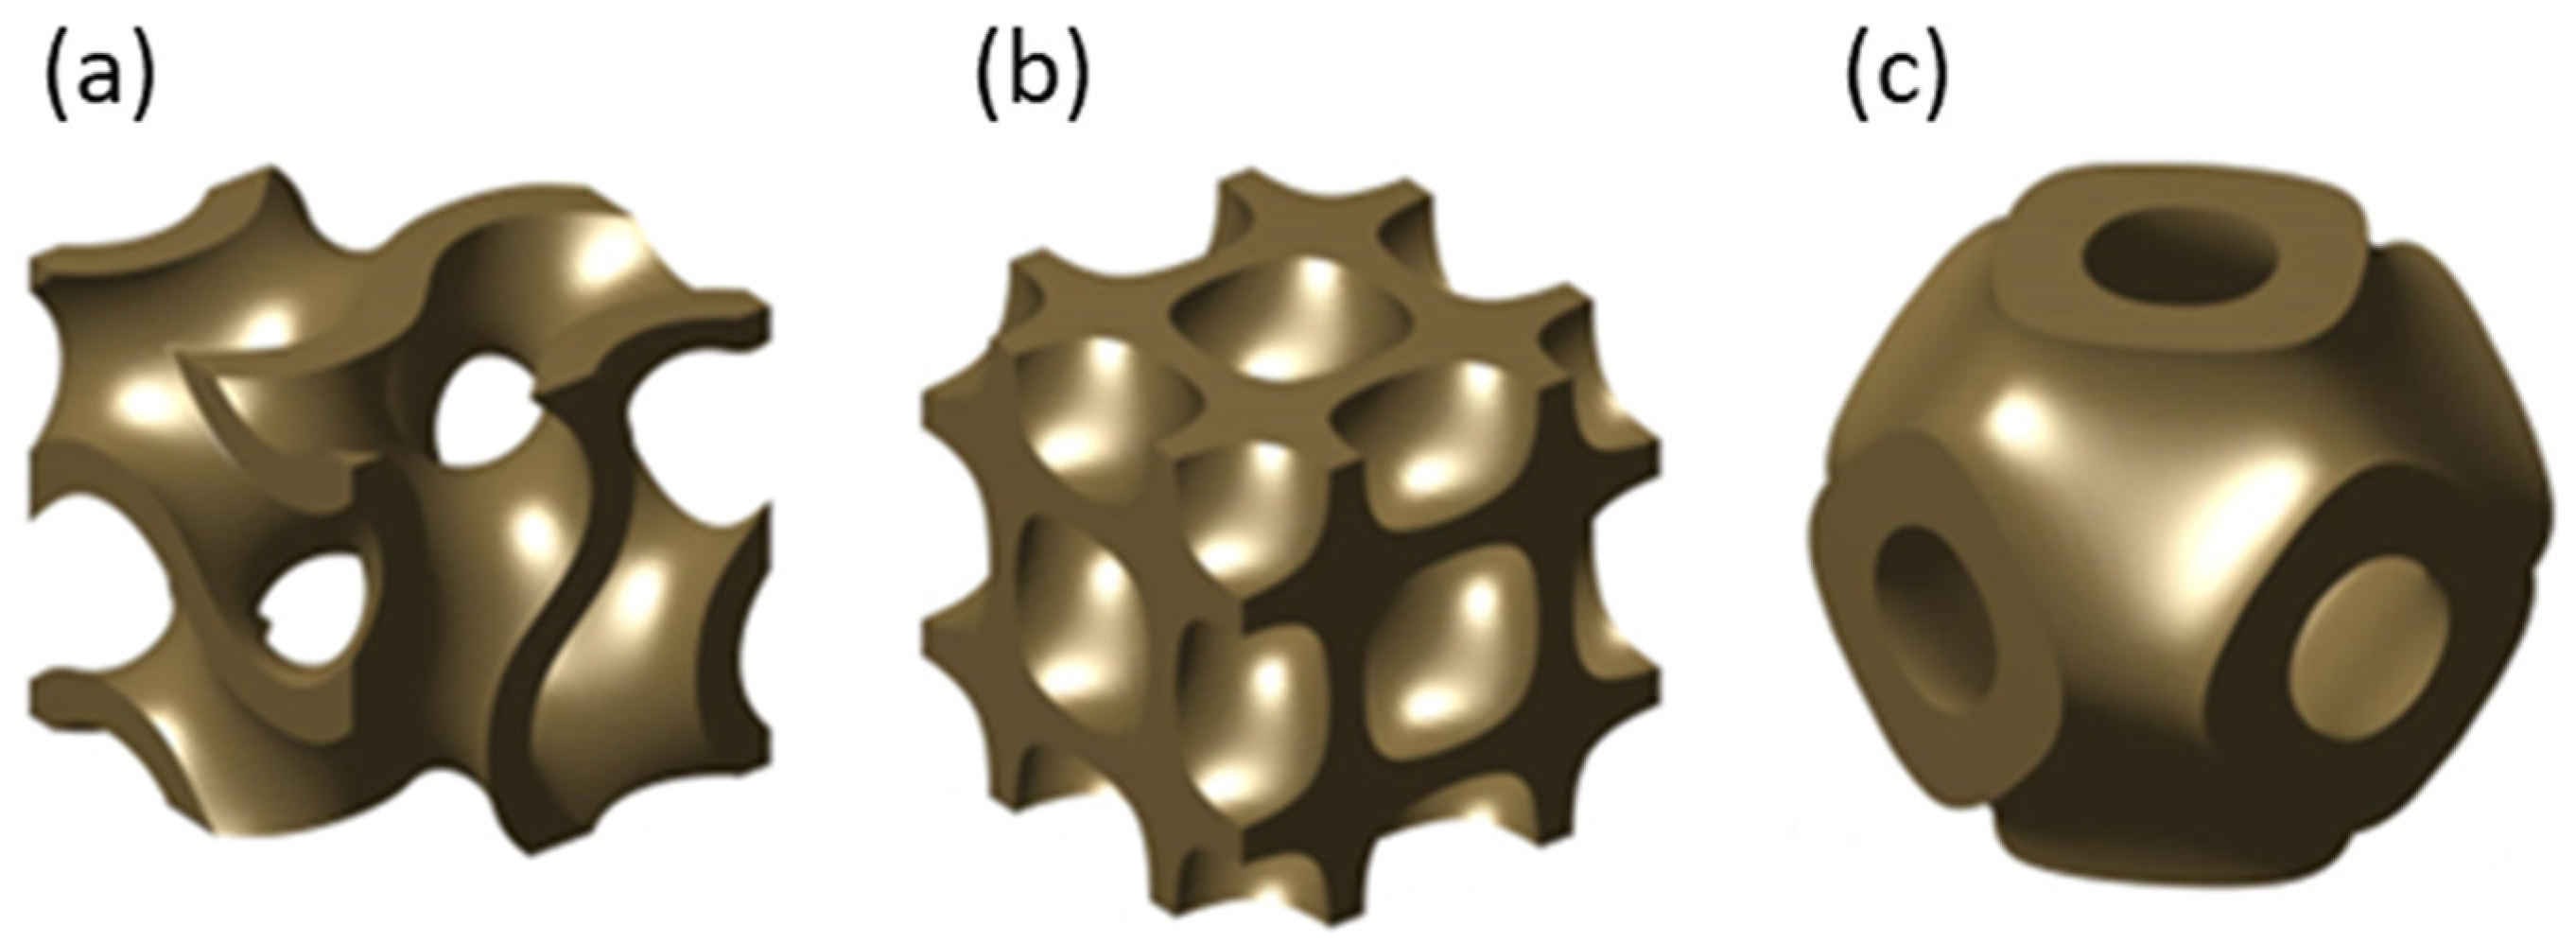
Figure 1. (a) Gyroid, (b) diamond, and (c) primitive TPMS structures.
Jmmp 08 00016 g001
Figure 2. (a) Typical stress–strain curve for lattice structure compression, (b) efficiency–strain curve showing onset of densification point [22].
Jmmp 08 00016 g002
Figure 3. Manufactured diamond, primitive, and gyroid structures.
Jmmp 08 00016 g003
Figure 4. Compression test results for diamond specimens. BO and VF stand for build orientation and volume fraction, respectively.
Jmmp 08 00016 g004
Figure 5. Compression test results for gyroid specimens. BO and VF stand for build orientation and volume fraction, respectively.
Jmmp 08 00016 g005
Figure 6. Compression test results for primitive specimens. BO and VF stand for build orientation and volume fraction, respectively.
Jmmp 08 00016 g006
Figure 7. Efficiency–strain plot for the determination of onset of densification point for specimen 8 (gyroid with 0.4 volume fraction and 60° build orientation).
Jmmp 08 00016 g007
Figure 8. Stress–strain graph for three different TPMS types with 0.35 volume fraction and 90° build orientation.
Jmmp 08 00016 g008
Figure 9. SEM image of gyroid TPMS lattice structure: (a) cross-sectional view; (b) lateral view. Red arrows show non-fully melted particle adhesion to the overhanging surfaces.
Jmmp 08 00016 g009
Figure 10. SEM image of gyroid TPMS lattice structure overhanging ligaments. Red arrows show non-fully melted particle adhesion to the overhanging surfaces.
Jmmp 08 00016 g010
Table 1. Approximate mathematical equations for diamond, gyroid and primitive structures [3,4].
TPMS TypeMathematical Equations
DiamondU = sin(kxx)sin(kyy)sin(kzz) + sin(kxx)cos(kyy)cos(kzz) + cos(kxx)sin(kyy)cos(kzz) + cos(kxx)cos(kyy)sin(kzz) − t
GyroidU = cos(kxx)sin(kyy) + cos(kyy)sin(kzz) + cos(kzz)sin(kxx) − t
PrimitiveU = cos(x) + cos(y) + cos(z) − t
ki = 2πni/Li, where ki: k value in x, y, and z directions, ni: number of unit cells in x, y, and z directions, and Li: outer dimension of structure in x, y, and z directions.
t: variable used to alter relative density.
U: represents isosurface boundary between solid and void sections and needs to be zero to generate TPMS lattices.
Table 2. L9 Taguchi orthogonal array with design variables.
Specimen NoBuild Orientation (°)Volume FractionTPMS Type
1450.2Gyroid
2600.2Diamond
3900.2Primitive
4450.3Diamond
5600.3Primitive
6900.3Gyroid
7450.4Primitive
8600.4Gyroid
9900.4Diamond
Table 3. Mechanical properties of specimens with standard deviations.
Specimen NoYield Stress (MPa)Elastic Modulus (GPa)Mass (g)Specific Energy Absorption (J/g)Onset of Densification (mm/mm)
170.9 ± 1.42.87 ± 0.0654.3 ± 1.135.8 ± 0.70.815 ± 0.016
288.4 ± 1.83.57 ± 0.0754.9 ± 1.142.5 ± 0.90.745 ± 0.015
355.5 ± 1.12.06 ± 0.0453.1 ± 1.119.7 ± 0.40.757 ± 0.015
4170.5 ± 3.43.80 ± 0.0880.7 ± 1.649.7 ± 1.00.772 ± 0.015
5123.7 ± 2.53.20 ± 0.0680.2 ± 1.626.5 ± 0.50.744 ± 0.015
6144.9 ± 2.92.94 ± 0.0680.6 ± 1.639.6 ± 0.80.792 ± 0.016
7186.1 ± 3.77.67 ± 0.15108.7 ± 2.240.6 ± 0.80.806 ± 0.016
8197.0 ± 3.95.63 ± 0.11106.8 ± 2.138.0 ± 0.80.705 ± 0.014
9204.0 ± 4.16.74 ± 0.14107.9 ± 2.252.3 ± 1.10.758 ± 0.015
Table 4. Loading sequence of gyroid, diamond, primitive TPMS structures with a 0.2 mm/mm strain interval.
Strain (mm/mm)GyroidDiamondPrimitive
0Jmmp 08 00016 i001Jmmp 08 00016 i002Jmmp 08 00016 i003
0.2Jmmp 08 00016 i004Jmmp 08 00016 i005Jmmp 08 00016 i006
0.4Jmmp 08 00016 i007Jmmp 08 00016 i008Jmmp 08 00016 i009
0.6Jmmp 08 00016 i010Jmmp 08 00016 i011Jmmp 08 00016 i012
0.8Jmmp 08 00016 i013Jmmp 08 00016 i014Jmmp 08 00016 i015
Table 5. Regression equations. VF stands for volume fraction and is valid for 0.2–0.4 range.
Design OutputTPMS TypeBuild OrientationEquation
Mass (g)Gyroid45°3.32 + 245.7xVF + 47.17xVF2
Gyroid60°8.07 + 228.0xVF + 47.17xVF2
Gyroid90°2.55 + 246.0xVF + 47.17xVF2
Diamond45°2.70 + 245.7xVF + 47.17xVF2
Diamond60°7.45 + 228.0xVF + 47.17xVF2
Diamond90°1.93 + 246.0xVF + 47.17xVF2
Primitive45°2.83 + 245.7xVF + 47.17xVF2
Primitive60°7.58 + 228.0xVF + 47.17xVF2
Primitive90°2.06 + 246.0xVF + 47.17xVF2
Yield Stress (MPa)Gyroid45°−168.7 + 1453xVF − 1272xVF2
Gyroid60°−157.8 + 1396xVF − 1272xVF2
Gyroid90°−131.3 + 1302xVF − 1272xVF2
Diamond45°−150.8 + 1453xVF − 1272xVF2
Diamond60°−139.9 + 1396xVF − 1272xVF2
Diamond90°−113.3 + 1302xVF − 1272xVF2
Primitive45°−191.4 + 1453xVF − 1272xVF2
Primitive60°−180.5 + 1396xVF − 1272xVF2
Primitive90°−154.0 + 1302xVF − 1272xVF2
Elastic Modulus (GPa)Gyroid45°9.66 − 62.8xVF + 144.3xVF2
Gyroid60°13.07 − 76.3xVF + 144.3xVF2
Gyroid90°8.84 − 63.0xVF + 144.3xVF2
Diamond45°9.65 − 62.8xVF + 144.3xVF2
Diamond60°13.06 − 76.3xVF + 144.3xVF2
Diamond90°8.83 − 63.0xVF + 144.3xVF2
Primitive45°9.70 − 62.8xVF + 144.3xVF2
Primitive60°13.11 − 76.3xVF + 144.3xVF2
Primitive90°8.88 − 63.0xVF + 144.3xVF2
Specific Energy Absorption (J/g)Gyroid45°15.7 + 109.3xVF − 45.33xVF2
Gyroid60°32.8 + 31.0xVF − 45.33xVF2
Gyroid90°11.8 + 106.2xVF − 45.33xVF2
Diamond45°21.0 + 109.3xVF − 45.33xVF2
Diamond60°38.1 + 31.0xVF − 45.33xVF2
Diamond90°17.1 + 106.2xVF − 45.33xVF2
Primitive45°4.1 + 109.3xVF − 45.33xVF2
Primitive60°21.2 + 31.0xVF − 45.33xVF2
Primitive90°0.2 + 106.2xVF − 45.33xVF2
Onset of Densification (mm/mm)Gyroid45°0.774 + 0.307xVF − 0.5xVF2
Gyroid60°0.842 − 0.143xVF − 0.5xVF2
Gyroid90°0.688 + 0.497xVF − 0.5xVF2
Diamond45°0.725 + 0.307xVF − 0.5xVF2
Diamond60°0.794 − 0.143xVF − 0.5xVF2
Diamond90°0.639 + 0.497xVF − 0.5xVF2
Primitive45°0.763 + 0.307xVF − 0.5xVF2
Primitive60°0.832 − 0.143xVF − 0.5xVF2
Primitive90°0.678 + 0.497xVF − 0.5xVF2
Table 6. Predicted and tested results.
Design OutputTPMS TypePredictedTestedError (%)
Mass (g)Gyroid94.4 ± 1.993.8 ± 1.90.7
Diamond93.8 ± 1.995.1 ± 1.91.4
Primitive93.9 ± 1.993.9 ± 1.90.1
Yield Stress (MPa)Gyroid168.6 ± 3.4157.4 ± 3.27.1
Diamond186.6 ± 3.7176.2 ± 3.55.9
Primitive145.9 ± 2.9141.7 ± 2.82.9
Elastic Modulus (GPa)Gyroid4.48 ± 0.095.14 ± 0.1012.9
Diamond4.47 ± 0.095.52 ± 0.1119.1
Primitive4.52 ± 0.095.00 ± 0.109.7
Specific Energy Absorption (J/g)Gyroid43.5 ± 0.939.9 ± 0.88.9
Diamond38.4 ± 0.847.0 ± 0.918.4
Primitive31.9 ± 0.626.20 ± 0.5221.6
Onset of Densification (mm/mm)Gyroid0.80 ± 0.020.74 ± 0.028.6
Diamond0.75 ± 0.020.75 ± 0.020.0
Primitive0.79 ± 0.020.70 ± 0.0113.4
Disclaimer/Publisher’s Note: The statements, opinions and data contained in all publications are solely those of the individual author(s) and contributor(s) and not of MDPI and/or the editor(s). MDPI and/or the editor(s) disclaim responsibility for any injury to people or property resulting from any ideas, methods, instructions or products referred to in the content.