Abstract
A piezoelectric vibration sensing system (PVSS) was devised in this study and employed for the purpose of vibration sensing in machining. The system comprises three primary components, wherein the sensor is utilized for the collection and conversion of energy, subsequently transmitting it to the data acquisition card (DAC) via a low-noise cable. The crux of the entire system lies in the upper computer-based control application, which facilitates the transmission of instructions to the DAC for data acquisition and transmission. The integration of Wi-Fi data transfer capability between the DAC and the computer serves to eliminate the principal issue associated with employing the sensor as a voltage source. The sensitivity of the designed device was calibrated utilizing commercial accelerometers, while an aluminum workpiece was fabricated to conduct vibration and machining tests in order to verify the performance of the PVSS. The shaker excitation experiment yielded a peak voltage of 0.05 mV, thereby substantiating that the PVSS can more accurately discern the natural frequency of the workpiece below 5000 Hz compared to commercial accelerometers. The experiments verify that the devised PVSS can precisely measure vibrations during the milling process, and can be implemented for the purpose of detecting machining stability.
1. Introduction
The integration of energy harvesting technologies into industrial processes has become a promising direction in recent years, primarily driven by the quest for high quality and efficiency in manufacturing. In cutting processes, a large amount of vibrational energy is generated, which deteriorates machining accuracy, surface finish, and even tool life [1,2,3,4]. Effective capture or sensing of the machining vibration could contribute to more accurate and efficient monitoring of manufacturing processes. Energy harvesters, especially ones based on piezoelectric materials, can convert the vibrational energy from machining into useful power while also serving as sensors to monitor the machining process [5,6,7,8]. This fusion of energy harvesting and machining application not only paves the way for precision manufacturing, but also introduces novel capabilities in vibration sensing.
Depending on the underlying energy conversion principles, energy harvesters can be classified into various types, such as electrostatic, piezoelectric, electromagnetic, magnetostrictive, and hybrid systems [9,10,11,12,13], among which piezoelectric energy harvesters more easily achieve miniaturization and integration. Piezoelectric materials commonly employed in piezoelectric energy harvesting include piezoelectric ceramics and piezoelectric polymers. Among these, piezoelectric ceramics exhibit a higher electromechanical coupling coefficient [14], making them well-suited for potential applications in machining. Lead zirconate titanate (PZT), despite its toxicity and relatively lower conversion efficiency, remains the most commonly used piezoelectric ceramic material. On the one hand, piezoelectric energy collection devices generate a certain amount of damping while receiving external vibration energy, which provides a theoretical basis for vibration suppression. Yigit et al. conducted a study on the effect of optimized piezoelectric shunt damping on the dynamic rigidity and absolute stability limit of the cutting process, demonstrating through theoretical and experimental means that the absolute stability limit in boring operations can be increased [15]. Da Silva et al. proposed a vibration reduction methodology to address chatter instability by utilizing embedded piezoelectric patches in the tool holder connected to a passive shunt circuit. Experimental results showed that this strategy presents a promising and feasible solution for chatter suppression, leading to improved surface finishing quality [16]. On the other hand, vibration signals can be collected through piezoelectric energy converters, thereby achieving vibration monitoring in mechanical processing. Presently, piezoelectric materials find extensive use in the design of sensors, particularly accelerometers. Piezoelectric accelerometers are employed to measure acceleration, and their output signal can be electronically integrated once to obtain the velocity signal or twice to obtain the displacement signal. Accelerometers are primarily designed using three different mechanical constructions: planar shear, delta shear, and center-mounted compression design. In addition, in the field of MEMS, the cantilever beam type is also a commonly used structure for accelerometers. Lee et al. [17] presented a PNZT piezoelectric film using a hybrid sol-gel method, resulting in an accelerometer with a sensitivity of 16.8 mV/g. However, due to its cantilever structure, the accelerometer’s natural frequency is limited to 200 Hz. Cheng-Che Tsai et al. [18] introduced a modified sol-gel method to fabricate thick film accelerometers with remarkable properties. These accelerometers exhibited voltage sensitivities ranging from 2.21 mV/g to 2.14 mV/g, and resonant frequencies between 6.5 kHz and 7.1 kHz, showcasing high sensitivity and performance. Shi et al. [19] designed and manufactured a piezoelectric accelerometer with a unique four L-shaped beam configuration. This accelerometer demonstrated an initial sensitivity of 28.14 mV/g at 500 Hz, and exhibited an operational bandwidth spanning from 100 Hz to 750 Hz.
In order to further process and analyze the signals collected by sensors, circuits for signal conditioning, conversion, and transmission are necessary. Signal acquisition technology is widely used in various testing and control sites, such as industrial testing and scientific experiments [20,21]. The acquisition system mainly consists of a signal conditioning circuit, an A/D conversion module, a storage module, and a transmission module. The electrical signals generated by piezoelectric chips cannot be directly input into the computer for processing, and the electrical signals converted and amplified by sensors are generally affected by electromagnetic interference at the measurement site, sensors, and the amplification circuit itself, often containing noise signals of multiple frequencies. If the noise signal is not removed, the testing system will not be able to obtain the signal correctly, so it is necessary to adjust the signal [22]. The A/D conversion module can convert the input analog voltage or current into a digital quantity directly proportional to it, and register it in the storage device. The digital signal obtained from A/D conversion needs to undergo signal analysis to meet monitoring requirements, and can generally be processed by an upper computer or microprocessor. Using the upper computer for data processing can fully utilize its powerful computing capabilities. In addition, based on the collected vibration signals, software and programming techniques can also be used to adopt more diverse methods for analysis. During this process, signals can be transmitted through wired or wireless means [23].
This paper embarks on a journey to explore the uncharted territory of utilizing energy harvesting principles in the realm of machining vibration sensing. In this study, a piezoelectric vibration sensing system (PVSS) is developed to convert mechanical vibration energy in mechanical processing into electrical energy. The remainder of the paper is organized as follows: Section 2 presents the construction of the PVSS, outlining the specific functions performed by each component, along with the design and working principle of each component in the PVSS system. In Section 3, the energy conversion components within the system are mathematically modeled. The experimental verification of the PVSS is thoroughly described in Section 4, which covers the vibration tests conducted, and Section 5 focuses on the machining tests performed. Finally, the paper is concluded in Section 6.
2. Construction of the PVSS and Its Modules
2.1. General Concept of the PVSS
In the case of constructing a sensor (Piezoelectric Accelerometer) that functions as a voltage source, a center-mounted compression design is selected. To facilitate the utilization of the proposed sensor, a comprehensive PVSS was designed and implemented. The PVSS system comprises three main components: the sensor itself, the data acquisition card (DAC), and the software-based PVSS control application (Figure 1). Instead of using a cable, Wi-Fi data transfer is employed for the communication between the DAC and the portable computer (PC).
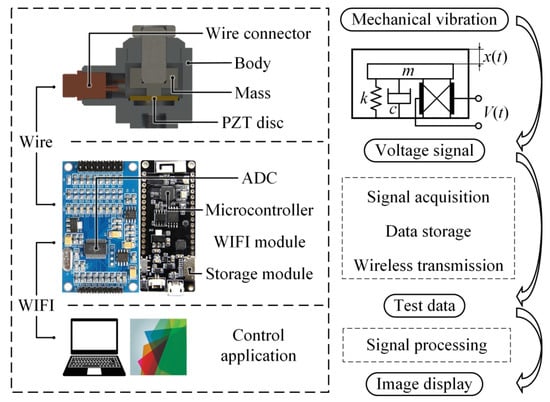
Figure 1.
General concept of the PVSS.
During the machining process, the workpiece undergoes vibrations, and a piezoelectric sensor attached to the workpiece converts the vibration acceleration into a corresponding voltage signal. This signal is captured by the DAC, which performs the analog-to-digital (AD) conversion and stores the collected data. The DAC’s microprocessor processes and analyzes the signals, presenting them in the form of visual representations, such as images.
In the energy harvesting system, an AC-DC energy conditioning circuit is essential for rectifying the alternating current generated by the piezoelectric transducers. This circuit can be modeled as a lumped-parameter electromechanical system with a single degree of freedom [24]. The most commonly employed circuit for this purpose is a bridge rectifier, which converts the output voltage from both polarities into a single polarity. The rectified voltage is then used to charge a capacitor to a predetermined voltage [25].
As shown in Figure 2, the voltage generated by the accelerometer is divided between the accelerometer and cable capacitances. The piezoelectric accelerometer can be viewed as a voltage source Va in series with a capacitor Ca in parallel with a high internal leakage resistance Ra, which is loaded by the capacitance of a cable Cc. It should be noted that any changes in Cc, caused by using a different cable type or altering the cable length, will affect the voltage sensitivity. Therefore, sensitivity calibration of the PVSS needs to be carried out before being applied in practice.
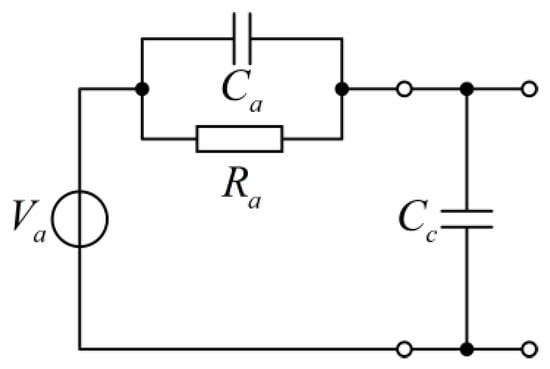
Figure 2.
The equivalent electrical circuits for the PZT accelerometer and connection cable.
The charge sensitivity of a piezoelectric accelerometer, represented as Sqa in Equation (1), is calibrated in terms of charge (measured in pC) per unit of acceleration.
Similarly, the voltage sensitivity, represented as Sva in Equation (2), is calibrated as voltage per unit of acceleration.
2.2. Design of the Sensor
Regarding the design of the sensor (Piezoelectric Accelerometer), the objective is to create a compact device capable of detecting vibrations up to a frequency of 5 kHz and accurately measuring their acceleration, especially for workpieces with varying weights in a vibrating state.
The sensor, as depicted in Figure 3, features outer dimensions of 20 mm in height, 16 mm in width, and 27 mm in length. To ensure a lightweight structure and enhanced durability, the cap and body components are forged from an aluminum alloy, while stainless steel is employed for the mass, stud, and nut. The piezoelectric disc is made from PZT-52 material, with dimensions of 10 mm in diameter and 1 mm in thickness. The upper surface of the PZT disc is covered with a thin tape layer for electrical insulation. The connection method of the PZT with other mechanical elements involves a center-mounted compression design. The stud is connected to the mass through an unthreaded hole at one end to retain the mass at the center of the device, in proximity to the PZT disc. The opposing end of the stud is screwed into the threaded hole at the center of the cap and affixed with a nut. This design allows the mass to move in response to vibrations while maintaining the necessary mechanical interaction with the PZT disc. The mass is not rigidly fixed in place, but can exhibit slight movement along the axis of the stud due to the flexibility of the PZT disc. The PZT disc, characterized by a stiffness of k, forms a spring-mass system in conjunction with the mass. During operation, vibrations originating from the source are transmitted to the sensor. This prompts the mass to vibrate, thereby causing deformation in the PZT disc, and results in the generation of a voltage signal. The voltage signal is then transferred through the wire connector, ultimately reaching the DAC for further processing.
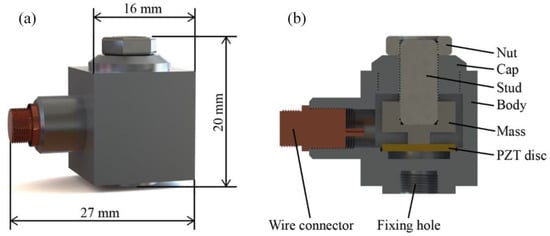
Figure 3.
The geometry and structure of the sensor. (a) the appearance and size of the sensor; (b) the internal structure of the sensor.
To ensure optimal sensitivity and high-quality measurement results, the sensor should be securely mounted to the workpiece using a stud mounting technique. This method maintains the sensor’s sensitivity and enables accurate measurements. During the experiment, a magnetic shaker is used to excite the workpiece, initiating vibrations. These vibrations are then transmitted from the workpiece to the sensor through the fixation stud and subsequently to the mass inside the sensor. As a result of the input impact force, the vibrating mass strikes the PZT disc, generating a voltage signal. The mass is kept centered on the PZT disc by the stud, which acts as a spring in the spring-mass system. The generated voltage signal is then transmitted from the PZT disc to the wire connector via a soldered wire. It is crucial to use a low-noise cable for the transmission of the voltage output signal to the DAC to ensure clear and accurate indication of the signal; this therefore helps to minimize any potential interference that could affect the final measurement result.
2.3. Construction of the DAC
Figure 4 presents the designed and assembled DAC. The DAC consists of two primary components: the analog-digital converter (ADC) and the Microcontroller.
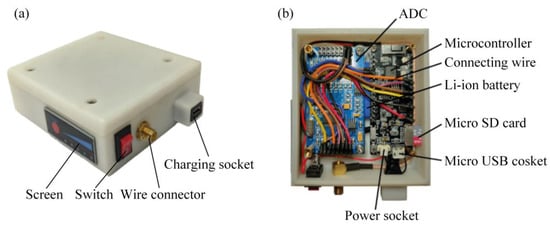
Figure 4.
The designed DAC. (a) overall view of the DAC; (b) circuit construction of the DAC.
The designed DAC incorporates the ADS1256 as the ADC due to its 24-bit resolution and low noise performance. The ADC utilizes a quadruple-order delta-sigma (ΔΣ) modulator and a programmable digital filter to achieve high-precision analog-to-digital conversion. It also features a flexible input multiplexer that can handle both differential and single-ended signals, with built-in circuitry to verify the proper functioning of external sensors connected to the inputs.
For the microcontroller, the TTGO T8 V1.7 electronic board is employed. This board is built around the ESP-32 Wroover module, a versatile WiFi-BT-BLE Microcontroller Unit (MCU) capable of performing various tasks. The ADC and microcontroller are interconnected and communicate with each other through a serial peripheral interface (SPI). The analog voltage signal generated by the sensor during vibration is transmitted via a low-noise cable to the DAC, specifically to the ADC input. The microcontroller then acquires the signal data from the ADC and stores it on a micro SD card, which serves as the memory storage medium. The acquired signal data remains stored on the micro SD card until it is transmitted wirelessly through Wi-Fi to a computer software application.
After the manufacturing process and final assembly, the DAC has a weight of 146 g, and dimensions of 95 mm in length, 80 mm in width, and 29 mm in height. These compact dimensions and lightweight design contribute to the portability and practicality of the DAC for vibration measurement applications in machining processes.
2.4. Construction of the Control Module
The scheme of the designed experimental setup, including the PVSS and the control application running on a computer, is illustrated in Figure 5. This setup enables effective control and data transmission between the PVSS and the computer program, facilitating the monitoring and analysis of vibration measurements.

Figure 5.
Scheme of the designed experimental setup. (a) The data acquisition module; (b) the data processing module.
3. Mathematical Modelling
The equivalent mechanical model is shown in Figure 1, which showcases the single piezoelectric oscillator in the energy harvesting system.
The model consists of essential components, such as an effective mass m, a spring k, a combined viscous damping element c, and a piezoelectric element with an effective piezoelectric coefficient Θ and capacitance Cv. When the generator undergoes vibration with a displacement x(t) and the mass undergoes relative motion denoted as (t), the resulting differential equation of motion can be expressed as follows.
The mass in the system, identified as a mass m, is subjected to a harmonically time-varying acceleration, 0(t) = a0sin(ωt), with a loading frequency of ω. The displacement of the mass with respect to the hollow cylinder block is characterized by a single displacement coordinate x(t). Taking into account the effect of viscous damping, the differential equation of motion can be expressed as follows.
The natural frequency of the system, ωn, can be expressed as ωn = sqrt(k/m). The damping ratio, denoted as ζ, is given by ζ = c/(2mωn). It is seen that the mass value influences the damping ratio, thereby affecting the level of vibration attenuation. Consequently, Equation (3) can be rewritten as Equation (4).
The general solution of x(t) is given by xt(t).
By substituting Equation (5) into Equation (4), the constants A1 and A2 are computed based on the initial conditions x(0) = 0 and (0) = 0, as presented in Equations (6) and (7).
where β is the frequency ratio, which is defined as β = ω/ωn. Therefore, the transient response represented by the particular solution of Equation (4) is given as xp(t).
Furthermore, the steady-state harmonic response can be expressed by xs(t).
where
Consequently, the total response containing the transient and steady-state response is obtained as Equation (11).
According to Hooke’s law, the force that acts on the piezoelectric material due to the displacement excitation can be derived as F(t).
Therefore, the voltage generated V(t) by the piezoelectric harvester is represented as follows:
where d33 is the piezoelectric coefficient in the 3–3 coupling mode, and Cv is the capacity of a single piezoelectric patch.
The output power for a circular piezoelectric energy harvester, which is given by Pondrom [26], is expressed as Equation (14)
where Rl denotes the load resistance.
When the load resistance Rl equals its optimal value Ropt, as expressed as Equation (15), the output power reaches its maximum Pmax and can be derived as Equation (16).
4. Vibration Tests
An aluminum (7075-T6) workpiece, shown in Figure 6, is fabricated to conduct vibration and machining tests to evaluate the performance of the PVSS. FEM analysis is carried out first, which indicates that the first four natural frequencies of the workpiece is 781 Hz, 1851 Hz, 4579 Hz, and 4815 Hz. As the boundary conditions between the ideal case and the practical scenario may change due to clamping uncertainties, the natural frequencies of the workpiece are also simulated, and the results are presented in Table 1, which demonstrates the relationship between support stiffness and natural frequency. As the support stiffness increases from 7.35 × 10⁹ N/m to 1.25 × 10¹⁰ N/m, the first natural frequency of the workpiece increases from 600.4 Hz to 650.0 Hz. When the support stiffness approaches infinity, representing an ideal fixed boundary condition, the first mode frequency reaches its maximum value of 781.2 Hz.
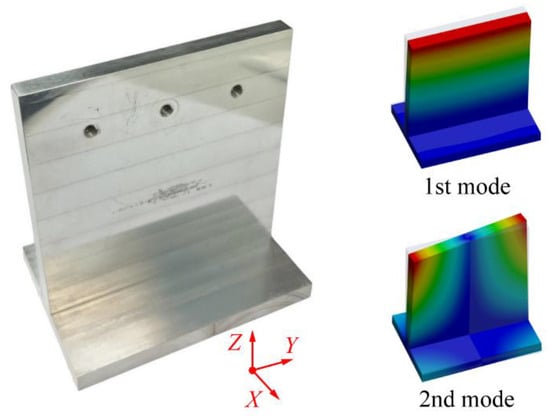
Figure 6.
The workpiece to be machined.

Table 1.
Variation of natural frequencies with different support stiffness.
The designed sensor needs to be calibrated before conducting shaker excitation tests. Figure 7 showcases both the time and frequency domains of the acquired vibration signal from the sensor under a harmonic excitation, and a stable output voltage of 1.64 mV is observed in the time domain. After performing fast Fourier transformation (FFT), the corresponding spectrum in the frequency domain is obtained, which indicate a single frequency harmonic of 100 Hz. Furthermore, the vibration signal under the same excitation measured by a commercial accelerometer is shown in Figure 8. It can be seen that the magnitude and the frequency of the excitation by the shaker is 8.2 g and 100 Hz, respectively. Compared with the output voltage of the sensor, the sensitivity can be determined as 0.2 mV/g.
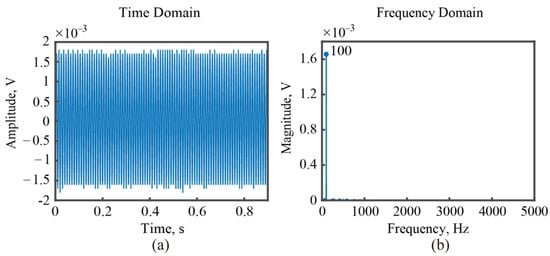
Figure 7.
The vibration signal measured by the designed PVSS. (a) In the time domain; (b) in the frequency domain.
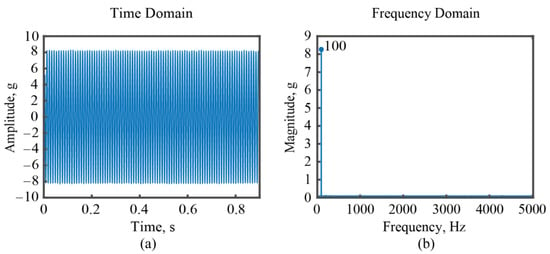
Figure 8.
The vibration signal measured by a commercial accelerometer. (a) In the time domain; (b) in the frequency domain.
Following the calibration of the designed sensor, a series of shaker excitation tests were conducted. The laboratory stand is presented in Figure 9.
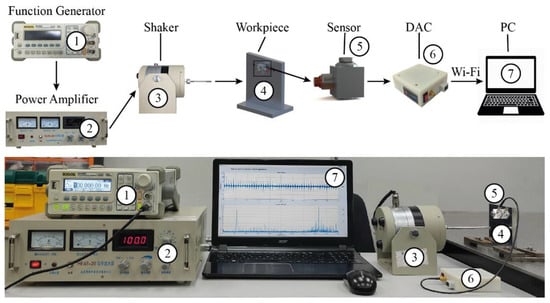
Figure 9.
The laboratory stand diagram; 1—function generator (RIGOL DG1022U); 2—power amplifier (TS5871); 3—shaker (JZ50); 4—workpiece; 5—the designed sensor; 6—the designed DAC; 7—PC.
The output voltage of the sensor was measured under various excitation frequencies, and the results are presented in Figure 10. The corresponding theoretical results were also included for comparison purposes, which are calculated based on Equation (13), and their parameter values are given in Table 2.
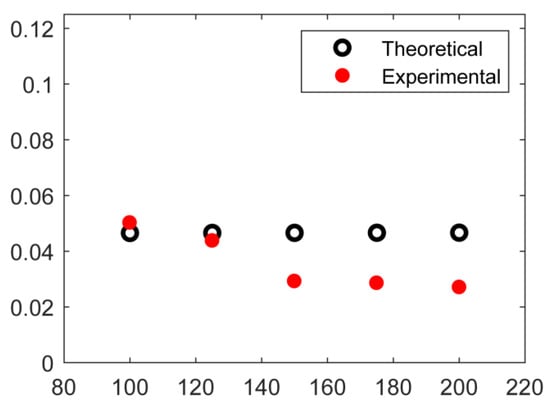
Figure 10.
The output voltage of the designed PVSS by shaker excitation tests.

Table 2.
The parameter values for output voltage calculation.
The excitation frequencies ranged from 100 Hz to 200 Hz, with a voltage peak-to-peak (Vp-p) value of 5 V. The highest peak of the output voltage was measured to be 0.05 mV at 100 Hz, whereas the theoretical value was expected to be 0.047 mV. With the excitation frequency increases, the generated voltage was found to be smaller than the theoretical values, and the discrepancy in the theoretical and experimental results increased. This phenomenon may be attributed to the enhanced effect of damping due to the increasing excitation frequency, which reduces the amplitude of excited vibrations, and thus the output voltage.
Furthermore, shaker excitation tests were conducted on the designed PVSS attached to the workpiece. Figure 11a shows the output signal from the designed PVSS with a sensitivity of 0.2 mV/g. Additionally, the output signals from the commercial accelerometers (the technical data are given in Table 3) are shown in Figure 11b,c.
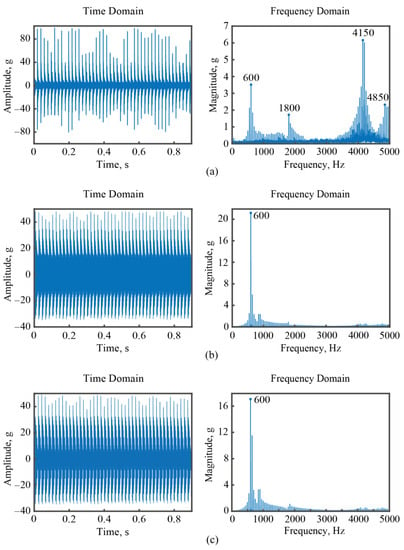
Figure 11.
The measured vibration signals in shaker excitation tests. (a) by the designed PVSS; (b) by KISTLER 8776B050A; (c) by KISTLER 8778A500.

Table 3.
Technical data of the KISTLER accelerometers.
It can be observed that all three accelerometers accurately identify the fundamental frequency of the workpiece, which is determined to be 600 Hz. However, the designed PVSS outperforms the commercial sensors by successfully identifying three additional natural frequencies: 1800 Hz, 4150 Hz, and 4850 Hz. This improved sensitivity contributes to enhanced measurement accuracy, allowing for the identification of four natural frequencies below 5 kHz.
The capability of the designed sensor in detecting higher modes is attributed to its carefully engineered sensitivity, which is set at a lower level (0.2 mV/g) compared to that of previous research (Table 4) and commercial accelerometers such as the KISTLER 8776B050A (106.8 mV/g) and KISTLER 8778A500 (10.73 mV/g). This intentional reduction in sensitivity plays an important role in enhancing accuracy when measuring high-frequency vibration signals.

Table 4.
Indexes of the designed sensors and those in related studies.
Sensors with higher sensitivity possess the advantage of quicker and more precise responsiveness to changes in input. However, they also tend to be more susceptible to environmental noise and interference, particularly at high frequencies, so that limits the stability and bandwidth. The designed sensor, with its lower sensitivity, strikes a balance between accuracy and resilience against high-frequency noise, thereby enabling the detection of higher vibration modes beyond the capabilities of high-sensitivity commercial accelerometers.
It should be noted that due to challenges associated with achieving ideal workpiece attachments on a platform, the natural frequencies obtained from the experimental results may differ slightly from those obtained through FEM simulation. Based on the experimental findings, it can be concluded that the developed PVSS offers more accurate vibration measurements compared to the other two accelerometers.
5. Machining Application
The current study utilizes a three-axis vertical milling machine to conduct the machining test, and the stability analysis is performed using CutPro software. To determine the natural frequency, stiffness, and damping ratio of the spindle-tool system, which are essential for predicting the SLD, impact tests were conducted as shown in Figure 12. During the test, a hammer (PCB 086C03) was used to excite the tooltip and workpiece, and the resulting signal was captured using an accelerometer (KISTLER 8776B050A).
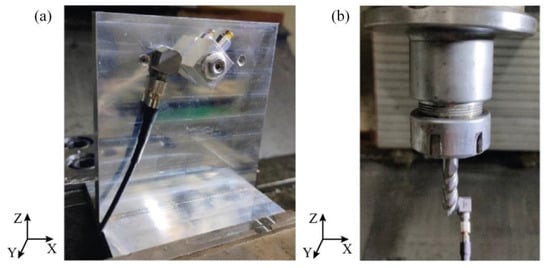
Figure 12.
Impact test on the workpiece and tooltip. (a) Workpiece; (b) tooltip.
Figure 13 shows measured FRFs for the workpiece in the Y direction, and that of the tooltip in the X and Y directions, which are neccesarry for SLD prediction. It should be noted that the natural frequency of the workpiece is 650 Hz according to Figure 13a, which slightly differs from the value obtained during the shaker excitation test (600 Hz). This discrepancy in natural frequency may be attributed to variations in boundary conditions between the two tests.
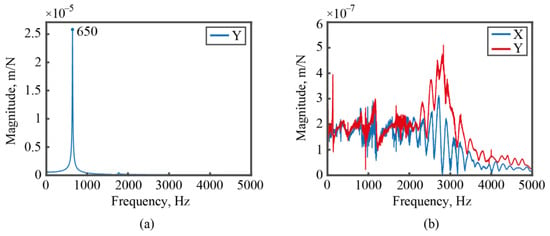
Figure 13.
The measured FRFs. (a) Workpiece in the Y direction; (b) tooltip in the X and Y directions.
After conducting the stability analysis, the predicted SLD can be derived as shown in Figure 14. The SLD provides information about the stable and unstable cutting zones based on the chosen depth of cut and spindle speed (Table 5). For the machining test, three points were selected: Points #1 and #3 are situated in the predicted stable cutting zone and have similar depth of cut values but different spindle speeds. Point #2, on the other hand, is located in the predicted unstable cutting zone and shares the same spindle speed as Point 1 but has a different depth of cut. These points were chosen to investigate the machining vibration under various cutting conditions. For the machining test, a carbide milling cutter with a diameter of 12 mm and three flutes (z = 3) was used. The machining vibration of the workpiece was measured simultaneously using both a commercial accelerometer and the designed PVSS, as depicted in Figure 14. The acquired data from these measurements were then compared and analyzed to gain insights into the vibration behavior during the machining process.
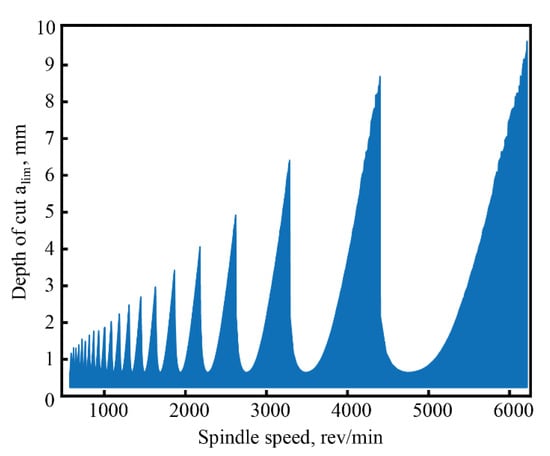
Figure 14.
The predicted SLD based on the measured FRFs.

Table 5.
The cutting parameters of machining test.
The results of the machining test are presented in Figure 15, Figure 16 and Figure 17. Figure 16 specifically displays the measurement results obtained at Point #1. By analyzing the frequency domain of the collected signals, it can be observed that both the designed PVSS and the commercial accelerometer are capable of identifying the tooth passing frequency during the cutting operation, which is determined to be 700 Hz. Additionally, the second peak observed in the frequency domain corresponds to the excited vibration mode frequency of the workpiece during the cutting process. A difference in the vibration frequency measured by the designed PVSS and the commercial accelerometer is observed from Figure 16. Specifically, the designed PVSS identifies the excited frequency of the workpiece as 1750 Hz. However, this is measured as a frequency of 1808 Hz by the commercial accelerometer.
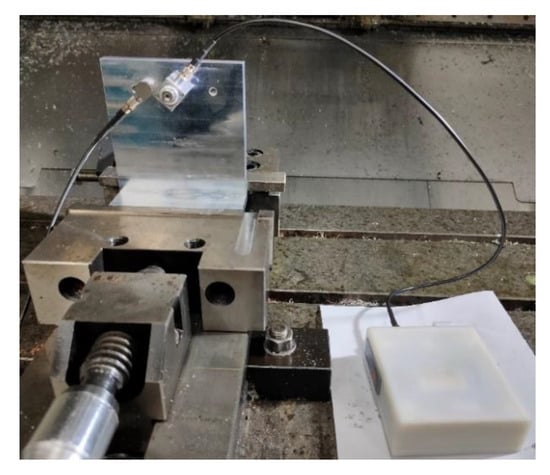
Figure 15.
The experimental setup for machining test.
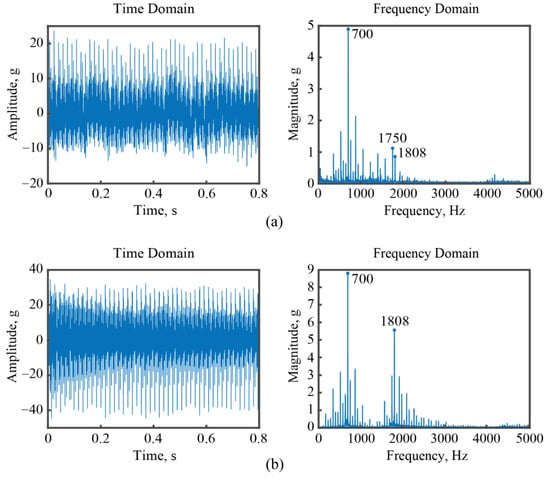
Figure 16.
The measured vibration signals for Point #1. (a) By the designed PVSS; (b) by the commercial accelerometer.
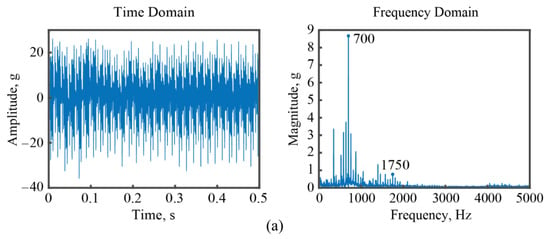
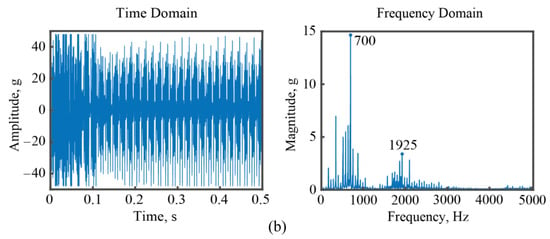
Figure 17.
The measured vibration signals for Point #2. (a) By the designed PVSS; (b) by the commercial accelerometer.
The vibration measurement results at Point #2 are depicted in Figure 17. Similar to the results for Point #1, the developed PVSS successfully detects the tooth passing frequency, 700 Hz, during the cutting process. Meanwhile, the excited mode frequency of the workpiece is measured as 1750 Hz and 1925 Hz by the designed PVSS and the commercial accelerometer, respectively.
Figure 18 presents the vibration measurement results obtained for Point #3. In this case, both the designed PVSS and the commercial accelerometer identify the tooth passing frequency as 615 Hz. Meanwhile, the excited mode frequency of the workpiece is detected to be 1775 Hz by the designed PVSS, and is identified as 1845 Hz by the commercial accelerometer.
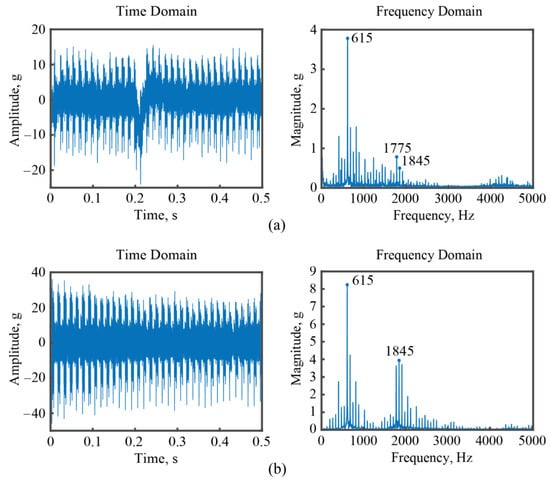
Figure 18.
The measured vibration signals for Point #3. (a) By the designed PVSS; (b) by the commercial accelerometer.
The differences in the observed performance for capturing higher resonance frequencies is mainly attributed to the spatial discrepancy of the designed sensor and the commercial accelerometer during the machining tests.
According to the modal analysis of the workpiece, as depicted in Figure 6, the first mode corresponds to the bending of the thin-walled plate, while the second mode involves a twist with respect to the z-axis. In the machining tests, the positioning of the designed sensor is closer to the modal node of the second mode, which differs from that of the commercial accelerometer. The designed sensor exhibits reduced accuracy in capturing both the amplitude and frequency of this mode in comparison to the commercial accelerometer. However, it is noteworthy that the frequency of the first mode, which both sensors measure consistently, aligns well with the anticipated results.
6. Conclusions
This study presents a PVSS designed for vibration sensing, particularly in the context of machining applications, which consists of a sensor, a DAC, and control application software. The system’s design is detailed, and each module has been carefully selected to ensure seamless integration and optimal functionality. The underlying energy conversion principles have been mathematically modeled, providing insights into the PVSS’s capability in vibration sensing. Experimental validation through shaker excitation tests and machining applications substantiates the PVSS’s effectiveness in vibration measurement and its potential for various industry applications.
The wireless data transfer is integrated for seamless communication between the DAC and PC, and its reliability is experimentally verified. This departure from traditional wired connections not only liberates the system from physical constraints, but also enhances the flexibility and convenience of data transmission. This feature opens avenues for remote operation, contributing to a more adaptive and user-friendly sensing system that can cater to diverse industrial requirements.
The results of shaker excitation tests indicate that the PVSS is capable of detecting all natural frequencies of the workpiece below 5 kHz, while the commercial accelerometers could only identify the fundamental frequency. The superior performance of the PVSS in capturing higher vibration modes can be attributed to the combination of intentionally reduced sensitivity with the carefully engineered output signal processing module. This approach strikes a balance between precision and resilience against high-frequency noise, which enables the PVSS to surpass the capabilities of high-sensitivity accelerometers by effectively detecting higher vibration modes.
While the PVSS has demonstrated favorable performance for measuring milling vibration, further enhancements could still be achieved. Future investigations can explore avenues to further amplify sensitivity and expand the system’s frequency range. Additionally, investigating the impact of temperature variations on the sensor’s performance could further enhance the versatility of the sensing system, ensuring accurate measurements across a broader spectrum of utilization scenarios.
Author Contributions
Formal analysis, L.L. and M.A.; Funding acquisition, W.M. and D.X.; Project administration, Y.Y.; Software, L.L. and M.A.; Supervision, Y.Y. and W.M.; Writing—original draft, W.M.; Writing—review and editing, Y.Y. All authors have read and agreed to the published version of the manuscript.
Funding
This research was funded by the National Natural Science Foundation of China grant number [52205005, 91960108, and 52205493], the China Postdoctoral Science Foundation grant number [2022M720014], and the Jiangxi Provincial Natural Science Foundation grant number [20224BAB214046].
Data Availability Statement
Data is contained within the article.
Conflicts of Interest
The authors declare no conflict of interest.
References
- Si, H.; Wang, L. Error compensation in the five-axis flank milling of thin-walled workpieces. Proc. Inst. Mech. Eng. Part B J. Eng. Manuf. 2019, 233, 1224–1234. [Google Scholar] [CrossRef]
- Ma, H.; Wu, J.; Xiong, Z. Active chatter control in turning processes with input constraint. Int. J. Adv. Manuf. Technol. 2020, 108, 3737–3751. [Google Scholar] [CrossRef]
- Liu, Y.; Liu, Z.; Song, Q.; Wang, B. Analysis and implementation of chatter frequency dependent constrained layer damping tool holder for stability improvement in turning process. J. Mater. Process. Technol. 2019, 266, 687–695. [Google Scholar] [CrossRef]
- Yang, Y.; Wang, Y.; Liu, Q. Design of a milling cutter with large length–diameter ratio based on embedded passive damper. J. Vib. Control. 2019, 25, 506–516. [Google Scholar] [CrossRef]
- Fang, H.B.; Liu, J.Q.; Xu, Z.Y.; Dong, L.; Wang, L.; Chen, D.; Cai, B.C.; Liu, Y. Fabrication and performance of MEMS-based piezoelectric power generator for vibration energy harvesting. Microelectron. J. 2006, 37, 1280–1284. [Google Scholar] [CrossRef]
- Lin, S.-C.; Wu, W.-J. Fabrication of PZT MEMS energy harvester based on silicon and stainless-steel substrates utilizing an aerosol deposition method. J. Micromech. Microeng. 2013, 23, 125028. [Google Scholar] [CrossRef]
- Liu, H.; Lee, C.; Kobayashi, T.; Tay, C.J.; Quan, C. A new S-shaped MEMS PZT cantilever for energy harvesting from low frequency vibrations below 30 Hz. Microsyst. Technol. 2012, 18, 497–506. [Google Scholar] [CrossRef]
- Jiang, L.; Yang, Y.; Chen, R.; Lu, G.; Li, R.; Li, D.; Humayun, M.S.; Shung, K.K.; Zhu, J.; Chen, Y.; et al. Flexible piezoelectric ultrasonic energy harvester array for bio-implantable wireless generator. Nano Energy 2019, 56, 216–224. [Google Scholar] [CrossRef]
- Naito, Y.; Uenishi, K. Electrostatic MEMS Vibration Energy Harvesters inside of Tire Treads. Sensors 2019, 19, 890. [Google Scholar] [CrossRef]
- Yu, G.; He, L.; Zhou, J.; Liu, L.; Zhang, B.; Cheng, G. Study on mirror-image rotating piezoelectric energy harvester. Renewable Energy 2021, 178, 692–700. [Google Scholar] [CrossRef]
- Wu, Q.; Gao, S.; Jin, L.; Guo, S.; Yin, Z.; Fu, H. A Frequency-Adjustable Tuning Fork Electromagnetic Energy Harvester. Materials 2022, 15, 2108. [Google Scholar] [CrossRef]
- Liu, H.; Zhao, X.; Liu, H.; Yang, J. Magnetostrictive biomechanical energy harvester with a hybrid force amplifier. Int. J. Mech. Sci. 2022, 233, 107652. [Google Scholar] [CrossRef]
- Hou, C.; Li, C.; Shan, X.; Yang, C.; Song, R.; Xie, T. A broadband piezo-electromagnetic hybrid energy harvester under combined vortex-induced and base excitations. Mech. Syst. Signal Process. 2022, 171, 108963. [Google Scholar] [CrossRef]
- Kim, H.S.; Kim, J.-H.; Kim, J. A review of piezoelectric energy harvesting based on vibration. Int. J. Precis. Eng. Manuf. 2011, 12, 1129–1141. [Google Scholar] [CrossRef]
- Yigit, U.; Cigeroglu, E.; Budak, E. Chatter reduction in boring process by using piezoelectric shunt damping with experimental verification. Mech. Syst. Signal Process. 2017, 94, 312–321. [Google Scholar] [CrossRef]
- da Silva, M.M.; Venter, G.S.; Varoto, P.S.; Coelho, R.T. Experimental results on chatter reduction in turning through embedded piezoelectric material and passive shunt circuits. Mechatronics 2015, 29, 78–85. [Google Scholar] [CrossRef]
- Lee, Y.-C.; Tsai, C.-C.; Li, C.-Y.; Liou, Y.-C.; Hong, C.-S.; Chu, S.-Y. Fabrication and function examination of PZT-based MEMS accelerometers. Ceram. Int. 2021, 47, 24458–24465. [Google Scholar] [CrossRef]
- Tsai, C.C.; Chien, Y.C.; Hong, C.S.; Chu, S.Y.; Wei, C.L.; Liu, Y.H.; Kao, H.Y. Study of Pb(Zr0.52Ti0.48)O3 microelectromechanical system piezoelectric accelerometers for health monitoring of mechanical motors. J. Am. Ceram. Soc. 2019, 102, 4056–4066. [Google Scholar] [CrossRef]
- Shi, S.; Geng, W.; Bi, K.; Shi, Y.; Li, F.; He, J.; Chou, X. High Sensitivity MEMS Accelerometer Using PZT-Based Four L-Shaped Beam Structure. IEEE Sens. J. 2022, 22, 7627–7636. [Google Scholar] [CrossRef]
- Adigüzel, E.; Gürkan, K.; Ersoy, A. Design and development of data acquisition system (DAS) for panel characterization in PV energy systems. Measurement 2023, 221, 113425. [Google Scholar] [CrossRef]
- Katrancıoğlu, S.; Savaş, K.; Erdal, H. A modular and low-cost data acquisition card design with multitasking support. Procedia Soc. Behav. Sci. 2010, 2, 5266–5270. [Google Scholar] [CrossRef]
- Karbari, S.R.; Mohanram, S.; Sriniketh, S.S.; Kumari, M.U.; Shireesha, G. Signal conditioning circuits for low vibration signals using an array of piezoelectric sensors. Mater. Today Proc. 2021, 46, 2212–2220. [Google Scholar] [CrossRef]
- Yuan, Y.; Xu, Q.; Guan, X.; Liu, Z. Industrial high-speed wireless synchronous data acquisition system with real-time data compression. Measurement 2013, 46, 3482–3487. [Google Scholar] [CrossRef]
- Shu, Y.C.; Lien, I.C. Analysis of power output for piezoelectric energy harvesting systems. Smart Mater. Struct. 2006, 15, 1499. [Google Scholar] [CrossRef]
- Liu, H.; Hua, R.; Lu, Y.; Wang, Y.; Salman, E.; Liang, J. Boosting the efficiency of a footstep piezoelectric-stack energy harvester using the synchronized switch technology. J. Intell. Mater. Syst. Struct. 2019, 30, 813–822. [Google Scholar] [CrossRef]
- Pondrom, P.; Hillenbrand, J.; Sessler, G.M.; Bös, J.; Melz, T. Vibration-based energy harvesting with stacked piezoelectrets. Appl. Phys. Lett. 2014, 104, 172901. [Google Scholar] [CrossRef]
Disclaimer/Publisher’s Note: The statements, opinions and data contained in all publications are solely those of the individual author(s) and contributor(s) and not of MDPI and/or the editor(s). MDPI and/or the editor(s) disclaim responsibility for any injury to people or property resulting from any ideas, methods, instructions or products referred to in the content. |
© 2023 by the authors. Licensee MDPI, Basel, Switzerland. This article is an open access article distributed under the terms and conditions of the Creative Commons Attribution (CC BY) license (https://creativecommons.org/licenses/by/4.0/).