Abstract
The aim of this research was to determine the factors affecting the metallurgical quality of cast iron during serial production of castings using a campaign cupola and a holding furnace. The problem to be solved, which was to obtain cast iron with the required mechanical properties while reducing the internal porosity, results from the foundry’s need to increase the metallurgical quality of the alloy. The increasing difficulty and complicated constructions of castings, for which it is not possible to introduce risers at the stage of technological design, make the stage of proper preparation of cast iron the only way to obtain castings without shrinkage defects. The article presents the results of the study of physicochemical and mechanical properties, microstructure and shrinkage tendency of ductile iron depending on the charge materials used, the amount of Mg used during spheroidization and the type of final inoculants. Step castings and wedge tests were produced on a vertical molding line. The spheroidization was carried out by injecting a core wire containing Mg alloy into the cast iron. The final inoculation of 0.2% was performed using a pneumatic dispenser equipped with a vision system to control the effectiveness of the inoculation. The ITACA Meltdeck thermal analysis system was used to study the physicochemical properties of the initial cast iron, and the ITACA X system to analyze the state of the final cast iron on the molding line. Mechanical tests were performed on samples cut from a stepped casting, and microstructure tests were carried out using a light microscope and a scanning electron microscope. The results of thermal analyses show that increasing the share of pig iron at the expense of steel increases the minimum solidification temperature of eutectic, and thus, increases the potential for graphite nucleation in cast iron. Increasing the nucleation potential can be obtained by adding anthracite, FeSi and SiC. A very important factor in obtaining cast iron of high metallurgical quality is the possible limitation during spheroidization of the length of the core wire containing Mg, which is a carbide-forming element. The lower the initial sulfur level, the greater the possibility of reducing the amount of cored wire. The inoculants containing Ce and Bi were the most advantageous final inoculants from the point of view of obtaining the best microstructure parameters and plastic properties of cast iron.
1. Introduction
Ductile iron is a high-carbon iron alloy in which the carbon is spheroidal. Solidification of ductile iron, as with other grades of iron containing carbon in the form of graphite, involves eutectic transformation. In ductile iron, the number of stable nucleation centers for eutectic solidification is about 200 times greater than in gray cast iron for the same undercooling. Austenite preferentially nucleates in carbon-depleted regions, and elements such as Al, V, Zr and Ti effectively increase the number of austenite dendrites by forming carbides, nitrides and carbonitrides as a substrate for austenite crystallization [1,2,3,4,5].
The number of nucleation centers is a function of the chemical composition and undercooling of the liquid metal. The inoculation process is more effective in hypoeutectic than in hypereutectic cast iron. Several types of inclusions have been identified in the central part of spheroids, most often products of spheroidization and inoculation: MgS, CaS, SrS, CeS, LaS, MgO, SiO2, MgO.SiO2, 2MgO.SiO2, CaOAl2O3.2SiO2, (Mg,Al)3O4, (Mg,Al)SiO3, (Mg,Ca,Al)SiO3, Fe2O3, Fe2SiO4, Mg-Al.-Si-Ti-O, CeO2, MgSiN2, MgN2 and CaOSiO2 [1,5,6].
The basic steps in the production of high-quality ductile iron castings are the proper melting and preparation of the base cast iron. The metallurgical quality depends on the quality of the charge materials, and the control of the melting process and preparation of the liquid metal for the final metallurgy treatment (spheroidization, inoculation). The input materials are the raw materials necessary for the smelting of cast iron. They can be divided into base materials that make up the base material of the alloy, auxiliary materials that are used to adjust the chemical composition or that carry alloying elements, and materials that are used to remove contaminants. For melting ductile iron, a typical charge has the following structure: pig iron, steel scrap, returned scrap of ductile iron and ferroalloy and carburizer [7,8,9,10,11,12].
The mentioned charge materials do not have to be fully used in the melting; they can be omitted depending on the conditions. The most stabilized cast iron melting process (both in terms of chemical composition and temperature) is ensured by the use of induction electric furnaces. In many foundries, due to higher efficiency and lower production costs, ductile iron is also produced in the cupola-induction or cupola-holding furnace systems. Long keeping of cast iron at high temperature leads to burnout and dissolution of the graphite nuclei. The physicochemical state of cast iron can be significantly changed using the preconditioner and inoculation procedure, which consists of introducing compounds containing elements such as Ca, Sr, Zr, Ba, Al into the liquid cast iron, which can be graphite nuclei because they are sparingly soluble in liquid cast iron. Another way to improve metallurgical quality is to supplement the metal bath with carbon and silicon. Increasing the proportion of pig iron at the expense of steel scrap also leads to an improvement in the condition of the base cast iron [7,8,9,10].
2. Materials and Methods
2.1. Influence of Charge Materials on the Metallurgical Quality of the Starting Cast Iron
Cast iron melts were carried out under production conditions using a campaign cupola with oxygen-enriched blast. The basic parameters of cupola melting include: the amount of dosed coke, the amount and temperature of blast, and the overheating temperature of cast iron. The melting furnace is equipped with an automatic component weighing system, which allows one to change the proportions of the materials in any way, depending on the required chemical composition of the cast iron. The cast iron was continuously transported through a runner to the holding furnace, from which a sample was taken for chemical composition testing using an emission spectrometer. Figure 1 shows a diagram showing the melting logistics. The physicochemical properties of cast iron were also controlled; mainly the nucleation potential using a thermal analysis stand. Charge materials are the raw materials necessary for the smelting of cast iron. The materials used in the tests could be divided into basic materials, which are the main alloying material (pig iron, steel scrap, scrap/returns), auxiliary materials used to correct the chemical composition (anthracite, FeSi, SiC), materials used to remove impurities (CaCO3) and fuel needed to operate the cupola (coke). To calculate the carbon equivalent CE, the dependence [1] was used:
where: C, Si, P, Mn, S -% content of carbon, silicon, phosphorus, manganese and sulfur in the sample.
CE = C + 0.31Si + 0.33P + 0.40S − 0.027Mn
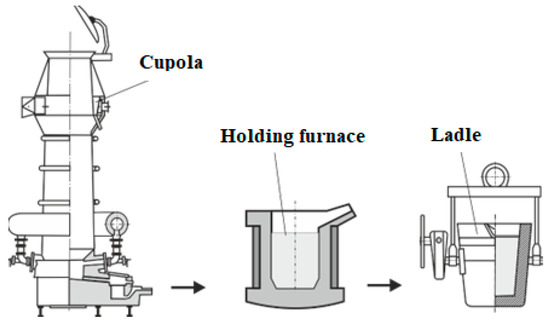
Figure 1.
Diagram of cast iron melt.
Table 1 shows the chemical composition of the charge materials. The share of individual charge materials used in the subsequent melts is presented in Table 2, while the obtained chemical compositions of the base cast iron are shown in Table 3.

Table 1.
Chemical composition of charge materials.

Table 2.
Charge materials.

Table 3.
Chemical composition of base iron.
The chemical composition does not reflect the physicochemical condition of cast iron; therefore, the cups for thermal analysis were additionally poured. This method determines the characteristic parameters of the solidification process (temperature), crystallization (the first derivative of the solidification process) and nucleation (the second derivative of the solidification process). Thermal derivative analysis is carried out by pouring the tested metal into a cup made of a shell mass with a thermocouple for temperature measurement [13,14,15,16,17].
Data from the thermocouple are sent to the recording and processing apparatus, and then saved. The cooling curve allows you to observe temperature changes during the metal cooling process. It determines two characteristic points, called crystallization stops, the first of which reflects the temperature of the beginning of crystallization (liquid), while the second determines the temperature of the end of solidification (solidus). The curve determining the derivative of the cooling function allows the observation of even the smallest thermal effects occurring in the metal, thanks to which it is possible to determine temperature stops in low-energy phase transitions, where these points are difficult to determine [13,14,18,19,20,21,22].
A typical ATD (thermal derivative analysis) diagram illustrates two curves: cooling T (t) and crystallization T′(t), as shown in Figure 2. The cooling curve is a graph of the temperature variation during the cooling process of the metal.
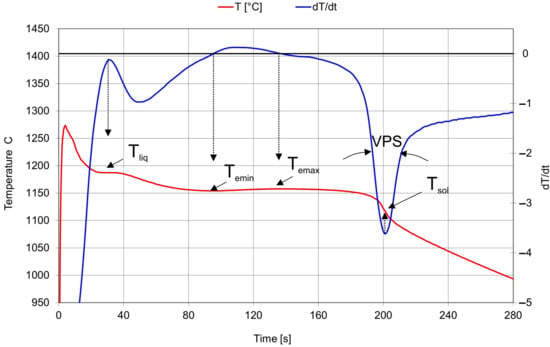
Figure 2.
An example of a thermal analysis curve.
To better understand the meaning of each parameter, the following is a description of each of them [13,18,19,20,21,22]:
- ▪
- Tliq—temperature at which the first solid particles are formed: the solidification process begins. Shown as a horizontal plateau due to the precipitation of primary austenite in hypoeutectic cast iron and as the minimum temperature for eutectic alloys
- ▪
- Temin—the minimum temperature reached during the solidification of the eutectic. At this point, the latent heat of crystallization is equal to the heat given off during cooling. According to the literature data from the sources of the manufacturer of the device for thermal derivation analysis ITACA, below 1135 °C, nucleation is considered low and there is then a high risk of primary carbides appearing in the casting. Between 1135 °C and 1145 °C, nucleation is not considered optimal and the risk of the appearance of primary carbides in the casting has to be assessed according to the wall thickness of the casting. Above 1145 °C, nucleation is very good and there is no risk of primary carbide formation.
- ▪
- VPS—the rate of transition of cast iron from semi-solid to solid. Parameter strongly related to the formation of shrinkage cavities. Primary cast iron optimal values depend on the carbon content (data from the sources of the manufacturer of the device for thermal derivation analysis ITACA):
- -
- for high CEL cast iron it must be <16
- -
- for cast iron with average CEL it must be <20
- -
- for low CEL cast iron it must be <23Need to pay attention to the amount of inoculant and pre-conditioner used, as too much may deteriorate rather than improve the indicator.In final cast iron, the optimal values of the index depend on the type of cast iron:
- -
- for gray cast iron optimal values: <16, <20, <23 (depending on the C content)If the indices are above the threshold values, the tendency to create shrinkage cavities increases. In this case, the inoculation should be increased.
- -
- for ductile iron, the optimal values are between 35 and 55.
If the indices are above the threshold values, the tendency to create shrinkage cavities increases. In this case, the inoculation should be increased. If the ratios are lower, the matrix is ok, but there is a risk of graphite degeneration. The microstructure and Mg content should be monitored.
- ▪
- Rec = Temax − Temin. Relationship with the amount of formed graphite. The optimal recalescence value for gray iron ranges from 4 to 9 ° C; for ductile iron it ranges from 2 to 5 °C.
A low Rec value may indicate a low level of graphite expansion. This could be the cause of the formation of porosity. This value must be assessed as a function of the nucleation level and the current one position on the Fe-C system.
A high Rec value is associated with a high level of graphite expansion and may be the cause of mold deformation.
Table 4 presents the thermal analysis parameters obtained for the base cast iron during each melt.

Table 4.
Characteristic ATD parameters of base iron.
2.2. The Influence of Amount of Mg Used during Spheroidization on the Metallurgical Quality
The next stage of research into the ductile iron production process was to determine the effect of the initial sulfur level in the cast iron on the amount of magnesium needed to obtain spheroidal graphite during spheroidization. Additionally, the influence of the amount of magnesium on the level of graphite nucleation in cast iron and the ability to create shrinkage using thermal analysis was investigated. Four melts were made with different levels of initial sulfur.
The cast iron from the holding furnace was poured into a ladle and transported to the spheroidization station. The cast iron from the holding furnace was poured into a ladle and transported to the spheroidization station.
The PE method (flexible core wire) was used. The granular alloy for spheroidization is in the core of the steel wire. The diameter of the steel wire is usually 9–13 mm, supplied in the form of coils. The wire is fed with a certain speed to the ladle with cast iron by means of transport rollers. Knowing the exact weight of the metal being processed, the temperature and the sulfur content, the software calculates the amount of wire needed to achieve the set magnesium level in cast iron. Higher initial sulfur levels in the cast iron require a longer length of wire containing the granular spheroidization alloy and, therefore, a higher amount of magnesium. The amount of pure magnesium in kilograms was calculated based on the chemical composition of the wire and the length used during spherodization. This value was related to the mass of cast iron subjected to spherodization. Depending on the initial sulfur, the levels of magnesium required varied.
For magnesium treatment, WHS 1525 wire was used with a percentage content of Mg = 25.4%, Si = 44.2%, RE = 1%.
Due to the fact that magnesium counteracts graphitization, liquid cast iron should be graphitized after the spheroidization treatment. In the inoculation process, an inoculant in the flexible wire FeSiBa was used with a content of Si = 75%, Ca = 0.2%, Al = 0.5%, Ba = 2.5%.
2.3. The Influence of Final Inoculation on the Metallurgical Quality of Nodular Cast Iron
The final aim of the research was to evaluate the influence of various available inoculants on thermal analysis parameters, microstructure and mechanical properties with the use of stepped castings. The castings were produced on a line with a vertical division of the casting mold and poured using an automatic pouring machine. For final inoculation, a pneumatic dispenser was used, equipped with a vision system that determines the effectiveness of the modification by coating the inoculant particles with a stream of metal. Figure 3 shows the used experimental pattern plate. Tests on the microstructure and mechanical properties were made from the step marked with no. III with a thickness of 12.7 mm.
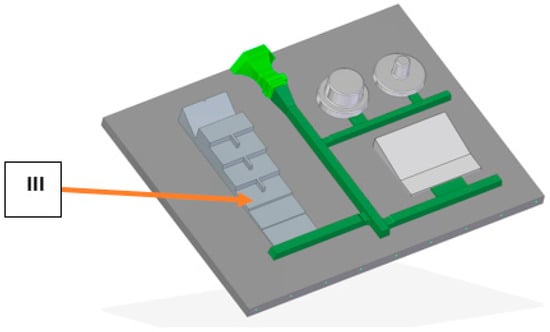
Figure 3.
Experimental pattern plate.
The composition of each inoculant used is shown in Table 5. The intention was to test the inoculation effect of each inoculant based on its active ingredients.

Table 5.
Chemical composition of the inoculants.
Table 6 presents the share of individual charge materials used to melt the base cast iron in the campaign cupola, while Table 7 shows the obtained chemical composition. Then, spheroidization with the PE method was carried out using WHS 1525 wire with a percentage content of Mg = 25.4%, Si = 44.2%, RE = 1%. The obtained composition is presented in Table 8.

Table 6.
Charge materials.

Table 7.
Chemical composition of base iron.

Table 8.
Chemical composition of final iron.
Additionally, the cups for thermal analysis were poured in order to determine the physicochemical and technological parameters. The cup without the inoculant (No Inoc.) was poured to determine the zero state and then the cups with the inoculants (Inoc.) were poured. The purpose of this procedure was to show the direct influence of the inoculant itself, without additional process variables.
For samples with different inoculants, the observation of graphite precipitation was carried out on the Phenon ProX scanning electron microscope—integrated with the EDS energy dispersion X-ray spectrometer. Images of the fractures are shown in Figure 4, Figure 5, Figure 6 and Figure 7. Magnifications of 500×, 1500×, 2500× and 3500× were used.
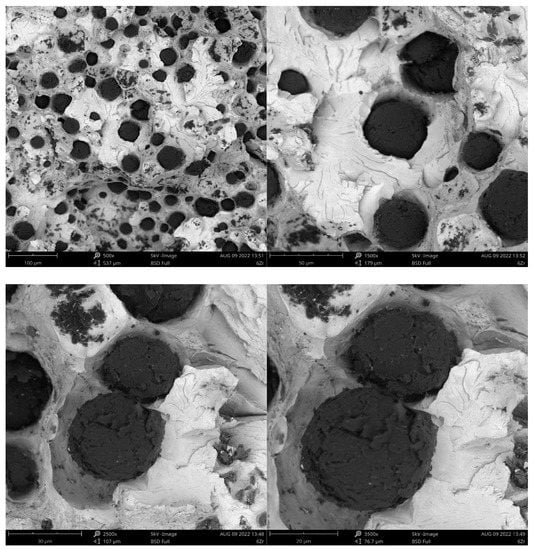
Figure 4.
Fracture of sample inoculated with Zr.
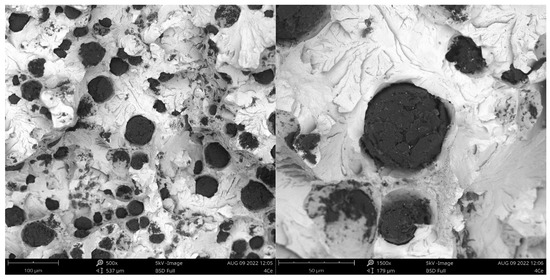
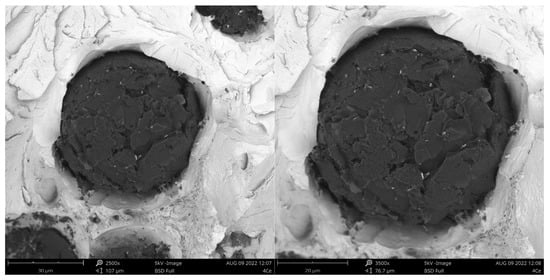
Figure 5.
Fracture of sample inoculated with Ce.
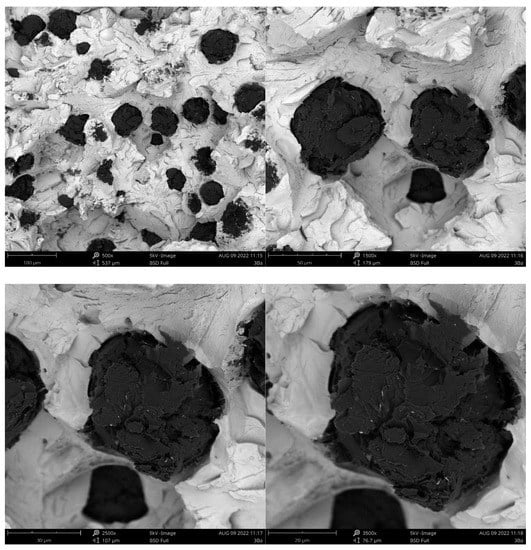
Figure 6.
Fracture of sample inoculated with Ba.
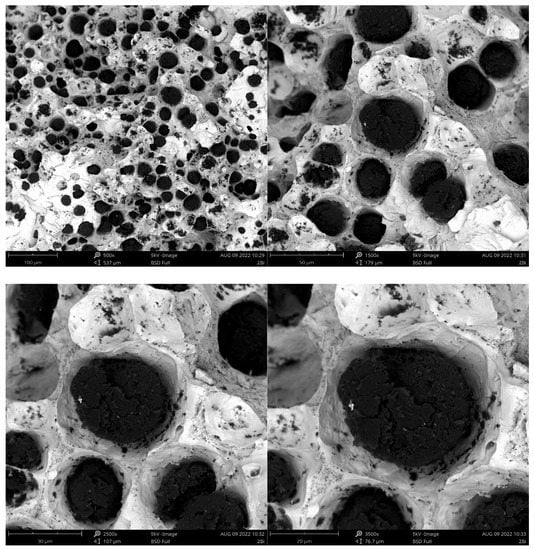
Figure 7.
Fracture of sample inoculated with Bi.
3. Results and Discussion
3.1. Influence of Charge Materials on the Metallurgical Quality of the Base Cast Iron
Figure 8 shows the effect of the amount of pig iron on the value of the minimum temperature achieved during eutectic transformation Temin. It was noticed that, as the amount of pig iron increased, the Temin values increased, which means that pig iron improves the metallurgical quality of the base cast iron for magnesium treatment.
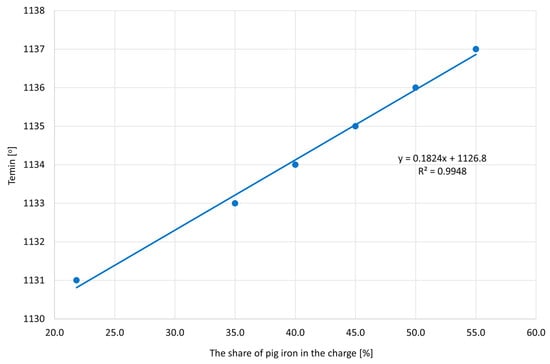
Figure 8.
The obtained Temin values depending on the share of pig iron.
Figure 9 presents the effect of the amount of steel scrap on the value of the minimum temperature achieved during eutectic transformation Temin. It was noticed that, with the increase in the amount of steel scrap, the Temin values decrease, which means that the steel scrap deteriorates the metallurgical quality of the base cast iron for spheroidization. Increasing the proportion of steel scrap in the charge provides little potential for graphitization of the bath, because, during production, the steel is thoroughly deoxidized and free of any nucleation-promoting element.
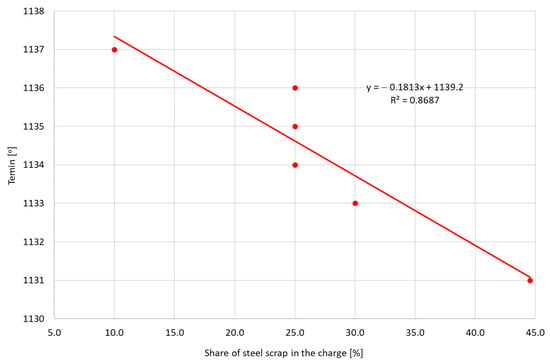
Figure 9.
The obtained Temin values depending on the share of steel scrap.
Figure 10 shows the influence of the amount of pig iron on the value of the VPS parameter, related to the formation of shrinkage cavities. Contrary to expectations, increasing the amount of pig iron increases the tendency to shrink. For grey cast iron, the use of the VPS parameter to predict shrinkage defects is incorrect, because increasing pig iron in the charge reduces the tendency of cast iron to shrink.
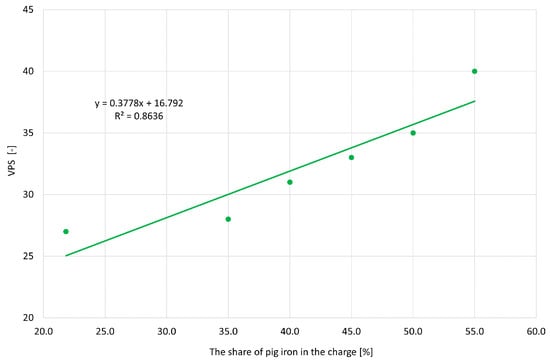
Figure 10.
The obtained VPS values depending on the share of pig iron.
Increasing the amount of steel scrap necessitates the addition of additional ingredients to raise the levels of carbon and silicon. These include anthracite, FeSi and SiC [7,9,10]. A positive effect of additives on the values of the VPS parameter was noticed. The increased amount of the sum of components with the increasing share of steel in the charge reduces the VPS (Figure 11). The charge with a low nucleation tendency positively reacts to the refreshing process using anthracite, ferrosilicon and silicon carbide.
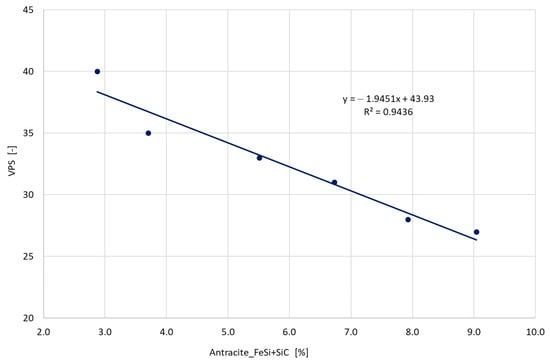
Figure 11.
The obtained VPS values depending on the share of additional ingredients anthracite + FeSi + SiC.
Recalescence (Rec) is related to the amount of graphite formed. The optimal recalescence value for gray cast iron is between 4 and 9 °C. Values consistent with the required values were obtained for heats, where the share of pig iron ranged from 22 to 40% (Figure 12). Increasing the amount of pig iron causes a strong increase in recalescence, which may cause deformation of the mold as a result of expansion. The reason for the increase in recalescence is the increasing level of carbon in cast iron.
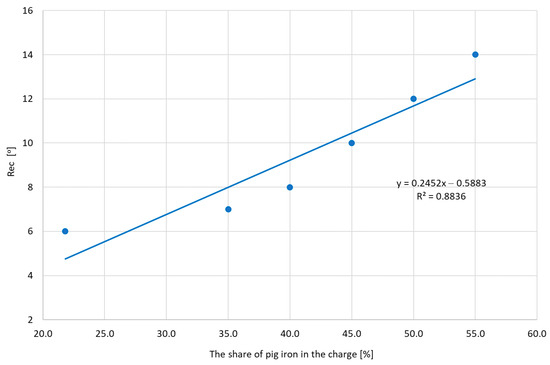
Figure 12.
The obtained Rec values depending on the share of pig iron.
3.2. The Influence of Amount of Mg Used during Spheroidization on the Metallurgical Quality
Figure 13 shows the dependence of the amount of Mg consumed in the cast iron spheroidization process on the level of the initial sulfur. The limitation of the initial sulfur allows for a significant reduction in the amount of magnesium necessary to obtain spherical graphite. For the initial sulfur at the level of 0.044%, it was enough to use 1.35% Mg. Increasing the sulfur level to 0.087% required increasing the amount of Mg by approximately 50%. Increasing the amount of Mg, i.e., the length of the wire for spheroidization, causes deterioration of the the graphitization nuclei. Figure 14 shows a clear decrease in the Temin value with an increasing amount of Mg used during spheroidization. Increasing the amount of Mg from 1.35 to 2.04% resulted in an unfavorable decrease of Temin by 12 °C, which creates serious problems with the subsequent restoration of the quality of cast iron to the required one.
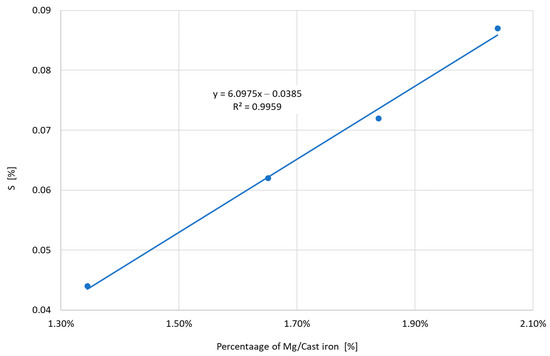
Figure 13.
The amount of Mg consumed during spheroidization depending on the level of the initial sulfur.
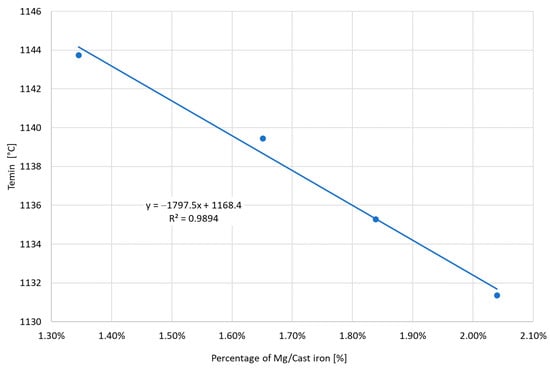
Figure 14.
The obtained Temin values depending on the amount of Mg consumed during spheroidization.
Figure 15 shows the effect of the amount of Mg consumed during spheroidization on the VPS parameter. For ductile iron, the optimal values range from 35 to 55. If the indices are above the threshold values, the tendency to create shrinkage cavities increases. If the values are lower, the matrix is correct, but there is a risk of graphite degeneration. Increasing the amount of Mg consumed causes a deterioration of the VPS parameter. The increase of Mg used above 1.65% results in exceeding the recommended limits.
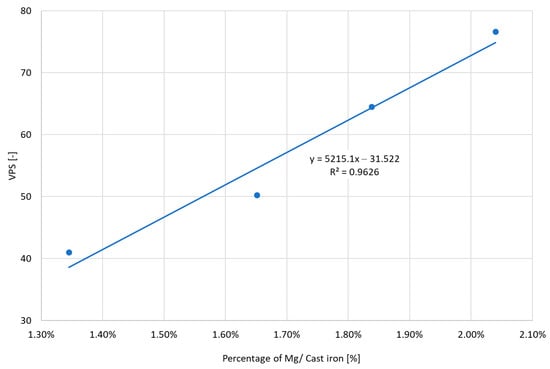
Figure 15.
The obtained VPS values depending on the amount of Mg consumed during magnesium treatment.
3.3. The Influence of Final Inoculation on the Metallurgical Quality of Nodular Cast Iron
The thermal analysis system was used to assess the impact of various types of inoculants on individual physicochemical and technological parameters. Table 9 shows the results obtained. The cup without inoculant (No Inoc.) was poured to determine the zero state, and then the cups with inoculant (Inoc.) were poured.

Table 9.
TDA parameters for various inoculants.
The results of the mechanical tests carried out with the use of a testing machine are presented in Table 10. The test samples were taken from step no. III, with a thickness of 12.7 mm. The static tensile test was performed at a temperature of 20 ± 1 °C in accordance with the PN-EN ISO 6892-1: 2016 standard. The tensile strength (Rm) [MPa], yield strength (Rp 0.2) [MPa] and relative elongation (A) [%] were determined.

Table 10.
Mechanical properties depending on the type of inoculant.
The obtained results of the mechanical tests of samples obtained with the use of various inoculant prove that the EN-GJS 500-7 grade was obtained. The spread of the tensile strength Rm between the highest and the lowest value was 35 MPa, the yield strength Rp 0.2 was 15 MPa, while there was a large difference between the elongation A. The difference between the highest (Ce) and the lowest (Ba) value was 5.9%.
The metallographic tests were carried out with the use of a light microscope at 200× magnification using the Nikon NiS-Elements program for quantitative analysis of the microstructure. Samples for the microstructure were cut from the step marked no. III, with a thickness of 12.7 mm.
Analyzing the results of the quantitative assessment of the microstructure, it can be concluded that the Bi-modified cast iron showed the highest degree of sphericity, while Ce showed the lowest. The largest share of ferrite was found in the structure of cast iron modified with Ce and Bi, and the smallest was found with the use of inoculant with Ba, which is related to the Temin value obtained during the ATD analysis. These modifiers strongly reduce the ability to undercool cast iron and increase the volume fraction of ferrite in the microstructure. The increase in ferrite improves the ductility of cast iron. Modified cast iron Bi and Ce are characterized by the highest amount of graphite precipitates per sqm, which proves the high amount of graphitization nuclei supplied (Table 11).

Table 11.
Microstructure of samples depending on the type of inoculant.
4. Summary
Obtaining ductile iron of the highest metallurgical quality depends on many process factors. The conducted tests based on thermal analysis showed that the used batch materials, the amount of magnesium used during spheroidization and the selection of an appropriate final inoculant affect the tendency to create unfavorable cementite and shrinkage defects in different ways. In addition, the use of various inoculants allows one to control mechanical properties by changing the morphology of graphite, and the proportion of ferrite and pearlite in the microstructure of cast iron. The most important conclusions obtained during tests under production conditions include:
- As the amount of pig iron in the charge increases, the value of Temin increases. It proves the improvement of the graphite nucleation capacity in cast iron.
- With an increase in the amount of steel scrap in the charge, the Temin value decreases. Increasing the share of steel scrap causes a reduction in the graphitization potential of the metal bath, due to the reduction of the content of elements favoring nucleation.
- Increasing the amount of pig iron in the charge increases the VPS parameter and increases the tendency to form shrinkage cavities. For gray cast iron, the VPS parameter is not a good predictor of shrinkage defects because, as is known from foundry practice, pig iron is added to reduce shrinkage defects in castings.
- Increasing the amount of additional ingredients (anthracite + FeSi + SiC) with the increasing share of steel in the charge reduces the tendency to create shrinkage cavities. The charge with low nucleation tendency positively reacts to the refreshing process by providing new graphitization nuclei contained in anthracite, ferrosilicon or silicon carbide.
- Recalescence is related to the amount of graphite being formed. Values consistent with the required values were obtained for melts, where the share of pig iron ranged from 22 to 40%. Increasing the amount of pig iron causes a strong increase in recalescence, which may cause deformation of the mold as a result of graphite expansion.
- Reducing the initial sulfur content in the base cast iron reduces the length of the wire during spheroidization and, thus, the amount of magnesium necessary to obtain spherical graphite and the same level of residual Mg in the final cast iron. For the initial sulfur content of 0.044%, it was enough to use 1.35% Mg. While, for sulfur at the level of 0.087%, it was necessary to increase the amount of Mg by about 50%.
- Increasing the amount of Mg causes deterioration of the metallurgical quality through the degradation of graphitization nuclei. This is confirmed by a significant decrease in Temin values with an increase in the amount of Mg used during spheroidization. The need to increase the length of spheroidization wire resulted from the increasing sulfur. Increasing the amount of Mg from 1.35 to 2.04% resulted in an unfavorable decrease in Temin by 12°, which creates serious problems with the subsequent restoration of the cast iron quality to the required one.
- Increasing the amount of Mg consumed increases the VPS parameter. The use of Mg over 1.65% resulted in exceeding the recommended limits. It is clearly visible that the lowest defect tendency was obtained for Mg at the level of 1.35%. Increasing its level to 2.04% during spheroidization caused almost a three times higher risk of obtaining defective castings.
- The highest tensile strength was achieved for Ba-inoculated cast iron and the lowest for Bi. The spread of the tensile strength Rm between the highest and the lowest values was 35 MPa, the yield strength Rp 0.2 was 15 MPa, while there was a large difference between the elongation A. The difference between the highest (Ce) and the lowest (Ba) values was 5.9%.
- Based on the results of the microstructure of the samples, depending on the type of inoculant (Table 10), we can see that cast iron inoculated with Bi had the highest nodularity, while the cast iron inoculated with Ce had the lowest degree. The largest share of ferrite in the structure was recorded for cast iron inoculated with Ce, and the smallest for Ba. This proves the high ferritic effect of cerium. Cast iron inoculated with Ce and Bi was characterized by the largest number of graphite particles per sqm, which proves a large number of graphitization nuclei. The tests carried out using a scanning microscope showed that the obtained carbon precipitates had: a regular shape similar to a sphere, a variable density of precipitates in individual melts and a different size.
Author Contributions
Conceptualization, R.D. and K.J.; methodology, K.J.; software, R.D.; validation, R.D. and K.J.; formal analysis, K.J.; investigation, K.J.; resources, R.D.; data curation, R.D.; writing—original draft preparation, R.D.; writing—review and editing, K.J.; visualization, K.J.; supervision, K.J.; project administration, R.D.; funding acquisition, R.D. All authors have read and agreed to the published version of the manuscript.
Funding
The research was financed by the Ministry of Science and Higher Education as part of the 3rd edition of the “Implementation Doctorates” program.
Data Availability Statement
Not applicable.
Conflicts of Interest
The authors declare no conflict of interest.
References
- Karsey, S.I. Żeliwo Sferoidalne; QIT, Fer et Titane Inc.: Warszawa, Poland, 2000. [Google Scholar]
- Riposan, I.; Chisamera, M.; Stanc, S. The Role of Compounds in Graphite Formation in Cast Iron—A Review. Mater. Sci. Forum 2018, 925, 3–11. [Google Scholar] [CrossRef]
- Stefanescu, D.M.; Alonso, G.; Larranaga, P.; De la Fuente, E.; Suarez, R. Reexamination of crystal growth theory of graphite in iron-carbon alloys. Acta Mater. 2017, 139, 109–121. [Google Scholar] [CrossRef]
- Stefanescu, D.M.; Alonso, G.; Suarez, R. Recent Developments in Understanding Nucleation and Crystallization of Spheroidal Graphite in Iron-Carbon-Silicon Alloys. Metals 2020, 10, 221. [Google Scholar] [CrossRef]
- Fraś, E.; Podrzucki, C. Żeliwo Modyfikowane; AGH: Kraków, Poland, 1978. [Google Scholar]
- Sobczak, J. Poradnik odlewnika, T.1, Odlewnictwo Współczesne; Wydawnictwo Stowarzyszenia Technicznego Odlewników Polskich: Kraków, Poland, 2013. [Google Scholar]
- Janerka, K.; Kondracki, M.; Jezierki, J.; Szajnar, J.; Stawarz, M. Carburizer Effect on Cast Iron Solidification. J. Mater. Eng. Perform. 2014, 23, 2174–2181. [Google Scholar] [CrossRef]
- Nowak, J. Wpływ Namiarów Wsadowych na Strukturę i Wybrane Właściwości Żeliwa Sferoidalnego Wytapianego Przy Zadanej Temperaturze Przegrzania; Rozprawa doktorska; AGH: Kraków, Poland, 2019. [Google Scholar]
- Janerka, K.; Jezierski, J.; Bartocha, D.; Szajnar, J. Analysis of the ductile iron production on the steel scrap base. Int. J. Cast Met. Res. 2014, 27, 230–234. [Google Scholar] [CrossRef]
- Janerka, K.; Kostrzewski, Ł.; Stawarz, M.; Jezierski, J. The importance of SiC in the process of melting ductile iron with a variable content of charge materials. Materials 2020, 13, 1231. [Google Scholar] [CrossRef] [PubMed]
- Riposan, I.; Anca, D.; Stan, I.; Chisamera, M.; Stan, S. Graphite Nodularity Evaluation in High-Si Ductile Cast Irons. Materials 2022, 15, 7685. [Google Scholar] [CrossRef] [PubMed]
- Anca, D.; Stan, I.; Chisamera, M.; Riposan, I.; Stan, S. Experimental Study Regarding the Possibility of Blocking the Diffusion of Sulfur at Casting-Mold Interface in Ductile Iron Castings. Coatings 2021, 11, 673. [Google Scholar] [CrossRef]
- Stefanescu, D.M.; Suarez, R.; Kim, S.B. 90 years of thermal analysis as a control tool in the melting of cast iron. China Foundry 2020, 17, 69–84. [Google Scholar] [CrossRef]
- Stefanescu, D.M. Thermal Analysis—Theory and Applications in Metalcasting. Int. J. Met. 2015, 9, 7–22. [Google Scholar] [CrossRef]
- Chisamera, M.; Riposan, I.; Stan, S.; Stefan, E.; Costache, G. Thermal analysis control of in-mould and ladle inoculated grey cast irons. China Foundry 2015, 6, 145–151. [Google Scholar]
- Erturka, S.O.; Kumruoglub, L.C.; Ozel, A. Determination of Feederless Casting Limits by Thermal Analysis in Cast Iron. Acta Phys. Pol. A 2017, 131, 370–373. [Google Scholar] [CrossRef]
- Cojocaru, A.M.; Riposan, I.; Stan, S. Solidification influence in the control of inoculation effects in ductile cast irons by thermal analysis. J. Therm. Anal. Calorim. 2019, 138, 2131–2143. [Google Scholar] [CrossRef]
- Petrus, Ł.; Bulanowski, A.; Kołakowski, J.; Sobieraj, J.; Paruch, T.; Urbanowicz, M.; Brzeżański, M.; Burdzy, D.; Janerka, K. Importance of TDA thermal analysis in an automated metallurgical process. J. Cast. Mater. Eng. 2021, 5, 89–93. [Google Scholar] [CrossRef]
- Petrus, Ł.; Bulanowski, A.; Kołakowski, J.; Brzeżański, M.; Urbanowicz, M.; Sobieraj, J.; Matuszkiewicz, G.; Szwalbe, L.; Janerka, K. The influence of selected metling parameters on the psychical and chemical properties of cast iron. Arch. Foundry Eng. 2020, 20, 105–110. [Google Scholar]
- Dwulat, R.; Janerka, K.; Grzesiak, K. The Influence of Final Inoculation on the Metallurgical Quality of Nodular Cast Iron. Arch. Foundry Eng. 2021, 21, 5–14. [Google Scholar]
- Zonato, A.; Agio, M.; Mazzocco, C. Reduction in the variability of the iron castings production process by the use of the thermal analysis software “ITACA”. Proservice Technol. E-J. 2013, 1, 1–12. [Google Scholar]
- Available online: https://proservicetech.it/products/x/ (accessed on 21 December 2022).
Disclaimer/Publisher’s Note: The statements, opinions and data contained in all publications are solely those of the individual author(s) and contributor(s) and not of MDPI and/or the editor(s). MDPI and/or the editor(s) disclaim responsibility for any injury to people or property resulting from any ideas, methods, instructions or products referred to in the content. |
© 2023 by the authors. Licensee MDPI, Basel, Switzerland. This article is an open access article distributed under the terms and conditions of the Creative Commons Attribution (CC BY) license (https://creativecommons.org/licenses/by/4.0/).