Article

Robustness Analysis of Pin Joining

1
Institute of Manufacturing Technology, Friedrich-Alexander-Universität Erlangen-Nürnberg (FAU), Egerlandstraße 13, 91058 Erlangen, Germany
2
Engineering Design (KTmfk), Friedrich-Alexander-Universität Erlangen-Nürnberg (FAU), Martensstraße 9, 91058 Erlangen, Germany
3
Product Life Cycle Management, Technical University of Darmstadt, Otto-Berndt-Straße 2, 64287 Darmstadt, Germany
*
Author to whom correspondence should be addressed.
J. Manuf. Mater. Process. 2022, 6(5), 122; https://doi.org/10.3390/jmmp6050122
Submission received: 30 September 2022 / Revised: 12 October 2022 / Accepted: 14 October 2022 / Published: 16 October 2022

Abstract

:
The trend towards lightweight design, driven by increasingly stringent emission targets, poses challenges to conventional joining processes due to the different mechanical properties of the joining partners used to manufacture multi-material systems. For this reason, new versatile joining processes are in demand for joining dissimilar materials. In this regard, pin joining with cold extruded pin structures is a relatively new, two-stage joining process for joining materials such as high-strength steel and aluminium as well as steel and fibre-reinforced plastic to multi-material systems, without the need for auxiliary elements. Due to the novelty of the process, there are currently only a few studies on the robustness of this joining process available. Thus, limited statements on the stability of the joining process considering uncertain process conditions, such as varying material properties or friction values, can be provided. Motivated by this, the presented work investigates the influence of different uncertain process parameters on the pin extrusion as well as on the joining process itself, carrying out a systematic robustness analysis. Therefore, the methodical approach covers the complete process chain of pin joining, including the load-bearing capacity of the joint by means of numerical simulation and data-driven methods. Thereby, a deeper understanding of the pin joining process is generated and the versatility of the novel joining process is increased. Additionally, the provision of manufacturing recommendations for the forming of pin joints leads to a significant decrease in the failure probability caused by ploughing or buckling effects.

1. Introduction

Considering the current energy and environmental crisis that can cause energy shortages for both industry and private households in Europe, it is important to reduce general energy consumption with only a slight loss of prosperity. In consideration of the goal of transforming into a resource-efficient and competitive economy, which was passed by the European Union in the European Green Deal [1], it is necessary to strongly reduce man-made greenhouse gas emissions over the coming years in order to achieve a net greenhouse gas emission of 0 by 2050. In the European Union, road mobility accounts for about 20% of greenhouse gas emissions, with around 60% of CO2 emissions coming from private transport by car and motorbike [2]. Thus, the goal is to reduce emissions in the transport sector by 90% by 2050. In order to achieve this ambitious goal, the general energy consumption of both internal combustion engines and electric motor vehicles must be significantly reduced. One way to reduce emissions is to reduce vehicle weight. For this reason, the popularity of multi-material systems or hybrid components as well as the use and the combination of high-strength sheet materials made of steel and aluminium in industrial applications is increasing, as the advantages of different materials can be combined in this way. However, when joining dissimilar materials, established joining processes reach their process-related limits due to different mechanical properties and chemical incompatibilities. Consequently, research is being conducted into new, versatile, and often mechanical joining processes with the potential for joining dissimilar materials [3]. However, there are also other non-mechanical joining processes for joining dissimilar materials, such as magnetic pulse welding [4].
Joining with extruded pin structures is a process with the potential to join unequal materials such as steel and aluminium as well as steel and fibre-reinforced plastics (FRP) [5]. In the two-stage joining process, mostly cylindrical pin structures are first extruded axially from the sheet plane by cold extrusion. In the next step, these pins are joined by means of either direct pin pressing, in which the pin is pressed into the joining partner, or by caulking, where the pin is placed through a pre-punched joining partner and is upset at the pin head. This creates an undercut and consequently a form-fit and force-fit connection. In the scientific environment, pin structures are already used frequently, especially in combination with fibre-reinforced plastic composites [6], and are being investigated with regard to the reinforcement of bonded metal/plastic composites [7]. However, in the literature, pin structures extruded from the sheet metal plane are rarely used to join metal and fibre reinforced plastics or dissimilar metals, although it has been demonstrated that load-bearing metal/FRP [8] and metal/metal joints [9] can be produced. Instead, alternative manufacturing processes are used to attach the pins to the surface of the component to be joined. This covers processes such as laser powder bed fusion [10], direct energy deposition [11], or processes such as cold metal transfer [12], metal injection moulding [13], or COMELDTM [14].
In contrast, the process of forming pins by cold extrusion from the sheet metal plane, which was proven feasible by Ghassemali et al. [15] and Hirota [16], has the advantage that the process can be integrated into existing manufacturing processes and that the the pins have improved mechanical properties due to work hardening during the extrusion process. This increase in the strength of the pin structures also makes it possible to use metallic pins to produce dissimilar metal/metal joints. In addition, it was demonstrated in [9] that the variation of the extrusion process parameters, such as the ratio of punch diameter to die diameter or the punch penetration depth, has an effect on the strain hardening of the pin structure. In the context of joining with extruded pin structures, which is still a very new joining process in comparison to established joining methods such as welding or riveting, there are still hardly any considerations with regard to the robustness of the joining process. Thus, no statement can yet be made about the uncertainties and instabilities of the joining process against varying material or friction conditions [17]. For this reason, the aim of this work is first to identify the influencing parameters on the pin extrusion, by building on the findings in [18], and then to numerically investigate the effect of varying conditions on the pin extrusion and joining process. Through this, it is possible to gain a deeper understanding of the entire pin joining process chain. In addition, recommendations for pin joining are given on the basis of the obtained results. This can pave the way to a robust pin extrusion as well as load-bearing capabilities in future works.

2. Research Questions

While previous works mainly analysed the applicability of the pin joining process for the realization of multi-material connections in versatile process chains, this contribution additionally focuses on uncertain input parameters, such as variations of sheet thickness, and their impact on the resulting pin joint properties. In this context, after the introduction of the applied material and methods, the determination of Pearson’s correlation coefficients and the following robustness analysis provide a deeper understanding of the joining process and enables us to answer three research questions (RQ).
In particular, the previous definition of parameter spaces combined with the selection of suitable distribution functions (e.g., Gaussian or uniform distribution) ensure the sampling of a sufficient database. Based on this, the following Pearson’s correlation analysis offers the opportunity to answer the question: which uncertain input parameters have a significant impact on individual pin joining characteristics and which factors are less relevant (RQ1). Subsequently, the robustness analysis provides a deeper understanding of the pin joining process. In this context, the definition of boundary values (minimum and maximum) for the generated pin heights enables us to evaluate how robustly the particular joint properties react to the varying process and friction parameters (RQ2). Based on this, the definition of adapted input parameter spaces combined with the performance of a second robustness analysis allows us to answer the question of whether an improvement of the process reliability can be achieved, and which recommendations can be given for future joining tasks (RQ3).

3. Materials and Methods

3.1. Materials

In this work, two different materials are applied for the investigation of pin joining. The dual phase steel HCT590X+Z (DP600) was used for pin manufacturing. In this regard, dual phase steels are characterised by a balance between strength and ductility and a high work hardening during forming processes [19]. DP600 is frequently used in car body production in the automotive sector, especially for structural components. The precipitation-hardening aluminium magnesium silicon alloy EN AW-6014-T4 is used as the joining partner, which is also used in car body production. Typical areas of application are the vehicle exterior trim, such as hood outers and fenders [20]. The flow curves used for the numerical simulation are shown in Figure 1a. For the DP600, the yield curve was determined by means of a uniaxial tensile test according to DIN EN ISO 6892-1 [21] at 0° to the rolling direction and extrapolated using the Swift [22] strain hardening model. For the aluminium material, the curves were determined using a Bulge test according to DIN EN ISO 16808 [23] and extrapolated using the Hockett–Sherby [24] strain hardening model. For the material, the values were calculated on the basis of the experimental investigations mentioned above. Therefore, the formulas for the extrapolation of the two materials based on the strain-hardening models shown in Figure 1a are given below.
DP600    σ = 994.47·(εpl + 0.00188)0.17
EN   AW - 6014 - T 4         σ = 408.76 ( 408.76 103.67 ) · e 2.11 · ε p l 0.55

3.2. Cold Extrusion of Pin Structures

Pin joining is a two-stage joining process in which pin extrusion is the initial stage. For this, a multi-acting tool system is necessary to ensure independent control of the blank holder and the punch. The general setup of the extrusion process, based on the approach in [9], and the effective plastic strain of an exemplary pin is shown in Figure 2. For pin forming, the blank holder first moves axially downwards onto the sheet and applies the blank holder pressure σ B H = 250 MPa. The blank holder prevents the sheet from bulging during extrusion and reduces the radial material flow due to the prevailing friction conditions between the sheet and the blank holder. Consequently, as the blank holder pressure increases, more material flows axially into the die, resulting in a larger pin. After the blank holder pressure is applied, the punch of diameter d P = 3 mm moves axially downwards and penetrates the sheet of thickness t 0 = 1.5 mm, thereby displacing the sheet material both axially downwards into the die of diameter d D = 1.5 mm and laterally outwards in the sheet metal plane as well as laterally inwards into the die. The punch penetration depth s, which is primarily responsible for the final pin height h, is limited by mechanical stops. Dionol ST V 1725-2 was used for lubrication during the process. In the last step, the blank holder and the punch move axially upwards, and the specimen can be ejected. The pin structure extruded from the sheet metal plane is now used in the following step for joining by direct pin pressing.

3.3. Joining by Direct Pin Pressing

For pin joining, several process strategies can be used to connect the pins with the joining partner. In the following, direct pin pressing will be discussed, which was investigated in more detail in the context of this work. The process sequence and process setup, based on the approach in [9] as well as the effective plastic strain of an exemplary pin pressing joint, are shown schematically in Figure 3. For this, the sheet metal component with the previously extruded pin is placed on a conventional upsetting tool. Since the pin has to be axially supported in the punch cavity during the joining process in order to avoid bending or damage to the pin and the surrounding material, sheet metal discs are inserted into the punch indentation. The aluminium joining partner is then placed over the pin structure and the upper upsetting tool moves axially downwards at a constant speed and applies the joining work. The pin penetrates the softer joining partner and displaces the material axially upwards and radially outwards due to the local upsetting of the sheet metal. This results in a constant increase in force, while the aluminium sheet and the pin structure are continuously compressed. Depending on the material pairing or strength gradient, as well as the pin height between the joining partners, the pin is compressed to a greater or lesser extent during this phase. Due to the high local compressive stresses that occur, the aluminium surface curves above the pin structure as the process progresses, which is illustrated in Figure 3. As soon as the aluminium sheet contacts the steel sheet, a strong increase in force appears since in this phase the bulge on the surface of the joining partner is levelled out and the main compression of the pin structure simultaneously occurs. Depending on the pin height, a radial material flow within both the pin structure and the aluminium joining partner starts. Due to the continuous compression of the pin structure, an undercut is formed within the joining partner which leads to a form-fit and force-fit pin joint. The completion of the levelling of the joining partner surface and the associated steep linear increase in the joining force marks the end of direct pin pressing.

3.4. Numerical Models of Pin Extrusion and Joining Processes

3.4.1. Pin Extrusion

For the numerical simulation of the pin extrusion process, which was set up according to the design in Figure 4 on the right and represents a bulk sheet metal forming process, the multiphysics solver LS-Dyna and, more precisely, the solver version smp_d_R12.0 was used for the calculation of the FE simulation. Since the extrusion of the pins is a rotationally symmetrical problem and to reduce the computing time, the simulation was designed as a 2D axisymmetric simulation. In this way, it was possible to manage the large scale of variant simulations that were carried out as part of the investigation of the robustness analysis. The model design, the dimension of the sheet metal, and the tools used, as well as relevant parameters of the simulation, are summarised in Figure 4.
For the discretisation of the tools and the sheet metal, a quadrilateral mesh was used, and a four-node fully integrated axisymmetric element (elform 15) was involved as the element formulation. A maximum edge length of 0.3 mm was applied for meshing the die. A minimum of 8 elements over the radius was ensured when meshing the edge radius at the opening of the die. This rounded edge is not present in the real process, as a sharp-edged die opening was used in the experimental investigations, manufactured using a wire EDM machine. Due to the fact that this sharp edge cannot be reproduced in the FE model or would lead to problems in the simulation, a radius of 0.1 mm was added to the die opening. An element size of 0.04 mm was used for the mesh of the punch and the blank holder. Due to the high plastic deformations that occur during the pin extrusion process and the resulting strong mesh deformation, which would lead to a termination of the numerical simulation, it is necessary to implement remeshing of the sheet material during the simulation. For this purpose, 2D r-adaptive remeshing is applied, which rebuilds the mesh with a constant element edge length of 0.04 mm at a defined frequency. The tools were modelled as elastic bodies in order to achieve a more accurate representation of the process, whereby the movement of the tools is carried out by rigid bodies. The materials used for the tools are tungsten carbide for the die (E-modulus: 450 GPa) and the punch (E-modulus: 650 GPa) and steel (E-modulus: 210 GPa) for the blank holder, using the 001-Elastic material card. For the DP600 sheet material used for extrusion, the material card 024-Piecewise_linear-plasticity was used, with an E-modulus of 210 GPa and the flow curve in Figure 1 extrapolated according to Swift. The pin extrusion simulation itself was set up with an implicit time integration. For mapping the tribology of the model, different friction coefficients were used depending on the contact pairing. For the friction model, Coulomb’s law of friction was applied to the individual processes. According to [25], both are within the limits of the validity of Coulomb’s law including the varied friction values presented below. In Kraus et al. [26], the coefficient of friction for the material pairing of DP600 and carbide in the lubricated state was determined experimentally with a value of µ = 0.078, which corresponds to the material pairing for the punch and the DP600 sheet in this work. This was consequently used for the contact between the die/sheet and punch/sheet. A coefficient of friction of µ = 0.1 was used for the contact between the blank holder and the sheet metal.

3.4.2. Validation of the Pin Extrusion Simulation

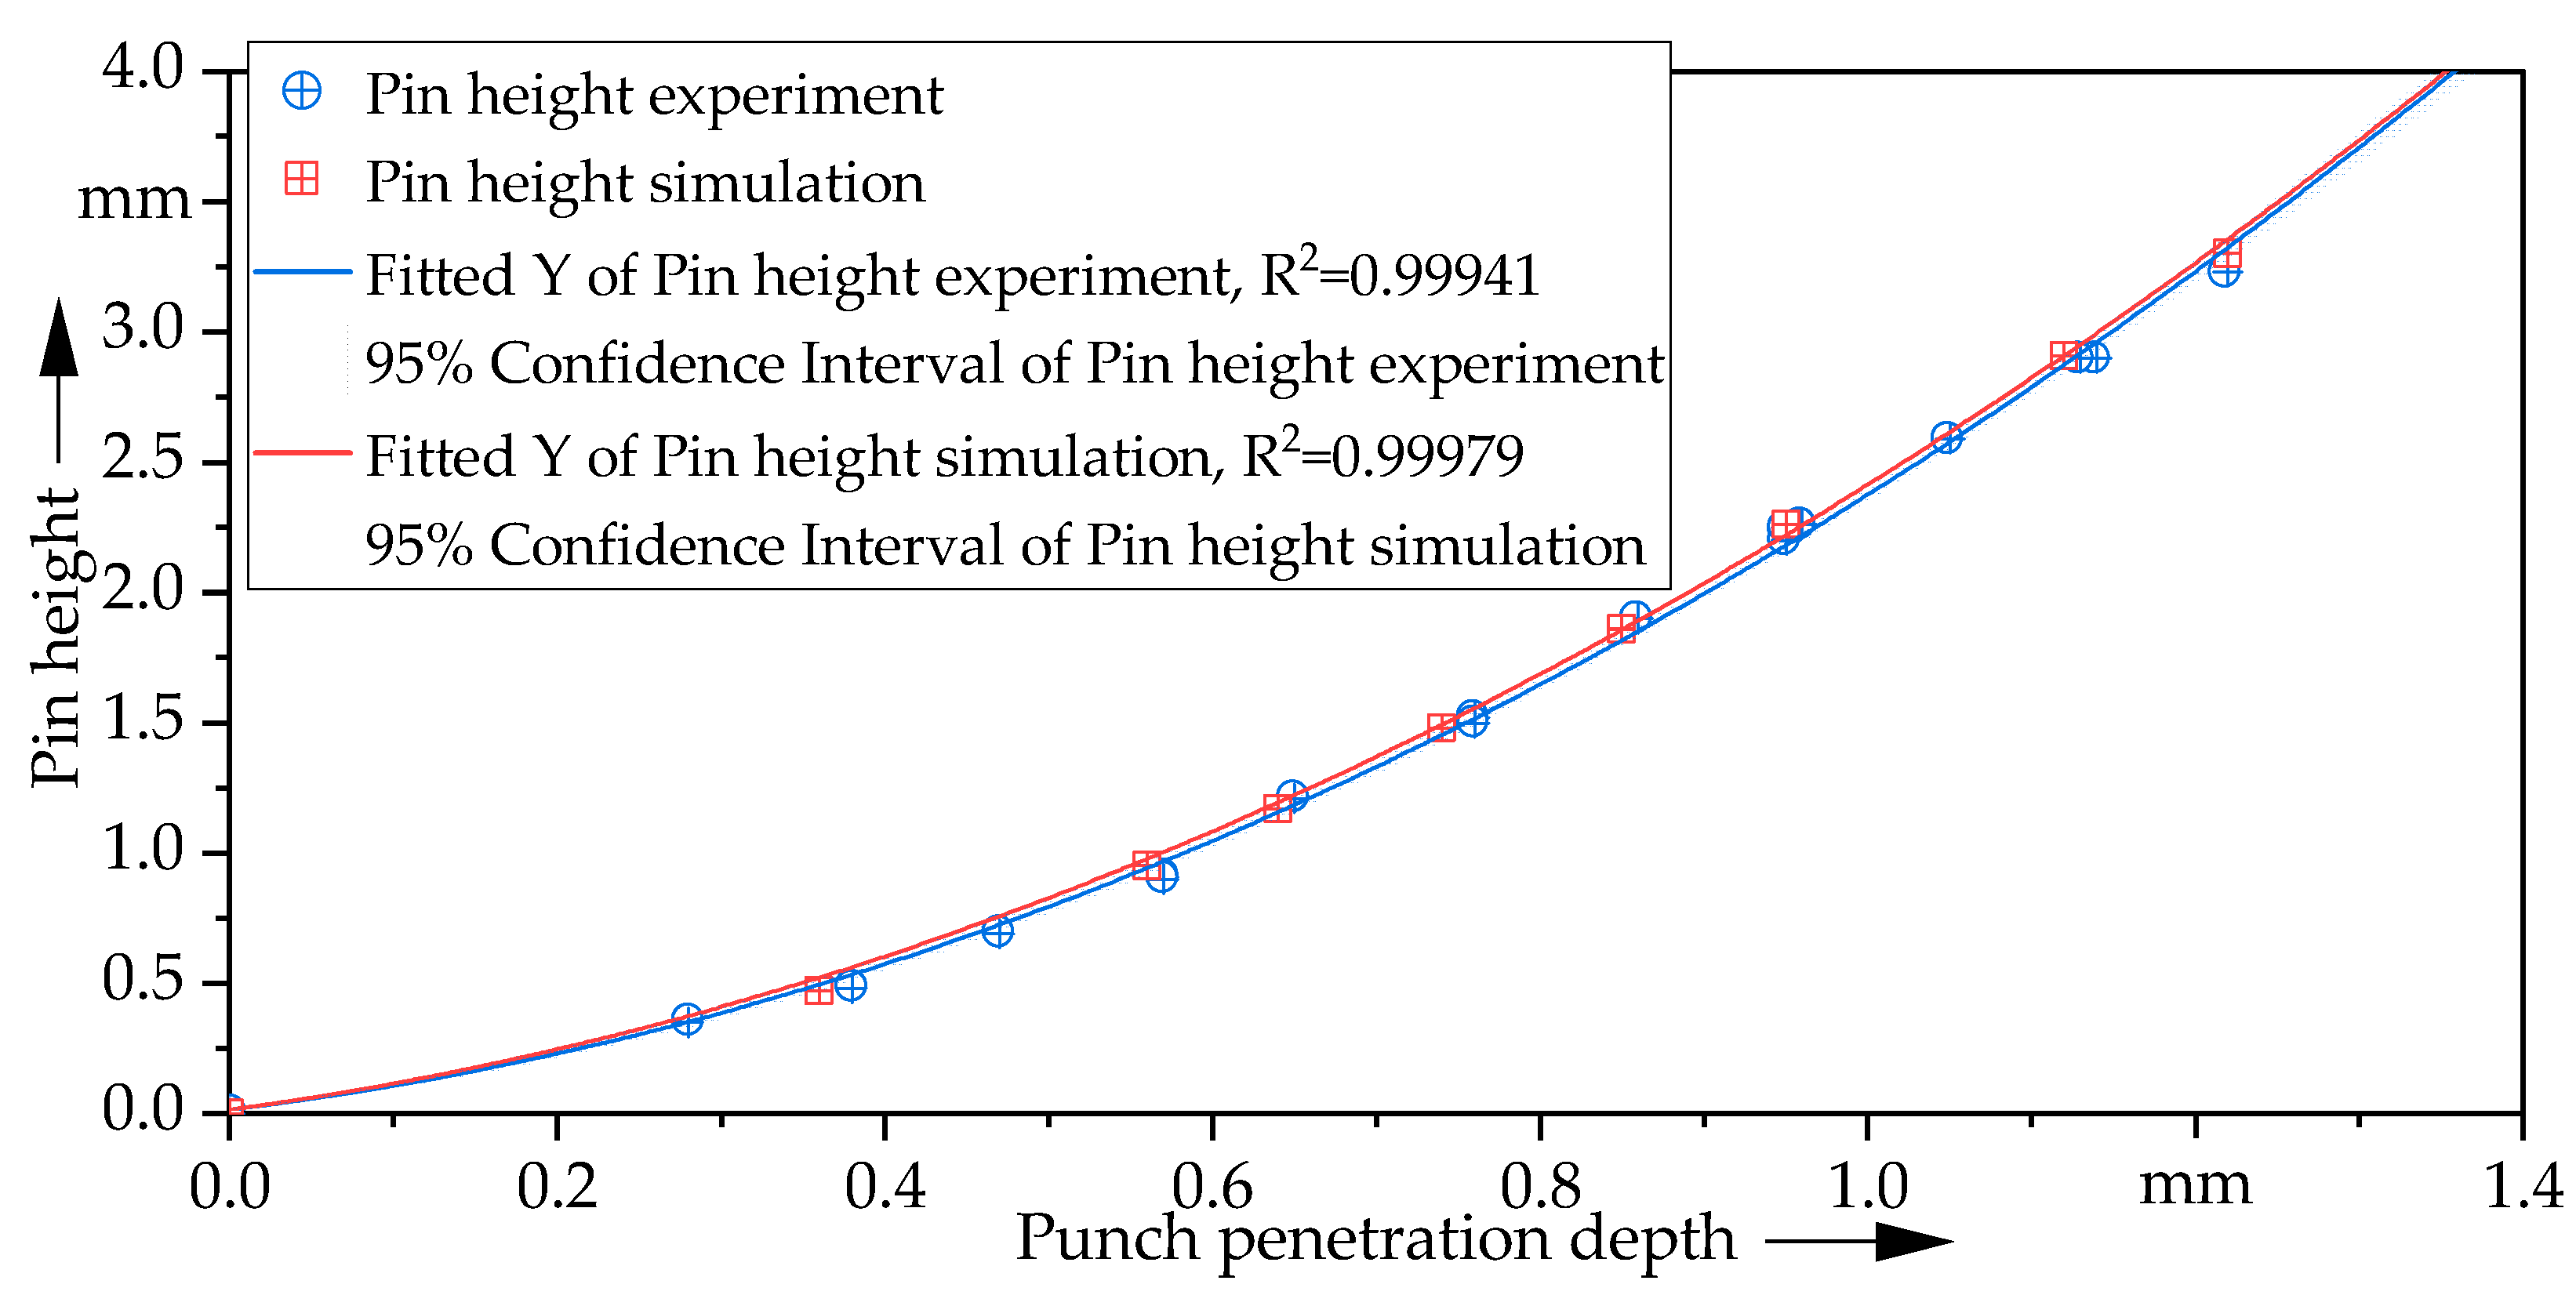
For evaluating the quality of the numerical simulation, the FE models were validated by comparing the experimental results with the data generated by the simulation. The validation procedure was derived from the methodology presented by Tekkaya in [27]. Since the pin height and the solidification of the pin structure during extrusion are two decisive parameters for the subsequent connections, both are used to compare the results with the numerical simulation. For this purpose, pins with a diameter of 1.5 mm were extruded from a 25 mm circular blank made of DP600 with different penetration depths, and subsequently, the pin height was measured. Figure 5 shows the results of the punch penetration depth-pin height combination. In addition, the results were fitted using a 2nd degree polynomial. In addition to the experimental results, different punch penetration depths were also calculated in the numerical simulation and the corresponding pin heights were measured. Comparing the experimental and numerical data, a satisfying agreement can be identified. By analysing the values of the fitted curves of the two data sets with each other, a mean deviation of the pin height of 0.03 ± 0.01 mm is obtained, which means that slightly higher pin heights are achieved in the numerical simulation than in the experiment. The deviations may be caused by the complex friction conditions and the above-mentioned fact that a small die entry radius had to be used in the simulation, as a sharp edge cannot be reproduced in the simulation.
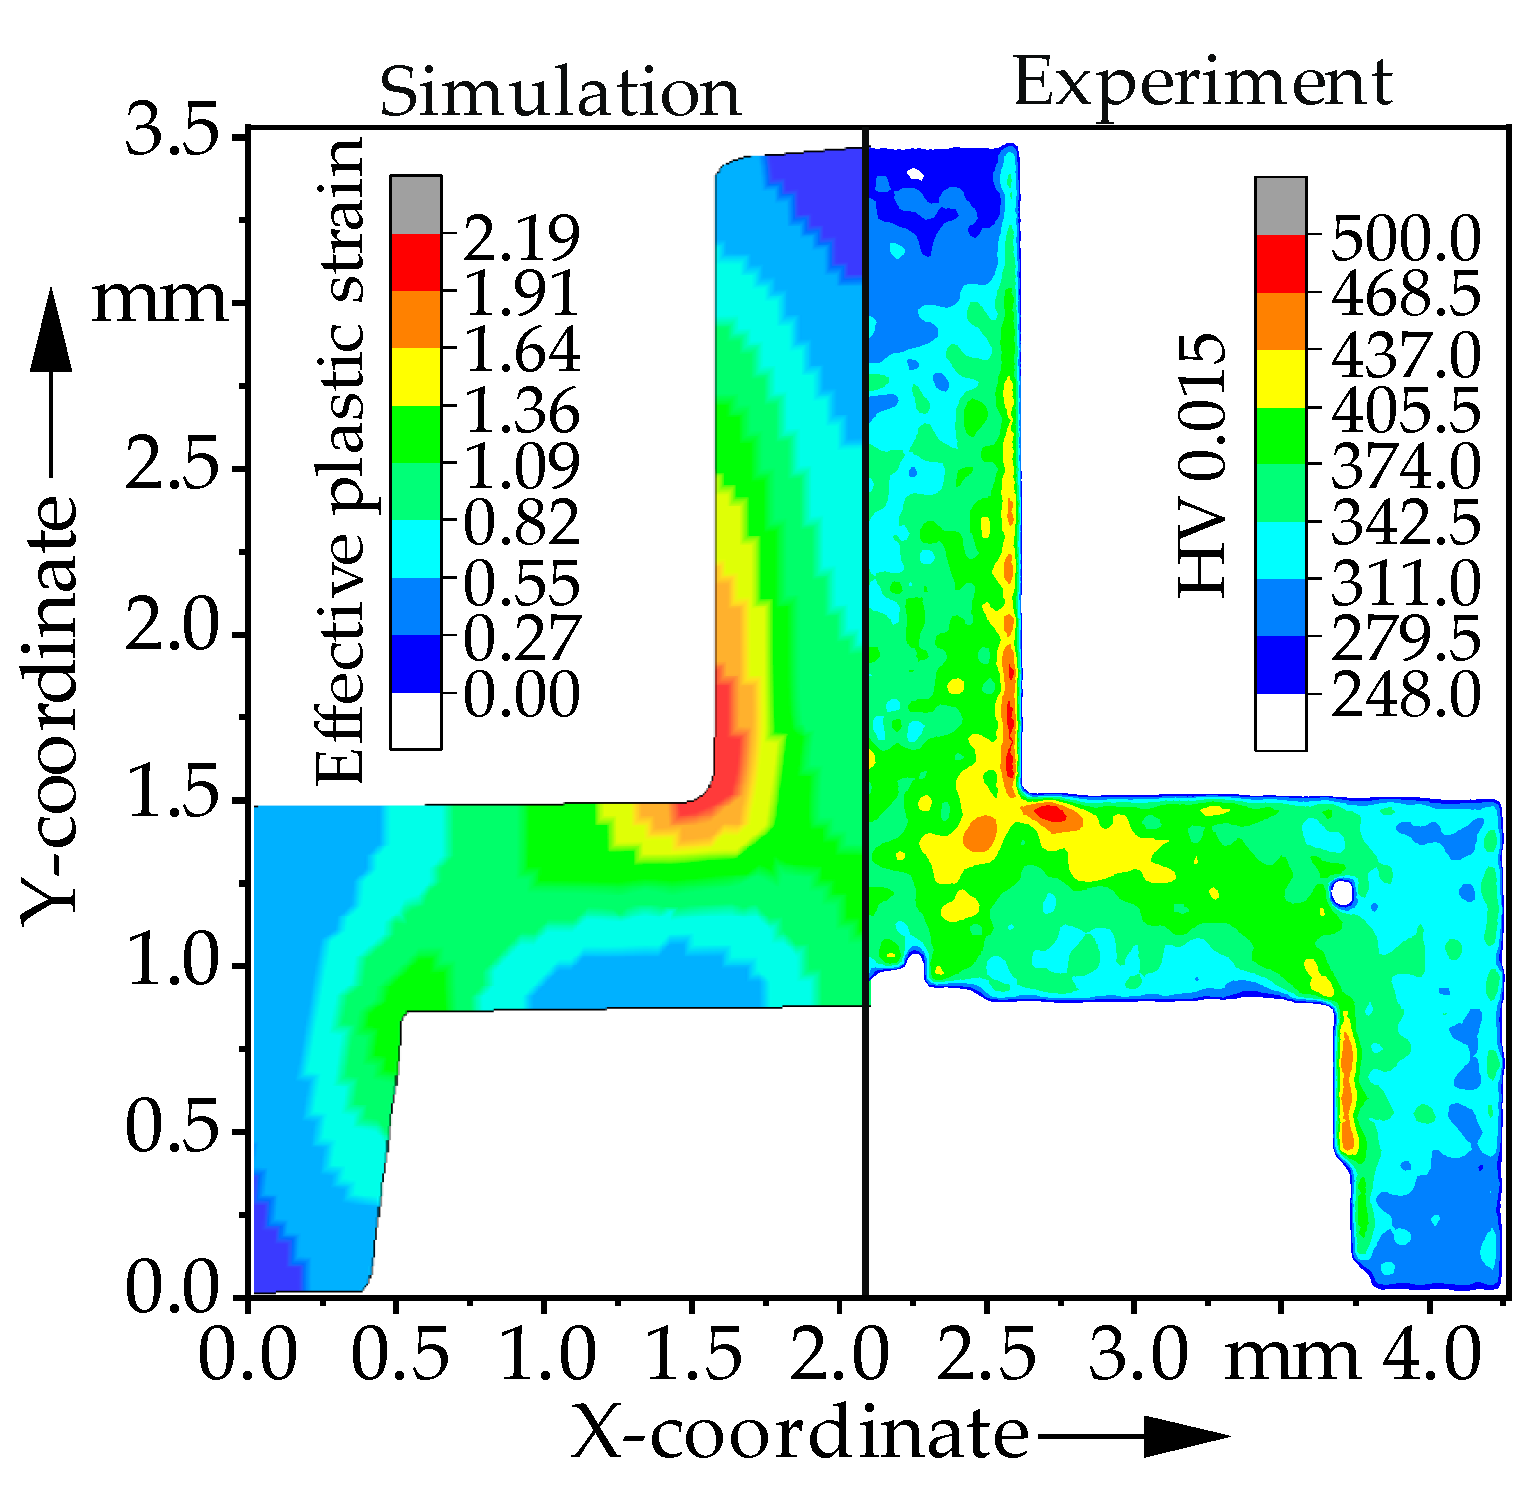
In addition to a quantitative, geometric validation of the numerical simulation, a qualitative comparison of the results was carried out in order to investigate how well the mechanical properties are reproduced by the numerical simulation. For this purpose, the hardness of an extruded pin with a height of 2.0 mm and a diameter of 1.0 mm was measured by means of microhardness measurement HV 0.015 with a Fischerscope HM2000 from Helmut Fischer GmbH in accordance with ISO 14577-1 [28]. The results are shown in Figure 6. Additionally, the effective plastic strain for an equivalent pin from the numerical simulation is compared with the hardness measurement. Since the increase in hardness and the plastic deformation are correlating, according to [29], the microhardness distribution of the experiment can be qualitatively compared with the effective plastic strain of the numerical simulation.
The analysis of the data presented in Figure 6 shows a sufficient representation of the hardening of the material by the numerical simulation. Particularly, in the area of the die entry, the high plastic deformation and the different areas of the plastic hardening in the pin are well mapped, showing the validity of the model and confirming that the extrusion process as well as the resulting properties of the component are well represented.

3.4.3. Pin Joining

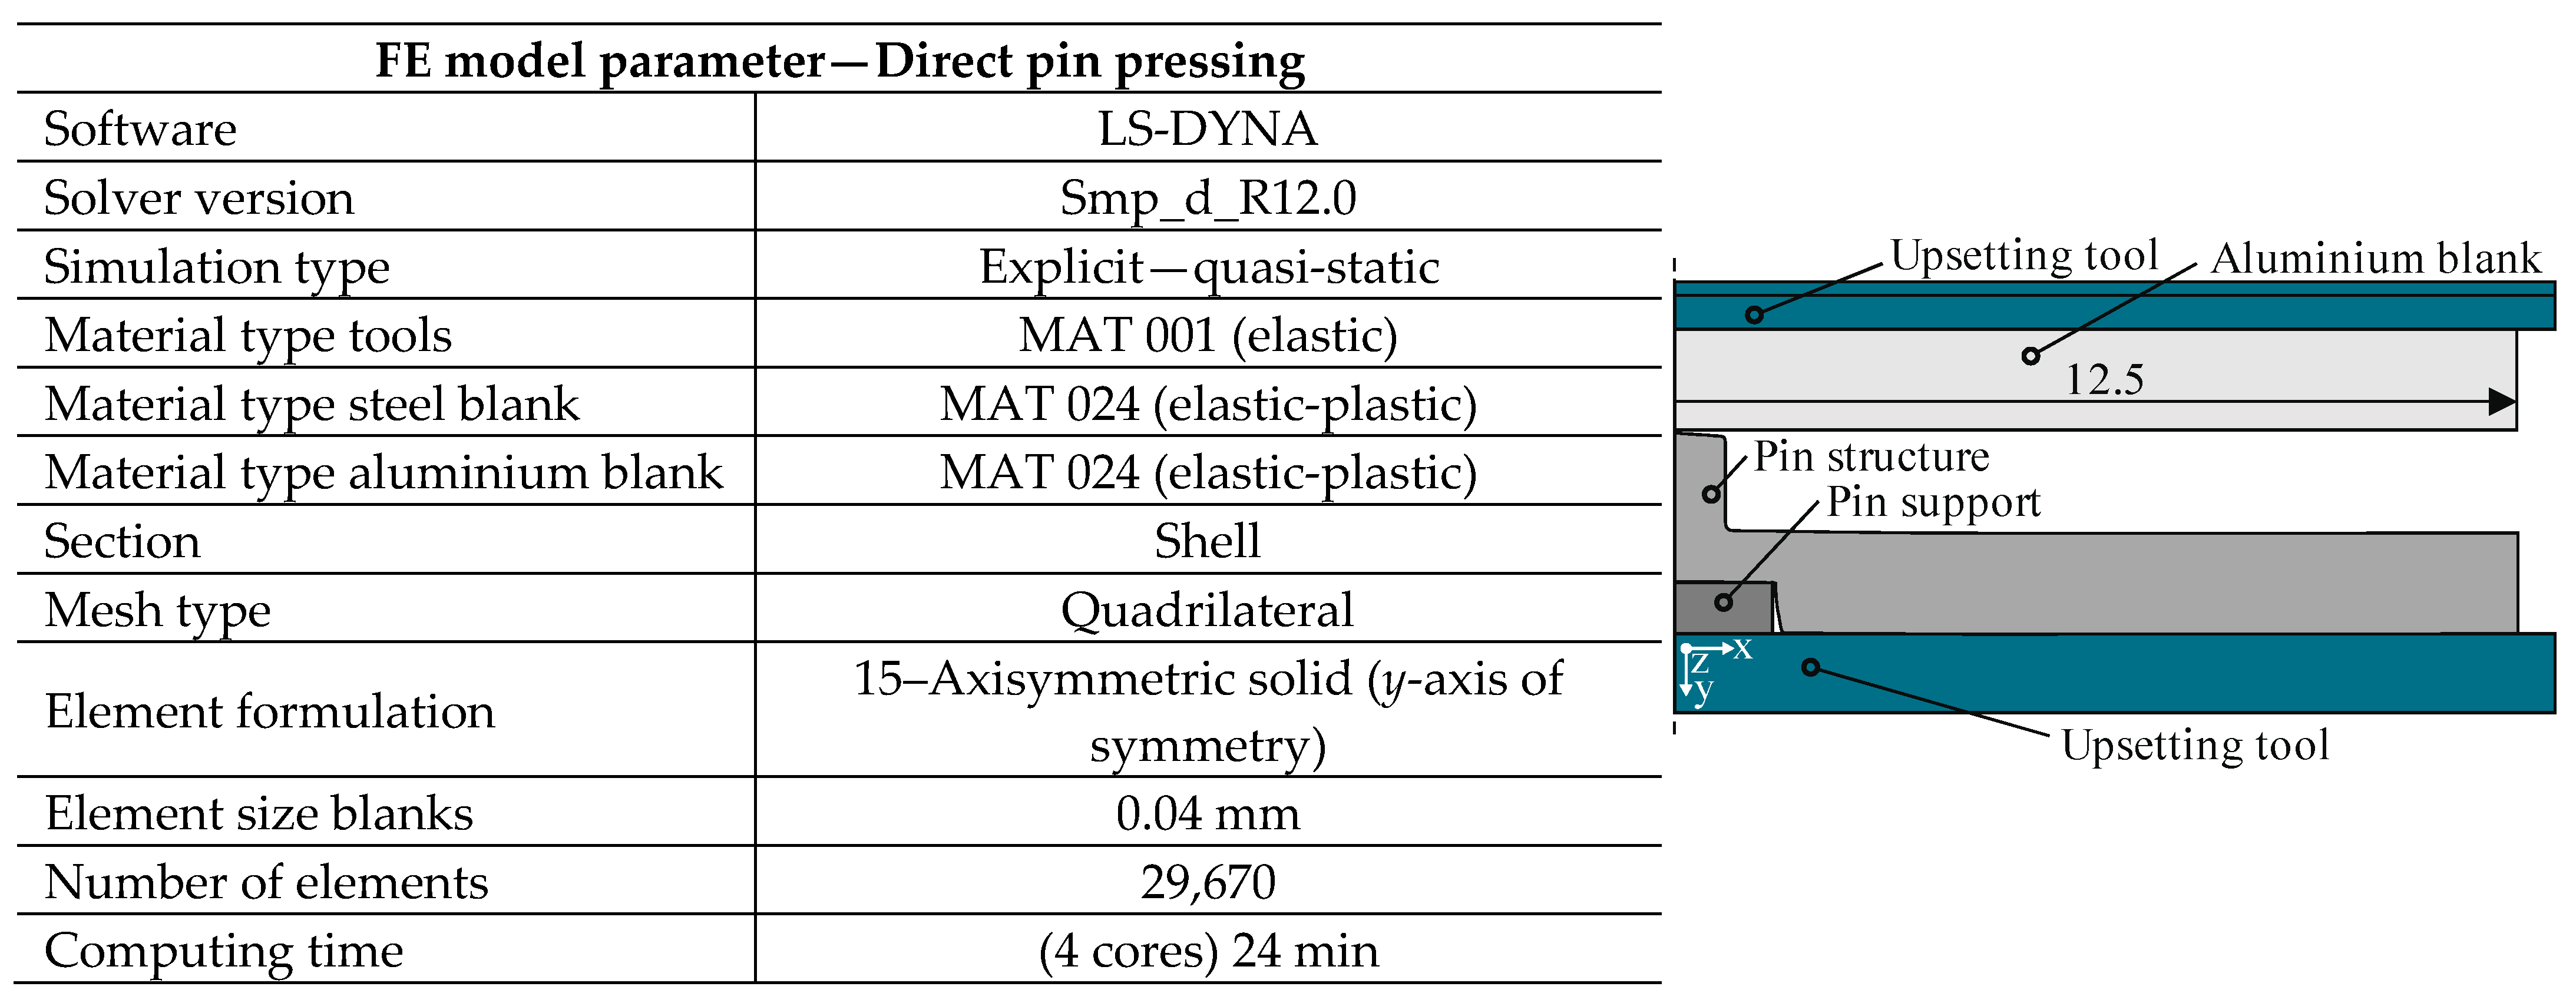
For the simulation of the joining process, which was set up according to the design in Figure 7 on the right, LS-Dyna and the same solver as for the pin extrusion were used. In addition, analogous to the extrusion simulation, a 2D axisymmetric numerical simulation along with a quadrilateral mesh for the discretisation of the tools and the sheet metal was used again due to the rotational symmetry of the joining point. The pin structure for the joining simulation was exported with the stress-strain data from the pin extrusion simulation, maintaining the forming history of the pin. For the discretisation of the pin as well as the aluminium joining partner, an element size of 0.04 mm was again used and, due to the high plastic deformation of the aluminium sheet in particular, 2D r-adaptive remeshing was used for both the aluminium sheet and the pin structure to avoid too much mesh distortion during the process. For the lower and upper tools, an element size of 0.05 mm and an element size of 0.1 mm for the pin support was used. The material model for the pin from DP600 was taken from the extrusion simulation and the material card 024-Piecewise_linear-plasticity with an E-modulus of 70 GPa and the Hockett–Sherby extrapolated yield curve from Figure 1 for the EN AW-6014-T4 were also used for the aluminium joining partner. For the mapping of the tribology of the model, a coefficient of friction of µ = 0.1 was used for the tool/sheet contacts, and a friction value of µ = 0.15 was used for the contact between the joining partners for a DP600/EN AW-6014 pairing, according to [30].

3.4.4. Validation of Pin Joining Simulation

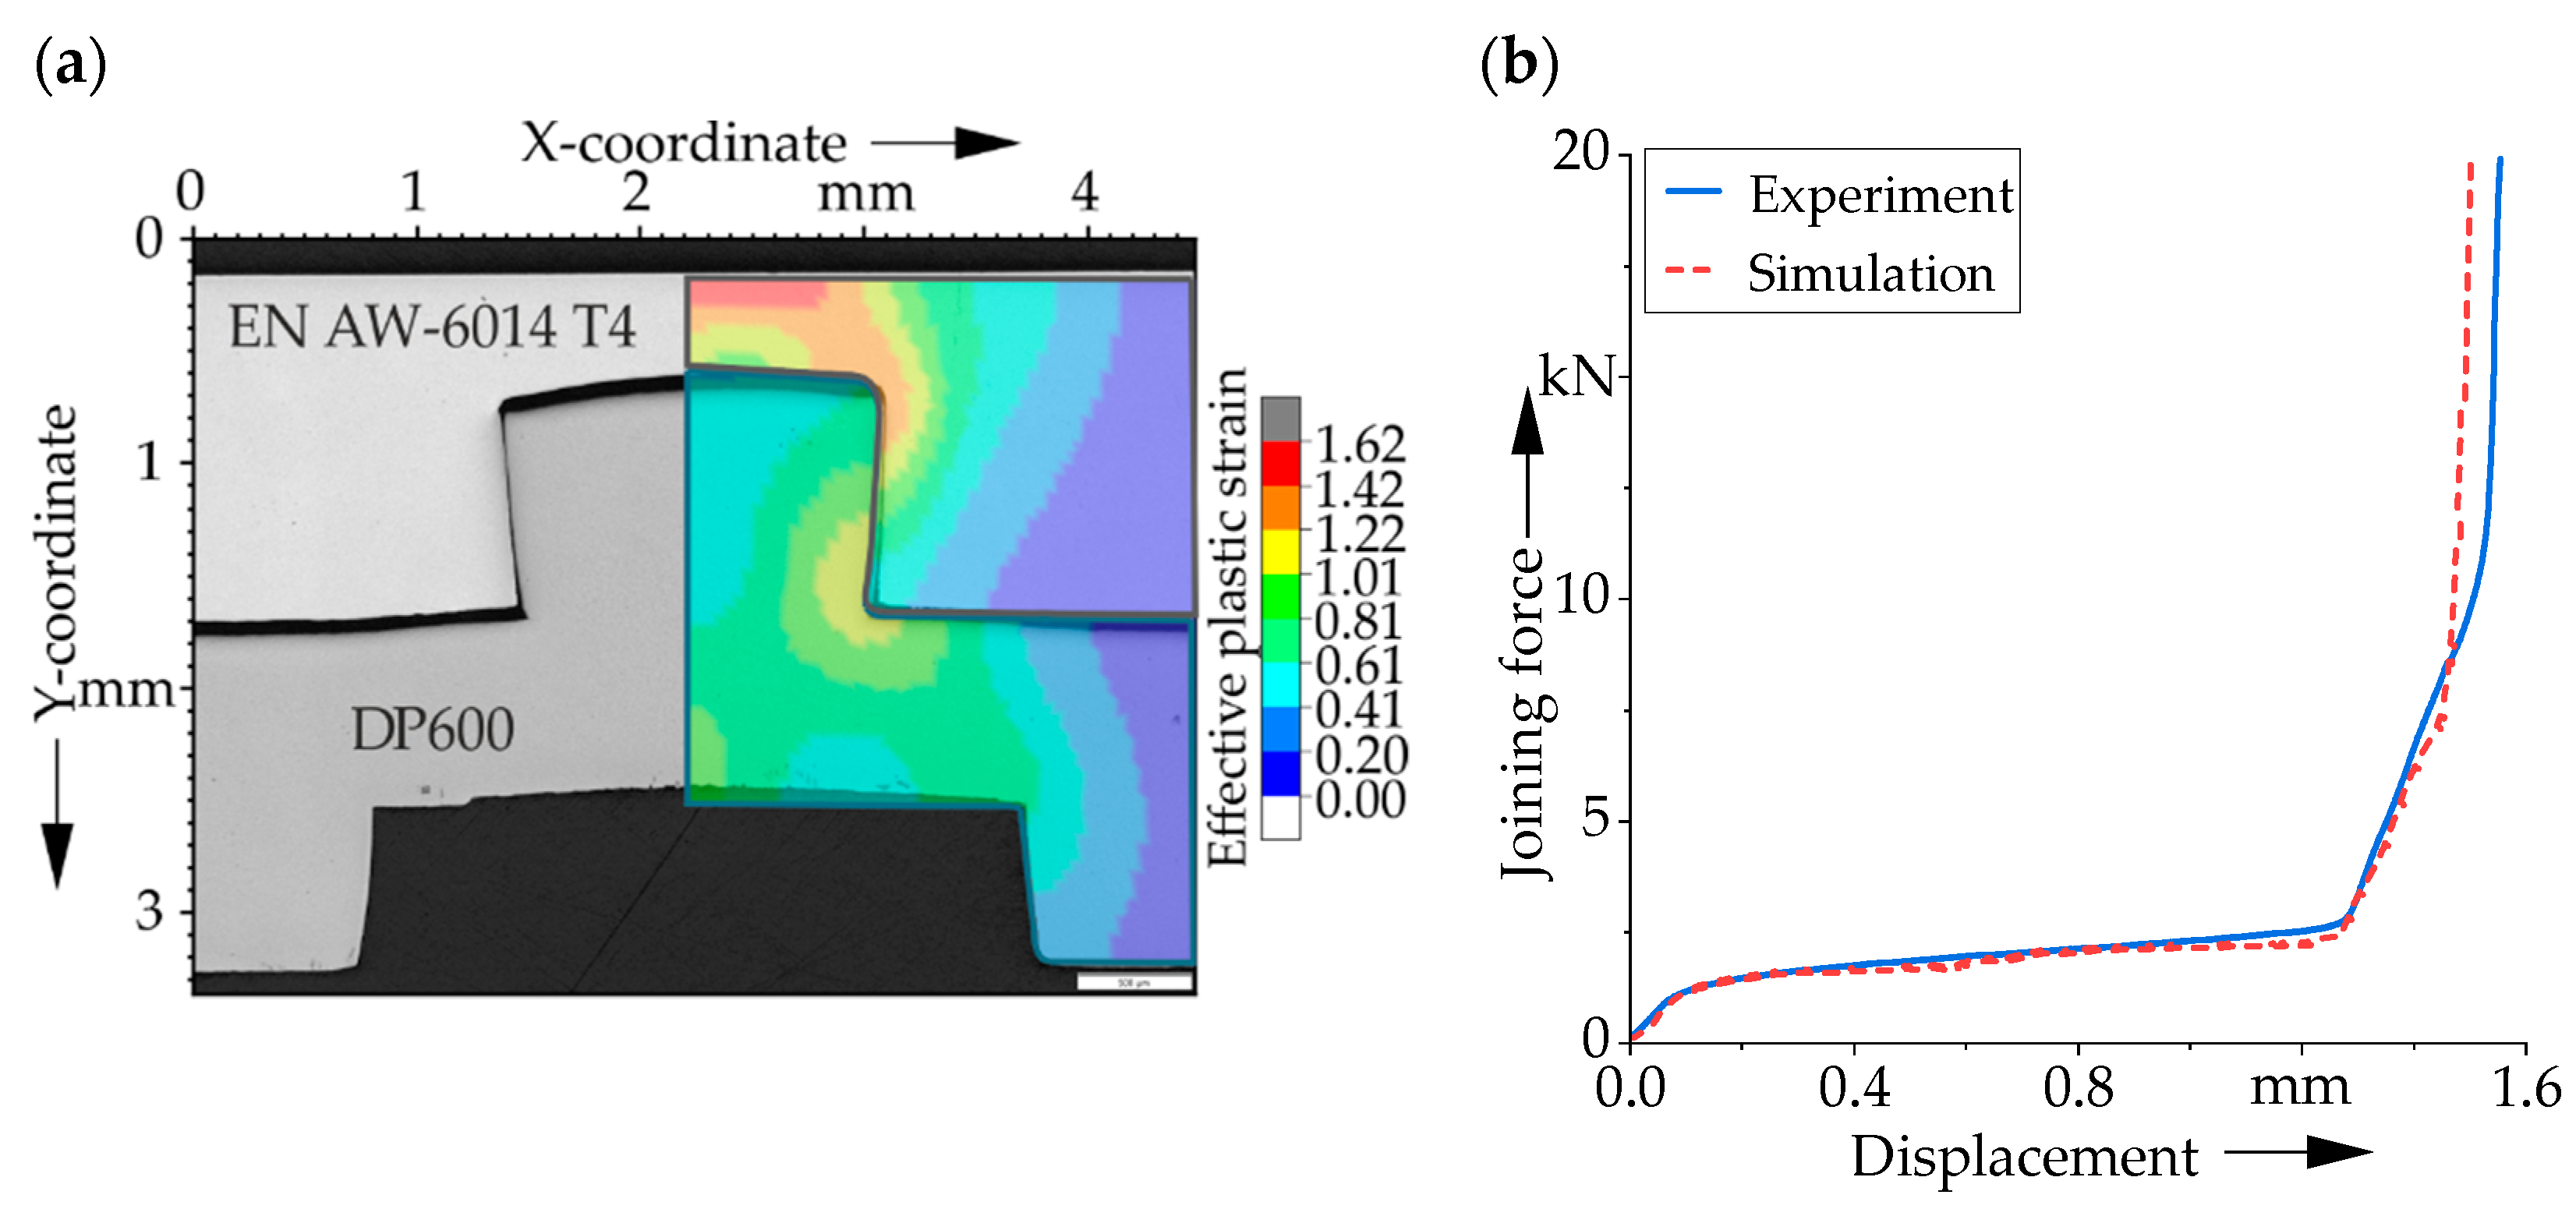
For the validation of the numerical simulation for direct pin pressing, in addition to the geometric validation via a micrograph of the joint, a validation of the force-displacement curve of the joining process was used. For the geometric validation, a joint of the material combination investigated in this work was used with sheet thicknesses of t0 = 1.5 mm for the DP600 and the EN AW-6014-T4 sheet. Figure 8a compares a micrograph of the direct pin pressing joint with an initial pin height h of 1.38 mm with the contour of the numerical simulation to investigate the mapping accuracy of the joint geometry. The numerical simulation shows a high qualitative agreement of the joint geometry. The wedge-shaped geometry of the pin, which is created by the upsetting during the joining process, is well reproduced. However, a slightly higher residual pin height can be seen in the simulation and the pin penetrates slightly further into the aluminium sheet. One reason could be the friction conditions between the upsetting tool and the aluminium sheet, which has an influence on the material flow of the aluminium and thus on the axial upsetting of the pin structure.
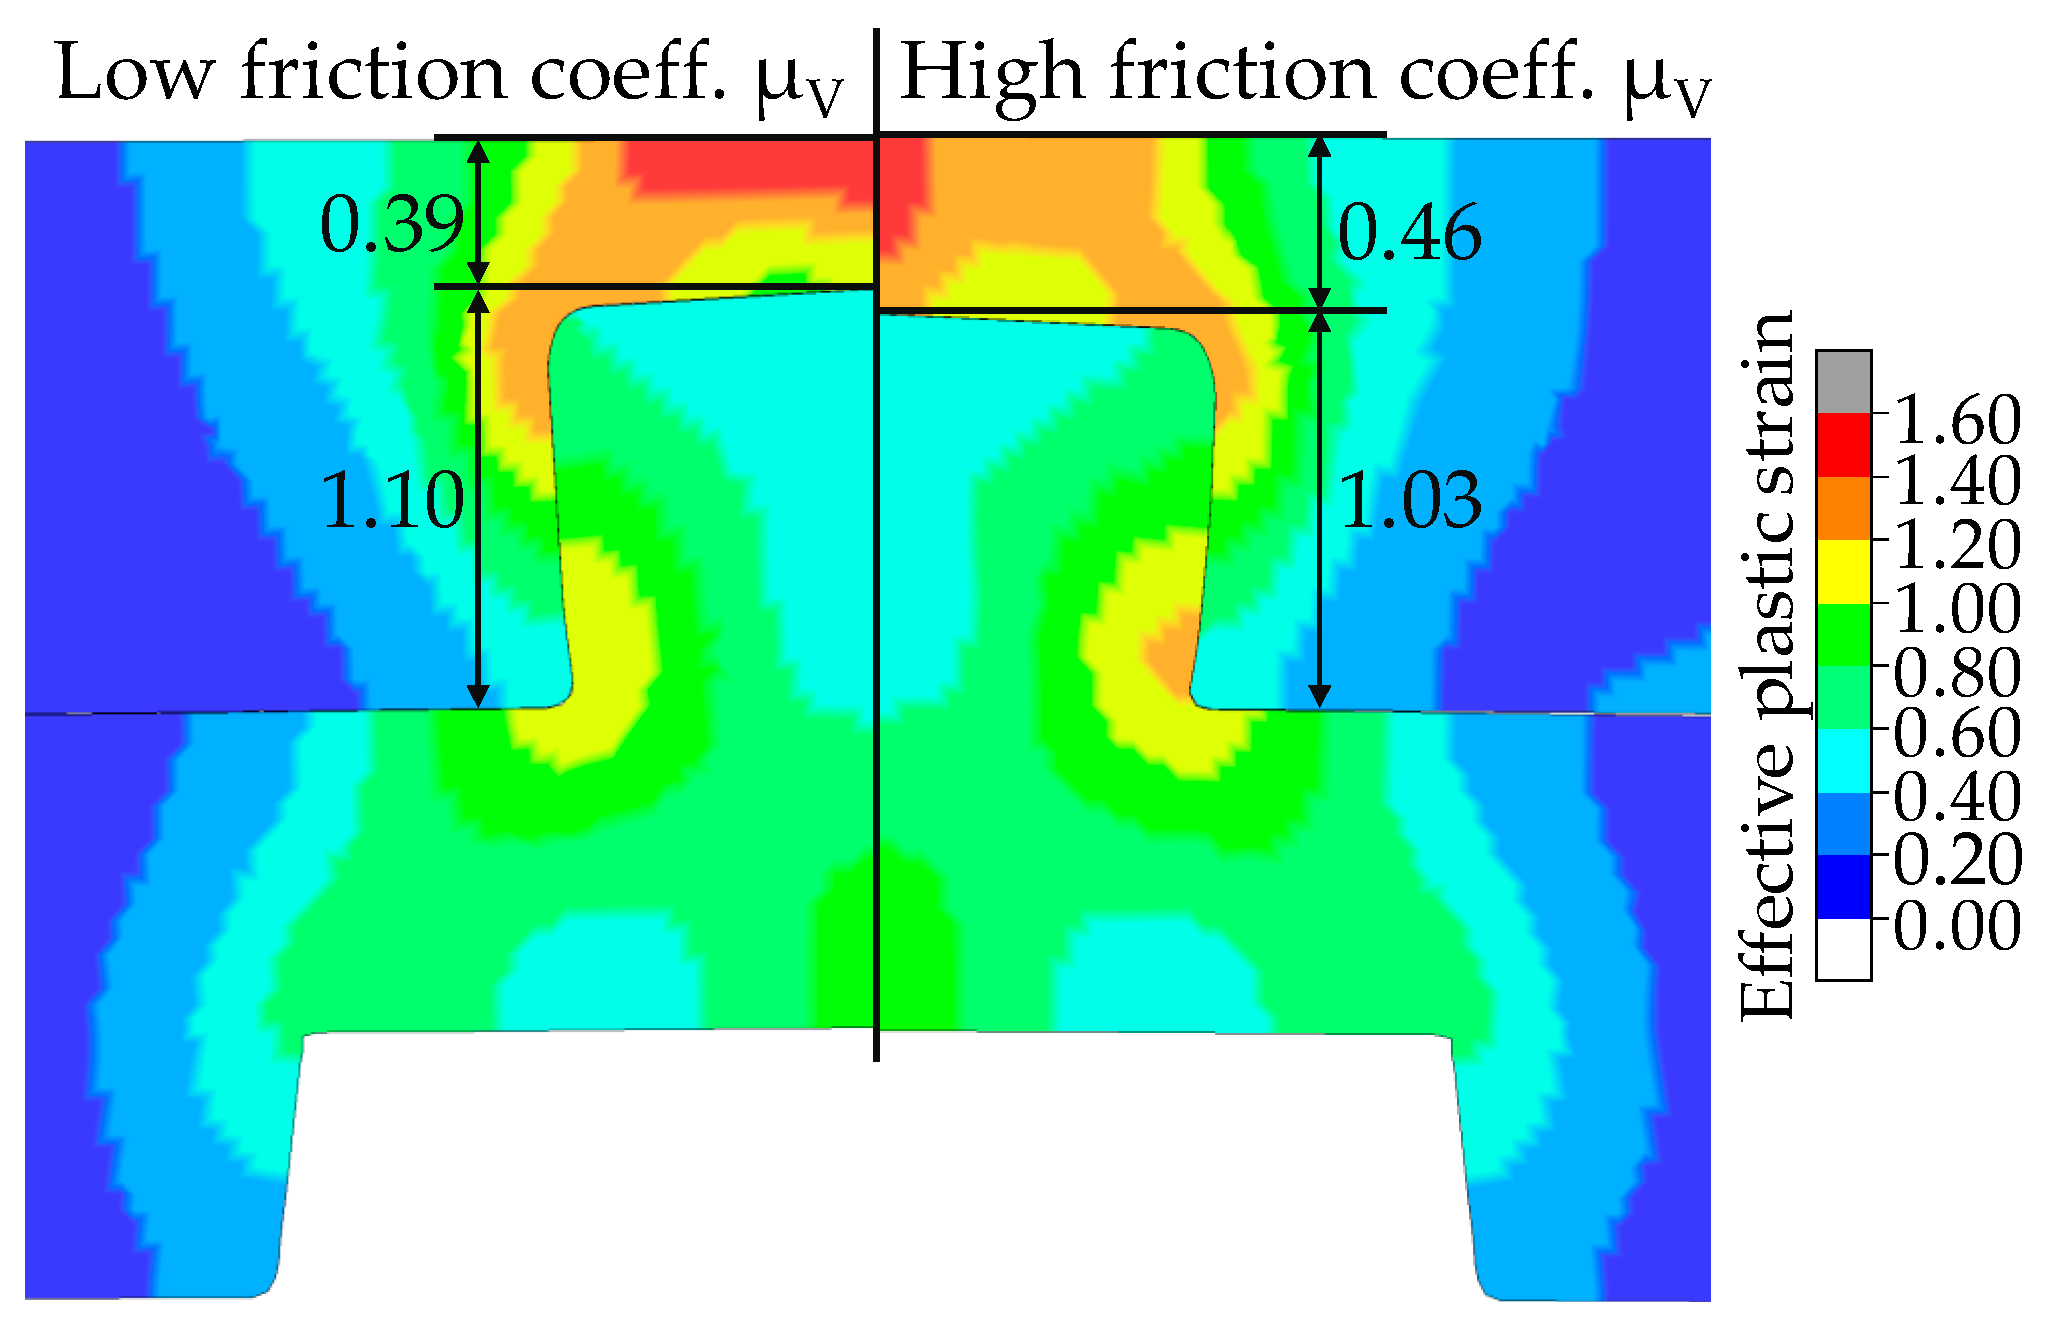
Additionally, Figure 8b shows the experimentally and numerically determined force path for the direct pin pressing of a pin with a height, h, of 1.49 mm. It can be seen that the three phases of the joining process described in [31] can be reproduced well by the numerical simulation and that it shows a satisfying agreement with the force-displacement curve. The joining process thus begins with the linear increase in the force due to the elastic deformation of the steel and aluminium. This is followed by the elastic-plastic deformation of the aluminium and the steel pin, whereby, initially, the aluminium is primarily plastically deformed. Due to the penetration of the pin into the aluminium joining partner, a bulge forms on the surface as already described due to the axial material displacement by the pin. As soon as the aluminium and steel sheet come into contact, the slope of the force increases sharply and the bulge is smoothed out by the upsetting tool through axially upsetting the material as well as the pin and, as a result, displaces it radially into the sheet metal plane. As soon as the upsetting tool is in full contact with the aluminium again, the strong linear force increase takes place, and the joining process is completed. This strong linear rise in force occurs around 4% earlier at 1.47 mm in the numeric simulation compared to 1.53 mm in the experimental data. One explanation for this could be a slight deviation of the experimental and numerical pin height, which would lead to a deviation from the beginning of the force increase. Additionally, the friction conditions between the upsetting tool and the aluminium sheet can again have an influence on the process. With a higher friction coefficient, the material flow radially outwards is more restricted compared to a low friction coefficient and therefore, the residual sheet thickness of the aluminium above the pin structure is increased, slightly influencing the geometry of the joint (c.f. Figure 9). Due to the good agreement of the force displacement curves for the experiment and numerical simulation as well as the good geometric representation of the joint, the numerical model is considered validated.
Following the numerical investigation of the pin extrusion and joining process, the utilization of validated 3D (shear loading; FShear) and 2D (head tensile loading; FTensile) FE simulation models enabled the determination of the joint’s loading capacity. In this context, the setup of the individual models is mainly based on the introduced approaches in [32,33].

3.5. Design of Experiment

Since the investigation of an entire technical system can be highly cost- and time-intensive, the consideration of an intelligent experimental design enables the coverage of a large parameter space taking a significantly reduced number of samples into account. Furthermore, the set-up of a computer-based parameter study involving the previously introduced FE simulation models provides the opportunity to exactly determine variations in material properties or surface conditions [34]. In this context, the authors in [35,36] demonstrated a novel approach for the efficient and automated numerical parameter study in the field of mechanical joining processes using clinching as an example. Especially, the use of a Latin Hypercube Design as a statistical method ensures the generation of near-random sample values based on a multi-dimensional distribution. Thus, the resulting space-filling parameter space decreases the appearance of spurious correlations between the individual input parameters whereby a sufficient representation of the investigated technical system can be achieved [34].
In addition to the selection of a suitable design for the experiment, it is crucial to also identify relevant input parameters and relating sampling boundary values for the following performance of a comprehensive Pearson’s correlation analysis and robustness study. Therefore, the combination of expert knowledge and existing standards or design principles ensures the reliable and meaningful exploration of varying parameter configurations. Based on experimental studies, such as in [37], that investigate the influence of friction conditions during the pin extrusion process, the selected parameters in Table 1 and Table 2 in the following chapter represent uncertain factors within the pin extrusion as well as the joining process chain. However, since not all uncertainties of the investigated input parameters are precisely described in tolerance specifications, the selection of suitable distribution functions is of main interest. For instance, while permissible variations in initial sheet thicknesses rely on standards, such as DIN EN 485-4:2019-05 [38], and thus are mainly Gaussian distributed to a mean value, friction values are often based on the available joining process, such as present tool coating conditions. For this reason, the chosen friction values represent different tool or sheet surface states.

4. Results

4.1. Data Sampling Process

For the selection and set-up of an intelligent experimental design, it is crucial to determine the involved input parameters regarding their boundary values and considered distribution functions. Therefore, existing process knowledge provided by standards or norms, such as manufacturing tolerances (e.g., DIN EN ISO 9445 [39]), enables a more precise definition of factor uncertainties. For instance, the initial thickness of the blanks or the material properties (e.g., ultimate tensile strength) can differ between specific tolerance limits. In this regard, each parameter shows a Gaussian distribution around a defined mean value, whereby the maximum and minimum values truncate a probability distribution representing 99.7% (six standard deviations) of the parameter space. In summary, Table 2 provides an overview of the chosen input factors and the considered distributions.
In comparison, the selection of suitable parameter spaces for each friction scenario mainly relies on the applied process and joining tool. For instance, changes in the tool surface caused by the wear in series production or the consideration of lubrication can result in a wide range of potential frictional contact mechanics. Thus, to achieve a satisfying coverage of varying conditions, all investigated contacting parts are represented by a uniform distribution of the particular friction values. The selected input parameters and factor spaces can be seen in Table 1. In the following, the steel material is described as the primary sheet and the aluminium alloy as the secondary sheet. Based on the defined design of the experiment, an intersection between the design points and the parametrization of the introduced FE models ensures a consistent and fast generation of 330 pin joint connections. In addition, the previously explained set-up of numerical 3D shear-tensile and 2D cross-tensile tests provides the opportunity to measure the impact of varying material properties and friction values on the resulting joint strengths. Therefore, an algorithm automatically determines both the resulting geometrical joint characteristics, such as the pin height, as well as the loading capabilities. In summary, the combination of an intelligent design of experiment with suitable distribution functions and parametrized FE models provide an efficient generation of data for the following performance of a Pearson’s correlation analysis and the subsequent investigation of process robustness considering uncertain material and process parameters.

4.2. Correlation Analysis

The application of a statistical method provides the opportunity to obtain a deeper understanding of the investigated pin joining process. Especially, the performance of Pearson’s correlation analysis enables the calculation of linear relationships between the input and target variables by measuring their individual associations. For instance, the identification of a positive correlation between variables means that an increase in one factor leads to an increase in the second one. In contrast to this, the decrease in a variable combined with the resulting increase in another parameter indicates a negative correlation between these parameters.
Given the aim to achieve a robust generation of pin joint connections, Figure 10 depicts the calculated Pearson’s correlation indices (r) regarding all varying input parameters and target variables. In this context, while r tending to 1 indicates a very strong positive correlation, a value of −1 implies a strong negative correlation. In addition, 0 means there is no association between the considered parameters.
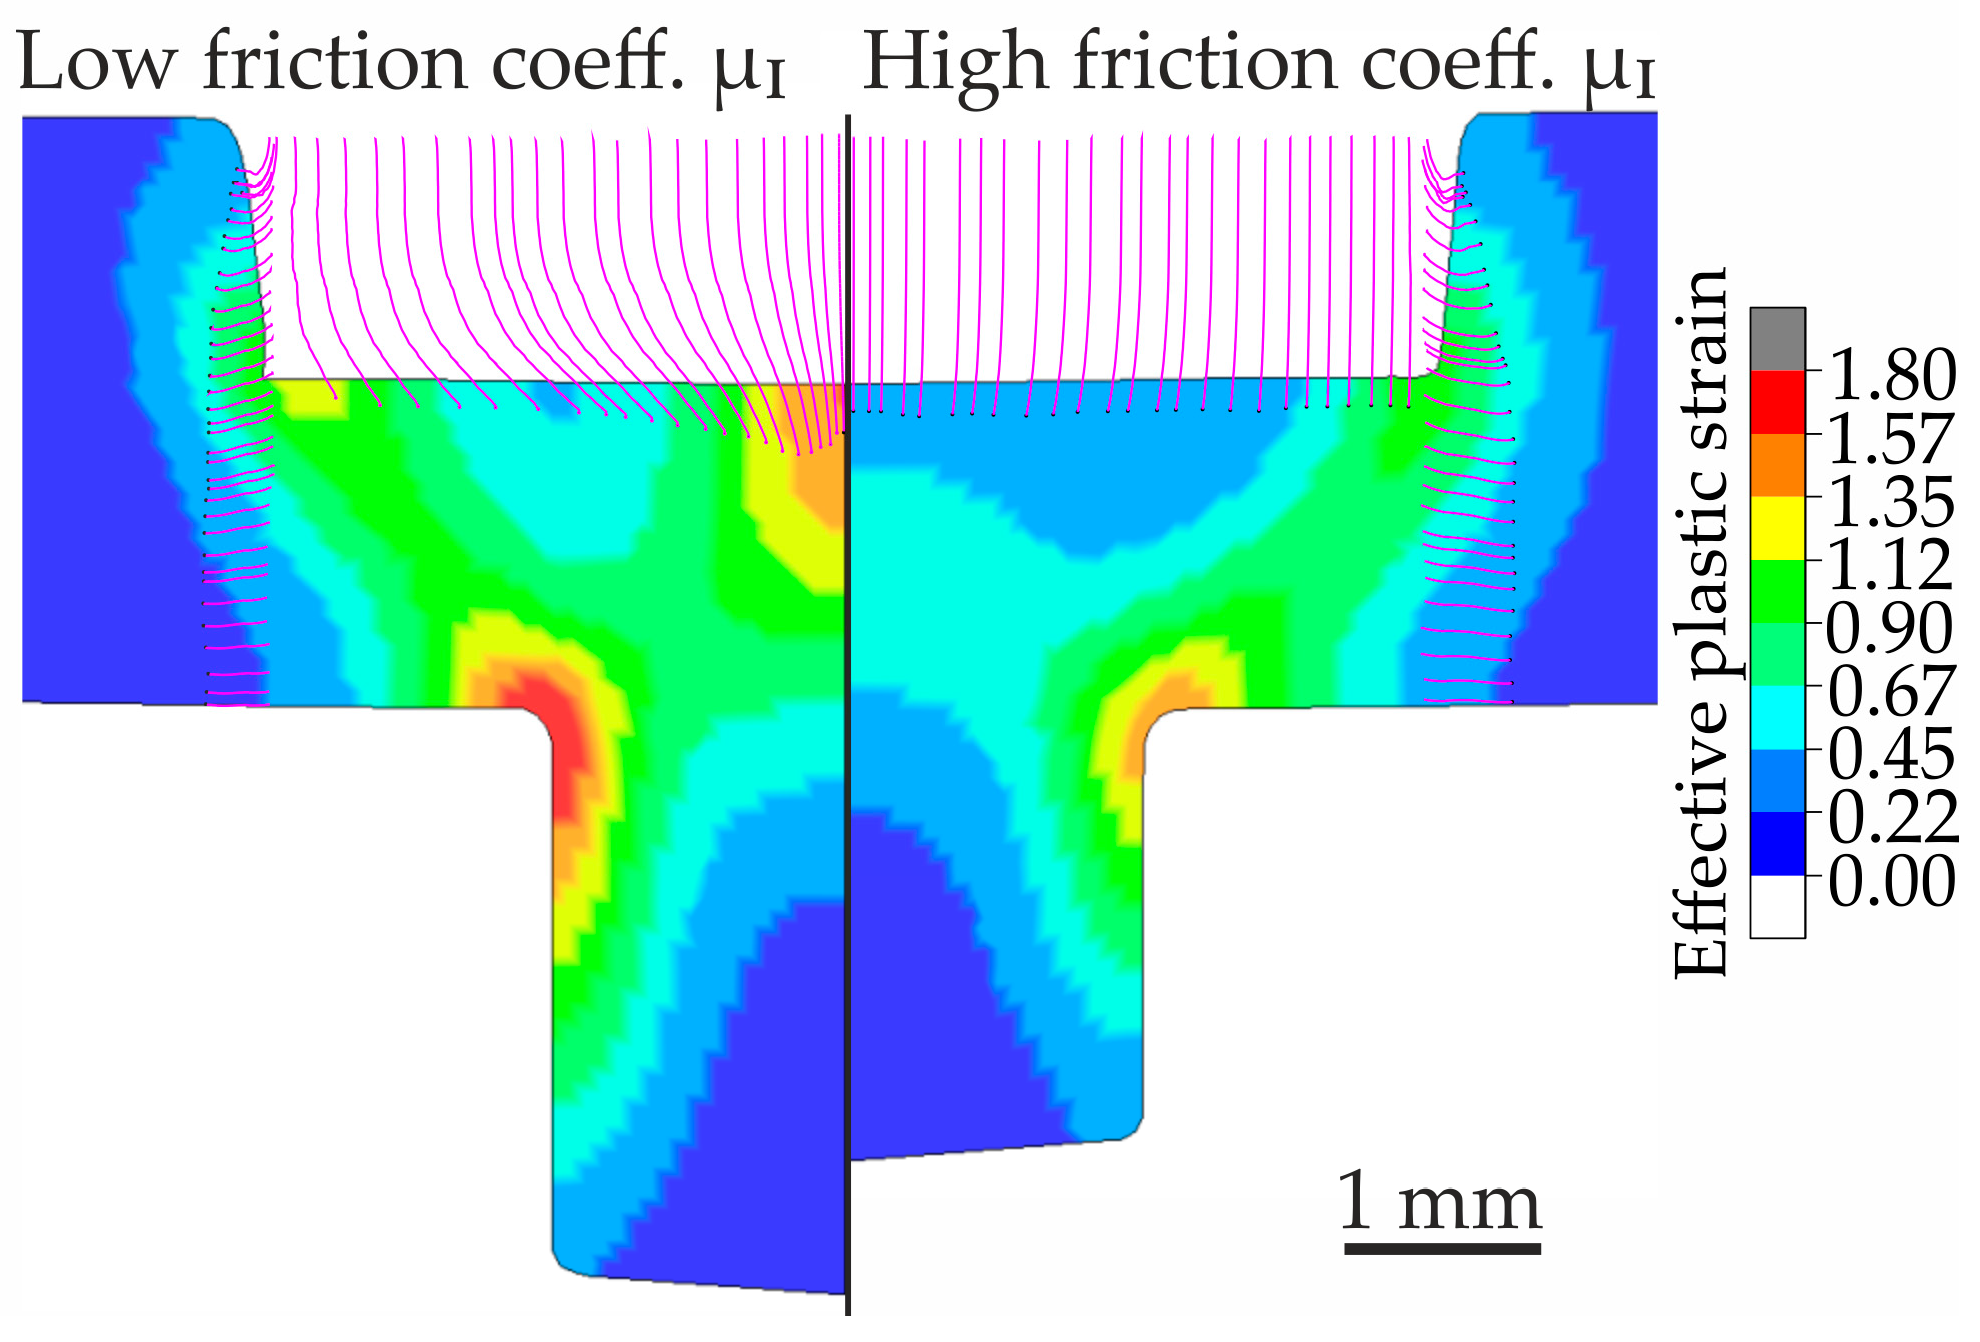
Thus, one can see that the pin height (hPin) is mainly affected by the present pre-straining ( c I ) in the steel sheet (r = 0.594) as well as the friction ( μ I ) between the punch surface and the primary material (r = −0.538). For the latter, the calculated Pearson’s correlation value indicates a moderately negative correlation, which means that an increase in friction results in a decrease in the achievable pin height. This can be explained by the fact that, due to the reduced friction between the punch and blank, the radial material flow inwards of the material that is in direct contact with the punch is promoted. This can be seen in Figure 11 (left) on the magenta lines, which indicate the material flow for the material right beneath and in the edge area of the punch. Conversely, higher friction ( μ I ) between punch and blank limits the radial material flow inwards of the material in direct contact with the punch and, therefore, leads to an increased material flow outwards into the sheet metal plane of the material beneath and in the edge area of the punch (c.f. Figure 11, right). Furthermore, the present friction ( μ I I I ) between the die and the primary joining material as well as the scale of pre-straining ( c I ) in this sheet have a positive effect on the target variable. In this case, the higher the input parameters are, the greater the resulting pin height. In contrast to this, uncertainties in the ultimate tensile strength ( T S I ,   T S I I ) influence the factor only slightly.
Focusing on the joint’s resistance against shear loading, one can see that the parameter is mainly affected by the input parameters μ I (friction between punch and primary sheet) and μ I I (friction between primary and secondary joining part). Especially, the latter indicates a moderate positive correlation whereby a higher friction coefficient leads to an increase in the shear force. Moreover, the generated pin height is highly relevant for achievable shear loading. In this context, an increase in the pin height leads to a simultaneous increase in this target variable. Similar to before, uncertainties in the ultimate tensile strength ( T S I ,   T S I I ) have nearly no impact on the resulting shear loading capacity.
In order to achieve enhanced tensile force values, the input parameters μ I I (friction between primary and secondary joining part) and μ V (friction between secondary joining part and upsetting tool) have to be taken into consideration. Therefore, while an increase in μ I I leads to a moderate improvement in the tensile strength, higher values of μ V result in a reduction in the achievable joint’s resistance against tensile loading.
This is due to the fact that the friction between the aluminium joining partner and the upper upsetting tool ( μ V ) , as already shown in Figure 9, leads to a stronger compression of the pin structure. As a result, the wedge-shaped pin geometry continuously changes into a barrel shape, similar to the shape which is common when upsetting cylindrical specimens for material characterisation. This changes the position of the largest cross-section of the pin from the pin head toward the pin base. However, the analysis of the numerical simulations showed that a position of the largest pin cross-section closer to the pin head has a positive effect on the tensile strength. This is based on the fact that a larger volume of material of the joining partner is located in the undercut, which leads to an increase in the load-bearing capacity under tensile load. Compared to this, uncertainties in the available sheet thicknesses ( t I , t I I ) have only a slight impact on this target variable.
In summary, one can see that the present friction conditions between the joining tools and the sheet metals affect the resulting quality-relevant pin joint characteristics rather than uncertainties in the material properties, such as a varying ultimate tensile strength. Thus, focusing on the selection of suitable frictional contact mechanics is crucial in order to control and guarantee a sufficient process robustness.

4.3. Robustness Analysis of Cold-Formed Pin Joints

In the context of this contribution, the following robustness analysis provides additional information to the previously determined Pearson’s correlation values. Therefore, the main scope is to acquire a better understanding of the underlying process uncertainties and frequency distributions of the target variables caused by differing process and material conditions. Furthermore, in order to evaluate whether the pin joining process is robust, boundary values are defined in which joint characteristics should be located. Especially, the resulting pin height has to reach a value of at least 1.45 mm to avoid ploughing [31] and a maximum of 2.25 mm to prevent buckling effects, which could be detected in preliminary tests. In this regard, Figure 12 illustrates the distributed quality-relevant pin joint characteristics, including the kernel density estimation. One can see that the results of the pin height are Gaussian distributed around the mean value of 1.8 mm. However, 6.41% of the generated joints did not reach the lower boundary and 3.51% exceeded the upper value, which represents a potential failure probability of 9.92%. Focusing on the shear force, the results are located between 1150 N and 1700 N (mean value of 1378 N, standard deviation of 95 N). In addition to this, the frequency distribution of the tensile force shows a variation range between 170 N and 550 N (mean value of 327 N, standard deviation of 81 N).
In summary, while the results of the pin height as well as the tensile loading indicate a Gaussian distribution around the mean value, the data of the tensile force tend to show a slightly skewed distribution. In this regard, the scope and purpose of this contribution are to evaluate the robustness of the pin joining process and to provide process recommendations to the design engineer in order to increase the reliability of the resulting joint connection as well as the robustness of the entire joining process. Thus, the following section focuses on the definition of a suitable process configuration based on the calculated relevance (Section 4.2) of individual input parameters.

4.4. Process Optimisation and Derivation of Process Windows

Since a failure probability of around 10% can lead to significant challenges within the joining process chain, this section focuses on the identification of more suitable limit values of the particular input parameters (process windows). Therefore, the aim is to increase the robustness of the pin joining process by simultaneously achieving a satisfying distribution of the pin height and thus ensuring a high resistance of the joint against shear and tensile loading. Based on the previous calculation of Pearson’s correlation values, the friction coefficients μ I (friction between punch and primary joining part) and μ I I I (friction between die and primary joining part) in particular, as well as the present state of pre-straining within the primary joining part ( c I ), are relevant for the formation of a pin structure. Since the latter mainly depends on previous forming steps, such as deep drawing, the setting of a high level of pre-straining is often hard to achieve and sometimes requires a cost- and time-intensive adjustment of the entire joining process. Thus, the recommendation is to apply the pin joining technology only in areas where a maximum of 5 percent pre-deformation is already present. This can also reduce the risk of buckling effects caused by pin heights exceeding the specified limit of 2.25 mm.
As previously explained, while lower friction values between the punch and primary joining part are preferable, the application of a coated die tool configuration or lubrications can be highly beneficial for the resulting pin height. Furthermore, and based on the results in Section 4.2, it is also advisable to choose tool configurations that tend to reach higher friction mechanics between the die and primary joining part. Thus, Table 3 illustrates the adapted parameter spaces for the subsequent performance of the second robustness analysis.
Although the demand on tighter permissible ranges of the tool friction conditions can result in higher production costs, since the die and punch have to be controlled and exchanged more frequently, Figure 13 demonstrates a significantly positive effect on the determined pin joint distribution and thus on the robustness of the entire pin joining process.
One can see that the failure probability for ploughing decreased by around 52% (6.41% to 3.03%) and for buckling by over 56% (3.51% to 1.52%). In this context, the mean pin height slightly increased to a value of 1.86 mm ( σ = 0.21 mm), still showing a Gaussian distribution of the results. Focusing on the loading capacity, it can be noted that while the distribution of the shear forces indicates a slightly increased mean value (1387 N to 1404 N) and standard deviation (95 N to 104 N), the results of the tensile force depict an opposite effect. Therefore, both the mean value (327 N to 308 N) and standard deviation (81 N to 68 N) demonstrate a reduced range. Especially, the latter effect can be referred to as the limitation of the permissible pre-straining of the primary joining part (see Section 4.2). To compensate for the decrease, the inclusion of a coated upsetting tool or lubrication between the primary and secondary joining part need to be investigated in future works.

5. Discussion

Reflecting on RQ1, namely the question of which uncertain input parameters have a significant impact on individual pin joint characteristics, Figure 10 depicts the results of the Pearson’s correlation analysis. While the variation of several friction values showed a significant impact on all investigated pin joint properties, uncertainties within the applied material, such as the ultimate tensile strength or the sheet thickness of the secondary joining part, are rather irrelevant. In truth, variations of the friction ( μ I ,   μ I I I ) between both extrusion tools (punch and die) and the primary joining part, as well as the level of pre-straining ( c I ) , affect the resulting pin height. Focusing on the shear and tensile force, the friction between the primary and the secondary joining part ( μ I I ) as well as the friction between the secondary joining part and the upsetting tool ( μ V ) are particularly relevant for the achievement of a high loading capacity. However, the Pearson’s correlation coefficients are based entirely on the previously selected design of the experiment and the chosen parameter distribution functions and boundaries. For instance, the selection of the friction ranges was defined on the basis of empirical values and less experimental data. A more precise specification of these ranges can lead to an even better evaluation of the parameter relevancies. In this context, the inclusion of the cross-domain knowledge introduced in [40] can pave the way to a deeper understanding of the pin joining process. In summary, the presented results are only valid for the introduced parameter spaces and can vary for changed conditions, but already provide a useful and better understanding of the pin joining process.
Referring to RQ2 and the question of how robustly the particular joint properties react to the varying process and friction parameters, Figure 12 shows that the involvement of boundary values for the pin height (minimum 1.45 mm; maximum 2.25 mm) leads to rather poor robustness (potential failure probability of 10%) of the pin joining process for the given input parameter spaces and joining task. In this context, the probability of 6.41% regarding ploughing and 3.51% for buckling can cause significant challenges within the joining process chain. However, the selection of the boundary values mainly relies on expert knowledge and only a few experimental studies. A more detailed adjustment of the values in future work may lead to an even more precise evaluation of the process’s robustness. Furthermore, the use of a 3D numerical simulation could significantly improve predictability in this regard, since buckling cannot be taken into account in an axisymmetric 2D simulation, but it has the disadvantage of a significantly higher computing time due to an increased number of elements.
In answer to the question of whether an improvement of the process reliability can be achieved and which recommendations can be given for future joining tasks (RQ3), Figure 13 illustrates a significant improvement of the pin joining process robustness. Therefore, the adaptation of only a few input parameter spaces already led to a reduction in the failure probability. As mentioned before, the investigated friction mechanics within the joining process chain were specifically indicated to have a significant influence on the resulting pin joint properties. However, while the increase in some values (e.g., μ I I I and c I ) can lead to higher pin heights, the adjustment of other values (e.g., μ I ) showed indications of the opposite effect. Thus, it is important to achieve a well-balanced adaption of the permissible input parameters to avoid strongly skewed distributions of the results. For instance, an updated parameter setting may reach a no failure probability for buckling but have a significantly increased level of ploughing. The second robustness analysis showed that the reduction in the friction values between the punch and the primary joining part, using, for example, coated tools or lubrications, can be beneficial for the achievement of greater pin heights. In contrast to this, the Pearson correlation analysis in Section 4.2 indicated that rather high friction mechanics between the die and the primary joining part are preferable for the resulting pin height. Additionally, it is recommended that the pin joining process should be applied in areas including a small pre-straining of the primary joining part. Based on this, the application of the joining technology in versatile process chains can be significantly increased, since a reduced failure probability leads to a robust and reliable generation of joining connections in future joining tasks.

6. Summary and Outlook

Summary: The introduced approach represents a systematic analysis of the pin joining process regarding the influence of varying input parameters on individual pin joint properties. Carrying out a robustness analysis combined with the determination of Pearson’s correlation coefficients enables the evaluation of the reliability of the pin joining process. Therefore, uncertain input parameters, such as varying sheet thicknesses, have to be focused on in more detail. In this context, the setup of validated and parameterized finite element simulation models in combination with the subsequent automated and algorithm-based determination of joint properties provided the generation of a comprehensive numerical database. For this purpose, the sheet metal HCT590X (1.5mm) as the primary joining part and EN AW-6014 (1.0mm) as the secondary joining part are used as an example. In summary, the investigations provided the subsequent results:
  • The friction mechanics between the extrusion tools (punch and die) are highly relevant for the achievement of satisfying pin joint properties. In comparison to this, uncertainties within the materials, such as the ultimate tensile strength or the sheet thickness of the secondary joining part, are less relevant.
  • The use of coated tools, especially for the punch, and the application of the pin joining process in areas including a small pre-straining level are recommended.
  • However, a good balance between the adjustments of particular process parameters is highly important as even small changes can lead to a significant shift in the distribution of the resulting pin joint properties.
  • An increase in the robustness of the pin joining process resulted from the described recommendations. In this context, the failure probability was reduced from 9.92% to 4.54%.
Outlook: The results presented in this contribution can pave the way to strengthen the application of pin joining as a sustainable and climate-friendly joining technology in versatile process chains. In this context, future research should try to establish a holistic approach to the pin joining process chain with a 3D simulation to address the limitation of the 2D axisymmetric simulation regarding the buckling of the pin during the joining process. Furthermore, since this work does not take the failure of the pin structure into account, the load bearing capacity of the joints is increased compared to the experimental results. Therefore, it is important to establish and subsequently implement a failure criterion for the material into the numerical simulation.

Author Contributions

Conceptualization, D.R., C.Z., B.S., S.W. and M.M.; Methodology, D.R. and C.Z.; Investigation, D.R. and C.Z.; Data curation, D.R. and C.Z.; resources, M.M., B.S. and S.W.; Writing—original draft preparation, D.R. and C.Z.; Writing—review and editing, D.R., C.Z., B.S., S.W. and M.M.; visualization, D.R. and C.Z.; Funding acquisition, M.M, B.S. and S.W.; Resources, M.M. and S.W.; Supervision, M.M., B.S. and S.W. All authors have read and agreed to the published version of the manuscript.

Funding

This work was funded by the Deutsche Forschungsgemeinschaft (DFG, German Research Foundation)-TRR 285 C01 & B05-Project-ID 418701707.

Data Availability Statement

The data will be provided from the corresponding author on request.

Conflicts of Interest

The authors declare no conflict of interest. The funders had no role in the design of the study; in the collection, analyses, or interpretation of data; in the writing of the manuscript; or in the decision to publish the results.

References

  1. European Comission. The European Green Deal. 2019. Available online: https://eur-lex.europa.eu/resource.html?uri=cellar:b828d165-1c22-11ea-8c1f-01aa75ed71a1.0002.02/DOC_1&format=PDF (accessed on 14 July 2022).
  2. Eurostat. Greenhouse Gas Emissions by Source Sector. Available online: https://ec.europa.eu/eurostat/databrowser/bookmark/1ffd5837-18ba-4e68-9634-1eaf2d6d4023?lang=de (accessed on 21 September 2022).
  3. Meschut, G.; Merklein, M.; Brosius, A.; Drummer, D.; Fratini, L.; Füssel, U.; Gude, M.; Homberg, W.; Martins, P.A.F.; Bobbert, M.; et al. Review on mechanical joining by plastic deformation. J. Adv. Join. Process. 2022, 177, 100113. [Google Scholar] [CrossRef]
  4. Raoelison, R.N.; Racine, D.; Zhang, Z.; Buiron, N.; Marceau, D.; Rachik, M. Magnetic pulse welding: Interface of Al/Cu joint and investigation of intermetallic formation effect on the weld features. J. Manuf. Process. 2014, 16, 427–434. [Google Scholar] [CrossRef]
  5. Kraus, M.; Merklein, M. Potential of Joining Dissimilar Materials by Cold Formed Pin-Structures. J. Mater. Process. Technology 2020, 283, 116697. [Google Scholar] [CrossRef]
  6. Ucsnik, S.A.; Kirov, G. New Possibility for the Connection of Metal Sheets and Fiber Reinforced Plastics. Mater. Sci. Forum 2011, 690, 465–468. [Google Scholar] [CrossRef]
  7. Parkes, P.N.; Butler, R.; Meyer, J.; de Oliveira, A. Static strength of metal-composite joints with penetrative reinforcement. Compos. Struct. 2014, 118, 250–256. [Google Scholar] [CrossRef] [Green Version]
  8. Römisch, D.; Popp, J.; Drummer, D.; Merklein, M. Joining of CFRT-steel hybrid parts via hole-forming and subsequent pin caulking. Prod. Eng. 2021, 16, 339–352. [Google Scholar] [CrossRef]
  9. Römisch, D.; Kraus, M.; Merklein, M. Investigation of the influence of formed, non-rotationally symmetrical pin geometries and their effect on the joint quality of steel and aluminium sheets by direct pin pressing. Proc. Inst. Mech. Eng. Part L J. Mater. Des. Appl. 2022, 236, 1187–1202. [Google Scholar] [CrossRef]
  10. Feistauer, E.E.; Santos, J.F.; Amancio-Filho, S.T. A review on direct assembly of through-the-thickness reinforced metal–polymer composite hybrid structures. Polym. Eng. Sci. 2019, 59, 661–674. [Google Scholar] [CrossRef] [Green Version]
  11. Graham, D.P.; Rezai, A.; Baker, D.; Smith, P.A.; Watts, J.F. The development and scalability of a high strength, damage tolerant, hybrid joining scheme for composite–metal structures. Compos. Part A Appl. Sci. Manuf. 2014, 64, 11–24. [Google Scholar] [CrossRef] [Green Version]
  12. Ucsnik, S.; Scheerer, M.; Zaremba, S.; Pahr, D.H. Experimental investigation of a novel hybrid metal–composite joining technology. Compos. Part A Appl. Sci. Manuf. 2010, 41, 369–374. [Google Scholar] [CrossRef]
  13. Feistauer, E.E.; dos Santos, J.F.; Amancio-Filho, S.T. An investigation of the ultrasonic joining process parameters effect on the mechanical properties of metal-composite hybrid joints. Weld. World 2020, 64, 1481–1495. [Google Scholar] [CrossRef]
  14. Smith, F. COMELD™: An innovation in composite to metal joining. Mater. Technol. 2005, 20, 91–96. [Google Scholar] [CrossRef]
  15. Ghassemali, E.; Tan, M.-J.; Jarfors, A.E.W.; Lim, S.C.V. Progressive microforming process: Towards the mass production of micro-parts using sheet metal. Int. J. Adv. Manuf. Technol. 2012, 66, 611–621. [Google Scholar] [CrossRef]
  16. Hirota, K. Fabrication of micro-billet by sheet extrusion. J. Mater. Process. Technol. 2007, 191, 283–287. [Google Scholar] [CrossRef]
  17. Stricker, N.; Lanza, G. The Concept of Robustness in Production Systems and its Correlation to Disturbances. Procedia CIRP 2014, 19, 87–92. [Google Scholar] [CrossRef] [Green Version]
  18. Romisch, D.; Zirngibl, C.; Schleich, B.; Wartzack, S.; Merklein, M. Data-driven analysis of cold-formed pin structure characteristics in the context of versatile joining processes. IOP Conf. Ser. Mater. Sci. Eng. 2021, 1157, 012077. [Google Scholar] [CrossRef]
  19. Fonstein, N. Dual-phase steels. In Automotive Steels. Design, Metallurgy, Processing and Applications; Rana, R., Singh, S.B., Eds.; Woodhead Publishing: Duxford, UK, 2017; pp. 169–216. [Google Scholar]
  20. Novelis Inc. Data Sheet-Novelis AdvanzTM 6F-e170. 2019. Available online: https://www.novelis.com/wp-content/uploads/2019/02/Advanz-6F-e170-DataSheet-012119.pdf (accessed on 10 August 2022).
  21. DIN EN ISO 6892-1:2014-06; Metallic Materials-Tensile Testing-Part 1: Method of Test at Room Temperature (ISO 6892-1:2014). Beuth Verlag: Berlin, Germany, 2014.
  22. Swift, H.W. Plastic instability under plane stress. J. Mech. Phys. Solids 1952, 1, 1–18. [Google Scholar] [CrossRef]
  23. 23. DIN EN ISO 16808:2014-1; Metallic Materials-Sheet and Strip-Determination of Biaxial Stress-Strain Curve by Means of Bulge Test with Optical Measuring Systems (ISO 16808:2014). Beuth Verlag: Berlin, Germany, 2014. [CrossRef]
  24. Hockett, J.E.; Sherby, O.D. Large strain deformation of polycrystalline metals at low homologous temperatures. J. Mech. Phys. Solids 1975, 23, 87–98. [Google Scholar] [CrossRef]
  25. Doege, E.; Behrens, B.-A. Handbuch Umformtechnik; Springer: Berlin/Heidelberg, Germany, 2016. [Google Scholar]
  26. Kraus, M.; Lenzen, M.; Merklein, M. Contact pressure-dependent friction characterization by using a single sheet metal compression test. Wear 2021, 93, 203679. [Google Scholar] [CrossRef]
  27. Tekkaya, A.E. A guide for validation of FE-simulations in bulk metal forming. Arab. J. Sci. Eng. 2005, 30, 113–136. [Google Scholar]
  28. DIN EN ISO 14577-1:2015; Metallic Materials—Instrumented Indentation Test for Hardness and Materials Parameters—Part 1: Test Method. Beuth Verlag: Berlin, Germany, 2015.
  29. Tekkaya, A.E.; Martins, P.A.F. Accuracy, reliability and validity of finite element analysis in metal forming: A user’s perspective. Eng. Comput. 2009, 26, 1026–1055. [Google Scholar] [CrossRef]
  30. Wituschek, S.; Lechner, M. Friction Characterisation for a Tumbling Self-Piercing Riveting Process. Key Eng. Mater. 2021, 883, 27–34. [Google Scholar] [CrossRef]
  31. Römisch, D.; Kraus, M.; Merklein, M. Experimental Study on Joining by Forming of HCT590X + Z and EN-AW 6014 Sheets Using Cold Extruded Pin Structures. J. Manuf. Mater. Process. 2021, 5, 25. [Google Scholar] [CrossRef]
  32. Bielak, C.R.; Böhnke, M.; Beck, R.; Bobbert, M.; Meschut, G. Numerical analysis of the robustness of clinching process considering the pre-forming of the parts. J. Adv. Join. Process. 2021, 3, 100038. [Google Scholar] [CrossRef]
  33. Martin, S.; Bielak, C.R.; Bobbert, M.; Tröster, T.; Meschut, G. Numerical investigation of the clinched joint loadings considering the initial pre-strain in the joining area. Prod. Eng. 2022, 16, 261–273. [Google Scholar] [CrossRef]
  34. Siebertz, K.; van Bebber, D.; Hochkirchen, T. Statistische Versuchsplanung; Springer: Berlin/Heidelberg, Germany, 2017. [Google Scholar]
  35. Zirngibl, C.; Schleich, B.; Wartzack, S. Approach for the Automated and Data-Based Design of Mechanical Joints. Proc. Des. Soc. 2021, 1, 521–530. [Google Scholar] [CrossRef]
  36. Zirngibl, C.; Schleich, B. Approach for the Automated Analysis of Geometrical Clinch Joint Characteristics. Key Eng. Mater. 2021, 883, 105–110. [Google Scholar] [CrossRef]
  37. Kraus, M.; Hufnagel, T.; Merklein, M. Accuracy of Conventional Finite Element Models in Bulk-Forming of Micropins from Sheet Metal. J. Micro Nano-Manuf. 2019, 7, 010902. [Google Scholar] [CrossRef]
  38. DIN EN 485-4:2019-05; Aluminium and Aluminium Alloys-Sheet, Strip and Plate-Part 4: Tolerances on Shape and Dimensions for Cold-Rolled Products. Beuth Verlag: Berlin, Germany, 1993. [CrossRef]
  39. DIN EN ISO 9445-1:2010-06; Continuously Cold-Rolled Stainless Steel-Tolerances on Dimensions and Form-Part 1: Narrow Strip and Cut Lengths (ISO 9445-1:2009). Beuth Verlag: Berlin, Germany, 2010. [CrossRef]
  40. Zirngibl, C.; Kügler, P.; Popp, J.; Bielak, C.R.; Bobbert, M.; Drummer, D.; Meschut, G.; Wartzack, S.; Schleich, B. Provision of cross-domain knowledge in mechanical joining using ontologies. Prod. Eng. 2022, 16, 327–338. [Google Scholar] [CrossRef]
Figure 1. (a) Flow curves of the material used for the numerical simulation. The flow curve of DP600 was derived from the uniaxial tensile test in the rolling direction and extrapolated using the Swift [22] strain hardening model. The flow curve of EN AW-6014-T4 was derived from the bulge test and extrapolated using the Hockett–Sherby [24] strain hardening model. (b) Mechanical properties of the used materials.
Jmmp 06 00122 g001
Figure 2. Illustration of the pin extrusion process and relevant process parameters.
Jmmp 06 00122 g002
Figure 3. Illustration of the direct pin pressing joining strategy.
Jmmp 06 00122 g003
Figure 4. Relevant parameters of the FE-Simulation of the pin extrusion process as well as the FE-model design with the initial dimensions.
Jmmp 06 00122 g004
Figure 5. The comparison of the experimentally measured pin heights and punch penetration depths with the pin heights and punch penetration depths determined with the described numerical simulation. Both data sets were fitted with a 2nd grade polynomial to ensure better comparability.
Jmmp 06 00122 g005
Figure 6. Comparison of the effective plastic strain with the microhardness measurement of a pin with a height of 2 mm and a diameter of 1.0 mm.
Jmmp 06 00122 g006
Figure 7. The relevant parameters of the FE-simulation of the direct pin pressing process as well as the FE-model design with the initial dimensions.
Jmmp 06 00122 g007
Figure 8. (a) The comparison of the geometric properties of a direct pin pressing joint using a micrograph of a pin with a height, h, of 1.38 mm from a sheet of DP600 with a thickness of t0 = 1.5 mm and an aluminium joining partner of EN AW-6014-T4 with a thickness of t0 = 1.5 mm, and the results of the numerical simulation with corresponding parameters. (b) Numerically determined and experimentally measured force-displacement curves for direct pin pressing.
Jmmp 06 00122 g008
Figure 9. The comparison of a low and high friction coefficient µV (c.f. Table 1) between the upper upsetting tool and aluminium joining partner.
Jmmp 06 00122 g009
Figure 10. Pearson correlation coefficients showing the impact of varying input parameters on pin joint properties.
Jmmp 06 00122 g010
Figure 11. The comparison of a low and high friction coefficient µI (c.f. Table 1) between the punch and steel blank during pin extrusion.
Jmmp 06 00122 g011
Figure 12. Property distributions and failure probability of pin joint characteristics.
Jmmp 06 00122 g012
Figure 13. Property distribution of pin joint characteristics based on the second robustness analysis.
Jmmp 06 00122 g013
Table 1. Uniformly distributed input parameters.
Input ParameterA.UnitSpaces
min.max.
Pin extrusion
Friction punch/
primary sheet
μ I 0.050.25
Friction die/
primary sheet
μ I I I 0.050.25
Friction primary sheet/blank holder μ I V 0.050.25
Pre-straining
primary sheet
c I % *010
Pin joining
Friction primary/secondary sheet μ I I 0.050.25
Friction secondary sheet/upsetting tool μ V 0.050.25
Pre-straining
secondary sheet
c I I % *010
* Of initial sheet thickness.
Table 2. Gaussian distributed input parameters.
Input ParameterA.UnitDistribution
x ¯ ± σ ± 3 σ
Materials
Thickness
primary sheet
t I mm1.50.0330.1
Thickness
secondary sheet
t I I mm1.50.0330.1
Tensile strength primary sheet T S I MPa64516.6755
Tensile strength secondary sheet T S I I MPa23511.6735
Table 3. Overview of the initial and adapted parameter spaces for the robustness analysis.
Input ParameterInitial Parameter SpaceAdapted Parameter Space
μ I (punch and primary
joining part)
μ I = 0.05–0.25 μ I = 0.05–0.15
μ I I I (die and primary
joining part)
μ I I I = 0.05–0.25 μ I I I = 0.15–0.25
c I (pre-straining primary
joining part)
c I = 0–10% c I = 0–5%
Publisher’s Note: MDPI stays neutral with regard to jurisdictional claims in published maps and institutional affiliations.