Article

Boosting Productivity of Laser Powder Bed Fusion for AlSi10Mg

1
Department of Engineering “Enzo Ferrari”, University of Modena and Reggio Emilia, Via Vivarelli 10, 41125 Modena, Italy
2
Ferrari S.p.A., Via Abetone Inferiore 4, 41053 Maranello, Italy
*
Author to whom correspondence should be addressed.
J. Manuf. Mater. Process. 2022, 6(5), 112; https://doi.org/10.3390/jmmp6050112
Submission received: 11 August 2022 / Revised: 21 September 2022 / Accepted: 27 September 2022 / Published: 30 September 2022

Abstract

:
The Laser Powder Bed Fusion (L-PBF) process is recognized for high-end industrial applications due to its ability to produce parts with high geometric complexity. If lightweighting is one of the main strengths of L-PBF, a weakness is still the trade-off between high mechanical properties and competitive productivity. This objective can be targeted through a fine tuning of the process parameters within the manufacturing window. The paper pursues the combined optimization of part quality and process productivity for AlSi10Mg by going beyond the commonly used approach based solely on volumetric energy density. The effects of hatch distance and scan speed on the two targets were analyzed in detail. The best results were achieved by the adoption of a high scan speed and a low hatch distance, with notably different outcomes for nearly the same energy density.

1. Introduction

Laser-Powder Bed Fusion (L-PBF) is one of the most successful technologies for the production of metal parts by additive manufacturing (AM) [1]. The construction method that adds material, instead of removing it, makes complex shapes feasible. The resulting design freedom is one of the main reasons why L-PBF is gaining interest in industrial applications [2]. The “complexity for free” advantage of L-PBF process gives designers the opportunity to completely rethink the component, for example with the goal of weight reduction or interfunctionality.
Among all of the alloys, aluminium is one of the preferred materials for the L-PBF process because a good compromise between mechanical properties and low weight can be achieved. For this reason, aluminium is the best choice for industrial applications in aerospace and the automotive industries [3].
AlSi10Mg is one of the most studied alloys for AM thanks to its low cost, light weight and good weldability. This is favoured by the presence of Si, while the addition of elements such as Mg and Cu plays an important role in age hardening, thanks to the precipitation of secondary phases [4,5]. Furthermore, high mechanical properties are achievable even without heat treatment, since the rapid solidification of the molten material produces a fine cellular microstructure.
Moreover, many studies have reported the possibility of printing AlSi10Mg parts with a density higher than 99% [4,6,7,8,9,10]. However, despite the high relative density, the presence of internal porosity or defects adversely affects the static and dynamic mechanical properties [6,9,10,11,12,13]. Therefore, densification of printed AlSi10Mg parts is still one of the main focuses of AM research.
The main defects can be classified in two types: spherical porosity and irregular-shaped porosity (known as lack of fusion defects). For the first type, there are several causes, such as improper powder packing on the build plate [14], internal gas porosity in virgin powder [13], trapping of the shielding gas (typically Argon or Helium) in the melt pool, or moisture on the powder surface [15,16]. Lack of fusion is strongly related to the optimization of the process parameters [8,13,17,18]. Namely, if the laser power is too high or the scan velocity and the layer thickness are too low, the energy density applied to the powder bed increases. The temperature of the melt pool increases until the evaporation point of the low melting elements contained in the alloy is reached, resulting in spherical defects in the printed part [13,16,19]. On the other hand, insufficient energy density leads to defective re-melting of the previous layers or low overlap between adjacent traces [18]. Therefore, there is a risk of insufficient bonding, and a lack of fusion defects may occur.
For parameter optimization, the volumetric energy density (VED) [4,20] is mainly used, which is defined in Equation (1) [21]:
VED = P v · h · t   [ J mm 3 ]
where:
  • P is the laser power [W]
  • v is the scanning speed [mm/s]
  • h is the hatch distance [mm]
  • t is the layer thickness [mm]
Due to its high reflectivity and thermal diffusivity, aluminium requires a high incident energy to ensure proper melting of the powder [22]. Therefore, a high laser power is generally needed. In this context, K. G. Prashanth et al. observed that low laser power has a detrimental effect on mechanical properties due to increasing porosity [23].
In addition, the energy density decreases if the scanning speed or the hatch distance are too high, which leads to problems of insufficient bonding between consecutive layers and adjacent scanning tracks. As a result, lack of fusion defects may occur, leading to a reduction in part density and the presence of stress concentration zones [6,16,19,24,25].
Many studies have also reported that a low scan speed is preferable as it leads to the minimization of porosity and defects in general, as well as of the balling phenomenon [6,26,27,28,29,30]. Obviously, from a productive point of view, the decrease in the scan speed is inversely proportional to the production time, resulting in an increase in production costs. Therefore, a trade-off must be made between part quality and build time.
In this work, different combinations of process parameters were studied to evaluate their influence on the quality of the printed part in terms of defects, relative density and mechanical properties. Specifically, variation of hatch spacing and scan speed were studied in terms of their effects on metallurgical quality, while attempting to keep the process competitive from a productive standpoint as well.

2. Materials and Methods

SLM Solution GmbH supplied a gas atomized AlSi10Mg powder, with a nominal normal distribution from 20 to 63 µm (D10 = 25 µm, D50 = 40 µm, D90 = 65 µm) and a nominal chemical composition as listed in Table 1 [31]. AlSi10Mg cubes and tensile specimens were printed by using an SLM 500 machine (SLM Solution GmbH, Germany). The system was equipped with four overlapping IPG fiber lasers capable of operating simultaneously with a maximum power of 400 W for each laser and an estimated beam focus diameter of between 80 and 115 microns. During the process, Argon gas with a purity level of about 99.998% flowed into the build chamber to ensure an inert environment with an oxygen content less than 0.1%, reducing the risk of oxide formation inside the printed parts.
A design of experiment (DOE) was prepared to evaluate the effects of the process parameters on the mechanical properties of the AlSi10Mg specimens. The variables considered were the hatch distance h and the scanning speed v, while the laser power P and the layer thickness t were kept at 370 W and 60 µm, respectively. The scanning strategy chosen for the experiments was a strip exposure. The build plate was heated to 150 °C during the process to reduce the internal stresses in the printed samples. The process window considered in this study is illustrated in Table 2. In detail, the hatch distance h was increased from 0.06 to 0.24 mm with a growth step of 0.02 mm, while the scan speed v increased from 800 mm/s to 2000 mm/s with steps of 100 mm/s.
The adoption of a hatch distance that is considerably bigger than the spot diameter takes into account that the melt pool width is significantly larger than the laser spot, especially at low scan speeds. The values within each cell indicate the volumetric energy density for each pair of variables calculated using Equation (1). Given the large number of combinations, the VED range was narrowed in the first step of the analysis by considering only the values around 38 J/mm3 (bold cells in Table 2), with a maximum and a minimum of 45.3 J/mm3 and 30.2 J/mm3, respectively. Contour parameters were kept constant for all experiments: power 300 W, scan speed 600 mm/s.
The second step of the analysis focused on finding optimal process parameters that can ensure high mechanical properties while increasing the build rate. The reduction in build time leads to a decrease in production costs, making the L-PBF process more competitive from a productive point of view. In this regard, the laser exposure time was evaluated by calculating the build rate, as shown in Equation (2).
B u i l d   r a t e = v · h · t   [ mm 3 s ]
Therefore, the parameter combinations considered in the second step of the experiments (cells not in bold) were mainly placed in the lower-right part of the matrix, where the exposure time decreases. The values between brackets in Table 2 indicate the build time (exposure term only) in percent when the slowest parameter set is taken as reference. While in step 1 a reduction of the exposure time to 50% was considered, in step 2 the analysis is extended to reach a cut down to 32%. The total build time is obtained by summing the exposure time and the recoating time. As a reference for the job in which these specimens were built, the total recoating time was about 4 h, while the exposure time varied from 3.3 to 10.5 h, respectively, in the fastest and slowest conditions. Approximately 0.5 h are required for the machine to warm up and another 4–5 h for it to cool down before the chamber can be opened. The total time for the machine therefore ranges between 12 and 19 h in the set-ups considered. If a job with support structures is considered, the exposure time typically weighs between 27 and 55% of the total build time, depending on whether fast or slow parameter combinations are chosen.
Three tensile specimens (built with the axis parallel to the Z direction) and a 15 × 15 × 15 mm3 cube were printed for each parameter set, without using support structures, as the geometry in Figure 1 is self-supporting. The scan vector of the laser was rotated at each subsequent layer according to the standard stripe building method. All samples underwent standard stress relief of 2 h at 300 °C followed by air quenching [31]. The static mechanical properties were evaluated by tensile tests at room temperature (according to the standard UNI EN ISO 6892-1) of non-machined (NM) specimens, as shown in t 1. for each process set-up, three samples were tensile tested. The tests were carried out under strain control on the Galdabini Quasar 200 machine equipped with a 200 kN load cell. The absolute ultimate tensile strength (UTS), yield stress (YS) and elongation values cannot be disclosed due to industry policy. Therefore, the results were normalized and expressed as a percentage of the mechanical properties reported on the supplier’s material datasheet and considered equal to 100 in this study [31].
Density was measured by using a hydrostatic balance (Gibitre Instruments, Electronic Densimeter Resol2.0) based on the Archimedes method. The density (g/cm3) is then calculated as in Equation (3), where mair and mwater are the weight of the sample in air and in distilled water, respectively.
ρ s a m p l e = ρ w a t e r   ·   m a i r m a i r m w a t e r   [ g / cm 3 ]
Porosity was evaluated by image analysis on cube sections parallel to the building direction. The sample sections were polished (using the Tegramin-30 automatic polishing machine, Struers Inc., Cleveland, OH, USA), working down to a fine silica suspension of 0.25 µm. Thanks to image analysis it was possible to quantify the presence of defects and insufficient fusion for each combination of process parameters. In this way, each combination could be distinguished not only in terms of mechanical properties, but also in terms of the metallurgical quality of the printed part, i.e., the absence of residual pores or defects.

3. Results and Discussion

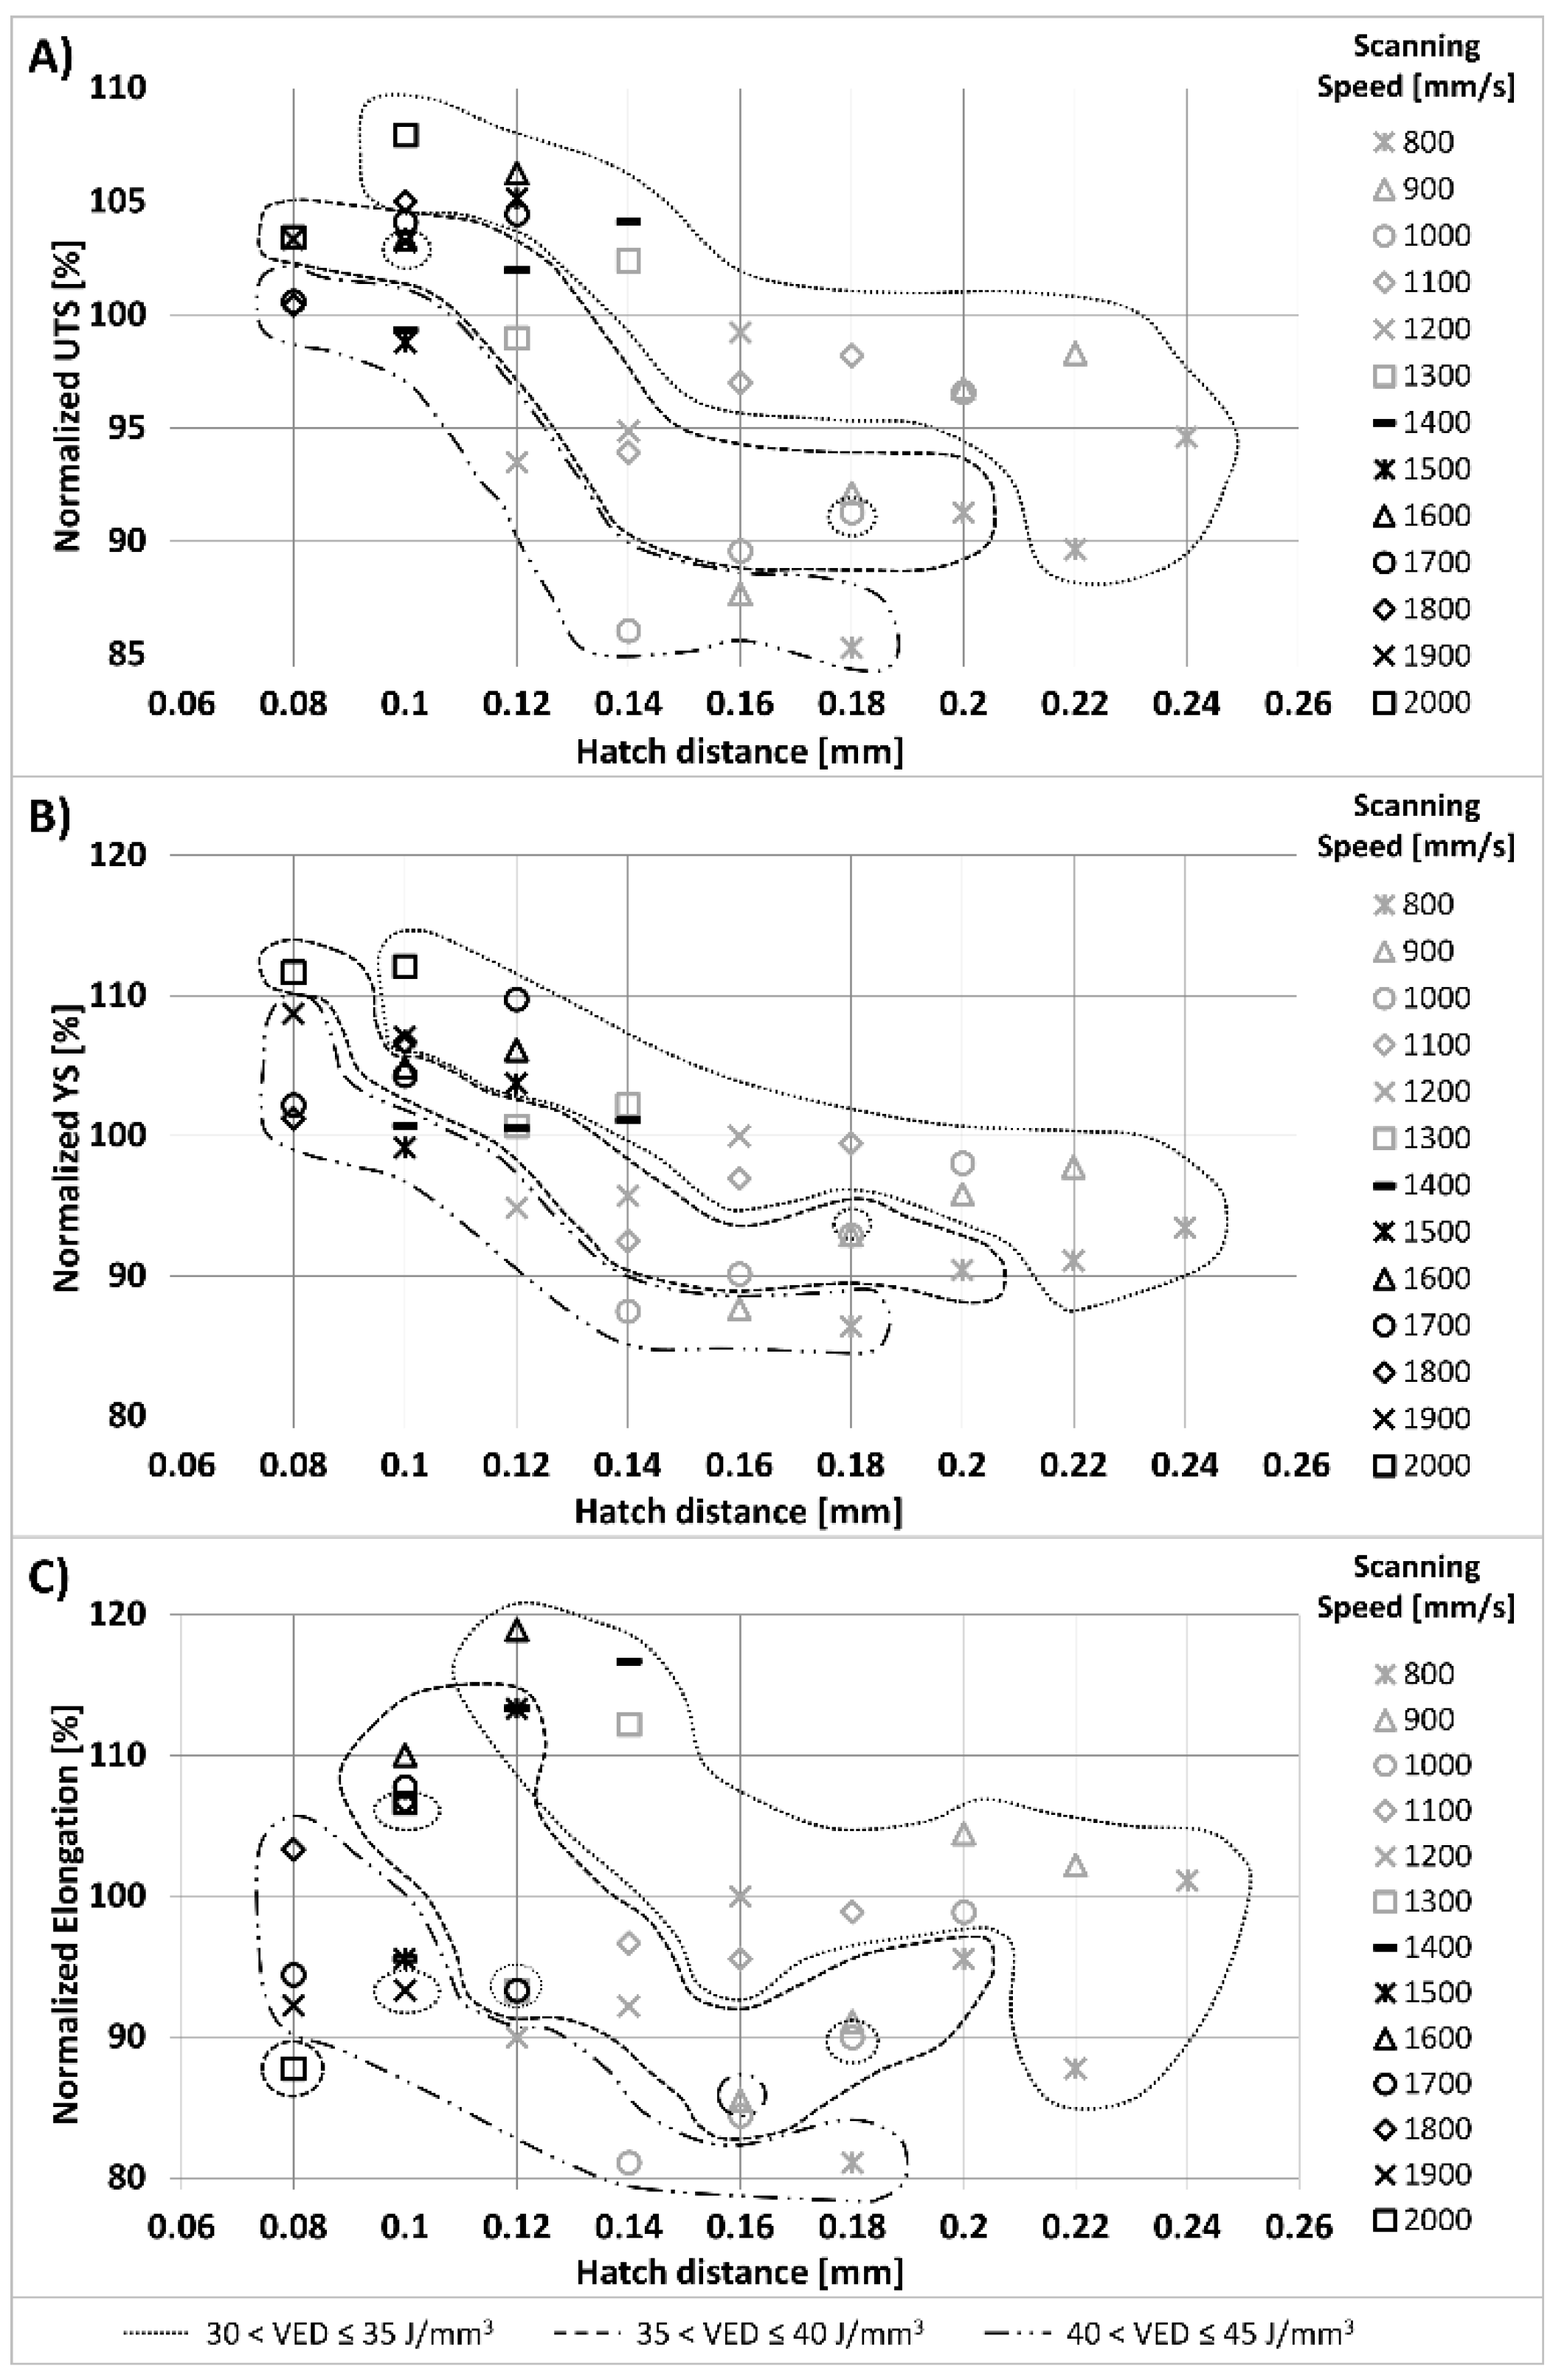
First, the specimens built with the process parameters from step 1 (bold cells in Table 2) were tested. The results are shown in the graphs in Figure 2.
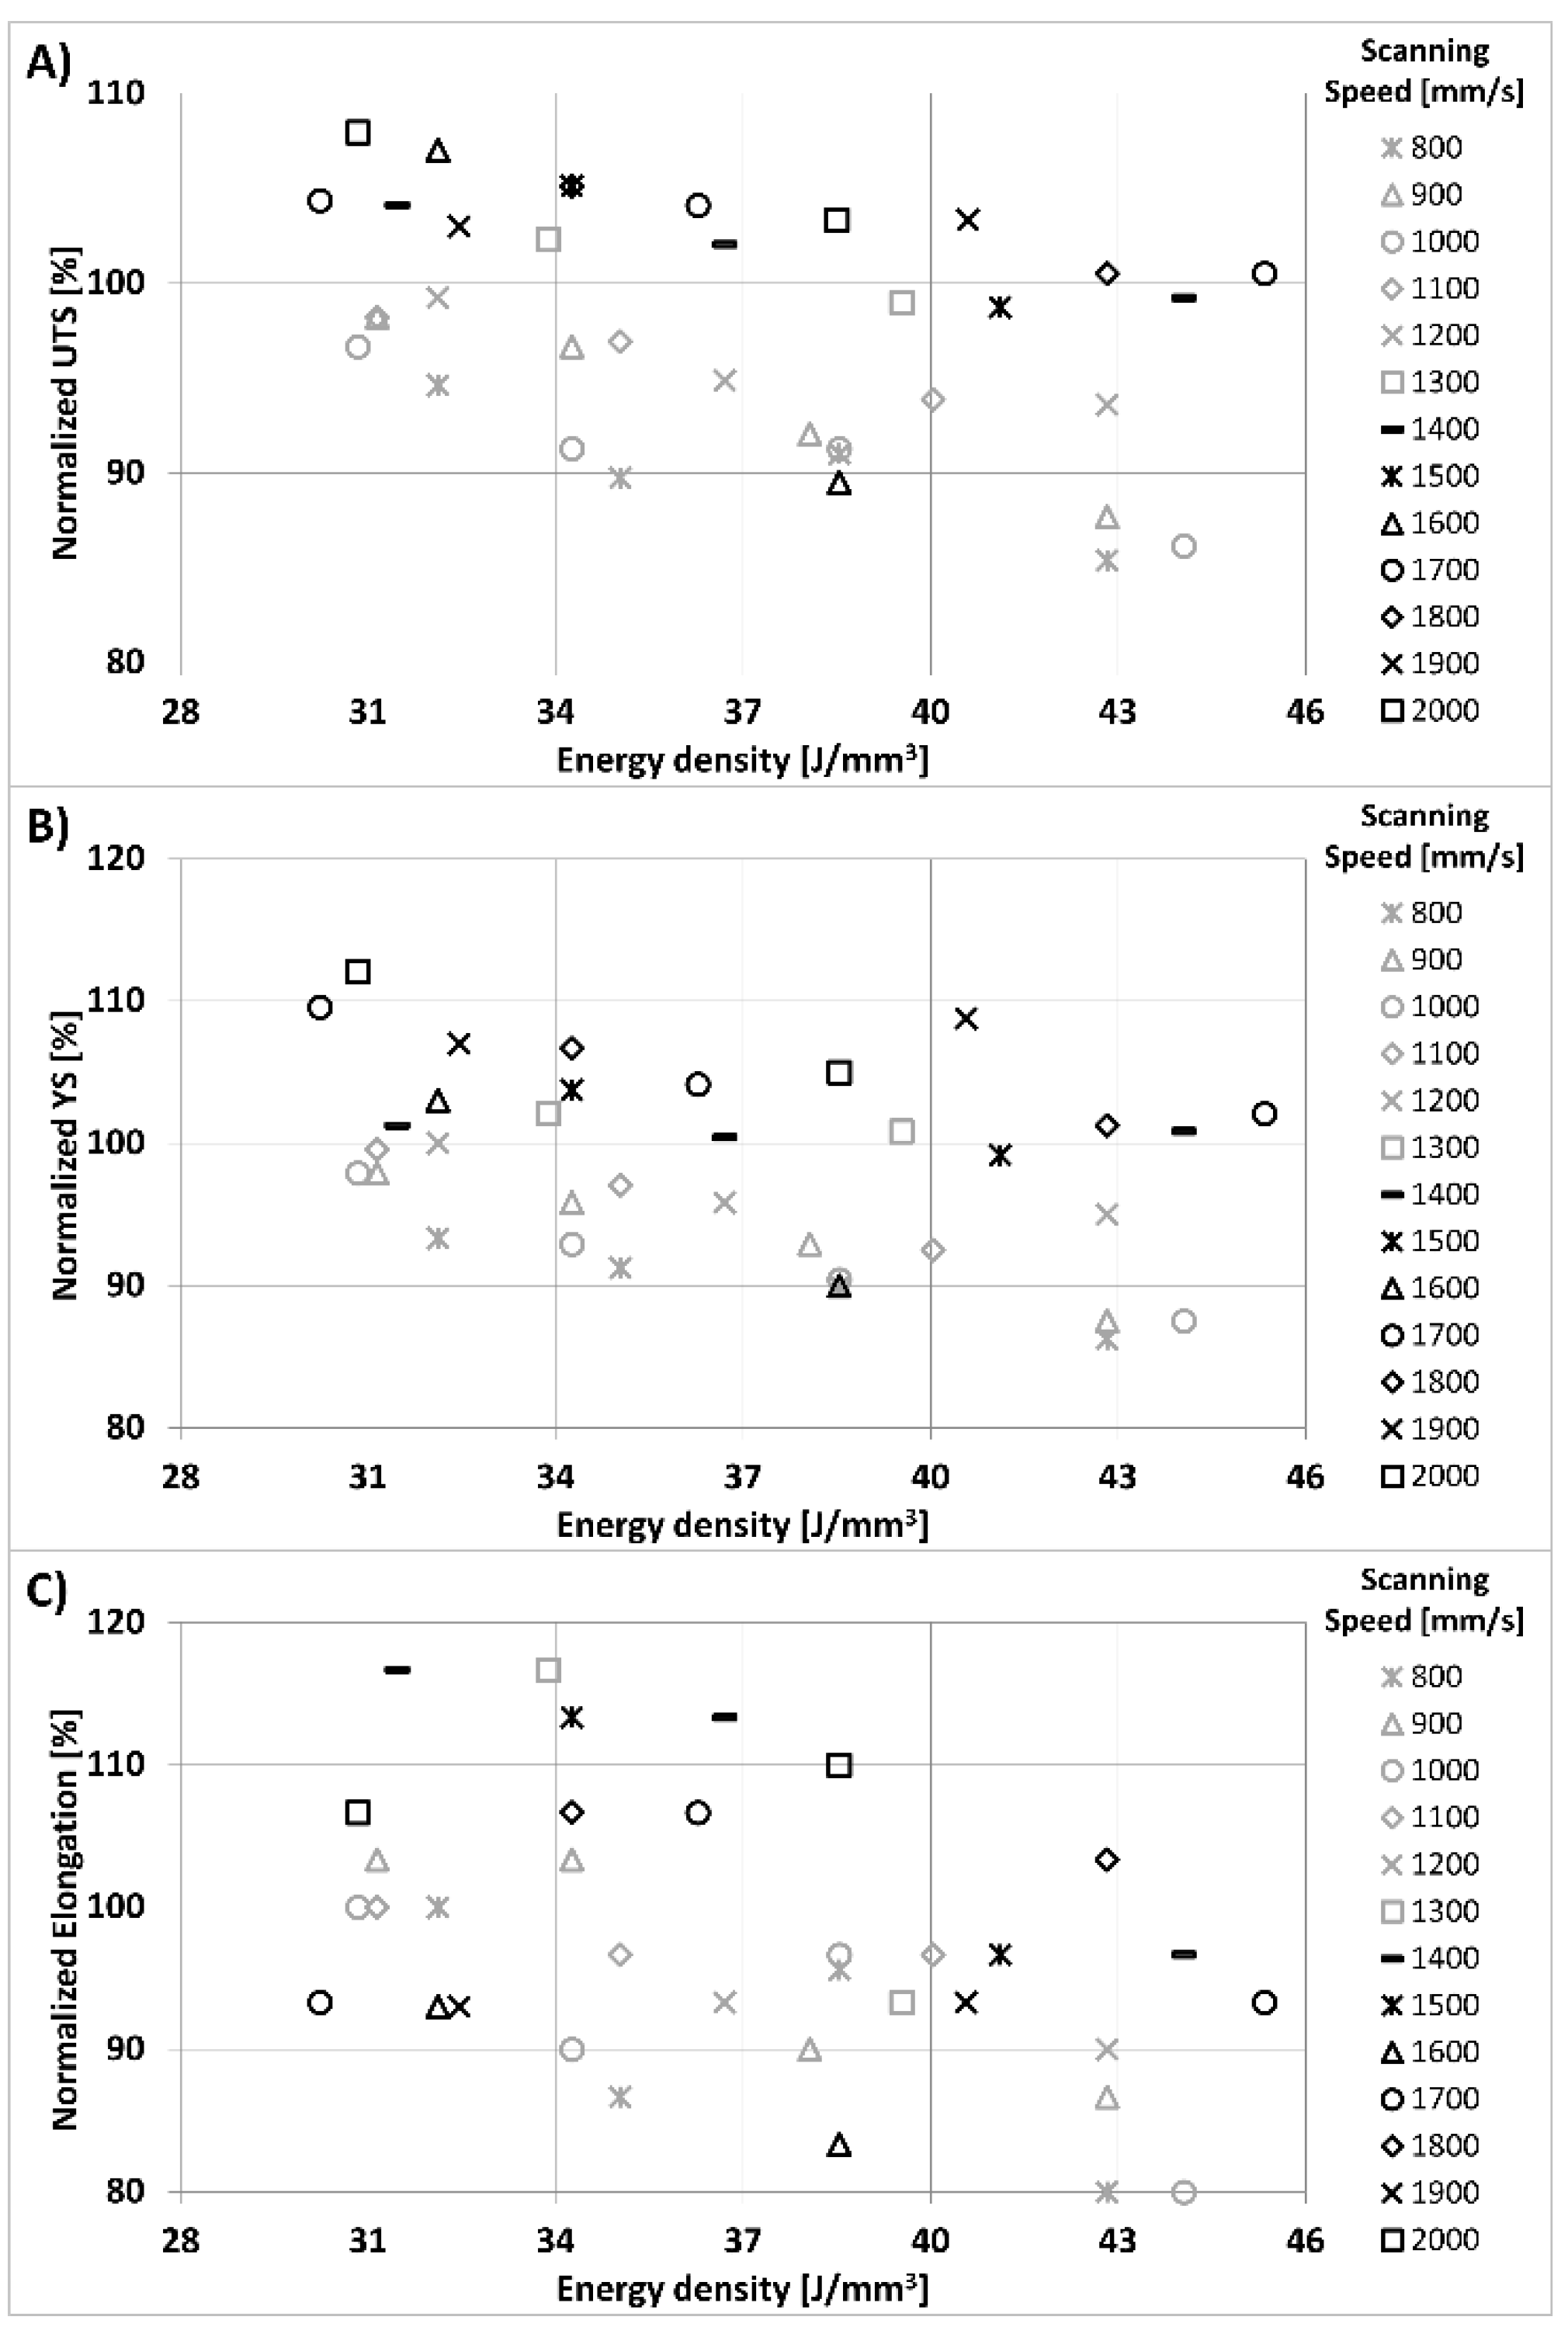
In general, it can be seen that the poorer results are related to the application of high hatching distances and low scanning speeds corresponding to the first three rows of Table 2 (v = 800–900–1000 mm/s). On the contrary, higher mechanical properties were achieved by using medium/low hatch spacing and high scan speeds (above 1300 mm/s). Figure 3 shows how the tensile properties obtained in step 1 are related to VED.
A slight decrease in mechanical properties with the increase in VED can be noticed. However, careful analysis of the results by comparing the graphical representations in Figure 2 and Figure 3 suggests that the effect of VED on the change in mechanical properties is less pronounced than that of the process parameters. The hatched areas in Figure 2 indicate domains in the graph that relate to three classes of energy density:
  • 30 < E ≤ 35 J/mm3
  • 35 < E ≤ 40 J/mm3
  • 40 < E ≤ 45 J/mm3
Using strength as an example, it can be seen in Figure 2A that within each region of nearly constant VED, marked variations of UTS are observed as the hatch distance is varied. Conversely, when the hatch distance is kept constant and low, in the left area of the plot, a decrease in VED has a less pronounced effect on UTS. Similar considerations apply to YS, as shown in Figure 2B.
For strains, the results are more scattered and the effect of the energy density is less clear.
As a general result, the best mechanical properties were obtained for an energy density between 30 and 40 J/mm3 and a hatch spacing between 0.08 and 0.12 mm. With these settings, it was possible to produce specimens whose UTS, YS and elongation were higher than the nominal reference value.
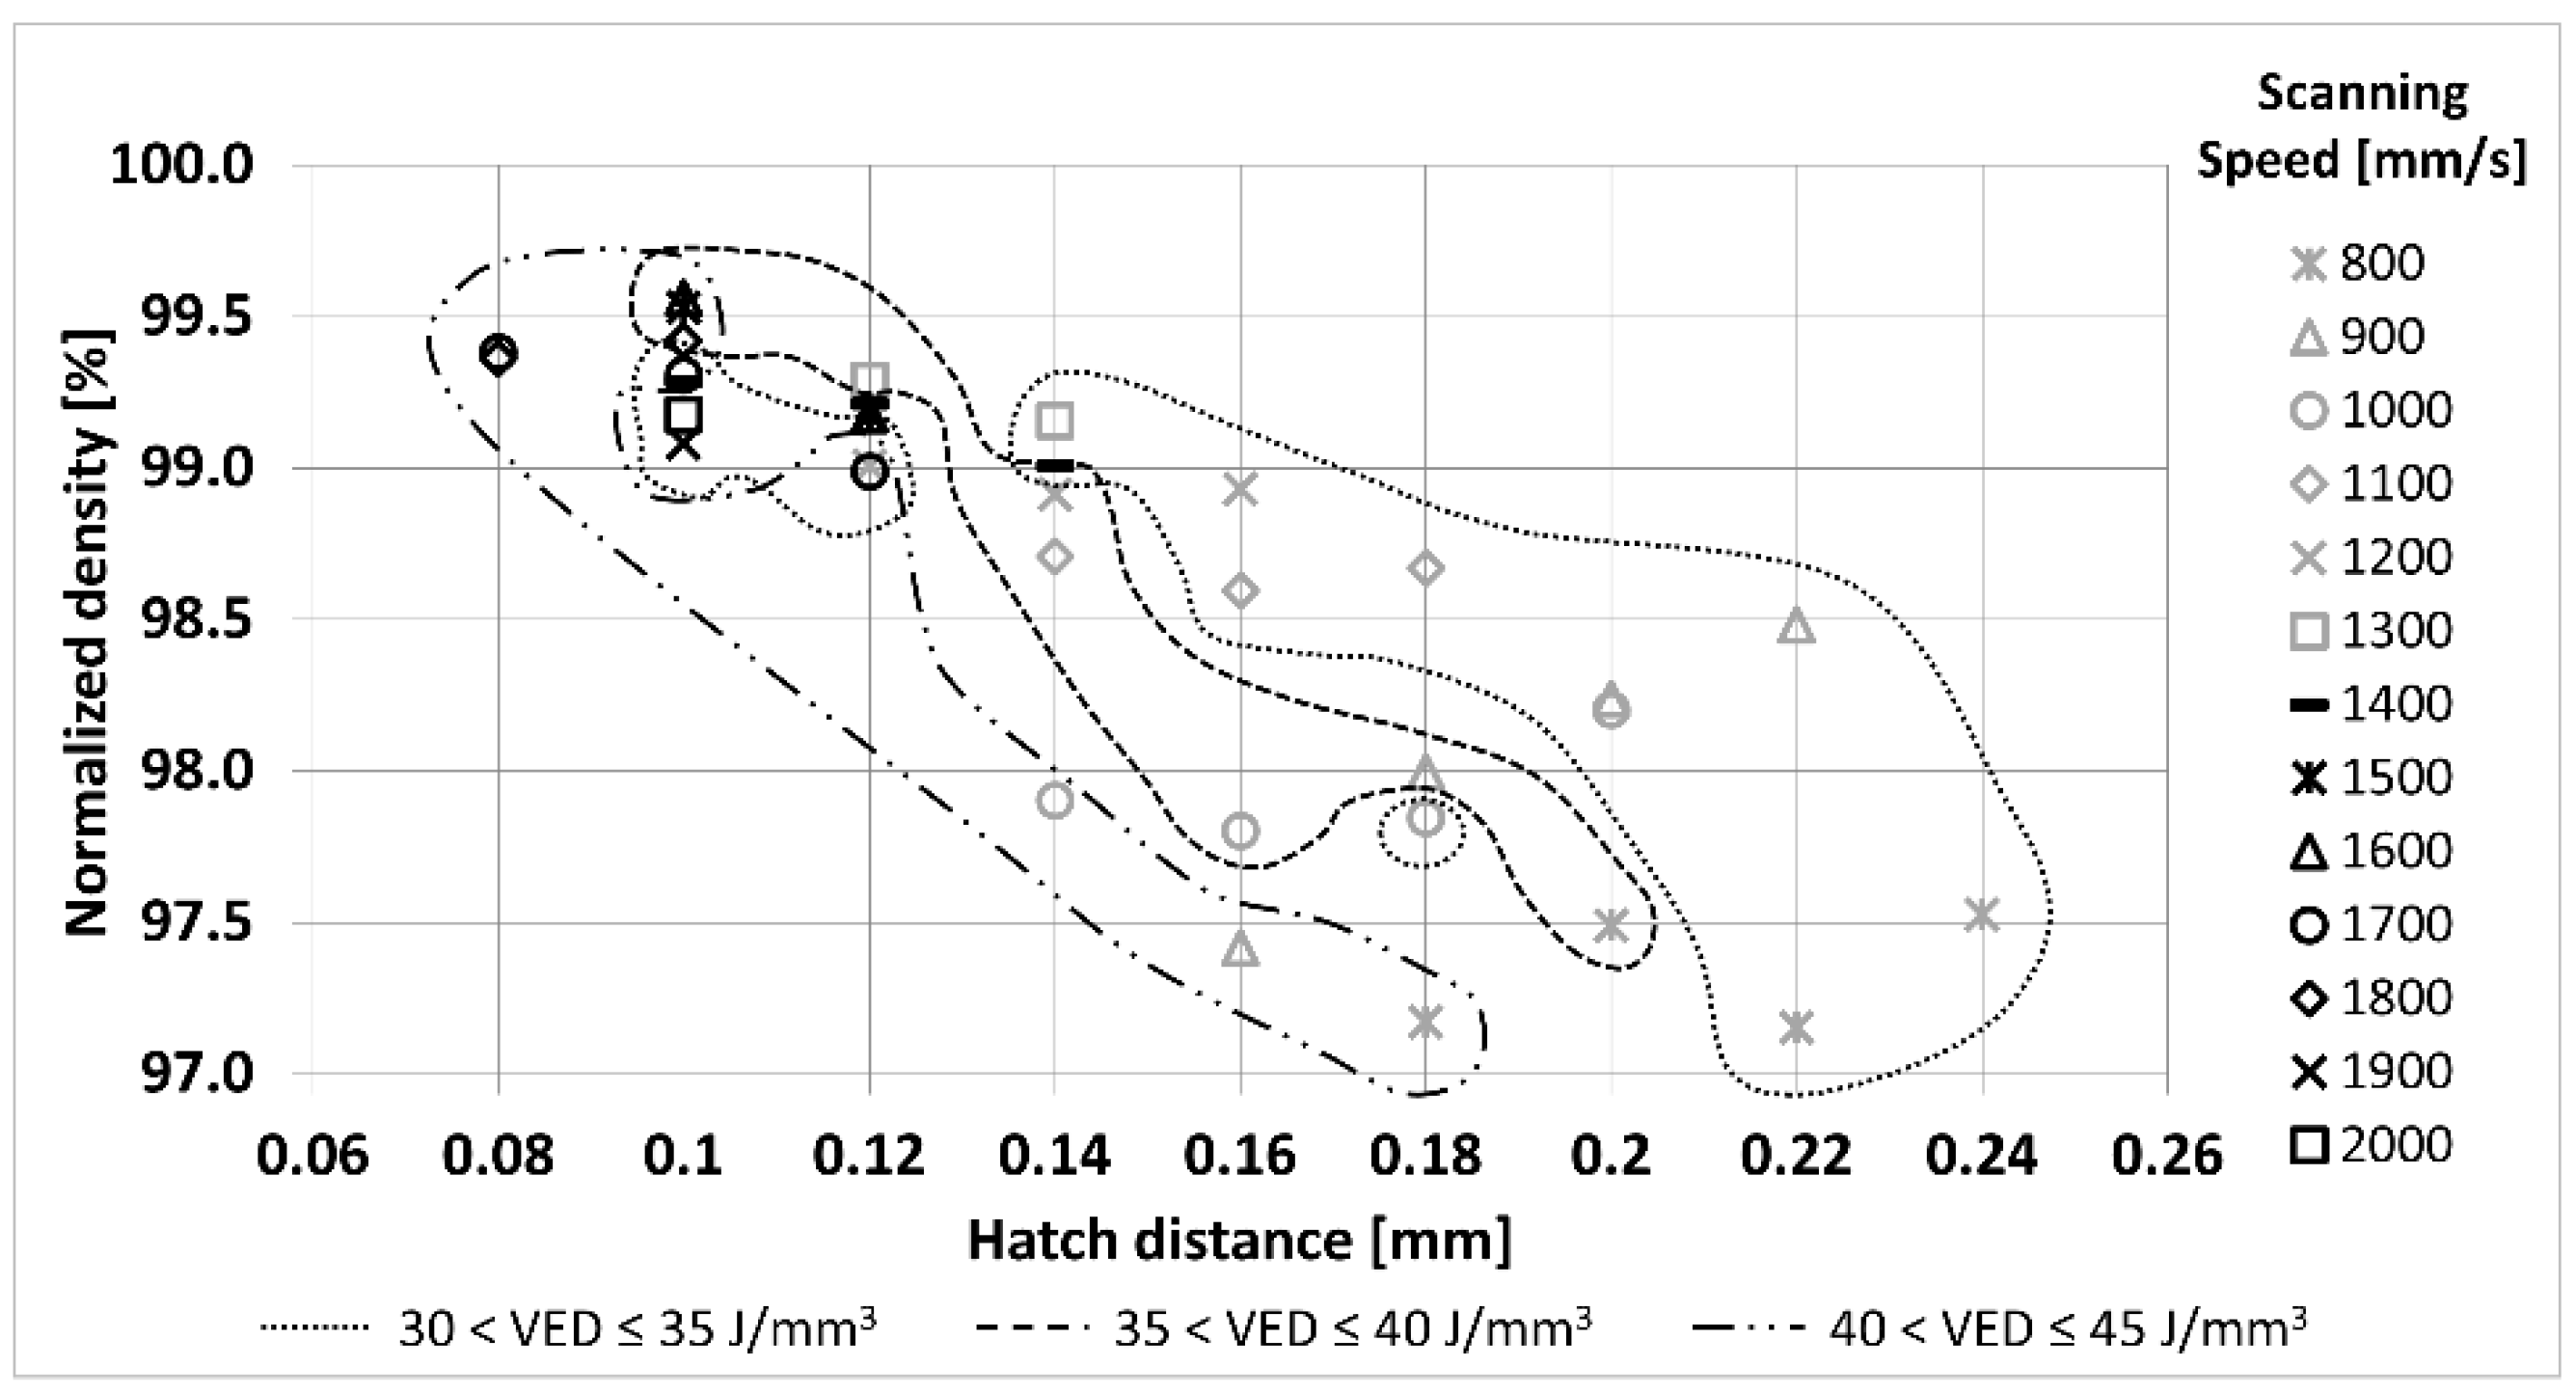
For each pair of parameters, density was measured using the Archimedes method, as described in Section 2. The objective of this analysis was to obtain a first overview of the internal quality of the printed parts and to evaluate possible correlations between density and process parameters. The results are plotted in Figure 4, which shows a similar trend as for the tensile properties: the highest density corresponds to the combinations of high scanning speed (1700–1800 mm/s) and low hatch distance (0.08–0.10 mm). Beyond that, the results become more inconsistent at scan speeds between 800 and 1000 mm/s. When the density measurements are plotted against VED, as in Figure 5, there is a large scatter, and there is no obvious effect of energy density on densification.
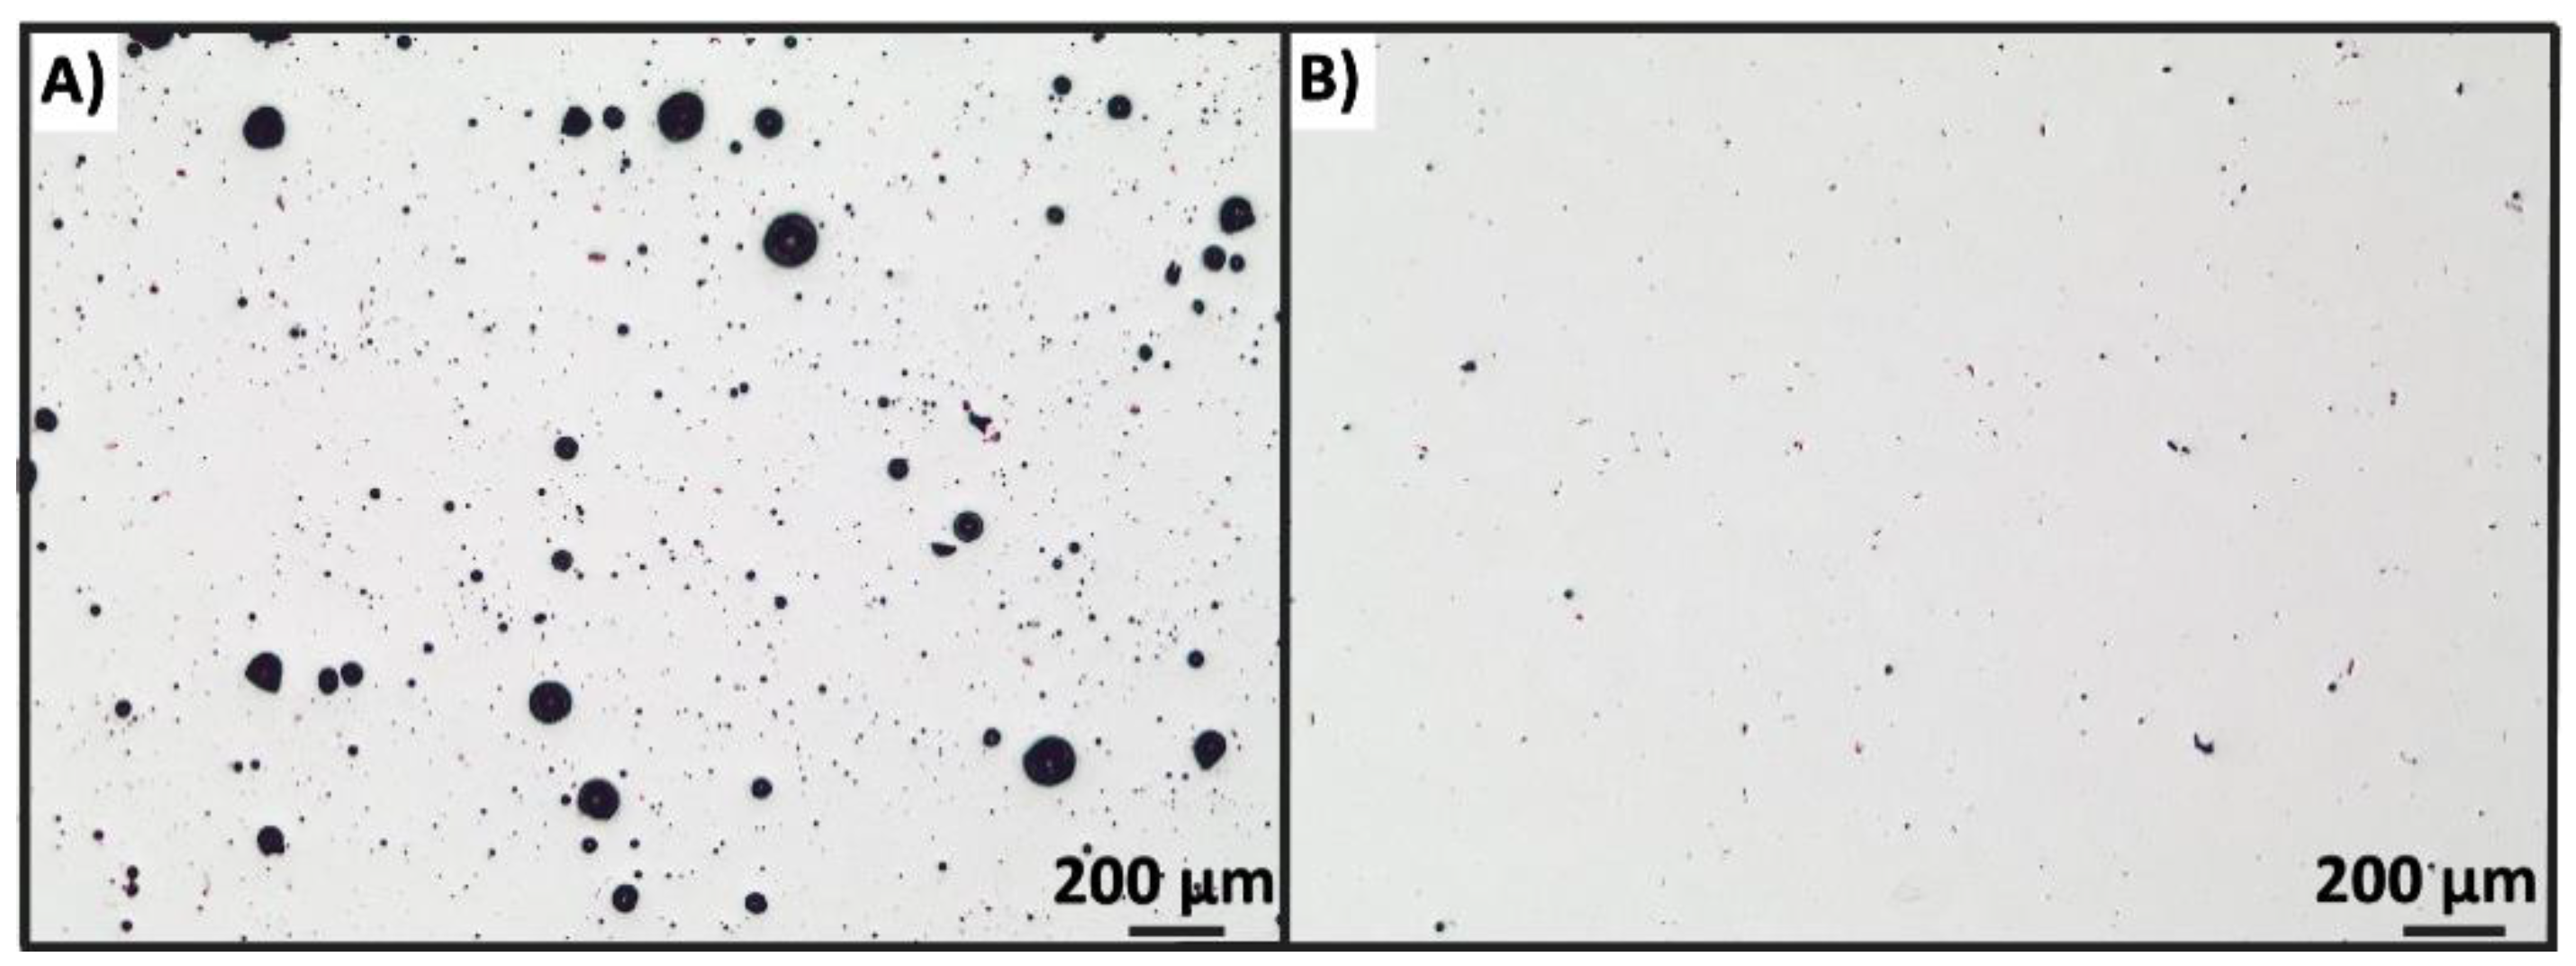
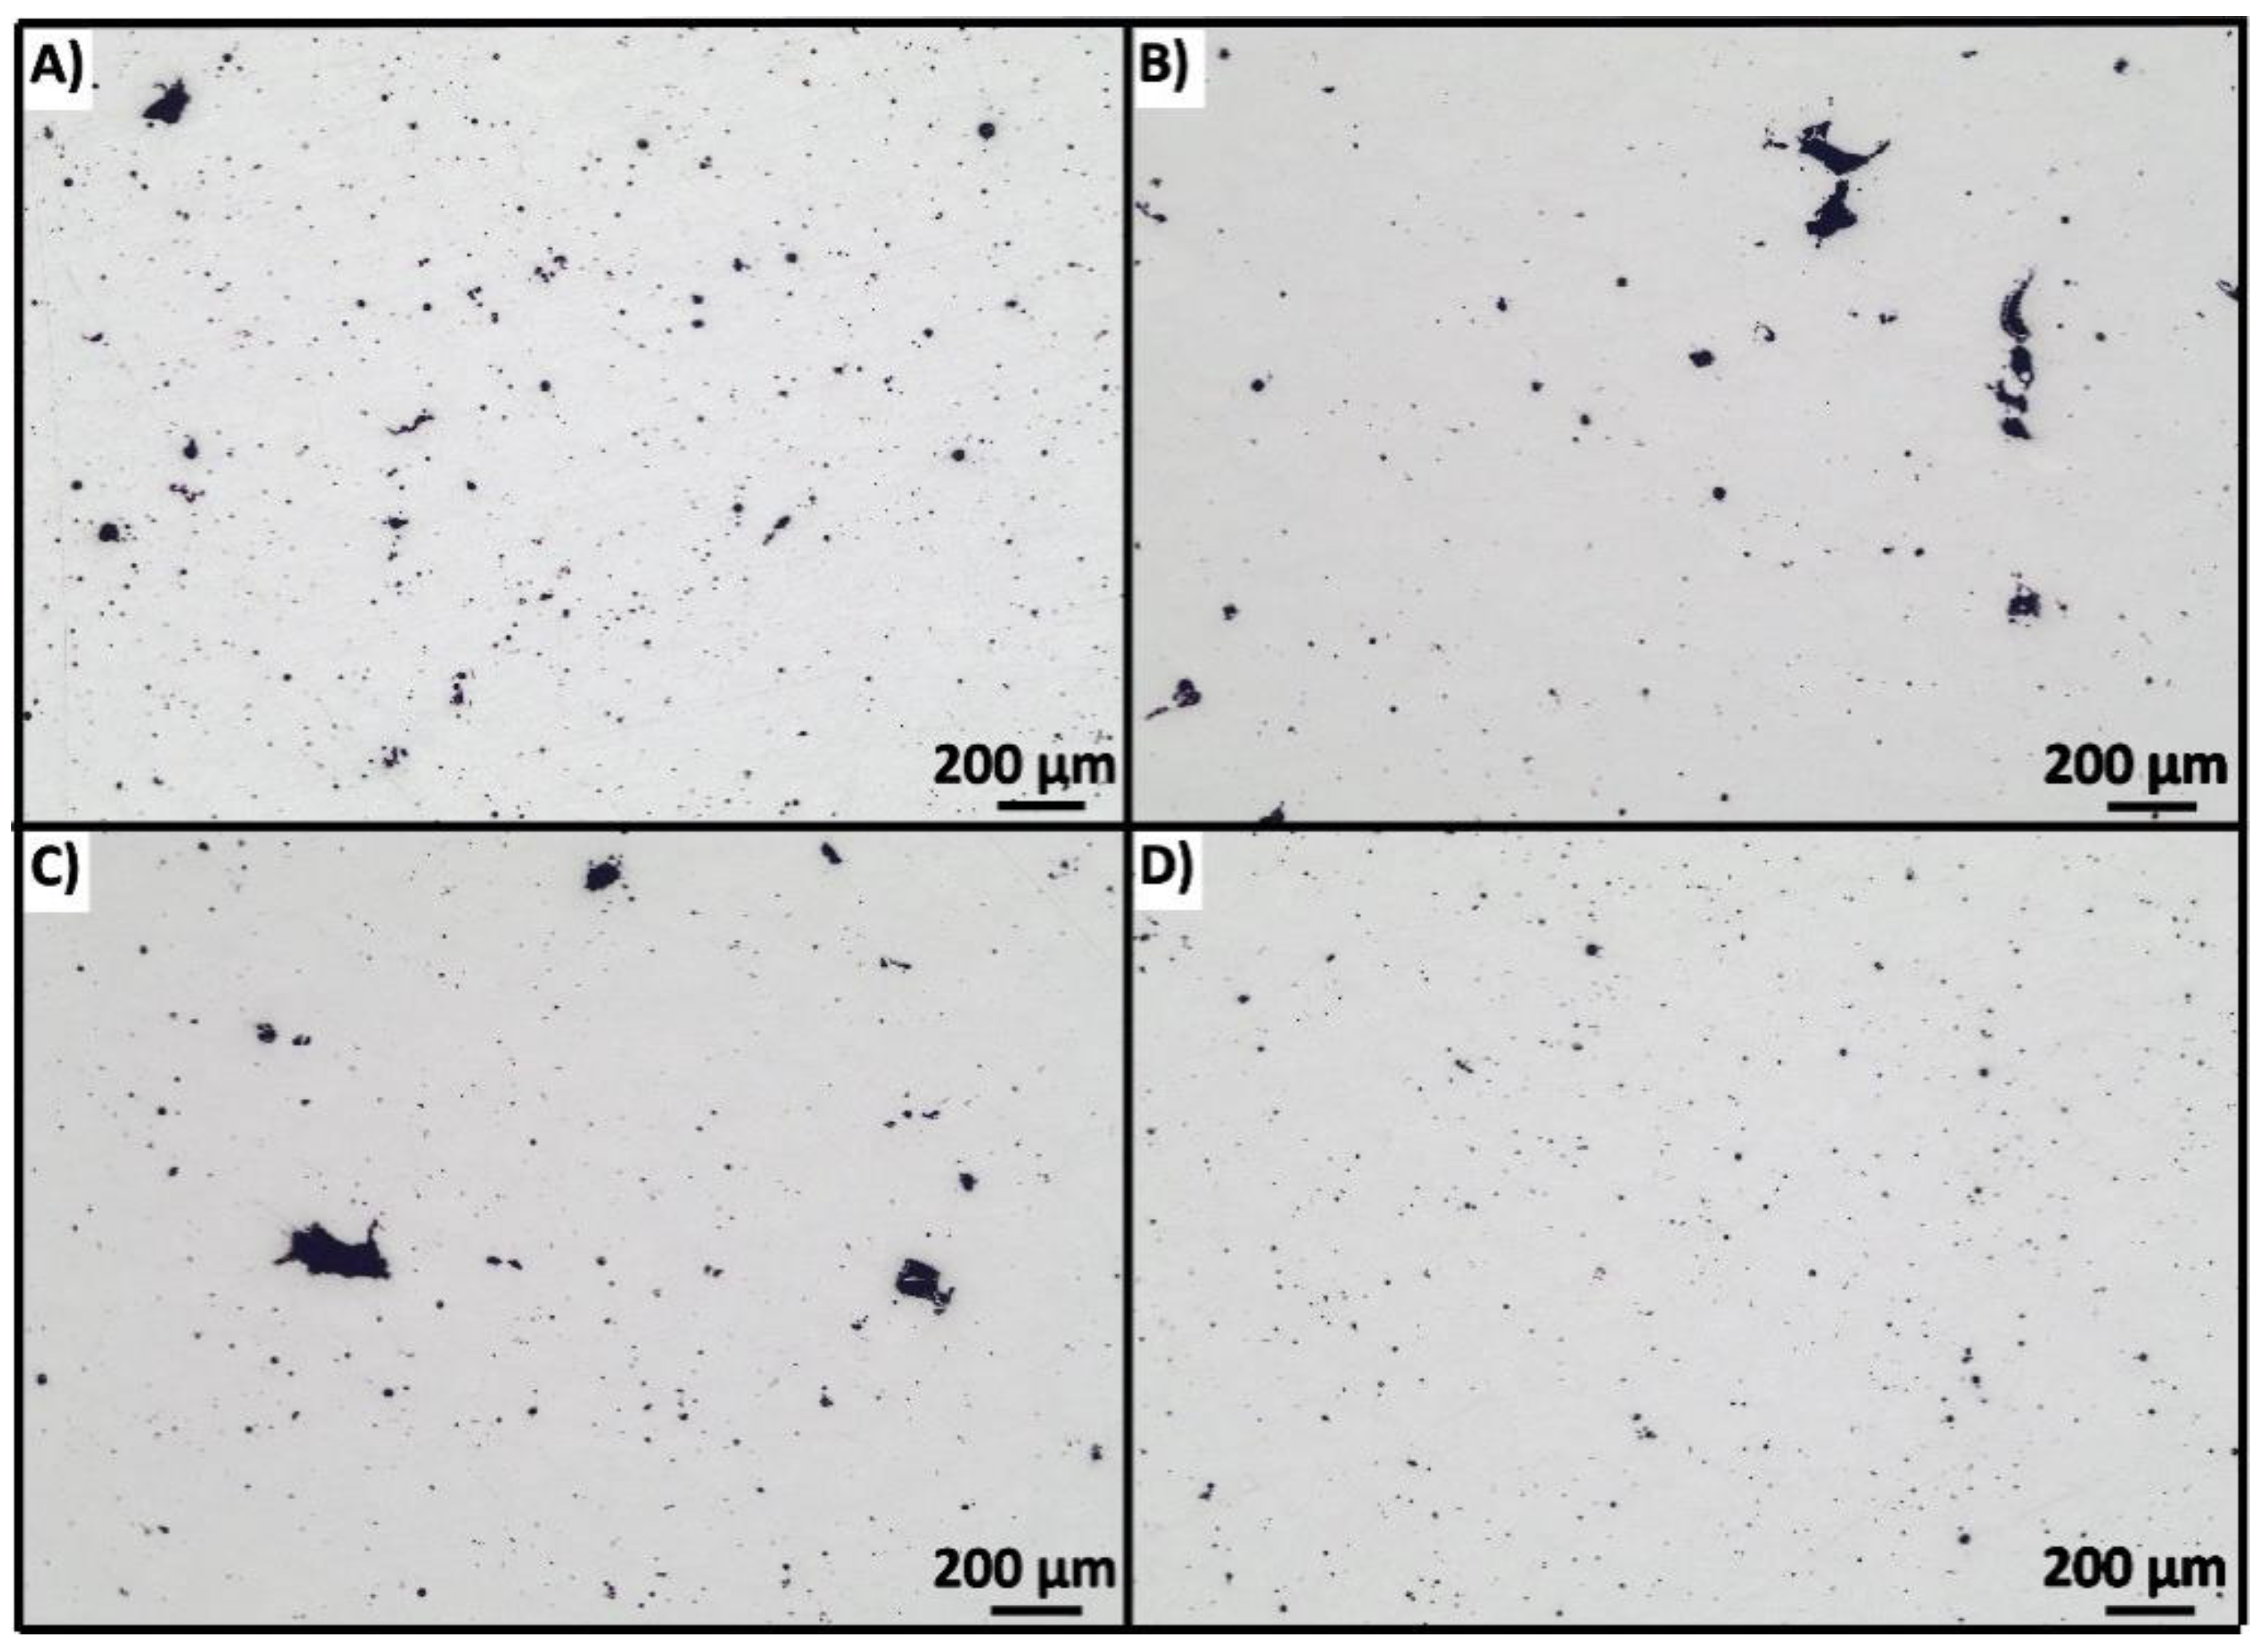
The absence of pores and defects in the specimens was checked by image analysis. Cubes built with parameter combinations corresponding to the extremes of DOE were sectioned and polished to analyse the internal porosity and the presence of defects. Figure 6 shows the difference in terms of internal porosity between samples fabricated at a scanning speed of 800 mm/s and a hatch distance of 0.24 mm (Figure 6A) and a speed of 1800 mm/s and hatch of 0.1 mm (Figure 6B). These two experimental set-ups had almost the same energy density (32 and 34 J/mm3, respectively), but were characterised by a remarkable difference in hatch spacing that led to divergent outcomes.
As can be seen in Figure 6A, when a high hatch distance and a low scan speed were applied, spherical pores with considerable dimensions were indeed obtained. Specifically, for the sample in Figure 6A, a relative density of 98.9% was measured by image analysis (97.5% by the Archimedes method) with an average defect size of 143 µm2. In contrast, the sample in Figure 6B appears to be free of defects with a relative density of 99.7% and an average porosity size of just 20 µm2. The difference observed in these two cross sections may be due to the different thermal histories. Although the powder bed received the same energy density, the solidification mechanism differs depending on the duration of exposure to the high temperatures. When the laser moves at a low scanning speed on the build plate, the powder is exposed to a high temperature for a sufficient time to form gas porosity, with dimensions and shapes typical of keyhole melting [32,33,34]. At the same time, the hatch spacing (0.24 mm) is not narrow enough to ensure proper re-melting of the adjacent tracks. Therefore, the bubbles generated during the previous laser track have no possibility to escape and remain trapped in the already solidified metal. The use of a high scanning speed and a small hatch distance solves this problem, since no keyhole melting occurs and proper densification is guaranteed by adequate re-melting of the adjacent laser tracks. In addition to the above considerations, it should be emphasized that in neither case did printing defects occur in the form of a lack of fusion. With respect to residual porosity, VED alone seems to have only a weak correlation with the results, as already observed for mechanical properties.
The results for density and pore/defect analysis confirm what was previously stated about the mechanical properties. Therefore, the process setups that generally lead to the best quality are those listed in the lower left part of Table 2 which correspond to the use of a high scanning speed and a low hatch distance.
On the other hand, this process window is mostly characterized by long build times. As a consequence, production times and costs are generally hardly competitive. This is the main reason why in the second step of the analysis a larger number of parameter combinations were considered (corresponding to the non-bold cells in Table 2), mostly moving towards the lower-right part of the Table, in order to look for a trade-off between build time and print quality.
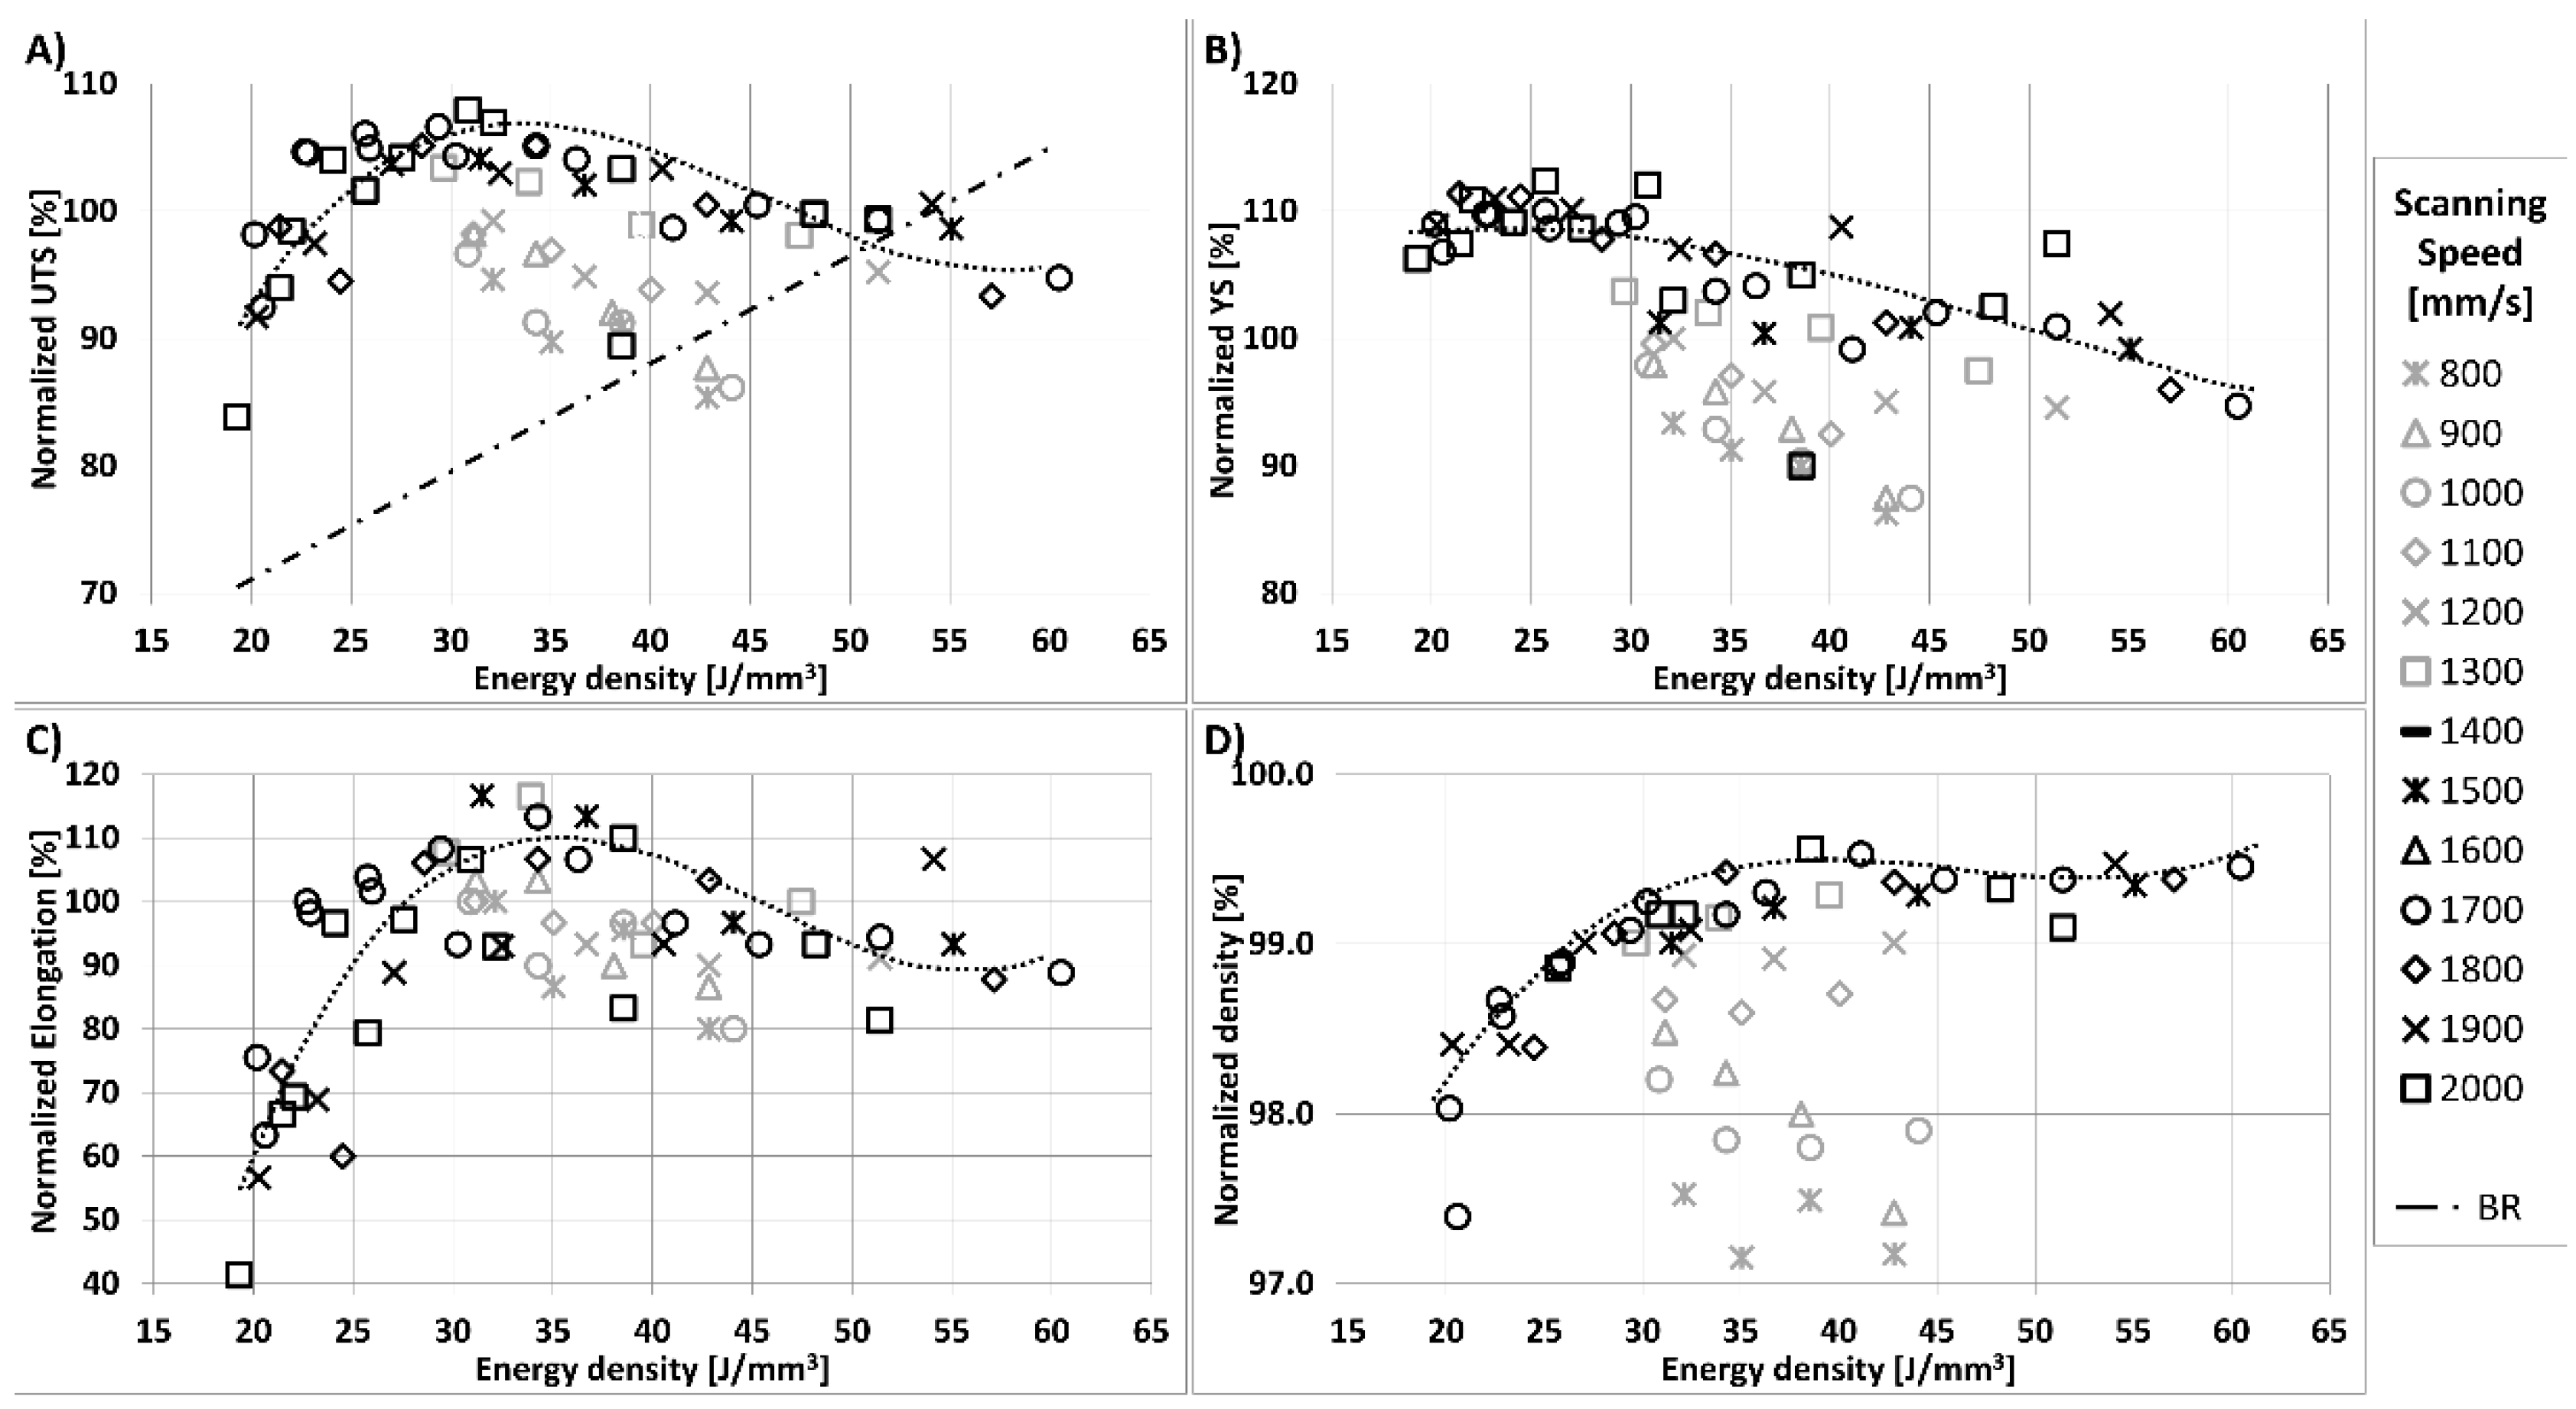
The graphs in Figure 7 show the normalized mechanical properties as a function of the incident volumetric energy density for the entire series of tests. The results of step 2 are represented along with those already shown in Figure 3 for step 1. The observed variation of mechanical properties is in complete agreement with the trend in experimental density. For the processing window considered in this study, the change in mechanical response is strongly related to the presence or absence of pores and defects resulting from the different process parameters. In contrast to what was previously discussed for step 1, the effects of energy density on mechanical properties become more apparent when it is varied over a wider range. The trend is nearly the same for UTS, YS, and elongation, with an optimum at VED between 30 and 35 J/mm3. In detail, the mechanical properties (especially elongation and UTS) decrease significantly when a VED of less than 25 J/mm3 is applied. On the contrary, above an energy density of about 45 J/mm3, the curves tend to stabilize.
The UTS graph also shows the build rate. It can be seen that an energy density around 30 J/mm3 should be applied to be competitive from a production point of view while maintaining good mechanical properties. At slightly higher values of energy density (tested in step 1), the mechanical properties reach a plateau on average, at the expense of larger scatter of results.
With respect to density, the previous observations remain almost unchanged even for parameter combinations considered in step 2. The energy density still has a small effect on density of Archimedes, with a slight decreasing tendency as one moves toward 20 J/mm3.
In this regard, results in the literature are varied and contradictory. In several studies, almost the same degree of densification was obtained at very different energy densities [6,35,36]. Other research is in contrast to the results of this study. Read et al. [4] studied the relationship between porosity and applied energy density. In this study, a wider range of energy densities was investigated and 60 J/mm3 was reported as the best value for maximizing density, with a steep decline toward lower energy densities. Giovagnoli et al. [37] examined a VED spectrum (40–70 J/mm3) that partially overlaps that investigated in this study. They found a clear decrease in part density with increasing energy density, which is in stark contrast to the present research, although almost the same VEDs were used. Given the contrasting results obtained in the literature at the same energy density, as also pointed out in [37], this variable does not seem to be the correct discriminating factor for the parameter optimizations. In any case, it is important to keep in mind that the process parameters are extremely machine specific. This means that the optimized parameters found with one L-PBF machine may not fit the others.
The results of this study support the hypothesis that VED is not specific enough to distinguish successful from less successful process settings. As a matter of fact, the results of the experiments performed in step 1 demonstrate that considerable variation in manufacturing quality can be obtained by using different parameter combinations that share the same energy density. If a fixed laser power is considered, the discrimination of optimal building conditions cannot be based on the VED value alone, but it is mandatory to tune the hatching distance and the scanning speed. VED can be helpful on a larger scale when the process window is extended to a wider range of energies, as in step 2 of this study.
Figure 8 shows all tensile test results, including steps 1 and 2, as a function of hatch distance and scan speed. The energy density values are shown for the maximum, minimum, and average mechanical properties. The normalized values of tensile properties are also listed in Table 3, along with the range of deviation across the three specimens.
Image analysis of cube sections printed at energy densities below 31 J/mm3 pointed out that the lack of fusion defects start occurring around 25 J/mm3, regardless of the setup applied (Figure 9A–C). On the contrary, Figure 9D shows that at an energy density of about 31 J/mm3, with high scan speed and low hatch spacing, the printing defects disappear, and are replaced by small porosity. This phenomenon confirms the statements made in the first step of the analysis about the influence of the parameters on the pores/defect presence. Moreover, it is consistent with the results of Archimedes’ density obtained in step 2, since the low energy densities are accompanied by a slight decrease in density.

4. Conclusions

  • The results regarding the density, metallurgical quality and tensile properties of AlSi10Mg components produced by L-PBF allow for the reckoning that volumetric energy density is not a self-sufficient parameter for process optimization. The Archimedes density measured in this study is not significantly affected by the variation of VED, especially in the range of 25–55 J/mm3. Moreover, samples produced with equal values of VED exhibited extremely different degrees of porosity. This conclusion is consistent with the unresolved role attributed to energy density in the scientific literature. It can be concluded that more detailed variables need to be adopted for tuning the laser powder bed fusion process by taking into account the thermal history of the individual melt track.
  • Although VED is not a comprehensive parameter, it can still be useful for initial rough identification of ranges where the process is effective. In the present study, the best tensile properties were achieved at a VED between 30 and 35 J/mm3. Within this window, choosing an energy density of 30 J/mm3 represents a good compromise between part quality and productivity. For example, the use of 0.1 mm hatch distance and 2000 mm/s speed guarantees higher mechanical properties than the 0.10/1500 combination, with a 25% time saving. On a more general level, the complete set of results allows a multipurpose optimization of the process for each specific weighting of the concurrent factors.
  • At a fixed laser power, the hatch distance and scanning speed actually affect the quality of the manufactured part, both in terms of mechanical properties and the absence of pores and defects, even at constant incident energy.

Author Contributions

Conceptualization and methodology, A.G. and F.F.; validation, S.D.; formal analysis, E.T.; investigation, C.C.; data curation, E.T. and C.C.; writing—S.D. and C.C.; supervision, A.G. and F.F. All authors have read and agreed to the published version of the manuscript.

Funding

This research received no external funding.

Institutional Review Board Statement

Not applicable.

Informed Consent Statement

Not applicable.

Data Availability Statement

Data available upon request.

Conflicts of Interest

The authors declare that they have no conflicts of interest. The funders had no role in the design of the study; in the collection, analyses, or interpretation of data; in the writing of the manuscript; or in the decision to publish the results.

References

  1. ASTM F2792-12a; Standard Terminology for Additive Manufacturing Technologies. ASTM International: West Conshohocken, PA, USA, 2013. [CrossRef]
  2. Bassoli, E.; Defanti, S.; Tognoli, E.; Vincenzi, N.; Degli Esposti, L. Design for Additive Manufacturing and for Machining in the Automotive Field. Appl. Sci. 2021, 11, 7559. [Google Scholar] [CrossRef]
  3. Kotadia, H.R.; Gibbons, G.; Das, A.; Howes, P.D. A review of Laser Powder Bed Fusion Additive Manufacturing of aluminium alloys: Microstructure and properties. Addit. Manuf. 2021, 46, 102155. [Google Scholar] [CrossRef]
  4. Read, N.; Wang, W.; Essa, K.; Attallah, M.M. Selective laser melting of AlSi10Mg alloy: Process optimisation and mechanical properties development. Mater. Des. 2015, 65, 417–424. [Google Scholar] [CrossRef]
  5. Gupta, A.K.; Lloyd, D.J.; Court, S.A. Precipitation hardening in Al–Mg–Si alloys with and without excess Si. Mater. Sci. Eng. A 2001, 316, 11–17. [Google Scholar] [CrossRef]
  6. Aboulkhair, N.T.; Everitt, N.M.; Ashcroft, I.; Tuck, C. Reducing porosity in AlSi10Mg parts processed by selective laser melting. Addit. Manuf. 2014, 1, 77–86. [Google Scholar] [CrossRef]
  7. Qiu, C.; Panwisawas, C.; Ward, M.; Basoalto, H.C.; Brooks, J.W.; Attallah, M.M. On the role of melt flow into the surface structure and porosity development during selective laser melting. Acta Mater. 2015, 96, 72–79. [Google Scholar] [CrossRef]
  8. Kempen, K.; Thijs, L.; Van Humbeeck, J.; Kruth, J.-P. Mechanical Properties of AlSi10Mg Produced by Selective Laser Melting. Phys. Procedia 2012, 39, 439–446. [Google Scholar] [CrossRef]
  9. Raus, A.A.; Wahab, M.S.; Shayfull, Z.; Kamarudin, K.; Ibrahim, M. The Influence of Selective Laser Melting Parameters on Density and Mechanical Properties of AlSi10Mg. MATEC Web Conf. 2016, 78, 01078. [Google Scholar] [CrossRef]
  10. Wei, P.; Wei, Z.; Chen, Z.; Du, J.; He, Y.; Li, J.; Zhou, Y. The AlSi10Mg samples produced by selective laser melting: Single track, densification, microstructure and mechanical behavior. Appl. Surf. Sci. 2017, 408, 38–50. [Google Scholar] [CrossRef]
  11. Brandl, E.; Heckenberger, U.; Holzinger, V.; Buchbinder, D. Additive manufactured AlSi10Mg samples using Selective Laser Melting (SLM): Microstructure, high cycle fatigue, and fracture behavior. Mater. Des. 2012, 34, 159–169. [Google Scholar] [CrossRef]
  12. Ngnekou, J.N.D.; Nadot, Y.; Henaff, G.; Nicolai, J.; Ridosz, L. Influence of defect size on the fatigue resistance of AlSi10Mg alloy elaborated by selective laser melting (SLM). Procedia Struct. Integr. 2017, 7, 75–83. [Google Scholar] [CrossRef]
  13. Zhang, B.; Li, Y.; Bai, Q. Defect Formation Mechanisms in Selective Laser Melting: A Review. Chin. J. Mech. Eng. 2017, 30, 515–527. [Google Scholar] [CrossRef]
  14. Brika, S.E.; Letenneur, M.; Dion, C.A.; Brailovski, V. Influence of particle morphology and size distribution on the powder flowability and laser powder bed fusion manufacturability of Ti-6Al-4V alloy. Addit. Manuf. 2020, 31, 100929. [Google Scholar] [CrossRef]
  15. Weingarten, C.; Buchbinder, D.; Pirch, N.; Meiners, W.; Wissenbach, K.; Poprawe, R. Formation and reduction of hydrogen porosity during selective laser melting of AlSi10Mg. J. Mater. Process. Technol. 2015, 221, 112–120. [Google Scholar] [CrossRef]
  16. Buchbinder, D.; Schleifenbaum, H.; Heidrich, S.; Meiners, W.; Bültmann, J. High Power Selective Laser Melting (HP SLM) of Aluminum Parts. Phys. Procedia 2011, 12, 271–278. [Google Scholar] [CrossRef]
  17. Galy, C.; Le Guen, E.; Lacoste, E.; Arvieu, C. Main defects observed in aluminum alloy parts produced by SLM: From causes to consequences. Addit. Manuf. 2018, 22, 165–175. [Google Scholar] [CrossRef]
  18. Oliveira, J.P.; LaLonde, A.D.; Ma, J. Processing parameters in laser powder bed fusion metal additive manufacturing. Mater. Des. 2020, 193, 108762. [Google Scholar] [CrossRef]
  19. Yang, K.V.; Rometsch, P.; Jarvis, T.; Rao, J.; Cao, S.; Davies, C.; Wu, X. Porosity formation mechanisms and fatigue response in Al-Si-Mg alloys made by selective laser melting. Mater. Sci. Eng. A 2018, 712, 166–174. [Google Scholar] [CrossRef]
  20. Bertoli, U.S.; Wolfer, A.J.; Matthews, M.J.; Delplanque, J.-P.R.; Schoenung, J.M. On the limitations of Volumetric Energy Density as a design parameter for Selective Laser Melting. Mater. Des. 2017, 113, 331–340. [Google Scholar] [CrossRef] [Green Version]
  21. Ciurana, J.; Hernandez, L.; Delgado, J. Energy density analysis on single tracks formed by selective laser melting with CoCrMo powder material. Int. J. Adv. Manuf. Technol. 2013, 68, 1103–1110. [Google Scholar] [CrossRef]
  22. Kempen, K.; Thijs, L.; Yasa, E.; Badrossamay, M.; Verheecke, W.; Kruth, J. Process Optimization and Microstructural Analysis for Selective Laser Melting of AlSi10Mg. In Proceedings of the 22nd Annual International Solid Freeform Fabrication Symposium—An Additive Manufacturing Conference, Austin, TX, USA, 17 August 2011; pp. 484–495. [Google Scholar]
  23. Prashanth, K.G.; Scudino, S.; Maity, T.; Das, J.; Eckert, J. Is the energy density a reliable parameter for materials synthesis by selective laser melting? Mater. Res. Lett. 2017, 5, 386–390. [Google Scholar] [CrossRef]
  24. Zhang, H.; Zhu, H.; Qi, T.; Hu, Z.; Zeng, X. Selective laser melting of high strength Al–Cu–Mg alloys: Processing, microstructure and mechanical properties. Mater. Sci. Eng. A 2016, 656, 47–54. [Google Scholar] [CrossRef]
  25. Olakanmi, E.O.; Cochrane, R.F.; Dalgarno, K.W. A review on selective laser sintering/melting (SLS/SLM) of aluminium alloy powders: Processing, microstructure, and properties. Prog. Mater. Sci. 2015, 74, 401–477. [Google Scholar] [CrossRef]
  26. Facchini, L.; Vicente, N.; Lonardelli, I.; Magalini, E.; Robotti, P.; Molinari, A. Metastable Austenite in 17-4 Precipitation-Hardening Stainless Steel Produced by Selective Laser Melting. Adv. Eng. Mater. 2010, 12, 184–188. [Google Scholar] [CrossRef]
  27. Thijs, L.; Verhaeghe, F.; Craeghs, T.; Humbeeck, J.V.; Kruth, J.P. A study of the microstructural evolution during selective laser melting of Ti-6Al-4V. Acta Mater. 2010, 58, 3303–3312. [Google Scholar] [CrossRef]
  28. Gu, D.; Hagedorn, Y.-C.; Meiners, W.; Meng, G.; Batista, R.J.S.; Wissenbach, K.; Poprawe, R. Densification behavior, microstructure evolution, and wear performance of selective laser melting processed commercially pure titanium. Acta Mater. 2012, 60, 3849–3860. [Google Scholar] [CrossRef]
  29. Sola, A.; Nouri, A. Microstructural porosity in additive manufacturing: The formation and detection of pores in metal parts fabricated by powder bed fusion. J. Adv. Manuf. Process. 2019, 1, e10021. [Google Scholar] [CrossRef]
  30. Yang, T.; Liu, T.; Liao, W.; MacDonald, E.; Wei, H.; Chen, X.; Jiang, L. The influence of process parameters on vertical surface roughness of the AlSi10Mg parts fabricated by selective laser melting. J. Mater. Process. Technol. 2019, 266, 26–36. [Google Scholar] [CrossRef]
  31. SLM Solutions Group AG Al-Alloy AlSi10Mg/EN AC-43000 Material Datasheet. Available online: https://www.slm-solutions.com/fileadmin/Content/Powder/MDS/MDS_Al-Alloy_AlSi10Mg_0520_EN.pdf (accessed on 14 March 2022).
  32. Yu, W.; Sing, S.L.; Chua, C.K.; Tian, X. Influence of re-melting on surface roughness and porosity of AlSi10Mg parts fabricated by selective laser melting. J. Alloys Compd. 2019, 792, 574–581. [Google Scholar] [CrossRef]
  33. Stugelmayer, E. Characterization of Process Induced Defects in Laser Powder Bed Fusion Processed AlSi10Mg Alloy. Ph.D. Thesis, Montana Tech, Butte, MT, USA, 2018. [Google Scholar]
  34. King, W.E.; Barth, H.D.; Castillo, V.M.; Gallegos, G.F.; Gibbs, J.W.; Hahn, D.E.; Kamath, C.; Rubenchik, A.M. Observation of keyhole-mode laser melting in laser powder-bed fusion additive manufacturing. J. Mater. Process. Technol. 2014, 214, 2915–2925. [Google Scholar] [CrossRef]
  35. Thijs, L.; Kempen, K.; Kruth, J.-P.; Van Humbeeck, J. Fine-structured aluminium products with controllable texture by selective laser melting of pre-alloyed AlSi10Mg powder. Acta Mater. 2013, 61, 1809–1819. [Google Scholar] [CrossRef]
  36. Aboulkhair, N.T.; Maskery, I.; Tuck, C.; Ashcroft, I.; Everitt, N.M. The microstructure and mechanical properties of selectively laser melted AlSi10Mg: The effect of a conventional T6-like heat treatment. Mater. Sci. Eng. A 2016, 667, 139–146. [Google Scholar] [CrossRef]
  37. Giovagnoli, M.; Silvi, G.; Merlin, M.; Di Giovanni, M.T. Optimisation of process parameters for an additively manufactured AlSi10Mg alloy: Limitations of the energy density-based approach on porosity and mechanical properties estimation. Mater. Sci. Eng. A 2021, 802, 140613. [Google Scholar] [CrossRef]
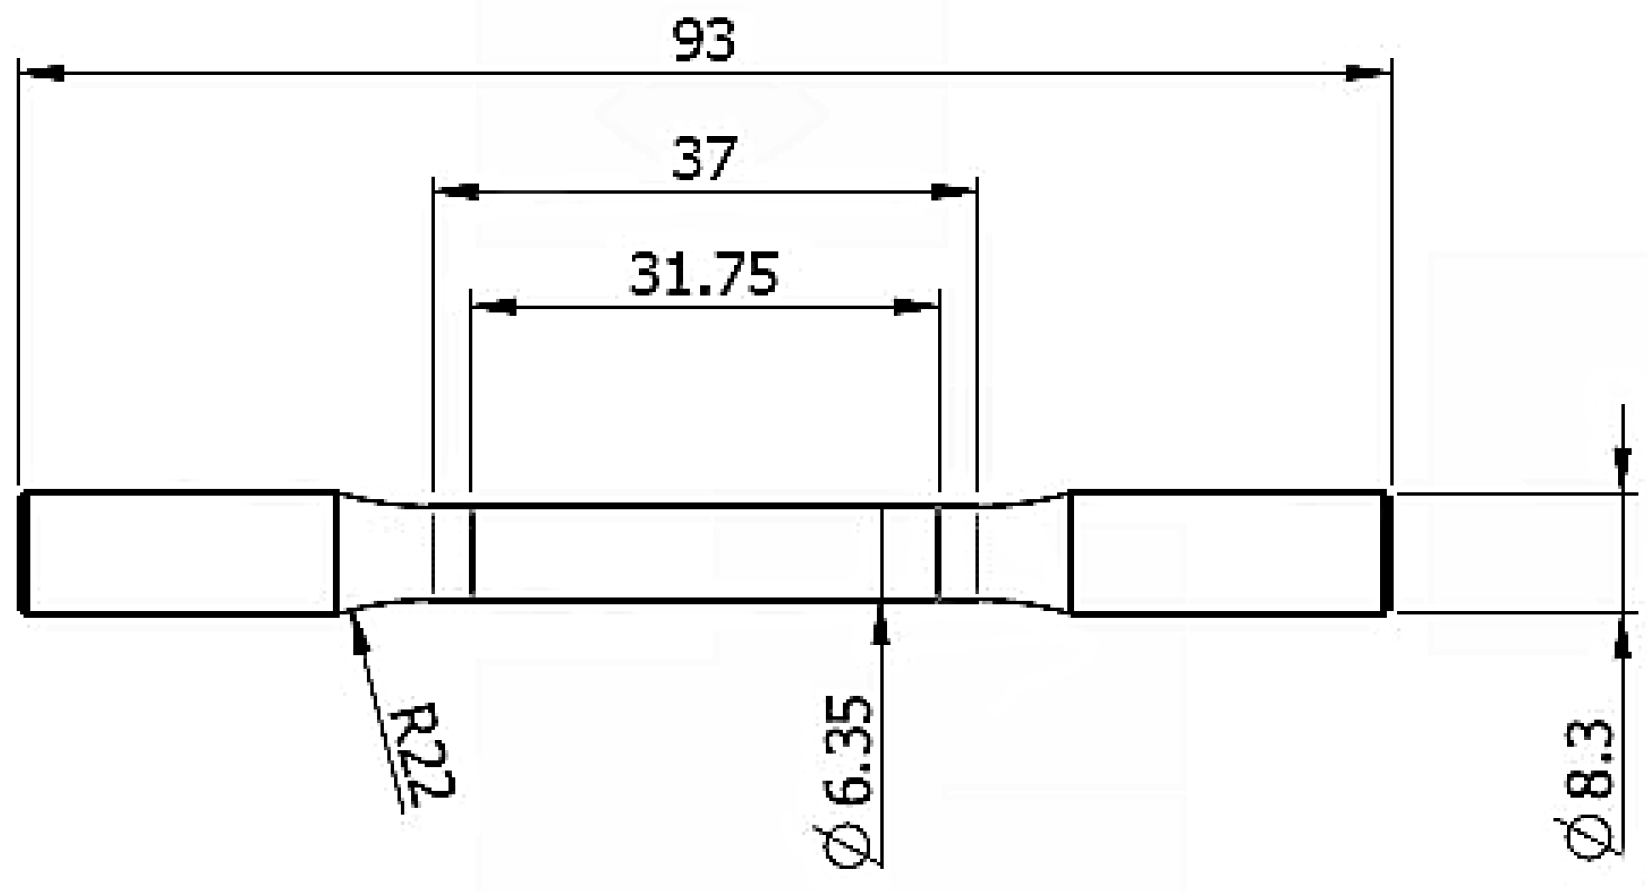
Figure 1. Geometry of the NM (non-machined) tensile specimen.
Jmmp 06 00112 g001
Figure 2. Mechanical properties of parts built with the setups considered in step 1 of the analysis. Domains corresponding to different VED ranges are identified by dashed contours. (A) Normalized UTS; (B) Normalized YS; (C) Normalized elongation.
Jmmp 06 00112 g002
Figure 3. Variation of tensile properties versus energy density. Results refer to step 1 of the analysis. (A) Normalized UTS; (B) Normalized YS; (C) Normalized elongation.
Jmmp 06 00112 g003
Figure 4. Relative densities measured with Archimedes’ method in relation to the different parameters applied in step 1 of the analysis.
Jmmp 06 00112 g004
Figure 5. Relative density measurements with Archimedes method in relation to the energy density incident on the powder bed.
Jmmp 06 00112 g005
Figure 6. Optical microscope images of sections (parallel to the XZ plane) of cubes printed with the following parameter combinations. (A) h = 0.24 mm; v = 800 mm/s; (B) h = 0.1 mm; v = 1800 mm/s.
Jmmp 06 00112 g006
Figure 7. Mechanical properties measured for the setups of step 1 and 2, plotted against the energy density. (A) Normalized UTS; (B) Normalized YS; (C) Normalized elongation; (D) Normalized density.
Jmmp 06 00112 g007
Figure 8. Full set of tensile results of step 1 and step 2 of the analysis. For each hatch distance, values of VED [J/mm3] are shown next to the experimental points that provided the highest, lowest and medium values of the plotted mechanical property. (A) Normalized UTS; (B) Normalized YS; (C) Normalized elongation.
Jmmp 06 00112 g008
Figure 9. Optical microscope images of sections of cubes built with the following parameter combinations. (A) h = 0.16 mm, v = 1500 mm/s, VED = 26 J/mm3; (B) h = 0.18 mm, v = 1500 mm/s, VED = 23 J/mm3; (C) h = 0.14 mm, v = 1700 mm/s, VED = 26 J/mm3; (D) h = 0.1 mm, v = 2000 mm/s, VED = 31 J/mm3.
Jmmp 06 00112 g009
Table 1. AlSi10Mg nominal chemical composition.
ElementAlSiCuMnMgZnFe
Wt %Balance9–11≤0.05≤0.450.2–0.45≤0.1≤0.55
Table 2. Tested combinations of hatch distance and scanning speed. Each cell reports the corresponding energy density and, in parentheses, the percent build time, with the most time-consuming parameter set (v = 1700 mm/s, h = 0.06 mm) as a reference. The bold and non-bold values correspond to the parameters analyzed in the first and second experimental steps, respectively.
Energy Density [J/mm3]
(Build Time [%])
Hatch Distance [mm]
0.060.080.100.120.140.160.180.200.220.24
Scanning Speed [mm/s]800 42.8
(70.8)
38.5
(63.8)
35.0
(58.0)
32.1
(53.1)
900 42.8
(70.8)
38.1
(63.0)
34.3
(56.7)
31.1
(51.5)
1000 44.0
(72.9)
38.5
(63.8)
34.3
(56.7)
30.8
(51.0)
1100 40.0
(66.2)
35.0
(58.0)
31.1
(51.5)
1200 51.4
(85.0)
42.8
(70.8)
36.7
(60.7)
32.1
(53.1)
1300 47.4
(78.5)
39.5
(65.4)
33.9
(56.0)
29.6
(49.0)
1400 55.1
(91.1)
44.0
(72.9)
36.7
(60.7)
31.5
(52.0)
1500 51.4
(85.0)
41.1
(68.0)
34.3
(56.7)
29.4
(48.6)
25.7
(42.5)
22.8
(37.8)
20.6
(34.0)
1600 48.2
(79.7)
38.5
(63.8)
32.1
(53.1)
27.5
(45.5)
24.1
(39.8)
21.4
(35.4)
170060.5 (100.0)45.3
(75.0)
36.3
(60.0)
30.2
(50.0)
25.9
(42.9)
22.7
(37.5)
20.2
(33.3)
180057.1 (94.4)42.8
(70.8)
34.3
(56.7)
28.5
(47.2)
24.5
(40.5)
21.4
(35.4)
190054.1
(89.5)
40.6
(67.1)
32.5
(53.7)
27.0
(44.7)
23.2
(38.3)
20.3
(33.6)
200051.4 (85.0)38.5
(63.8)
30.8
(51.0)
25.7
(42.5)
22.0
(36.4)
19.3
(31.9)
Table 3. Complete set of tensile results. The average values of normalized UTS, normalized YS and normalized elongation are listed together with the range of deviation.
Normalized UTS
Normalized YS
Normalized Elongation
Hatch Distance [mm]
0.060.080.100.120.140.160.180.200.220.24
Scanning Speed [mm/s]800 85 1 + 2
86 1 + 1
81 4 + 2
91 3 + 3
90 2 + 2
96 9 + 11
90 0 + 1
91 1 + 1
88 1 + 2
95 1 + 1
93 2 + 1
101 1 + 2
900 88 2 + 2
88 3 + 3
86 2 + 4
92 2 + 1
93 2 + 2
91 4 + 6
97 1 + 1
96 2 + 1
104 1 + 2
98 0 + 0
98 1 + 1
102 2 + 1
1000 86 2 + 4
88 3 + 2
81 8 + 9
90 3 + 1
90 2 + 2
84 4 + 2
91 1 + 1
93 1 + 2
90 3 + 7
97 1 + 1
98 1 + 2
99 2 + 4
1100 94 2 + 2
93 3 + 3
97 3 + 3
97 3 + 4
97 2 + 2
96 9 + 11
98 1 + 1
99 1 + 1
99 2 + 4
1200 95 1 + 1
95 3 + 3
91 11 + 12
94 1 + 1
95 2 + 2
90 3 + 3
95 1 + 1
96 1 + 1
92 6 + 4
99 1 + 1
100 0 + 0
100 7 + 7
1300 98 2 + 2
98 1 + 1
100 7 + 10
99 1 + 1
101 2 + 3
93 13 + 7
102 1 + 1
102 1 + 1
112 6 + 4
103 2 + 1
104 2 + 1
108 8 + 6
1400 99 2 + 1
99 1 + 1
93 10 + 7
99 1 + 1
101 2 + 3
96 6 + 4
102 1 + 1
101 1 + 1
113 10 + 10
104 1 + 1
101 4 + 3
117 10 + 10
1500 99 0 + 0
101 1 + 2
94 11 + 6
99 1 + 1
99 0 + 0
96 2 + 4
105 1 + 1
104 1 + 1
113 3 + 3
106 0 + 0
109 0 + 0
107 3 + 3
106 1 + 1
111 1 + 1
102 6 + 8
105 1 + 0
110 1 + 1
99 2 + 1
92 2 + 2
107 1 + 1
63 7 + 7
1600 100 1 + 0
103 1 + 0
93 7 + 3
103 1 + 1
105 1 + 1
110 3 + 3
106 2 + 1
106 1 + 1
119 6 + 4
104 1 + 1
110 1 + 1
96 6 + 4
105 2 + 2
110 2 + 3
101 8 + 6
94 3 + 2
108 0 + 0
67 7 + 3
1700 95 2 + 2
95 1 + 1
89 6 + 8
101 3 + 2
102 2 + 1
94 8 + 9
104 1 + 1
104 1 + 1
108 1 + 2
104 2 + 2
110 1 + 0
93 10 + 10
105 1 + 1
109 2 + 3
103 7 + 7
105 0 + 0
110 0 + 0
100 7 + 3
98 0 + 0
109 1 + 1
76 2 + 1
1800 93 0 + 0
96 1 + 1
88 4 + 6
100 0 + 0
101 0 + 1
103 0 + 0
105 1 + 1
98 18 + 10
107 0 + 0
104 3 + 3
108 1 + 1
101 18 + 12
95 4 + 2
111 1 + 1
60 10 + 7
99 2 + 1
111 1 + 0
73 7 + 3
1900 101 2 + 2
102 1 + 2
107 13 + 17
103 0 + 1
109 0 + 1
92 2 + 4
103 3 + 3
107 1 + 0
93 13 + 17
104 1 + 0
110 1 + 1
89 2 + 4
97 1 + 1
111 1 + 1
69 6 + 8
92 2 + 2
109 1 + 1
57 3 + 7
2000 99 4 + 3
109 0 + 0
79 13 + 11
103 1 + 1
112 2 + 1
88 4 + 2
108 1 + 1
112 1 + 2
107 7 + 10
101 2 + 1
113 0 + 0
76 6 + 4
98 2 + 1
112 0 + 0
68 4 + 6
86 3 + 2
108 3 + 3
48 4 + 6
Publisher’s Note: MDPI stays neutral with regard to jurisdictional claims in published maps and institutional affiliations.