Article

Influence of the Pore Radius on the Penetration Depth of Inks in Binder Jetting—A Modification of the Washburn Equation

Institute for Machine Tools and Industrial Management, TUM School of Engineering and Design, Technical University of Munich, Boltzmannstr. 15, 85748 Garching, Germany
*
Author to whom correspondence should be addressed.
J. Manuf. Mater. Process. 2022, 6(5), 101; https://doi.org/10.3390/jmmp6050101
Submission received: 17 August 2022 / Revised: 6 September 2022 / Accepted: 12 September 2022 / Published: 14 September 2022

Abstract

:
In binder jetting (BJ), an ink is inserted layerwise into a powder bed to selectively bond the particles in the cross-section of a part. By predicting the penetration depth of the ink, the ideal layer thickness for BJ can be set. Each layer should be penetrated with ink. Insufficient penetration will result in a poor layer bond and a low strength of the part; over-penetration will impede a dimensionally accurate production, as the ink will leak from the sides of the part and unintentionally solidify the powder in these areas. The Washburn equation has been used for the calculation of the penetration depth in various fields, such as hydrology or with loose powders. However, a transfer to the BJ process is difficult due to the preferably compact powder bed and the fine particles. In more compact powder beds, the small radii with their greater capillary pressure and their distribution in the layer have a high influence on the penetration depth. This work shows an adaptation of the Washburn equation for powder beds in BJ and a new approach to determine the effective pore radius for calculating the penetration depth. A weighted pore radius was introduced, which accounts for the spatial distribution of the pores in the powder bed and the acting capillary pressure. The validation was performed with two different powders by experimentally simulating the BJ process through the infiltration of a drop into a powder bed. The weighted radius was used in the Washburn equation to calculate the penetration depth. The results were compared with those models from the literature and experimental data, and a good agreement between the calculation and the experiment was found.

1. Introduction

Binder jetting (BJ) is a promising additive manufacturing process for the fabrication of complex metal, ceramic, or even multi-material parts. It has advantages over laser-based processes because of its low unit costs and high build-up rates [1]. During BJ, an ink selectively bonds the powder particles in the cross-section of the part. After recoating a new layer of powder, the next cross-section is penetrated by the ink and thus is connected to the lower layer. The green part, which is created layer by layer, is then densified in a subsequent sintering process. An adequate connection between the layers is crucial to control the printing resolution [2] and thus to ensure sufficient accuracy and strength of the part [3]. The penetration depth of the ink determines the used layer thickness in the process. If the layer thickness is too low, the ink will penetrate too deeply and the saturation in the component may be too high. If the layer thickness is too high, the penetration depth of the ink is not sufficient to create a bond to the lower layer. Thus, the cause–effect relationships of the penetration of the ink into the powder bed need to be thoroughly understood to guarantee a stable BJ process. This relationship that can be equated to the interaction between a fluid and porous media is described by the Washburn equation in multiple works, which will be discussed in more detail in the following.

1.1. Washburn Equation
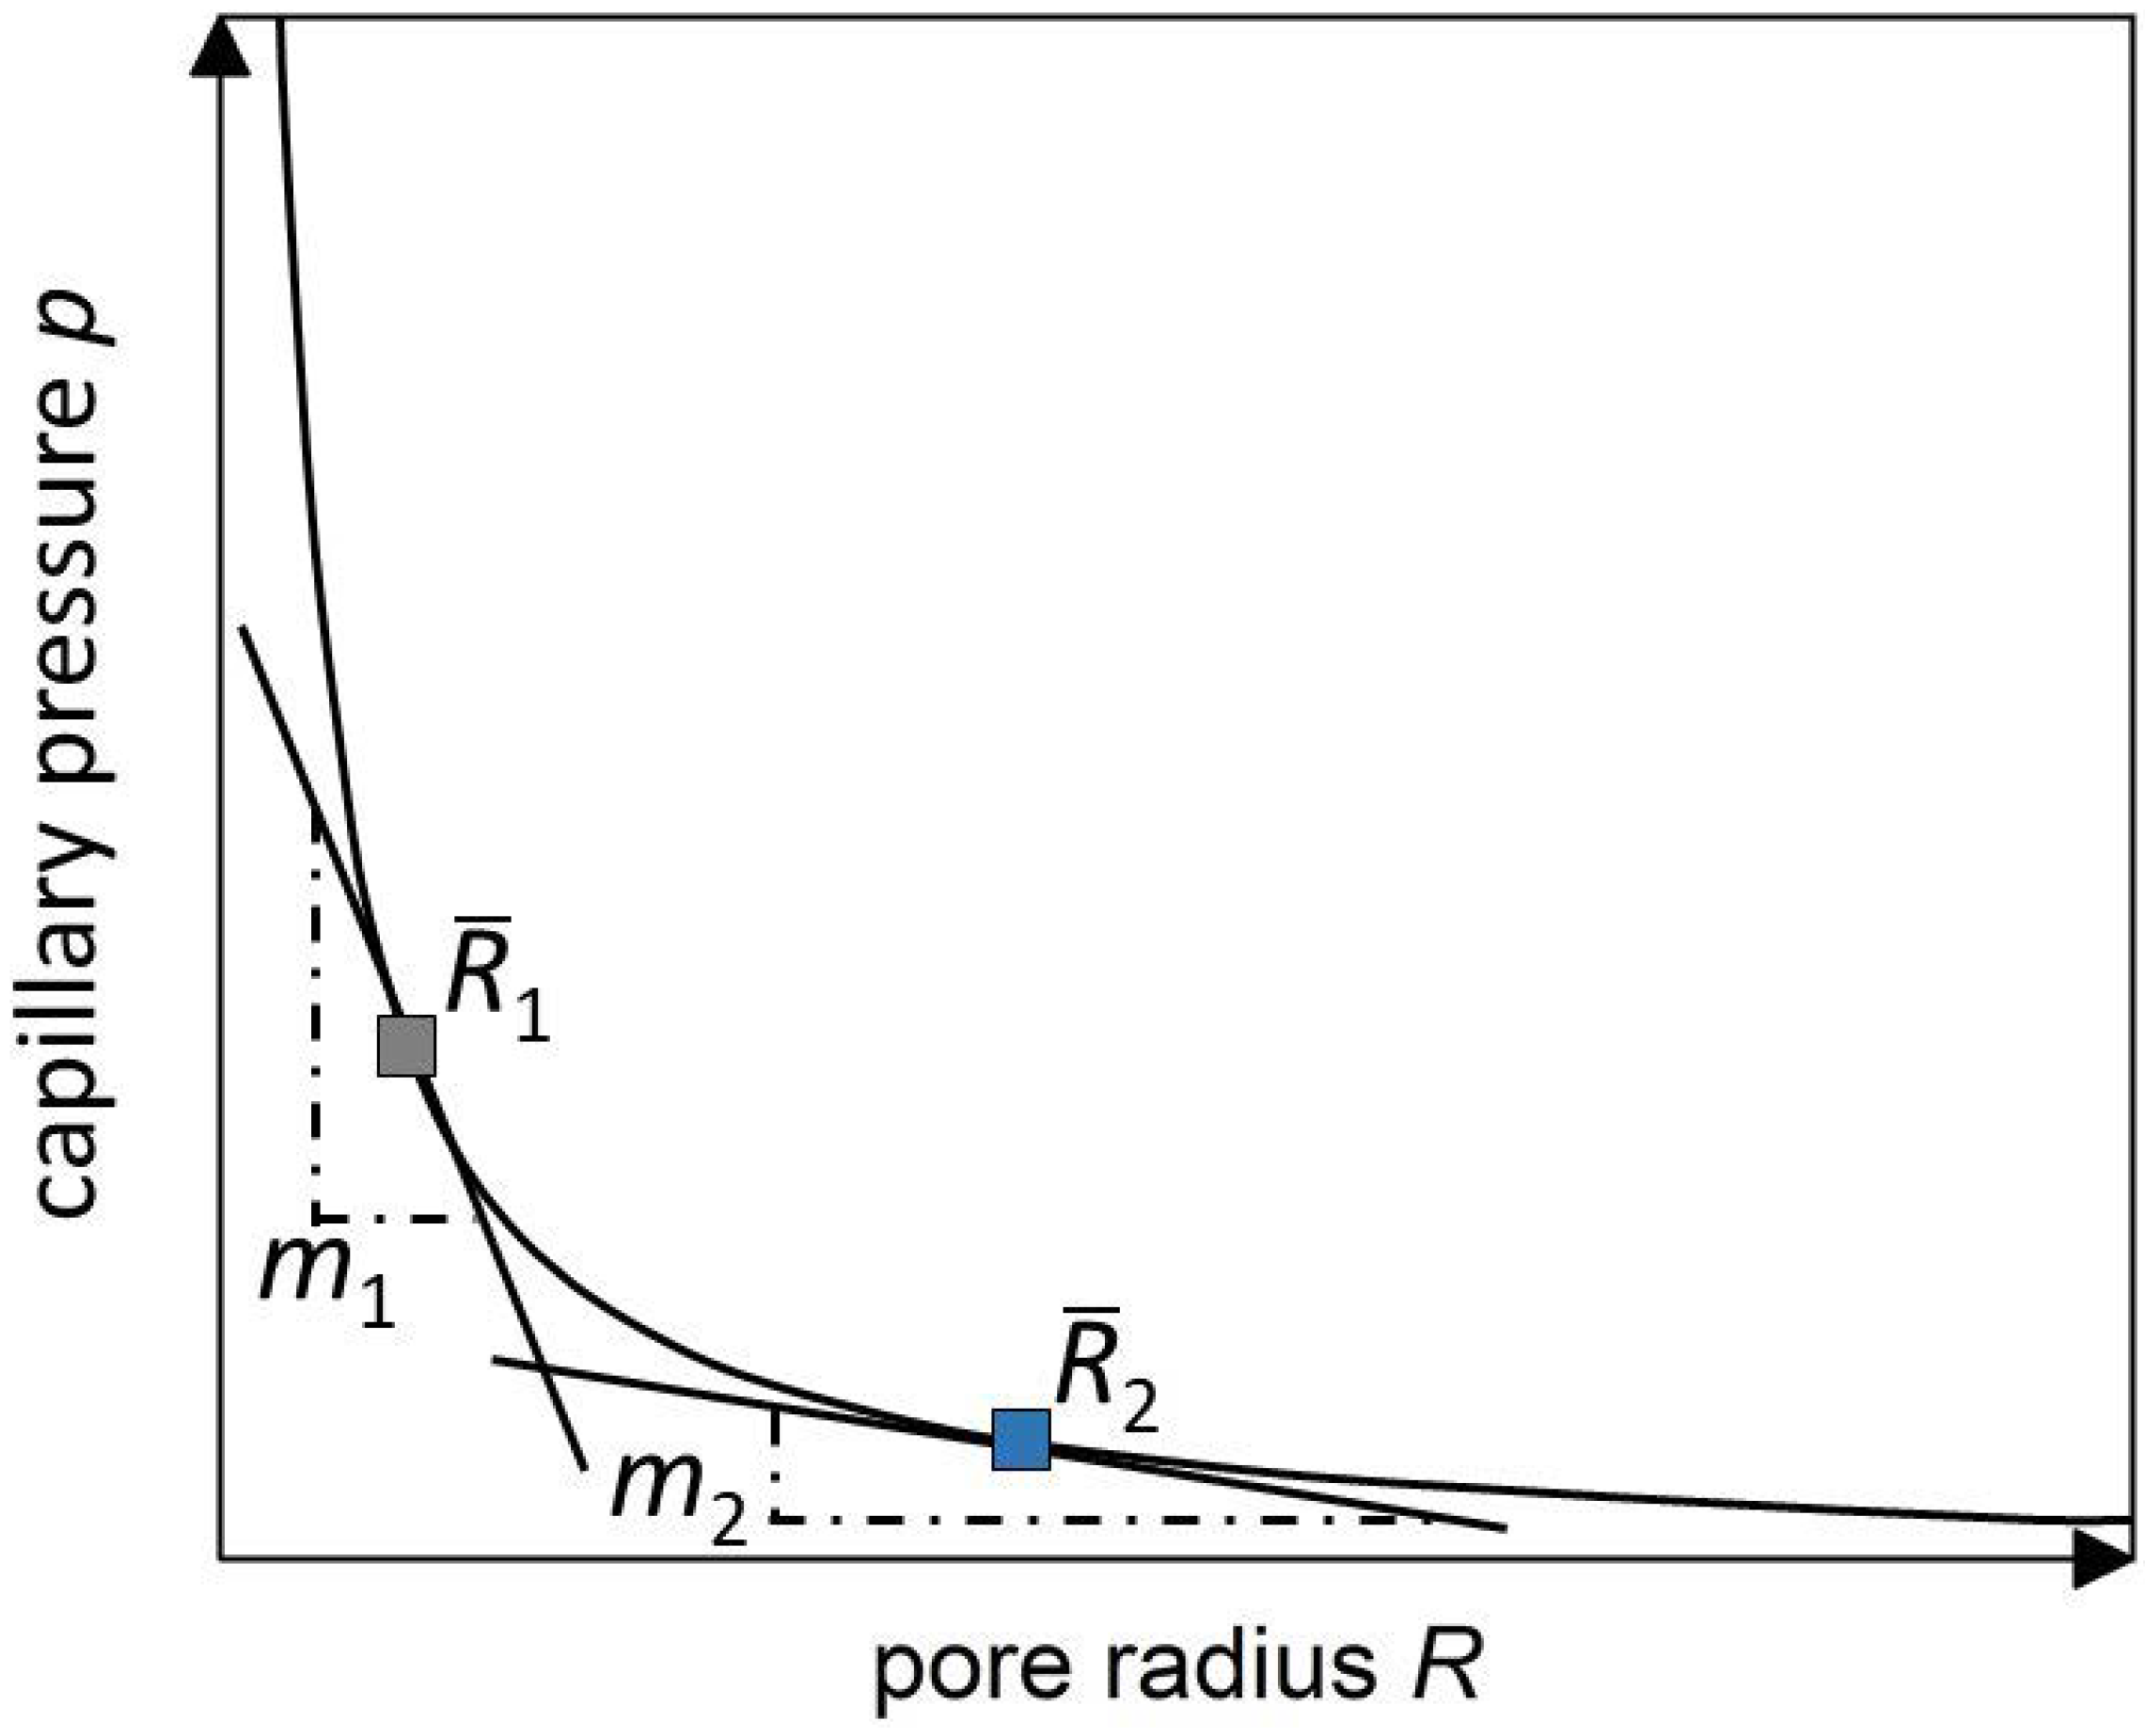
The penetration of a fluid into a powder bed can be assumed as the infiltration of a network of capillaries [4] and is schematically depicted in Figure 1. The penetration depth h ( t ) into the capillary rises with the infiltration time t and depends on the pore radius R, the surface tension γ , the dynamic viscosity η of the fluid, and the contact angle θ between the fluid and the solid.
A simplified model to describe the penetration depth is the Washburn equation [7], which reads
h ( t ) = γ cos ( θ ) R t 2 η .
Although this model is widely used in the literature, it is not yet possible to determine the exact penetration depth of fluids into powder beds. The assumption of the pores as a parallel bundle of capillary tubes with an approximated radius is questioned by various authors, according to Barui et al. [2].
Bouchard and Chandra [8] found that the Washburn equation underestimated the infiltration time of water in thin porous layers of glass beads because it overpredicted the growth rate of the penetration depth.
Popovich et al. [9] studied the infiltration of various fluids into the powder bed. The results of the experiments could not be fully explained by the Washburn equation. They hypothesized that, during the drainage of the fluid, particle rearrangement in the powder bed occurred.
Hapgood et al. [10] modified the equation with an adjustment of the used pore radius to include large macrovoids, which gave better results. However, this assumption is only valid for loose powder beds and therefore not suitable for the use in BJ.
Zhang et al. [11] investigated the fluid imbibition into different porous structures. A comparison with the theoretical drop penetration calculated with the Washburn equation showed contradictory results. The results of their calculations yielded lower penetration times and smaller pore sizes than the experiments. They concluded that the simplification of the pore sizes as a bundle of capillaries with a constant radius is not sufficient to model the penetration depth. Their experiments were also unable to represent the fine pores that are typically found in powder beds or the rearrangement occurring in the powder bed.

1.2. Pore Radius

The studies indicate that the pore radius R, in particular, has a large effect on the penetration depth. It follows from Zhang et al. [11] that the pore radius has a higher effect on the fluid capillary increase than the material surface wettability. An exact representation of the pore radius is therefore important for the precise determination of the penetration depth. The literature uses different approaches to determine this pore radius.
Holman et al. [12] used the mean pore radius R m of the total number of pore radii measured by porosimetry for their investigations of the spreading and the infiltration behavior of printed drops on porous substrates.
Barui et al. [2] introduced an effective radius R eff , which is related to the mean particle diameter, the particle arrangement, and the powder bed porosity. They used the relationship
R eff = 2 ϵ ( 1 ϵ ) D 32 6 ,
where D 32 is the Sauter mean diameter and ϵ is the powder bed porosity fraction. The Sauter mean diameter is defined as the diameter of a sphere that has the same volume to surface area ratio as the particles in the powder bed [13].
Hapgood et al. [10] varied the effective pore radius R eff by the substitution of the porosity by adding an effective porosity including macrovoids in the powder bed in the formulaic relationship. They used the Hausner ratio, which relates the actual porosity to the tap porosity.
However, none of the described approaches can properly represent the penetration behavior for the BJ process. Barui et al. [2] confirmed this conclusion with the statement that the Washburn equation needs to be modified.
The aim of this work is to introduce a new approach for the determination of a representative pore radius to be used in the Washburn equation. A hypothesis for the fluid spreading in powder beds is described and an approach for the modification of the Washburn equation is derived and physically justified. A methodology to determine the variables for this approach is elaborated and applied to the utilized material of this study. After this calibration, a validation is described, which is using the sessile drop method with one fluid and two different powders. This method was used to experimentally simulate the BJ process.
The results of the methodology are compared with theoretical model approaches from the literature.

2. Hypothesis

The smallest occurring pore in a powder bed of spherical particles is the contact region between two powder particles. During the infiltration of a fluid, capillary bridges form at these contact regions.
Miyanaji et al. [14] found that, during BJ, the main driving mechanism for the fluid infiltration is this capillary pressure, but it differs in the different pore sizes. The smaller the pores are, the higher is the capillary pressure. Larger pores are filled with liquid only partially or not at all because the capillary force is insufficient [10]. This leads to a combination of fluid-filled regions and unwetted dry voids [2].
Compared to a loose powder bed, there are more contact regions in a predefined volume of a compact powder due to the higher packing density. This is schematically depicted in Figure 2, showing an initial drop penetrating into powder beds with two different states of packing density.
The more dense powder bed is homogeneously filled with fluid, resulting in a compact pattern (see Figure 2a). In loose powder beds with larger pores, a finger-like pattern occurs [14]. The fluid bypasses the larger pores, whose capillary pressure is insufficient to draw in the liquid, and thus migrates to the deeper contact regions (see Figure 2b). Consequently, the penetration depth increases. This leads to the hypothesis that a weakly compressed powder bed results in a higher penetration depth due to a spatially extensive distribution of the contact regions and therefore small pores. Accordingly, the penetration depth depends on two aspects:
  • the contact regions in the powder bed and their resulting capillary pressure, and
  • their spatial distribution within the powder bed.
The latter is given by the respective volume fraction of the contact regions in the powder bed. A uniform distribution of the pores is assumed in this work.
To modify the variable R in the Washburn equation for the BJ process, these two factors need to be considered.

3. Methodology and Modeling Approach

This section explains the modeling of the influences of the contact regions, of their volume fraction, and of the acting capillary pressure on the penetration depth. The aim is to define a weighted pore radius R w that takes these influences into account. For the mathematical formulation of the underlying physics, a critical radius R crit is introduced and calculated, representing a threshold value for the subsequent weighting approach. The method is demonstrated using an alumina (Al2O3) powder with spherical powder particles.

3.1. Critical Radius R crit

Figure 3a shows a section of a scanning electron microscopy (SEM) (JEOL JSM-IT200 InTouchScope, JOEL GmbH, Freising, Germany) image of a printed green part after drying.
The formation of the capillary bridge can clearly be seen. This formation between two particles occurs due to the acting capillary force and is dependent on the separation distance a between the particles, illustrated in Figure 3b. The capillary bridge is only stable up to a certain distance between two powder particles. If this distance is exceeded, the capillary bridge will rupture [15]. R crit is defined as the radius at which a wetting of a pore between two powder particles still takes place (see Figure 3b) without resulting in a coalescence and a filling of the triangular opening between the particles (see Figure 3a). To determine R crit , the assumption is made that all powder particles have the same size. The volume of a capillary bridge increases nearly linearly with the particle size for particles on the microscale [16]. Thus, it is assumed that with the median diameter D 50 of the particle size distribution as the diameter for all particles, all volumes of the capillary bridges can be represented by averaging. The value for a will be assumed to be equal to the smallest measured pore size in the powder bed. To calculate R crit , the bridge angle β needs to be determined. Scheel et al. [17] found that the triangular opening between the powder particles will be fill up with liquid when β exceeds 30 . Thus, 30 is set as the maximum value for β to avoid this coalescence of the capillary bridges and to calculate R crit . To estimate R crit , the following geometrical expression with the median particle radius R 50 can be used:
R crit = a 2 + R 50 ( 1 cos ( β ) ) .
The defined R crit is the basis for the weighting of the volume fraction of the contact regions and the influence of the capillary pressure in the different pore sizes for the adaption of the pore radius in the Washburn equation.

3.2. Weighting of the Volume Fraction

To determine the volume fraction of the contact regions, the pore size distribution estimated by mercury porosimetry is used. For the visualization, the differential quotient of the specific volume and the radius dV/dR is plotted in Figure 4 over the logarithm of the mean pore radii R.
To perform a weighting of the pore fractions in the powder bed, the normalized volume fractions of the radii smaller than R crit ( V 1 ) and larger than R crit ( V 2 ) are determined. In addition, the mean values of the radii ( R ¯ 1 and R ¯ 2 ) are calculated for the ranges larger and smaller than R crit .
The two average values are weighted according to their volume fraction in the powder bed and result in the average weighted radius R wd . Mathematically, this can be represented as follows:
R wd = R ¯ 1 V 1 + R ¯ 2 V 2 .

3.3. Weighting of the Capillary Pressure

The capillary pressure p , explained by Hassanizadeh and Gray [18], defines the formation of the capillary bridges in porous media and can be estimated by
p = 2 γ cos ( θ ) R .
This equation shows the effect of the strong increase of the capillary pressure with a decreasing pore size.
With the formulation of a generally applicable methodology for the calculation of the penetration depth, the derivative of p with regard to the radius can be determined as
d p d R = 2 γ cos ( θ ) R 2 .
By estimating the slopes m 1 and m 2 at the mean radii R ¯ 1 and R ¯ 2 calculated in Section 3.1 (see Figure 5) and putting them into the relation, the different pore sizes can be weighted by P 1 for small radii and by P 2 for radii larger than R crit shown in the following equations:
P 1 = m 1 m 1 + m 2
and
P 2 = m 2 m 1 + m 2 .
The constant parameters γ and θ are not to be taken into account, as they are canceled out, which makes this part of the proposed methodology universally applicable.
In this way, the capillary pressure acting in the different pore sizes can be weighted, resulting in the weighted radius R wp . Mathematically, this can be represented as follows:
R wp = R ¯ 1 P 1 + R ¯ 2 P 2 .

3.4. Determination of the Weighted Radius R w

Considering the two weighted radii R wd and R wp , the modified Washburn equation can be set up as
h ( t ) = γ cos ( θ ) R w t 2 η ,
with R w defined as
R w = R wd + R wp 2 .
The calculation of the Washburn equation with R w thus includes the acting capillary pressure in the pores and the spatial distribution of the contact regions.

4. Materials and Methods

The validation of the weighted radius R w was performed for two different spherical powders, Al2O3 powder (BAK-40, Xtra GmbH, Leonberg-Gebersheim, Germany) and Polymethylmethacrylat (PMMA) powder (PolyPor powder type A, voxeljet AG, Friedberg, Germany) and one ink commonly used in BJ. The sessile drop method was used, which provides, according to Bai et al. [3], a practical approach to understanding the powder–fluid interaction during BJ. Thus, the powder bed was characterized by the characteristic properties of the BJ process, such as the typical powder material, the powder morphology, and the compaction state. R w was calibrated for each powder by mercury porosimetry in accordance with the methodology proposed in Section 3. The determination of the variables for the Washburn equation and the measurement of the penetration depth are described in the following.

4.1. Preparation and Characterization of the Ink

Using the procedure laid out in Lehmann et al. [19], a water-based ink with Newtonian fluid behavior and a particle addition of 0.1 m% were prepared for the validation experiments. Polyvinylpyrrolidone (PVP) (Luvitec 17, BASF, Ludwigshafen, Germany) was used as a binder [20] for the bonding of the powder particles and simultaneously as a dispersant [21] for the nanoparticles in the ink. PVP was dissolved in a water—isopropanol–ethylen–glycol mixture for 30 min using a magnetic stirrer to prepare the base ink. Graphite nanoparticles (Graphite Nanopowder, Nanografi, Ankara, Turkey) with a mean diameter of less than 50 nm were added to dye the base ink to create a better contrast for the experiments. The mixture was stirred for another 30 min. For the homogenization, the particle-loaded ink was sonicated for 160 s with a 1 min cooling break after each 20 s. The rheological properties of the ink were measured using a rotational rheometer (Kinexus lab +, Netzsch, Selb, Germany ) with a 40 mm plate-plate geometry and a sample gap of 0.1 mm. The dynamic viscosity was measured at a shear rate of 80 s 1 for 3 min, capturing 36 single-point measurements. Samples were kept at 25 ° C at all times.
The surface tension of the ink was examined by the stalagmometric method developed by Traube [22]. Deionized water was used for the calibration. For each measurement, 20 drops were weighed and four measurements were performed.

4.2. Characterization of the Powder

SEM images of the powders used were taken to show the morphology of the particles. They are depicted in Appendix A in Figure A2. The bulk density and the pore size distribution were determined using mercury intrusion porosimetry (Micromeritics Instrument Corporation, Norcross, GA, USA). The pore size distribution of the Al2O3 powder is shown in Figure 4 and that of the PMMA powder is presented in Appendix A in Figure A1. The tap density was measured in a 250 mL cylinder following the standard DIN EN ISO 787-11.
The Sauter diameter was calculated applying the equation
D 32 = i = 1 n n i D i 3 i = 1 n n i D i 2 ,
according to the standard DIN ISO 9276-2, where n i and D i are, respectively, the number and the diameter of the particles in a particle size distribution. The particle size distribution was determined with a laser diffraction analyzer (SALD-2201, Shimadzu, Tokyo, Japan) and is shown in Appendix A in Figure A3.

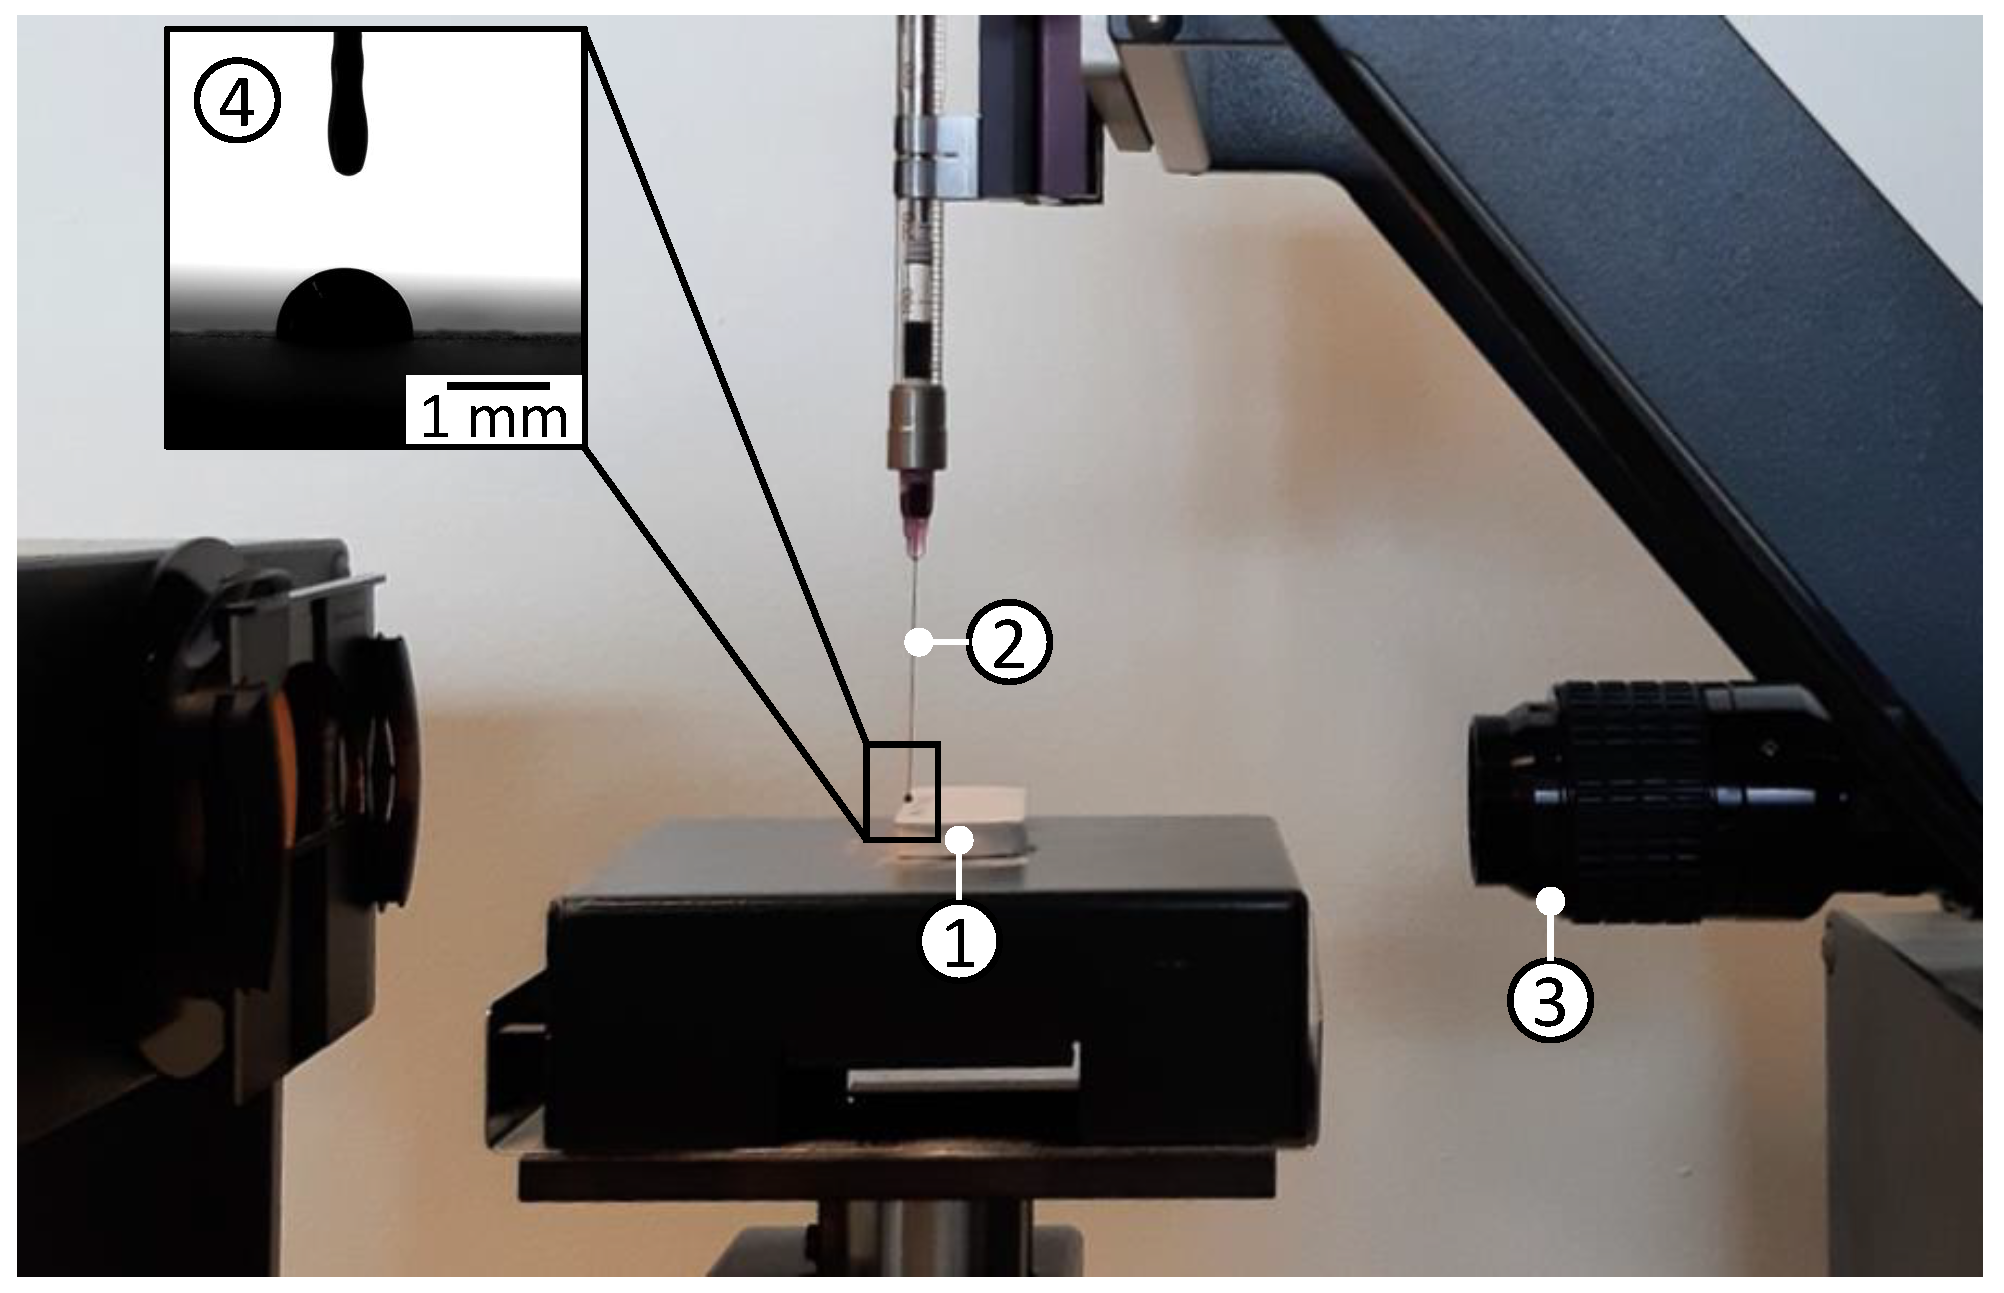
4.3. Powder–Ink Interaction: Contact Angle and Penetration Time

The apparent contact angle θ and the penetration time t were experimentally examined by the sessile drop method with a drop shape analyzer (DSA25E, Kruess Scientific, Hamburg, Germany). The setup is shown in Figure 6.
To imitate the BJ powder bed, the powder was placed in a flat vessel (1) and the top layer was recoated by a blade. A drop with a volume of 6 µl was deposited from a needle (2) with a diameter of 0.25 mm onto this powder bed and monitored by the attached camera (3). Images (4) were taken with a frame rate of 200 fps during the complete drop penetration.
Muster and Prestidge [23] and Danilov et al. [24] found that the apparent contact angle can be measured when the maximum spreading radius of the drop is reached. The contact angle was estimated in the image showing the largest spreading radius. The measurements were preformed for at least ten drops.
To determine the penetration time of a drop, the number of frames from the first impact on the powder bed to the complete infiltration of the drop was counted and divided by the frame rate.

4.4. Measurement of the Penetration Depth

The single drops deposited onto the powder bed during the contact angle measurement (see Section 4.3) were dried in a drying furnace (VT 6060 M, Thermo Fisher Scientific, Waltham, MA, USA) at 80 C for 8 h. The formed powder granules were retrieved from the loose powder, and the heights of ten drops were measured using a light microscope (MM40, Nikon, Tokyo, Japan) with a dedicated measurement software (OmniMet, Buehler ITW Company, Leinfelden-Echterdingen, Germany).

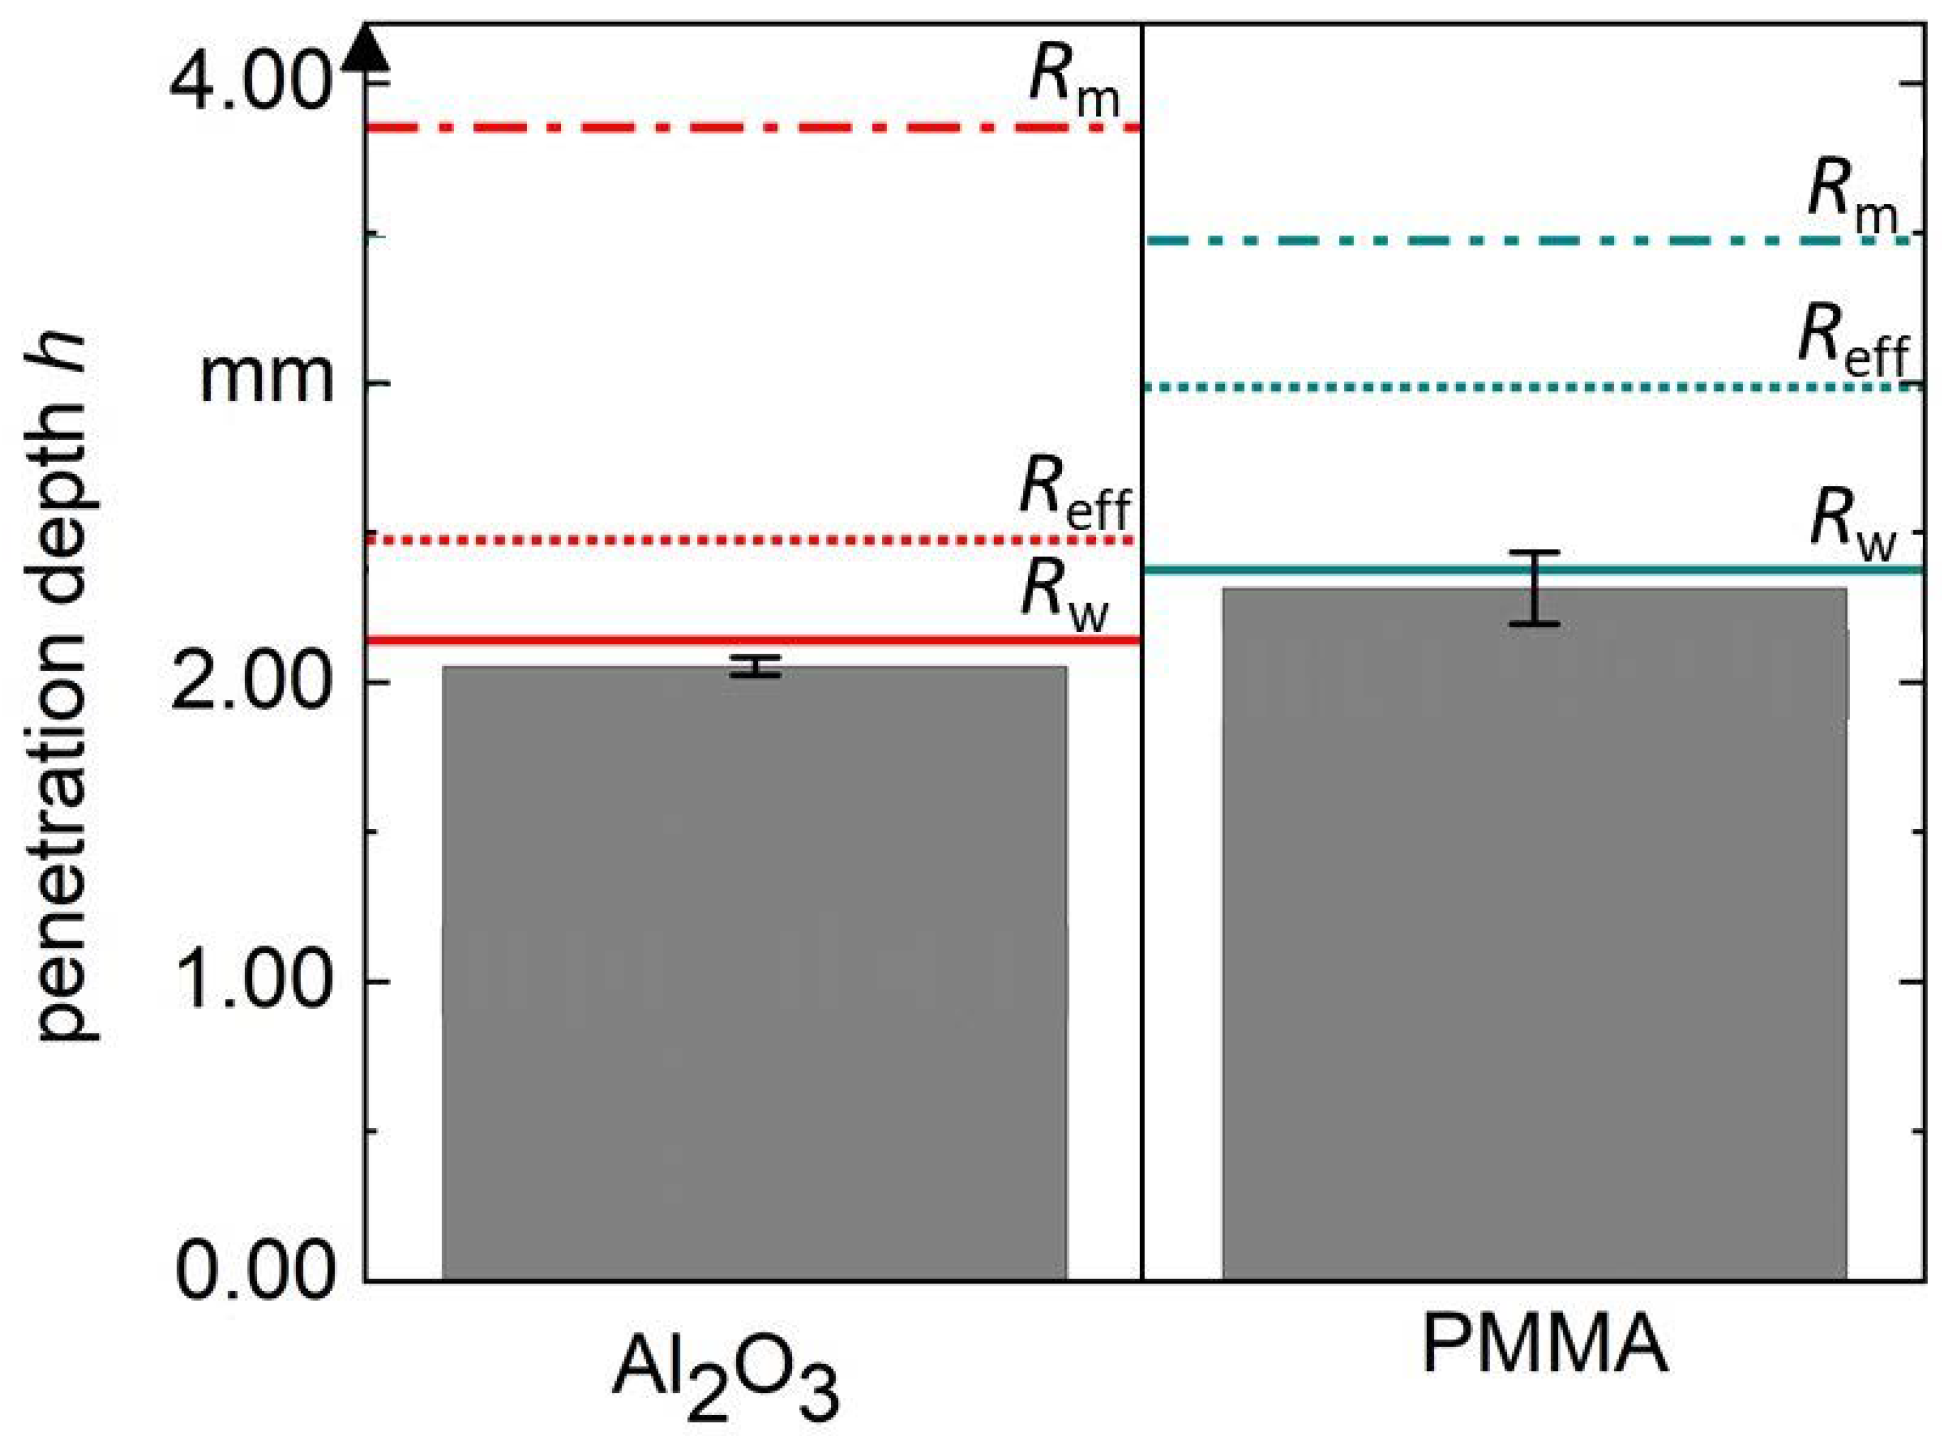
5. Validation, Results, and Discussion

The measured penetration depths were compared with the theoretical calculation of the penetration depth with the Washburn equation, in which R w was inserted. Three different approaches from the literature for the pore radius were also used for the calculation and applied for two powders, respectively. The median pore radius R m determined from the pore size distribution and the effective radius R eff , analogous to Barui et al. [2], were used. The measured values of the variables for the calculation of the penetration depth are shown in Table 1. The values for the calculation of R w and the calculated pore radii from the literature are displayed in Table 2.
Figure 7 shows the measured penetration depth in the Al2O3 and the PMMA powder in comparison with the three calculated penetration depths, which are shown as horizontal lines in the figure.
A penetration depth of 2.05 mm with a standard deviation of 0.03 mm was measured for the Al2O3 powder, and a penetration depth of 2.31 mm with a standard deviation of 0.12 mm was determined for the PMMA powder. The higher standard deviation can be attributed to the broader particle size distribution and the higher proportion of larger particles of the PMMA powder. The calculated penetration depth of 2.14 mm with the weighted radius R w lies slightly above the measured value for the Al2O3 powder. For the PMMA powder, the calculation resulted in a depth of 2.38 mm and lies within the standard deviation of the experimental data. The deviation in the calculation for the Al2O3 powder can be explained by the high roughness of the powder surface. This can be seen in Figure 3 and can lead to ink adhesion or to a change in the contact angle and thus to a reduction in the effective penetration depth. The PMMA powder has a smoother surface; therefore, the calculation is closer to the experimental value. The values of R eff calculated with the corresponding Equation (2) and R m from the porosimetry measurement used in the literature [2,12] indicate a higher penetration depth than the experiments showed for both powders. It is noticeable that the calculation of the penetration depth with R eff for the Al2O3 powder is closer to the measured value than the calculation for the PMMA powder. This can be explained by the definition of the Sauter diameter, which is used for the calculation of R eff . Particle size distributions can be mono-sized, flat, or Gaussian, and still have the same Sauter diameter. However, the porosities of the powder beds and the size and number of the capillary bridges present in the powder bed differ. This leads to an influence on the penetration depth [25]. R eff can be a suitable pore radius for a powder with a narrow pore size distribution. Consequently, it may be an alternative for the calculation for the Al2O3 powder but cannot be applied to the PMMA powder, since the Sauter diameter is increased in this case by a higher proportion of larger particles in the particle size distribution.
The validity of the model was shown for water-based binder-loaded inks and spherical particles for powder beds in the binder jetting process. Other inks that are using an adhesive in the powder bed and are, for example, based on a polymerization reaction cannot be represented by the model because the penetration behavior might also be influenced by the occurring chemical reaction. For loose powder beds in other processes, the model cannot be used without restrictions, since mercury porosimetry causes a rearrangement of the particles and only the state of the densest packing is measured. In binder jetting, however, this state is the most preferable to reach a high density in the final part [26]. Additionally, the transferability of the model to powder beds with non-spherical particles remains to be verified. For non-spherical powders, it is expected that the size of the capillary bridges differs, and R crit must be approximated with a different geometric model as, for example, shown in De Lazzer et al. [27].

6. Conclusions

The used pore radius in the Washburn equation has a high influence on the calculated penetration depth. Choosing a radius, which is only based on the simplified model of a capillary network, does not represent the actual effective porosity in the powder bed. In this study, a new approach for the determination of the pore radius was introduced. Based on the hypothesis that the contact regions between two powder particles, their spatial distribution, and the acting capillary pressure in the pores determine the penetration depth, a critical radius R crit was implemented to provide a threshold for delineating the contact regions from the larger pores. R crit was used to define a weighted pore radius R w that accounts for the influence of the volume fraction of the contact regions and the acting capillary pressure in the pores.
The findings of this study can be summarized as follows:
  • A weighting of the pore radius according to the volume distribution and the acting capillary pressure was shown to be advantageous.
  • The validation with two powders showed that the measured penetration depth can be reproduced very well by the calculation with R w . The calculation is independent of the shape of the particle size distribution, since R w is based on the effective porosity and the D 50 of the particle size distribution.
  • Estimating the penetration depth with equations from the literature that are based on the Sauter diameter are only useful for mono-modal narrow pore size distributions that are not oversized. For wider distributions, the estimation with the Sauter diameter no longer reflects the effective porosity in the powder bed. The use of the mean pore radius R m is not suitable for a calculation of the penetration depth.
In further research, the model will also be applied directly to the BJ process. For smaller drop sizes, it is necessary to adapt the measurement of the penetration time, which can no longer be represented by the sessile drop method, but by a process model. Process parameters, such as the droplet volume and velocity, and the powder bed temperature, are to be integrated into this model.

Author Contributions

Conceptualization, M.L.; Formal analysis, M.L.; Funding acquisition, M.F.Z.; Methodology, M.L. and H.P.; Project administration, M.F.Z.; Supervision, M.F.Z.; Validation, M.L.; Visualization, M.L.; Writing—original draft, M.L.; Writing—review and editing, C.G.K. and M.F.Z. All authors have read and agreed to the published version of the manuscript.

Funding

We hereby express our gratitude to the AiF for the funding of this work, within the framework ZIM of the Federal Ministry for Economic Affairs and Climate Action on the basis of a decision by the German Bundestag. Some of the illustrations and results in this paper were achieved within the scope of the research project MAWELA1 (Grant No. ZF4748301CM9).

Data Availability Statement

Not applicable.

Acknowledgments

The authors would like to thank Tobias Netter and Andrea Hartung (Chair of Energy Systems, Technical University of Munich) for the mercury porosimetry measurements as well as Hanh My Bui (Department of Chemistry, Technical University of Munich) for providing the possibility of the contact angle and penetration time measurements.

Conflicts of Interest

The authors declare no conflict of interest.

Appendix A

In order to remove the measurement errors in the pore size distribution, the measured curves were evaluated according to DIN ISO 15901-1 and a limit value for the maximum pore size was set at R 50 . Higher values for the pore radii resulted from the rearrangement of the particles in the powder bed. The interparticle pores were only filled afterwards. Figure A1 shows the pore size distribution of the PMMA powder.
Figure A1. Pore radius distribution of the PMMA powder; plotted as a logarithmic-differential pore volume distribution for a better representation.
Jmmp 06 00101 g0a1
Figure A2. SEM images of (a) the PMMA and (b) the Al2O3 powder.
Jmmp 06 00101 g0a2
Figure A3. Particle size distribution of (a) the PMMA and (b) the Al2O3 powder.
Jmmp 06 00101 g0a3

References

  1. Günther, D.; Heymel, B.; Franz Günther, J.; Ederer, I. Continuous 3D-printing for additive manufacturing. Rapid Prototyp. J. 2014, 20, 320–327. [Google Scholar] [CrossRef]
  2. Barui, S.; Ding, H.; Wang, Z.; Zhao, H.; Marathe, S.; Mirihanage, W.; Basu, B.; Derby, B. Probing Ink-Powder Interactions during 3D Binder Jet Printing Using Time-Resolved X-ray Imaging. ACS Appl. Mater. Interfaces 2020, 12, 34254–34264. [Google Scholar] [CrossRef]
  3. Bai, Y.; Wall, C.; Pham, H.; Esker, A.; Williams, C.B. Characterizing Binder–Powder Interaction in Binder Jetting Additive Manufacturing Via Sessile Drop Goniometry. J. Manuf. Sci. Eng. 2019, 141, 4041624. [Google Scholar] [CrossRef]
  4. Wudy, K.; Drummer, D. Infiltration Behavior of Thermosets for Use in a Combined Selective Laser Sintering Process of Polymers. JOM 2019, 71, 920–927. [Google Scholar] [CrossRef]
  5. Baek, S.; Jeong, S.; Seo, J.; Lee, S.; Park, S.; Choi, J.; Jeong, H.; Sung, Y. Effects of Tube Radius and Surface Tension on Capillary Rise Dynamics of Water/Butanol Mixtures. Appl. Sci. 2021, 11, 3533. [Google Scholar] [CrossRef]
  6. Breitwieser, M.; Viaene, D. Capillary Pressure in Wound Dressings. 2021. Available online: https://www.imeter.de/120VACUTEX2020eng (accessed on 5 September 2022).
  7. Washburn, E.W. The Dynamics of Capillary Flow. Phys. Rev. 1921, 17, 273–283. [Google Scholar] [CrossRef]
  8. Bouchard, D.J.; Chandra, S. Infiltration of impacting droplets into porous substrates. Exp. Fluids 2020, 61, 235. [Google Scholar] [CrossRef]
  9. Popovich, L.L.; Feke, D.L.; Manas-Zloczower, I. Influence of physical and interfacial characteristics on the wetting and spreading of fluids on powders. Powder Technol. 1999, 104, 68–74. [Google Scholar] [CrossRef]
  10. Hapgood, K.P.; Litster, J.D.; Biggs, S.R.; Howes, T. Drop penetration into porous powder beds. J. Colloid Interface Sci. 2002, 253, 353–366. [Google Scholar] [CrossRef]
  11. Zhang, J.; Tuohey, J.; Amini, N.; Morton, D.A.; Hapgood, K.P. Liquid imbibition into 3D printed porous substrates. Chem. Eng. Sci. 2021, 245, 116967. [Google Scholar] [CrossRef]
  12. Holman, R.K.; Cima, M.J.; Uhland, S.A.; Sachs, E. Spreading and infiltration of inkjet-printed polymer solution droplets on a porous substrate. J. Colloid Interface Sci. 2002, 249, 432–440. [Google Scholar] [CrossRef]
  13. Kowalczuk, P.B.; Drzymala, J. Physical meaning of the Sauter mean diameter of spherical particulate matter. Part. Sci. Technol. 2016, 34, 645–647. [Google Scholar] [CrossRef]
  14. Miyanaji, H.; Zhang, S.; Yang, L. A new physics-based model for equilibrium saturation determination in binder jetting additive manufacturing process. Int. J. Mach. Tools Manuf. 2018, 124, 1–11. [Google Scholar] [CrossRef]
  15. Lian, G.; Seville, J. The capillary bridge between two spheres: New closed-form equations in a two century old problem. Adv. Colloid Interface Sci. 2016, 227, 53–62. [Google Scholar] [CrossRef]
  16. Dörmann, M.; Schmid, H.J. Simulation of Capillary Bridges between Particles. Procedia Eng. 2015, 102, 14–23. [Google Scholar] [CrossRef]
  17. Scheel, M.; Seemann, R.; Brinkmann, M.; Di Michiel, M.; Sheppard, A.; Breidenbach, B.; Herminghaus, S. Morphological clues to wet granular pile stability. Nat. Mater. 2008, 7, 189–193. [Google Scholar] [CrossRef]
  18. Hassanizadeh, S.M.; Gray, W.G. Thermodynamic Basis of Capillary Pressure in Porous Media. Water Resour. Res. 1993, 29, 3389–3405. [Google Scholar] [CrossRef]
  19. Lehmann, M.; Kolb, C.G.; Klinger, F.; Zaeh, M.F. Preparation, characterization, and monitoring of an aqueous graphite ink for use in binder jetting. Mater. Des. 2021, 207, 109871. [Google Scholar] [CrossRef]
  20. Polsakiewicz, D.A.; Kollenberg, W. Highly loaded alumina inks for use in a piezoelectric print head. Mater. Und Werkst. 2011, 42, 812–819. [Google Scholar] [CrossRef]
  21. Kolb, C.G.; Lehmann, M.; Lindemann, J.L.; Bachmann, A.; Zaeh, M.F. Improving the Dispersion Behavior of Organic Components in Water-Based Electrode Dispersions for Inkjet Printing Processes. Appl. Sci. 2021, 11, 2242. [Google Scholar] [CrossRef]
  22. Traube, J. Ueber die Capillaritaetsconstanten organischer Stoffe in waesserigen Loesungen. Justus Liebig’s Ann. Chem. 1891, 265, 27–55. [Google Scholar] [CrossRef]
  23. Muster, T.H.; Prestidge, C.A. Application of time-dependent sessile drop contact angles on compacts to characterise the surface energetics of sulfathiazole crystals. Int. J. Pharm. 2002, 234, 43–54. [Google Scholar] [CrossRef]
  24. Danilov, V.E.; Korolev, E.V.; Ayzenshtadt, A.M. Measuring the Contact Angles of Powders by the Sessile Drop Method. Inorg. Mater. Appl. Res. 2021, 12, 794–798. [Google Scholar] [CrossRef]
  25. Bacelos, M.S.; Passos, M.L.; Freire, J.T. Effect of interparticle forces on the conical spouted bed behavior of wet particles with size distribution. Powder Technol. 2007, 174, 114–126. [Google Scholar] [CrossRef]
  26. Bai, Y.; Wagner, G.; Williams, C.B. Effect of particle size distribution on powder packing and sintering in binder jetting additive manufacturing of metals. J. Manuf. Sci. Eng. 2017, 139. [Google Scholar] [CrossRef]
  27. De Lazzer, A.; Dreyer, M.; Rath, H. Particle-surface capillary forces. Langmuir 1999, 15, 4551–4559. [Google Scholar] [CrossRef]
Figure 1. Schematic representation of the capillary rise of a fluid into a capillary showing the variables of the Washburn equation: the penetration depth h ( t ) , the infiltration time t, the pore radius R, the surface tension γ , the dynamic viscosity η of the fluid, and the contact angle θ between the fluid and the solid (modified from [5,6]).
Jmmp 06 00101 g001
Figure 2. Schematic illustration of a powder bed with (a) a packing density and a compact fluid infiltration present during BJ and (b) a loose powder bed with a finger-like infiltration pattern (modified from Miyanaji et al. [14]); the penetration depth h max in (b) is deeper than in (a), characterized by Δ h .
Jmmp 06 00101 g002
Figure 3. (a) Section of an SEM image of the formation of a capillary bridge highlighted in blue and a triangular pore between the Al2O3 powder particles in a binder jetted green part; (b) geometrical determination of R crit in a capillary bridge.
Jmmp 06 00101 g003
Figure 4. Pore radius distribution, and determination of the two volume fractions (marked blue and gray area), separated by R crit .
Jmmp 06 00101 g004
Figure 5. Schematic representation of the dependence of the capillary pressure on the pore radius with the weighting of the radii by the respective slope.
Jmmp 06 00101 g005
Figure 6. Experimental setup of the sessile drop method with the powder bed in a vessel (1), the needle for the drop formation (2), and an image section (4) of the camera shots (3) for the evaluation of the powder–ink interaction.
Jmmp 06 00101 g006
Figure 7. Measured penetration depth with standard deviation in two powders (Al2O3 and PMMA) compared to the calculated penetration depth with three different approaches shown by the horizontal lines: the median pore radius R m determined from the pore size distribution, the effective radius R eff , analogous to Barui et al. [2], and the weighted pore radius R w , determined in this study.
Jmmp 06 00101 g007
Table 1. Measured values of the variables for the calculation of the penetration depth using the Washburn equation.
Powder θ γ η t ϵ D 32 D 50
in in mN/min mPasin s-in µmin µm
Al2O340.3933.208.721.560.4012.2846.54
PMMA53.5833.208.721.210.4523.6550.50
Table 2. Values for the determination of the modified pore radius, the calculated weighted radius R w , and the calculated pore radii applying the equations given in the literature.
Powder R crit in µm R 50 in µm R w in µm R ¯ 1 in µm R ¯ 2 in µm R wd in µm R wp in µm R m [12] in µm R eff [2] in µm β [17] in ° V 1 - V 2 - P 1 - P 2 -
Al2O33.3723.272.030.796.683.260.786.562.71300.580.420.990.01
PMMA3.3925.254.151.537.236.521.778.876.54300.120.880.960.04
Publisher’s Note: MDPI stays neutral with regard to jurisdictional claims in published maps and institutional affiliations.

