Article

Optimization of Friction Stir Welding Parameters in Hybrid Additive Manufacturing: Weldability of 3D-Printed Poly(methyl methacrylate) Plates

by
Nectarios Vidakis
1,
Markos Petousis
1,*,
Nikolaos Mountakis
1 and
John D. Kechagias
2
1
Mechanical Engineering Department, Hellenic Mediterranean University, Estavromenos, 71410 Heraklion, Greece
2
Department of Forestry Wood Science and Design, University of Thessaly, 43100 Karditsa, Greece
*
Author to whom correspondence should be addressed.
J. Manuf. Mater. Process. 2022, 6(4), 77; https://doi.org/10.3390/jmmp6040077
Submission received: 14 June 2022 / Revised: 18 July 2022 / Accepted: 19 July 2022 / Published: 20 July 2022
(This article belongs to the Special Issue Frontiers in Friction Stir Welding and Processing)

Abstract

:
In this work, the expansion of friction stir welding (FSW) in parts made via material extrusion (MEX) 3D printing was investigated. Poly(methyl methacrylate) (PMMA) plates were joined in a full factorial experimental design. The effects of three FSW parameters (weld tool pin geometry, rotating speed, and travel speed) on the weld results were studied. The tensile strength was investigated using statistical modeling tools. A morphological characterization study was also conducted on the weld zone, with microscopy. The state of the material during the FSW process was monitored via real-time temperature measurements. The feasibility of the process was verified. The results show high industrial merit for the process. The highest tensile strength was reported for the sample welded with the frustum tool, at 1400 rpm and a 9 mm/min travel speed (the highest studied), with a welding efficiency > 1. This can be attributed to the reduced porosity of the weld area compared to the 3D printed structure, and indicates a high potential for joining 3D-printed PMMA sheets via the FSW process.

1. Introduction

Friction stir welding (FSW) is an autogenous, eco-friendly, solid-state joining process [1]. It is applied in various types of applications, such as aerospace, automotive, space [2], and energy applications [3]—mainly for alloys that are difficult to weld via fusion welding [4]. The process is commonly used for aluminum alloys [2,5] and steel [4,6,7]. It has also been used for titanium alloys [8], or even dissimilar metallic compounds [9,10,11]. The effects of the process parameters have been investigated in the literature [1,4]. Statistical modeling tools have been used for the FSW parameters in aluminum composites, aiming to optimize their mechanical properties [12], with research also focusing on the welding tool parameters [13]. The welding tool geometry is among the dominant parameters affecting the weld results; thus, it has been thoroughly studied [1,8,14]. In polymers, research on the FSW process is still limited [15,16], with the mechanism of the process reported in the literature [17]. The effects of process parameters on the mechanical response (tensile tests) of polycarbonate sheets have been reported [18]. The process parameters for polymers overall have been optimized with statistical modeling tools [19]. The feasibility of welding poly(methyl methacrylate) (PMMA) sheets via the FSW process has also been investigated experimentally and theoretically, employing simulation tools [20]. Polypropylene (PP) has also been investigated for FSW [21,22]. The feasibility and the mechanical performance of dissimilar joints of plastics and composites have also been investigated and reported [23,24,25,26]. The improvement of the automation of the process for polymeric materials has been investigated by integrating robotic platforms into the process [27]. Finally, for some other materials, research has focused on the effect of the welding tool used in the FSW of polymers [28,29].
PMMA is an optically clear synthetic polymer used in various types of applications, mainly as an alternative to inorganic glass [30]. In addition to its use in optical applications, it has been employed in biomedicine [31], polymer conductivity [32], sensors, solar applications [30], and membranes [33,34]. In additive manufacturing (AM), although several polymers—such as acrylonitrile–butadiene–styrene (ABS) [35], polyamide 12 (PA12) [36], polypropylene (PP) [37], and polyethylene terephthalate glycol (PETG) [38], among others—have been thoroughly studied, research is still limited on the PMMA polymer [39]. It currently focuses mainly on biomedical behavior and applications in vat photopolymerization 3D printing (dental [40,41]), the study of bone scaffolds [42], and the enhancement of its performance with nanotechnology in material extrusion (MEX) 3D printing. The feasibility of joining PMMA sheets [20,43] or PMMA with aluminum sheets [11] via FSW has been investigated, as mentioned above. Still, no research is available in the literature on the feasibility and the effects of the FSW process in 3D-printed PMMA parts. In the work of Derazkola et al. [20], bulk (not 3D-printed) PMMA sheets were welded with FSW. The authors used mathematical and numerical (finite element analysis) modeling, and samples were also experimentally tested. Parameters such as the welding speed, rotational speed, plunge depth, tilt angle, and the material flow during the FSW process were studied. The values investigated were of a different order of magnitude than the values tested in this work for the welding speed and the rotational speed. The present work differs from the former work because it studies 3D-printed sheets, considers the effect of the welding tool geometry on the performance of the weld, the FSW parameters are in different value ranges, and the experimental results are analyzed and optimized using statistical modeling tools. Moreover, the morphology of the weld was thoroughly investigated with microscopy. Elyasi et al. [43] studied the FSW of the PMMA polymer in T-joints. Again, mathematical, and numerical (finite element analysis) modeling was employed. Tensile and flexural tests were conducted. Samples were welded at various rotational speeds, and the hardness of the weld was measured. This study focused on a different type of joint than the present work; still, the results show an indication of the response of PMMA in FSW for bulk materials.
In this work, for the first time, the feasibility of FSW PMMA parts manufactured by MEX 3D printing is investigated. The aim was to examine the feasibility of joining MEX 3D-printed PMMA sheets and investigate the effects of critical FSW parameters on weld performance. This was a challenging work, due to the structure, porosity, and anisotropy of the 3D-printed parts. The feasibility of the process would expand the application areas of the PMMA polymer, exploiting the advantages of the 3D printing process in hybrid additive manufacturing (HAM) (i.e., integration of AM with pre-, in-, and post-processing techniques [44,45]). Combining 3D printing with conventional manufacturing processes in HAM aims to improve the specifications and usability of the 3D-printed parts. So far, research has focused on the integration of laser applications with 3D printing [46,47]—not on FSW. Again, no HAM research is available to date for the PMMA polymer. Statistical modeling tools have been introduced for the analysis and optimization of the process parameters [48,49,50]. The effects of three FSW parameters—i.e., the weld tool pin geometry, the rotation speed, and the travel speed—on the weld results were investigated in this work, in a full factorial design experiment, using analysis of variance (ANOVA) and quadratic regression tools. The weld performance was evaluated using mechanical tests and a morphological assessment via microscopy. All of the parameters studied were found to be significant for the weld results, with the weld tool being the dominant parameter. In many cases, the strength of the welded specimen was found to be higher than the strength of the non-welded 3D-printed part.

2. Materials and Methods

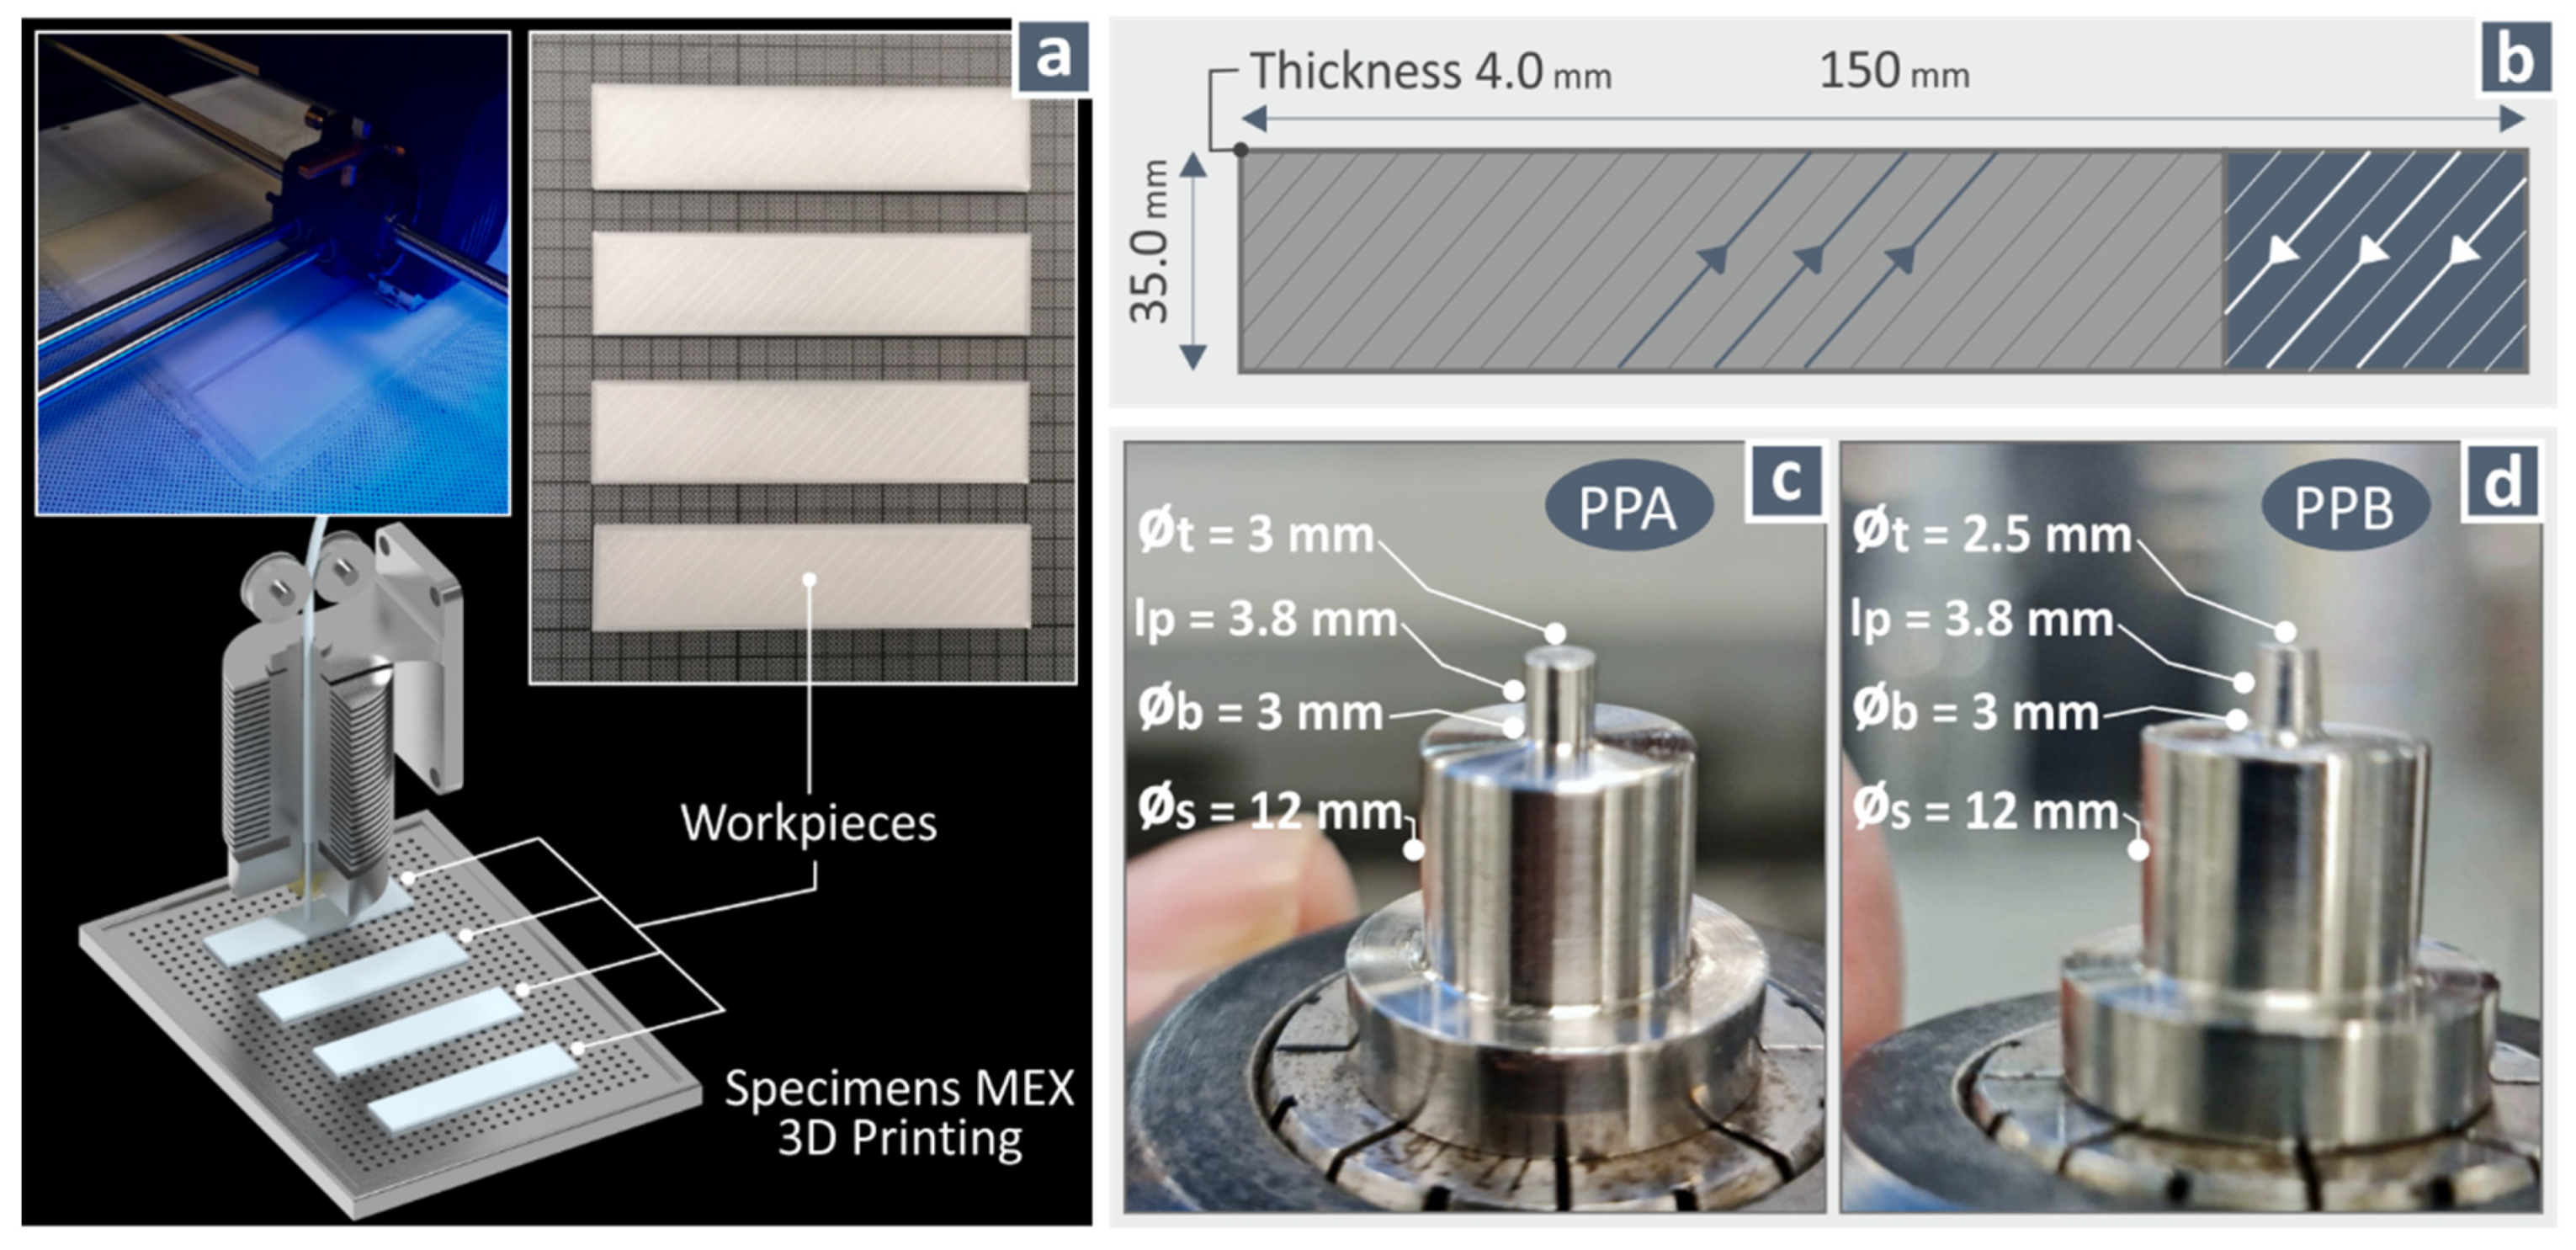
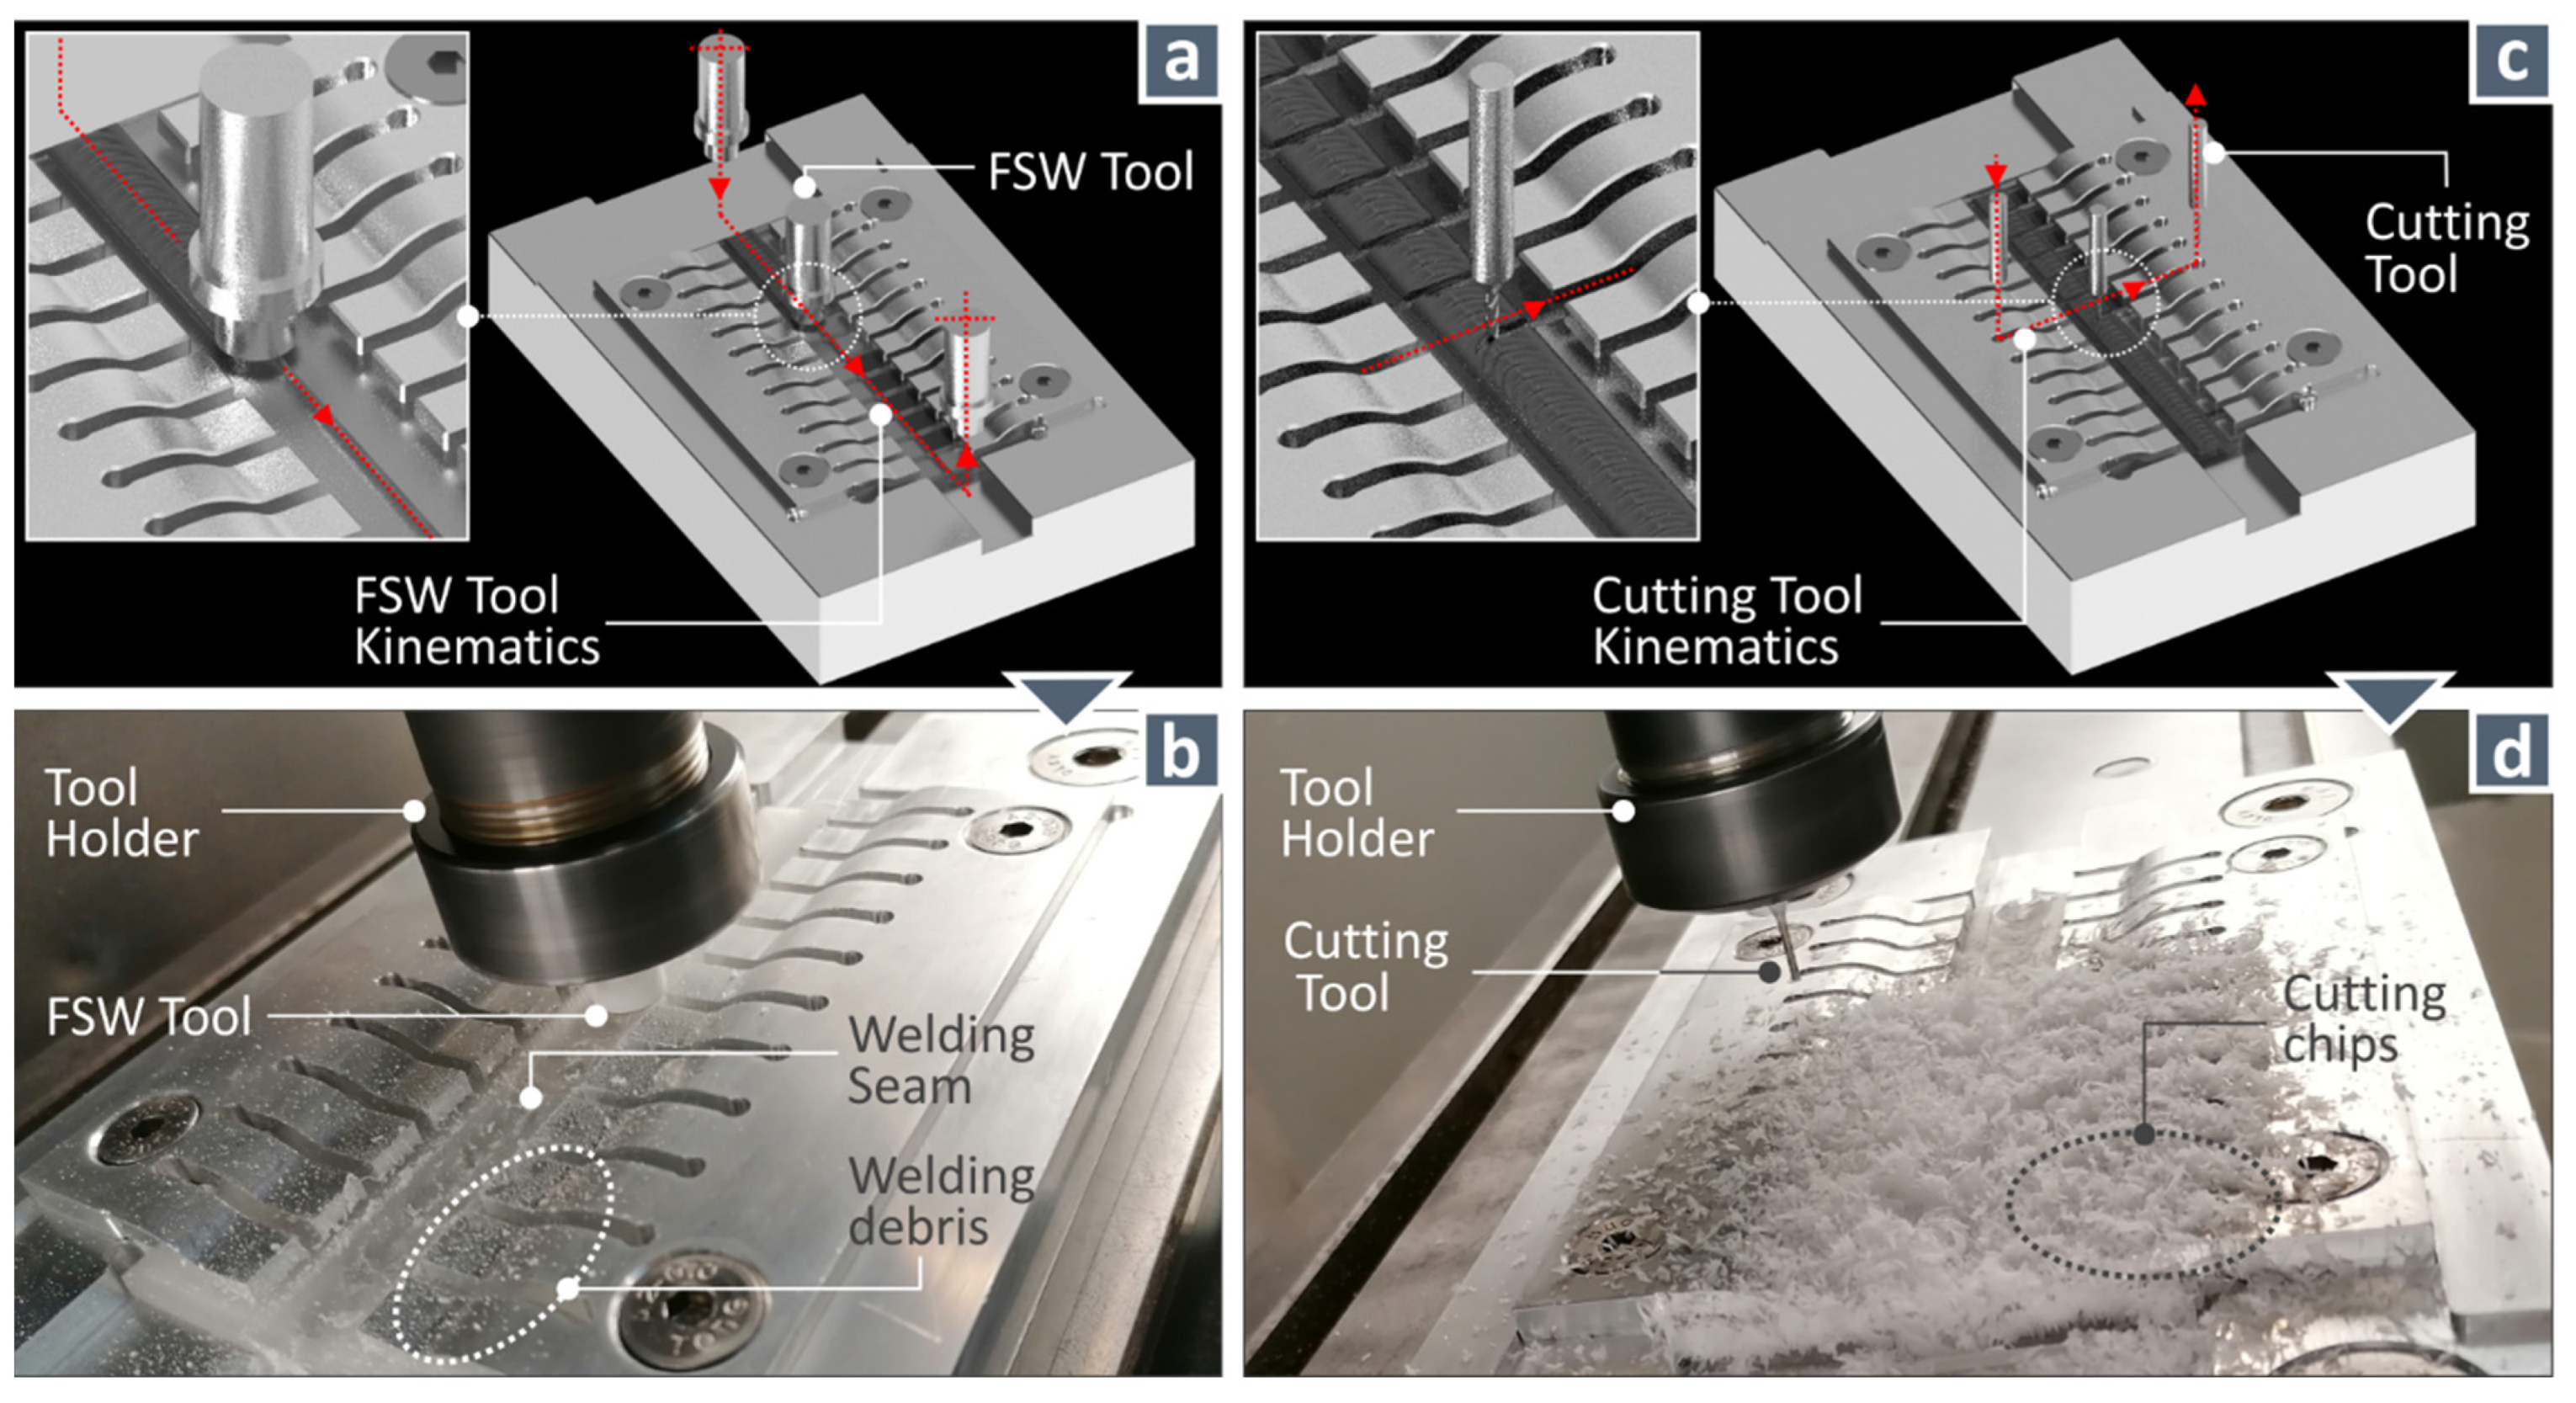
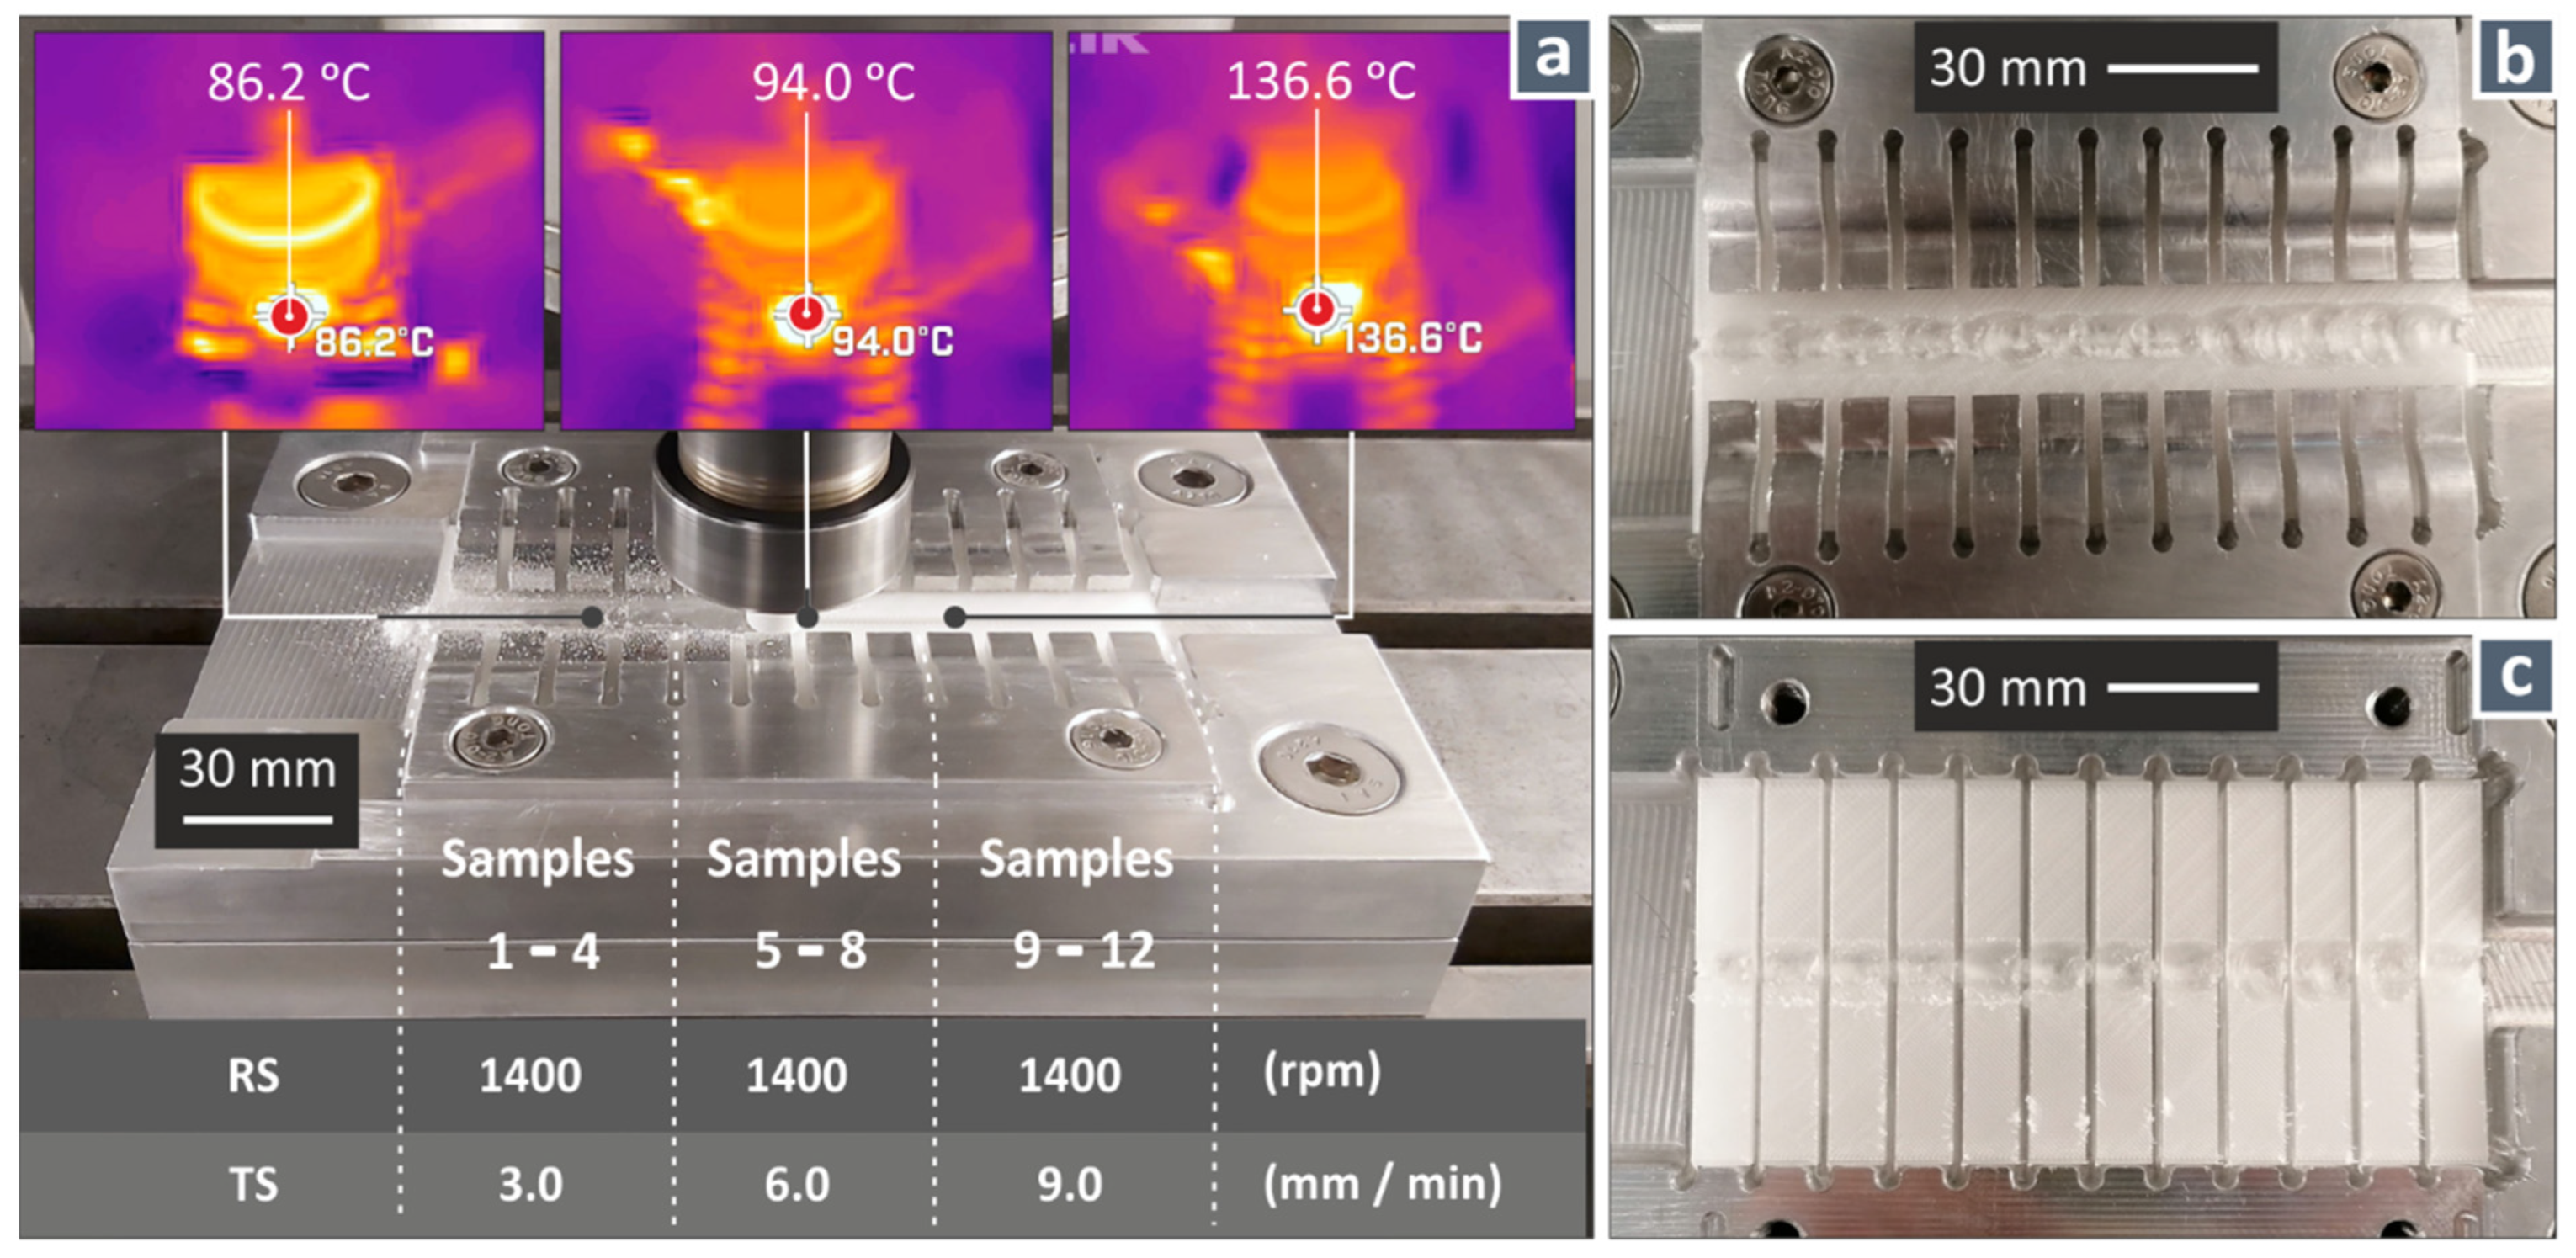
2.1. Experimental Setup

PMMA with a 1.75 mm diameter (brand name MSNJ) was procured for the manufacturing of the workpieces (suitable for the fixture used in the work) with a Zortrax M300 Dual MEX 3D printer (Zortrax, Olsztyn, Poland). The 3D printing and the FSW settings used in the study are depicted in Table 1. The workpiece and the weld tools’ geometry are presented in Figure 1. Two weld tools were manufactured from AISI304L stainless steel bars using a Haas SL20 lathe (their surfaces were polished before their use). One weld tool had a cylindrical pin (Profile Pin A (PPA), Figure 1c) and the other had a tapered pin (Profile Pin B (PPB), Figure 1d), to evaluate the effect of the pin geometry on the weld [51]. The fixture used was suitable for carrying out a straight weld joint on the contact surface of the two workpieces needed in each experiment. The welded part was then cut automatically with the computer numerical control (CNC) milling machine—which performs the FSW process—into 12 welded specimens of 10 mm width each. These were welded under three different sets of welding conditions, so three sets of four identical specimens were produced in each weld experiment.
FSW experiments were conducted on a Haas TM-1P CNC machine (Haas Automation Inc., Oxnard, CA, USA, G-code was programmed in the machine’s MCU). During the experiments, the temperature was monitored with a Flir One Pro thermal imaging camera (Teledyne Flir, Wilsonville, OR, USA).
Thermogravimetric analysis (TGA) (PerkinElmer Diamond, PerkinElmer Co., Waltham, MA, USA, heating: 30–550 °C, step: 10 °C/min) and differential scanning calorimetry (DSC) (TA Instruments DSC 25, TA Instruments, New Castle, DE, USA, cycle: 25–220–25 °C, step: 15 °C/min) were performed to determine the thermal properties of the PMMA used in this work.

2.2. Design of Experiments

This study considers three repetitions of each combination, resulting in 54 individual experiments: two categorical values for tool geometry, and three continuous values for rotational speed (RS) and travel speed (TS) (3 × 2 × 3 × 3 = 54). Their levels are presented after preliminary extensive experimental work and a literature review, as presented in the Materials and Methods section (see Table 1).

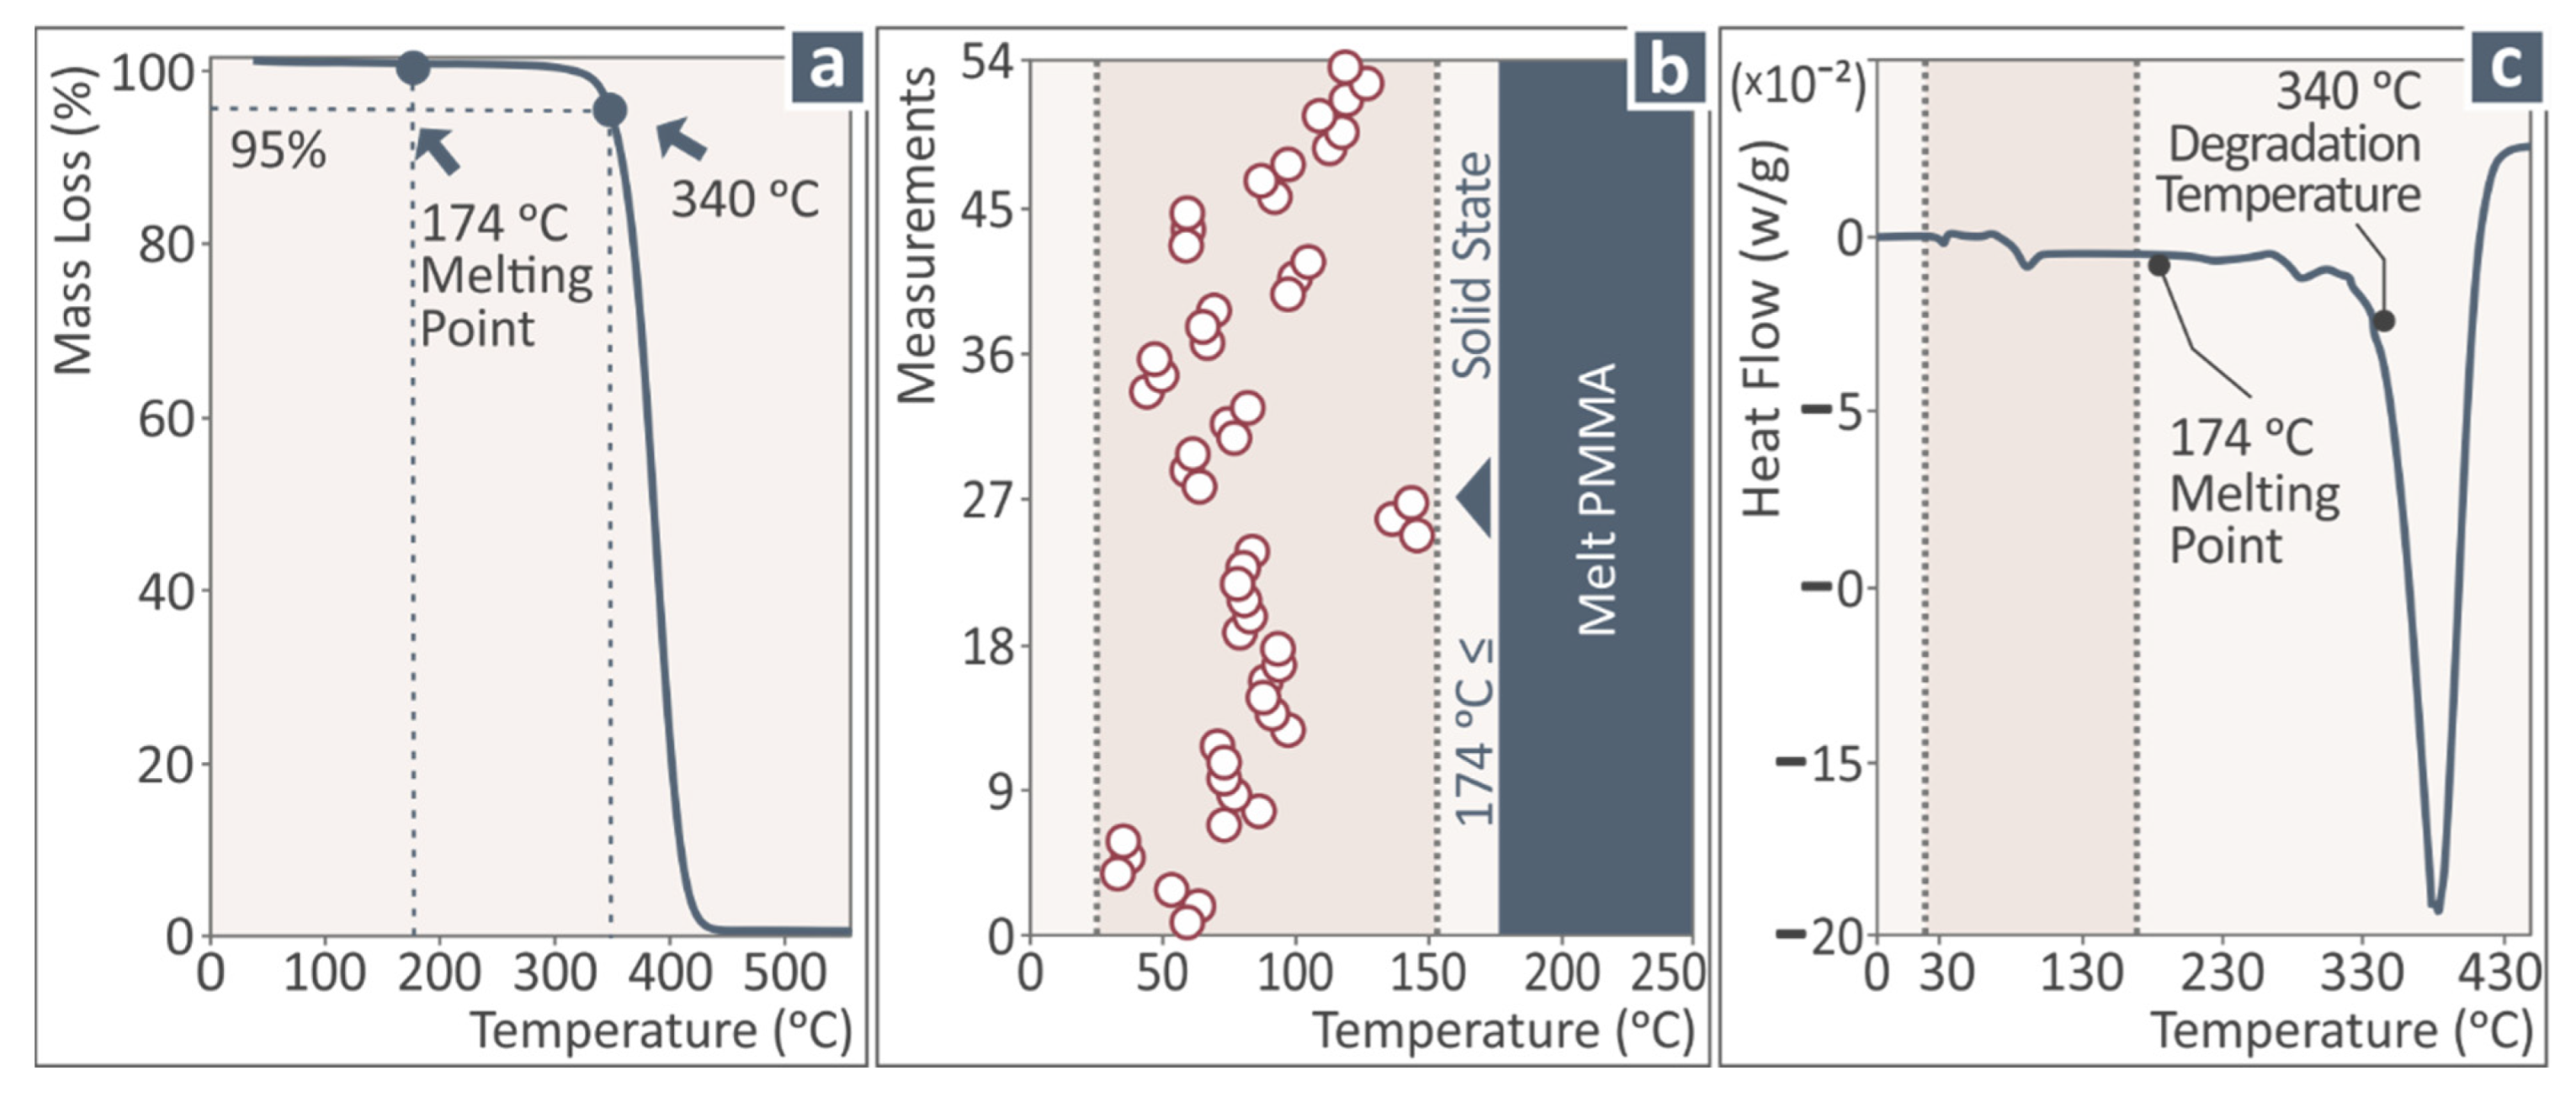
2.3. Evaluation of the Experimental Process

The welded workpieces (and a non-welded 3D-printed specimen for evaluation) were examined for their mechanical performance via tensile testing (Imada MX2, Imada Inc., Northbrook, IL, USA, elongation speed 10 mm/min, 23 °C, and 50% humidity), and their morphological properties were determined via stereoscopy upon the completion of the FSW process. A stereoscope (KERN OZR5, Kern & Sohn GmbH, Balingen, Germany), an optical microscope (Kern OKO 1, Kern & Sohn GmbH, Balingen, Germany) (both with a KERN ODC 832 5MP camera for image capturing, Kern & Sohn GmbH, Balingen, Germany), and a scanning electron microscope (JEOL JSM 6362LV, Jeol Ltd., Tokyo, Japan, 20 kV acceleration voltage, gold-coated specimens) were used to examine the morphology of the welds. The heat-affected zone (HAZ) and the transitional area of the weld were thoroughly analyzed for any phenomena in those regions.

3. Results and Discussion

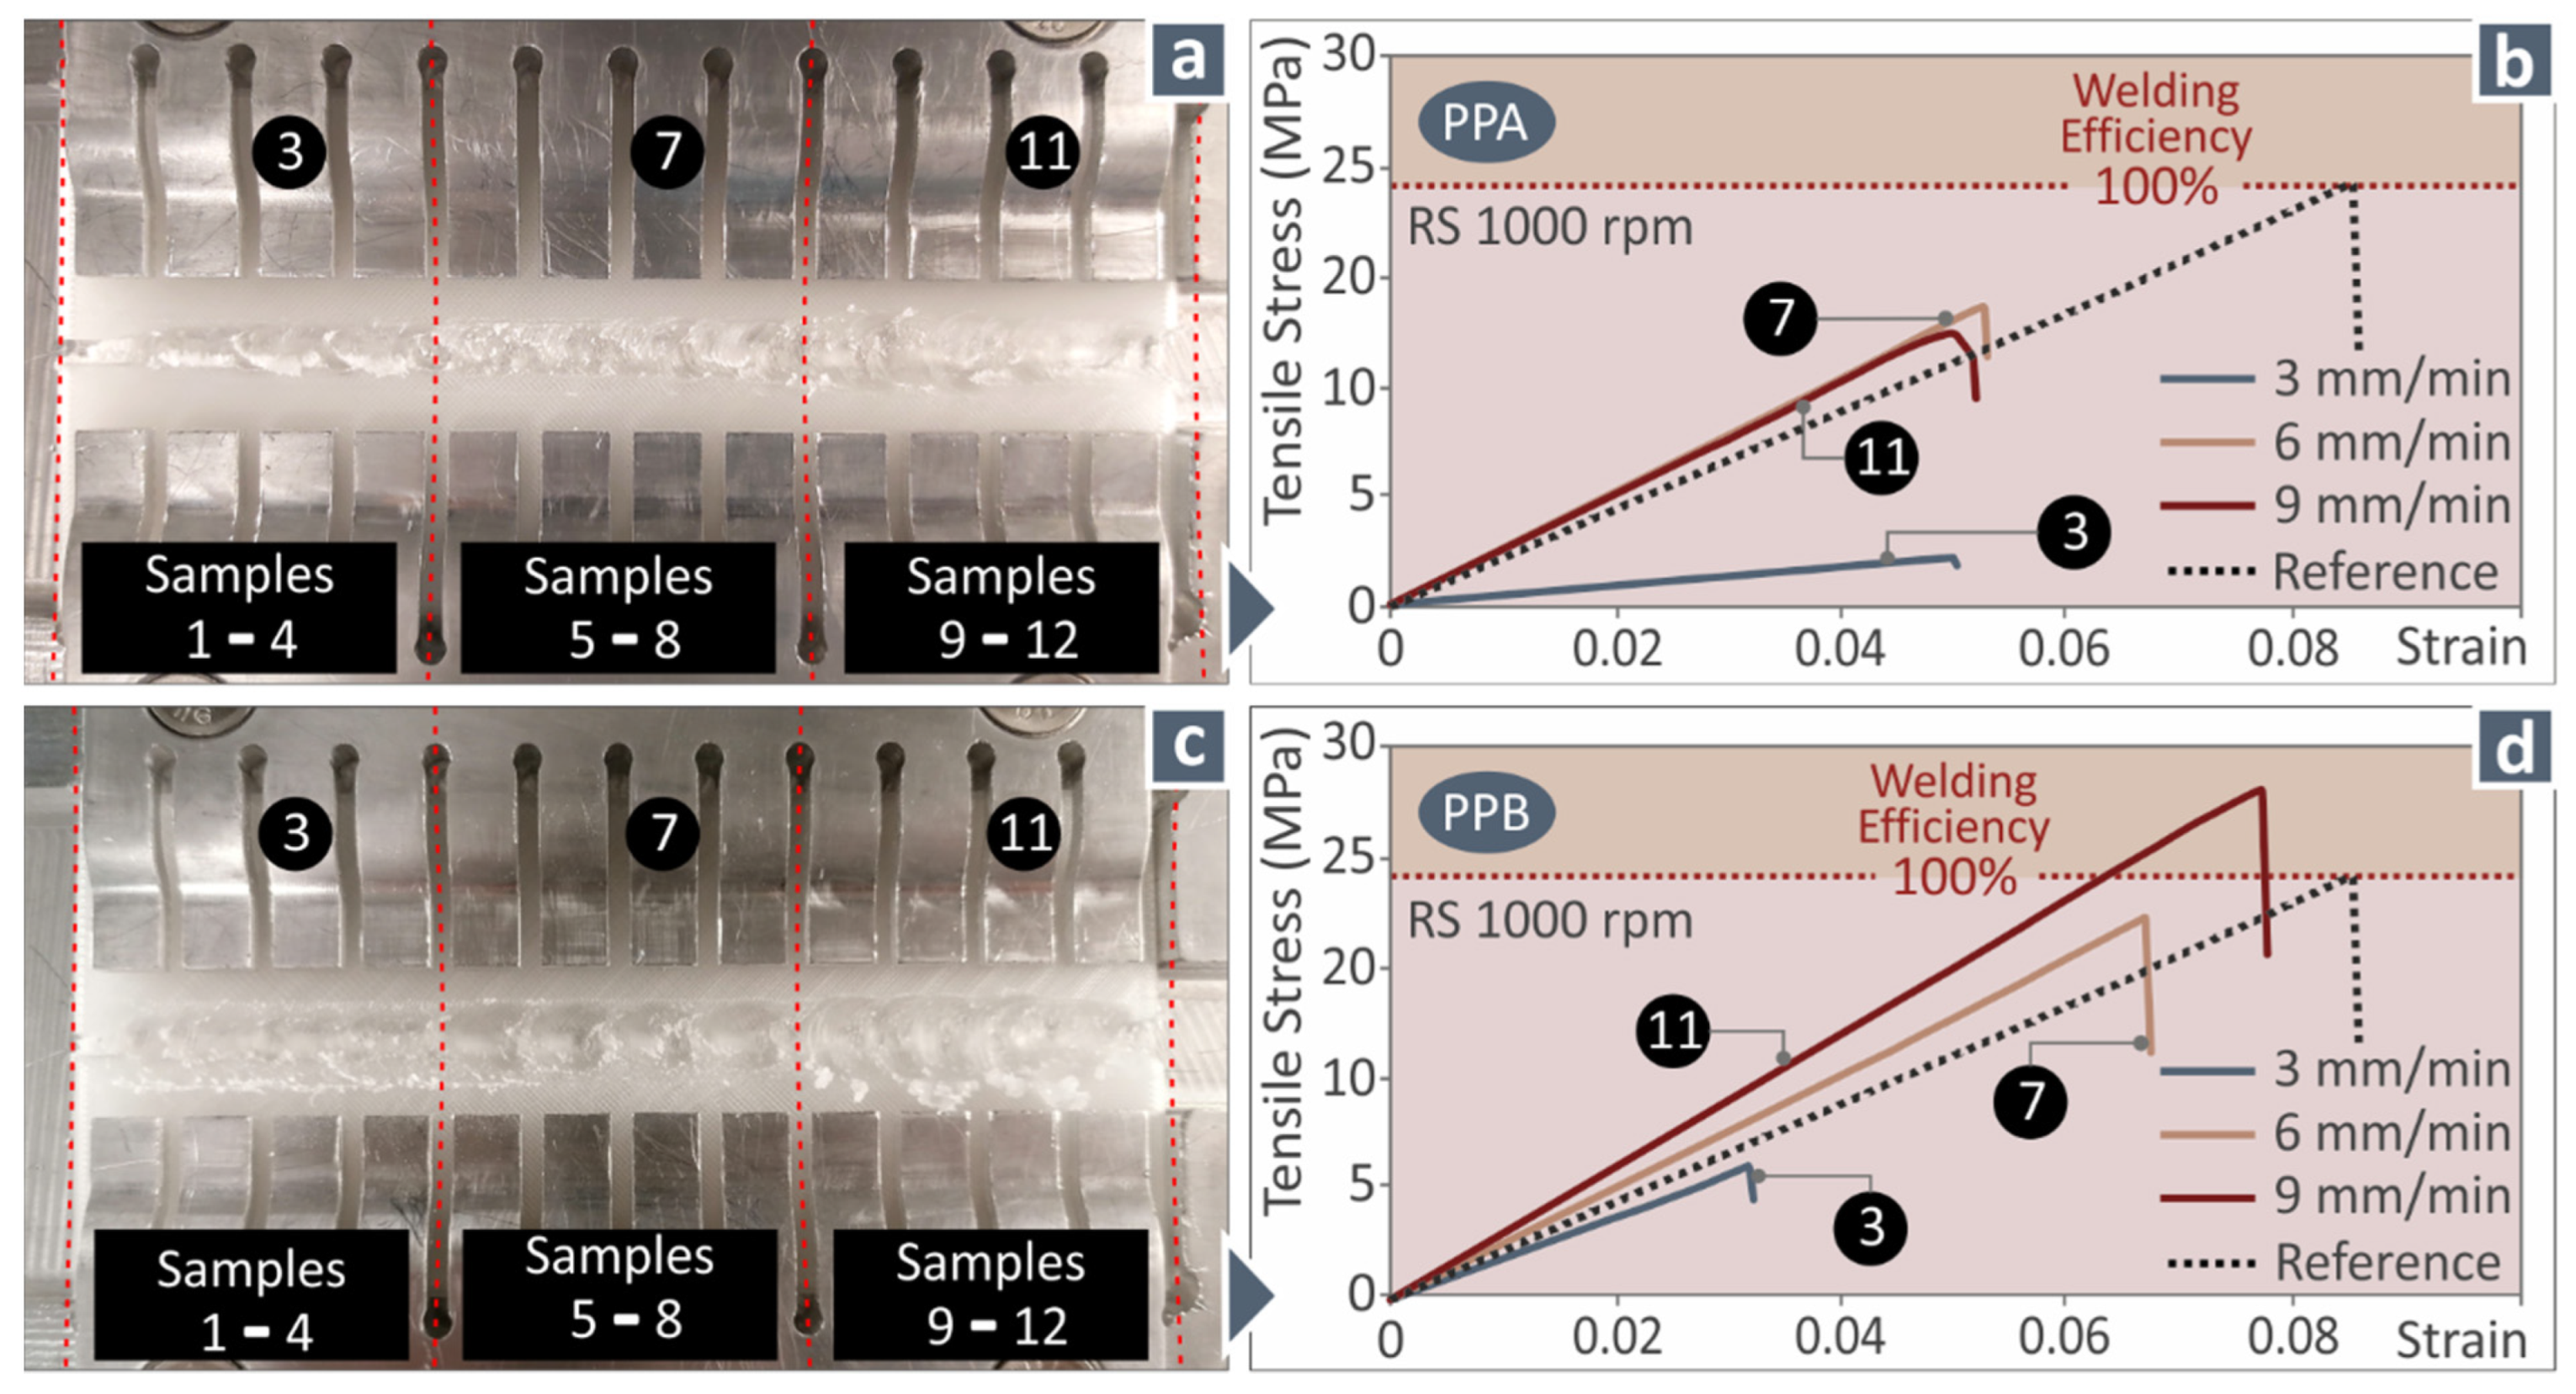
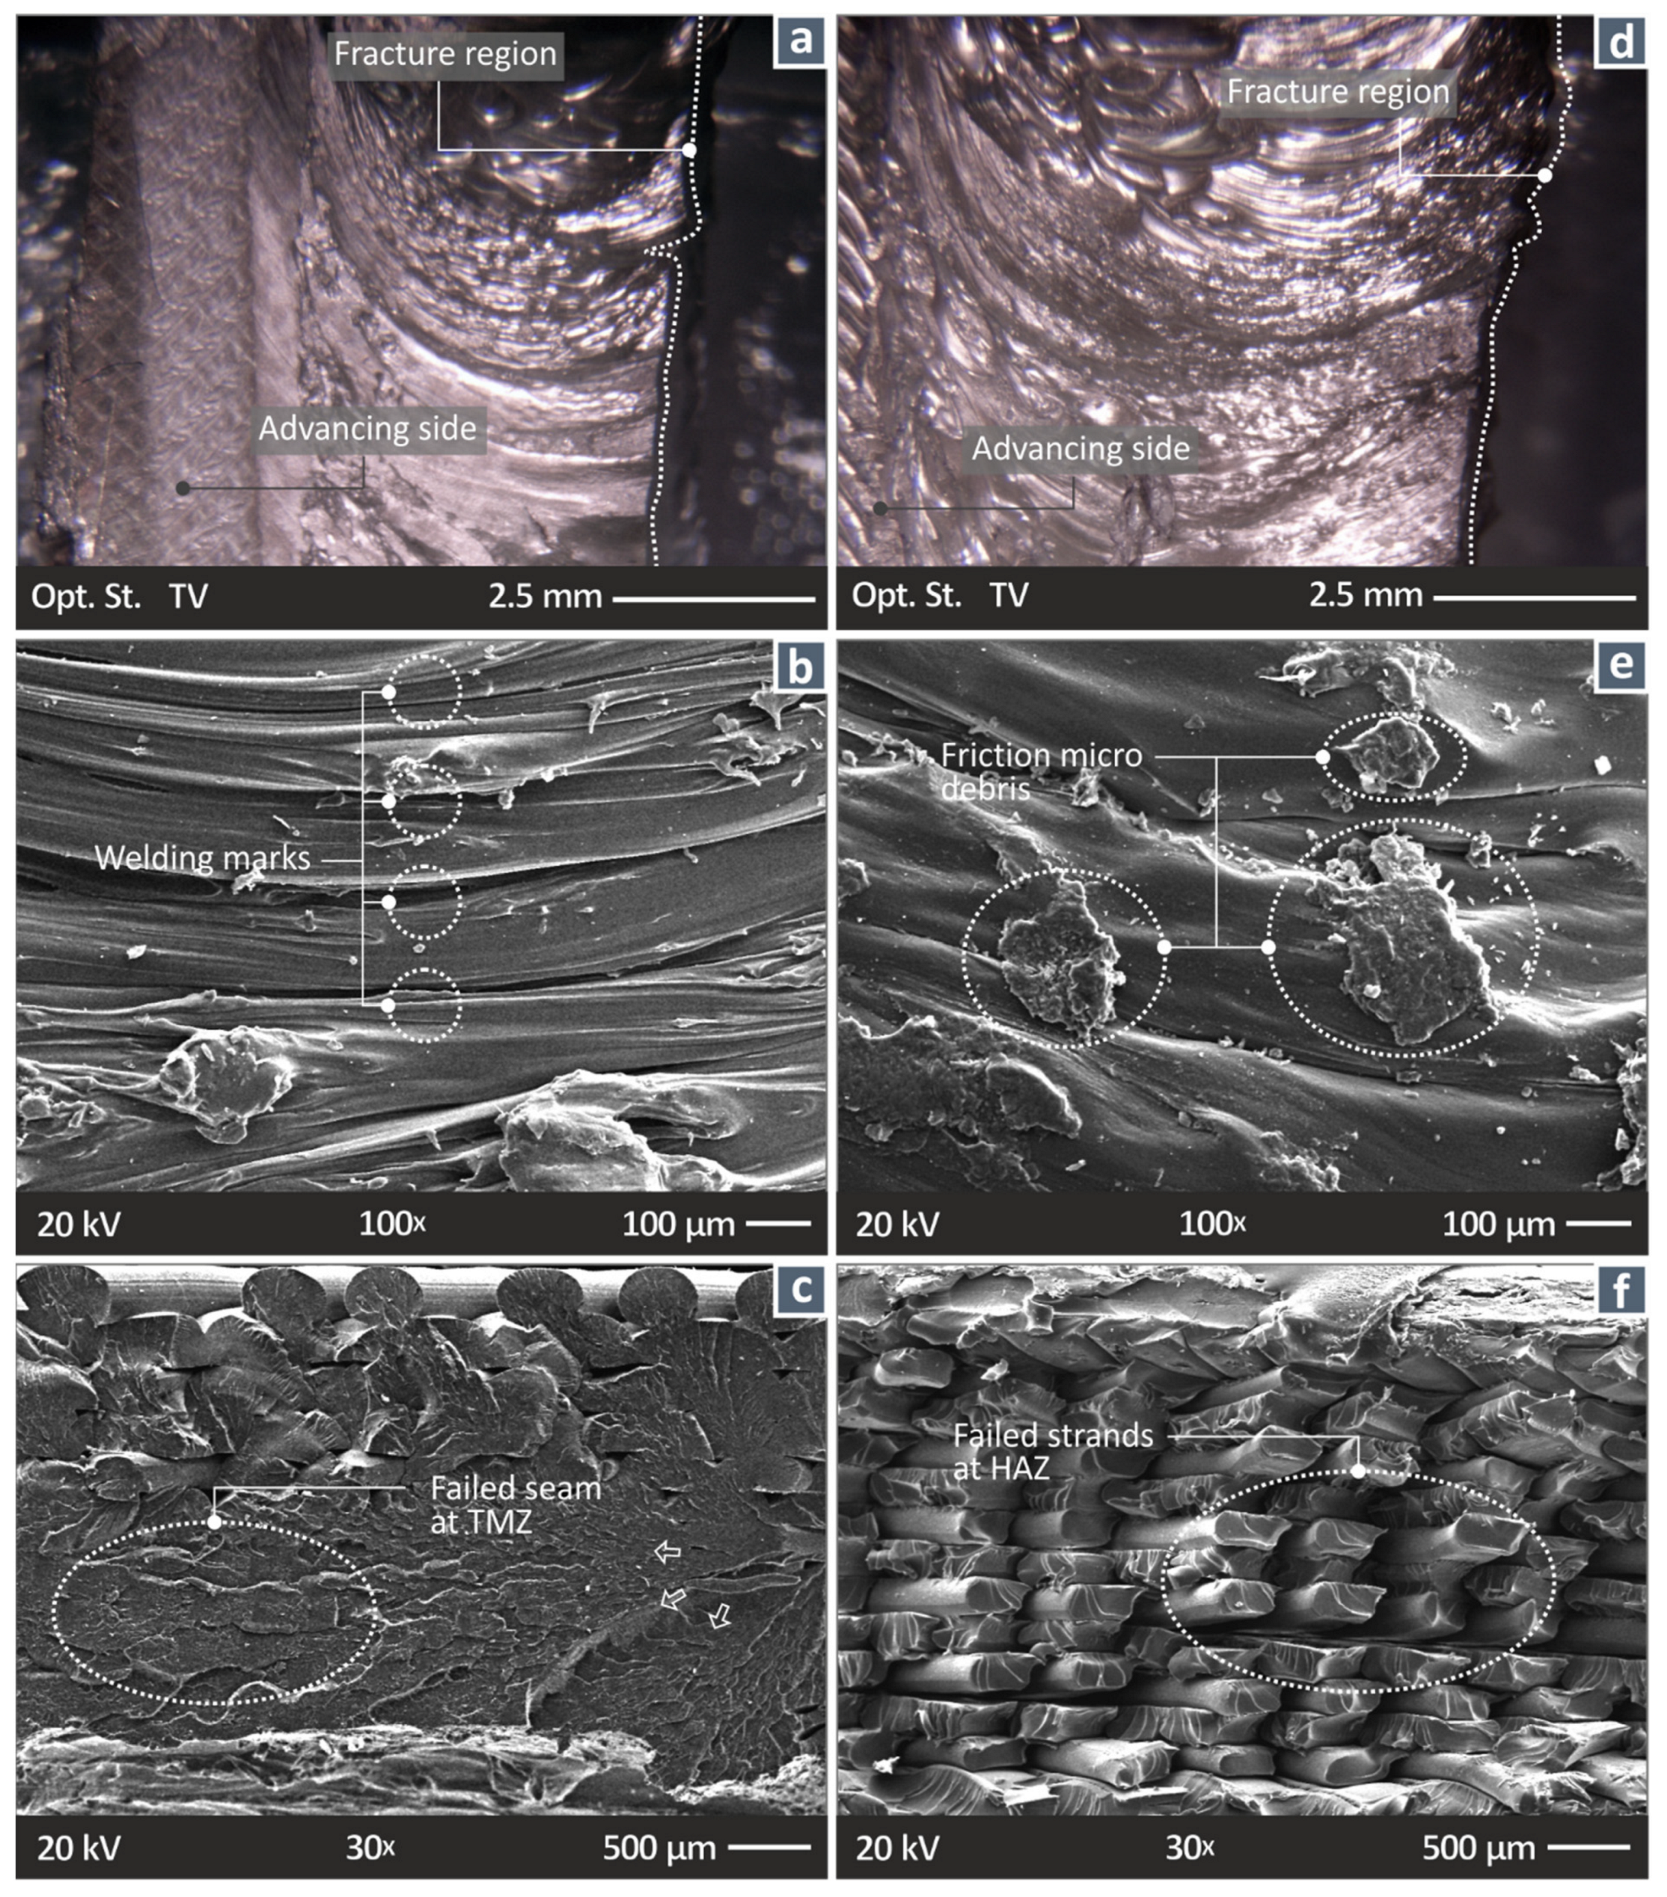
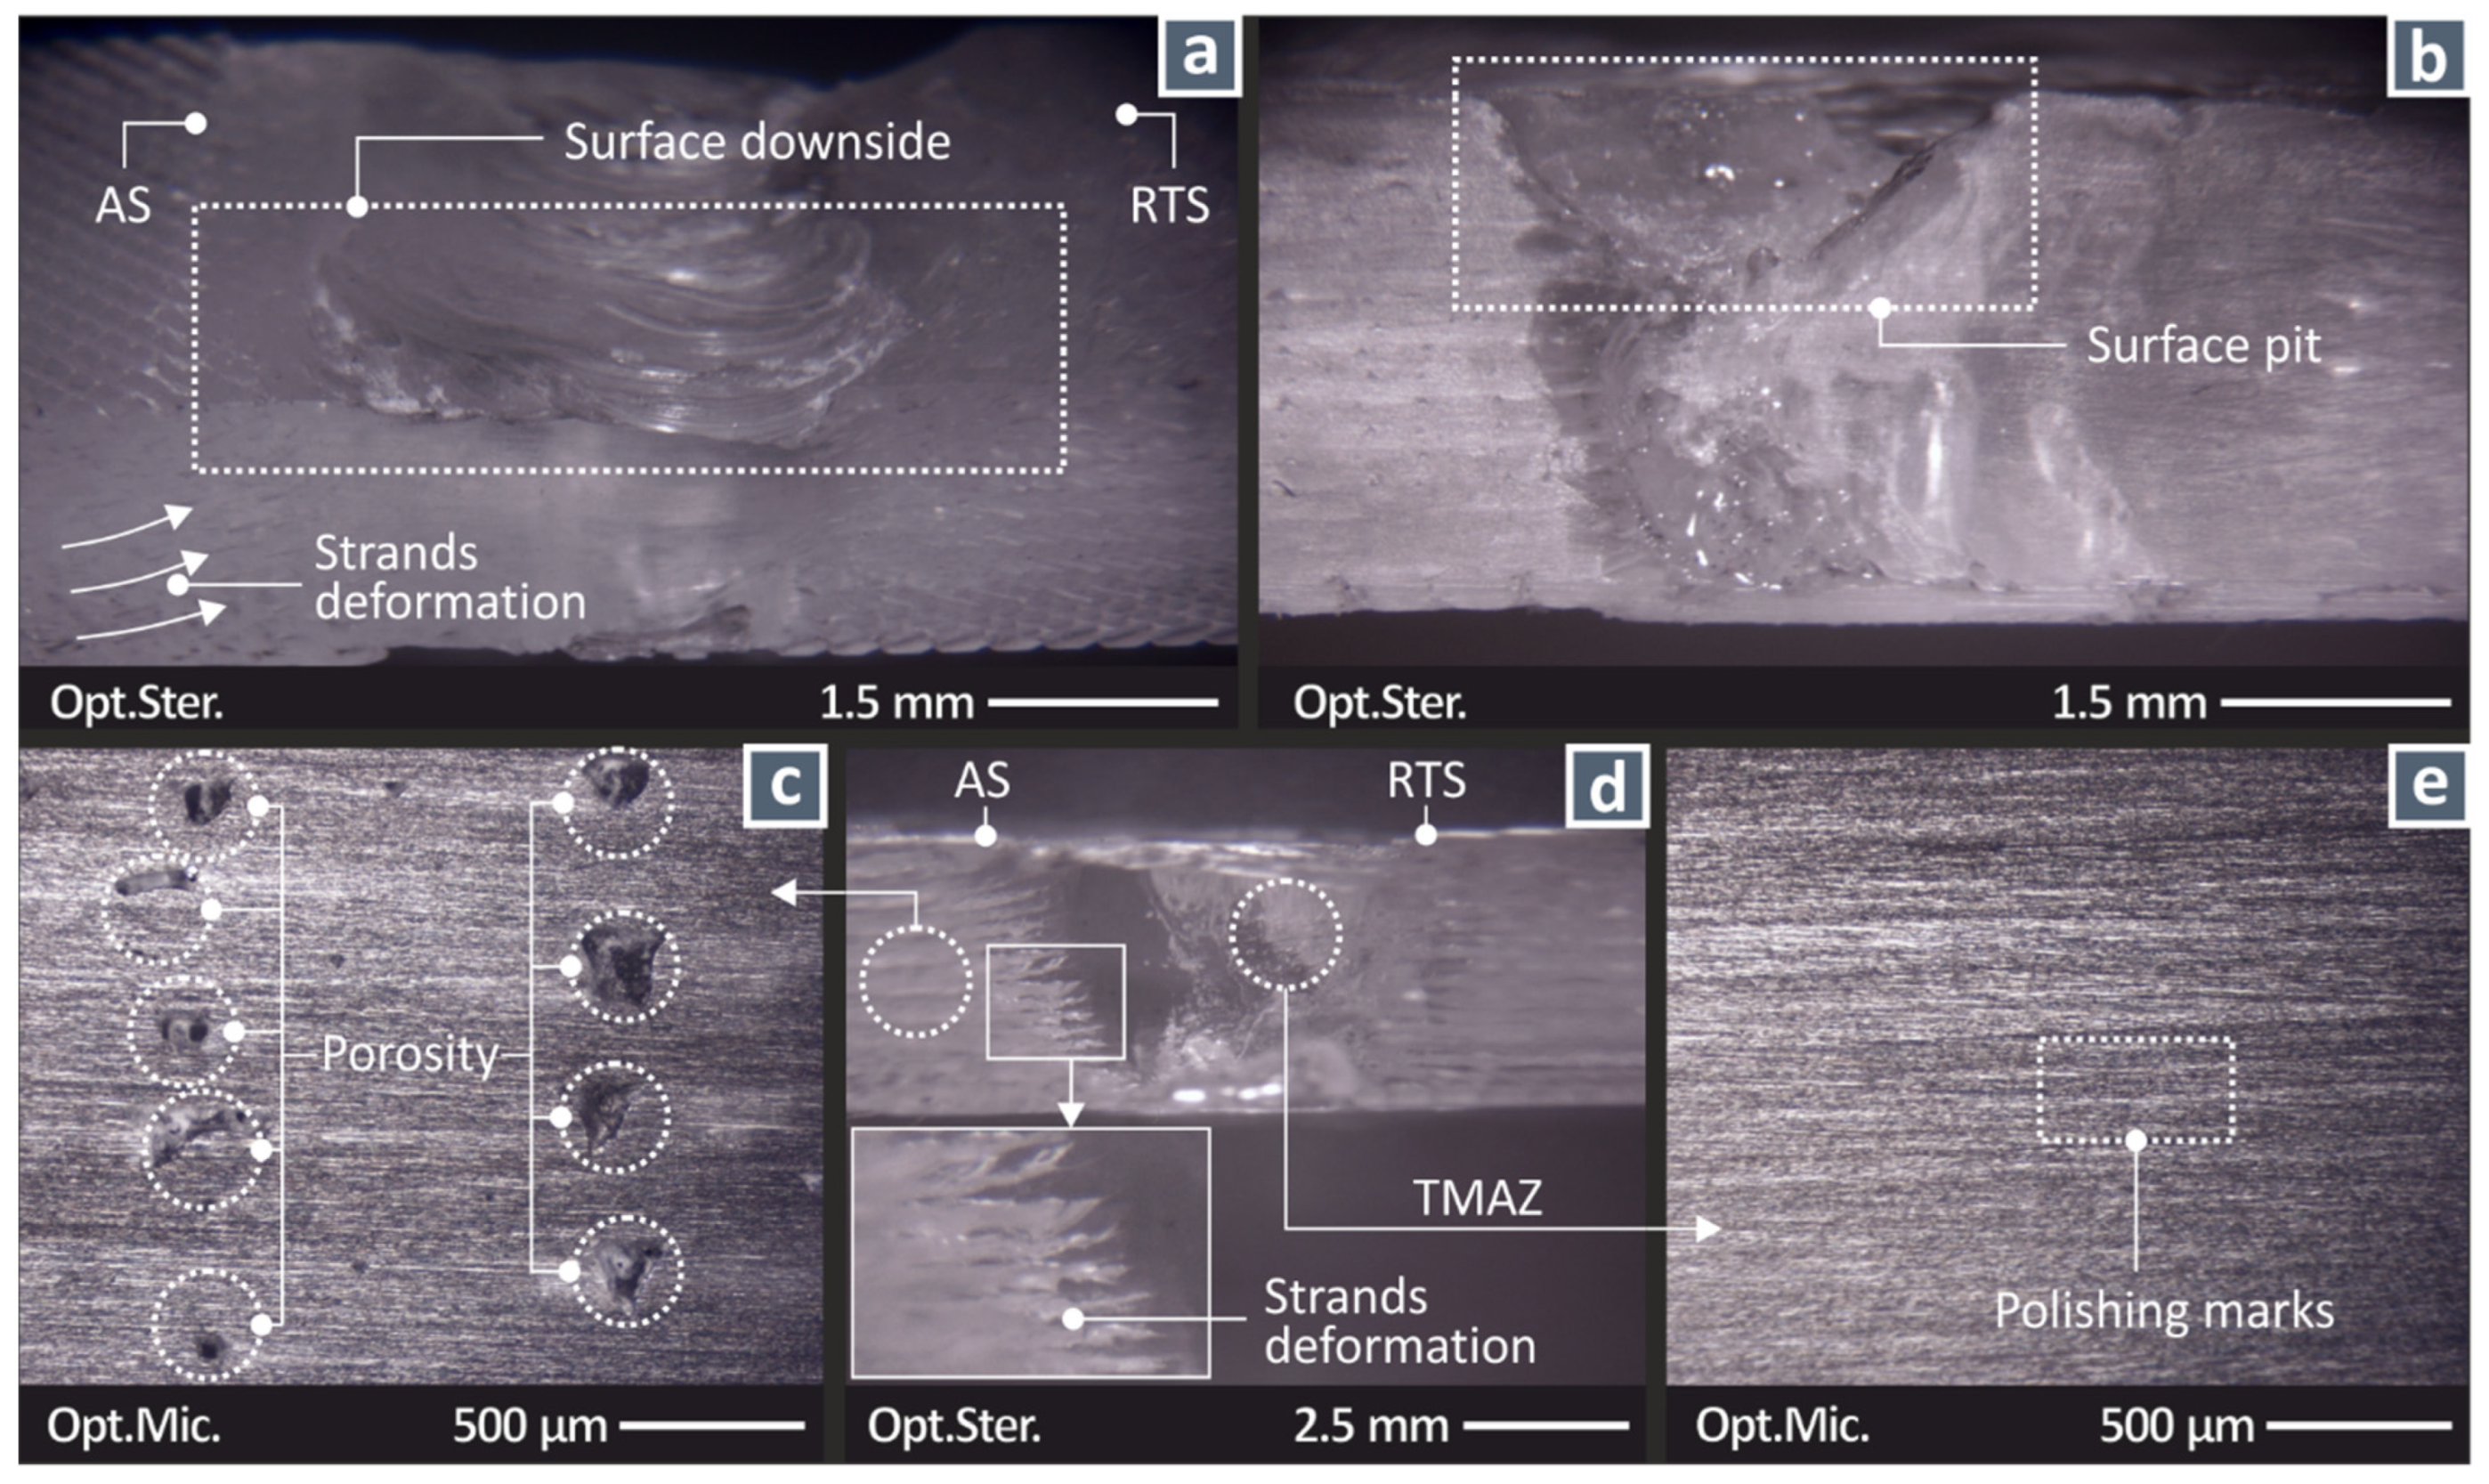
3.1. FSW Process Experiments and Evaluation

Figure 2 illustrates the experimental process for the FSW (Figure 2a,b) and the cutting of the specimens (Figure 2c,d). The FSW process conditions in the three different regions are shown in Figure 3a. The finished weld seam is shown in Figure 3b, and the specimens after the cutting process are shown in Figure 3c.
Figure 4 shows the completed weld seam for workpieces joined with the PPA weld tool (Figure 4a) and the PPB weld tool (Figure 4c). Figure 4b,d depict typical stress–strain curves for specimens welded with various travel speed (TS) values using the PPA and the PPB tools, respectively. In both cases, specimens welded with a higher TS exhibited higher mechanical strength values, with the specimen welded with the PPB tool having higher strength than the non-welded MEX 3D-printed specimen tested for evaluation. Such differences verify the significance of the FSW parameters in the weld performance. Specimens welded with the PPA tool showed a satisfactory mechanical response, but lower than that of the reference specimen, which also had a more ductile response than the welded specimens. Most of the specimens failed in the tensile tests in the transitional region between the welded area and the non-welded area, at the limits of the heat-affected zone (HAZ). This indicates that the strength of the weld was higher than the remaining part, since it did not fail in the weld region. This was attributed to the reduction or disappearance (optically seen) of porosity in some cases in this region.
Figure 5 shows the side surface of the welded specimens on the stereoscope and the optical microscope. The deformation of the filament strands of the 3D-printed structure can be observed (Figure 5a,d, optical stereoscope). The surface downside shown in Figure 5a is a typical characteristic of the FSW joint, and it is induced by the squeezing-out of material in the weld zone [52]. In this case, it is more intense, attributed to the material retreating to fill the porosity of the 3D-printed structure (shown in Figure 5c, optical microscope) during the FSW process. In the weld region, no porosity can be observed (Figure 5e, optical microscope). Defects such as surface pits (Figure 5b) caused during the process can also be observed.
Figure 6 shows images (stereoscopic and SEM) from the HAZ and the fracture area of specimens welded using the PPA (Figure 6a–c) and PPB (Figure 6d–f) weld tools. The characteristic onion rings are visible in both specimens, with the PPA specimen showing a rougher surface. In the fracture areas, the PPA specimen shows a more ductile response (Figure 6c) compared to the PPB specimen (Figure 6f), which shows a brittle fracture mechanism. This is consistent with the tensile test graphs. Both specimens failed at the transitional area between the welded and non-welded regions.
Figure 7a shows the TGA graph produced for the PMMA filament used herein, while Figure 7c shows the corresponding DSC graph. In both graphs, the characteristic temperatures (melting point: 174 °C, radical material degradation: 340 °C) are indicated. From the determined temperatures, it can be seen that the 3D printing process does not affect the thermal stability of the material. Figure 7b shows the maximum recorded temperature in each of the conducted experiments, with the maximum measured value being 146 °C. This temperature is consistent with corresponding temperature measurements from the literature with regard to FSW of bulk PMMA sheets [20,43]. From the comparison of the graphs, it can be confirmed that the material was in a solid state during the FSW process, which is consistent with the process specifications, and ensures the reliability of the derived experimental results. The highest temperature was recorded for the sample welded at 1400 rpm with the frustum tool and a 6 mm/min TS. Overall, the highest RS caused higher temperatures in the process. The lowest temperature was recorded for the sample welded at 1000 rpm with the cylindrical tool and a 3 mm/min TS. The temperatures per case are presented analytically in Table 2.

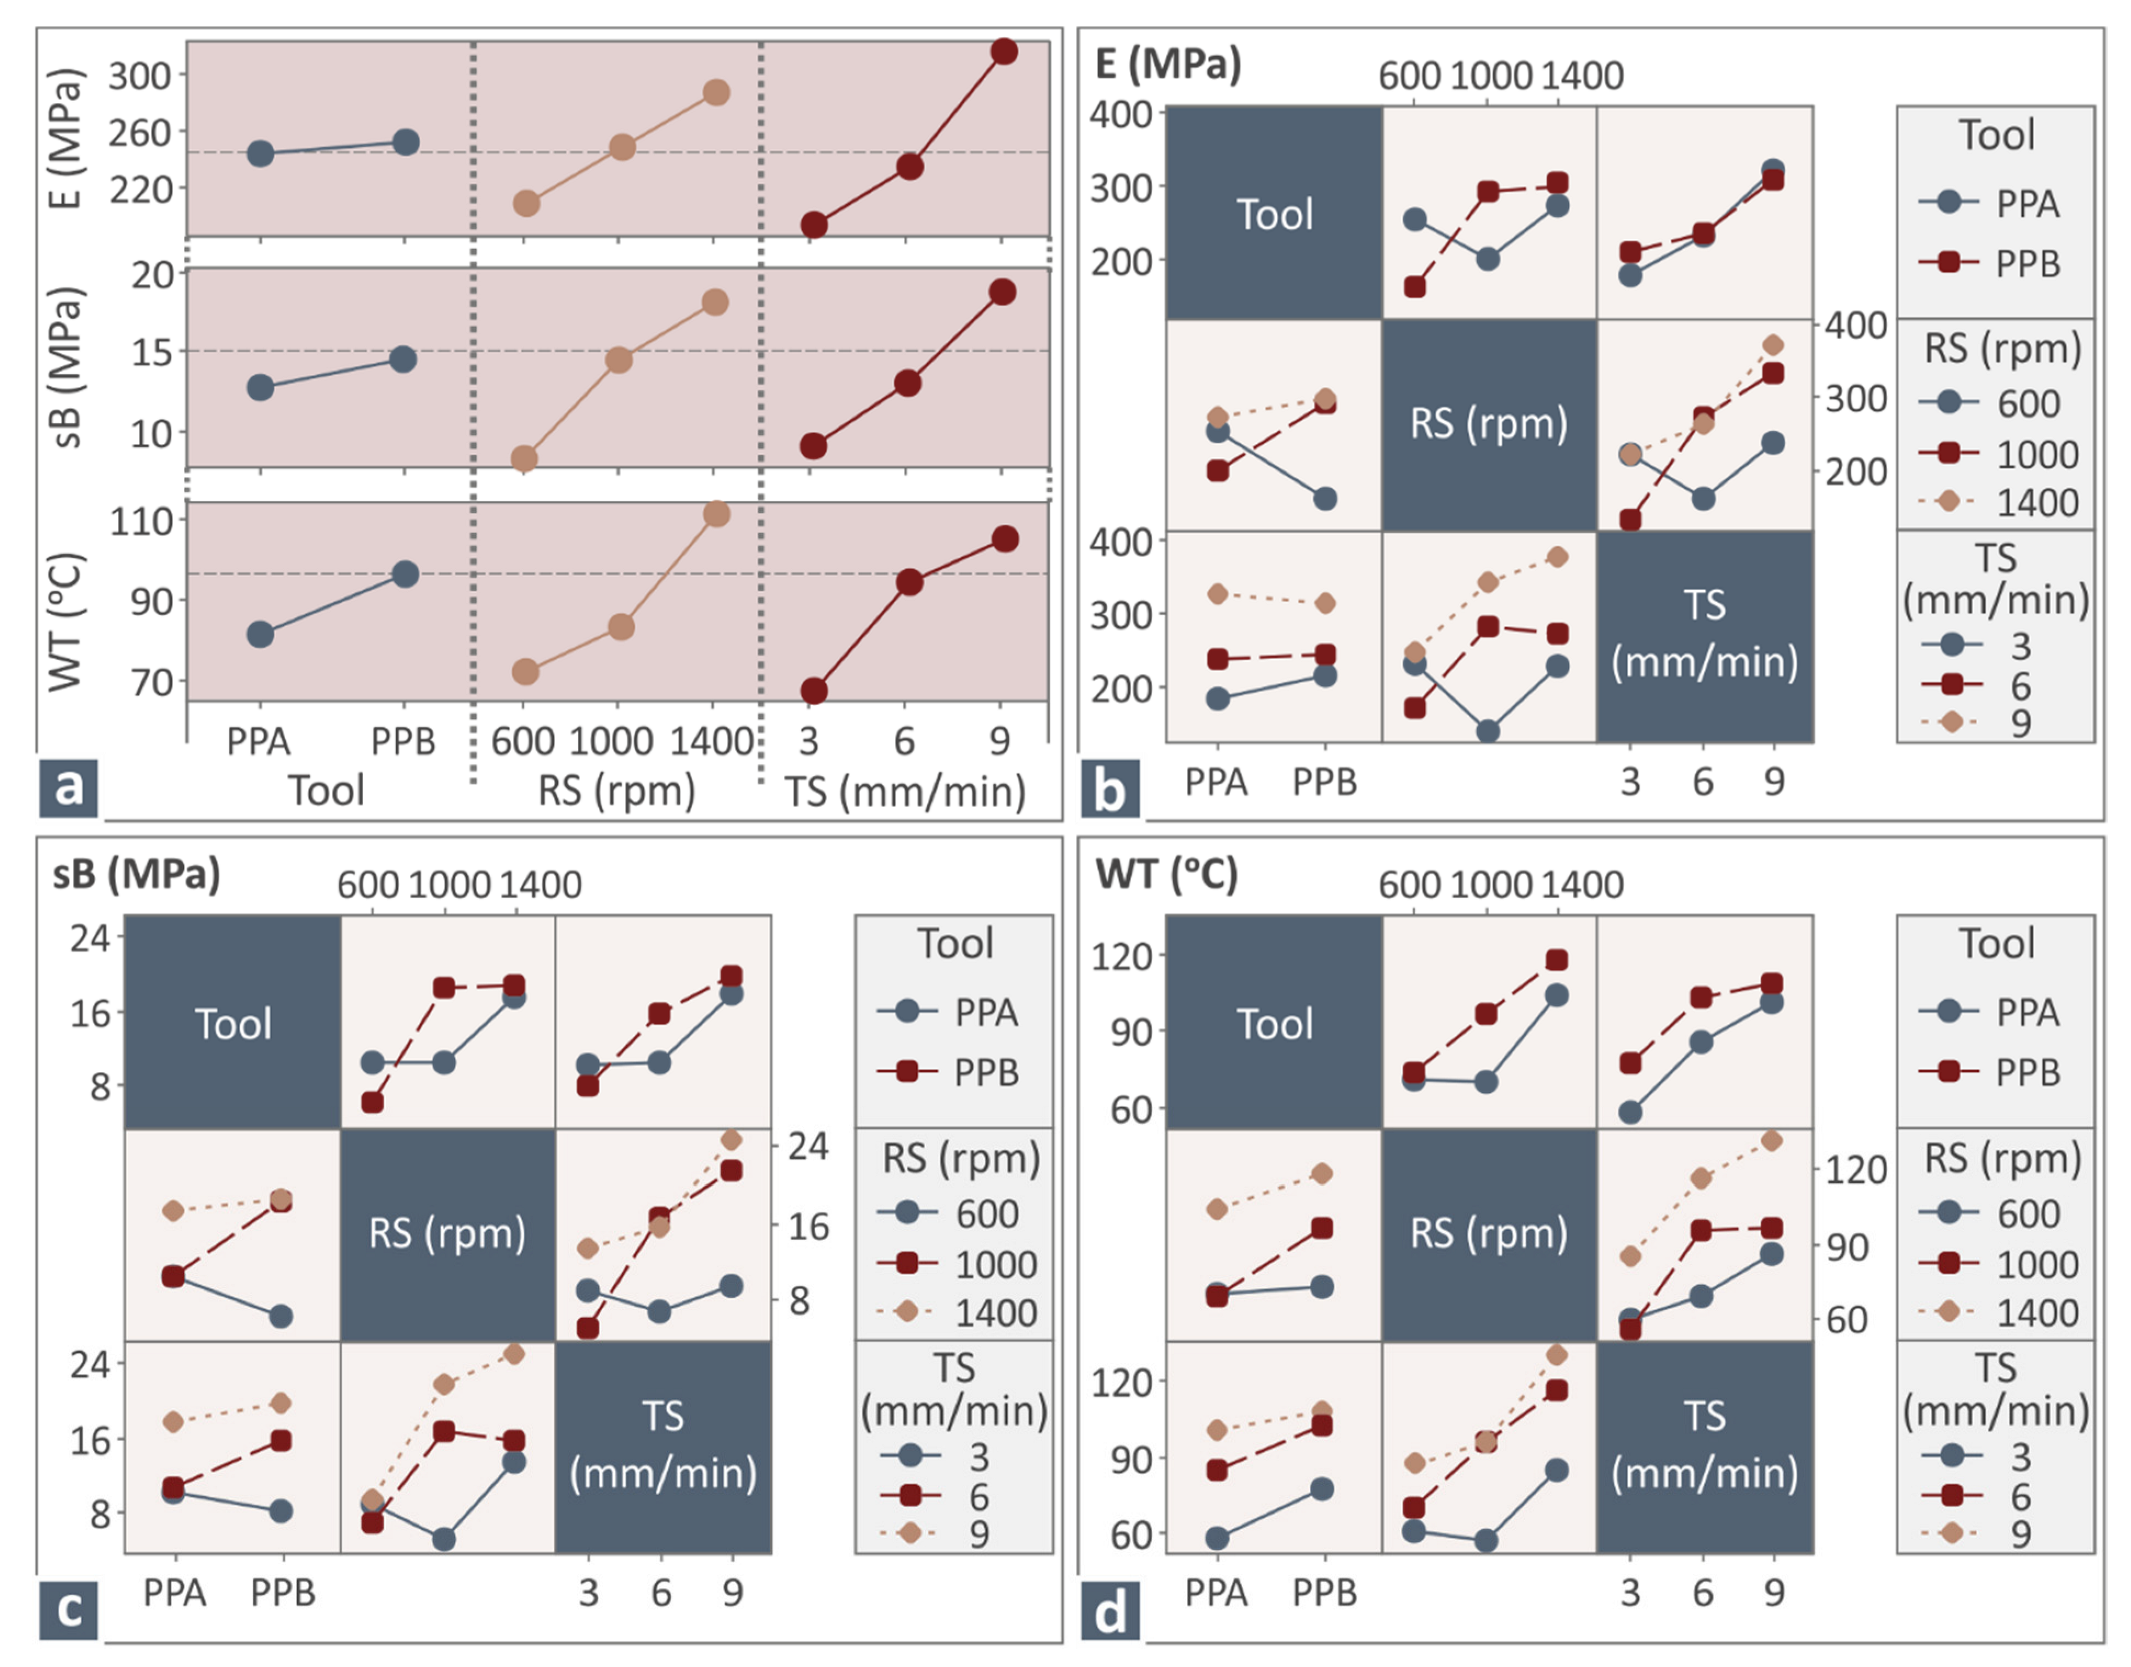
3.2. Statistical Modeling and Optimization of the Results of the Mechanical Tests

The results of Table 2 can be analyzed using descriptive statistics such as main effect plots (MEPs), interaction charts, and analysis of variance (ANOVA). Therefore, the trend of each parameter with respect to tensile modulus of elasticity (E), tensile strength (sB), and welding temperature (WT) can be decomposed and optimized accordingly.
The MEPs of tool, RS, and TS versus E, sB, and WT are depicted in Figure 8a.
  • The Pin Profile B (PPB) tool optimizes all metrics (E, sB, and WT). PPB has a conical shape, in contrast with PPA, which is cylindrical. Consequently, the contact area between the tool and the 3D-printed material is more extensive, resulting in higher energy generation due to friction, and a higher welding temperature. In addition, better mixing and homogenization are achieved, leading to a better mechanical response in the welded area (E and sB).
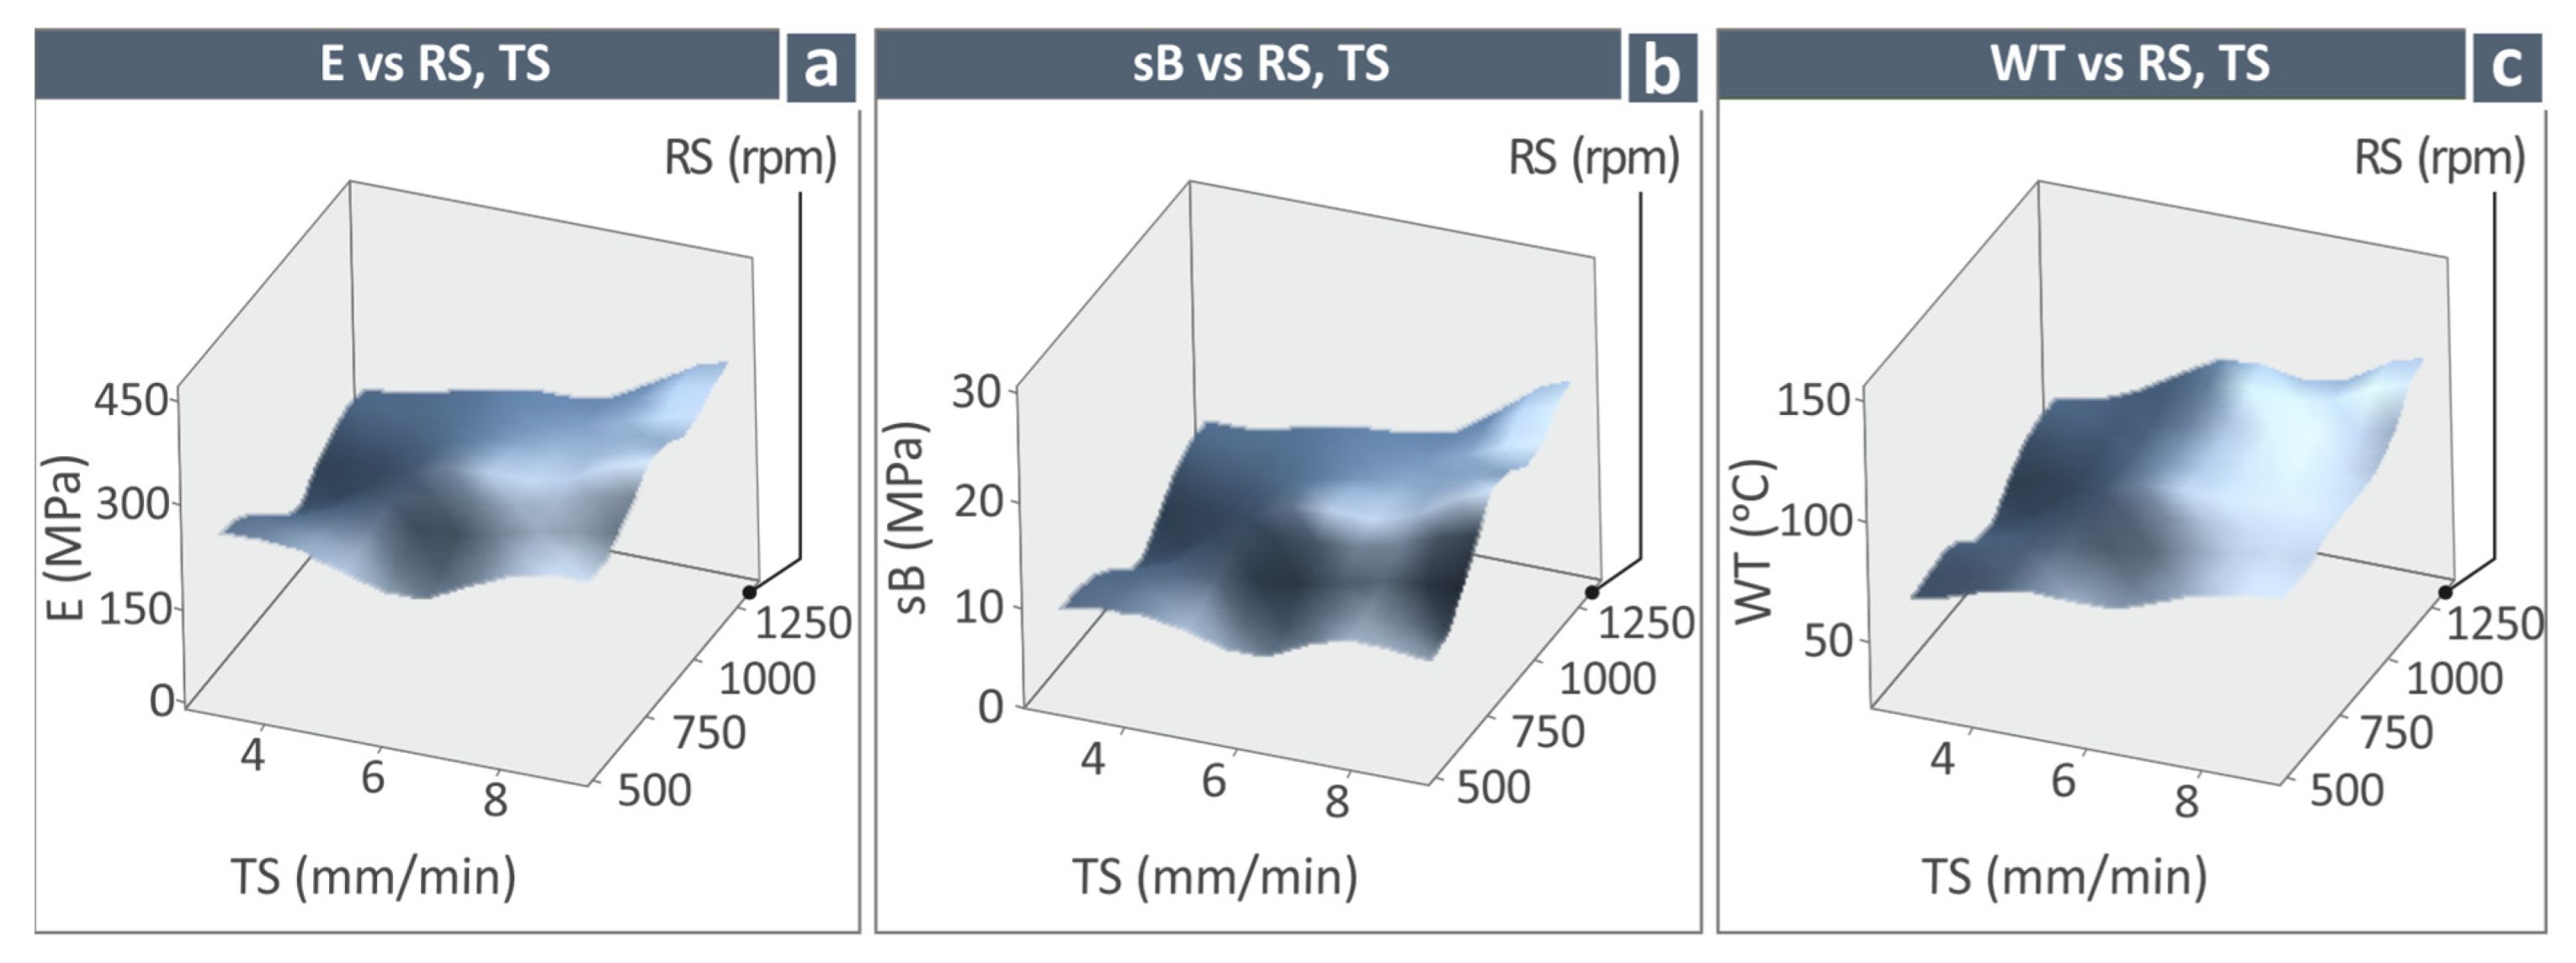
  • The rotational speed increases the welding temperature, modulus E, and ultimate tensile strength in the welded area. In addition, the increase in the RS increases the heat produced in the contact area between the plasticized material and the pin area, and better mixes the mass between the tool’s leading and trailing edges. Therefore, the increase in RS increases the WT, E, and sB in the particular experimental space.
  • The increase in TS also increases the weld temperature and the weld mechanical response. The transverse speed increases the tangential force, which interacts with the friction coefficient between the pin surface and the plasticized material, producing higher heat transfer rates, resulting in higher WT, E, and sB.
  • Figure 8b–d show the interaction plots between tool, Ra, and sB versus E, sB, and WT. These plots can decompose the interaction type—linear or nonlinear—between the processing parameters. It can be observed that the trend lines are smooth in all three cases for all interactions between the tool, RS, and TS, showing linear interactions with cross-products (i.e., synergistic interactions) (Table 2).
  • There is no similar work in the literature with which to correlate and compare the experimental results of this study. Tensile test results, when joining bulk PMMA sheets with FSW, are in good agreement with the results of this study [20]. In the former work, the ultimate tensile strength was found to be higher than the results of the present study, which is to be expected, as 3D-printed samples have inferior strength to the corresponding bulk (solid) samples.
Figure 9 depicts the surface plots of E, sB, and WT versus RS and TS, clearly showing that TS and RS increase E, sB, and WT.
The analysis of the results led to linear mathematical models—also known as additive models ([53])—with all linear cross-products for predicting the WT, E, and sB with respect to the tool, RS, and TS (see Equations (1)–(3)). Note here that to understand how the additive models work, the reader should study the above reference.
WT = 88.939 − 7.520 T_1 + 7.520 T_2 − 16.811 RS_600 − 5.689 RS_1000 + 22.500 RS_1400 − 21.639 TS_3 + 5.456 TS_6 + 16.183 TS_9 + 6.026 T × RS_1 600 − 6.430 T × RS_1 1000 + 0.404 T × RS_1 1400 − 6.026 T × RS_2 600 + 6.430 T × RS_2 1000 − 0.404 T × RS_2 1400 − 2.269 T × TS_1 3 − 1.396 T × TS_1 6 + 3.665 T × TS_1 9 + 2.269 T × TS_2 3 + 1.396 T × TS_2 6 − 3.665 T × TS_2 9 + 9.56 RS × TS_600 3 − 7.83 RS × TS_600 6 − 1.73 RS × TS_600 9 − 5.18 RS × TS_1000 3 + 7.66 RS × TS_1000 6 − 2.48 RS × TS_1000 9 − 4.38 RS × TS_1400 3 + 0.17 RS × TS_1400 6 + 4.21 RS × TS_1400 9 + 2.38 T × RS × TS_1 600 3 + 5.41 T × RS × TS_1 600 6 − 7.79 T × RS × TS_1 600 9 − 5.18 T × RS × TS_1 1000 3 + 11.15 T × RS × TS_1 1000 6 − 5.96 T × RS × TS_1 1000 9 + 2.80 T × RS × TS_1 1400 3 − 16.55 T × RS × TS_1 1400 6 + 13.75 T × RS × TS_1 1400 9 − 2.38 T × RS × TS_2 600 3 − 5.41 T × RS × TS_2 600 6 + 7.79 T × RS × TS_2 600 9 + 5.18 T × RS × TS_2 1000 3 − 11.15 T × RS × TS_2 1000 6 + 5.96 T × RS × TS_2 1000 9 − 2.80 T × RS × TS_2 1400 3 + 16.55 T × RS × TS_2 1400 6 − 13.75 T × RS × TS_2 1400 9 ± e
sB = 13.613 − 0.885 T_1 + 0.885 T_2 − 5.305 RS_600 + 0.838 RS_1000 + 4.467 RS_1400 − 4.546 TS_3 − 0.574 TS_6 + 5.120 TS_9 + 2.944 T × RS_1 600 − 3.202 T × RS_1 1000 + 0.258 T × RS_1 1400 − 2.944 T × RS_2 600 + 3.202 T × RS_2 1000 − 0.258 T × RS_2 1400 + 1.933 T × TS_1 3 − 1.732 T × TS_1 6 − 0.201 T × TS_1 9 − 1.933 T × TS_2 3 + 1.732 T × TS_2 6 + 0.201 T × TS_2 9 + 5.112 RS × TS_600 3 − 1.046 RS × TS_600 6 − 4.066 RS × TS_600 9 − 5.010 RS × TS_1000 3 + 2.846 RS × TS_1000 6 + 2.164 RS × TS_1000 9 − 0.102 RS × TS_1400 3 − 1.800 RS × TS_1400 6 + 1.902 RS × TS_1400 9 − 5.613 T × RS × TS_1 600 3 + 4.966 T × RS × TS_1 600 6 + 0.647 T × RS × TS_1 600 9 − 0.596 T × RS × TS_1 1000 3 + 2.465 T × RS × TS_1 1000 6 − 1.870 T × RS × TS_1 1000 9 + 6.209 T × RS × TS_1 1400 3 − 7.431 T × RS × TS_1 1400 6 + 1.223 T × RS × TS_1 1400 9 + 5.613 T × RS × TS_2 600 3 − 4.966 T × RS × TS_2 600 6 − 0.647 T × RS × TS_2 600 9 + 0.596 T × RS × TS_2 1000 3 − 2.465 T × RS × TS_2 1000 6 + 1.870 T × RS × TS_2 1000 9 − 6.209 T × RS × TS_2 1400 3 + 7.431 T × RS × TS_2 1400 6 − 1.223 T × RS × TS_2 1400 9 ± e
E = 248.04 − 3.96 T_1 + 3.96 T_2 − 38.97 RS_600 + 0.25 RS_1000 + 38.72 RS_1400 − 54.38 TS_3 − 13.42 TS_6 + 67.79 TS_9 + 49.53 T × RS_1 600 − 41.86 T × RS_1 1000 − 7.67 T × RS_1 1400 − 49.53 T × RS_2 600 + 41.86 T × RS_2 1000 + 7.67 T × RS_2 1400 − 12.01 T × TS_1 3 + 1.98 T × TS_1 6 + 10.03 T × TS_1 9 + 12.01 T × TS_2 3 − 1.98 T × TS_2 6 − 10.03 T × TS_2 9 + 69.85 RS × TS_600 3 − 32.37 RS × TS_600 6 − 37.48 RS × TS_600 9 − 60.72 RS × TS_1000 3 + 40.56 RS × TS_1000 6 + 20.16 RS × TS_1000 9 − 9.14 RS × TS_1400 3 − 8.19 RS × TS_1400 6 + 17.33 RS × TS_1400 9 − 62.98 T × RS × TS_1 600 3 + 79.51 T × RS × TS_1 600 6 − 16.53 T × RS × TS_1 600 9 − 32.50 T × RS × TS_1 1000 3 + 24.58 T × RS × TS_1 1000 6 + 7.92 T × RS × TS_1 1000 9 + 95.48 T × RS × TS_1 1400 3 − 104.09 T × RS × TS_1 1400 6 + 8.61 T × RS × TS_1 1400 9 + 62.98 T × RS × TS_2 600 3 − 79.51 T × RS × TS_2 600 6 + 16.53 T × RS × TS_2 600 9 + 32.50 T × RS × TS_2 1000 3 − 24.58 T × RS × TS_2 1000 6 − 7.92 T × RS × TS_2 1000 9 − 95.48 T × RS × TS_2 1400 3 + 104.09 T × RS × TS_2 1400 6 − 8.61 T×RS×TS_2 1400 9 ± e
where E, sB, and WT are the outputs for each combination of the parameters Ti (tool), RSi (rotational speed), and TSi (travel speed), while e is the process error, e.g., to predict the WT(T1, RS2, TS3), we should replace T with 1, RS with 1000, and TS with 9 in Equation (1).
The ANOVA analyses for the above three linear models, with all cross-products, are depicted in Table 3. Again, it can be seen that all Rsq values are higher than 95%, almost all F-values are higher than 4, and almost all p-values are lower than 0.05, indicating good fitting of the results.

4. Conclusions

The feasibility of joining 3D-printed PMMA specimens via FSW was verified in this work. Additionally, the processing parameters of the FSW were evaluated herein. Tool geometry, rotational speed, and transverse speed were tested as processing parameters, while the welding temperature and mechanical responses (i.e., ultimate tensile strength and tensile modulus of elasticity) were used as performance measures. The experimental space was selected after extensive preliminary experiments, and the FSW of 3D-printed PMMA specimens was presented for the first time, to best of the authors’ knowledge.
The FSW processing of the PMMA specimens exhibited high variability in the studied experimental area, as shown in Table 2. Hence, optimization of the process is of utmost importance. Therefore, descriptive statistics (i.e., MEPs, interaction plots, ANOVA) and additive models with cross-products were used to decompose each process parameter′s influence on the welding temperature, ultimate tensile strength, and tensile modulus of elasticity of the joining area. Finally, the results were explained according to the process joining mechanism.
  • According to the MEP diagrams and ANOVA, transverse speed and rotational speed are the most influential parameters, with very high F-values (F > 60, p = 0.000).
  • Tool geometry is not significant for tensile modulus of elasticity (E) (F = 2.09 < 4 and p = 0.157 > 0.05) in the specific experimental area, but is very substantial for the ultimate tensile strength (sB) and the welding temperature (WT) (F > 18 and p < 0.05).
  • The processing parameters mainly affect the tangential force and the resulting mixing quality of the welded material. PPB tool geometry, 1400 rpm rotational speed, and 9 mm/min transverse speed maximized the process welding temperature, ultimate tensile strength, and tensile modulus of elasticity.
The authors will investigate more FSW processing parameters and 3D printing materials and methods in future works.

Author Contributions

Conceptualization, N.V.; methodology, N.V.; software, J.D.K.; validation, M.P.; formal analysis, N.M. and J.D.K.; investigation, M.P. and N.M.; resources, N.V.; data curation, J.D.K. and N.M.; writing—original draft preparation, M.P.; writing—review and editing, M.P.; visualization, N.M.; supervision, N.V.; project administration, M.P.; funding acquisition, J.D.K. All authors have read and agreed to the published version of the manuscript.

Funding

This research received no external funding.

Institutional Review Board Statement

Not applicable.

Informed Consent Statement

Not applicable.

Data Availability Statement

The data presented in this study are available upon request from the corresponding author.

Acknowledgments

The authors would like to thank Aleka Manousaki from the Institute of Electronic Structure and Laser of the Foundation for Research and Technology, Hellas (IESL-FORTH), for taking the SEM images presented in this work.

Conflicts of Interest

The authors declare no conflict of interest.

References

  1. Zhang, Y.N.; Cao, X.; Larose, S.; Wanjara, P. Review of tools for friction stir welding and processing. Can. Metall. Q. 2012, 51, 250–261. [Google Scholar] [CrossRef]
  2. Threadgilll, P.L.; Leonard, A.J.; Shercliff, H.R.; Withers, P.J. Friction stir welding of aluminium alloys. Int. Mater. Rev. 2009, 54, 49–93. [Google Scholar] [CrossRef]
  3. Patel, V.; De Backer, J.; Hindsefelt, H.; Igestrand, M.; Azimi, S.; Andersson, J.; Säll, J. High-speed friction stir welding in light weight battery trays for the EV industry. Sci. Technol. Weld. Join. 2022, 27, 250–255. [Google Scholar] [CrossRef]
  4. Reynolds, A.P.; Tang, W.; Posada, M.; DeLoach, J. Friction stir welding of DH36 steel. Sci. Technol. Weld. Join. 2003, 8, 455–461. [Google Scholar] [CrossRef]
  5. Rodrigues, D.M.; Leitão, C.; Louro, R.; Gouveia, H.; Loureiro, A. High speed friction stir welding of aluminium alloys. Sci. Technol. Weld. Join. 2010, 15, 676–681. [Google Scholar] [CrossRef]
  6. Thomas, W.M.; Threadgill, P.L.; Nicholas, E.D. Feasibility of friction stir welding steel. Sci. Technol. Weld. Join. 1999, 4, 365–372. [Google Scholar] [CrossRef]
  7. Bhadeshia, H.K.D.H.; Debroy, T. Critical assessment: Friction stir welding of steels. Sci. Technol. Weld. Join. 2009, 14, 193–196. [Google Scholar] [CrossRef]
  8. Jiang, W.; Jiang, X.; Yuan, T.; Chen, S.; Liu, Y.; Liu, X. Material flow and viscous slips during stationary shoulder friction stir welding of Ti6Al4V. Sci. Technol. Weld. Join. 2022, 27, 220–227. [Google Scholar] [CrossRef]
  9. Karrar, G.; Galloway, A.; Toumpis, A.; Al-badour, F. Prediction and validation of intermetallic compound formation during friction stir welding of AA6061 to commercially pure copper Article History. Sci. Technol. Weld. Join. 2022, 27, 374–387. [Google Scholar] [CrossRef]
  10. Sahu, S.K.; Pal, K.; Mahto, R.P.; Dash, P. Monitoring of friction stir welding for dissimilar Al 6063 alloy to polypropylene using sensor signals. Int. J. Adv. Manuf. Technol. 2019, 104, 159–177. [Google Scholar] [CrossRef]
  11. Derazkola, H.A.; Kashiry Fard, R.; Khodabakhshi, F. Effects of processing parameters on the characteristics of dissimilar friction-stir-welded joints between AA5058 aluminum alloy and PMMA polymer. Weld. World 2018, 62, 117–130. [Google Scholar] [CrossRef]
  12. Hassan, A.M.; Almomani, M.; Qasim, T.; Ghaithan, A. Statistical analysis of some mechanical properties of friction stir welded aluminium matrix composite. Int. J. Exp. Des. Process Optim. 2012, 3, 91. [Google Scholar] [CrossRef]
  13. Arici, A.; Sinmaz, T. Effects of double passes of the tool on friction stir welding of polyethylene. J. Mater. Sci. 2005, 40, 3313–3316. [Google Scholar] [CrossRef]
  14. Rai, R.; De, A.; Bhadeshia, H.K.D.H.; DebRoy, T. Review: Friction stir welding tools. Sci. Technol. Weld. Join. 2011, 16, 325–342. [Google Scholar] [CrossRef]
  15. Mishra, D.; Sahu, S.K.; Mahto, R.P.; Pal, S.K.; Pal, K. Friction Stir Welding for Joining of Polymers; Springer Nature Singapore Pte Ltd.: Singapore, 2020; ISBN 9789811303784. [Google Scholar]
  16. Huang, Y.; Meng, X.; Xie, Y.; Wan, L.; Lv, Z.; Cao, J.; Feng, J. Friction stir welding/processing of polymers and polymer matrix composites. Compos. Part A Appl. Sci. Manuf. 2018, 105, 235–257. [Google Scholar] [CrossRef]
  17. Simoes, F.; Rodrigues, D.M. Material flow and thermo-mechanical conditions during Friction Stir Welding of polymers: Literature review, experimental results and empirical analysis. Mater. Des. 2014, 59, 344–351. [Google Scholar] [CrossRef]
  18. Ahmed, M.M.Z.; Elnaml, A.; Shazly, M.; El-Sayed Seleman, M.M. The effect of top surface lubrication on the friction stir welding of polycarbonate sheets. Int. Polym. Process. 2021, 36, 94–102. [Google Scholar] [CrossRef]
  19. Agrawal, A.; Kaur, R.; Walia, R.S. Engineering optimisation of process parameters for polymers: An overview. Int. J. Exp. Des. Process Optim. 2019, 6, 89. [Google Scholar] [CrossRef]
  20. Aghajani Derazkola, H.; Simchi, A. Experimental and thermomechanical analysis of friction stir welding of poly(methyl methacrylate) sheets. Sci. Technol. Weld. Join. 2018, 23, 209–218. [Google Scholar] [CrossRef]
  21. Nath, R.K.; Jha, V.; Maji, P.; Barma, J.D. A novel double-side welding approach for friction stir welding of polypropylene plate. Int. J. Adv. Manuf. Technol. 2021, 113, 691–703. [Google Scholar] [CrossRef]
  22. Mirabzadeh, R.; Parvaneh, V.; Ehsani, A. Experimental and numerical investigation of the generated heat in polypropylene sheet joints using friction stir welding (FSW). Int. J. Mater. Form. 2021, 14, 1067–1083. [Google Scholar] [CrossRef]
  23. Ogawa, Y.; Akebono, H.; Tanaka, K.; Sugeta, A. Effect of welding time on fatigue properties of friction stir spot welds of Al to carbon fibre-reinforced plastic. Sci. Technol. Weld. Join. 2019, 24, 235–242. [Google Scholar] [CrossRef]
  24. Eslami, S.; de Figueiredo, M.A.V.; Tavares, P.J.; Moreira, P.M.G.P. Parameter optimisation of friction stir welded dissimilar polymers joints. Int. J. Adv. Manuf. Technol. 2018, 94, 1759–1770. [Google Scholar] [CrossRef]
  25. Derazkola, H.A.; Khodabakhshi, F.; Simchi, A. Friction-stir lap-joining of aluminium-magnesium/poly-methyl-methacrylate hybrid structures: Thermo-mechanical modelling and experimental feasibility study. Sci. Technol. Weld. Join. 2018, 23, 35–49. [Google Scholar] [CrossRef]
  26. Choi, J.W.; Morisada, Y.; Liu, H.; Ushioda, K.; Fujii, H.; Nagatsuka, K.; Nakata, K. Dissimilar friction stir welding of pure Ti and carbon fibre reinforced plastic. Sci. Technol. Weld. Join. 2020, 25, 600–608. [Google Scholar] [CrossRef]
  27. Mendes, N.; Neto, P.; Simão, M.A.; Loureiro, A.; Pires, J.N. A novel friction stir welding robotic platform: Welding polymeric materials. Int. J. Adv. Manuf. Technol. 2016, 85, 37–46. [Google Scholar] [CrossRef]
  28. Eslami, S.; Tavares, P.J.; Moreira, P.M.G.P. Friction stir welding tooling for polymers: Review and prospects. Int. J. Adv. Manuf. Technol. 2017, 89, 1677–1690. [Google Scholar] [CrossRef]
  29. Kordestani, F.; Ashenai Ghasemi, F.; Arab, N.B.M. Effect of Pin Geometry on the Mechanical Strength of Friction-Stir-Welded Polypropylene Composite Plates. Mech. Compos. Mater. 2017, 53, 525–532. [Google Scholar] [CrossRef]
  30. Ali, U.; Karim, K.J.B.A.; Buang, N.A. A Review of the Properties and Applications of Poly (Methyl Methacrylate) (PMMA). Polym. Rev. 2015, 55, 678–705. [Google Scholar] [CrossRef]
  31. Feuser, P.E.; Gaspar, P.C.; Ricci-Júnior, E.; Da Silva, M.C.S.; Nele, M.; Sayer, C.; De Araújo, P.H.H. Synthesis and characterization of poly(methyl methacrylate) pmma and evaluation of cytotoxicity for biomedical application. Macromol. Symp. 2014, 343, 65–69. [Google Scholar] [CrossRef]
  32. Zheng, W.; Wong, S.C. Electrical conductivity and dielectric properties of PMMA/expanded graphite composites. Compos. Sci. Technol. 2003, 63, 225–235. [Google Scholar] [CrossRef]
  33. Zidan, H.M.; Abu-Elnader, M. Structural and optical properties of pure PMMA and metal chloride-doped PMMA films. Phys. B Condens. Matter 2005, 355, 308–317. [Google Scholar] [CrossRef]
  34. Ochoa, N.A.; Masuelli, M.; Marchese, J. Effect of hydrophilicity on fouling of an emulsified oil wastewater with PVDF/PMMA membranes. J. Memb. Sci. 2003, 226, 203–211. [Google Scholar] [CrossRef]
  35. Vidakis, N.; Maniadi, A.; Petousis, M.; Vamvakaki, M.; Kenanakis, G.; Koudoumas, E. Mechanical and Electrical Properties Investigation of 3D-Printed Acrylonitrile–Butadiene–Styrene Graphene and Carbon Nanocomposites. J. Mater. Eng. Perform. 2020, 29, 1909–1918. [Google Scholar] [CrossRef]
  36. Vidakis, N.; Petousis, M.; Velidakis, E.; Tzounis, L.; Mountakis, N.; Boura, O.; Grammatikos, S.A. Multi-functional polyamide 12 (PA12)/multiwall carbon nanotube 3D printed nanocomposites with enhanced mechanical and electrical properties. Adv. Compos. Mater. 2022, 31, 1–25. [Google Scholar] [CrossRef]
  37. Vidakis, N.; Petousis, M.; Velidakis, E.; Mountakis, N.; Fischer-Griffiths, P.E.; Grammatikos, S.A.; Tzounis, L. Mechanical reinforcement course of 3D printed polypropylene–antimony doped Tin Oxide nanocomposites versus filler loading. Adv. Compos. Mater. 2022, 31, 235–256. [Google Scholar] [CrossRef]
  38. Vidakis, N.; Petousis, M.; Velidakis, E.; Liebscher, M.; Mechtcherine, V.; Tzounis, L. On the strain rate sensitivity of fused filament fabrication (Fff) processed pla, abs, petg, pa6, and pp thermoplastic polymers. Polymers 2020, 12, 2924. [Google Scholar] [CrossRef]
  39. Polzin, C.; Spath, S.; Seitz, H. Characterization and evaluation of a PMMA-based 3D printing process. Rapid Prototyp. J. 2013, 19, 37–43. [Google Scholar] [CrossRef]
  40. Chen, S.G.; Yang, J.; Jia, Y.G.; Lu, B.; Ren, L. Tio2 and PEEK reinforced 3d printing pmma composite resin for dental denture base applications. Nanomaterials 2019, 9, 1049. [Google Scholar] [CrossRef] [Green Version]
  41. Dimitrova, M.; Corsalini, M.; Kazakova, R.; Vlahova, A.; Chuchulska, B.; Barile, G.; Capodiferro, S.; Kazakov, S. Comparison between Conventional PMMA and 3D Printed Resins for Denture Bases: A Narrative Review. J. Compos. Sci. 2022, 6, 87. [Google Scholar] [CrossRef]
  42. Matbouei, A.; Fathi, A.; Rabiee, S.M.; Shirzad, M. Layered manufacturing of a three-dimensional polymethyl methacrylate (PMMA) scaffold used for bone regeneration. Mater. Technol. 2019, 34, 167–177. [Google Scholar] [CrossRef]
  43. Elyasi, M.; Derazkola, H.A. Experimental and thermomechanical study on FSW of PMMA polymer T-joint. Int. J. Adv. Manuf. Technol. 2018, 97, 1445–1456. [Google Scholar] [CrossRef]
  44. Dilberoglu, U.M.; Gharehpapagh, B.; Yaman, U.; Dolen, M. Current trends and research opportunities in hybrid additive manufacturing. Int. J. Adv. Manuf. Technol. 2021, 113, 623–648. [Google Scholar] [CrossRef]
  45. Merklein, M.; Junker, D.; Schaub, A.; Neubauer, F. Hybrid additive manufacturing technologies-An analysis regarding potentials and applications. Phys. Procedia 2016, 83, 549–559. [Google Scholar] [CrossRef] [Green Version]
  46. Kechagias, J.D.; Fountas, N.A.; Ninikas, K.; Petousis, M.; Vidakis, N.; Vaxevanidis, N. Surface characteristics investigation of 3D-printed PET-G plates during CO2 laser cutting. Mater. Manuf. Process. 2021, 36. [Google Scholar] [CrossRef]
  47. Kechagias, J.D.; Ninikas, K.; Petousis, M.; Vidakis, N.; Vaxevanidis, N. An investigation of surface quality characteristics of 3D printed PLA plates cut by CO2 laser using experimental design. Mater. Manuf. Process. 2021, 36, 1544–1553. [Google Scholar] [CrossRef]
  48. Kechagias, J.; Chaidas, D.; Vidakis, N.; Salonitis, K.; Vaxevanidis, N.M. Key parameters controlling surface quality and dimensional accuracy: A critical review of FFF process. Mater. Manuf. Process. 2022, 37, 963–984. [Google Scholar] [CrossRef]
  49. Kechagias, J.D.; Vidakis, N.; Petousis, M. Parameter effects and process modeling of FFF-TPU mechanical response. Mater. Manuf. Process. 2021, 36, 1–11. [Google Scholar] [CrossRef]
  50. Vidakis, N.; Petousis, M.; Kechagias, J.D. Parameter effects and process modelling of Polyamide 12 3D-printed parts strength and toughness. Mater. Manuf. Process. 2022, 37, 1–12. [Google Scholar] [CrossRef]
  51. Sadeghian, N.; Besharati Givi, M.K. Experimental optimization of the mechanical properties of friction stir welded Acrylonitrile Butadiene Styrene sheets. Mater. Des. 2015, 67, 145–153. [Google Scholar] [CrossRef]
  52. Albannai, A.I. Review The Common Defects In Friction Stir Welding. Int. J. Sci. Technol. Res. 2020, 9, 318–329. [Google Scholar]
  53. Phadke, M.S. Quality Engineering Using Robust Design, 1st ed.; Prentice Hall PTR: Hoboken, NJ, USA, 1995; ISBN 0137451679. [Google Scholar]
Figure 1. (a) MEX 3D-printed specimens for the FSW process; (b) specimen dimensions and infill pattern (lines and arrows indicating the specimen’s 3D-printed structure); (c) Welding Tool A (PPA) dimensions; (d) Welding Tool B (PPB) dimensions.
Jmmp 06 00077 g001
Figure 2. (a) FSW experimental setup; (b) FSW process; (c) sample cutting procedure; (d) cutting of the specimens after the FSW process.
Jmmp 06 00077 g002
Figure 3. (a) Welding of the specimens (the process parameters are shown); (b) finished weld seam; (c) specimens after the cutting process (RS: rotational speed, TS: travel speed).
Jmmp 06 00077 g003
Figure 4. (a) PPA welding tool’s weld seam; (b) stress–strain graphs from the tensile tests for the different TS values (RS 1000 rpm, PPA); (c) PPB welding tool’s weld seam; (d) stress–strain graphs from the tensile tests for the different TS values (RS 1000 rpm, PPB).
Jmmp 06 00077 g004
Figure 5. Views of the welded specimens’ side (vertical) surface (the weld tool performs the weld on the top surface): (a) HAZ stereoscopic image (1000 rpm, 6 mm/min, PPA); (b) HAZ stereoscopic image (1400 rpm, 6 mm/min, PPA). Specimen welded at 1000 rpm, 3 mm/min, PPA: (c) view outside the welding zone, (d) stereoscopic image, and (e) view of the welding zone (AS: advancing side, RTS: retreating side, TMAZ: thermomechanically affected zone).
Jmmp 06 00077 g005
Figure 6. Morphological evaluation ((ac): specimen welded at 1000 rpm, 6 mm/min, PPA; (df): specimen welded at 1000 rpm, 9 mm/min, PPB). Stereoscopic images: (a) weld zone (PPA); (d) weld zone (PPB). SEM images: (b) fracture surface at 100× (PPA); (c) fracture surface at 30× (PPA) (arrows in the image indicate how the fracture evolved in the surface); (e) fracture surface at 100× (PPB); (f) fracture surface at 30× (PPB) (TMZ: thermomechanical zone, HAZ: heat-affected zone).
Jmmp 06 00077 g006
Figure 7. (a) TGA graph of the PMMA material; (b) maximum temperature values for all of the experiments; (c) DSC curves of the PMMA material.
Jmmp 06 00077 g007
Figure 8. (a) MEPs for E, sB, and WT, and (bd) interaction plots between tool, RS, and TS vs. E, sB, and WT.
Jmmp 06 00077 g008
Figure 9. Surfaces plots of (a) E, (b) sB, and (c) WT versus TS and RS.
Jmmp 06 00077 g009
Table 1. 3D printing and FSW parameters used in this work.
3D Printing ParametersValueUnits
Printing Orientation±45°
Layer Thickness0.20mm
Bed Temperature105°C
Nozzle Temperature240°C
Number of Parameters2-
Top Solid Layers7-
Bottom Solid Layers4-
Fill Density100%
Travel Speed40mm/s
FSW ParametersValueUnits
Rotation Speed600–1000–1400rpm
Welding Speed3–6–9mm/min
Pin ProfilePPA–PPB-
Shoulder Diameter12mm
Tool Tilt Angle0°
Stand-off Distance0mm
Tool Inclination Angle90 (vertical)°
Tool MaterialAISI 304
Table 2. Input and output parameters.
NoPP (A = 1; B = 2)RS (rpm)TS (mm/min)WT (°C)sB (MPa)E (MPa)sB/sB*E/E*
11600359.47.13187.1125.9%63.3%
21600363.48.09206.3929.4%69.9%
31600353.26.54191.9223.8%65.0%
41600673.010.21270.5837.1%91.6%
51600673.112.17304.0944.2%102.9%
61600670.713.56296.3649.3%100.3%
71600979.010.05259.6736.5%87.9%
81600983.011.33307.1141.2%103.9%
91600980.914.22268.5851.7%90.9%
1011000333.11.6939.646.1%13.4%
1111000336.72.1543.057.8%14.6%
1211000335.32.6045.929.5%15.5%
1311000697.113.66260.7849.6%88.3%
1411000691.513.94268.7450.6%91.0%
1511000687.912.51238.9945.5%80.9%
1611000978.116.21316.3958.9%107.1%
1711000980.313.44322.3848.8%109.1%
1811000983.717.08286.3562.1%96.9%
1911400373.218.93289.4868.8%98.0%
2011400386.222.76305.6382.7%103.4%
2111400377.121.16290.1676.9%98.2%
2211400688.65.04129.3918.3%43.8%
2311400694.05.97142.9021.7%48.4%
2411400693.46.74181.9524.5%61.6%
25114009146.027.84391.02101.1%132.3%
26114009136.622.23397.7780.8%134.6%
27114009143.826.42347.8896.0%117.7%
282600363.810.17246.4236.9%83.4%
292600359.212.49294.6845.4%99.7%
302600361.38.82220.8132.1%74.7%
312600667.01.6239.025.9%13.2%
322600665.31.3034.254.7%11.6%
332600669.41.2735.424.6%12.0%
342600992.26.88222.8025.0%75.4%
352600987.36.53191.9823.7%65.0%
362600997.17.16186.1926.0%63.0%
3721000376.87.21207.4726.2%70.2%
3821000374.67.34224.8526.7%76.1%
3921000382.18.39238.2930.5%80.6%
4021000697.419.63289.3771.3%97.9%
4121000699.620.90311.8575.9%105.5%
42210006104.719.71282.9171.6%95.7%
43210009112.727.90366.79101.4%124.1%
44210009117.728.59377.90103.9%127.9%
45210009109.227.19347.6798.8%117.7%
4621400388.65.04129.3918.3%43.8%
4721400394.05.97142.9021.7%48.4%
4821400393.46.74181.9524.5%61.6%
49214006146.027.84391.02101.1%132.3%
50214006136.622.23397.7780.8%134.6%
51214006143.826.42347.8896.0%117.7%
52214009119.224.23374.4088.0%126.7%
53214009126.726.38355.5595.8%120.3%
54214009118.723.51364.6685.4%123.4%
Min33.11.2734.254.6%11.6%
Max146.028.59397.77103.9%134.6%
Average88.913.61248.0449.5%83.9%
sB* reference (unwelded): 27.527 MPa, E* reference (unwelded): 295.473 MPa.
Table 3. Analysis of variance: general linear model (95% confidence intervals).
WT Versus Tool; RS; TS
SourceDoFSoSMSFp
Tool13054.03054.02199.060.000
RS214,782.17391.04481.760.000
TS213,678.36839.14445.780.000
Tool × RS21400.7700.3345.650.000
Tool × TS2369.5184.7412.040.000
RS × TS41706.4426.6127.810.000
Tool × RS × TS44519.21129.7973.640.000
Error36552.315.34
Total5340,062.5
S = 3.91687; R-sq = 98.62%; R-sq(adj) = 97.97%; R-sq(pred) = 96.90%;
sB versus Tool; RS; TS
SourceDoFSoSMSFp
Tool142.2942.28918.220.000
RS2878.46439.231189.260.000
TS2849.77424.885183.070.000
Tool × RS2341.81170.90773.640.000
Tool × TS2122.0060.99926.280.000
RS × TS4531.05132.76457.210.000
Tool × RS × TS4970.68242.669104.560.000
Error3683.552.321
Total533819.61
S = 1.52343; R-sq = 97.81%; R-sq(adj) = 96.78%; R-sq(pred) = 95.08%
E versus Tool; RS; TS
SourceDoFSoSMSFp
Tool1848848.02.090.157
RS254,31527,157.667.010.000
TS2139,18969,594.5171.710.000
Tool × RS276,76438,382.294.700.000
Tool × TS244762238.25.520.008
RS × TS481,13020,282.550.040.000
Tool × RS × TS4193,84948,462.3119.570.000
Error3614,591405.3
Total53565,163
S = 20.1321; R-sq = 97.42%; R-sq(adj) = 96.20%; R-sq(pred) = 94.19%
Publisher’s Note: MDPI stays neutral with regard to jurisdictional claims in published maps and institutional affiliations.

