1. Introduction
For most industrial companies, the prediction of various data is based on computer-aided human decisions and experiences. Production data collection, recording and processing within Industry 4.0 and Smart Manufacturing is today a routine activity [
1,
2,
3,
4,
5,
6]. Numerous systems, among others, the Manufacturing Execution System (MES), Enterprise Resource Planning (ERP) and Customer Relationship Management (CRP), support data management and forecasting [
7,
8,
9]. It is essential to be aware of the efficiency of production units in order to properly plan and assemble the sequence of products. It is inevitable to predict the change in efficiency, which can move in either a negative or positive direction in addition to the stagnant situation. Lower efficiency requires more manpower, and more manpower generates higher variable costs. Therefore, it is important to estimate future efficiency values as accurately as possible.
The aim of this paper is to explore, analyze and compare the prediction supported by human and decision trees and reveal a new model for more accurate efficiency prediction.
2. Literature Review
Analyzing historical data is no longer a complex task, although production efficiency is affected by a number of plannable and unplannable factors. The stochastic nature of the human work (e.g., variable assembly time, cycle time, etc.) and the occurrence of the duration of machine faults is particularly difficult in the case of semi-automatic assembly lines [
10].
Nowadays, within Artificial Intelligence (AI), the benefits of Data Mining (DM) and Machine Learning (ML) are increasingly being exploited in the field of production [
11,
12,
13,
14,
15]. Different techniques and algorithms are used in the fault detection, quality improvement, process characterization, predictive maintenance, energy consumption, production planning, cycle time prediction, lead time estimation, and scheduling and decision support system [
16,
17,
18,
19,
20,
21,
22].
In the domain of machine learning, there are several methods such as: deep learning (e.g., deep belief networks, convolutional neural networks, etc.), ensemble (e.g., random forest, gradient boosting machines, etc.), neural networks (e.g., perceptron, back-propagation, etc.), Bayesian (e.g., Bayesian network, Gaussian naïve Bayes, etc.), regularization (e.g., least absolute shrinkage and selected operator, elastic net, etc.), regression (e.g., linear regression, logistic regression, etc.), dimensionality reduction (multidimensional scaling, linear discriminant analysis, etc.), instant-based (e.g., k-nearest neighbor, learning vector quantization, etc.), clustering (e.g., k-means, hierarchical clustering, etc.), rule systems (e.g., one rule, zero rule, etc.) and decision tree [
23,
24,
25].
At the domain of the decision tree, there are also several methods, among others, the Classification and Regression Tree (CART), C4.5, C5.0, Chi-squared automatic interaction detection, decision stump, conditional decision tree, M5 and interactive dichotomiser 3 (ID3) [
26]. For decision tree models, the main components used are nodes (root nod, internal nod, leaf nodes), branches (if-then rules), splitting, stopping and pruning.
All machine learning methods can be categorized into the following three groups:
Based on Choudhary et al., the prediction goal is focusing on predicting the behavior of a model and determining the future values based on existing information [
29].
OEE as a best practice and standard firstly was introduced within the Total Productive Maintenance (TPM) framework by Nakajima [
30]. The original formula for calculation OEE is written as:
where,
a—availability [%],
p—performance [%],
q—quality [%].
According to Corrales et al., in the scientific literature more than 850 papers were published between 1996 and 2020 about Overall Equipment Effectiveness [
31]. Most articles deal with increasing OEE using a variety of methods. This paper seeks to explore how to achieve an accuracy of within 1% for OEE prediction.
3. Materials and Methods
In the field of production logistics, one of the most complex planning processes is the accurate forecasting of production and assembly efficiency. Full customer service is only possible if the forecast quantity can be economically produced and delivered in the specified time. To do this, however, the appropriate resources must be available. In addition, setting manufacturing and assembly targets can only be realistic if it is well defined what the production system will be capable of in terms of output.
According to the original formula, the expected availability is greater than 90%, performance is greater than 95%, and quality is greater than 99% [
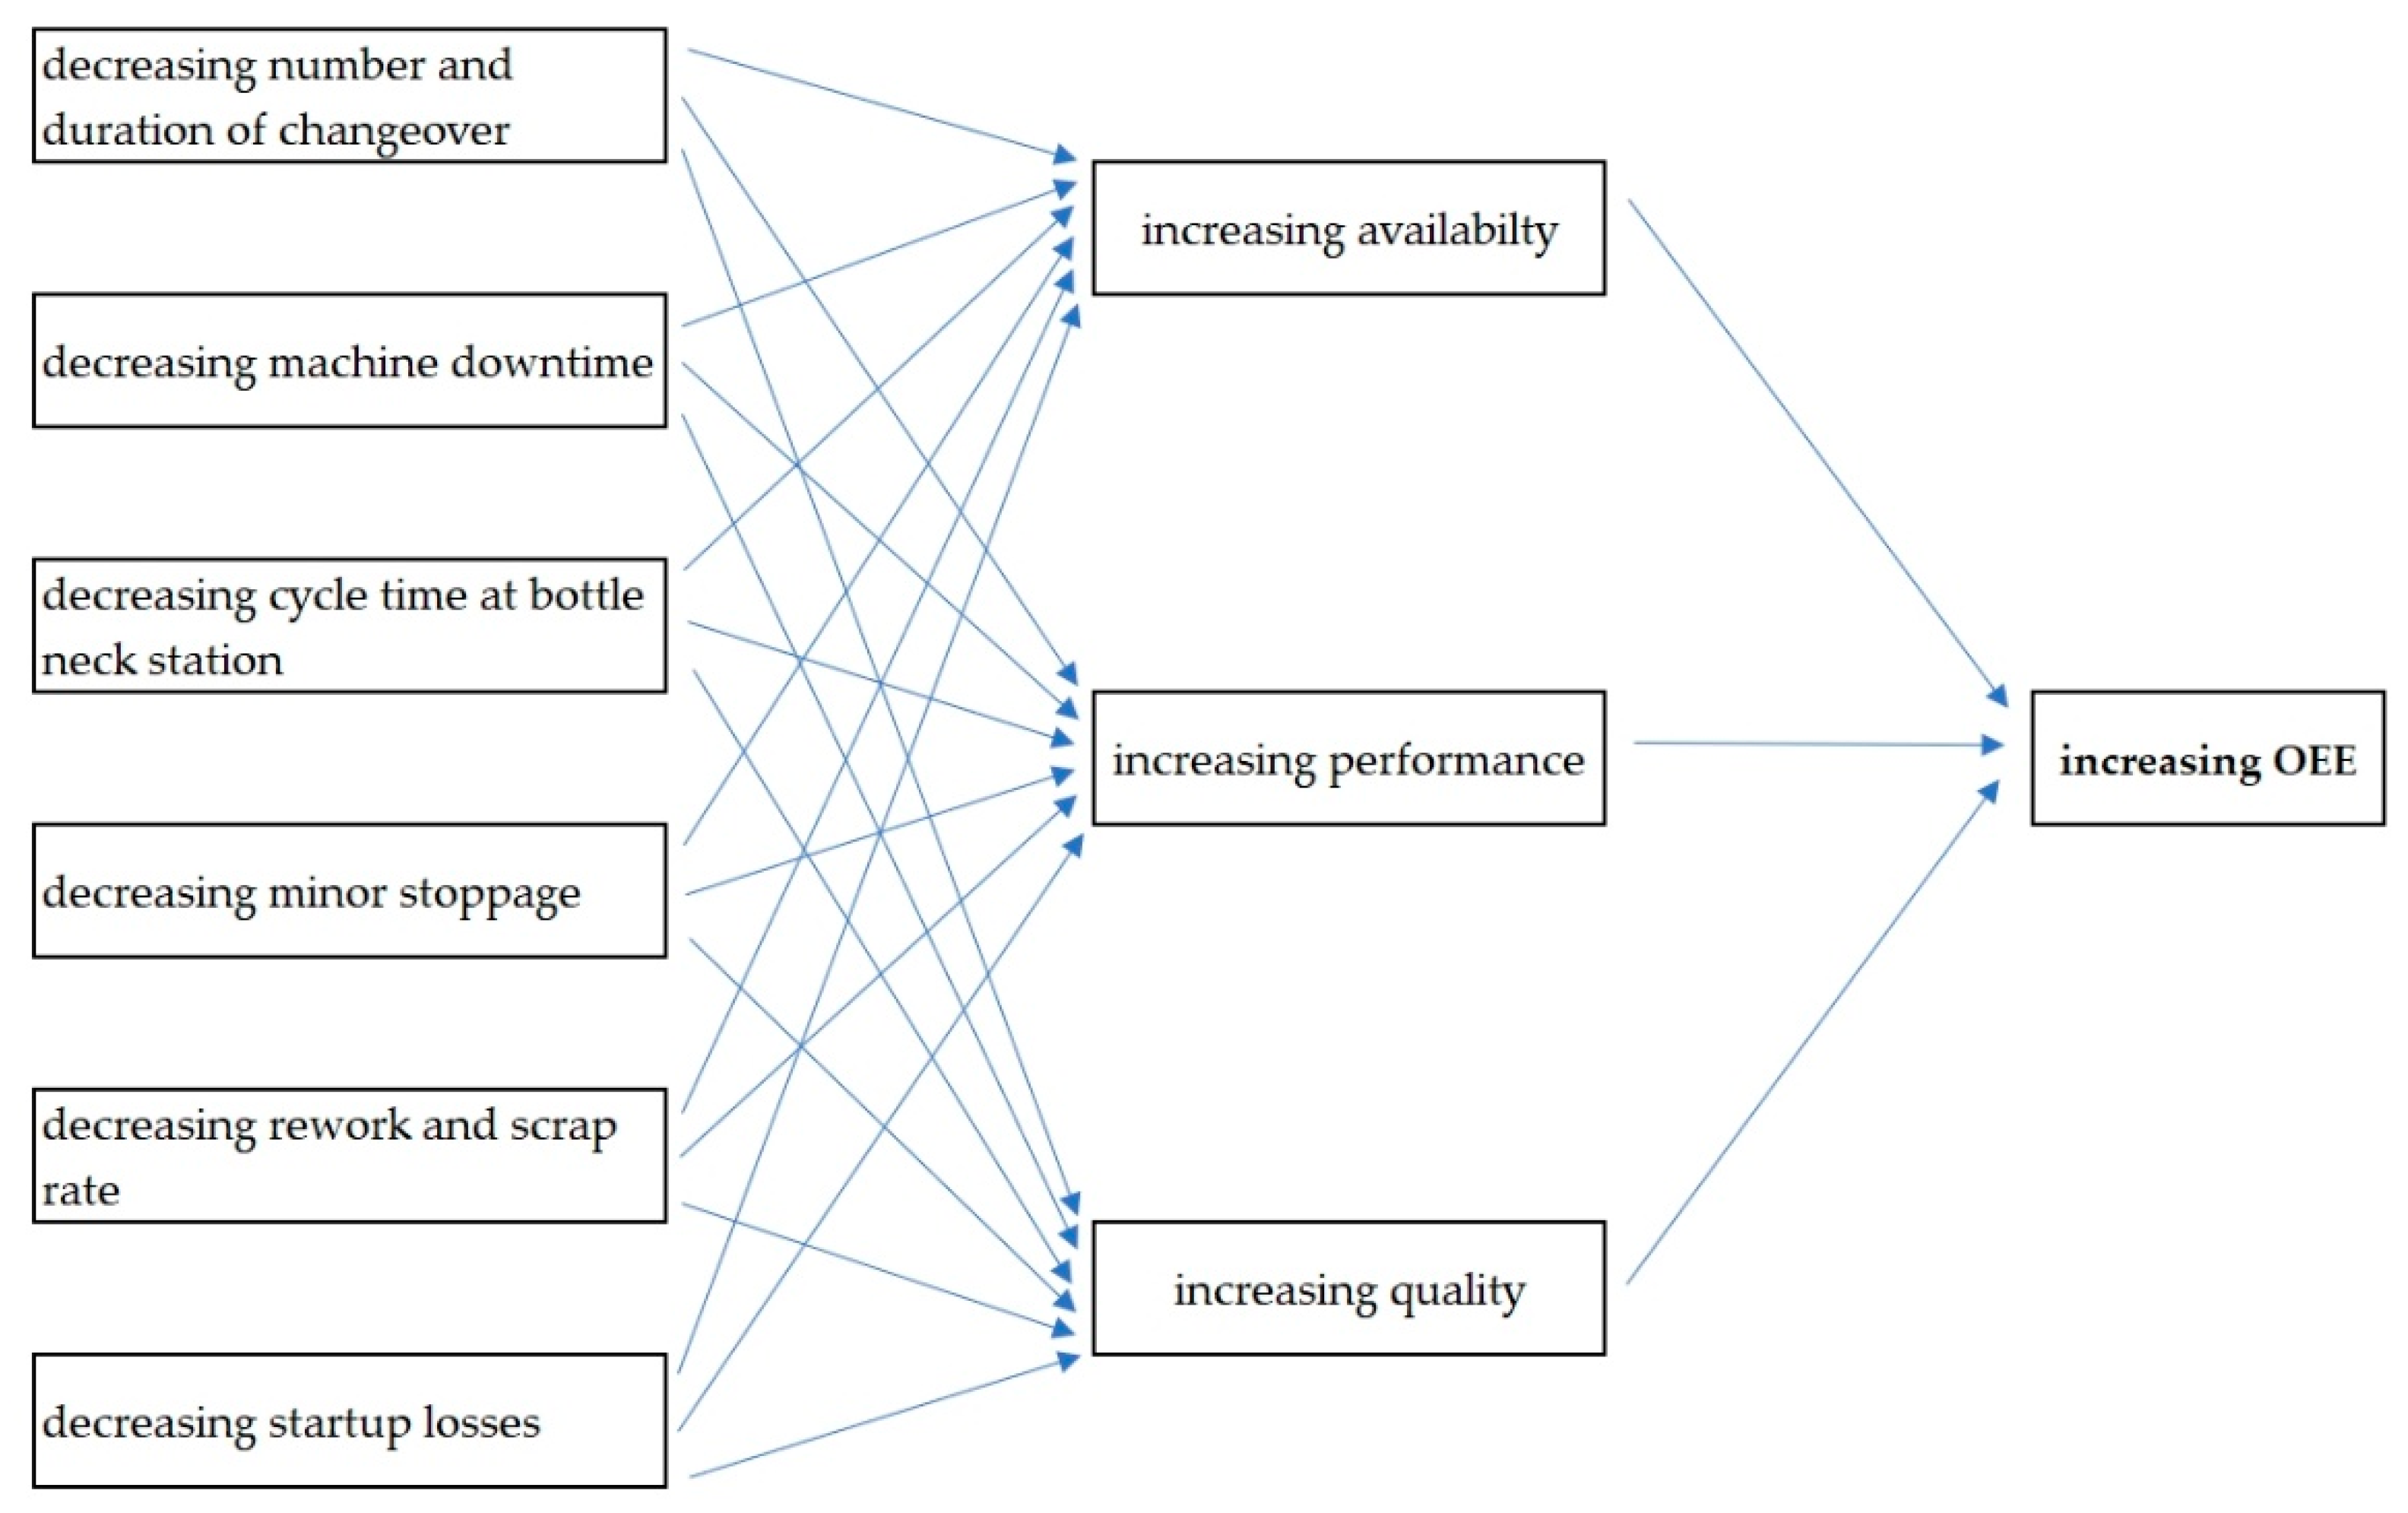
30]. It follows that in industrial practice, the percentages achieved are the highest in the field of quality, followed by performance, and finally, availability. The higher the target and performance, the fewer deviations, errors and outages are allowed. Considering the factors of availability, performance and quality, the issue of factors influencing OEE can be approached from several perspectives. The value of OEE follows logically from most of the parameters listed, but sometimes the direction of change of each factor requires more careful consideration. In the six big losses approach, reducing the number and duration of the changeover, machine downtime, cycle time at bottleneck station, minor stoppage, rework and scrap rate and startup losses, resulted that availability, performance and quality will increase, thus OEE percentage will be higher [
32,
33].
Figure 1 shows the approach of six big losses and its effects.
In terms of production environment, the value of availability, performance and quality will increase (including OEE) in case of the increasing series size, progress in product life cycle, increasing MTBF, decreasing MTTR, decreasing material shortage and increasing ordered quantity. However, the percentage of OEE increases with higher automation, but in this case, compared to manual assembly, the value of availability decreases. Industry experience has demonstrated that the efficiency of a manual assembly is generally higher than the efficiency of a machine assembly. Productivity, on the other hand, is the opposite. A real industrial example is the assembly of an airbag cable, where the manual assembly efficiency is around 95% and for semi-automatic assembly is around 90%; fully automatic assembly is around 85% for the same product. Some production environment factor and its affects are shown in
Table 1.
Implementing numerous methods, such as different lean techniques, also increases the value of OEE [
34,
35,
36,
37]. Proper application of engineering methods, e.g., the Failure Method and Effect Analysis (FMEA), will also result in higher OEE [
38]. Higher OEE can also be achieved by increasing the number of shifts in production, however, by increasing the length of shifts (from 8 h to 12 h), the higher OEE percentage will not be realized (
Table 2).
Heutmann and Schmitt used disturbance detection and prediction as a part of the control concept for a synchronized individual production control. The consequences of the predicted negative effects have been examined and suggestions made to avoid them [
39]. Lingitz et al. presents a machine learning algorithm for lead time prediction at a semiconductor manufacturer and tested several models for higher estimation values [
40]. Subramaniyan et al. suggested a data-driven algorithm based on MES to predict throughput bottlenecks in a production system based on active periods of the machines [
41]. Anusha and Umasankar present a concept for major factors affecting OEE and set up a model for OEE prediction. Through R studio, 80% of data are taken for the training data set and 20% of data are taken for the testing data set. It was established that a simple moving average is incapable of recording sudden changes in data, but Holt’s double exponential smoothing method can achieve the minimum error [
42]. Schuh et al. analyzed deviations between planned and real manufacturing processes and evaluated the forecast reliability of production planning. A method was used to determine four relevant deviations as a workstation of a process, date of a process, duration of a process and sequence of the processed order [
43]. According to Brunelli et al., a deep learning-based approach was proposed for predicting the future values of manufacturing performance. The Temporal Convolutional Network (TCN) and Long Short-Term Memory (LSTM) concept were applied for estimation [
44]. Other machine learning tools also applied for prediction of OEE, such as the Support Vector Machine (SVM), Random Forest by Hassani et al. [
45] and derivative Integral Proportional PID machine learning algorithm with SVM by Acosta et al. [
46].
The operation of a production system can be assessed in numerous ways. The most common method in industrial practice is to use Key Performance Indicators (KPIs). Within the KPI system, the monitoring of OEE best reflects the change in the value of efficiency [
47]. Beyond monitoring, forecasting is also paramount importance. In addition to mathematical and statistical methods, there are several other concepts for estimating, including the Forecasting Management Competence (FMC) [
48]. Lee et al. used big data and cloud-based predictive analytics within a Prognostics and Health Management (PHM) approach [
49].
4. Results of Prediction
4.1. OEE Estimation by Human
In addition to the framework of Industry 4.0 and IoT tools, human decisions and experiences still play an important role in practical life. In several cases, production planners question the data and forecasts provided by the machines, because the reliability of the support systems is sometimes not satisfactory enough. A real-life example of this is how customer order data recorded and processed in Enterprise Resource Planning (ERP) can change due to the customer’s modified needs. Sales coordinators and production planners know which sales orders can be realistic by the given deadlines and which orders will surely be postponed. Taking these factors into account, operational production management can be more accurate and balanced. With the optimal batch size, production can be more economical and efficient. Human is thus still a key factor in the planning and implementation of assembly efficiency.
Between October 2021 and January 2022 (week 43/2021–week 5/2022), a survey was conducted at a European automotive company to predict OEE by humans. Four machine adjusters working in different shifts with several years of manufacturing experience were asked to predict the OEE value for the next shift. For easier prediction, machine adjusters did not have to predict the OEE value directly, but their estimated number of units produced. From the number of pieces thus given, the predicted OEE value could be calculated according to the following formula:
where,
In addition to the two shifts’ operations, the assembly conditions were characterized by
Table 3.
Aspects considered in human prediction:
What type of product will be assembled in a given period (next shift);
How many type changes are planned;
Ability and practice of available operators (workers with routine and new operators), especially in critical workplaces and bottleneck station(s);
Suitable raw material is available for continuous assembly operations;
Reasons for production downtime in the previous short period (e.g., shift, day), as mainly quality defects and machine failures.
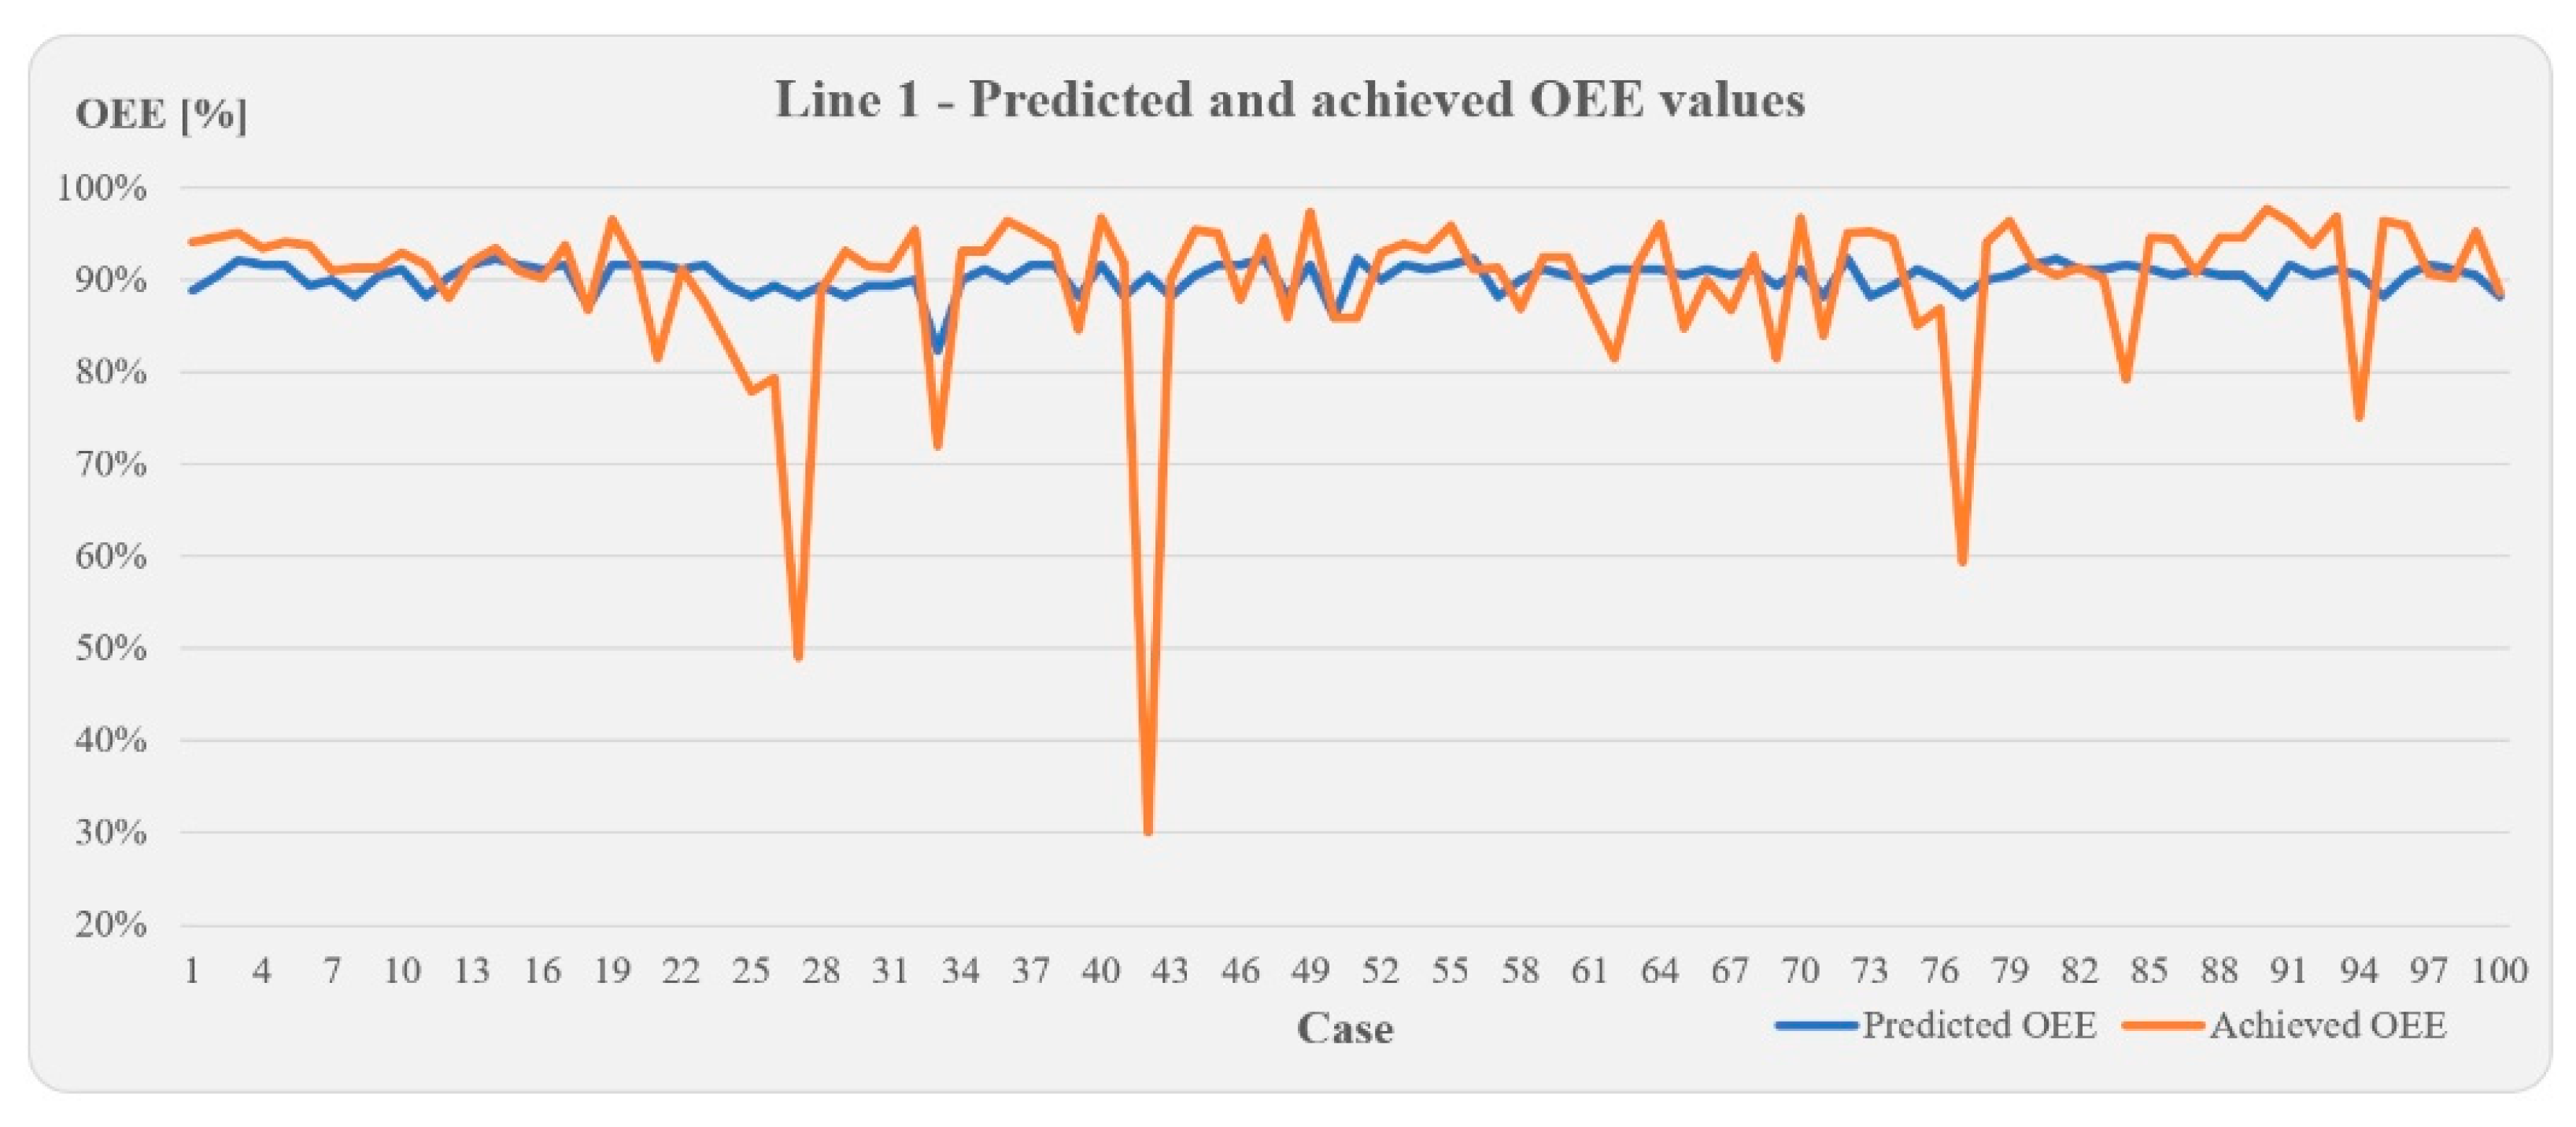
Each machine adjuster estimated the expected yield based on the listed aspects. For assembly line 1 and assembly line 2, the predicted and realized OEE values are shown in
Figure 2 and
Figure 3 as a function of the cases.
The focus of the survey was primarily on how accurate the prediction was and what factors caused each discrepancy. What is most likely to affect the variation and cannot be accurately predicted? The results are depicted in the descriptive statistics shown in
Table 4.
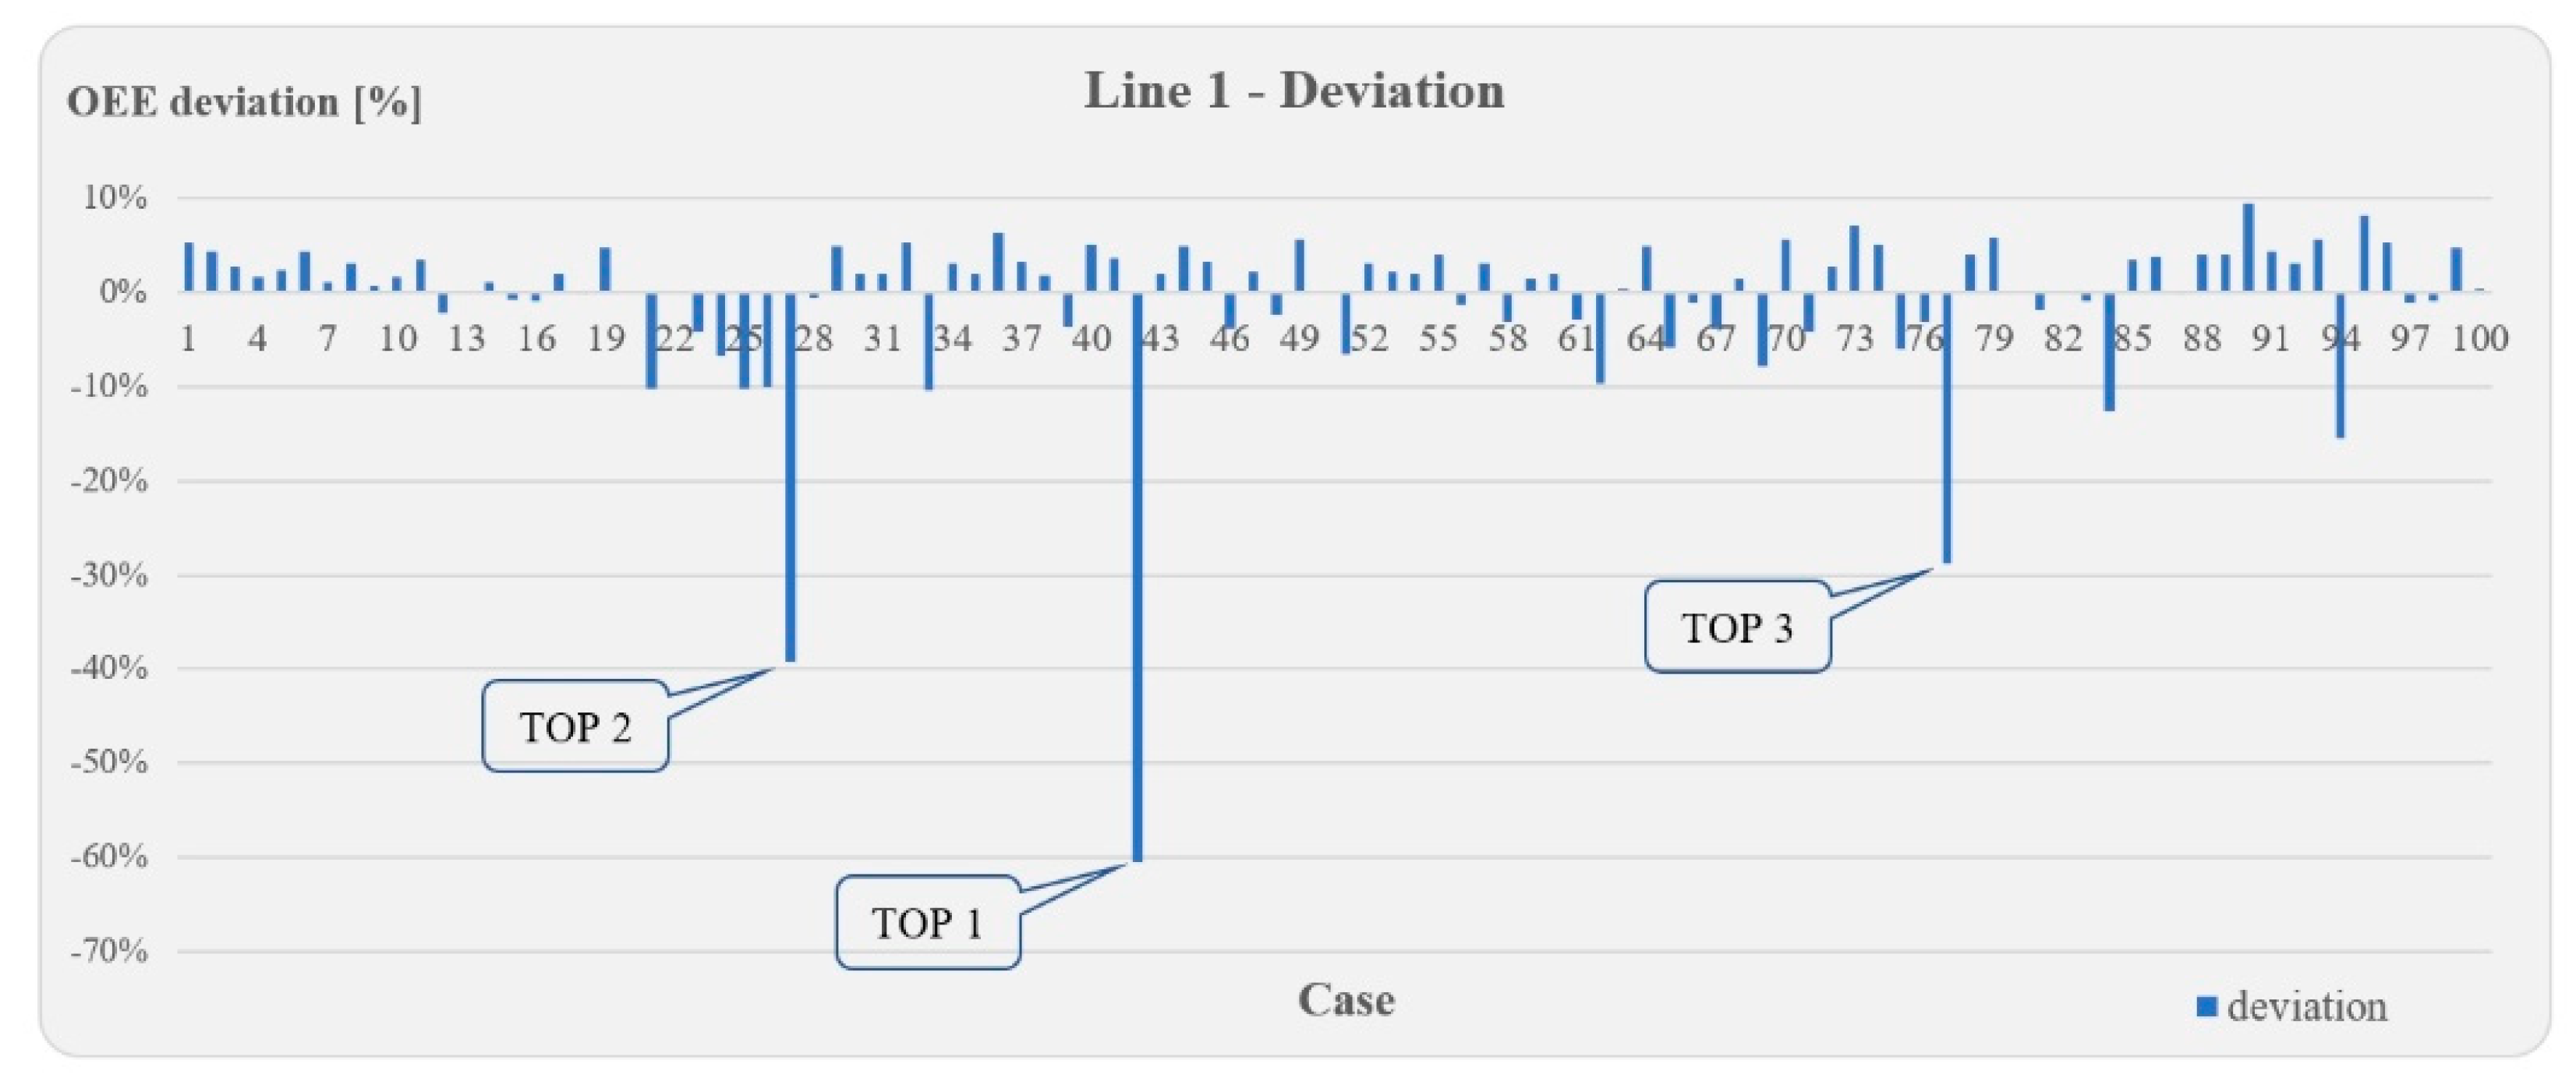
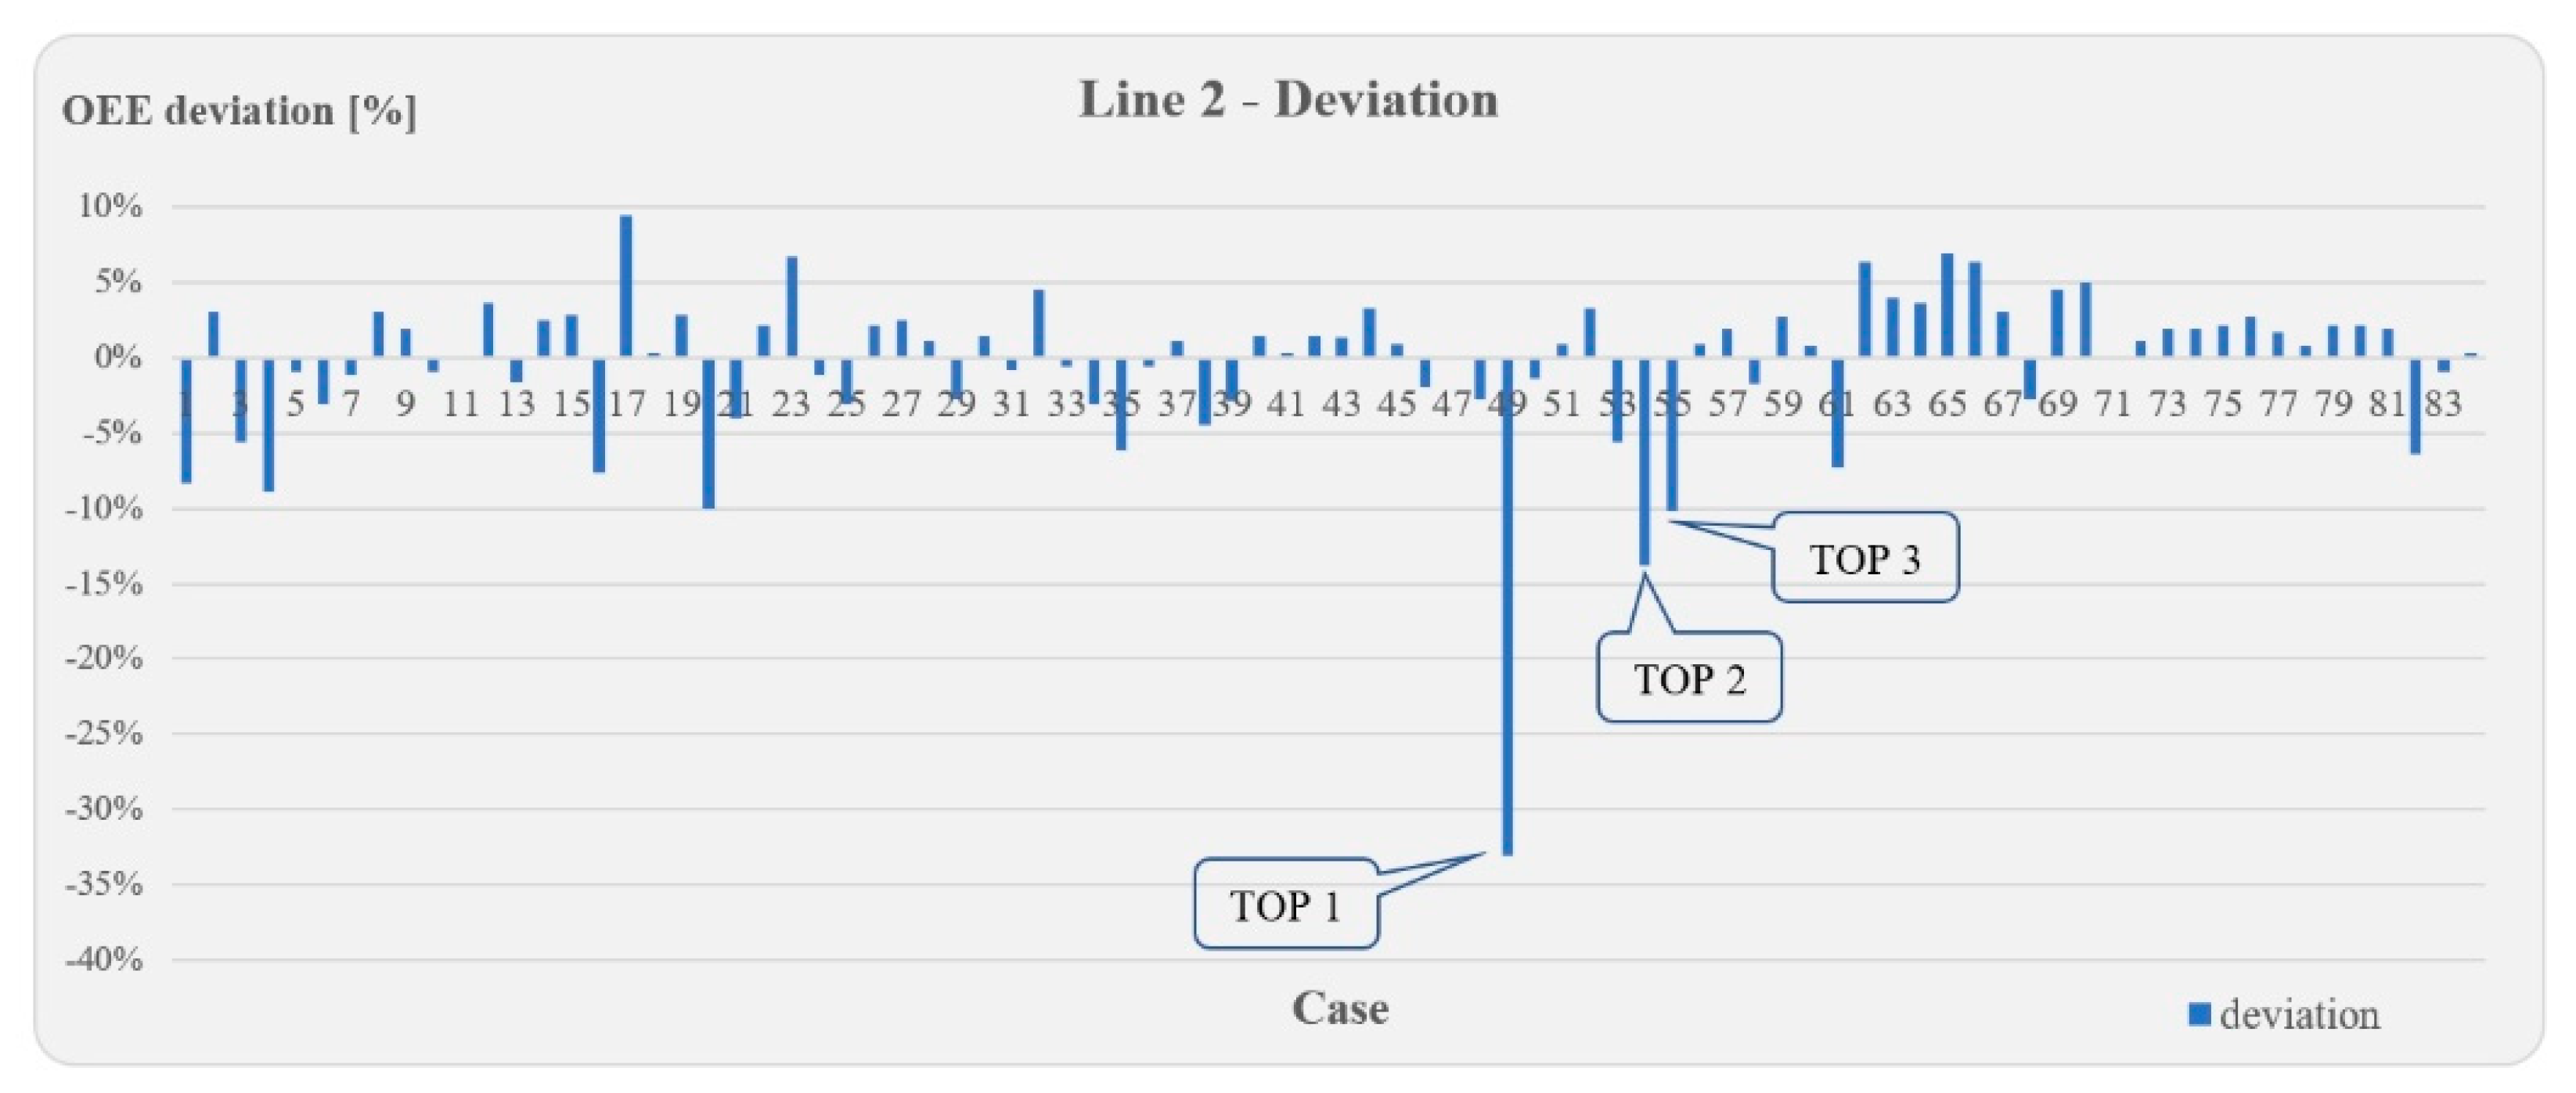
The predicted OEE values move in a relatively narrow range around the target, which means that based on the available data, machine operators do not anticipate a larger change that reduces the OEE value and considers the assembly process to be stable. Nevertheless, there have been several cases where the realized value has differed significantly from the prediction. Most of these discrepancies are negative discrepancies where unexpected and unforeseen events have occurred to varying degrees. The deviation from the estimation is shown in
Figure 4 and
Figure 5.
The reasons for the TOP 3 negative differences for the two assembly lines are shown in
Table 5.
Root cause analysis found that the material missing was caused by lower inventory levels within the plant between production areas. Supermarkets in front of the assembly line are filled with materials manufactured by welding and painting machines where the minimum stock is inadequate. There are small deviations in the positive direction, which are due to, among other things, faster product changes and a lower number of short downtimes (<3 min) than planned. It is also important that exceeding the target OEE values is not an easy task, so that the planned breaks in the OEE calculation are included in the planned total time. A 30-min break, common in industrial practice, reduces the theoretically achievable 100% OEE by 6.25% (30 min/480 min = 6.25%). Thus, the efficiency of the line can only be 93.75% in practice if no additional staff is employed during the planned breaks on the production line. The accuracy is characterized by the fact that 16% (line 1) and 20% (line 2) of the estimations were able to predict the OEE value with an accuracy of less than 1%.
Main events that make it impossible to accurately predict the OEE on the assembly line are:
Machine failure and duration;
Material missing and duration;
Line stop due to raw material and/or subassembly quality;
Line stop due to customer claim (root cause investigation);
Urgent order and its consequence, or a program change;
Other unforeseen events.
In the case where machine setters had to estimate the OEE value in advance for a week, none of them were able to predict this with an accuracy of less than two percent for any of the assembly line. In addition, in most cases, the estimation was not supported by a concept. This paper does not analyze the details of this case.
4.2. Takt Time Based Decision Trees
In the following, we will investigate how much more accurately OEE values can be predicted a few weeks in advance using a decision tree versus human estimation for a shift. The decision tree is based on the factors listed in
Table 6.
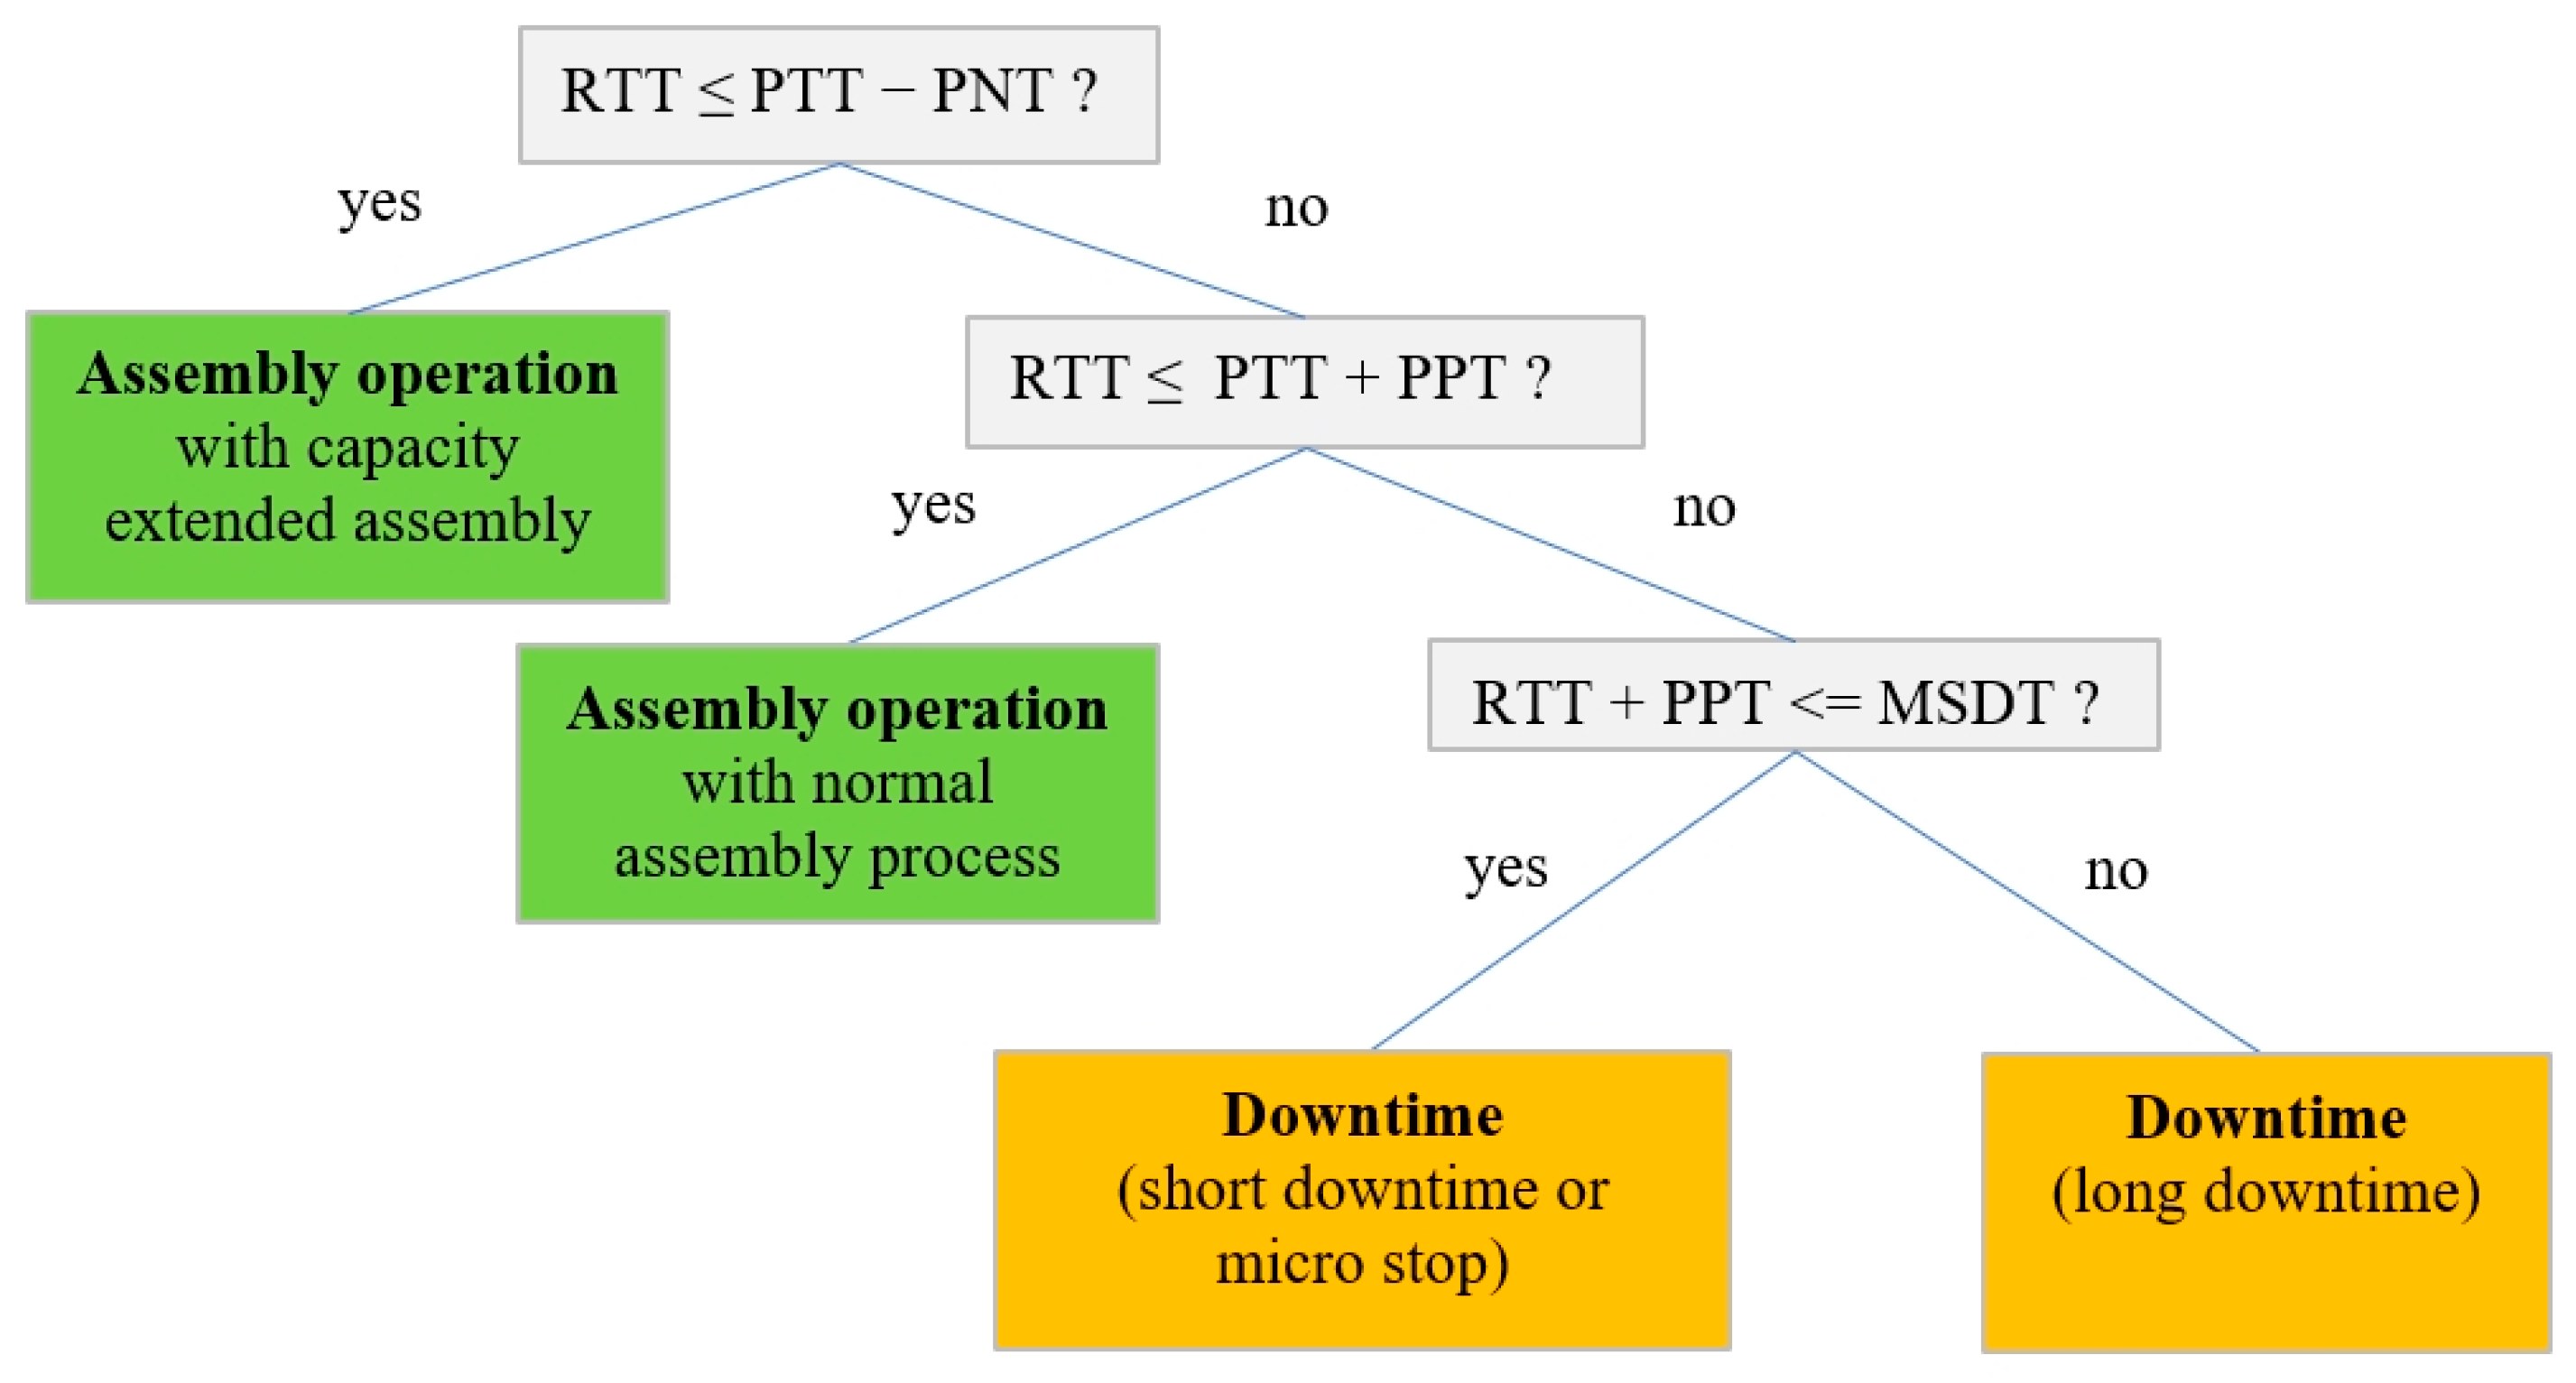
From decision tree, each category can be defined in two steps. In the first step, the real takt time (RTT) and planned takt time (PTT) are compared, taking into account the planned negative (PNT) and positive tolerances (PPT) from which the following groups can be determined:
Assembly operation with capacity extended assembly (temporarily more resources, e.g., multiple operators);
Assembly operation with normal assembly process;
Downtimes, which can be divided into two groups:
The decision tree for classifying assembly operations and downtimes is shown in
Figure 6.
In the second step, long downtime is classified in terms of planned and unplanned downtimes. In addition to the individual takt time data of the products, the time stamp is also taken into account when defining each category. In other words, the planned time and date of shift change, and the duration and date of the two planned breaks for all 3 shifts, are taken into account. In the following, the further breakdown is based on whether a product change occurred during the downtime, because this also results in a separate group (planned downtime and type change). As a final step, unplanned downtimes are identified that include machine failures and material missing. In
Figure 7, real industrial data were used to demonstrate the practical applicability of the decision tree.
These two decision trees serve as the basis for the OEE prediction presented in the next section.
4.3. Target-Oriented OEE Prediction
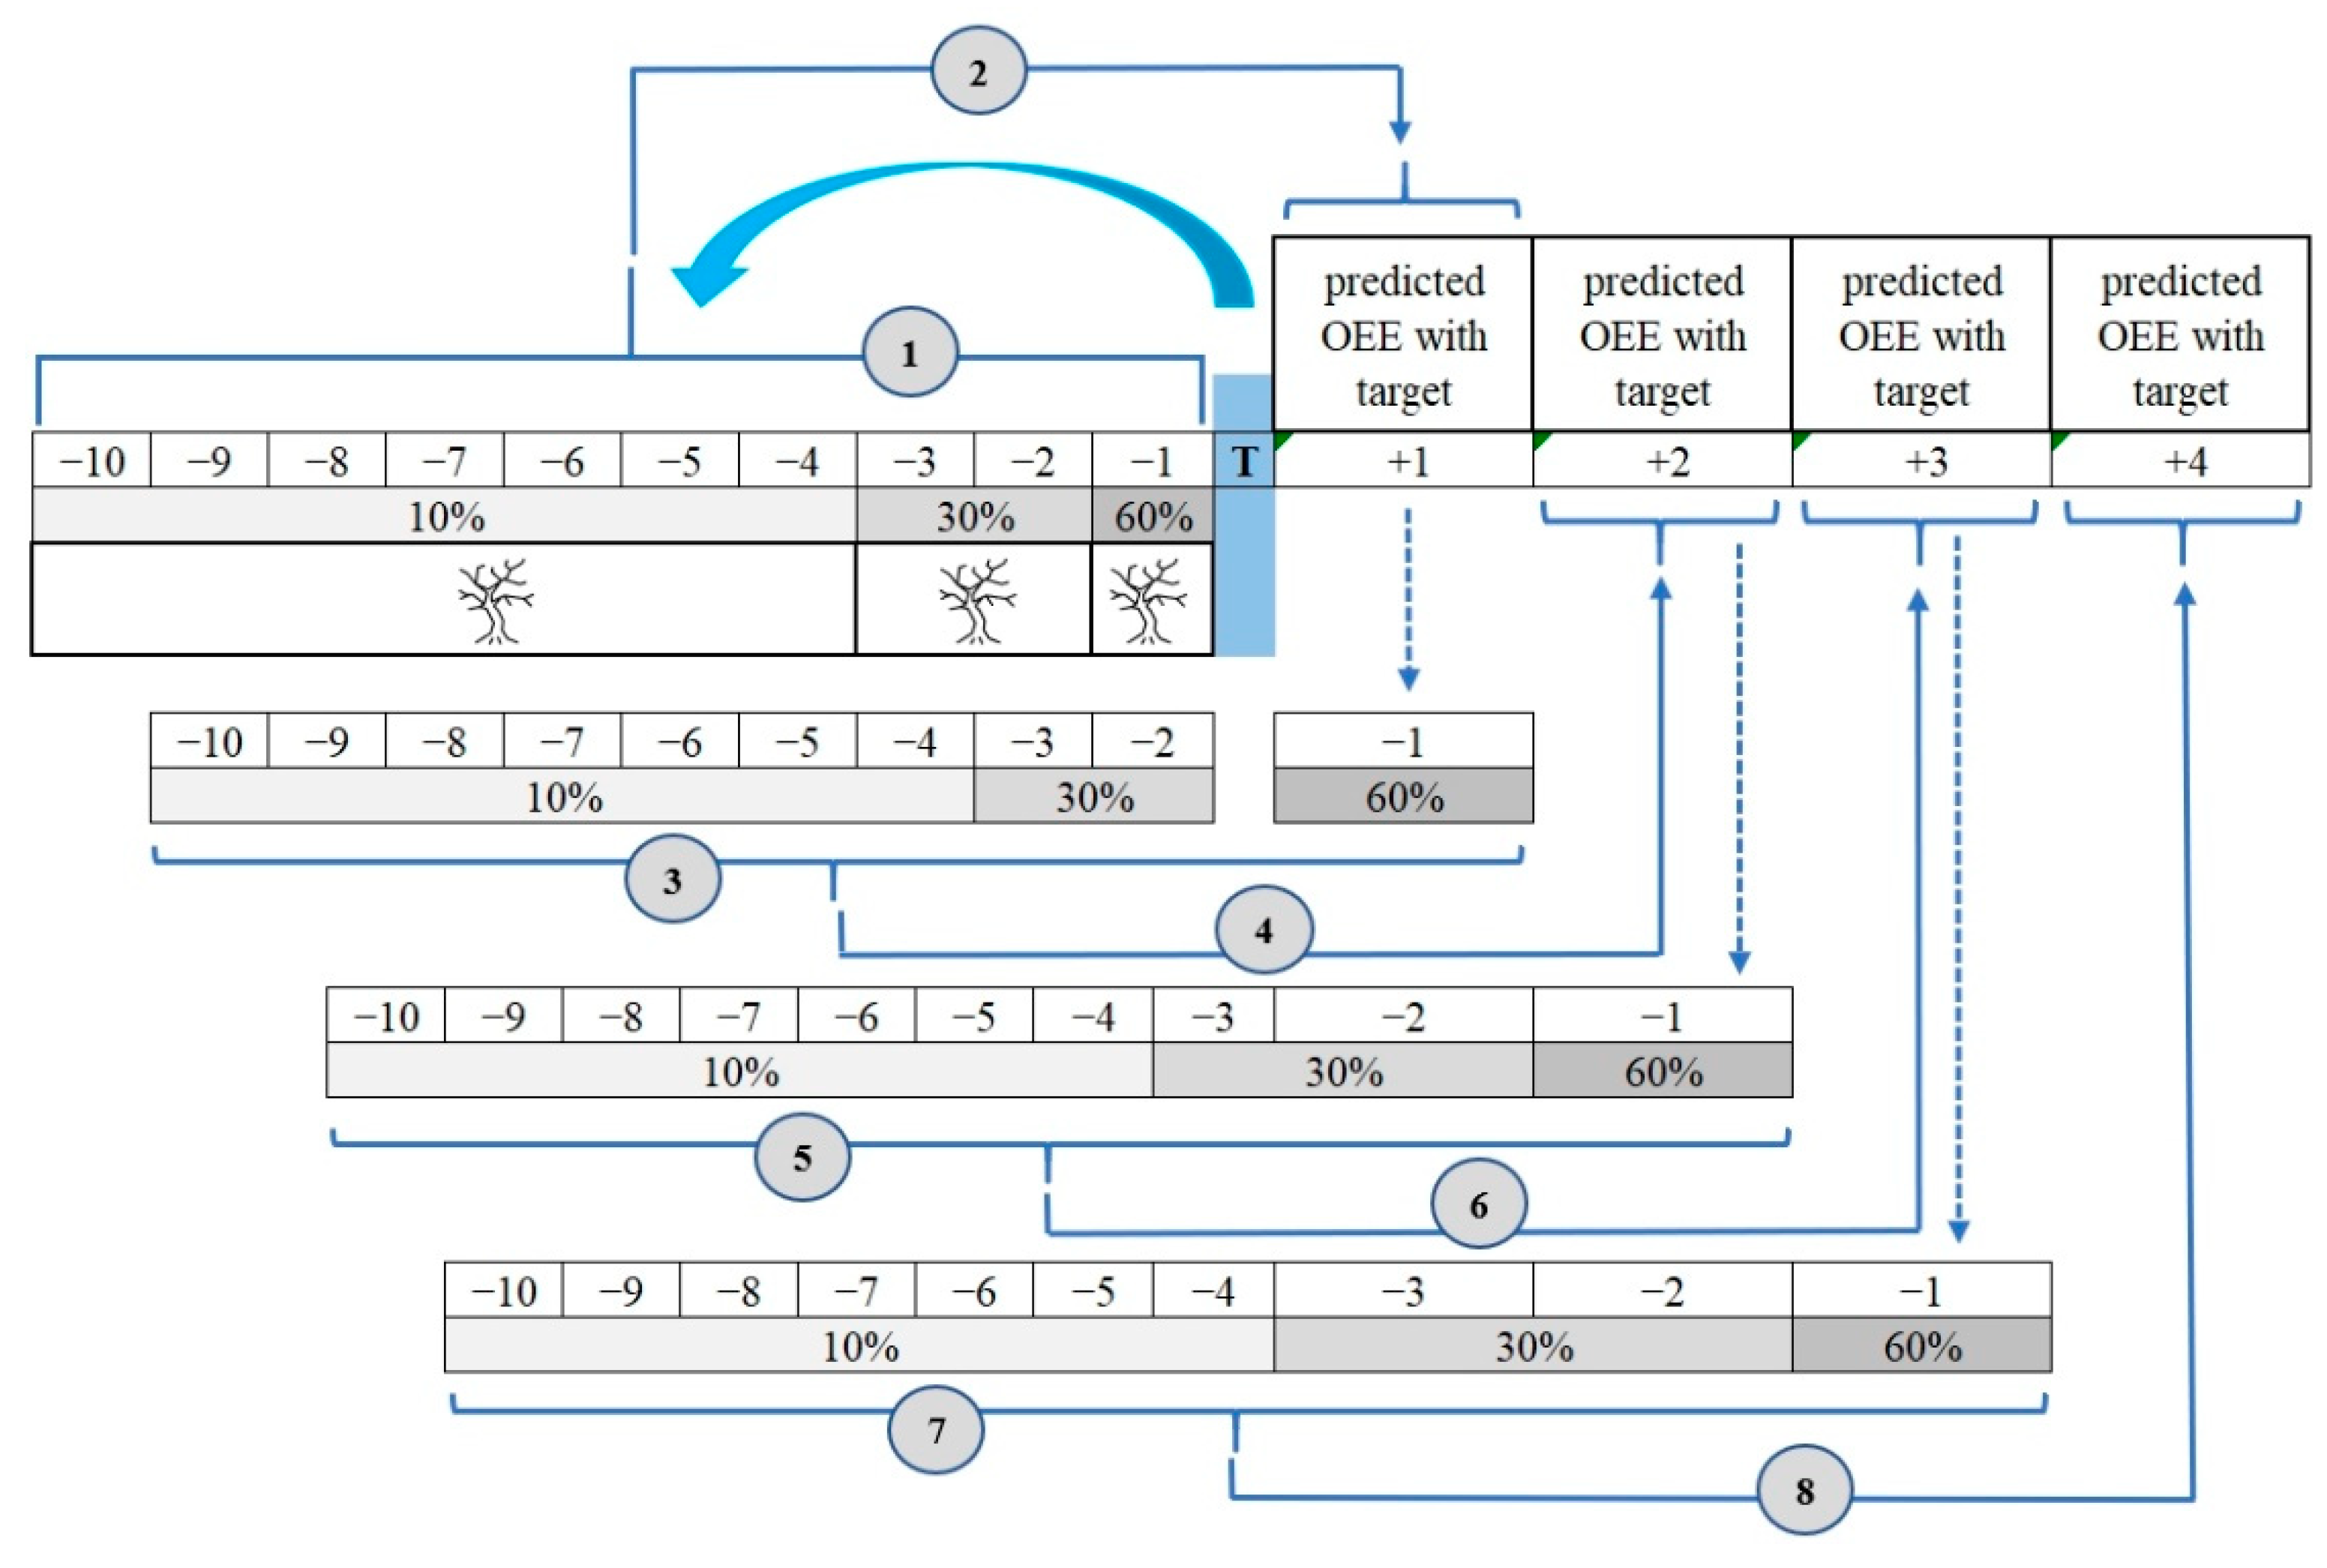
The aim of the target-oriented OEE prediction model is to predict the OEE value of the next few weeks based on the decision trees presented earlier, taking into account the OEE values of the recent past with different weights, while also taking into account the planned OEE target. The target-oriented OEE prediction model is shown in
Figure 8.
The model for each step is as follows:
The groups described by the decision trees for each period and the values of their percentage distribution explain the magnitude and reasons for the OEE value.
- 2.
The average of the OEE value obtained from the weighted values and the target set for the given assembly line will be the predicted OEE value for the first week (T + 1) after period T.
- 3.
To determine the weekly OEE value for the period T + 2, the weighting ratio of 60%, 30% and 10% for ten weeks shall be modified as a rolling window, so that the 60% ratio is the value predicted in the section point 2 (T + 1) represents.
- 4.
Based on section point 3, the average of the OEE value obtained from the weighted values and the target set for that assembly line will be the predicted OEE value for the second week (T + 2) after period T.
- 5.
To determine the weekly OEE value for the period T + 3, the weighting ratio of 60%, 30% and 10% for ten weeks is modified like a rolling window, so that the 60% ratio is represented by the value predicted in section point 2 (T + 1), and the 30% rate will be the average of the T − 1 period and the T + 1 value predicted in section point 2.
- 6.
Based on section point 5, the average of the OEE value obtained from the weighted values and the target set for that assembly line will be the predicted OEE value for the third week (T + 3) after period T.
- 7.
To determine the weekly OEE value for the period T + 4, the weighting ratio of 60%, 30% and 10% for ten weeks is modified a rolling window, so that the 60% ratio is represented by the value predicted in section point 2 (T + 1), and the 30% ratio will be the average of the T + 2 predicted in section point 4 and the T + 3 predicted in section point 6.
- 8.
Based on section point 7, the average of the OEE value obtained from the weighted values and the target set for that assembly line will be the predicted OEE value for the fourth week (T + 4) after period T.
The calculation method of the model shows the expected value of OEE, while the decision tree highlights why the value of OEE will be so high. The presented model is based on the fact that longer-term monitoring is not necessary, because in the current turbulent automotive market environment, the factors influencing the value of OEE may vary from week to week for the following reasons, among others:
Material shortages (e.g., electronics chips, metal, plastic, etc.);
Variable sales orders, variable quantity and product mix;
Availability of resources (fluctuating energy prices, availability of labor, absence rate, etc.).
Besides these, other specific short- and long-term measures, e.g., previous technical and technological developments, the use of Lean methods and customer guidance also affect longer-term time series data, the impact of which is not always effective at present due to the decline in practical sustainability.
4.4. OEE Prediction Model in the Industrial Practice
For the hybrid assembly line 2 presented in
Section 4.1 for the same period (week 43/2021–week 5/2022), the target-oriented OEE prediction model using the predicted values for the one-week forecast (T + 1) and the realized OEE values shows in
Figure 9.
Based on the model, the four-week forecast descriptive statistics are illustrated in
Table 7.
It is characteristic of the short-term prediction that the weekly values do not differ much for each parameter (e.g., minimum value, maximum value, mean, range and standard deviation). The authors publish more detailed classification distribution data based on decision trees in another scientific article [
50].
5. Discussion
In this section, human prediction and target-oriented OEE prediction are compared. Human estimation is characterized by a wide forecast range, while target-oriented OEE prediction is a narrow range. This means that the maximum negative deviation of the forecast and the maximum positive deviation of the forecast compared to the realized one are much more accurate in the case of the target-oriented OEE prediction model. Both the accuracy of human prediction per shifts level and the accuracy of target-oriented OEE prediction for weekly levels are within 1%. The detailed comparison is shown in
Table 8.
The maximum negative and positive deviation is derived from the difference between the values of the estimated data and realized data in both the human prediction and target-oriented prediction model.
To sum up the advantages of the target-oriented OEE prediction model are as follows:
Takes into account real and current circumstances;
More accurate than human forecast with a smaller standard deviation (human prediction accuracy is more than two percent, target-oriented prediction less than one percent on a weekly basis);
In contrast to most mathematical and statistical models, it ensures that the OEE cannot be greater than 100% (even for increasing trends, the calculation data is always less than 100%);
Gives an accurate answer to the OEE value in terms of contributors (availability, performance and quality) with the help of decision trees; thus, in addition to forecasting, it also provides guidance on which groups to focus on in order to increase efficiency;
Takes into account the goal to which the entire operational organization intends to go and allocates resources accordingly;
Classification can be conducted using Excel; it does not require another tool or program (after MES or SQL query, the .csv file can be processed with Excel using various functions);
It requires a small amount of human resources.
Compared to current research results, the presented method demonstrates the expected value of OEE, while the decision tree highlights why the value of OEE will be so high.
Based on these, the target-oriented OEE prediction model is excellent for estimating OEE percentages on semi-automatic assembly lines. The model can also be used to predict the efficiency of individual machines and full-automatic assembly lines in any industry. It could be a topic of further research to extend the target-oriented OEE prediction model for a longer estimation time, e.g., for two or three months. In addition, it is worth examining how the model behaves during different life cycles of the product, where efficiency is highly stochastic. Another way, could be in the future to develop the prediction model with a rule adaptation. During the prediction, recognized rules can be selected, confirmed and omitted to provide an even more accurate prediction.


