
Optimized Parameter for Butt Joint in Friction Stir Welding of Semi-Solid Aluminum Alloy 5083 Using Taguchi Technique


Abstract
:1. Introduction
2. Methodology
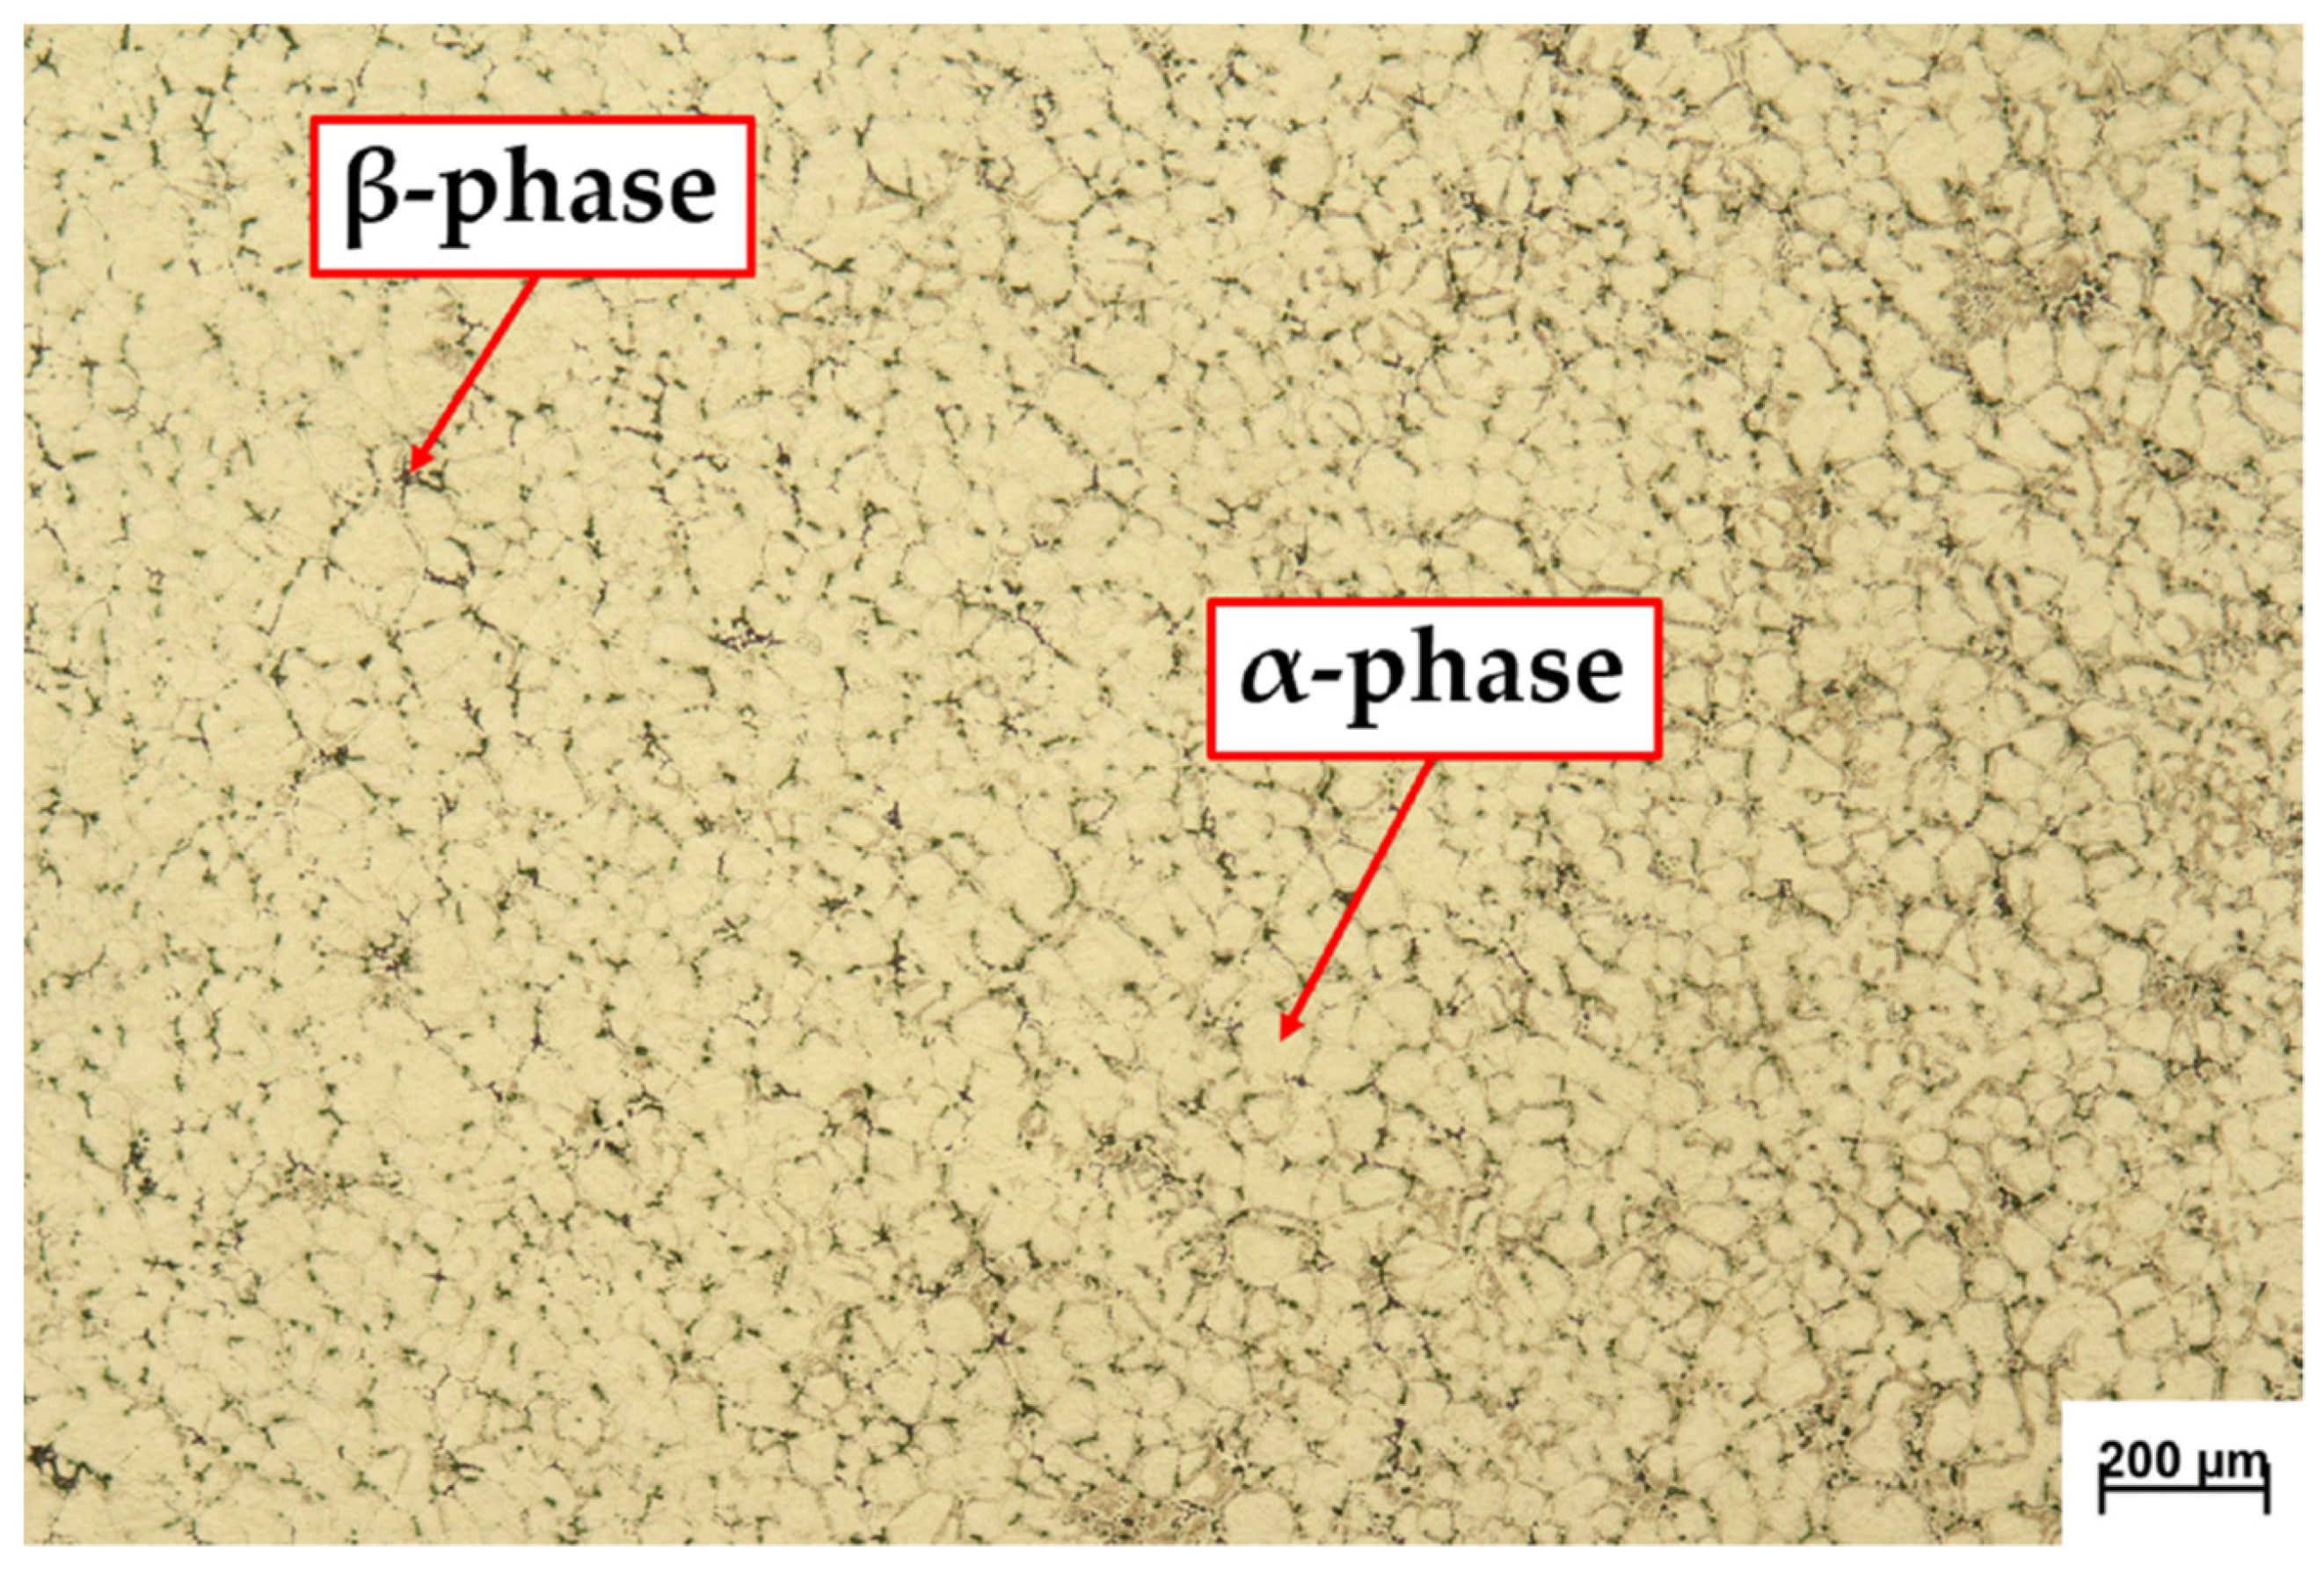
2.1. Materials
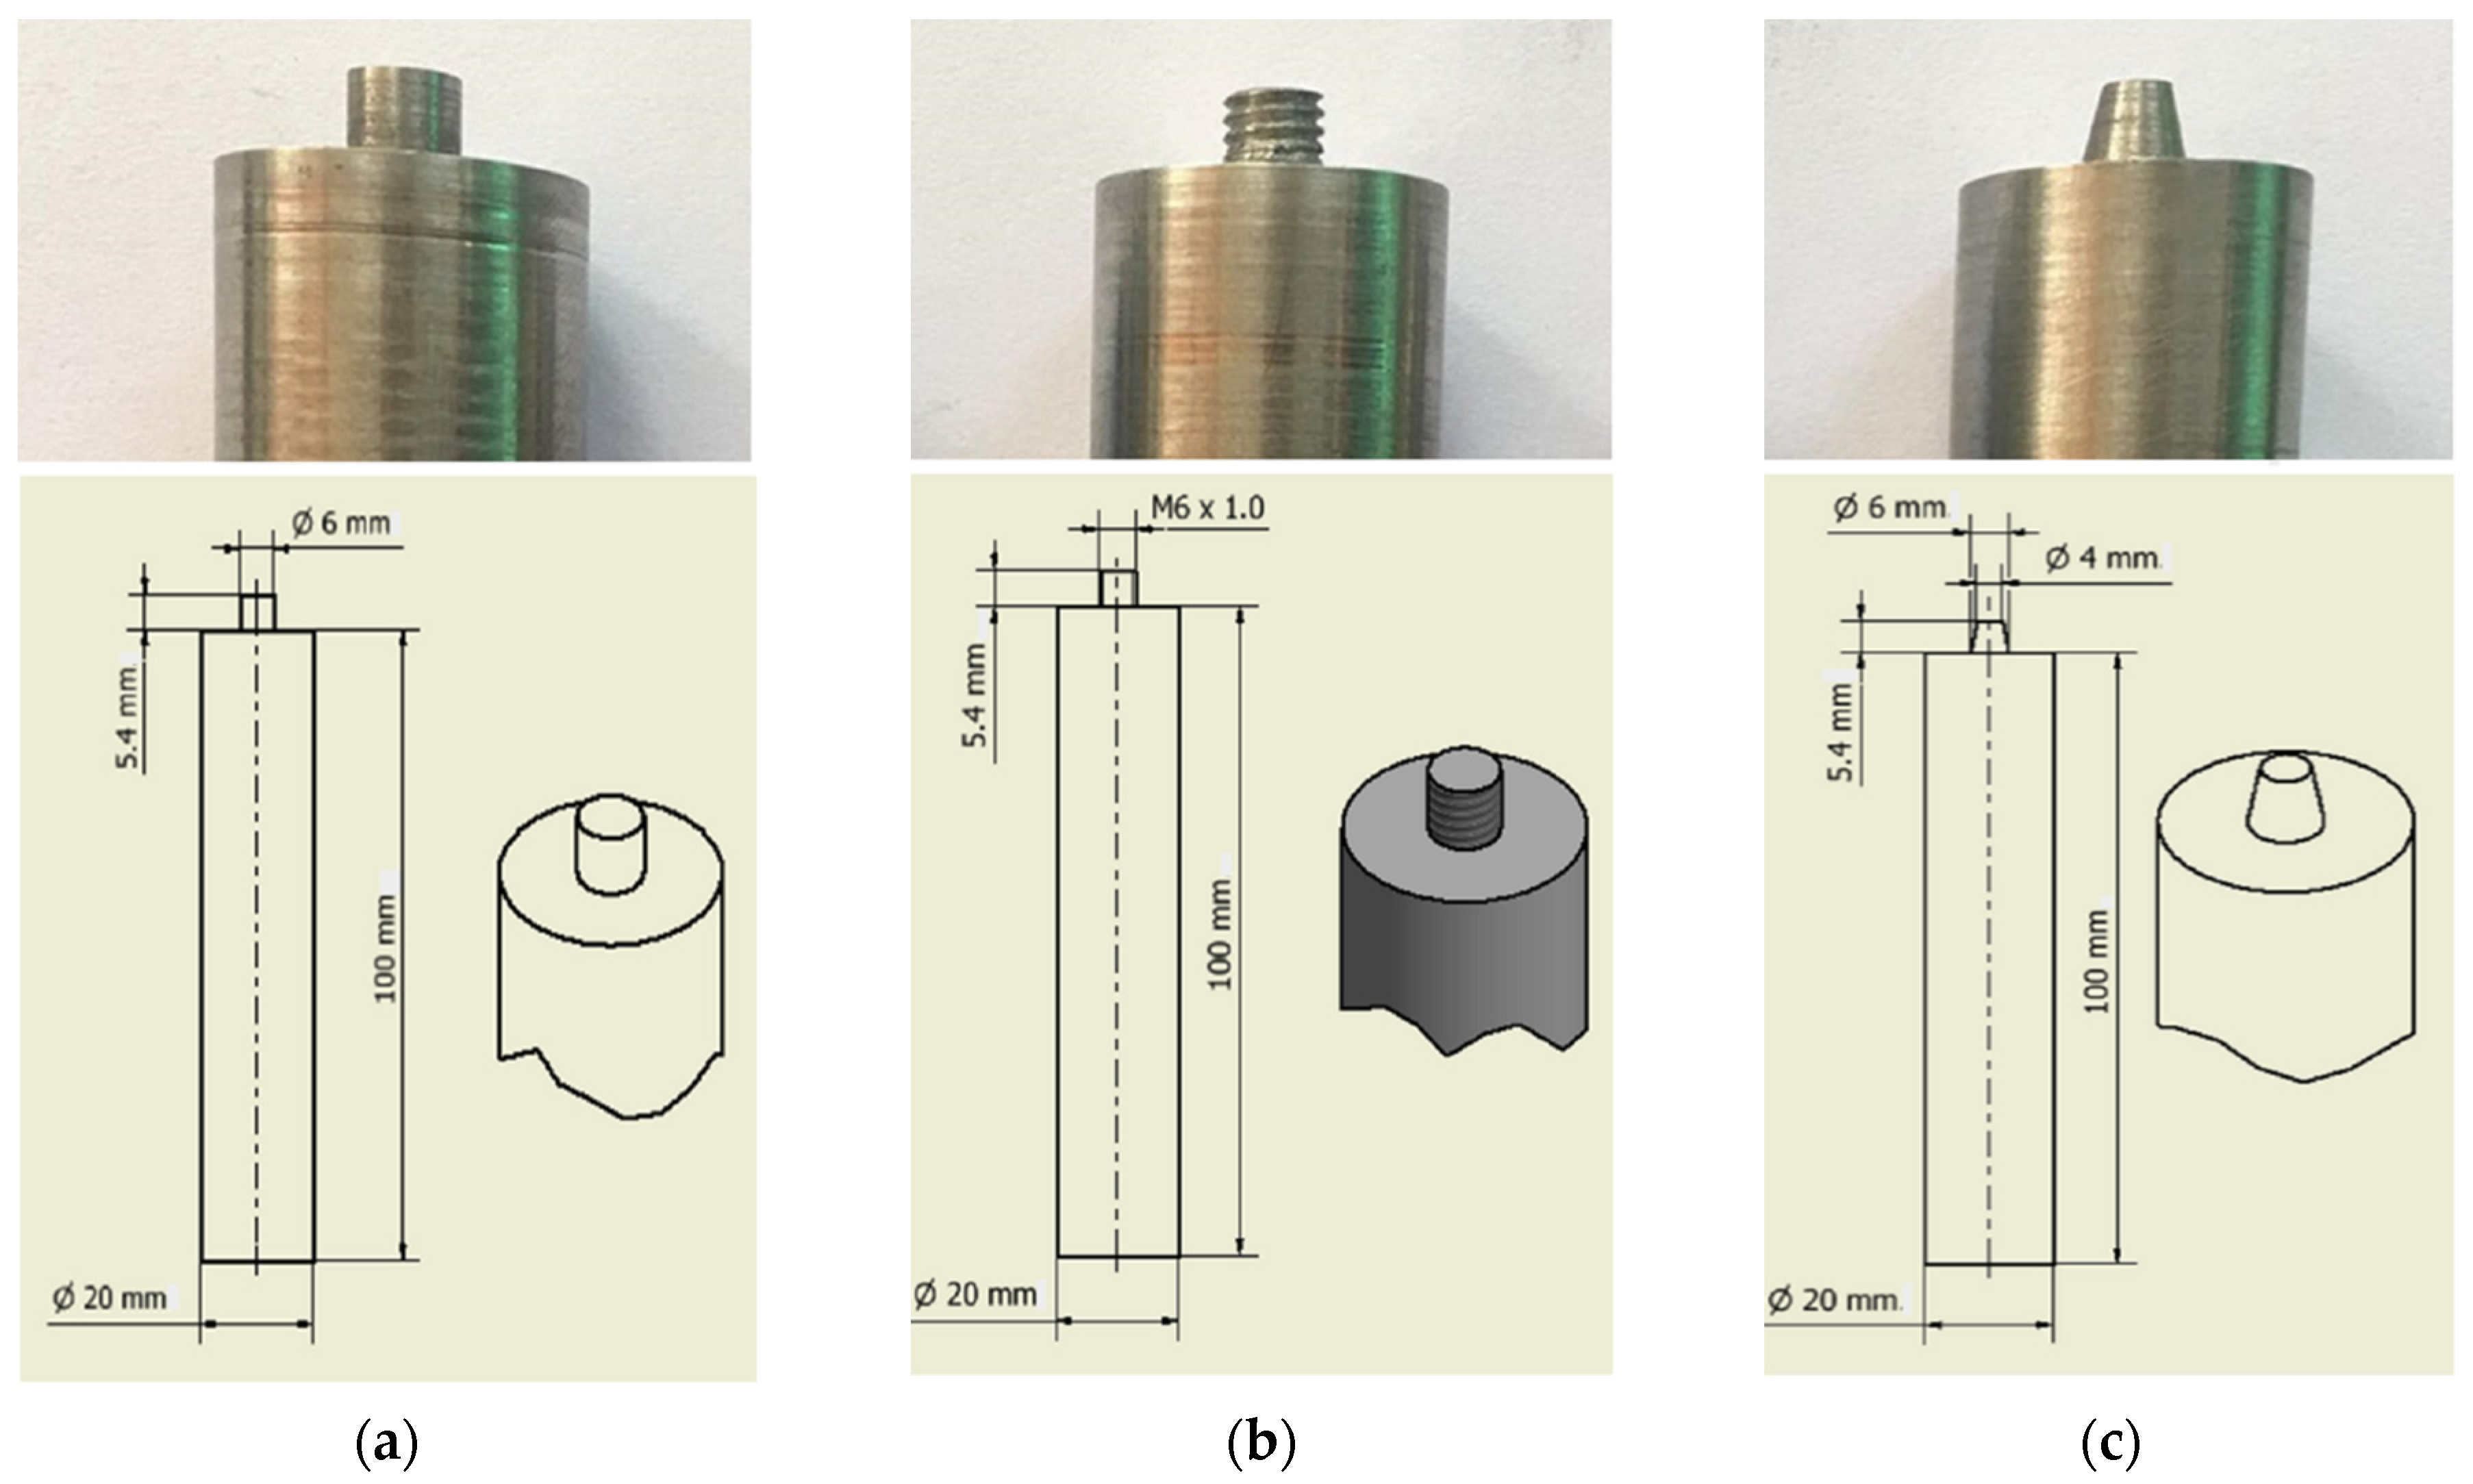
2.2. Friction Stir Welding (FSW) Process
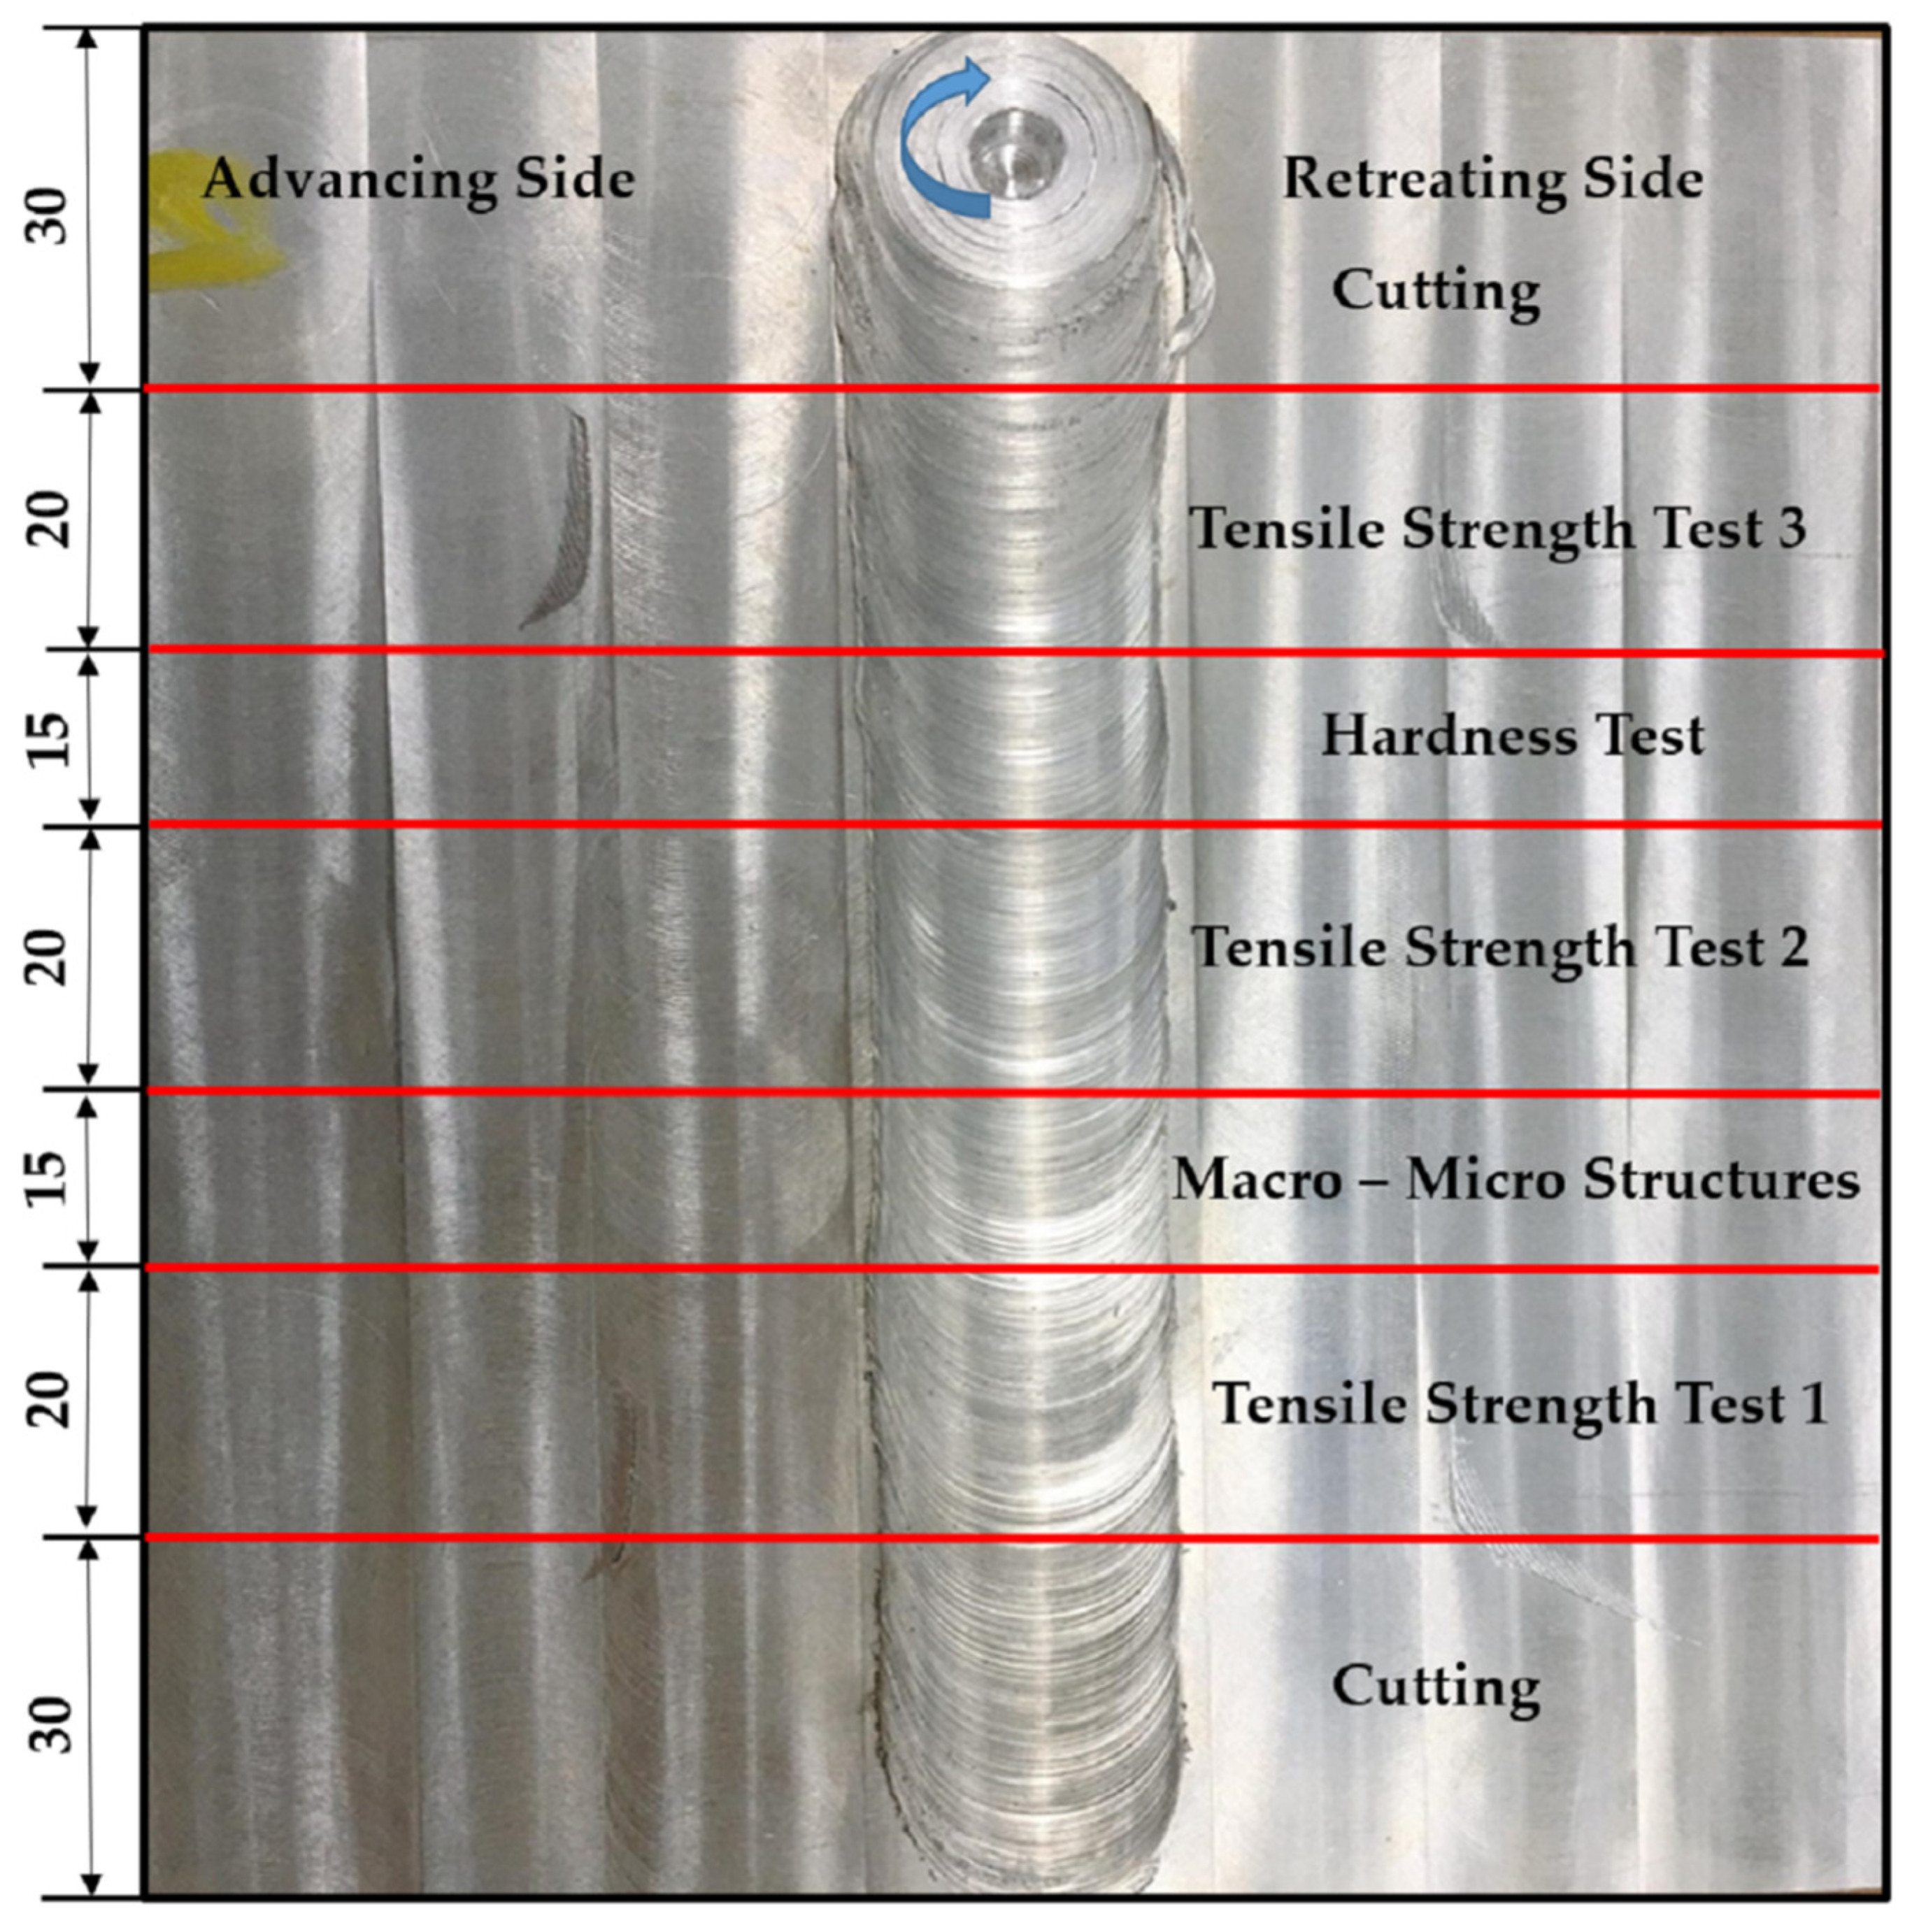
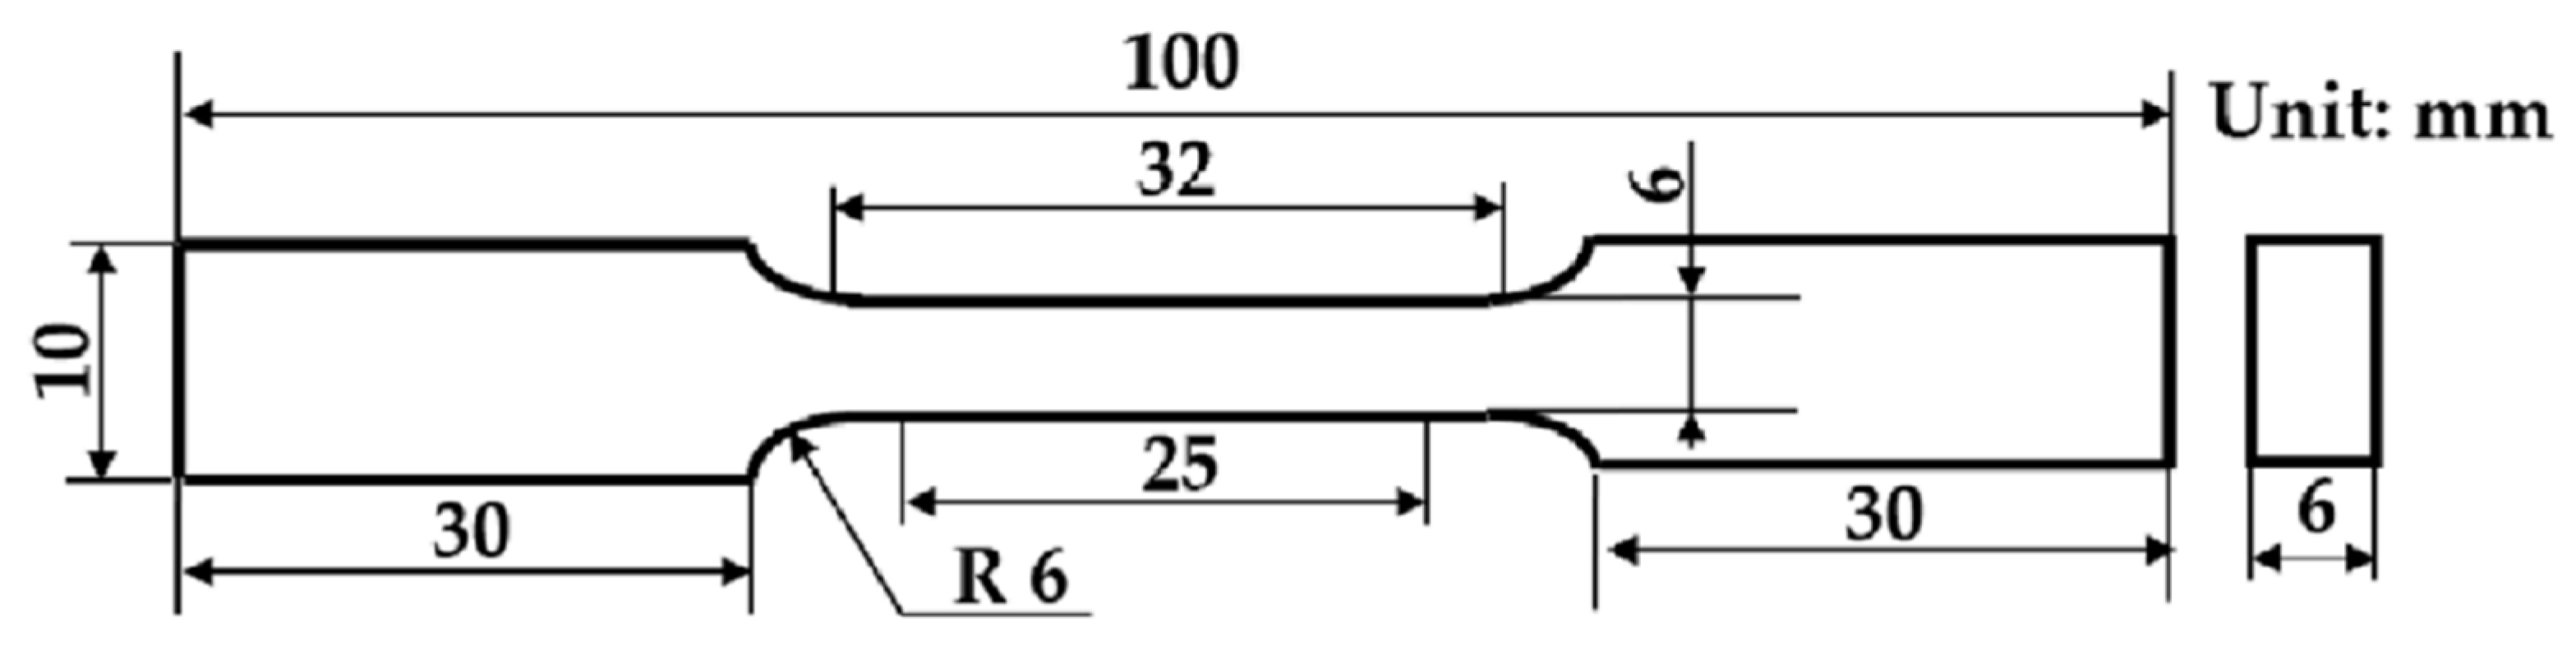
2.3. Mechanical Property Testing and Metallurgical Structural Inspection
2.4. Experimental Design with the Taguchi Method
3. Results and Discussion
3.1. Signal-to-Noise Ratio (S/N Ratio)
3.1.1. S/N Ratio for Tensile Strength
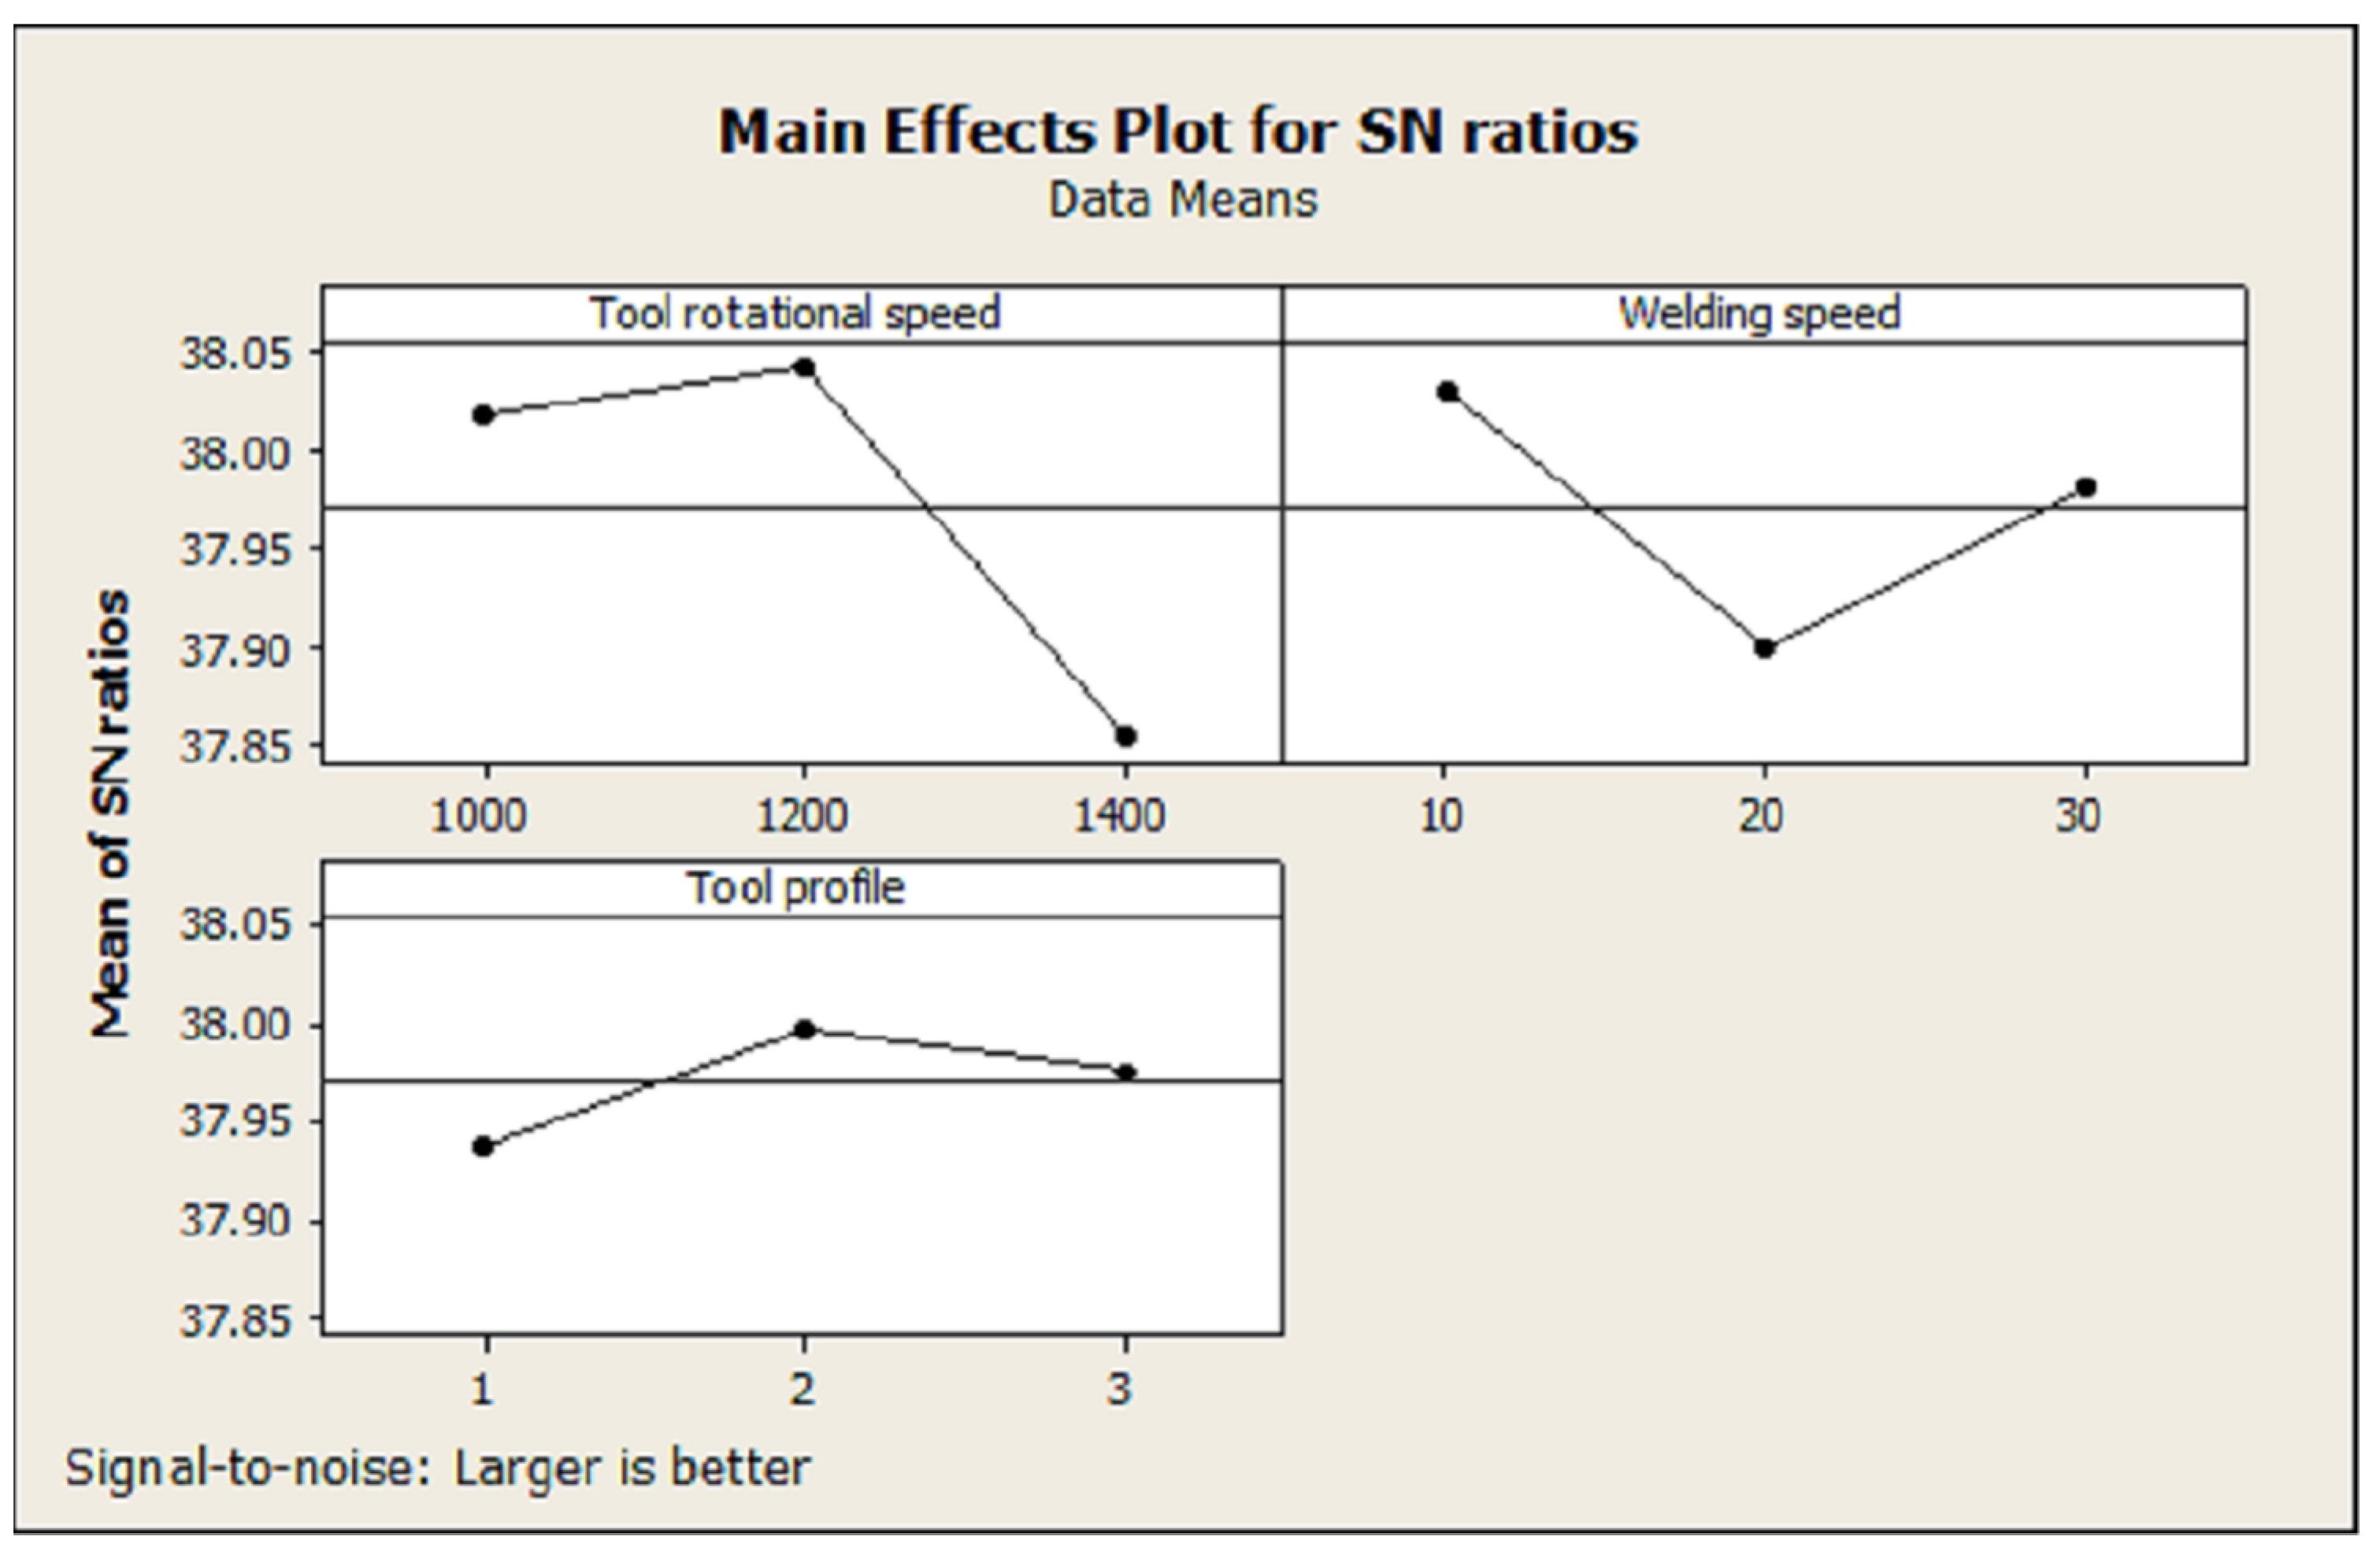
3.1.2. S/N Ratio for the Hardness in the SZ
3.2. Analysis of Variance (ANOVA)
3.3. Regression Analysis
3.4. Confirmation Analysis
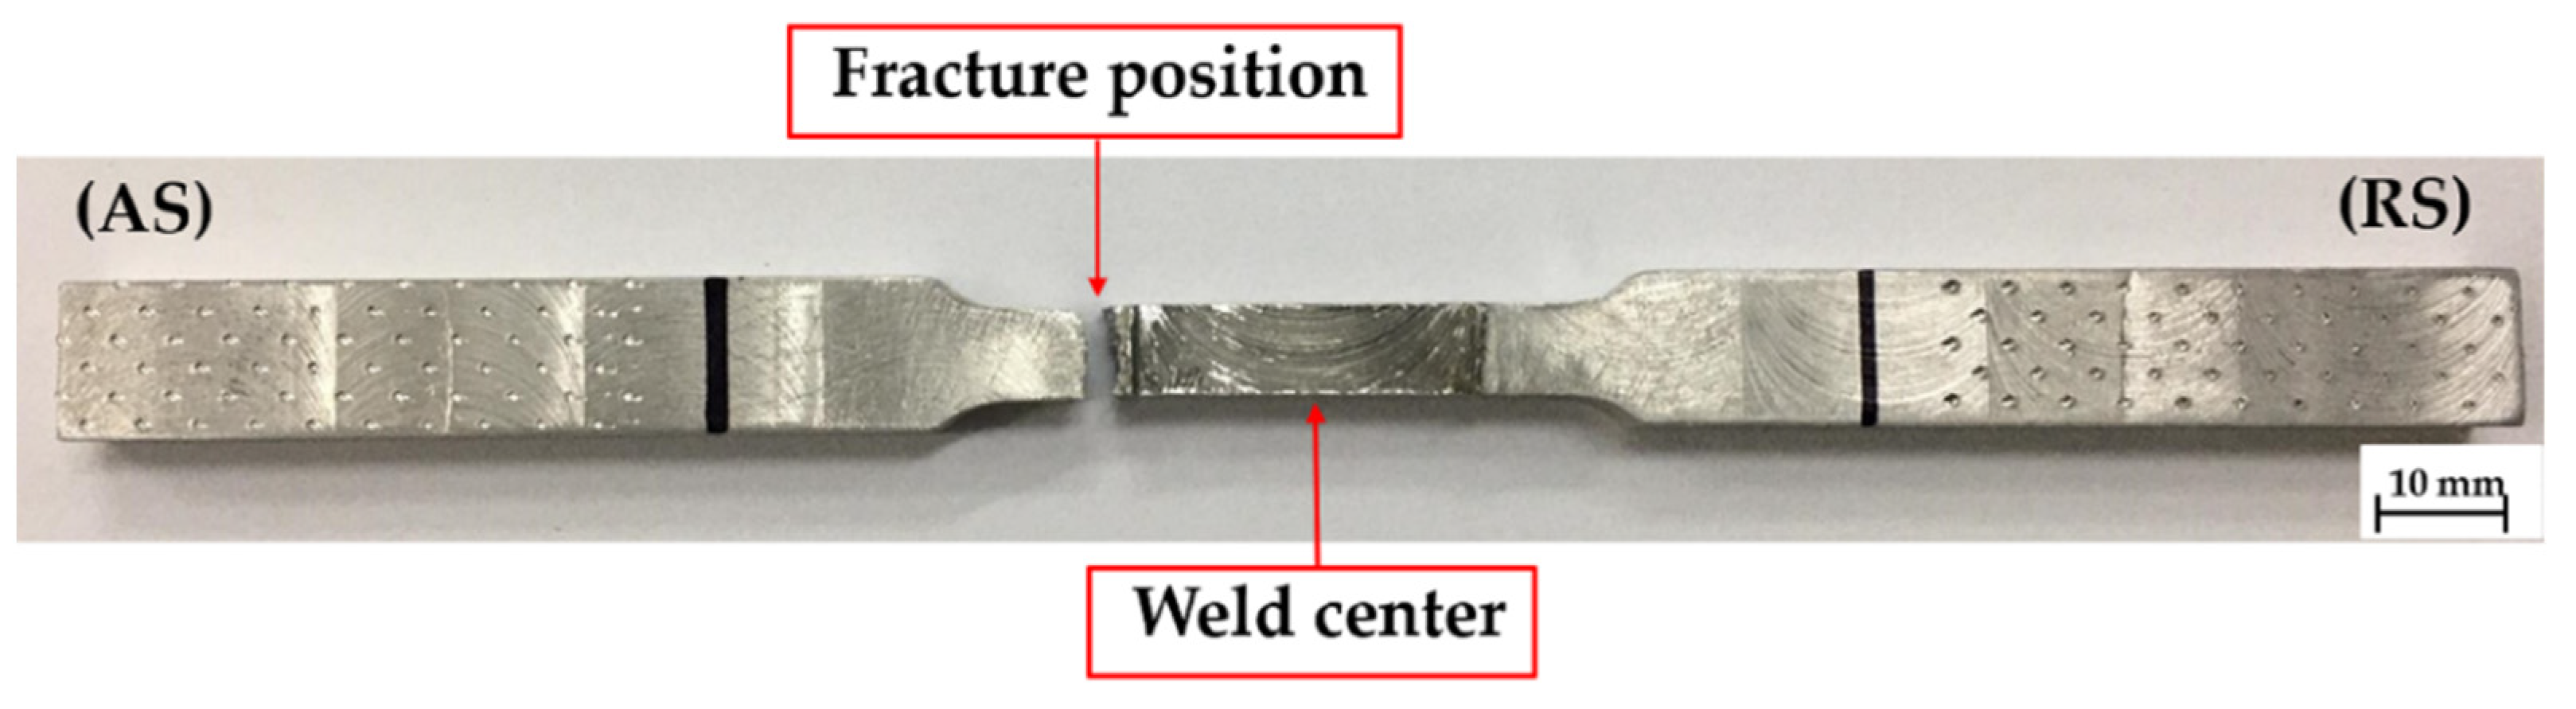
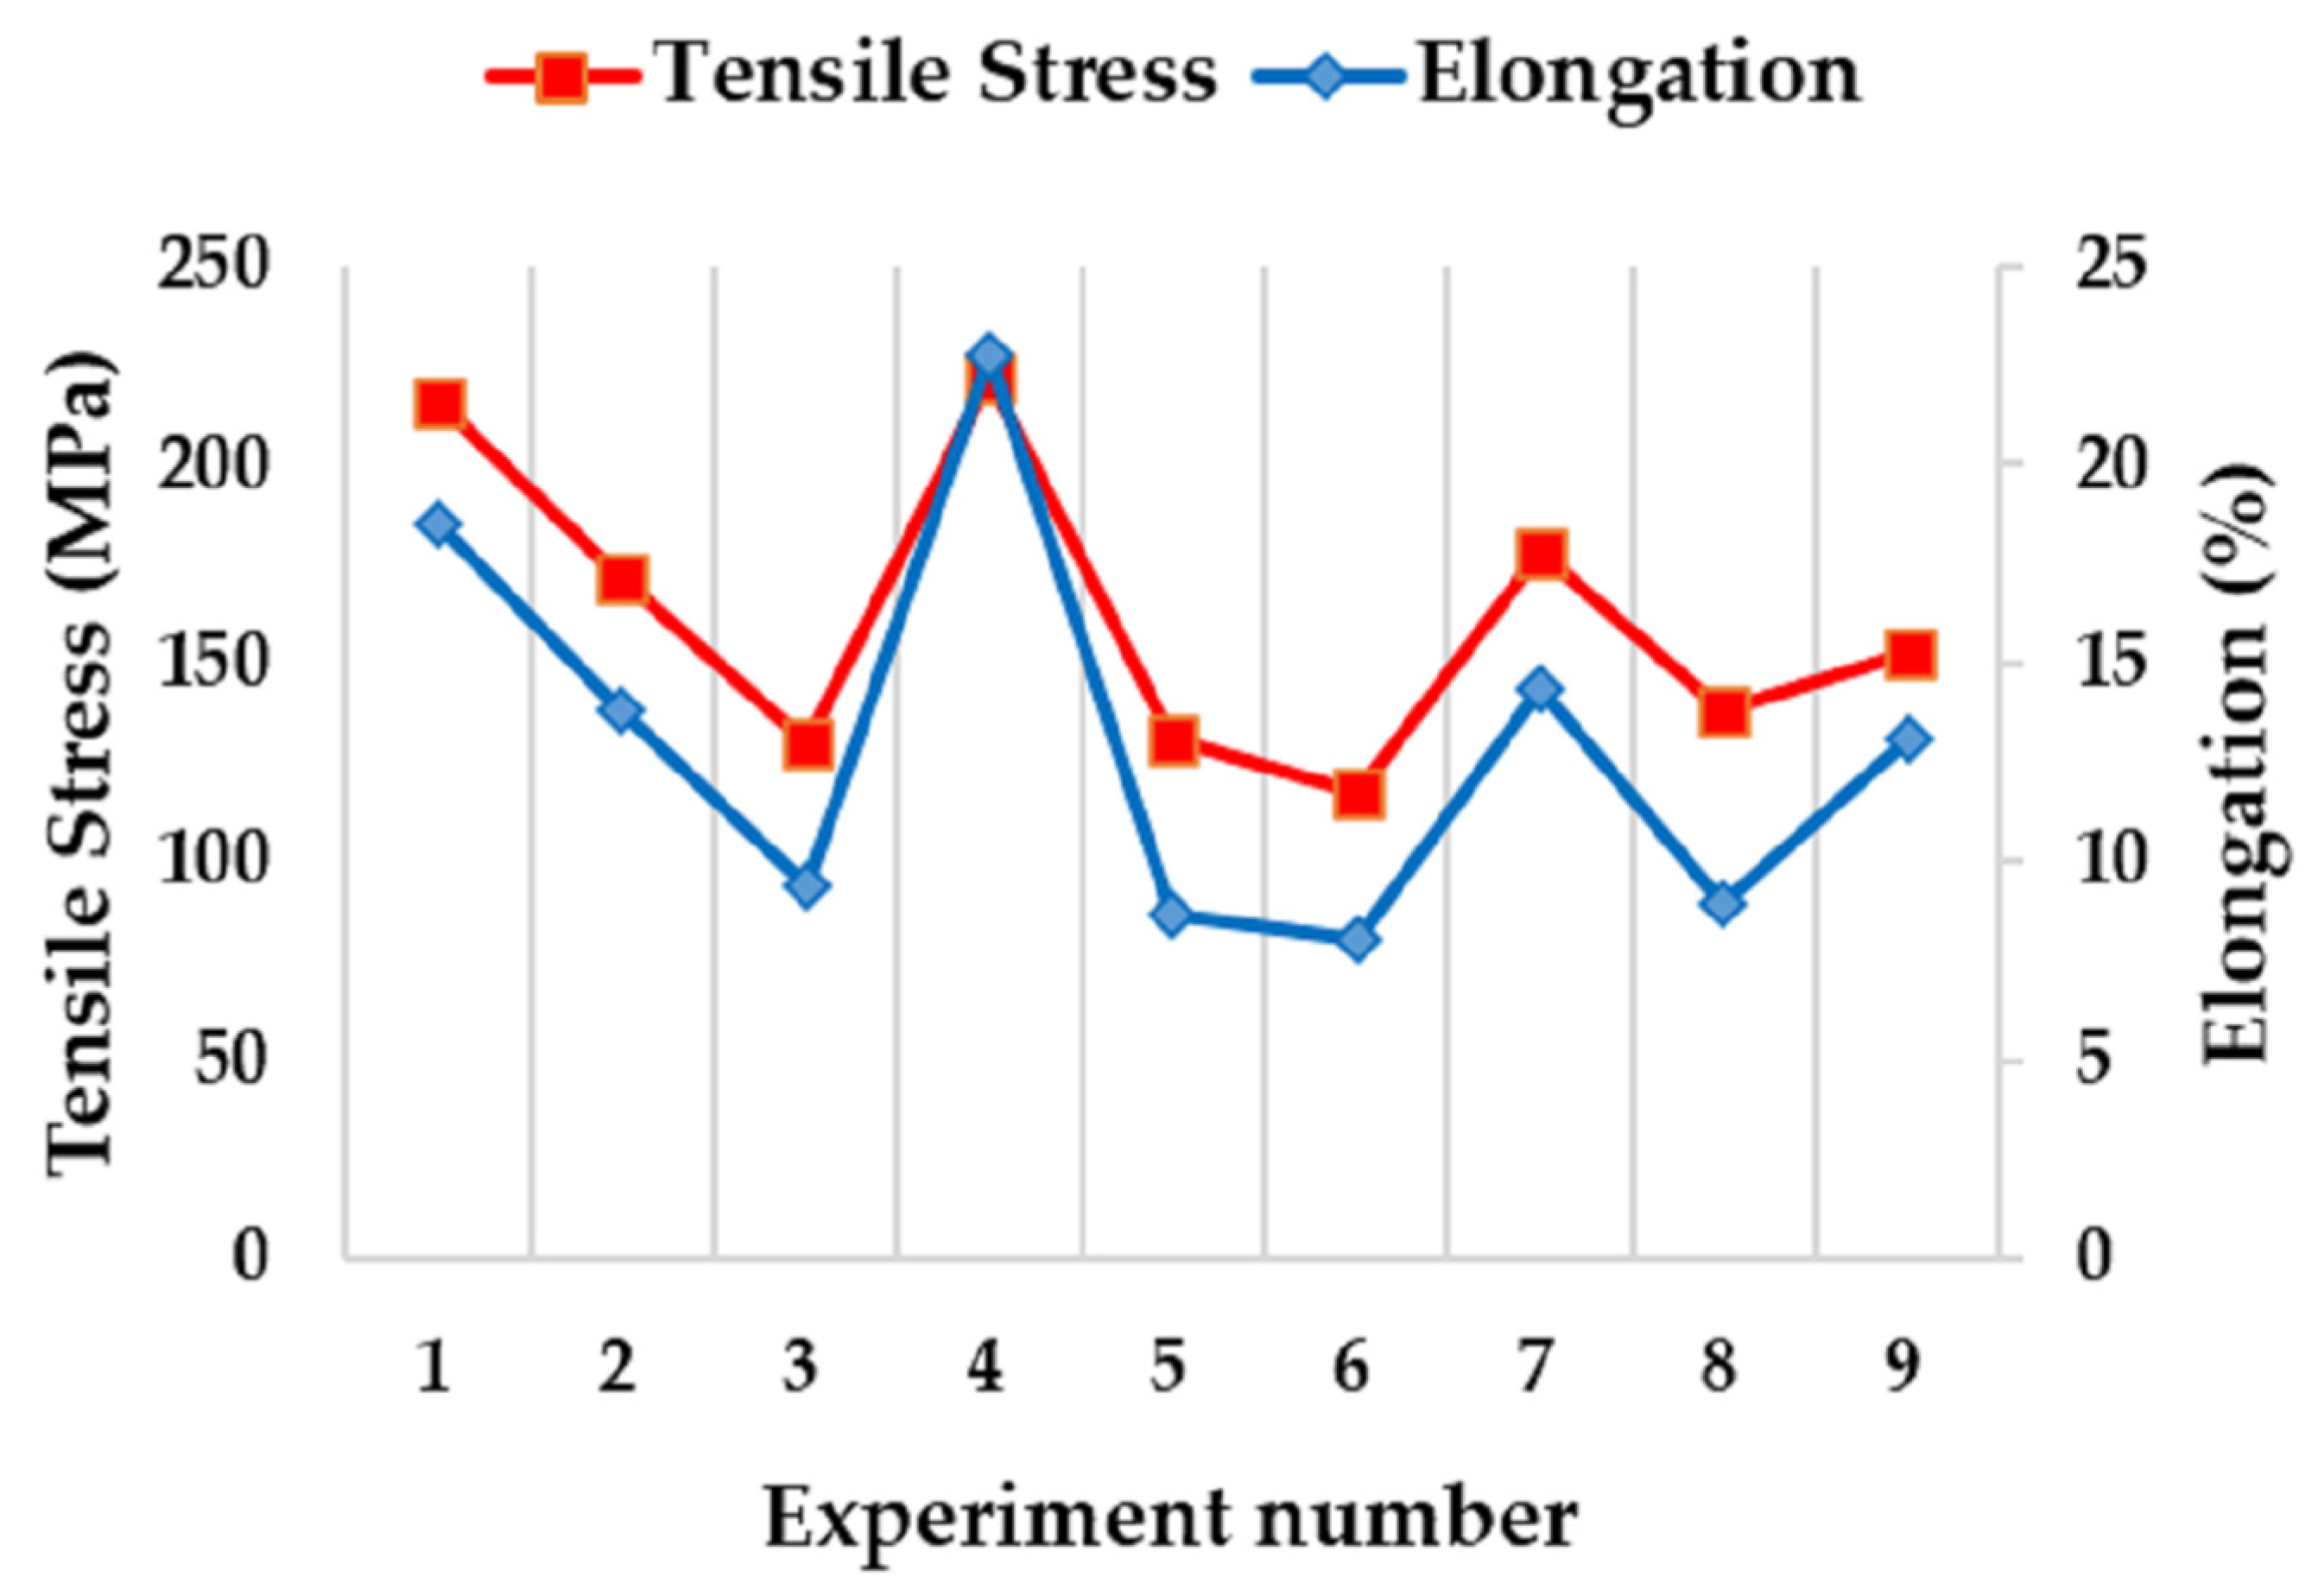
3.5. Analysis of Tensile Tests
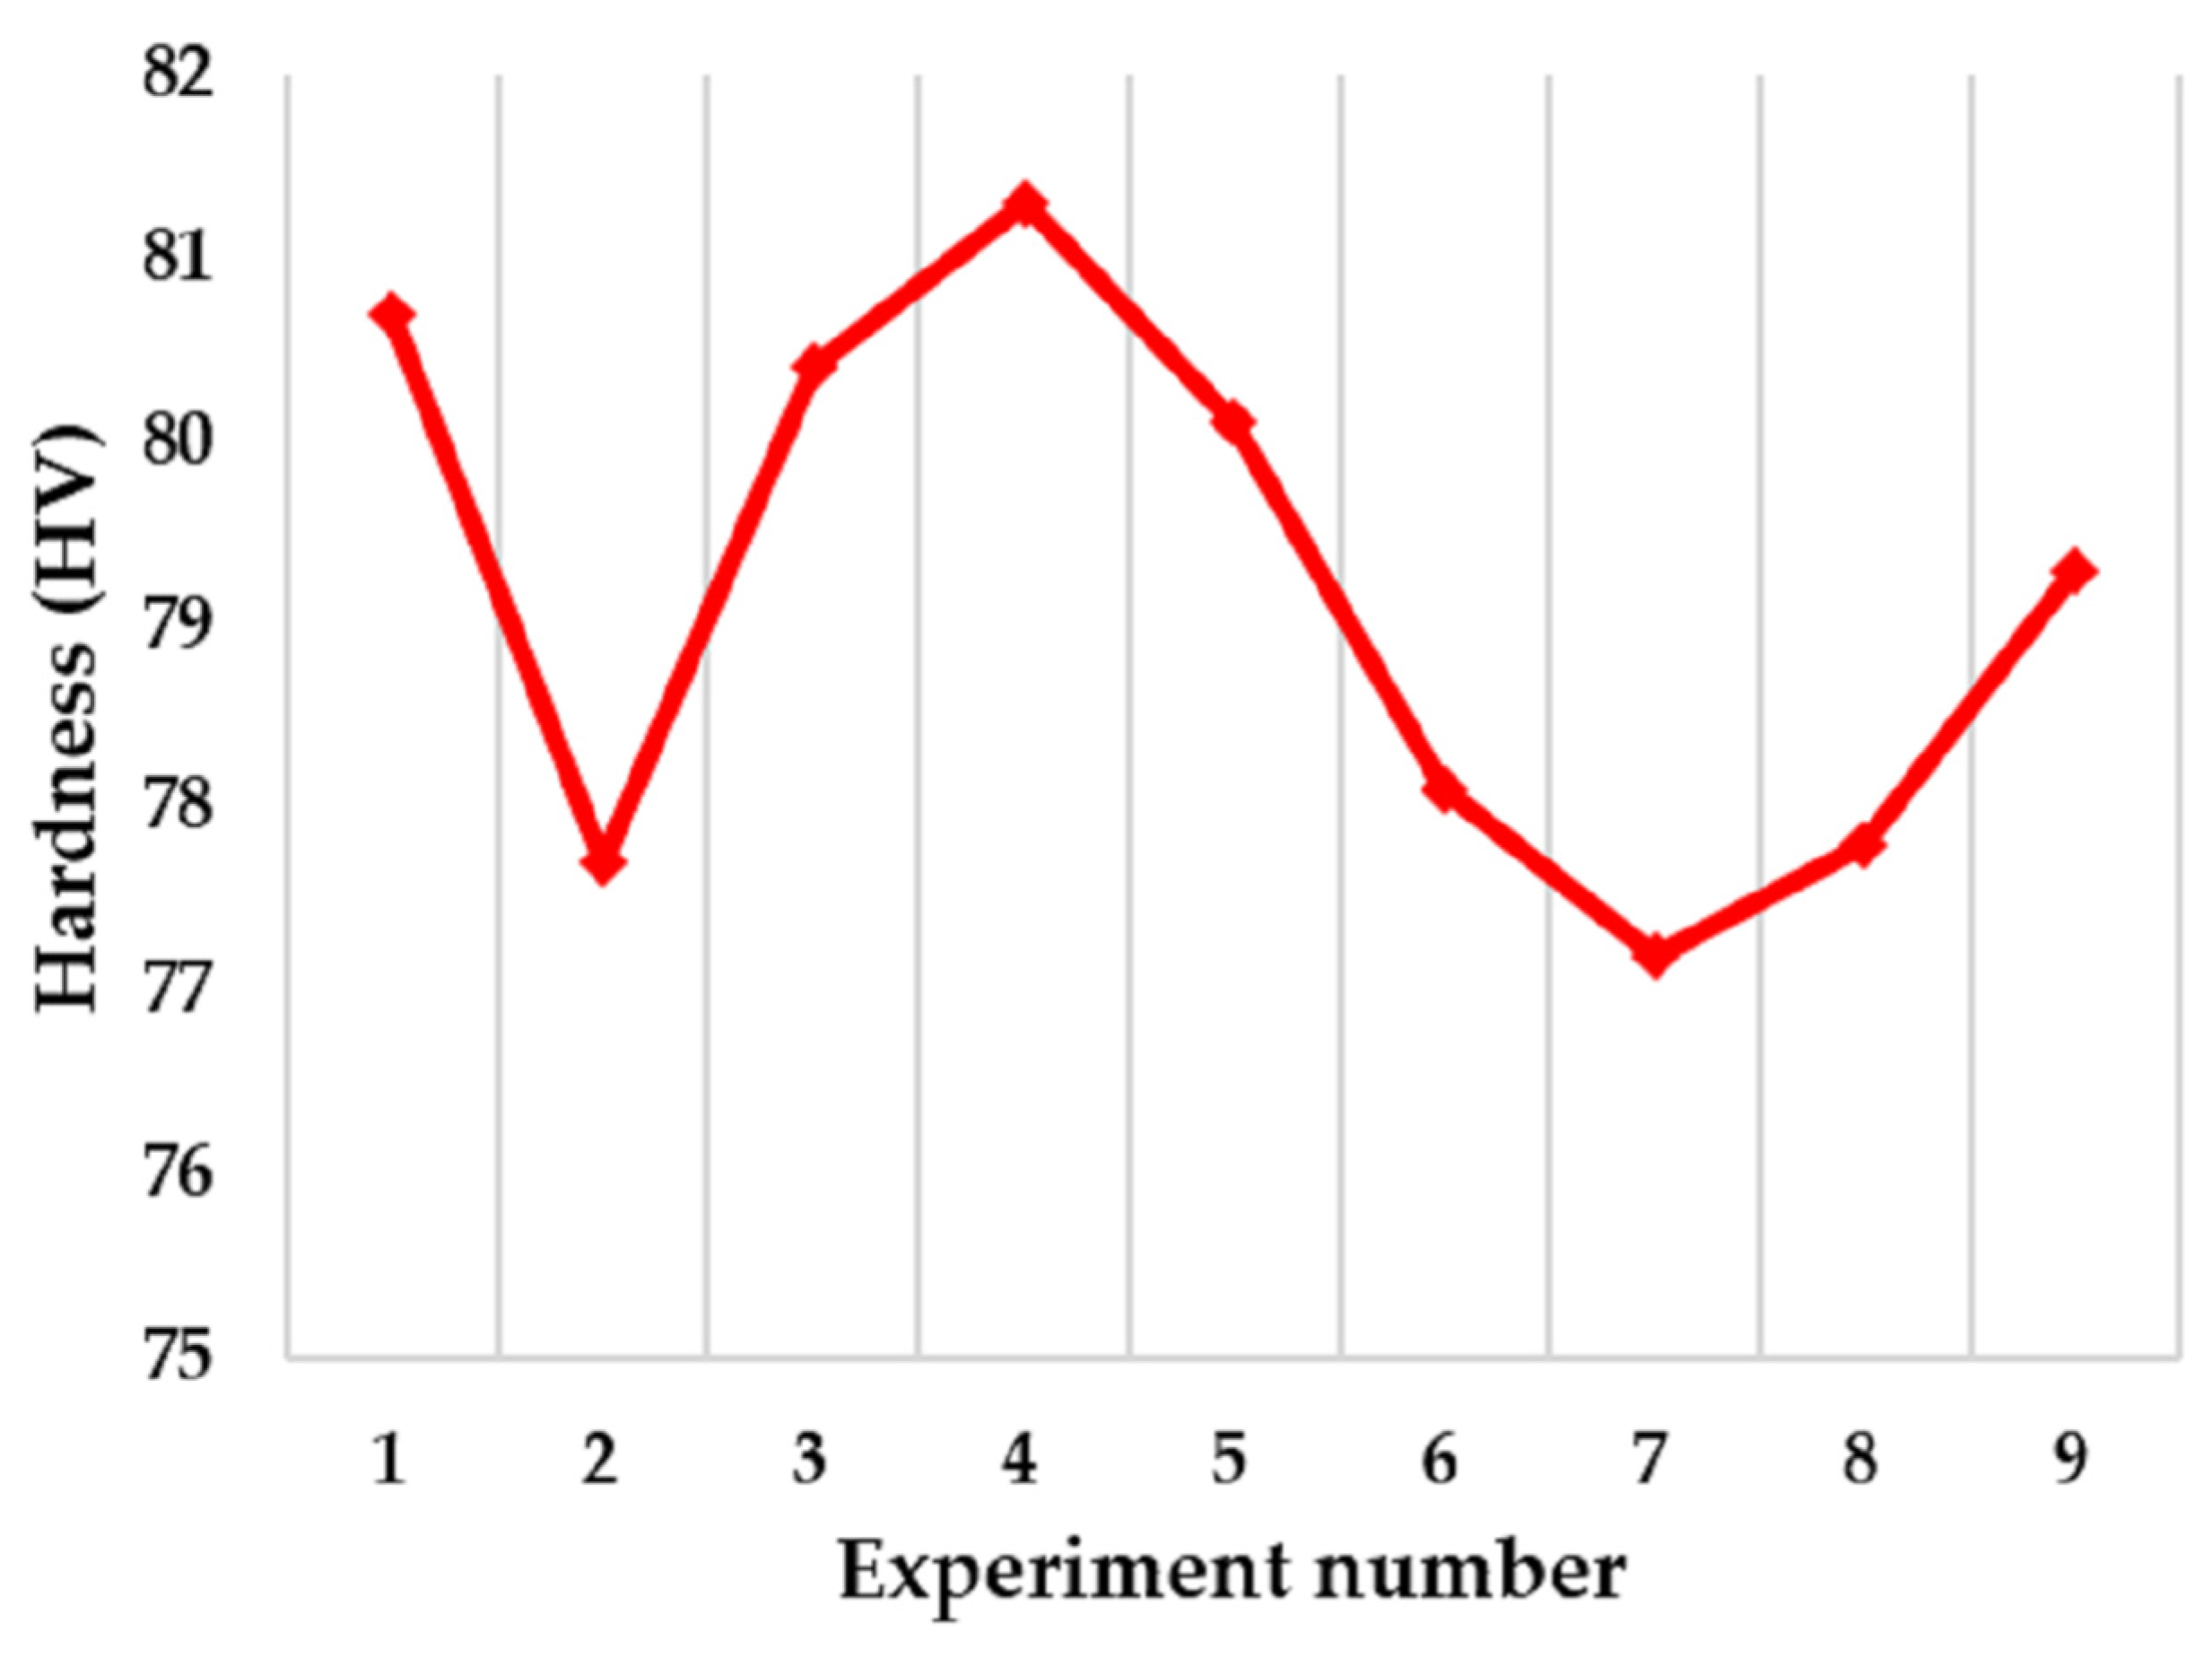
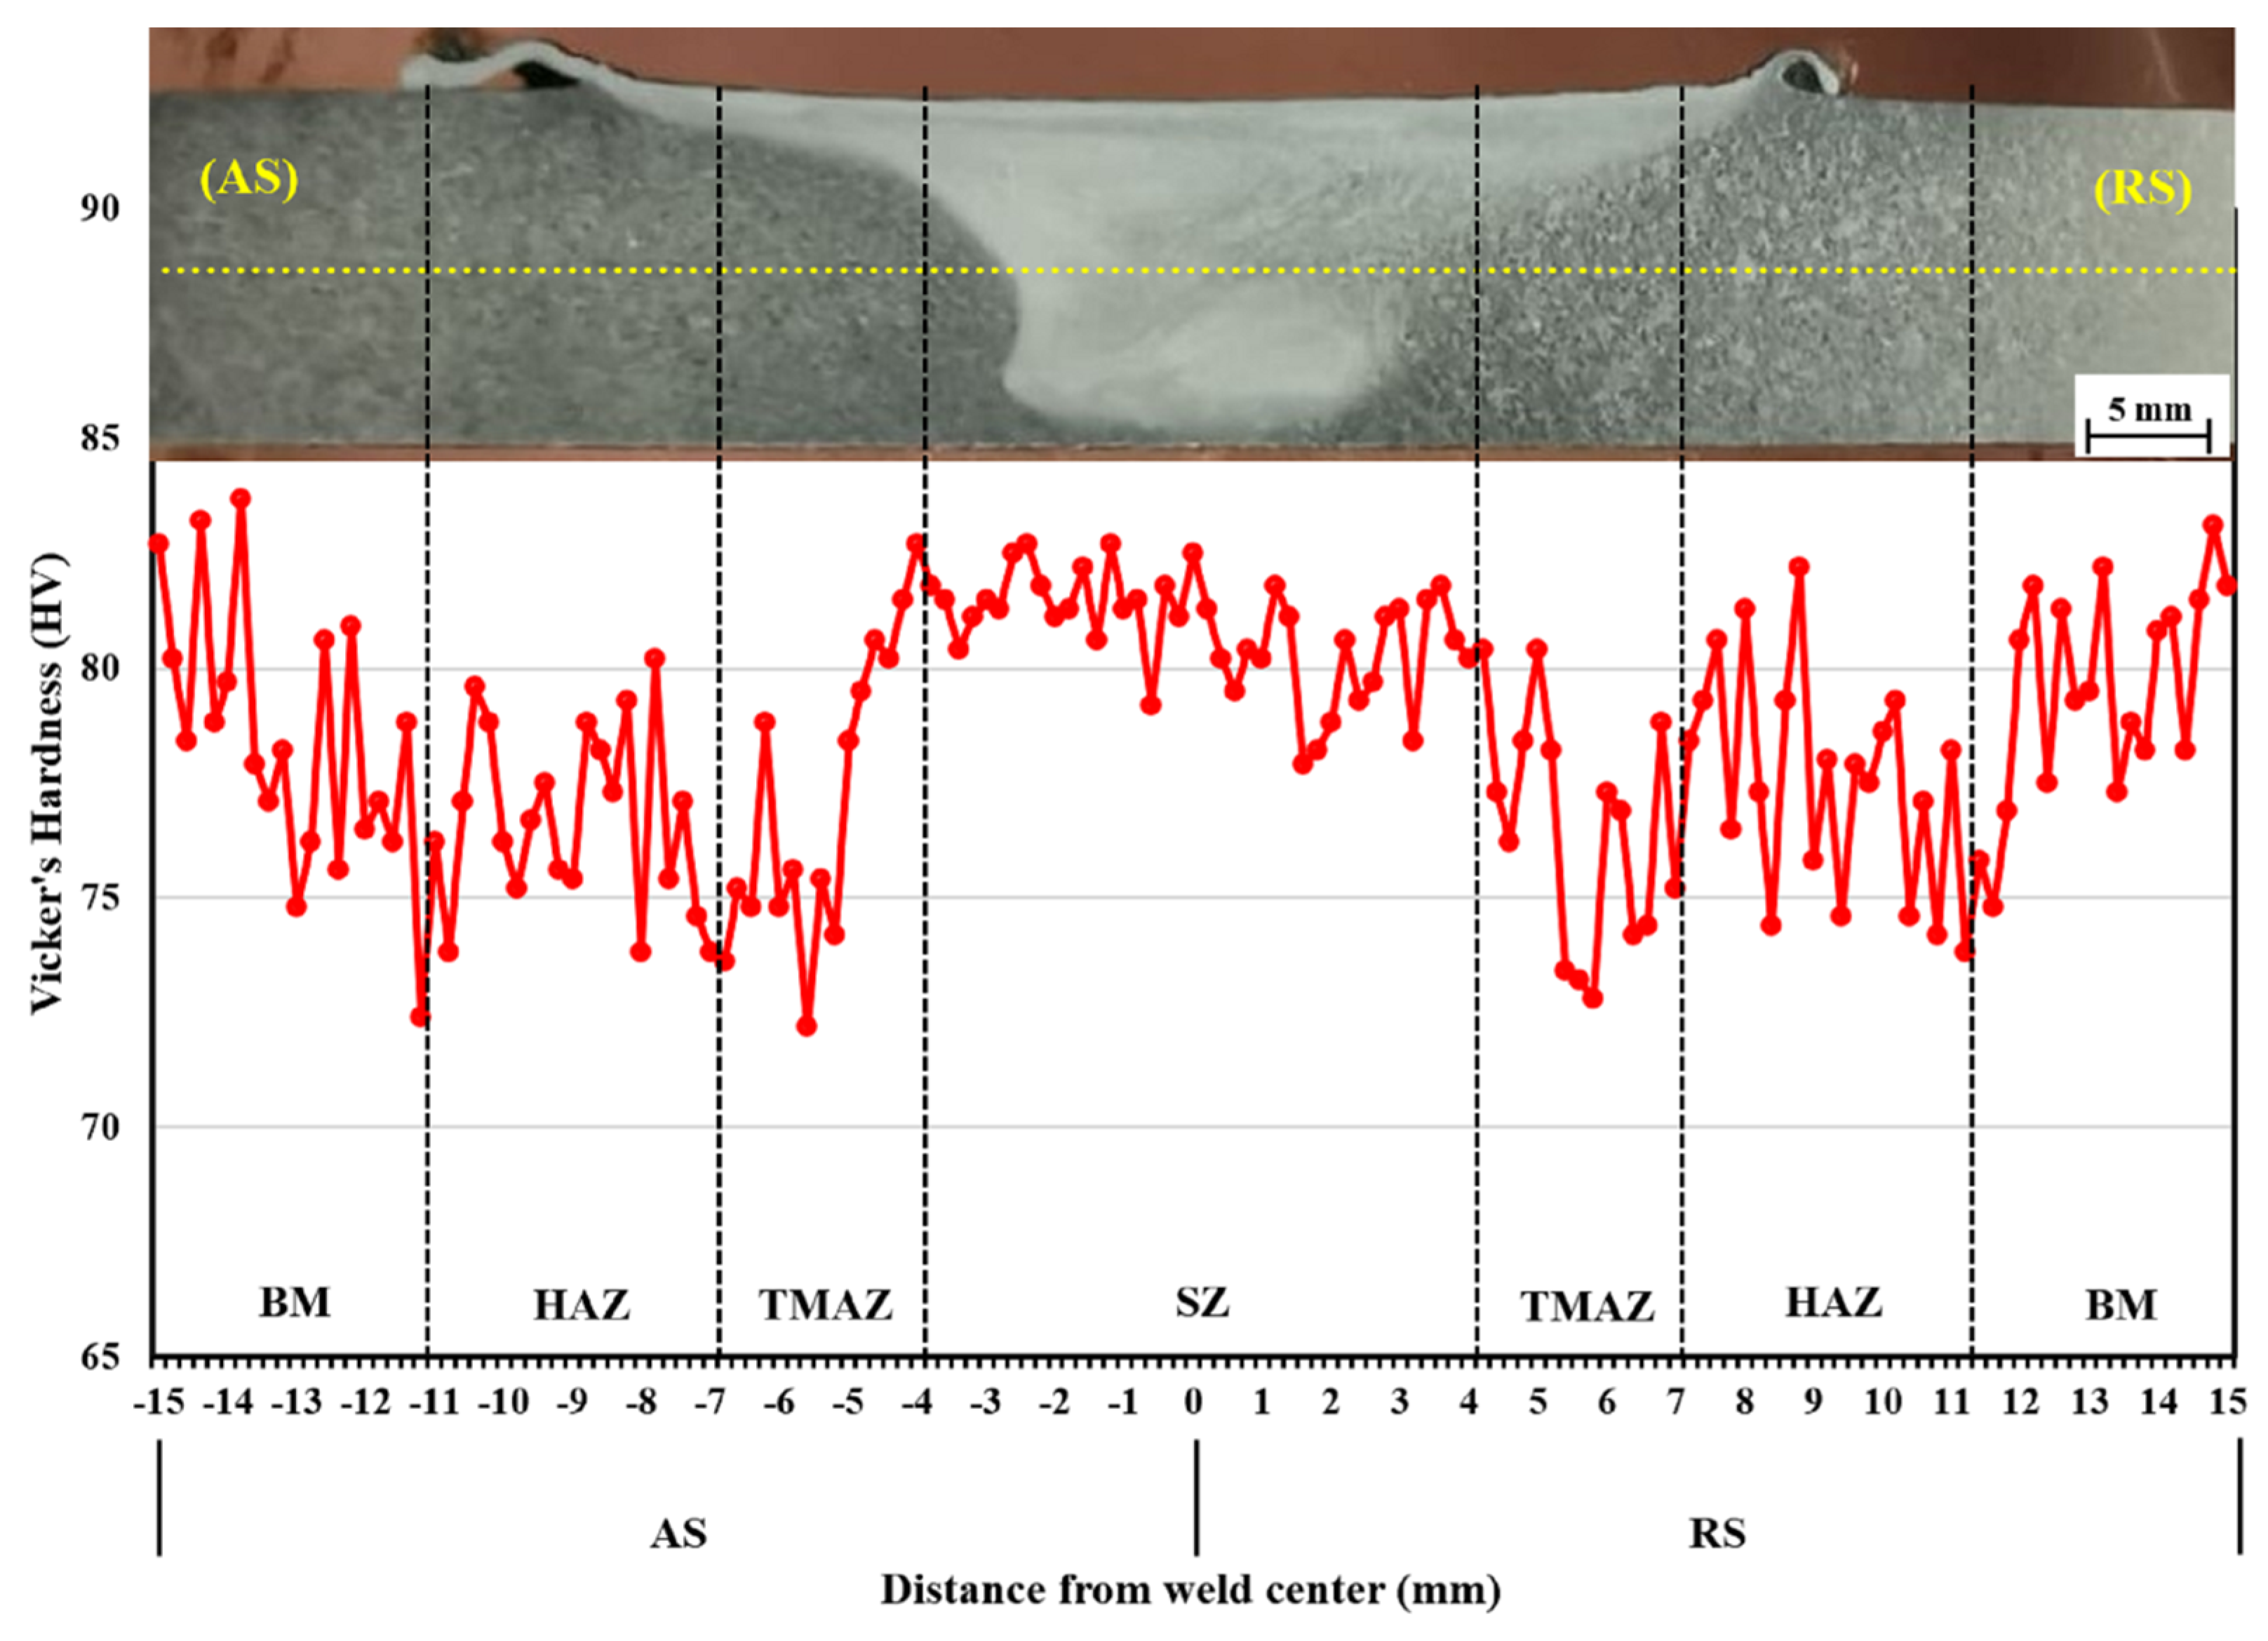
3.6. Vickers Hardness Analysis
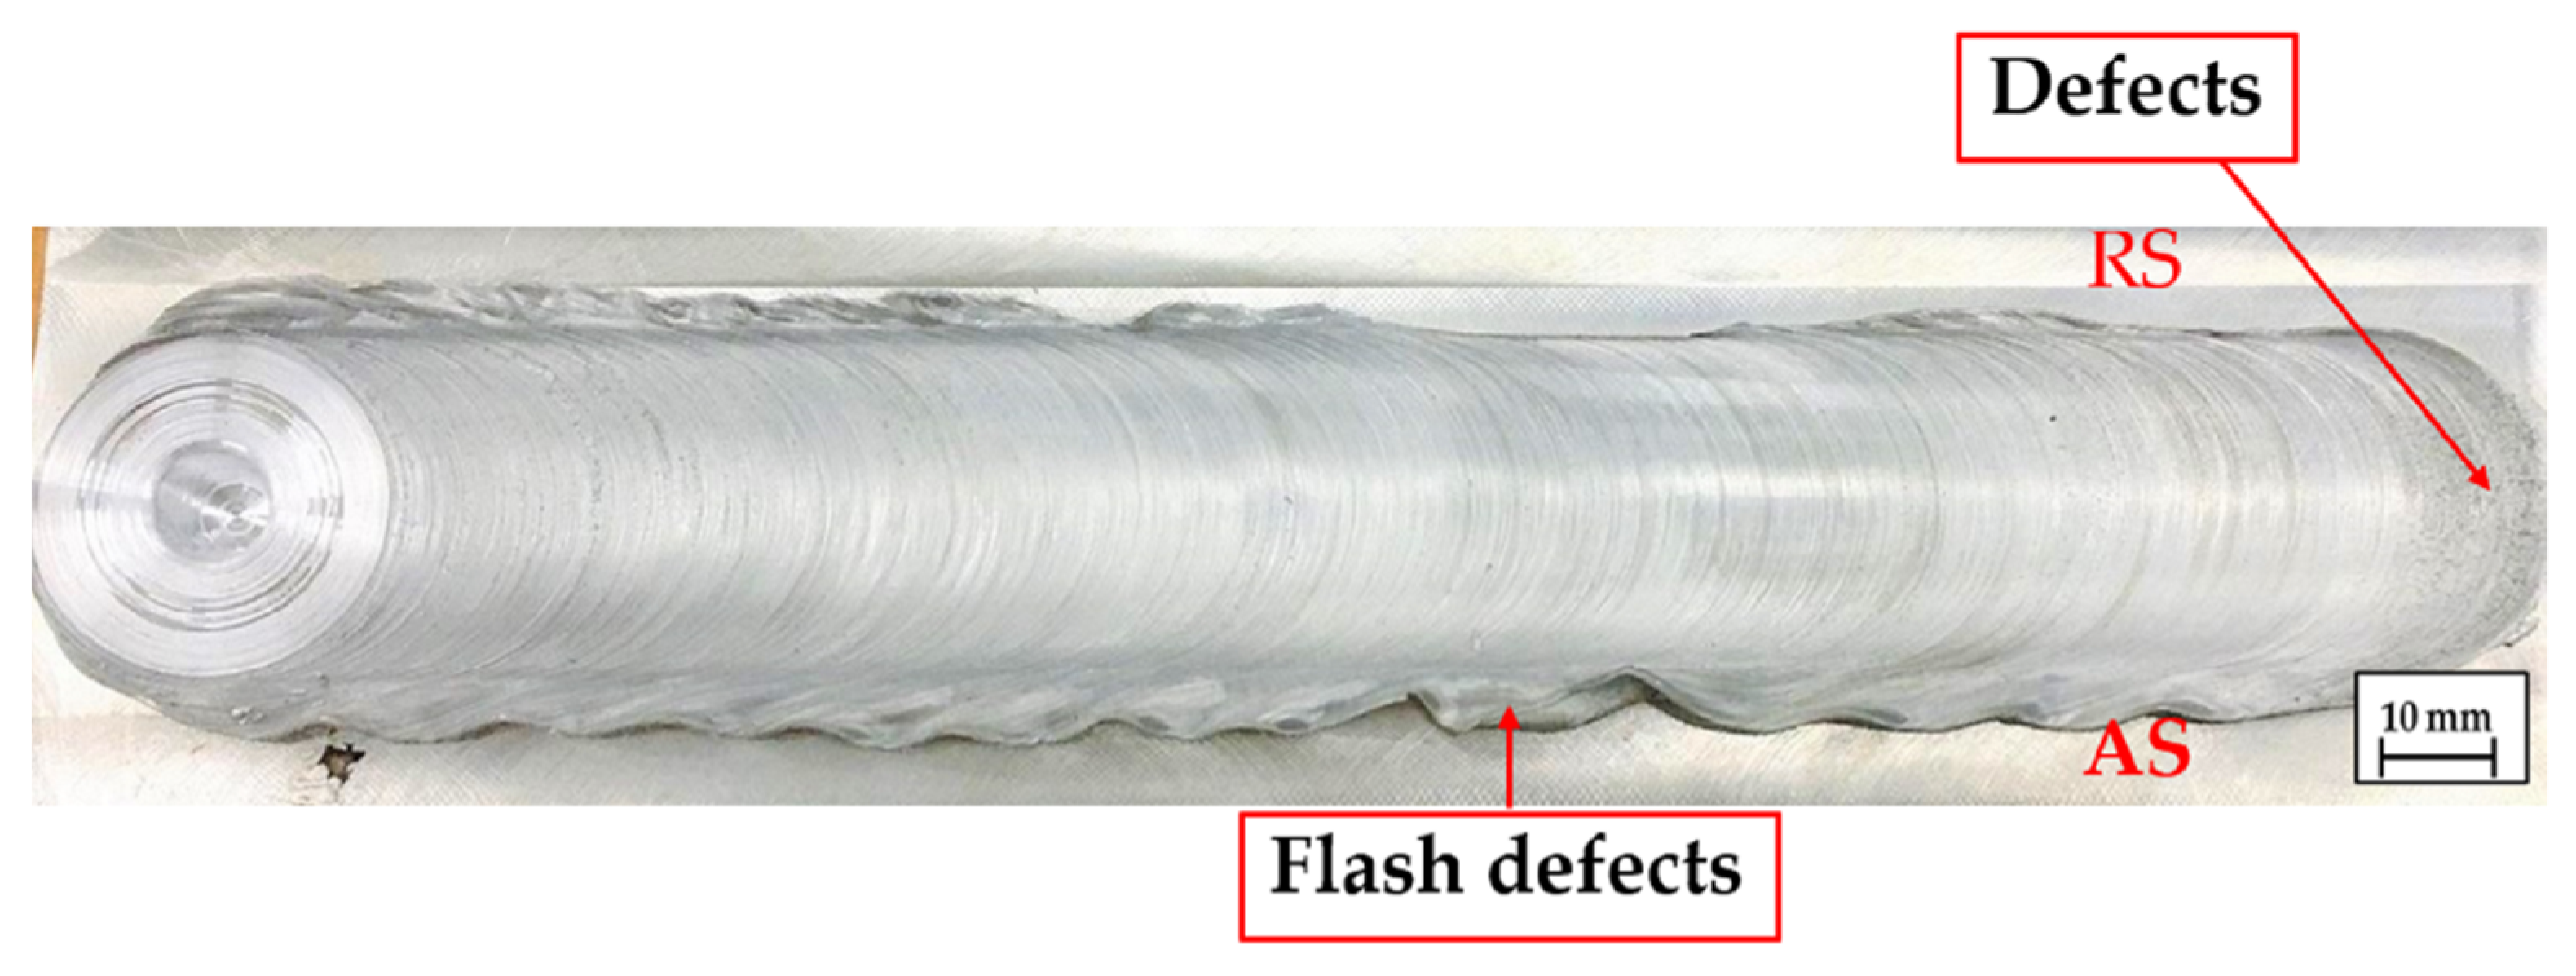
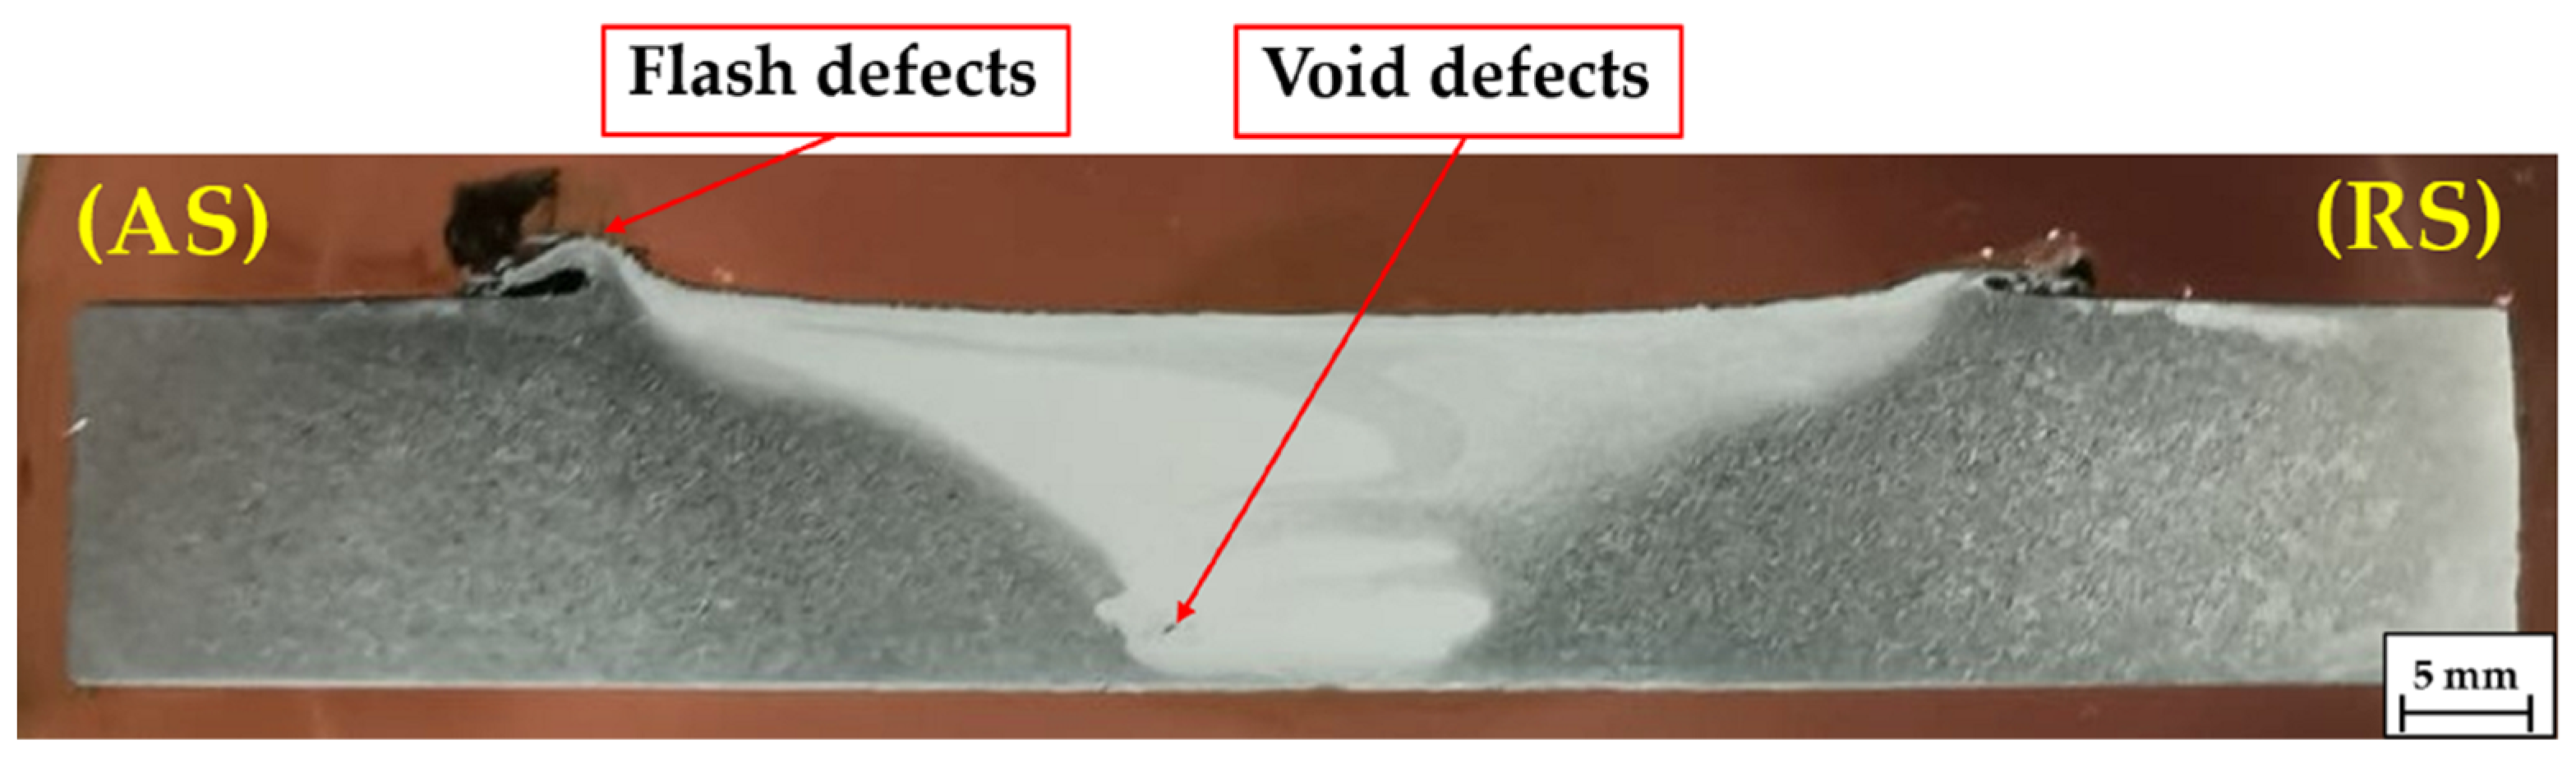
3.7. Macrostructural Examination
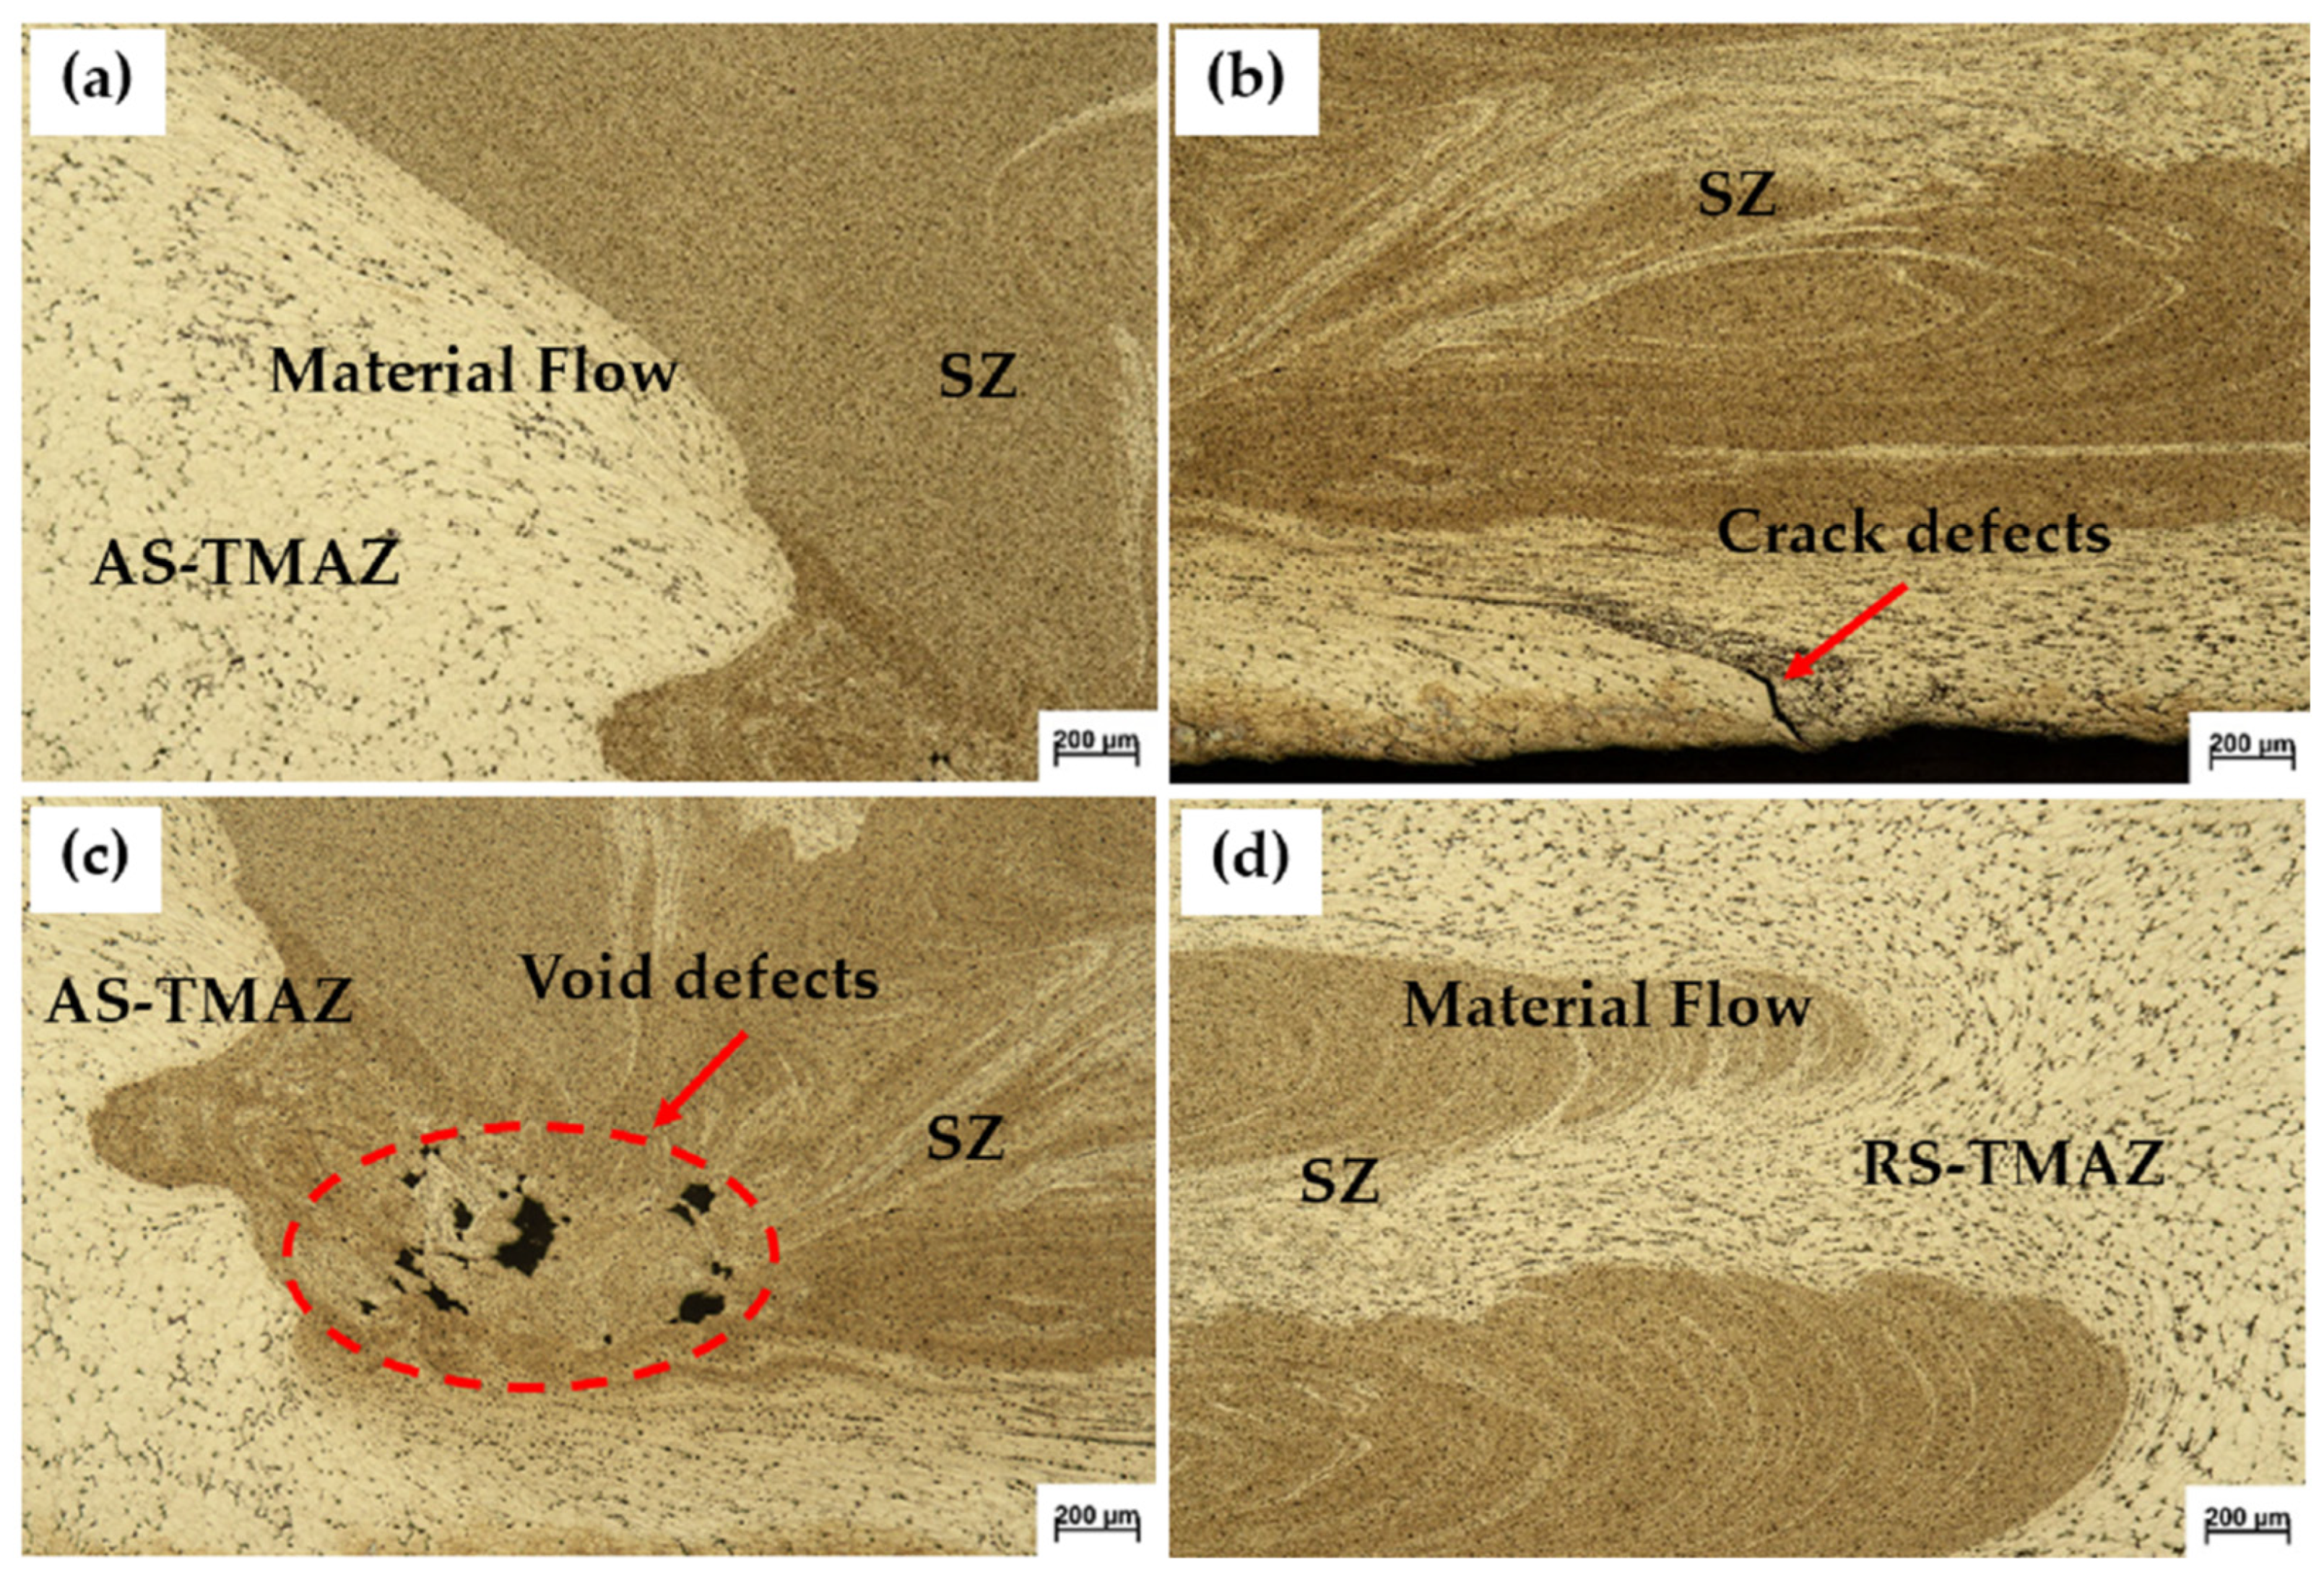
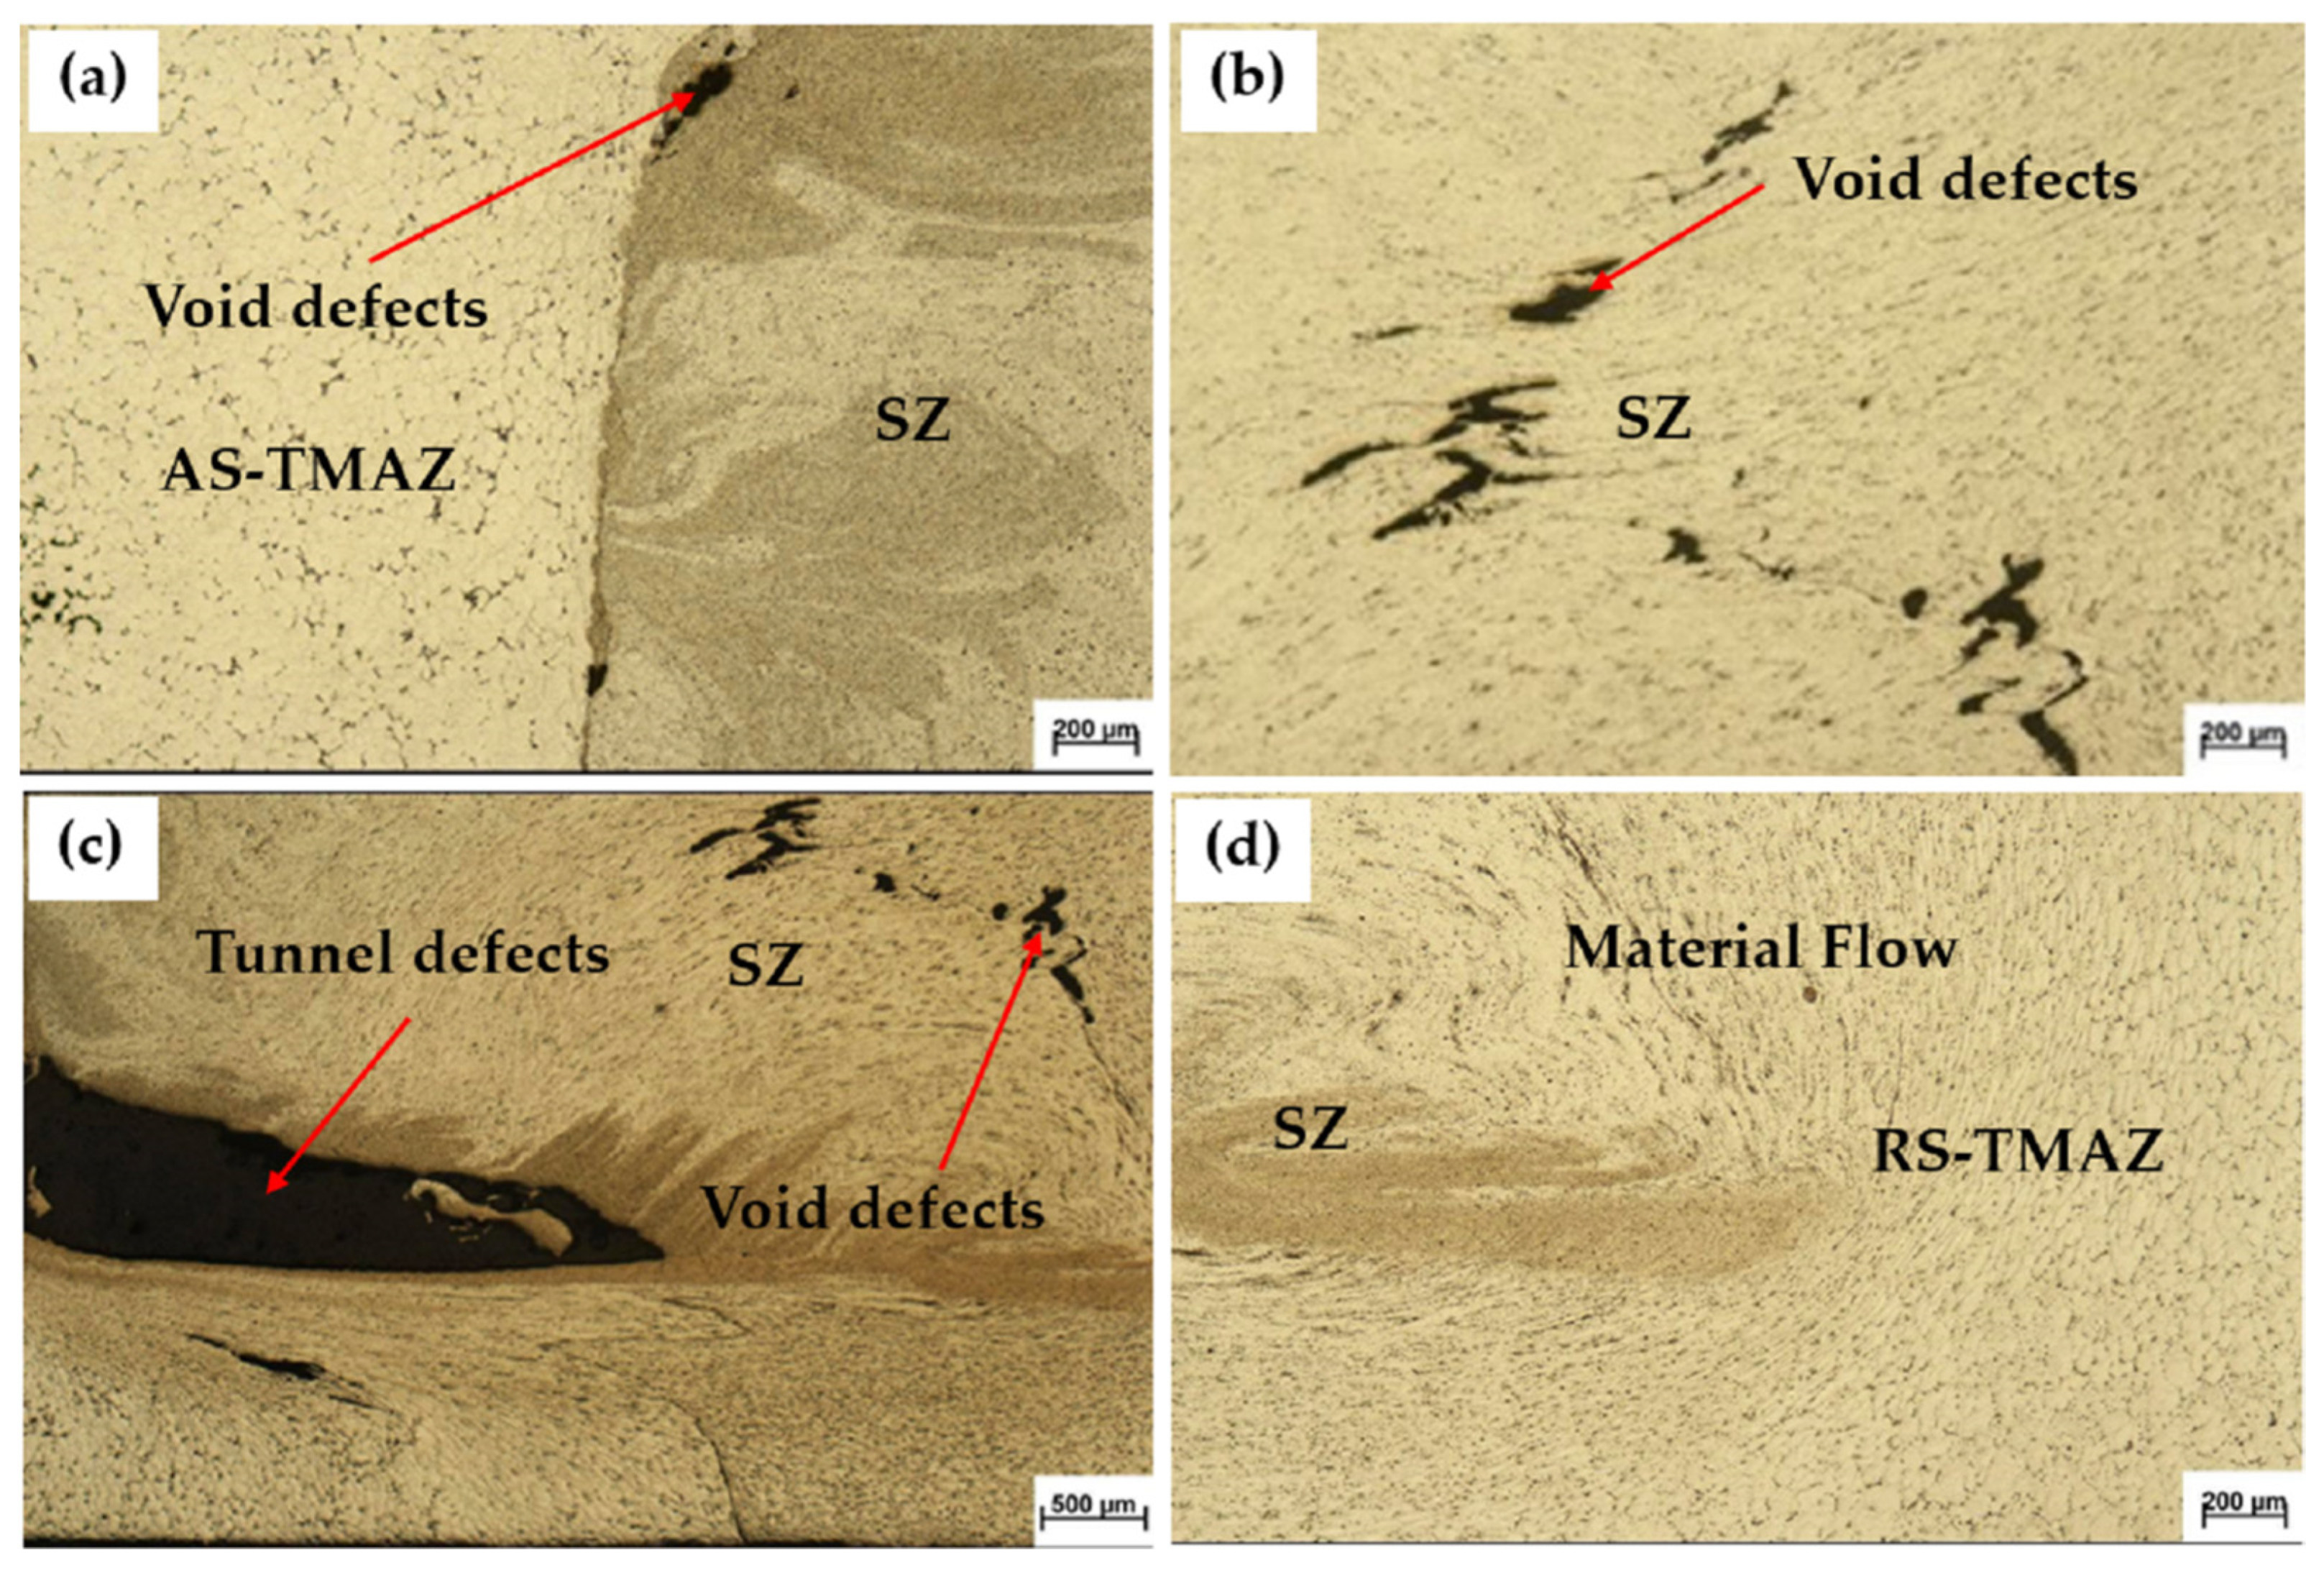
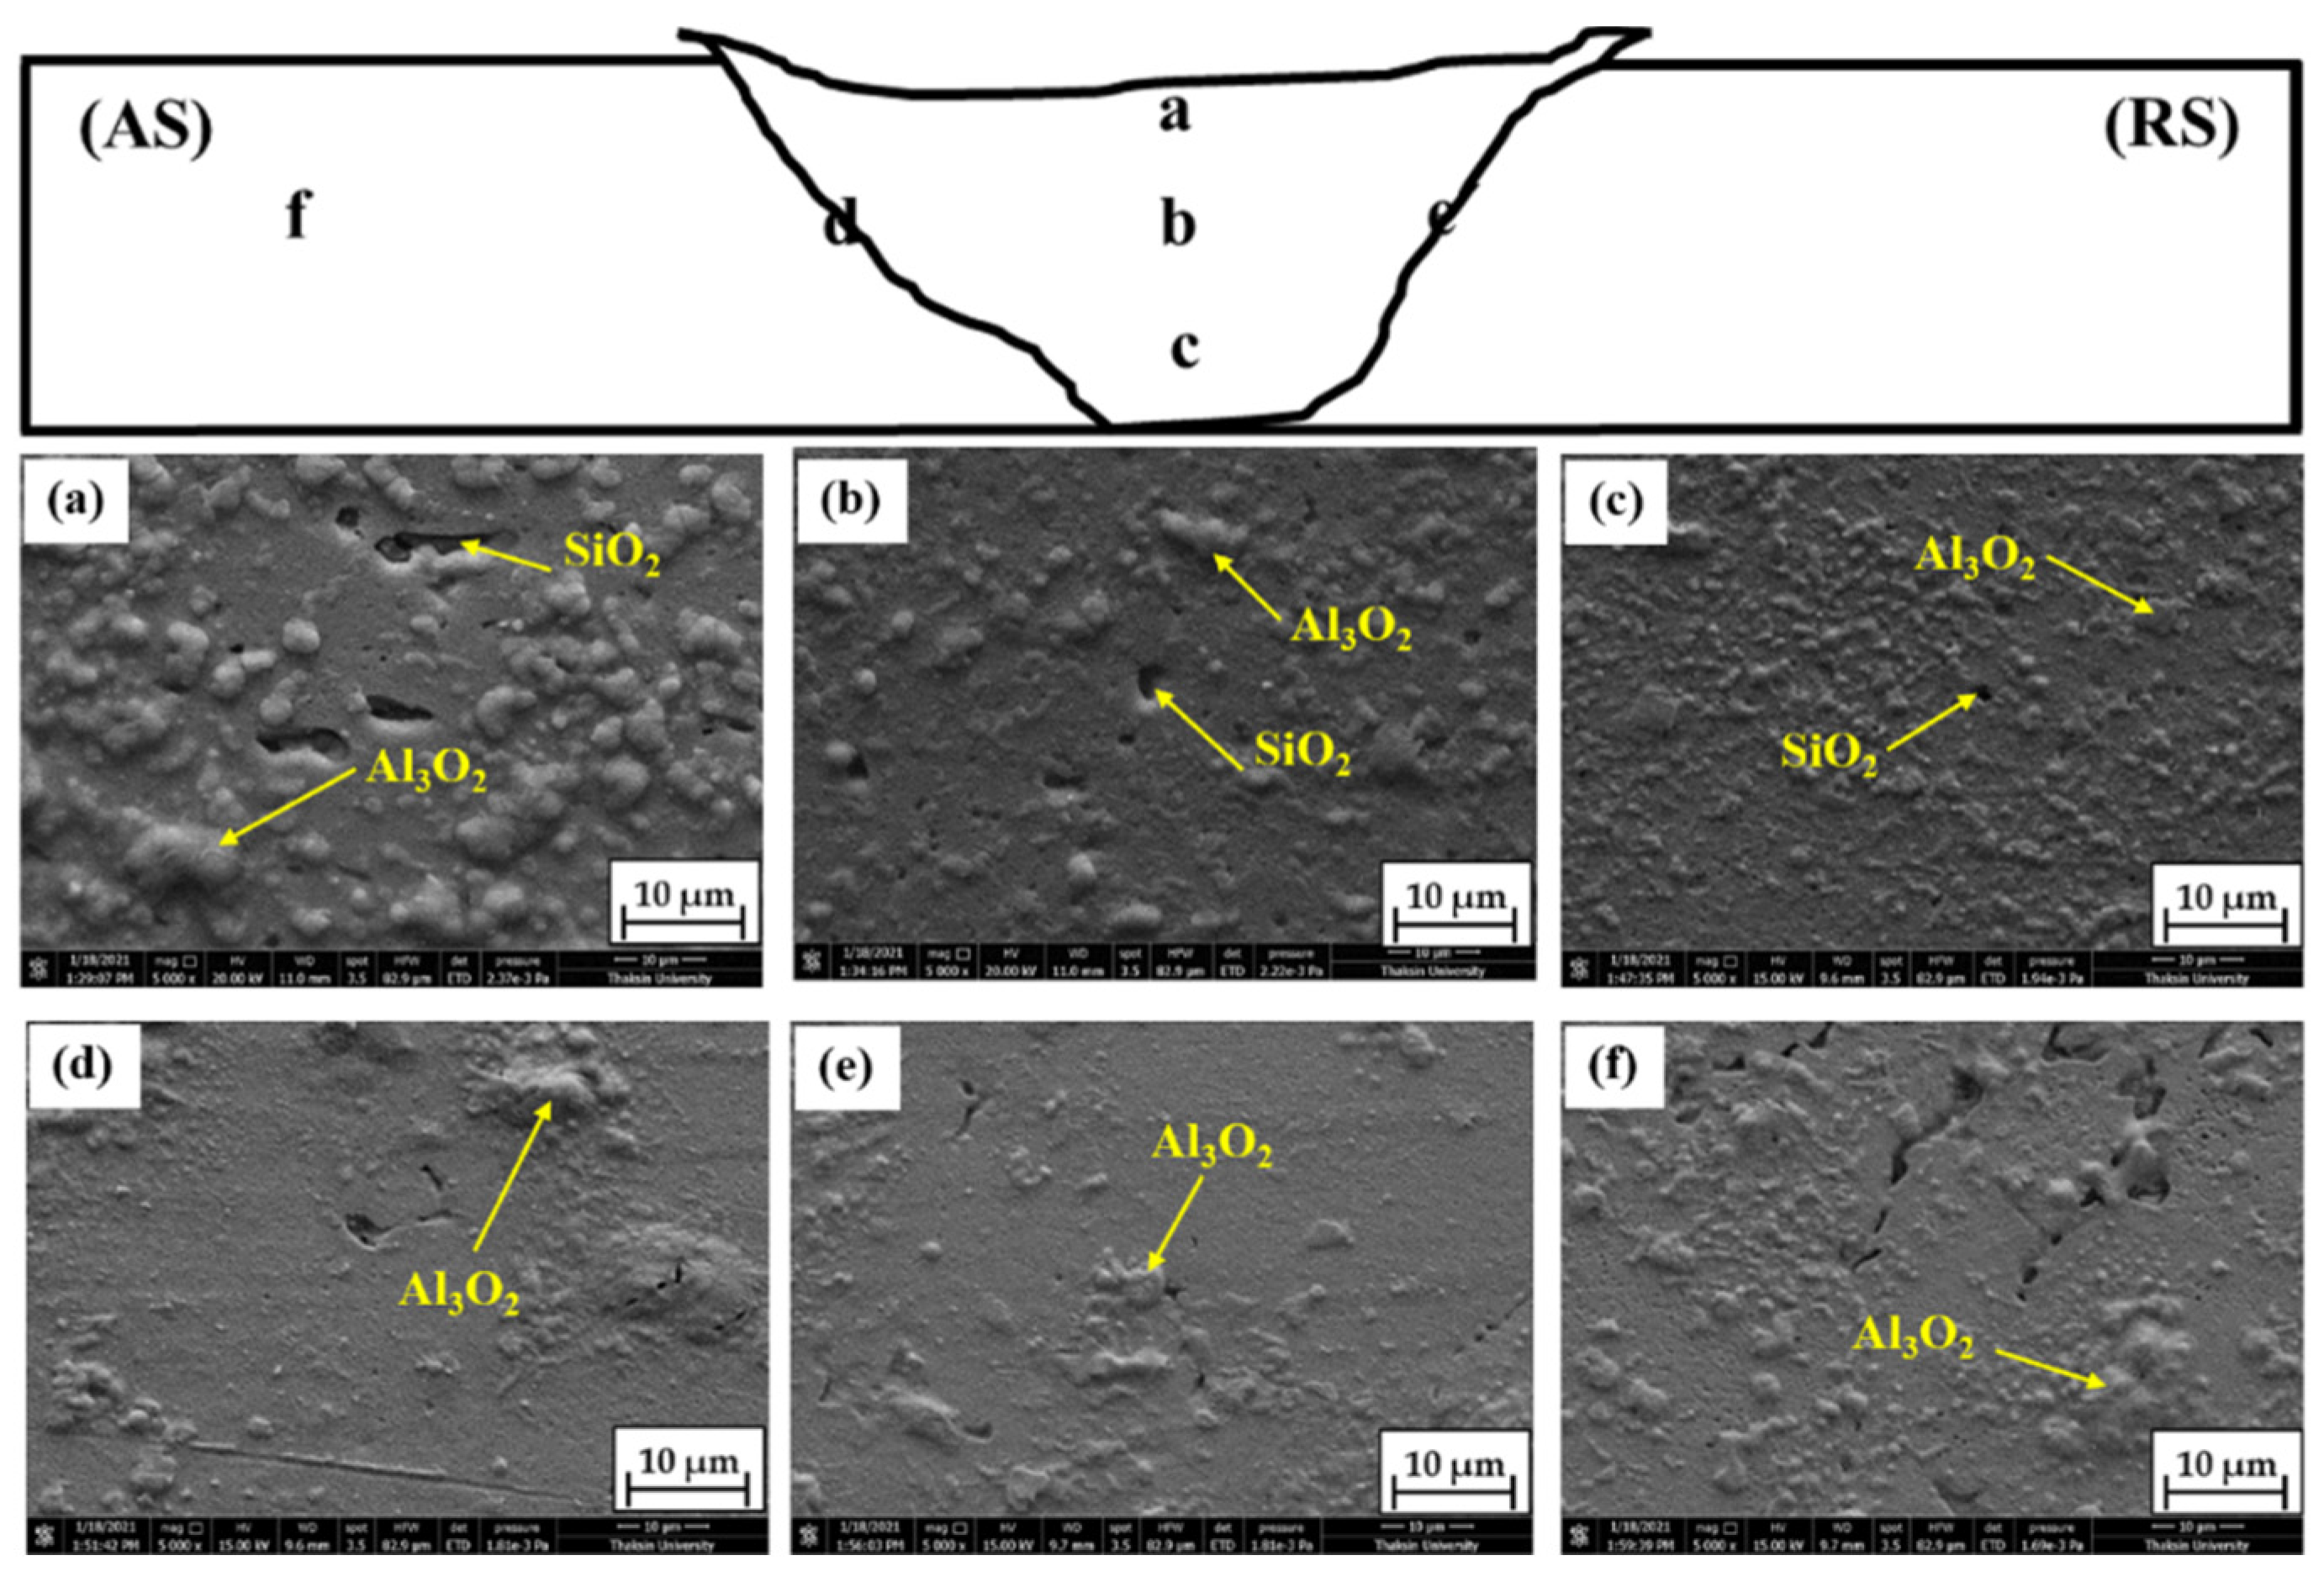
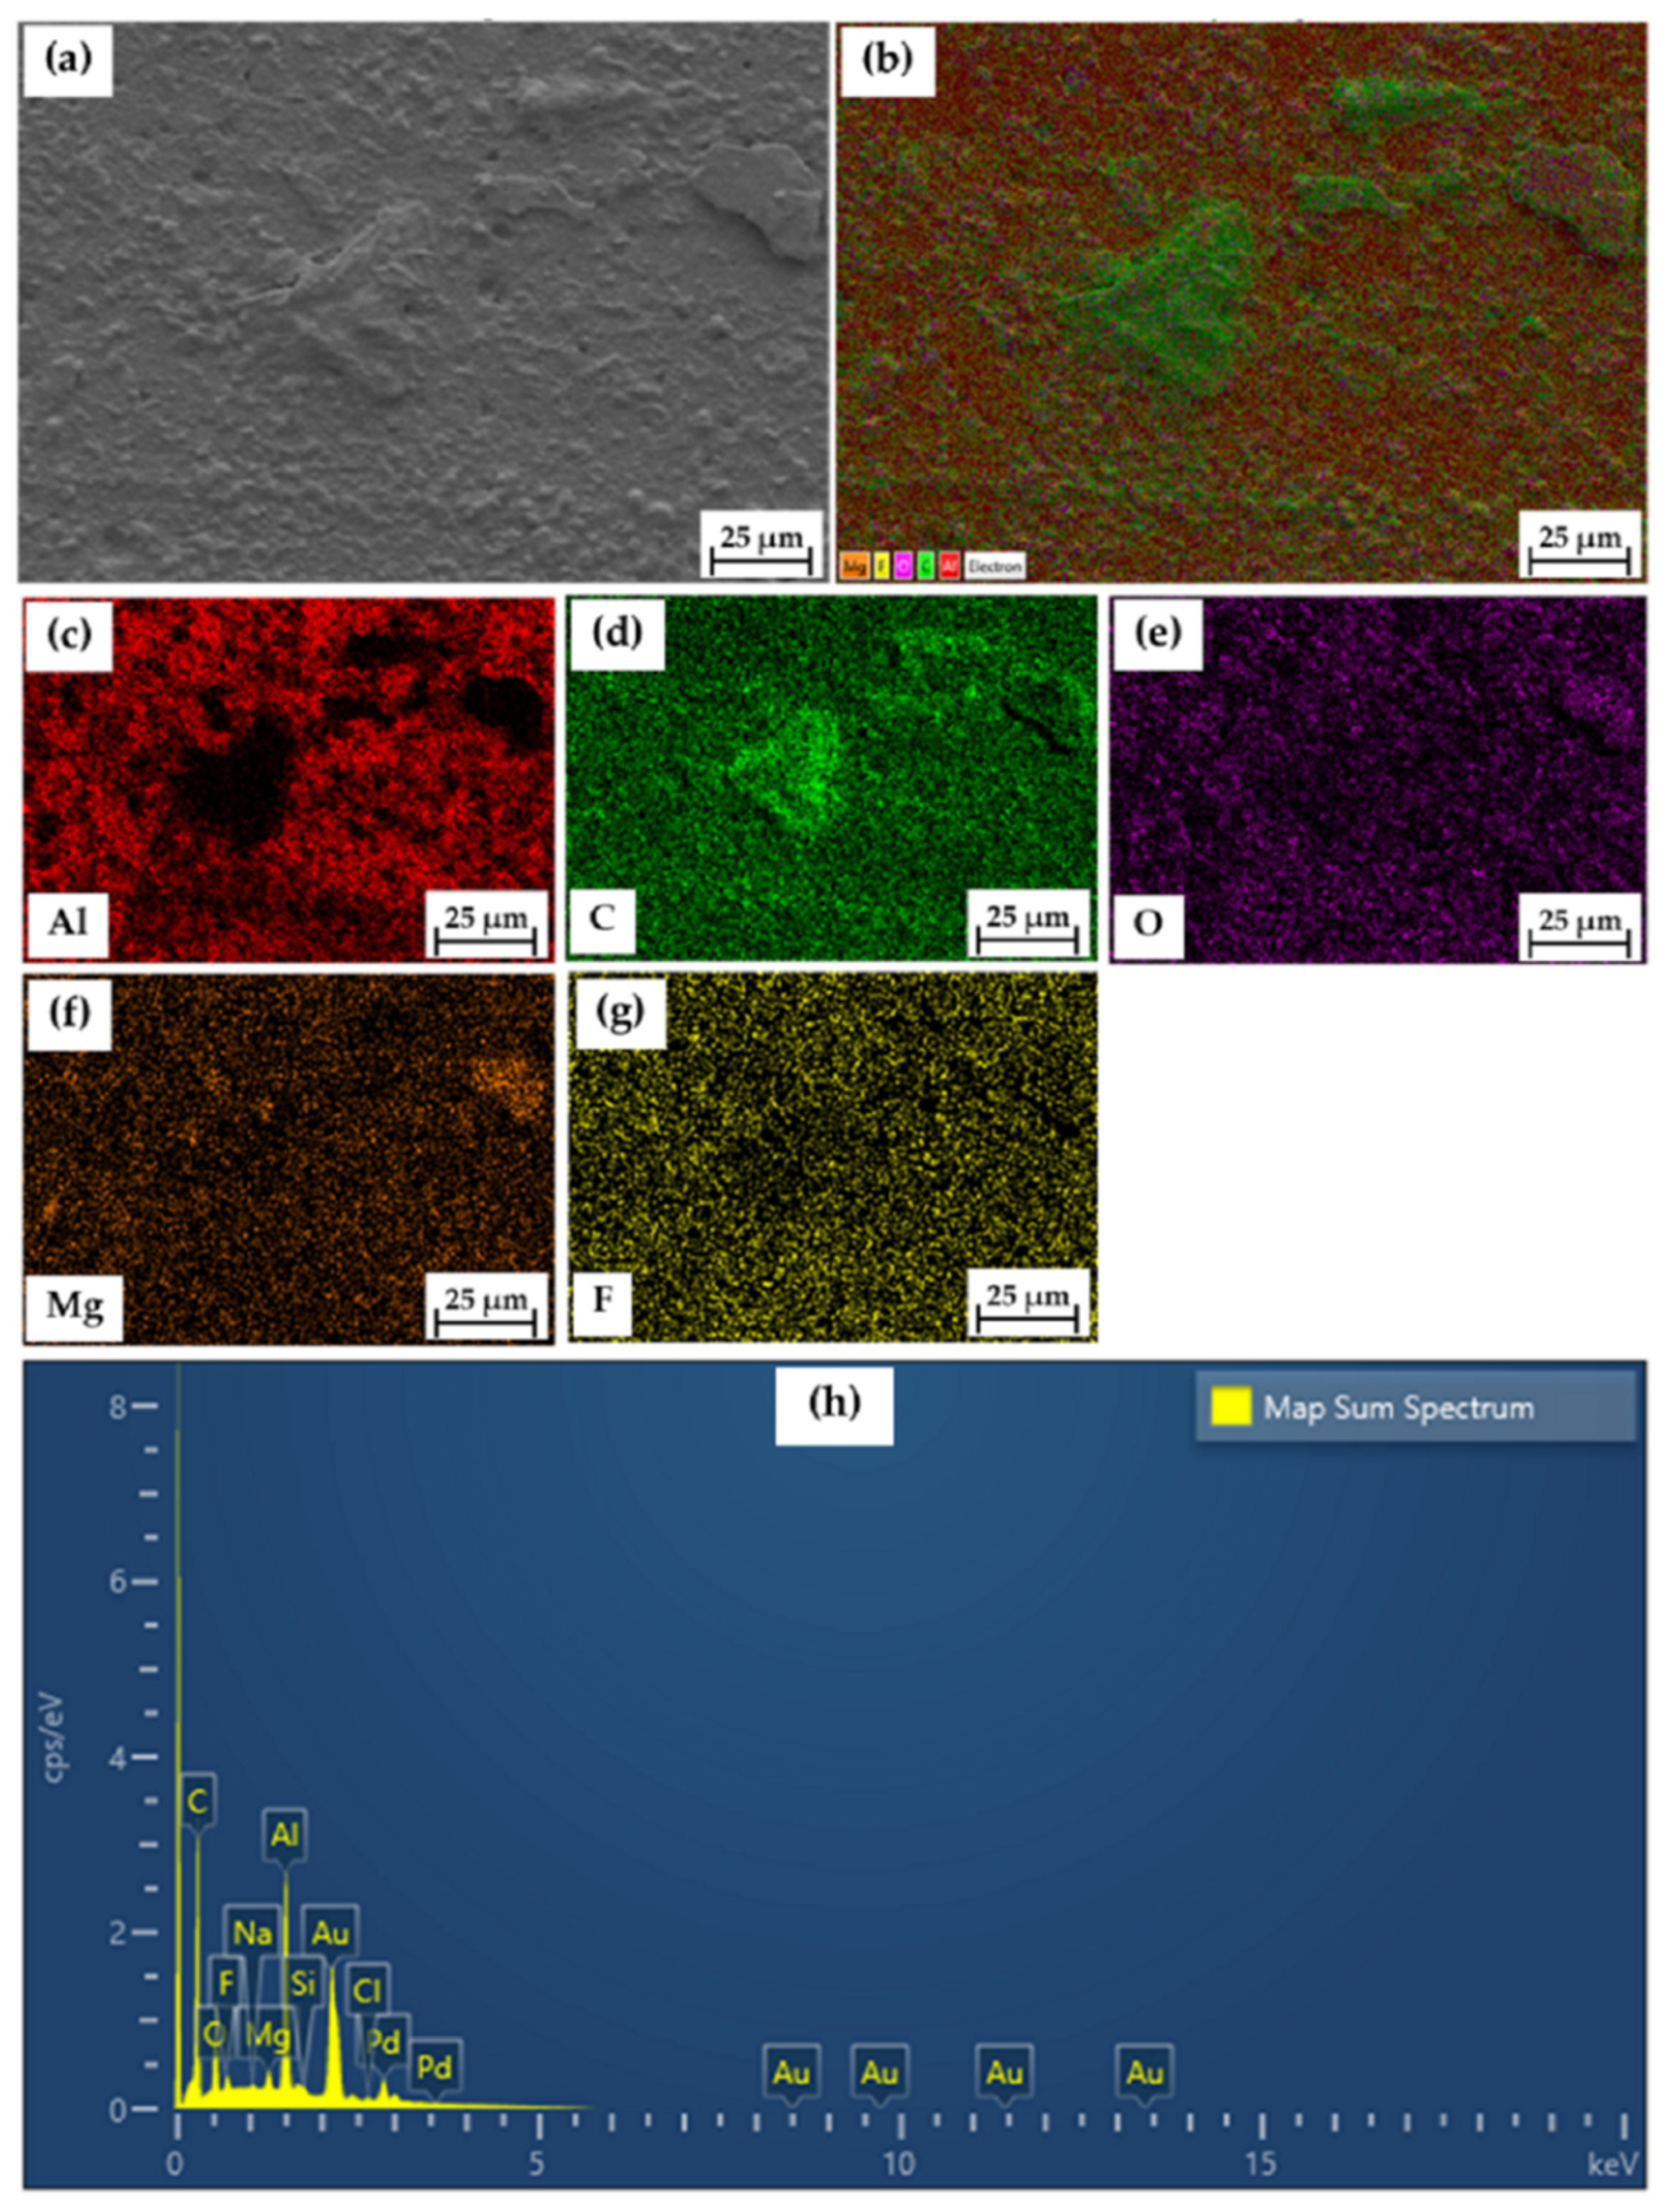
3.8. Microstructural Examination
4. Conclusions
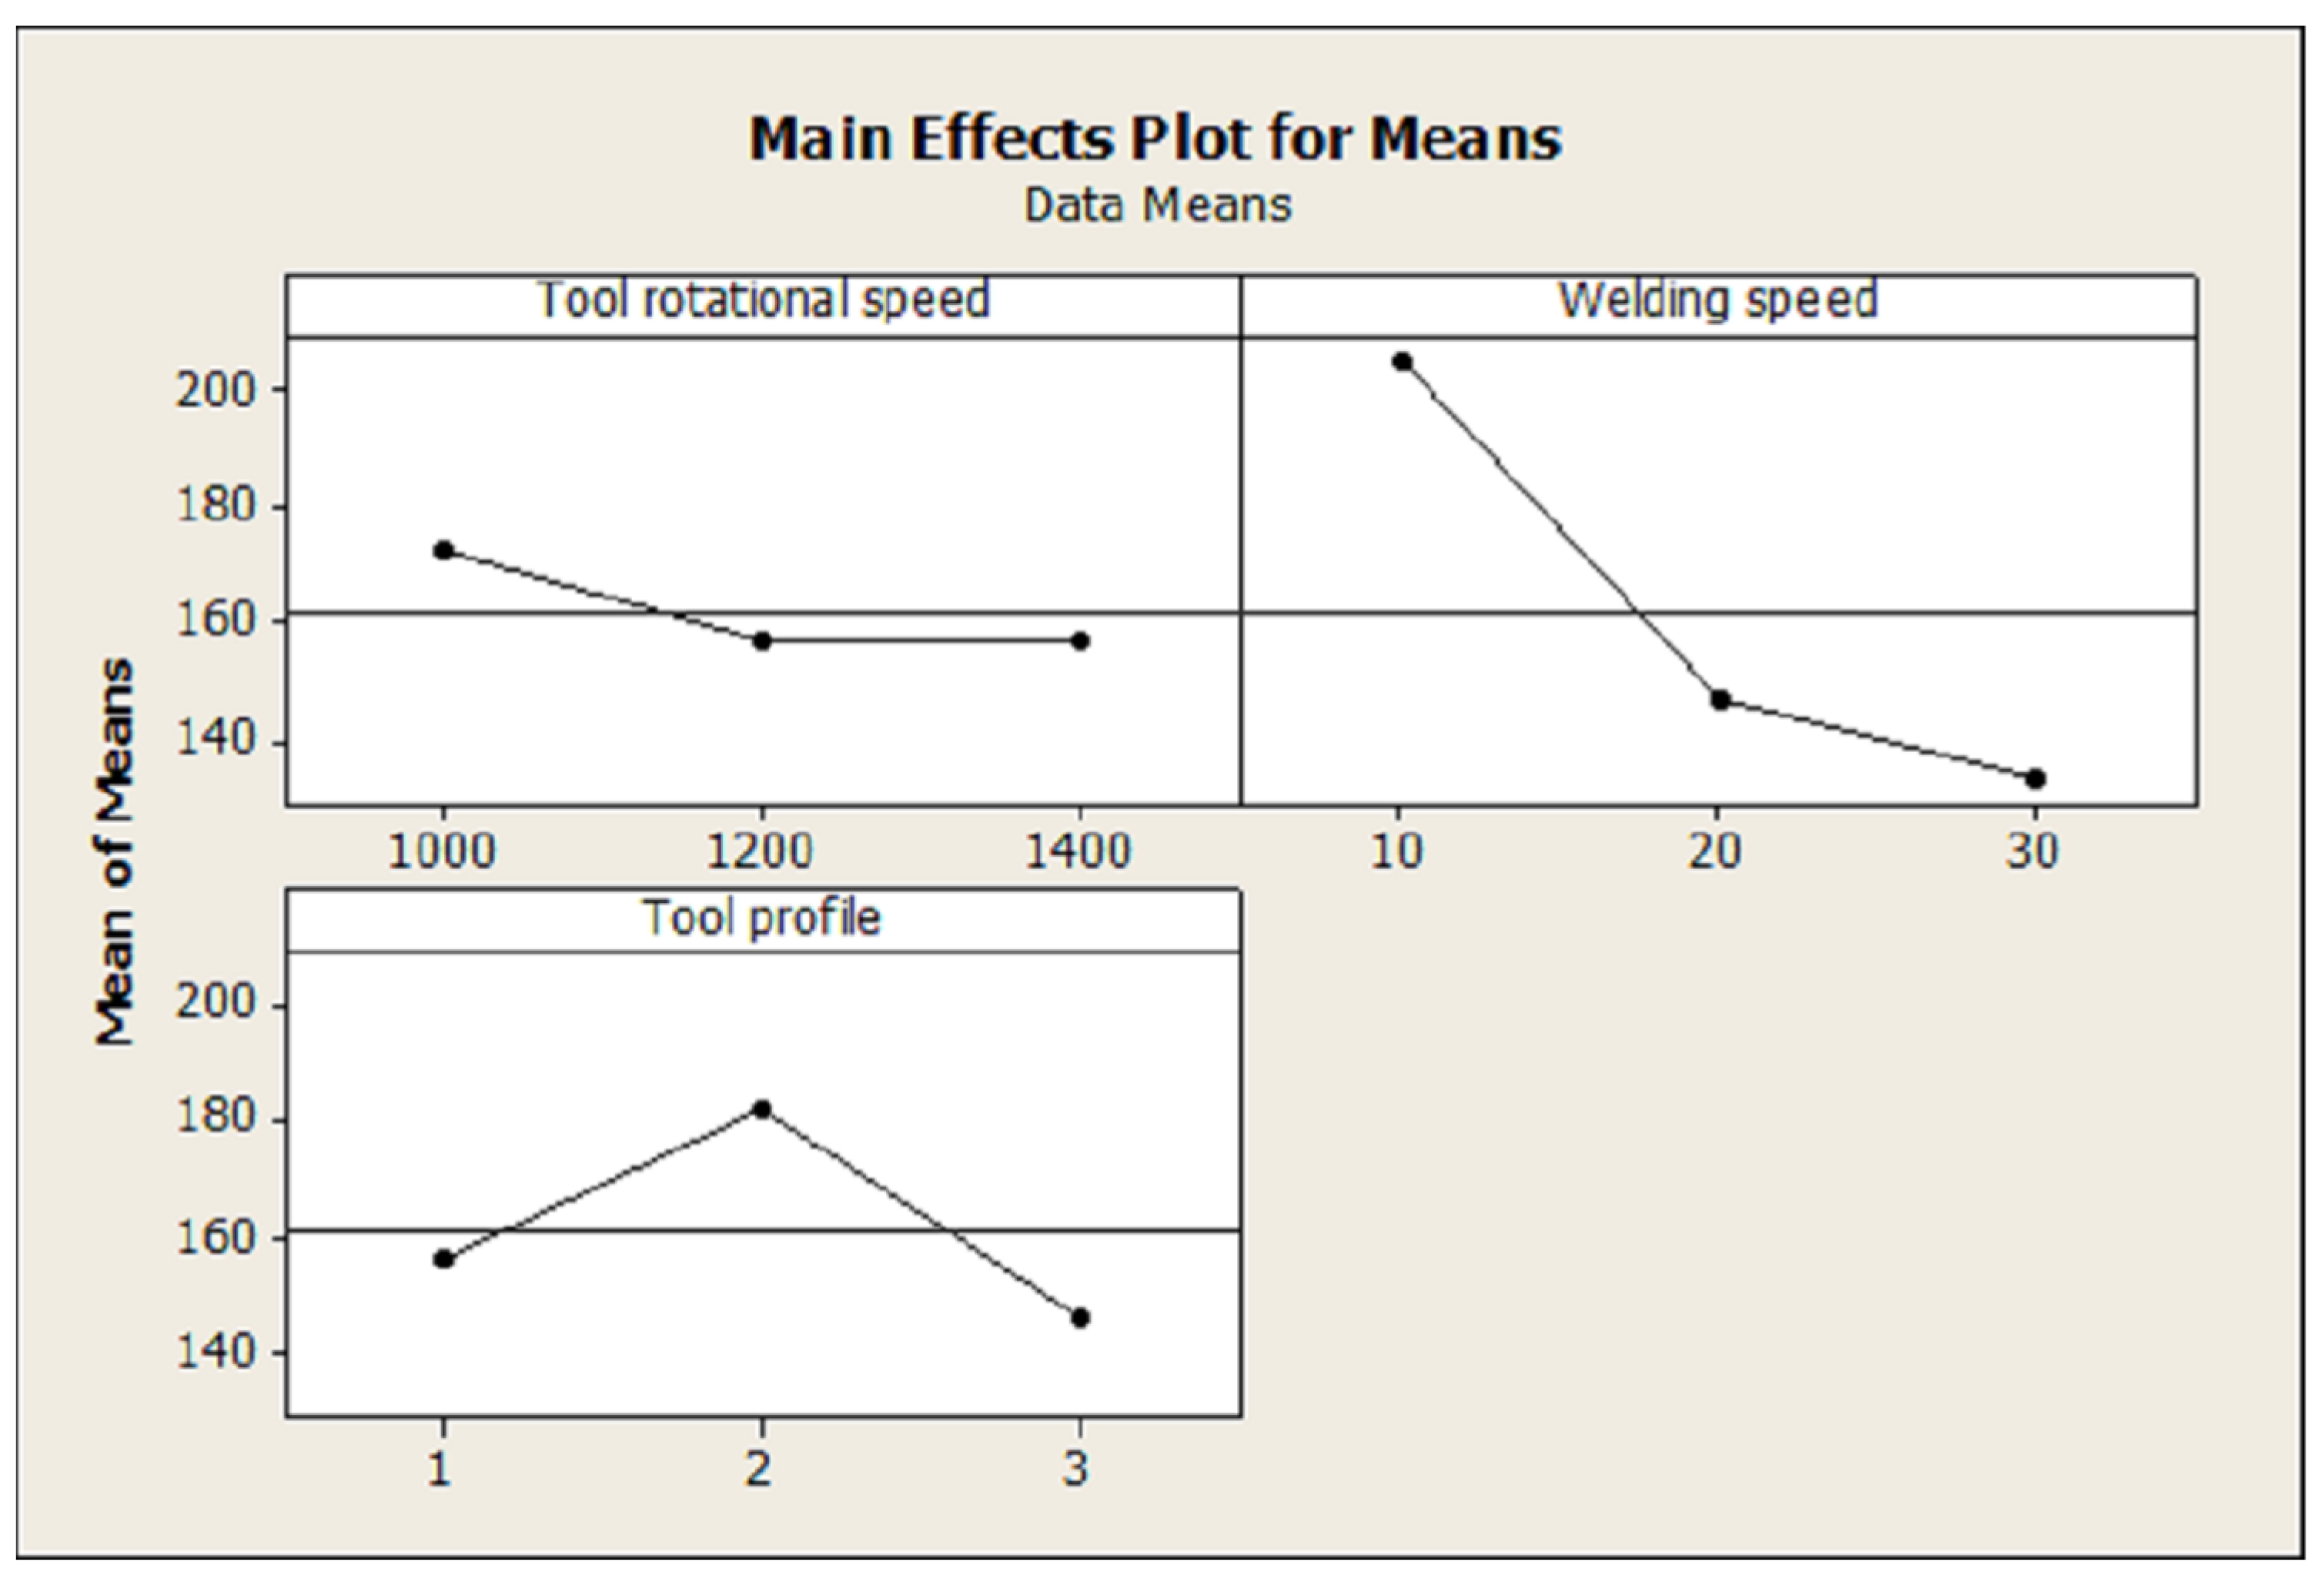
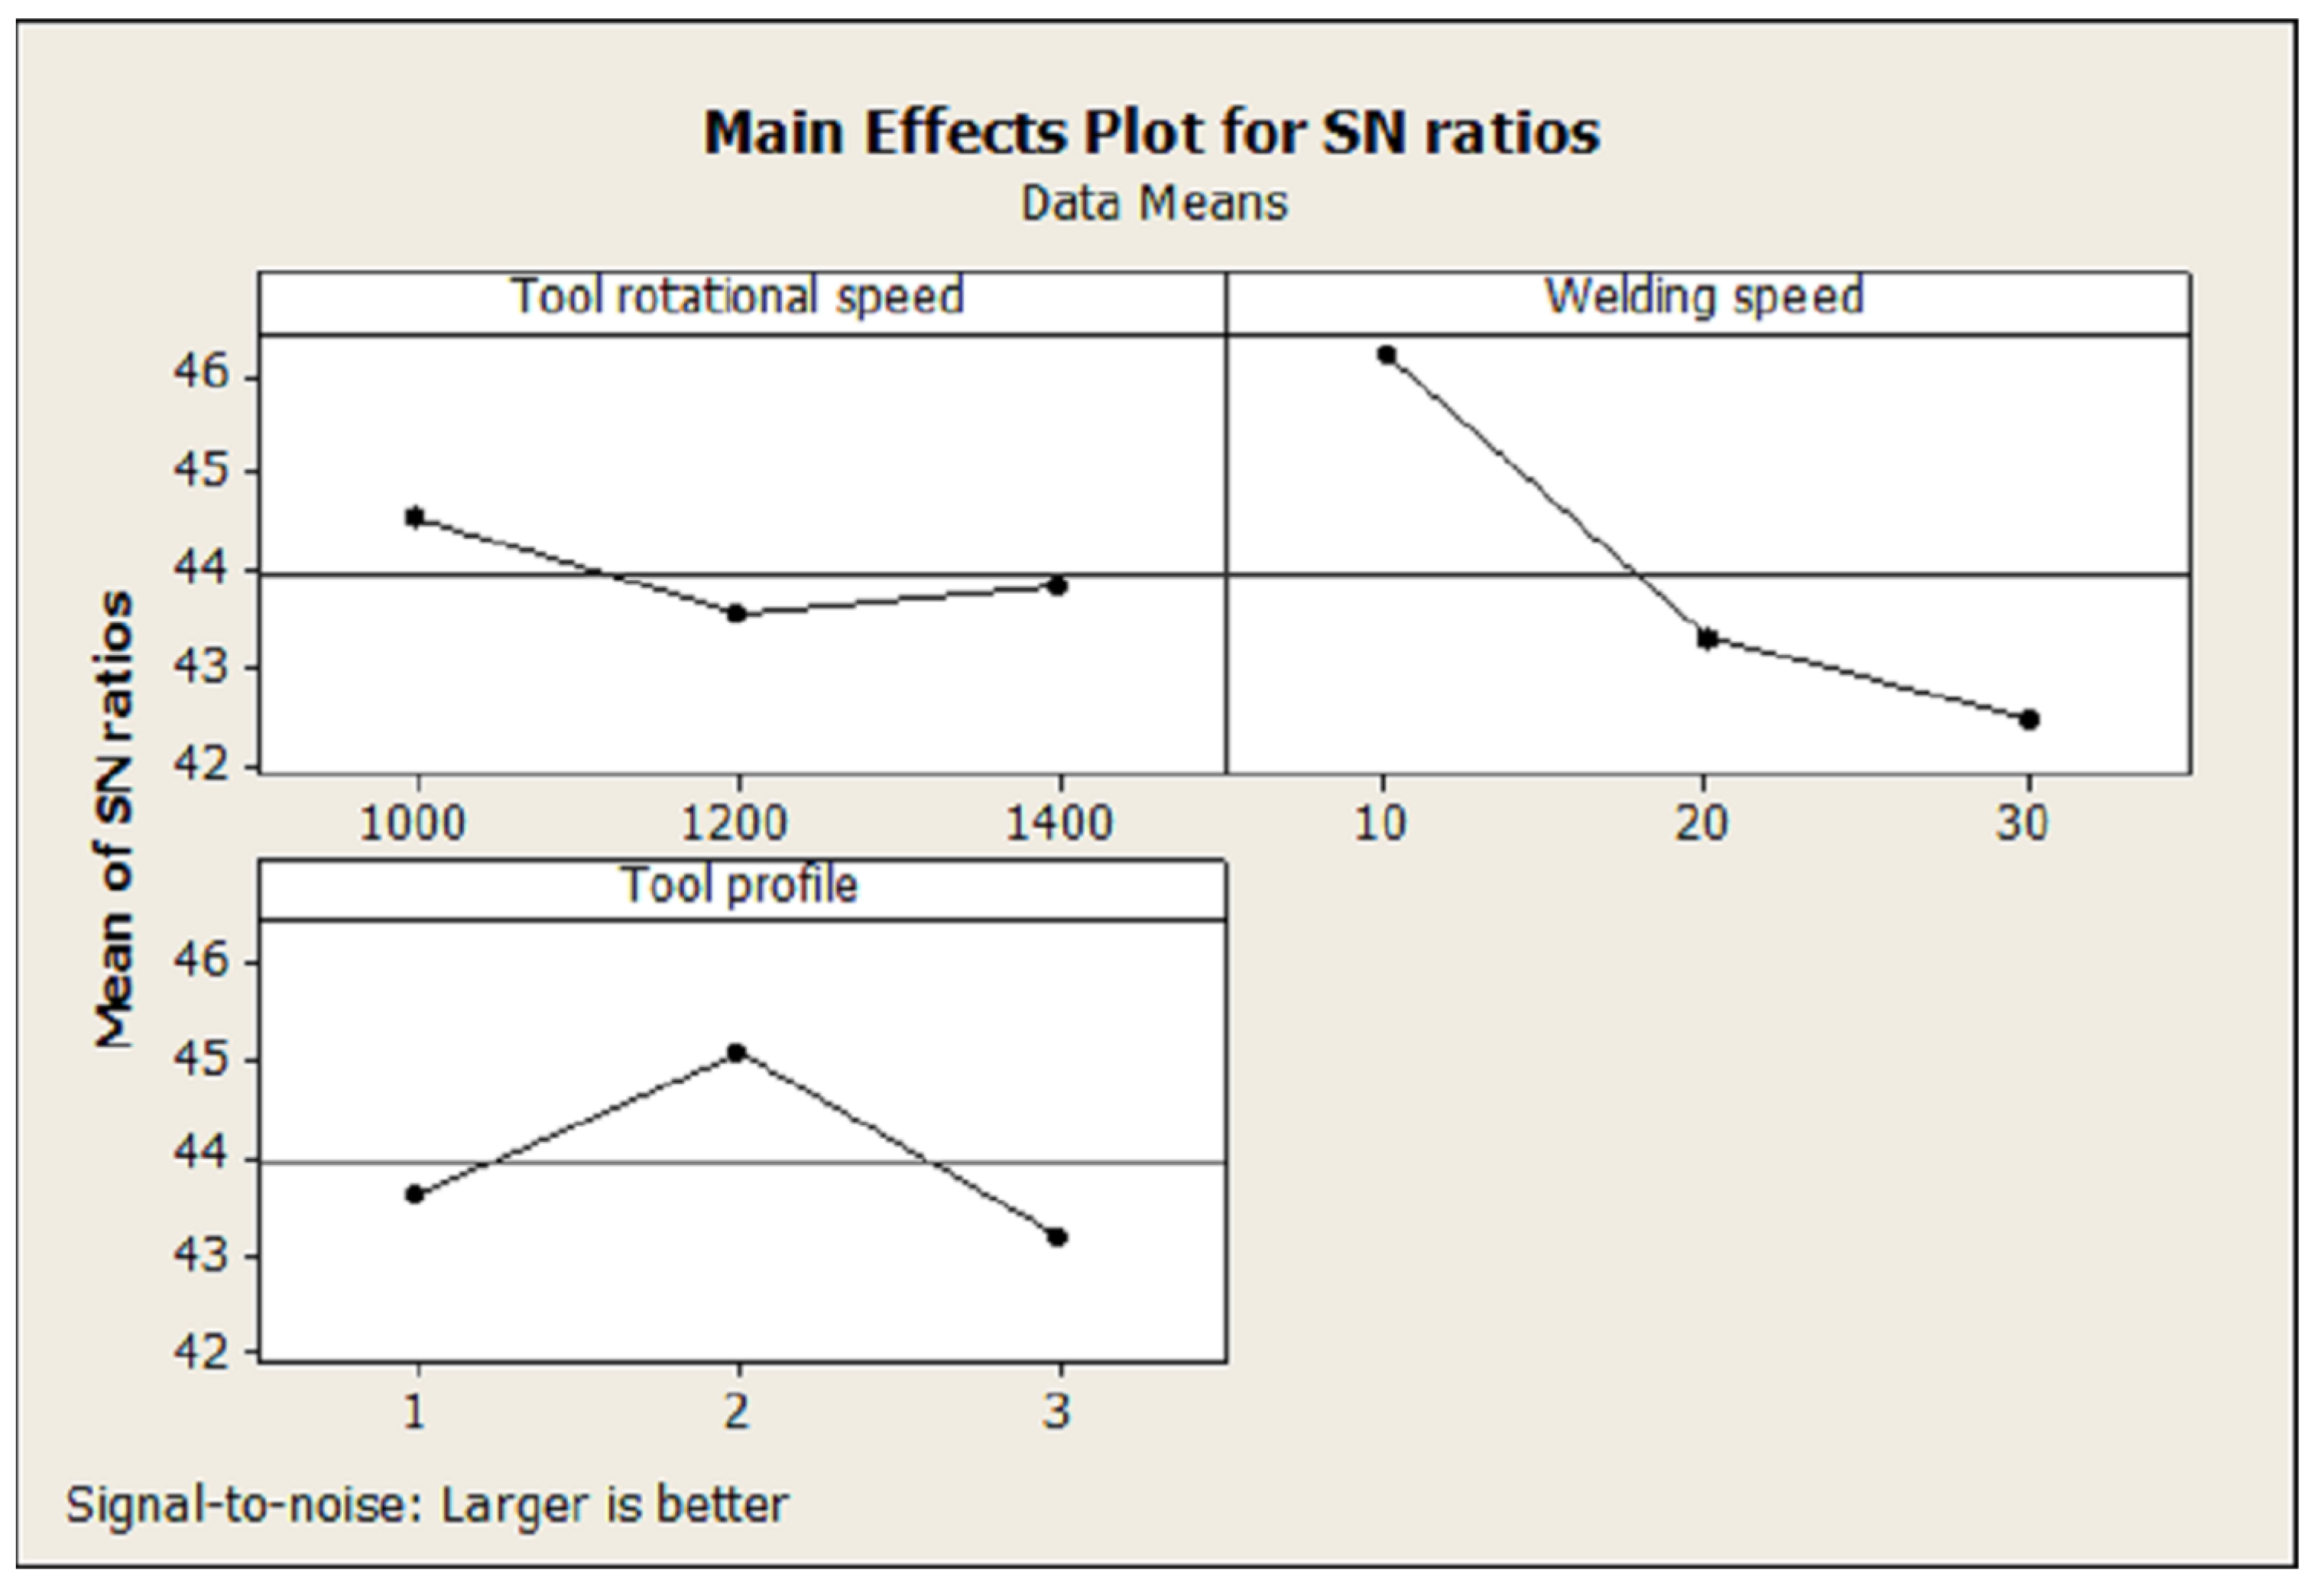
- The optimal FSW process parameters of aluminum alloy SSM 5083 obtained from the tensile strength and the S/N ratio were A1B1C2, i.e., a rotational speed of 1000 rpm, a welding speed of 10 mm/min, and a threaded cylindrical tool pin profile. The predicted tensile strength was 235.22 MPa, while the confirmational analysis showed the tensile strength to be 236 MPa;
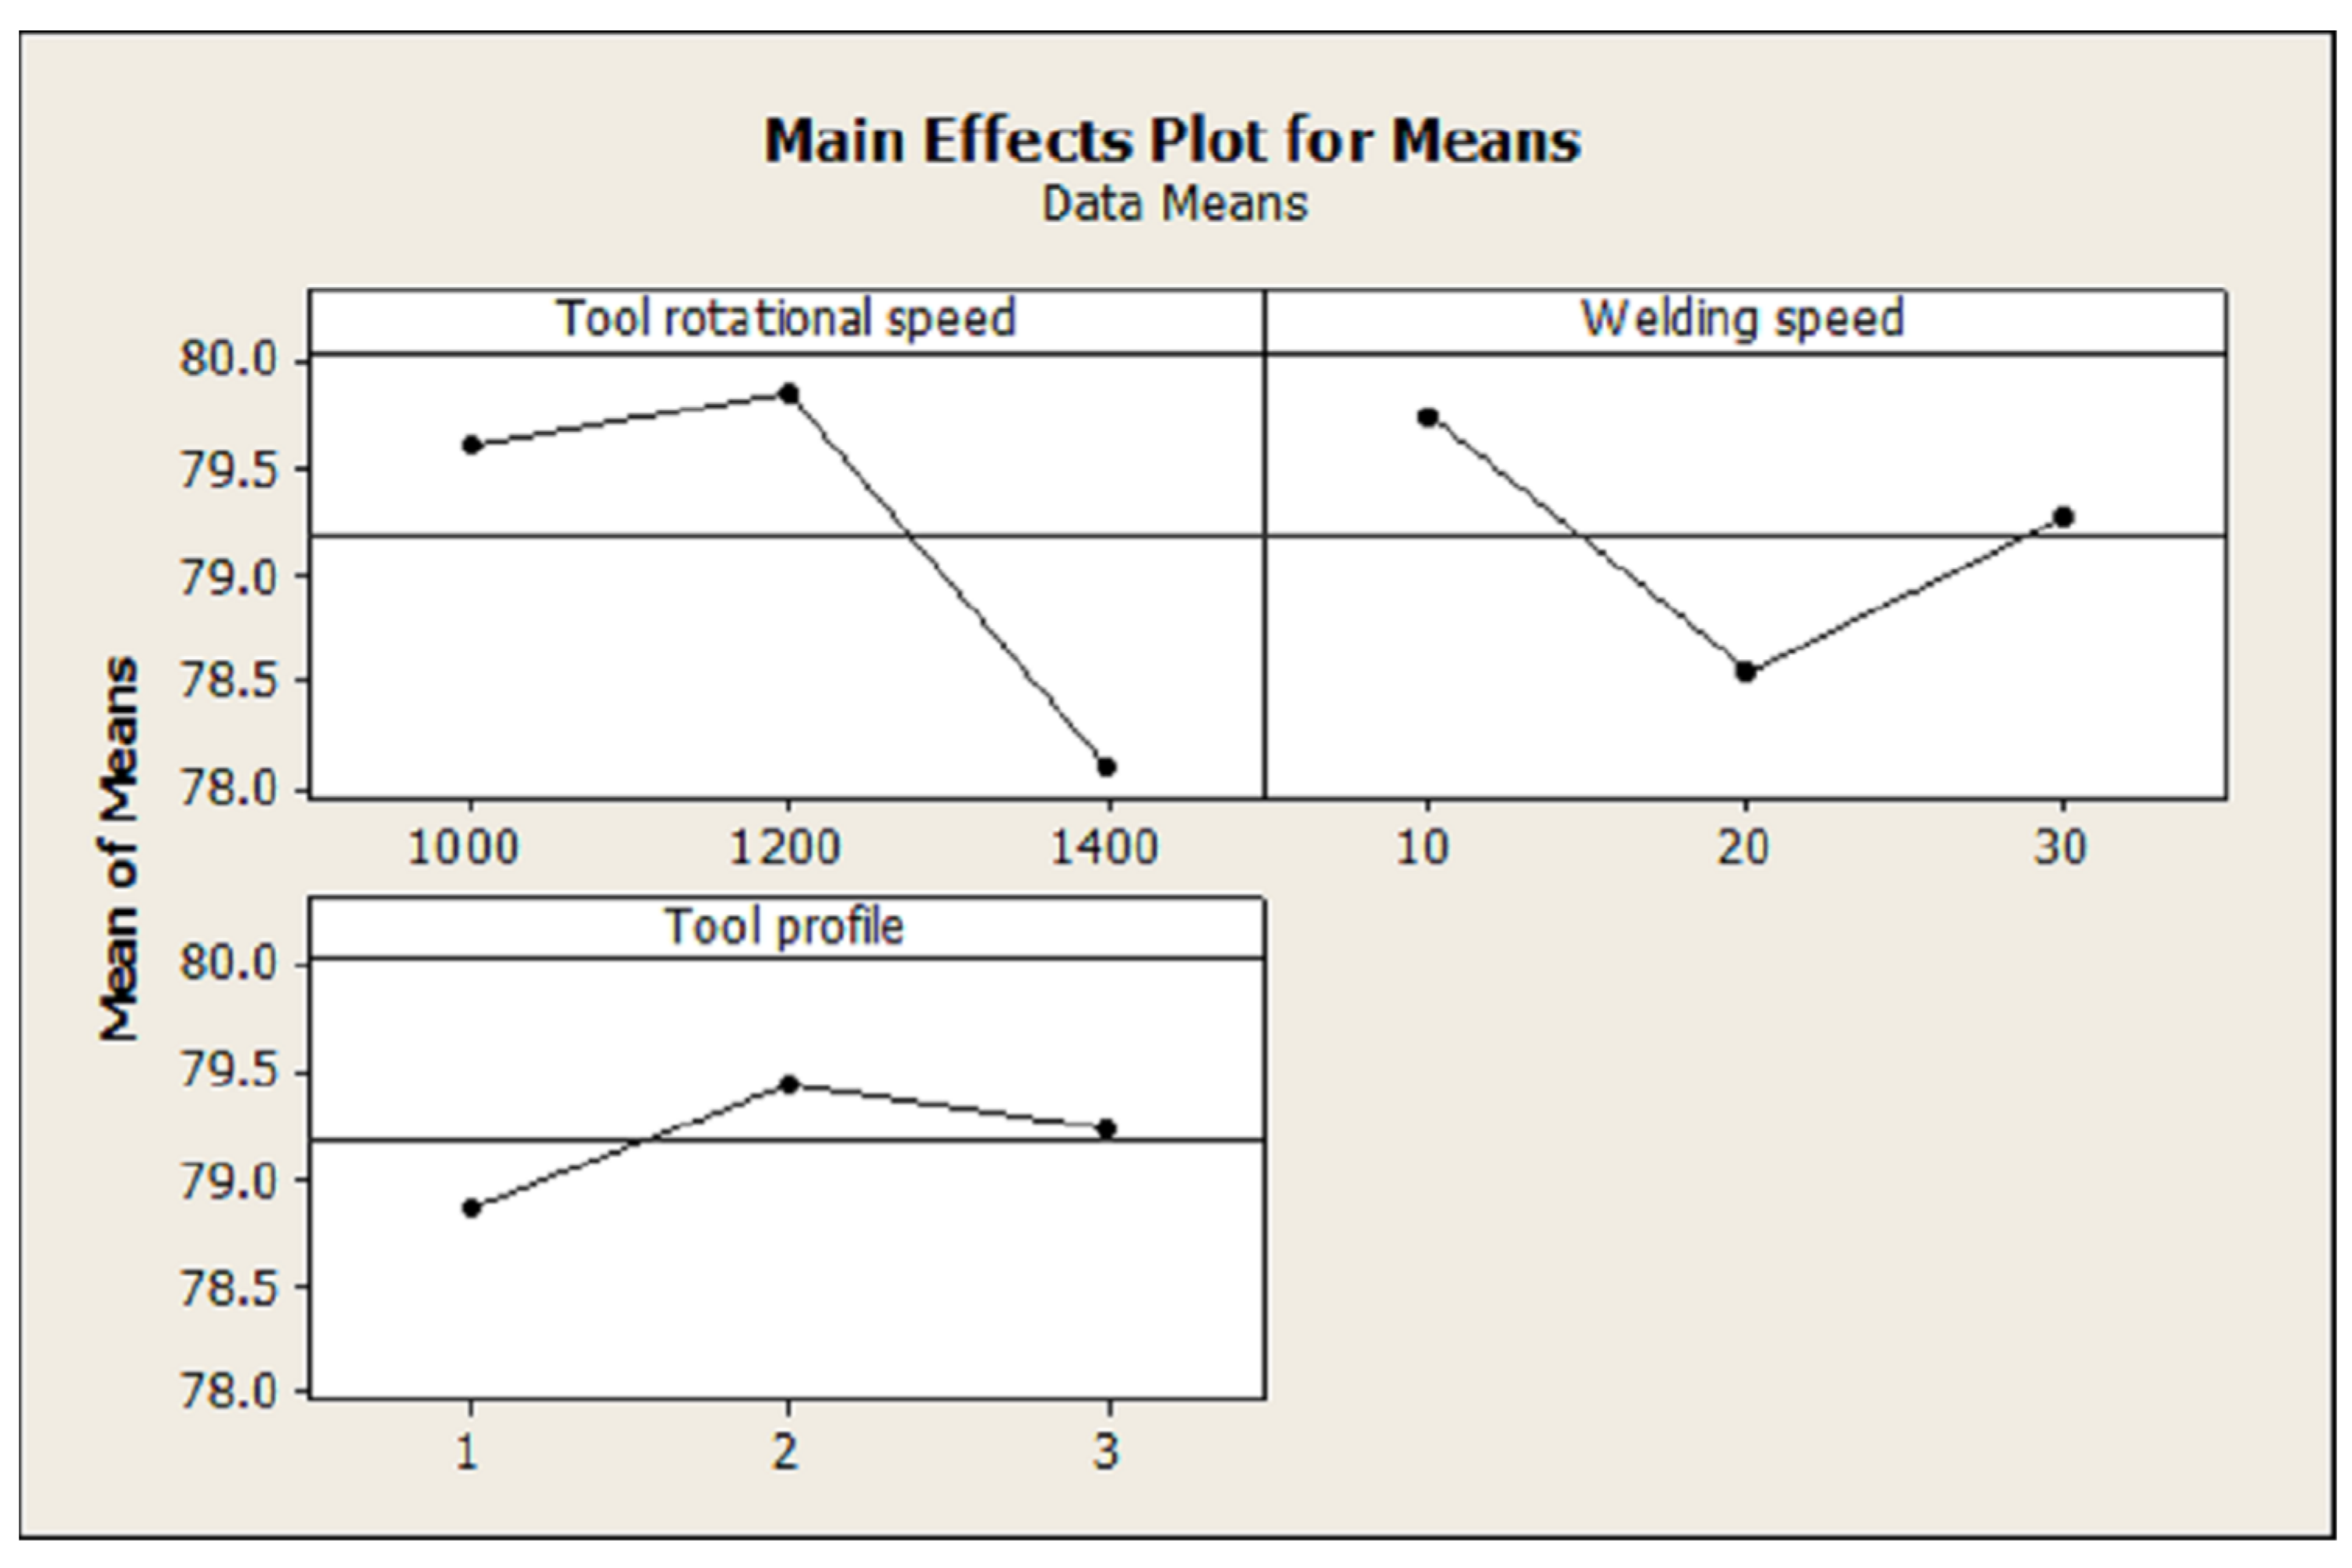
- The optimal FSW process parameters of aluminum alloy SSM 5083 obtained from the hardness value in the SZ and the S/N ratio were A2B1C2, i.e., a rotational speed of 1200 rpm, a welding speed of 10 mm/min, and a threaded cylindrical tool pin profile. The predicted hardness value in the SZ was 80.64 HV, while the confirmational analysis showed the hardness value in the SZ to be 84 HV;
- On the basis of the ANOVA, it was found that the most significant process parameter influencing the tensile strength at a 95% confidence level was the welding speed. Contrarily, none of the parameters, i.e., rotational speed, welding speed, or tool profile, influenced the hardness in the SZ;
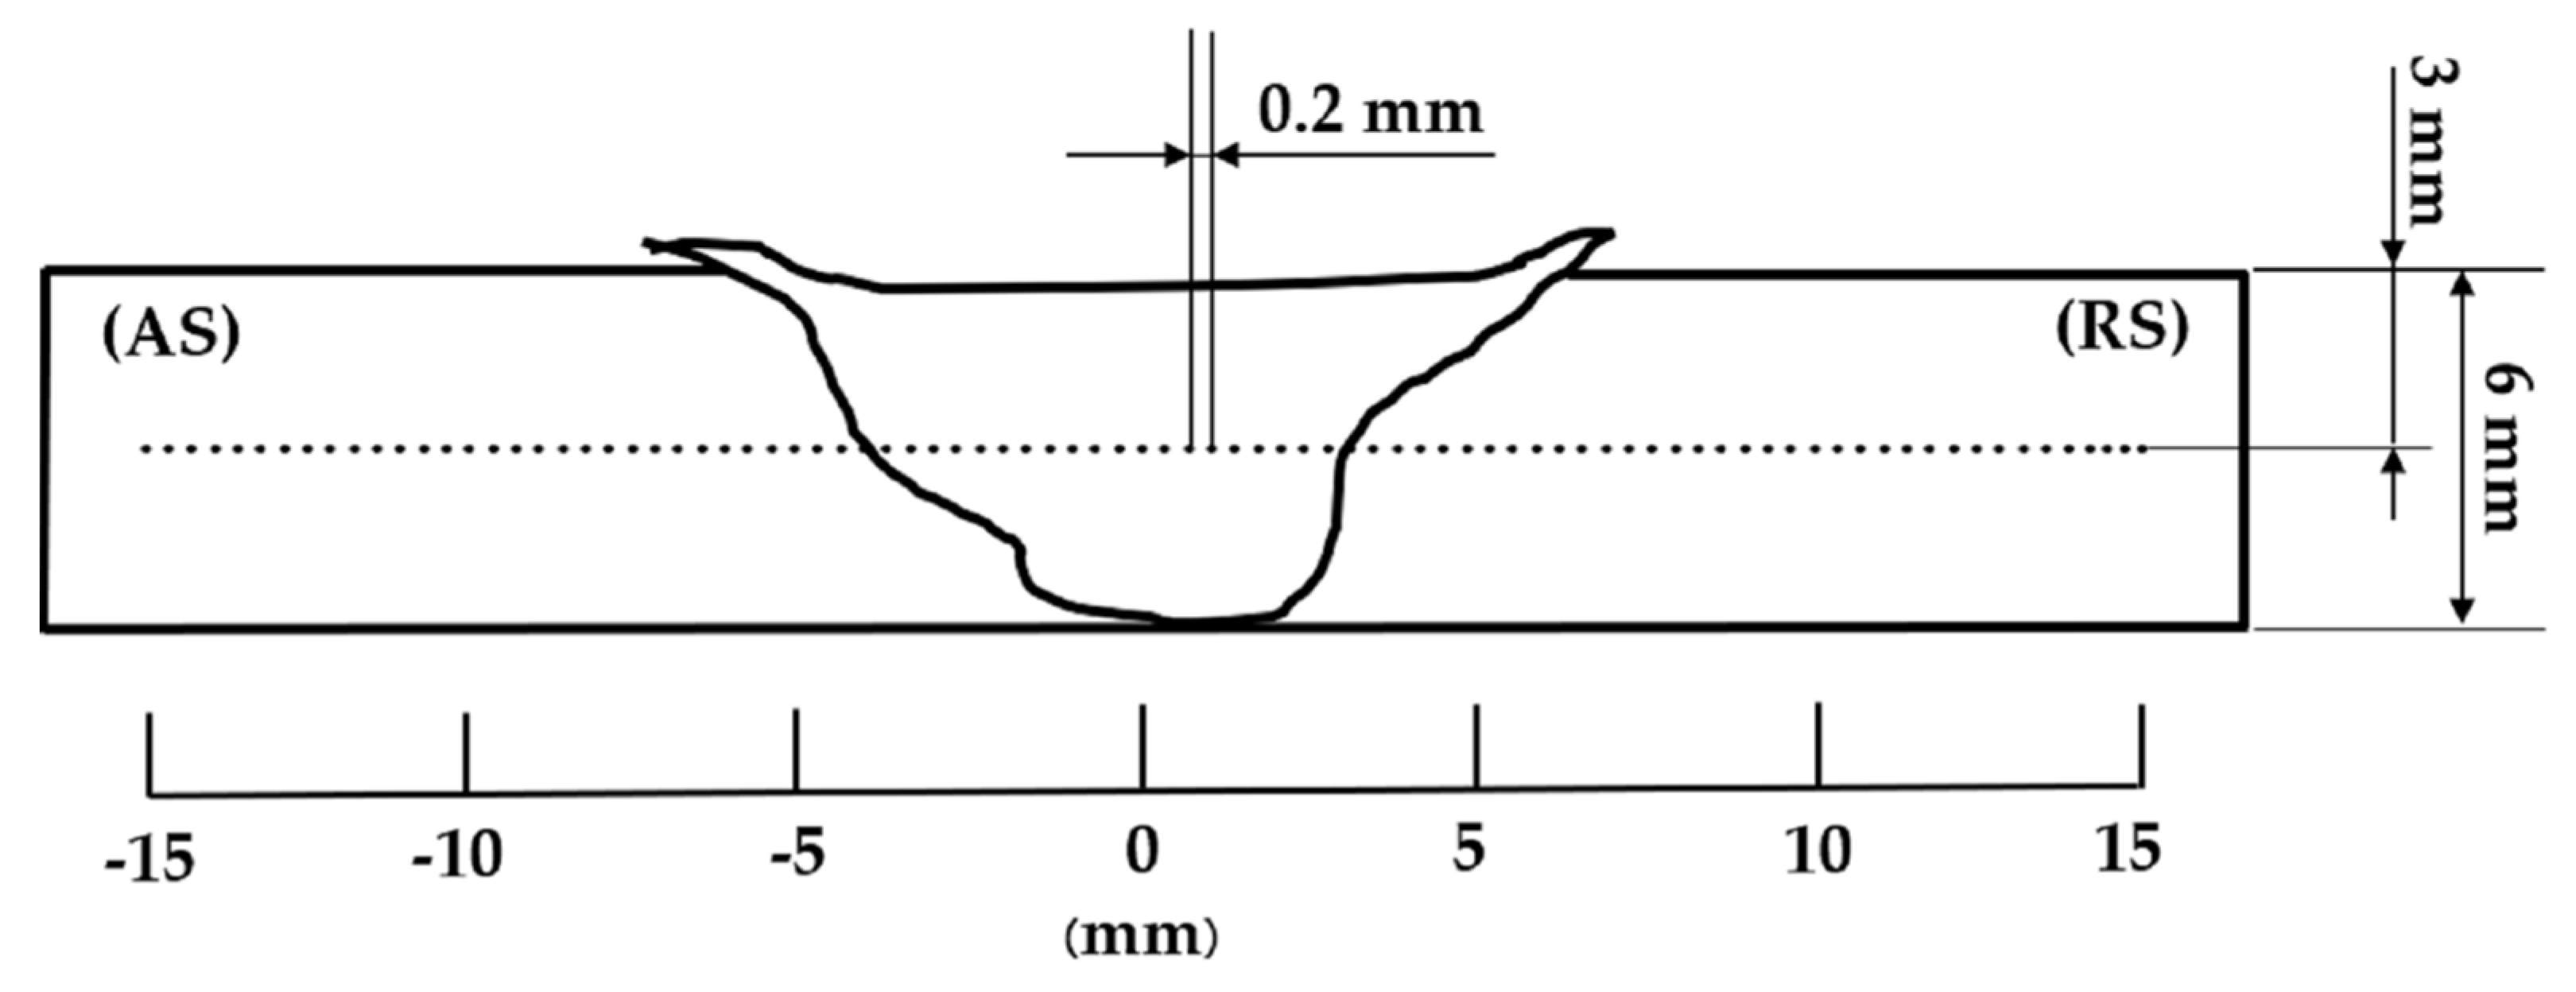
- The microstructure in the SZ area showed the material flowed and gathered well. A void defect was found on the retreating side. From the SEM analysis, surface morphology was found at the top of the weld. The particles were gray, which is the Al2O3 phase. The particles were not smooth and an SiO2 phase was found. Moreover, the size of the hole tended to continue narrowing towards the bottom of the weld in the RS-TMAZ, with good flow in the TMAZ area. On the RS, uniform particle distribution and minimal porosity were found in the AS-TMAZ. The average particle size was 1.320 µm. On the basis of the EDS analysis at the center of the weld, carbon, oxygen, and aluminum were distributed in large quantities throughout the area with some of fluorine, magnesium, etc.
Author Contributions
Funding
Data Availability Statement
Acknowledgments
Conflicts of Interest
References
- Nakata, K.; Kim, Y.G.; Ushio, M.; Hashimoto, T.; Jyogan, S. Weldability of high strength aluminum alloys by friction stir welding. ISIJ Int. 2000, 40, 15–19. [Google Scholar] [CrossRef]
- Wannasin, J.; Janudom, S.; Rattanochaikul, T.; Canyook, R.; Burapa, R.; Chucheep, T.; Thanabumrungkul, S. Research and development of gas induced semi-solid process for industrial applications. Trans. Nonferrous Met. Soc. China 2010, 20, 1010–1015. [Google Scholar] [CrossRef]
- Mishra, R.S.; Ma, Z.Y. Friction stir welding and processing. Mater. Sci. Eng. 2005, 50, 1–78. [Google Scholar] [CrossRef]
- Kumar, S.; Srivastava, A.K.; Singh, R.K.; Dwivedi, S.P. Experimental study on hardness and fatigue behavior in joining of AA5083 and AA6063 by friction stir welding. Mater. Today Proc. 2020, 25, 646–648. [Google Scholar] [CrossRef]
- Koilraj, M.; Sundareswaran, V.; Vijayan, S.; Koteswara Rao, S.R. Friction stir welding of dissimilar aluminum alloys AA2219 to AA5083 Optimization of process parameters using Taguchi technique. Mater. Des. 2012, 42, 1–7. [Google Scholar] [CrossRef]
- Durga Prasad, M.V.R.; Namala, K.K. Process Parameters Optimization in Friction Stir Welding by ANOVA. Mater. Today Proc. 2018, 5, 4824–4831. [Google Scholar] [CrossRef]
- Raweni, A.; Majstorovic, V.; Sedmak, A.; Tadic, S.; Kirin, S. Optimization of AA5083 Friction Stir Welding Parameters Using Taguchi Method. Teh. Vjesn. Tech. Gaz. 2018, 25, 861–866. [Google Scholar]
- Bayazid, S.M.; Farhangia, H.; Ghahramania, A. Investigation of friction stir welding parameters of 6063-7075 Aluminum alloys by Taguchi method. Procedia Mater. Sci. 2015, 11, 6–11. [Google Scholar] [CrossRef] [Green Version]
- Shojaeefard, M.H.; Akbari, M.; Khalkhali, A.; Asadi, P.; Parivar, A.H. Optimization of microstructural and mechanical properties of friction stir welding using the cellular automaton and Taguchi method. Mater. Des. 2014, 64, 660–666. [Google Scholar] [CrossRef]
- Javadi, Y.; Sadeghi, S.; Najafabadi, M.A. Taguchi optimization and ultrasonic measurement of residual stresses in the friction stir welding. Mater. Des. 2014, 55, 27–34. [Google Scholar] [CrossRef]
- Gite, R.A.; Loharkar, P.K.; Shimpi, R. Friction stir welding parameters and application: A review. Mater. Today Proc. 2019, 19, 361–365. [Google Scholar] [CrossRef]
- Sillapasa, K.; Mutoh, Y.; Miyashita, Y.; Seo, N. Fatigue Strength Estimation Based on Local Mechanical Properties for Aluminum Alloy FSW Joints. Materials 2017, 10, 186. [Google Scholar] [CrossRef] [Green Version]
- Singh, V.P.; Patel, S.K.; Ranjan, A.; Kuriachen, B. Recent research progress in solid state friction-stir welding of aluminum–magnesium alloys: A critical review. J. Mater. Res. Technol. 2020, 9, 6217–6256. [Google Scholar] [CrossRef]
- Hakem, M.; Lebailli, S.; Miroud, J.; Bentaleb, A.; Toukali, S. Welding and characterization of 5083 aluminum alloy. In Proceedings of the Conference METAL 2012 Proceedings, 21st International Conference on Metallurgy and Materials, Hotel Voronez I, Brno, Czech Republic, 23–25 May 2012. [Google Scholar]
- Kasman, S.; Yenier, Z. Analyzing dissimilar friction stir welding of AA5754/AA7075. Int. J. Adv. Manuf. Technol. 2014, 70, 145–156. [Google Scholar] [CrossRef]
- Salehi, M.; Saadatmand, M.; Aghazadeh Mohandesi, J. Optimization of process parameters for producing AA6061/SiC nanocomposites by friction stir processing. Trans. Nonferrous Met. Soc. China 2012, 22, 1055–1063. [Google Scholar] [CrossRef]
- Kim, N.-K.; Kim, B.-C.; An, Y.-G.; Jung, B.-H.; Song, S.-W.; Kang, C.-Y. The Effect of material arrangement on mechanical properties in friction stir welded dissimilar A5052/A5J32 aluminum alloys. Met. Mater. Int. 2009, 15, 671–675. [Google Scholar] [CrossRef]
- Reza-E-Rabby, M.D.; Anthony, P.R. Effect of tool pin thread forms on friction stir weldability of different aluminum alloys. Procedia Eng. 2014, 90, 637–642. [Google Scholar] [CrossRef]
- Roshan, S.B.; Jooibari, M.B.; Teimouri, R.; Asgharzadeh-Ahmadi, G.; Falahati-Naghibi, M.; Sohrabpoor, H. Optimization of friction stir welding process of AA7075 aluminum alloy to achieve desirable mechanical properties using ANFIS models and simulated annealing algorithm. Int. J. Adv. Manuf. Technol. 2013, 69, 1803–1818. [Google Scholar] [CrossRef]
- Gibson, B.T.; Lammlein, D.H.; Prater, T.J.; Longhurst, W.R.; Cox, C.D.; Ballun, M.C.; Strauss, A.M. Friction stir welding: Process automation and control. J. Manuf. Processes 2014, 16, 56–73. [Google Scholar] [CrossRef]
- Amini, S.; Amiri, M.R.; Barani, A. Investigation of the effect of tool geometry on friction stir welding of 5083-O aluminum alloy. Int. J. Adv. Manuf. Technol. 2015, 76, 255–261. [Google Scholar] [CrossRef]
- ASTM International. Standard Test Methods for Tension Testing of Metallic Materials E 8M—04. In Annual Book of ASTM Standard; ASTM International: West Conshohocken, PA, USA, 1996; Volume 03.01, pp. 1–24. [Google Scholar]
- Rao, S.R.; Padmanabhan, G. Application of Taguchi methods and ANOVA in optimization of process parameters for metal removal rate in electrochemical machining of Al/5%SiC composites. Int. J. Eng. Res. Appl. 2012, 2, 192–197. [Google Scholar]
- Vijayan, S.; Raju, R.; Subbaiah, K.; Sridhar, N.; Rao, S.R.K. Friction stir welding of Al–Mg alloy-optimization of process parameters using Taguchi method. Exp. Tech. 2010, 34, 37–44. [Google Scholar] [CrossRef]
- D’Urso, G.; Giardini, C. The influence of process parameters and tool geometry on mechanical properties of friction stir welded aluminum lap joints. Int. J. Mater. Form. 2010, 3, 1011–1014. [Google Scholar] [CrossRef]
- Shahraki, S.; Khorasani, S.; Behnagh, R.A.; Fotouhi, Y.; Bisadi, H. Producing of AA5083/ZrO2 nanocomposite by friction stir processing (FSP). Metall. Mater. Trans. B 2013, 44, 1546–1553. [Google Scholar] [CrossRef]
- Cho, J.-H.; Boyce, D.E.; Dawson, P.R. Modeling strain hardening and texture evolution in friction stir welding of stainless steel. Mater. Sci. Eng. A 2005, 398, 146–163. [Google Scholar] [CrossRef]
- Nandan, R.; DebRoy, T.; Bhadeshia, H.K.D.H. Recent advances in friction-stir welding-process-weldment structure and properties. Prog. Mater Sci. 2008, 53, 980–1023. [Google Scholar] [CrossRef] [Green Version]
- Zhao, Y.; Zhou, L.; Wang, Q.; Yan, K.; Zou, J. Defects and tensile properties of 6013 aluminum alloy T-joints by friction stir by friction stir welding. Mater. Des. 2014, 57, 146–155. [Google Scholar] [CrossRef]
- Salari, E.; Jahazi, M.; Khodabandeh, A.; Nanesa, H.G. Influence of tool geometry and rotational speed on mechanical properties and defect formation in friction stir lap welded 5456 aluminum alloy sheets. Mater. Des. 2014, 58, 381–389. [Google Scholar] [CrossRef]
- Ilman, M.N.; Triwibowo, N.A.; Wahyudianto, A.; Muslih, M.R. Environmentally assisted fatigue behaviour of stress relieved metal gas (MIG) AA5083 welds in 3.5% NaCl solution. Int. J. Fatigue 2017, 100, 285–295. [Google Scholar] [CrossRef]
- Abbasi, M.; Abdollahzadeh, A.; Bagheri, B.; Omidvar, H. The Effect of SiC Particle Addition During FSW on Microstructure and Mechanical Properties of AZ31 Magnesium Alloy. J. Mater. Eng. Perform. 2015, 24, 5037–5045. [Google Scholar] [CrossRef]


| Level | A Rotational Speed (RPM) | B Welding Speed (mm/min) | C Tool Profile |
|---|---|---|---|
| Level 1 | 1000 | 10 | Straight cylindrical |
| Level 2 | 1200 | 20 | Threaded cylindrical |
| Level 3 | 1400 | 30 | Tapered cylindrical |
| Experiment No. | A Rotational Speed (RPM) | B Welding Speed (mm/min) | C Tool Profile | Tensile Strength (MPa) | S/N Ratio |
|---|---|---|---|---|---|
| 1 | 1000 | 10 | Straight cylindrical | 215 | 46.64 |
| 2 | 1000 | 20 | Threaded cylindrical | 171 | 44.65 |
| 3 | 1000 | 30 | Tapered cylindrical | 130 | 42.27 |
| 4 | 1200 | 10 | Threaded cylindrical | 221 | 46.88 |
| 5 | 1200 | 20 | Tapered cylindrical | 131 | 42.34 |
| 6 | 1200 | 30 | Straight cylindrical | 117 | 41.36 |
| 7 | 1400 | 10 | Tapered cylindrical | 178 | 45.00 |
| 8 | 1400 | 20 | Straight cylindrical | 138 | 42.79 |
| 9 | 1400 | 30 | Threaded cylindrical | 153 | 43.69 |
| Level | Rotational Speed (RPM) | Welding Speed (mm/min) | Tool Profile |
|---|---|---|---|
| 1 | 172.0 | 204.7 | 156.7 |
| 2 | 156.3 | 146.7 | 181.7 |
| 3 | 156.3 | 133.3 | 146.3 |
| Delta | 15.7 | 71.3 | 35.3 |
| Rank | 3 | 1 | 2 |
| Level | Rotational Speed (RPM) | Welding Speed (mm/min) | Tool Profile |
|---|---|---|---|
| 1 | 44.53 | 46.18 | 43.60 |
| 2 | 43.53 | 43.27 | 45.08 |
| 3 | 43.83 | 42.45 | 43.21 |
| Delta | 1.00 | 3.74 | 1.87 |
| Rank | 3 | 1 | 2 |
| Experiment No. | A Rotational Speed (RPM) | B Welding Speed (mm/min) | C Tool Profile | Hardness (HV) | S/N Ratio |
|---|---|---|---|---|---|
| 1 | 1000 | 10 | Straight cylindrical | 80.7 | 38.13 |
| 2 | 1000 | 20 | Threaded cylindrical | 77.7 | 37.80 |
| 3 | 1000 | 30 | Tapered cylindrical | 80.4 | 38.10 |
| 4 | 1200 | 10 | Threaded cylindrical | 81.3 | 38.20 |
| 5 | 1200 | 20 | Tapered cylindrical | 80.1 | 38.07 |
| 6 | 1200 | 30 | Straight cylindrical | 78.1 | 37.85 |
| 7 | 1400 | 10 | Tapered cylindrical | 77.2 | 37.75 |
| 8 | 1400 | 20 | Straight cylindrical | 77.8 | 37.81 |
| 9 | 1400 | 30 | Threaded cylindrical | 79.3 | 37.98 |
| Level | Rotational Speed (RPM) | Welding Speed (mm/min) | Tool Profile |
|---|---|---|---|
| 1 | 79.60 | 79.73 | 78.87 |
| 2 | 79.83 | 78.53 | 79.43 |
| 3 | 78.10 | 79.27 | 79.23 |
| Delta | 1.73 | 1.20 | 0.57 |
| Rank | 1 | 2 | 3 |
| Level | Rotational Speed (RPM) | Welding Speed (mm/min) | Tool Profile |
|---|---|---|---|
| 1 | 38.02 | 38.03 | 37.94 |
| 2 | 38.04 | 37.90 | 38.00 |
| 3 | 37.85 | 37.98 | 37.98 |
| Delta | 0.19 | 0.13 | 0.06 |
| Rank | 1 | 2 | 3 |
| Source | DF | Seq SS | Adj SS | Adj MS | F | p | % Contribution |
|---|---|---|---|---|---|---|---|
| Rotational speed | 2 | 490.9 | 490.9 | 245.44 | 2.57 | 0.280 | 4.34 |
| Welding speed | 2 | 8630.2 | 8630.2 | 4315.11 | 45.21 | 0.022 | 76.43 |
| Tool profile | 2 | 1980.2 | 1980.2 | 990.11 | 10.37 | 0.088 | 17.53 |
| Error | 2 | 190.9 | 190.9 | 95.44 | 1.70 | ||
| Total | 8 | 11,292.2 |
| Source | DF | Seq SS | Adj SS | Adj MS | F | p | % Contribution |
|---|---|---|---|---|---|---|---|
| Rotational speed | 2 | 1.5686 | 1.5686 | 0.7843 | 3.41 | 0.227 | 5.06 |
| Welding speed | 2 | 23.1267 | 23.1267 | 11.5634 | 50.33 | 0.019 | 74.64 |
| Tool profile | 2 | 5.8316 | 5.8316 | 2.9158 | 12.69 | 0.073 | 18.82 |
| Error | 2 | 0.4595 | 0.4595 | 0.2297 | 1.48 | ||
| Total | 8 | 30.9864 |
| Source | DF | Seq SS | Adj SS | Adj MS | F | p | % Contribution |
|---|---|---|---|---|---|---|---|
| Rotational speed | 2 | 5.3089 | 5.3089 | 2.6544 | 0.51 | 0.661 | 28.95 |
| Welding speed | 2 | 2.1956 | 2.1956 | 1.0978 | 0.21 | 0.825 | 11.98 |
| Tool profile | 2 | 0.4956 | 0.4956 | 0.2478 | 0.05 | 0.954 | 2.70 |
| Error | 2 | 10.3356 | 10.3356 | 5.1678 | 56.37 | ||
| Total | 8 | 18.3356 |
| Source | DF | Seq SS | Adj SS | Adj MS | F | p | % Contribution |
|---|---|---|---|---|---|---|---|
| Rotational speed | 2 | 0.063832 | 0.063832 | 0.031916 | 0.51 | 0.662 | 28.93 |
| Welding speed | 2 | 0.025976 | 0.025976 | 0.012988 | 0.21 | 0.828 | 11.78 |
| Tool profile | 2 | 0.005907 | 0.005907 | 0.002953 | 0.05 | 0.955 | 2.68 |
| Error | 2 | 0.124886 | 0.124886 | 0.062443 | 56.61 | ||
| Total | 8 | 0.220601 |
| Element | Line Type | Apparent Concentration | K Ratio | wt% | wt% Sigma | Atomic % | Standard Label |
|---|---|---|---|---|---|---|---|
| C | K series | 0.76 | 0.00762 | 55.86 | 0.49 | 68.80 | C Vit |
| O | K series | 0.59 | 0.00199 | 22.34 | 0.31 | 20.66 | SiO2 |
| F | K series | 0.15 | 0.00030 | 2.99 | 0.16 | 2.32 | CaF2 |
| Na | K series | 0.01 | 0.00006 | 0.21 | 0.04 | 0.14 | Albite |
| Mg | K series | 0.05 | 0.00036 | 1.02 | 0.04 | 0.62 | MgO |
| Al | K series | 0.65 | 0.00467 | 11.67 | 0.14 | 6.40 | Al2O3 |
| Si | K series | 0.02 | 0.00016 | 0.39 | 0.03 | 0.20 | SiO2 |
| Cl | K series | 0.02 | 0.00014 | 0.30 | 0.03 | 0.13 | NaCl |
| Pd | K series | 0.21 | 0.00212 | 5.22 | 0.12 | 0.73 | Pd |
| Total | 100.00 | 100.00 |
Publisher’s Note: MDPI stays neutral with regard to jurisdictional claims in published maps and institutional affiliations. |
© 2021 by the authors. Licensee MDPI, Basel, Switzerland. This article is an open access article distributed under the terms and conditions of the Creative Commons Attribution (CC BY) license (https://creativecommons.org/licenses/by/4.0/).
Share and Cite
Nakowong, K.; Sillapasa, K. Optimized Parameter for Butt Joint in Friction Stir Welding of Semi-Solid Aluminum Alloy 5083 Using Taguchi Technique. J. Manuf. Mater. Process. 2021, 5, 88. https://doi.org/10.3390/jmmp5030088
Nakowong K, Sillapasa K. Optimized Parameter for Butt Joint in Friction Stir Welding of Semi-Solid Aluminum Alloy 5083 Using Taguchi Technique. Journal of Manufacturing and Materials Processing. 2021; 5(3):88. https://doi.org/10.3390/jmmp5030088
Chicago/Turabian StyleNakowong, Konkrai, and Kittima Sillapasa. 2021. "Optimized Parameter for Butt Joint in Friction Stir Welding of Semi-Solid Aluminum Alloy 5083 Using Taguchi Technique" Journal of Manufacturing and Materials Processing 5, no. 3: 88. https://doi.org/10.3390/jmmp5030088
APA StyleNakowong, K., & Sillapasa, K. (2021). Optimized Parameter for Butt Joint in Friction Stir Welding of Semi-Solid Aluminum Alloy 5083 Using Taguchi Technique. Journal of Manufacturing and Materials Processing, 5(3), 88. https://doi.org/10.3390/jmmp5030088