Article

Optimized Parameter for Butt Joint in Friction Stir Welding of Semi-Solid Aluminum Alloy 5083 Using Taguchi Technique

by
Konkrai Nakowong
and
Kittima Sillapasa
*
Department of Industrial Engineering, Faculty of Engineering, Ubon Ratchathani University, Ubon Ratchathani 34190, Thailand
*
Author to whom correspondence should be addressed.
J. Manuf. Mater. Process. 2021, 5(3), 88; https://doi.org/10.3390/jmmp5030088
Submission received: 19 July 2021 / Revised: 7 August 2021 / Accepted: 10 August 2021 / Published: 13 August 2021

Abstract

:
The semi-solid metal (SSM) 5083 aluminum alloy was developed for part manufacturing in the marine shipbuilding industry. This study aimed to optimize the parameters for the friction stir welding process of SSM 5083 aluminum alloy using the Taguchi and analysis of variance (ANOVA) techniques. Our analyses included tensile strength, hardness value, and the microstructure. The results revealed that the optimal parameters obtained for the tensile strength and hardness value in the stir zone (SZ) were A1B1C2 (1000 rpm, 10 mm/min, with a threaded cylindrical tool) with a tensile strength of 235.22 MPa and A2B1C2 (1200 rpm, 10 mm/min, with a threaded cylindrical tool) with a hardness value of 80.64 HV. According to the results obtained by ANOVA, it was found that the welding speed was the most significant process parameter in terms of influencing the tensile strength. Contrarily, no parameter influenced the hardness at a 95% confidence level. The examination using scanning electron microscopy (SEM) and an energy dispersive X-ray spectroscope (EDS) revealed an elongated grain structure and a void defect at the pin tip on the advancing side (AS) in the SZ. The particle distribution was uniform with Al2O3 and small porous SiO2 phases. Moreover, the quantities of C, O, Al, F, and Mg decreased.

1. Introduction

Several factors need to be addressed in the manufacture of parts in the marine shipbuilding industry, such as corrosion resistance, strength, and material weight. Aluminum is one of the most popular materials for producing parts because it is lightweight and strong. Aluminum alloy 5083 is one of the materials that meet the criteria because this type of aluminum has a low density, good corrosion resistance, good formability, and is the strongest non-heat-treatable alloy used in annealed conditions [1]. In the manufacture of specific marine ship-building components, a casting process is required. Dendritic microstructures can be formed in most alloy casting processes, which affect the strength of the material. However, improving the structure of the parts through the casting process can be achieved using the semi-solid casting method. This involves forming the metal by casting and partially hardening the metal with nondendritic grains or spheroidal/globular grains. Wannasin J. [2] developed a gas-induced semi-solid process for industrial applications, known as the gas-induced semi-solid (GISS) technique. This process applies fine gas bubble injection, using argon or nitrogen, for example, through a graphite diffuser into metallic water in order to produce semi-solid metals through the principle of metal water displacement and spot heat suction.
Friction stir welding (FSW), a popular marine shipbuilding welding method, involves lower temperatures than the melting temperature. This solid-state welding technique has many advantages, such as producing a fine microstructure, strong welding metallurgical properties, and no loss of mixed elements [3]. Kumar et al. [4] investigated the FSW characteristics in AA5083 and AA6063. The results showed that the welded joints were free from severe defects. The variation in hardness was due to the phase binding of the dissimilar alloys and the changes in the grain structure. Koilraj et al. [5] studied the FSW characteristics of the dissimilar aluminum alloys AA2219 and AA5083 to establish the optimal process parameters using the Taguchi technique. It was found that materials on the advancing side occupied the weld area. The minimum welding hardness occurred in the heat-affected zone (HAZ) on the AA5083 side. Durga Prasad M.V.R et al. [6] optimized the process parameters for FSW on the dissimilar aluminum alloys AA5083 and AA6061 using Taguchi L9 orthogonal array. It was found that the welding speed was an important factor that affected the percentage of elongation and hardness in the weld zone. The tool angle is an important factor in determining the hardness at the HAZ and the thermal–mechanically affected zone (TMAZ). Cavity defects were found in all joints welded with threaded cylindrical tools. Raweni A et al. [7] studied the optimal parameters for FSW on AA5083 using the Taguchi method with a signal-to-noise (S/N) ratio analysis to establish suitable welding parameters and ANOVA to determine the influence between the parameters. Bayazid S.M et al. [8] studied the effects of FSW parameters, such as rotational speed, welding speed, positioning of the joint plate on the microstructure, and mechanical properties of alloys 6063 and 7075 using the Taguchi technique and ANOVA. The results of the study showed that the rotational speed, welding speed, and placement of the plates influenced the tensile strength of the joints by 59%, 30%, and 7%, respectively. A predictive model was established for the tensile strength according to the FSW parameters and the experiments. Shojaeefard M.H et al. [9] studied the mechanical and microstructure properties of AA1100 in FSW using the orthogonal Taguchi L9 experimental design to determine and forecast the optimal grain size value. The ultimate tensile strength and hardness were verified for accuracy by running a confirmation test with the optimal parameters. ANOVA was also performed to determine the most important factor in FSW. Javadi Y et al. [10] studied residual stress arising from the FSW of 5086 aluminum sheets using the Taguchi statistical experimental design to determine the optimal welding parameters, including feed rates, rotational tool, pin speed, pin diameter, and shoulder diameter. The optimal parameters of the process depended on the effect of the residual stress connection parameters. According to ANOVA, it was concluded that the most significant effect on the maximum longitudinal residual stress was the feed rate, whereas the pin and shoulder diameter had no notable effect. The change in rotational speed led to the change in the heat that occurred during welding, which greatly affected the residual stress. Gite R.A et al. [11] criticized the application and parameters of FSW. Sillapasa et al. [12] investigated the fatigue strength of a different friction stir welding process (FSWp) using 6N01 and 7N01 and found it to be adequate. The relationship between the fatigue strength and the tensile strength was σa (R = −1) = 1.68 HV (σa is in MPa and HV has no units).
The present study applied the above principles and concepts in order to study FSW using aluminum alloy SSM 5083. The welding parameters were the rotational speed, welding speed, and the shape of the welding tools. The S/N ratio was analyzed using the Taguchi method. ANOVA was carried out in order to create a regression equation to predict the tensile strength and hardness values. In order to determine the welding parameters that most affected weld quality, the tensile strength, hardness value, macro- and microstructure, SEM, and EDS were analyzed.

2. Methodology

2.1. Materials

Aluminum 5083-H112 was used to produce semi-solid casting aluminum alloys using a GISS process. This is a process that improves mechanical properties by applying fine gas bubble injection through a graphite diffuser, resulting in semi-solid metal with a globular grain structure [2]. We melted 5083-H112 aluminum with the model V2 GISS casting system machine at 655 °C, then lowered the temperature to 640 °C. Nitrogen gas was then sprayed at a flow rate of 15 L per minute for 8 s. Next, the specimen was placed in a compression mold, resulting in 15 mm thick SSM 5083, with dimensions of 150 mm × 150 mm. By examining the microstructure of the SSM 5083 base material (BM), it was found that the α-Al phase grain was continuously nodular with a β phase, wherein Al3Mg2 grouped around the α phase [13,14] as shown in Figure 1. The tensile strength of the SSM 5083 base material was 255 MPa, and the hardness of the SSM 5083 base material was 85 HV. The SSM 5083 was processed to a thickness of 6 mm and dimensions of 75 mm × 150 mm with a horizontal band saw. The plate edges were machined and an oxide layer, if present, was removed with a HAAS TM-1 CNC VERTICAL MILLING MACHINE (Oxnard, CA, USA) to achieve dimensional accuracy throughout the joint surface. The surface roughness of the specimens was measured using a Surftest Roughness Tester Portable brand Mitutoyo model: SJ-210 (make: Mitutoyo Co., Ltd., Kanagawa, Japan). The average surface roughness was ranked between 0.2–0.5 µm.

2.2. Friction Stir Welding (FSW) Process

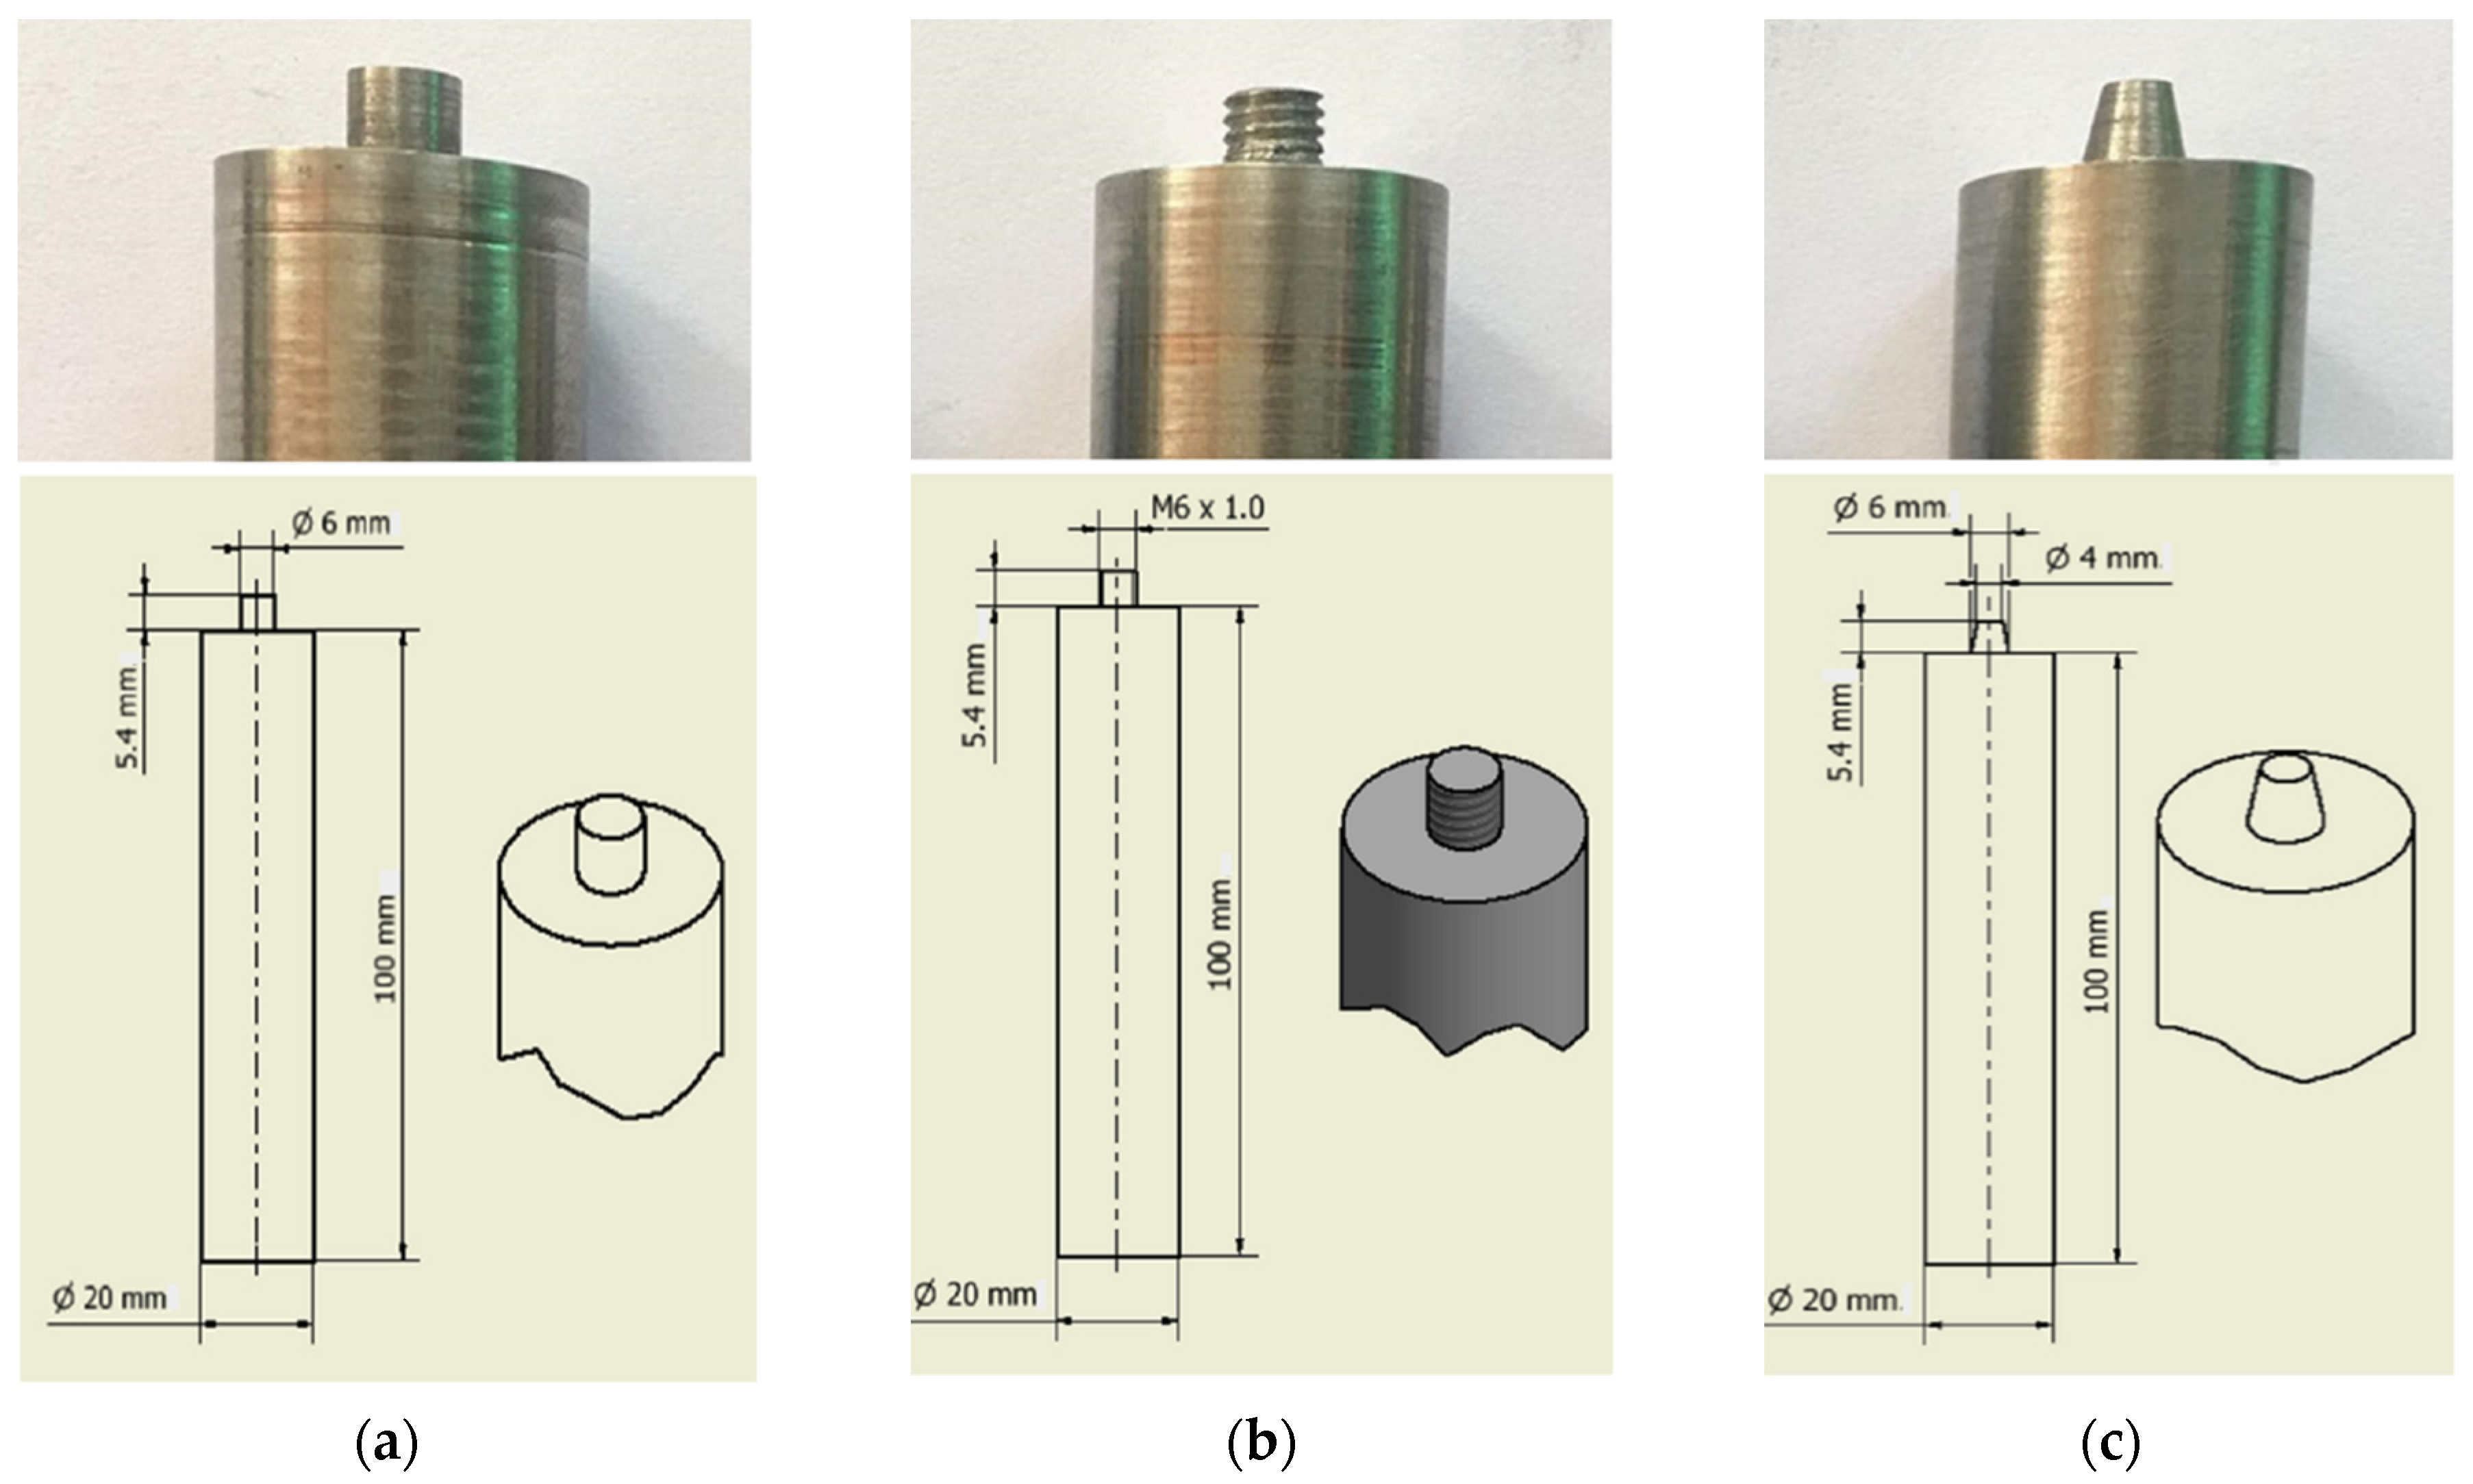
FSW was carried out on the aluminum alloy SSM 5083 plates with dimensions of 6 mm × 75 mm × 150 mm in butt joint configuration. They were clamped onto a planch to prevent separation, as shown in Figure 2a. The experiments were carried out with a constant tool tilt angle of 3° [15] and a work surface plug depth of 0.2 mm, which led to good heat and softening of the weld material [16,17]. In this study, three process parameters were optimized: rotational speed, welding speed, and tool profile. Variations in the rotational speed resulted in heat and plastic deformation [18], whereas higher welding speed resulted in a lower temperature and insufficient plastic deformation [19]. In addition, the machines used in the experiment were able to handle the welding load. For the welding experiment, the CNC brand HAAS TM-1 CNC VERTICAL MILLING MACHINE was used. The experiment was set up as shown in Figure 2b. The maximum tensile strength of the welding workpiece was tested and it was checked for flaws in the weld. It was found that the range of rotational speed was between 1000–1400 rpm and the range of welding speed was 10–30 mm/min. The stirrer used for welding was made of SKD11 (Cr12Mo1V1) steel. Many studies showed that it is important to correctly match the stirrer material with the welding material; for example, AISI H13 and hardened steel are reported to be effective [20,21]. From an experiment using the AISI H13 material in SSM 5083 welding, it was found that a rotational speed of 1000 rpm and a welding speed of 30 mm/min caused the tool pin to break during welding. Therefore, the researchers chose SKD11 steel to determine the shape of the three welding tools, as shown in Figure 3. In order to obtain a defect-free weld and optimal tensile strength, the input parameters were chosen in a highly specific range. The following input parameters were tested in this study: rotational speed (1000–1400 rpm), welding speed (10–30 mm/min), and tool profile (straight cylindrical, threaded cylindrical, tapered cylindrical).

2.3. Mechanical Property Testing and Metallurgical Structural Inspection

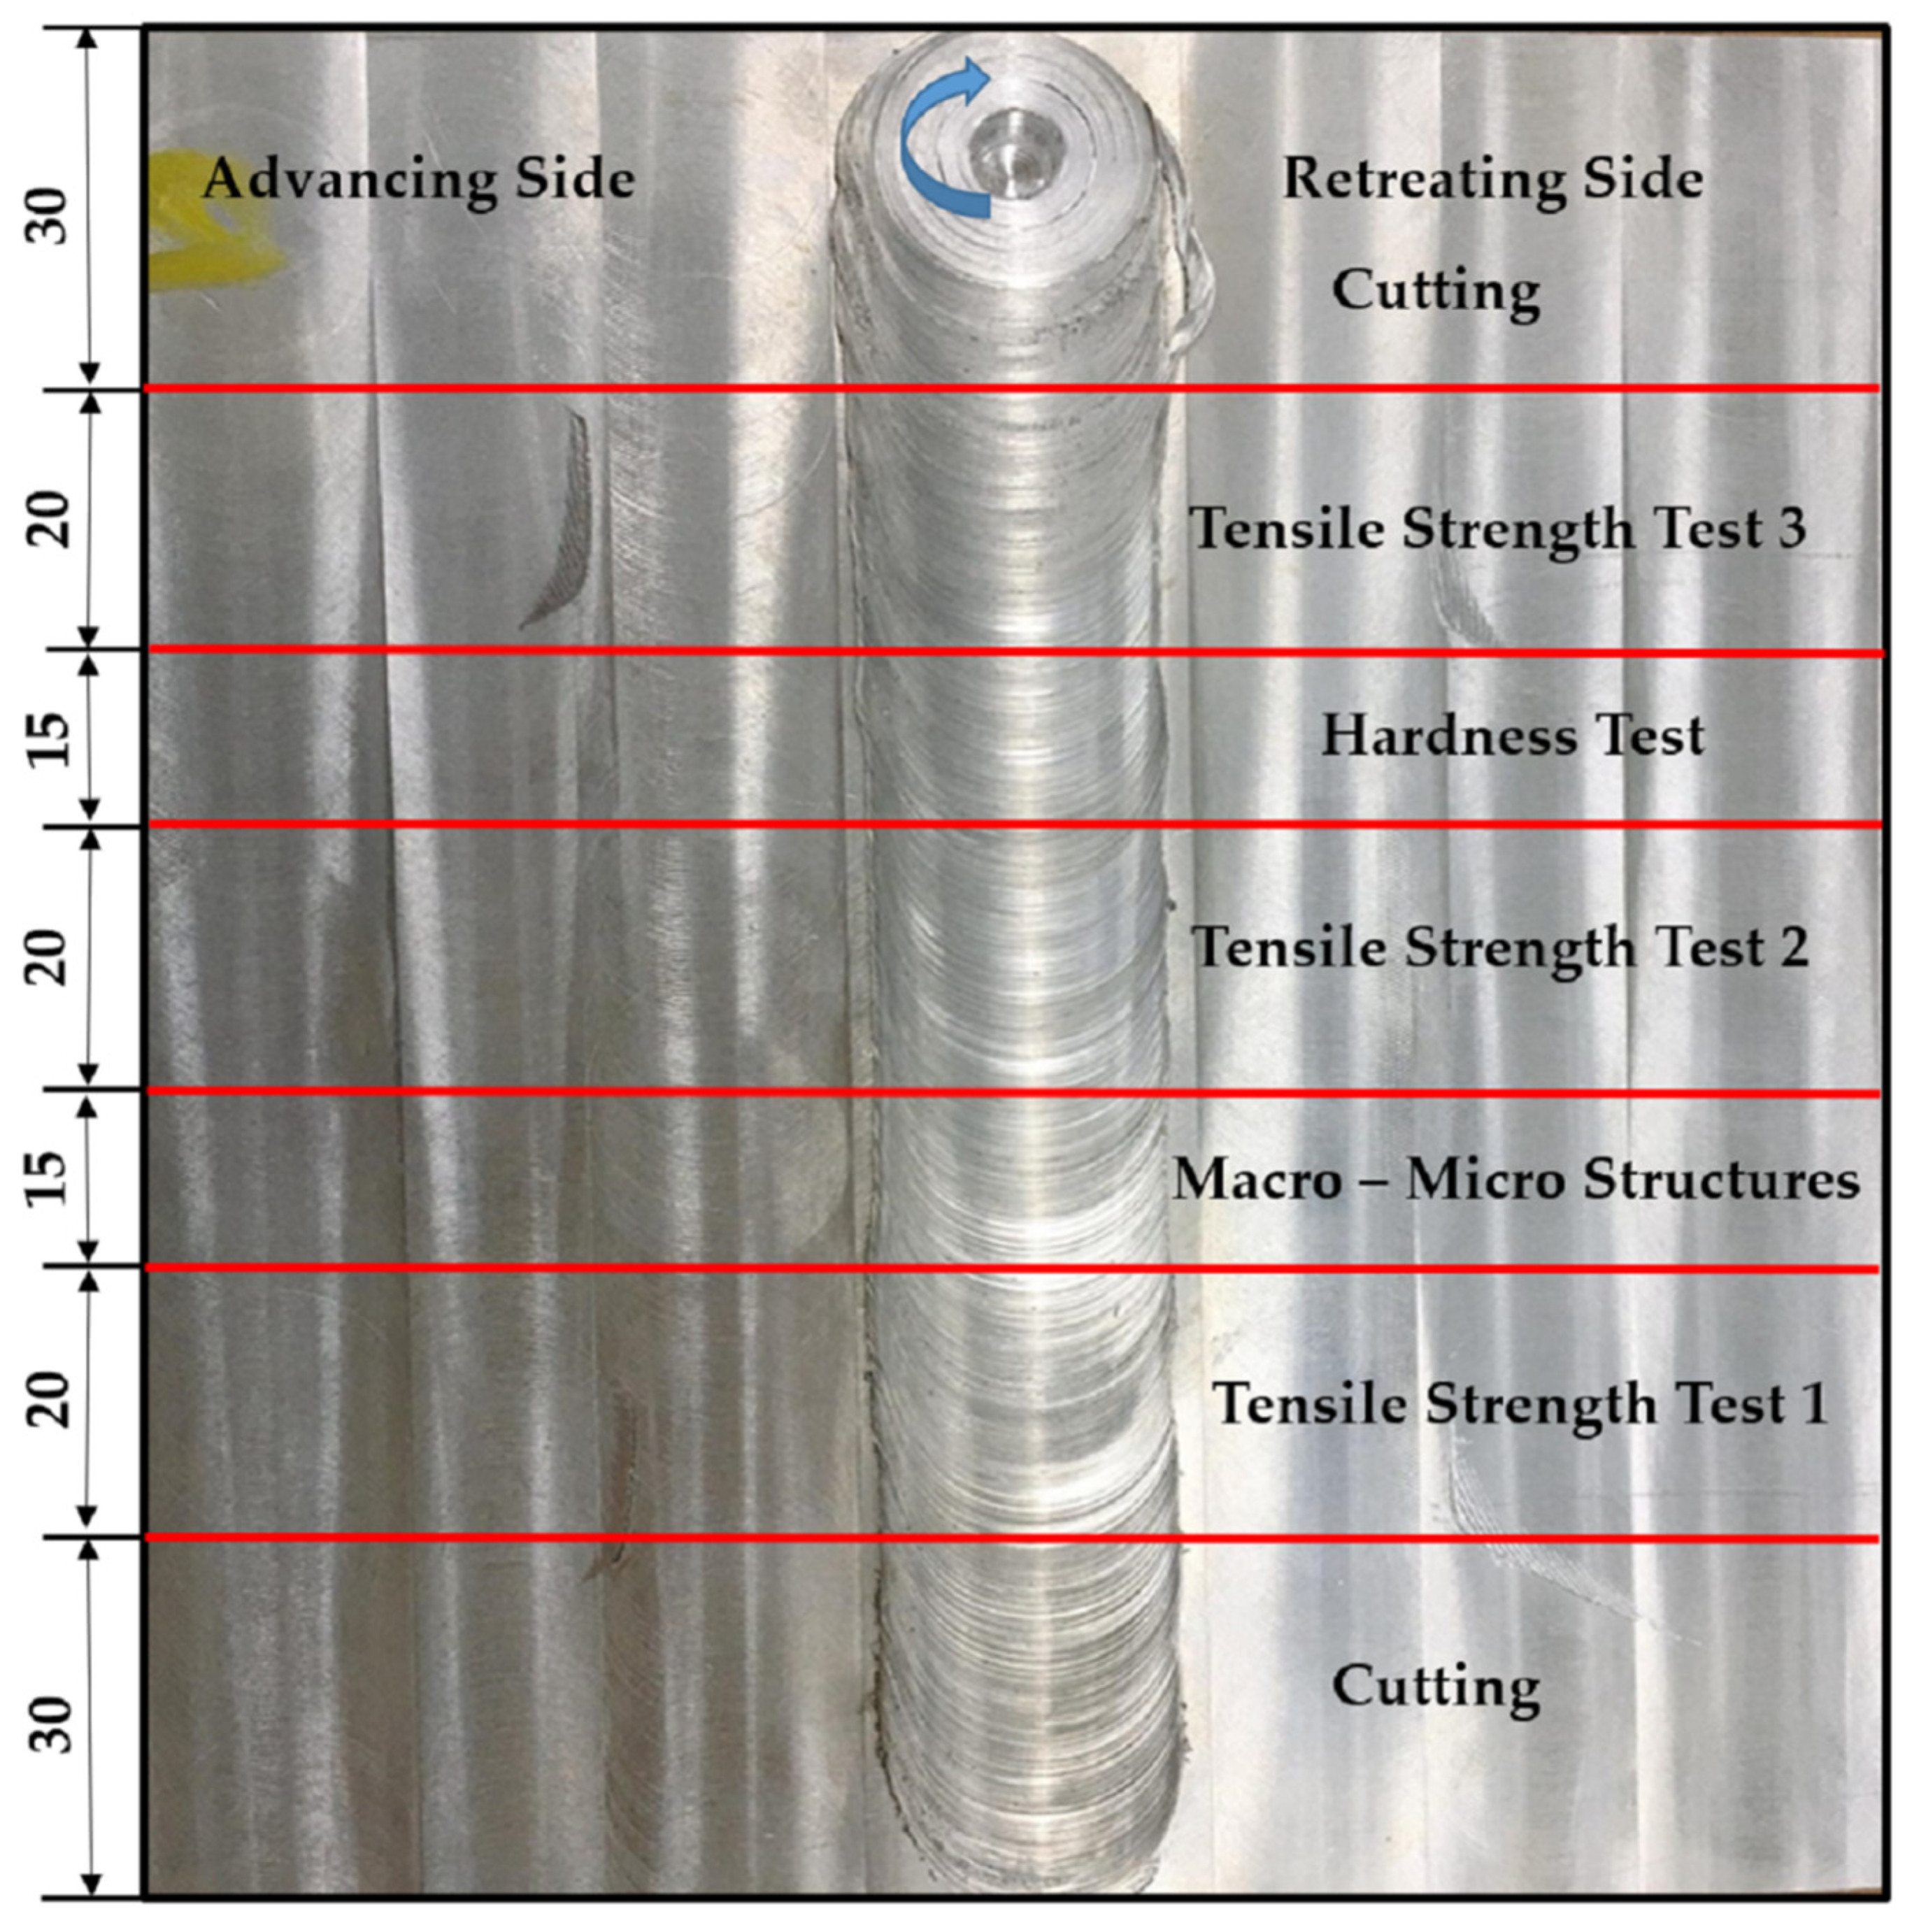
The SSM 5083 aluminum alloy specimens manufactured using the FSW process were prepared for mechanical property testing and analysis of their metallurgical structures, as shown in Figure 4.
For the preparation of the tensile specimens, a HAAS TM-1 CNC VERTICAL MILLING MACHINE was used to reduce the specimen’s width; their thickness and surface features were maintained. The tensile tests were conducted using a universal testing machine (NARIN; model: NRI-CPT500-50 NARIN INSTRUMENT Co., Ltd.; Samut Prakarn, Thailand), according to the American Society for Testing of Materials standard ASTM E8M-04 [22], as shown in Figure 5.
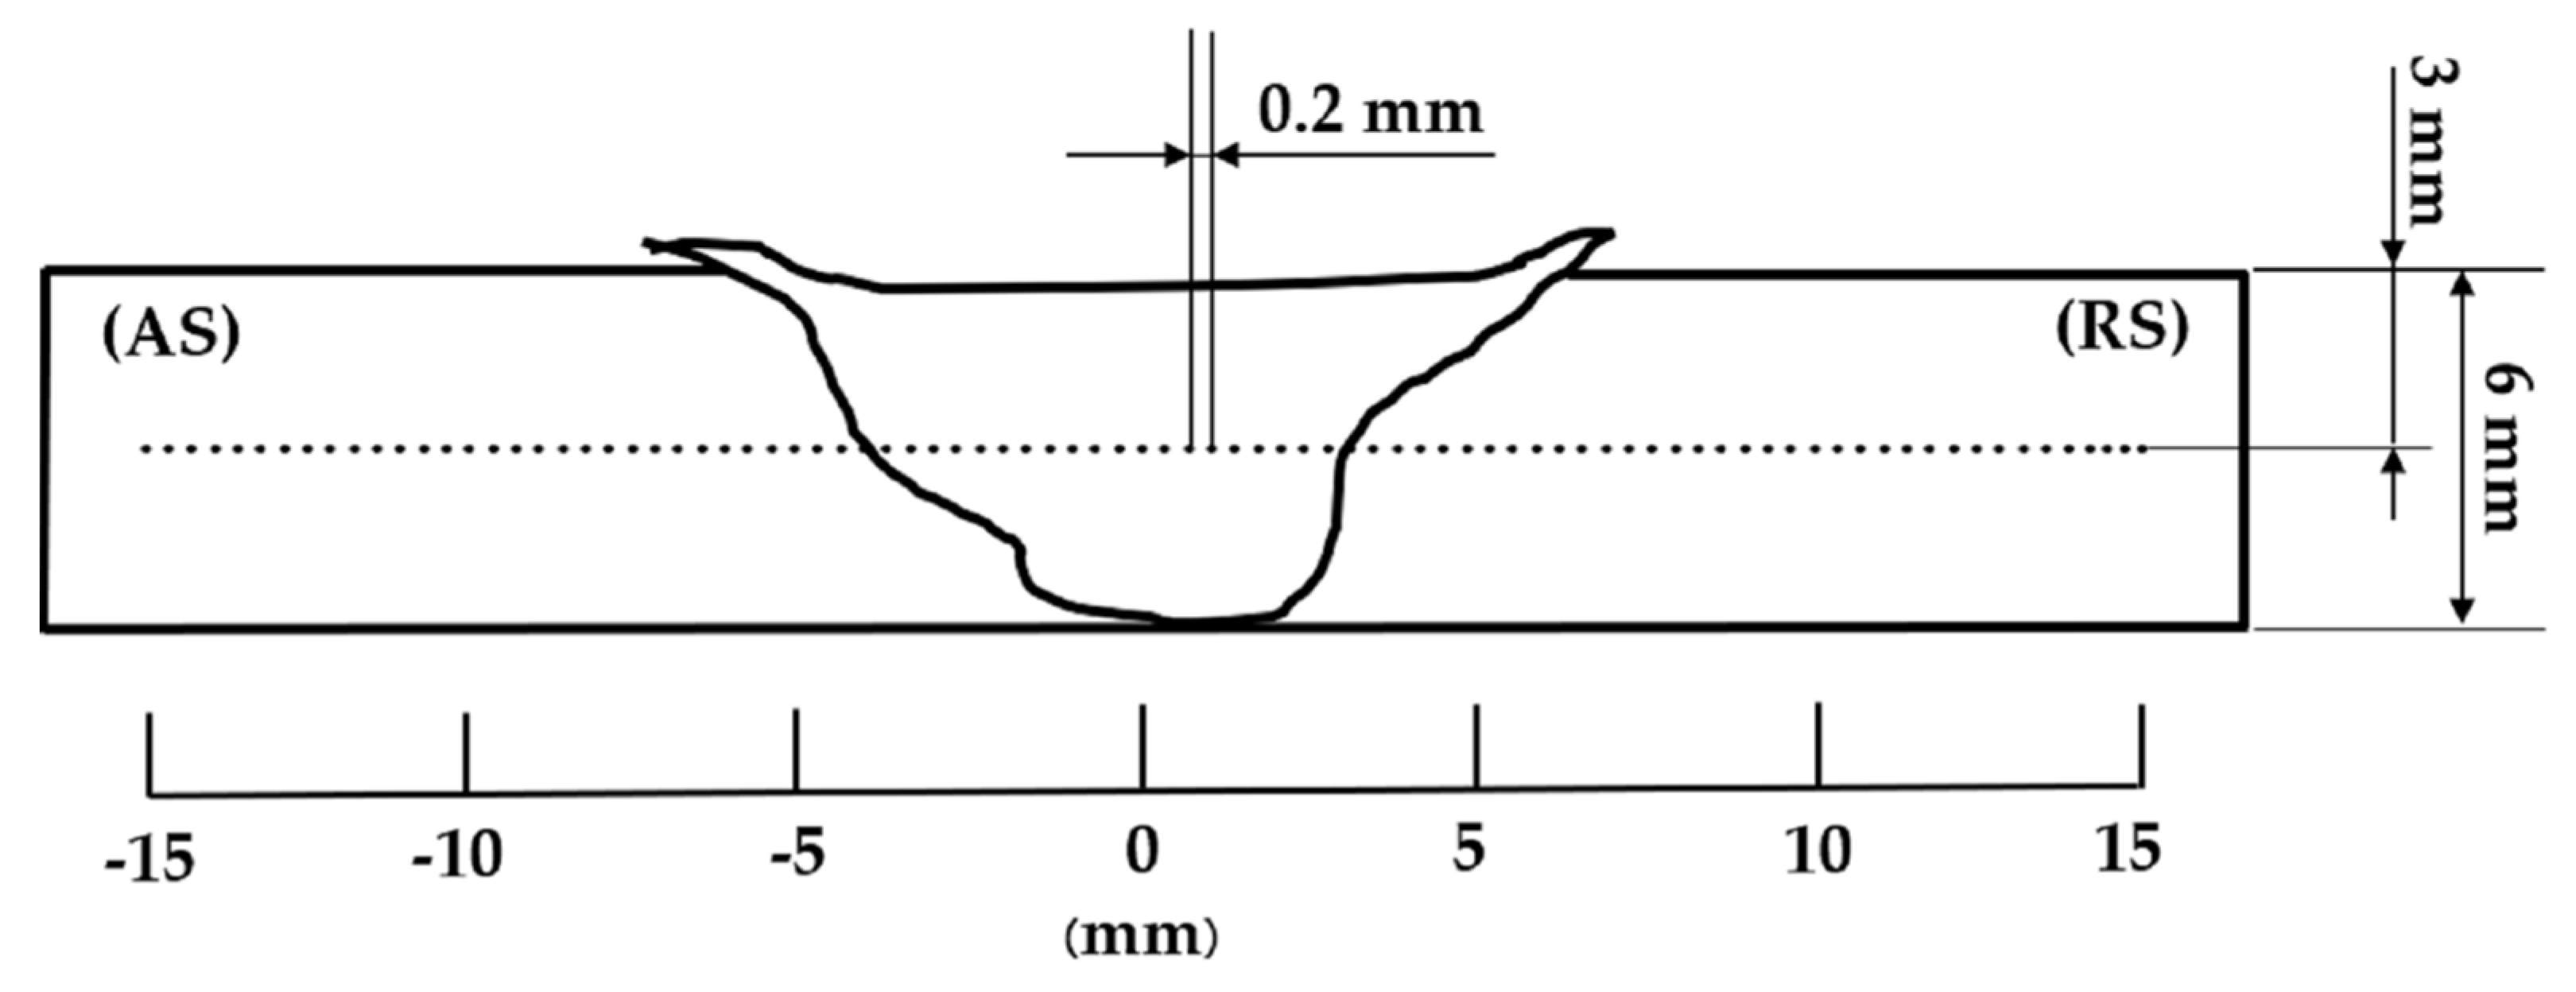
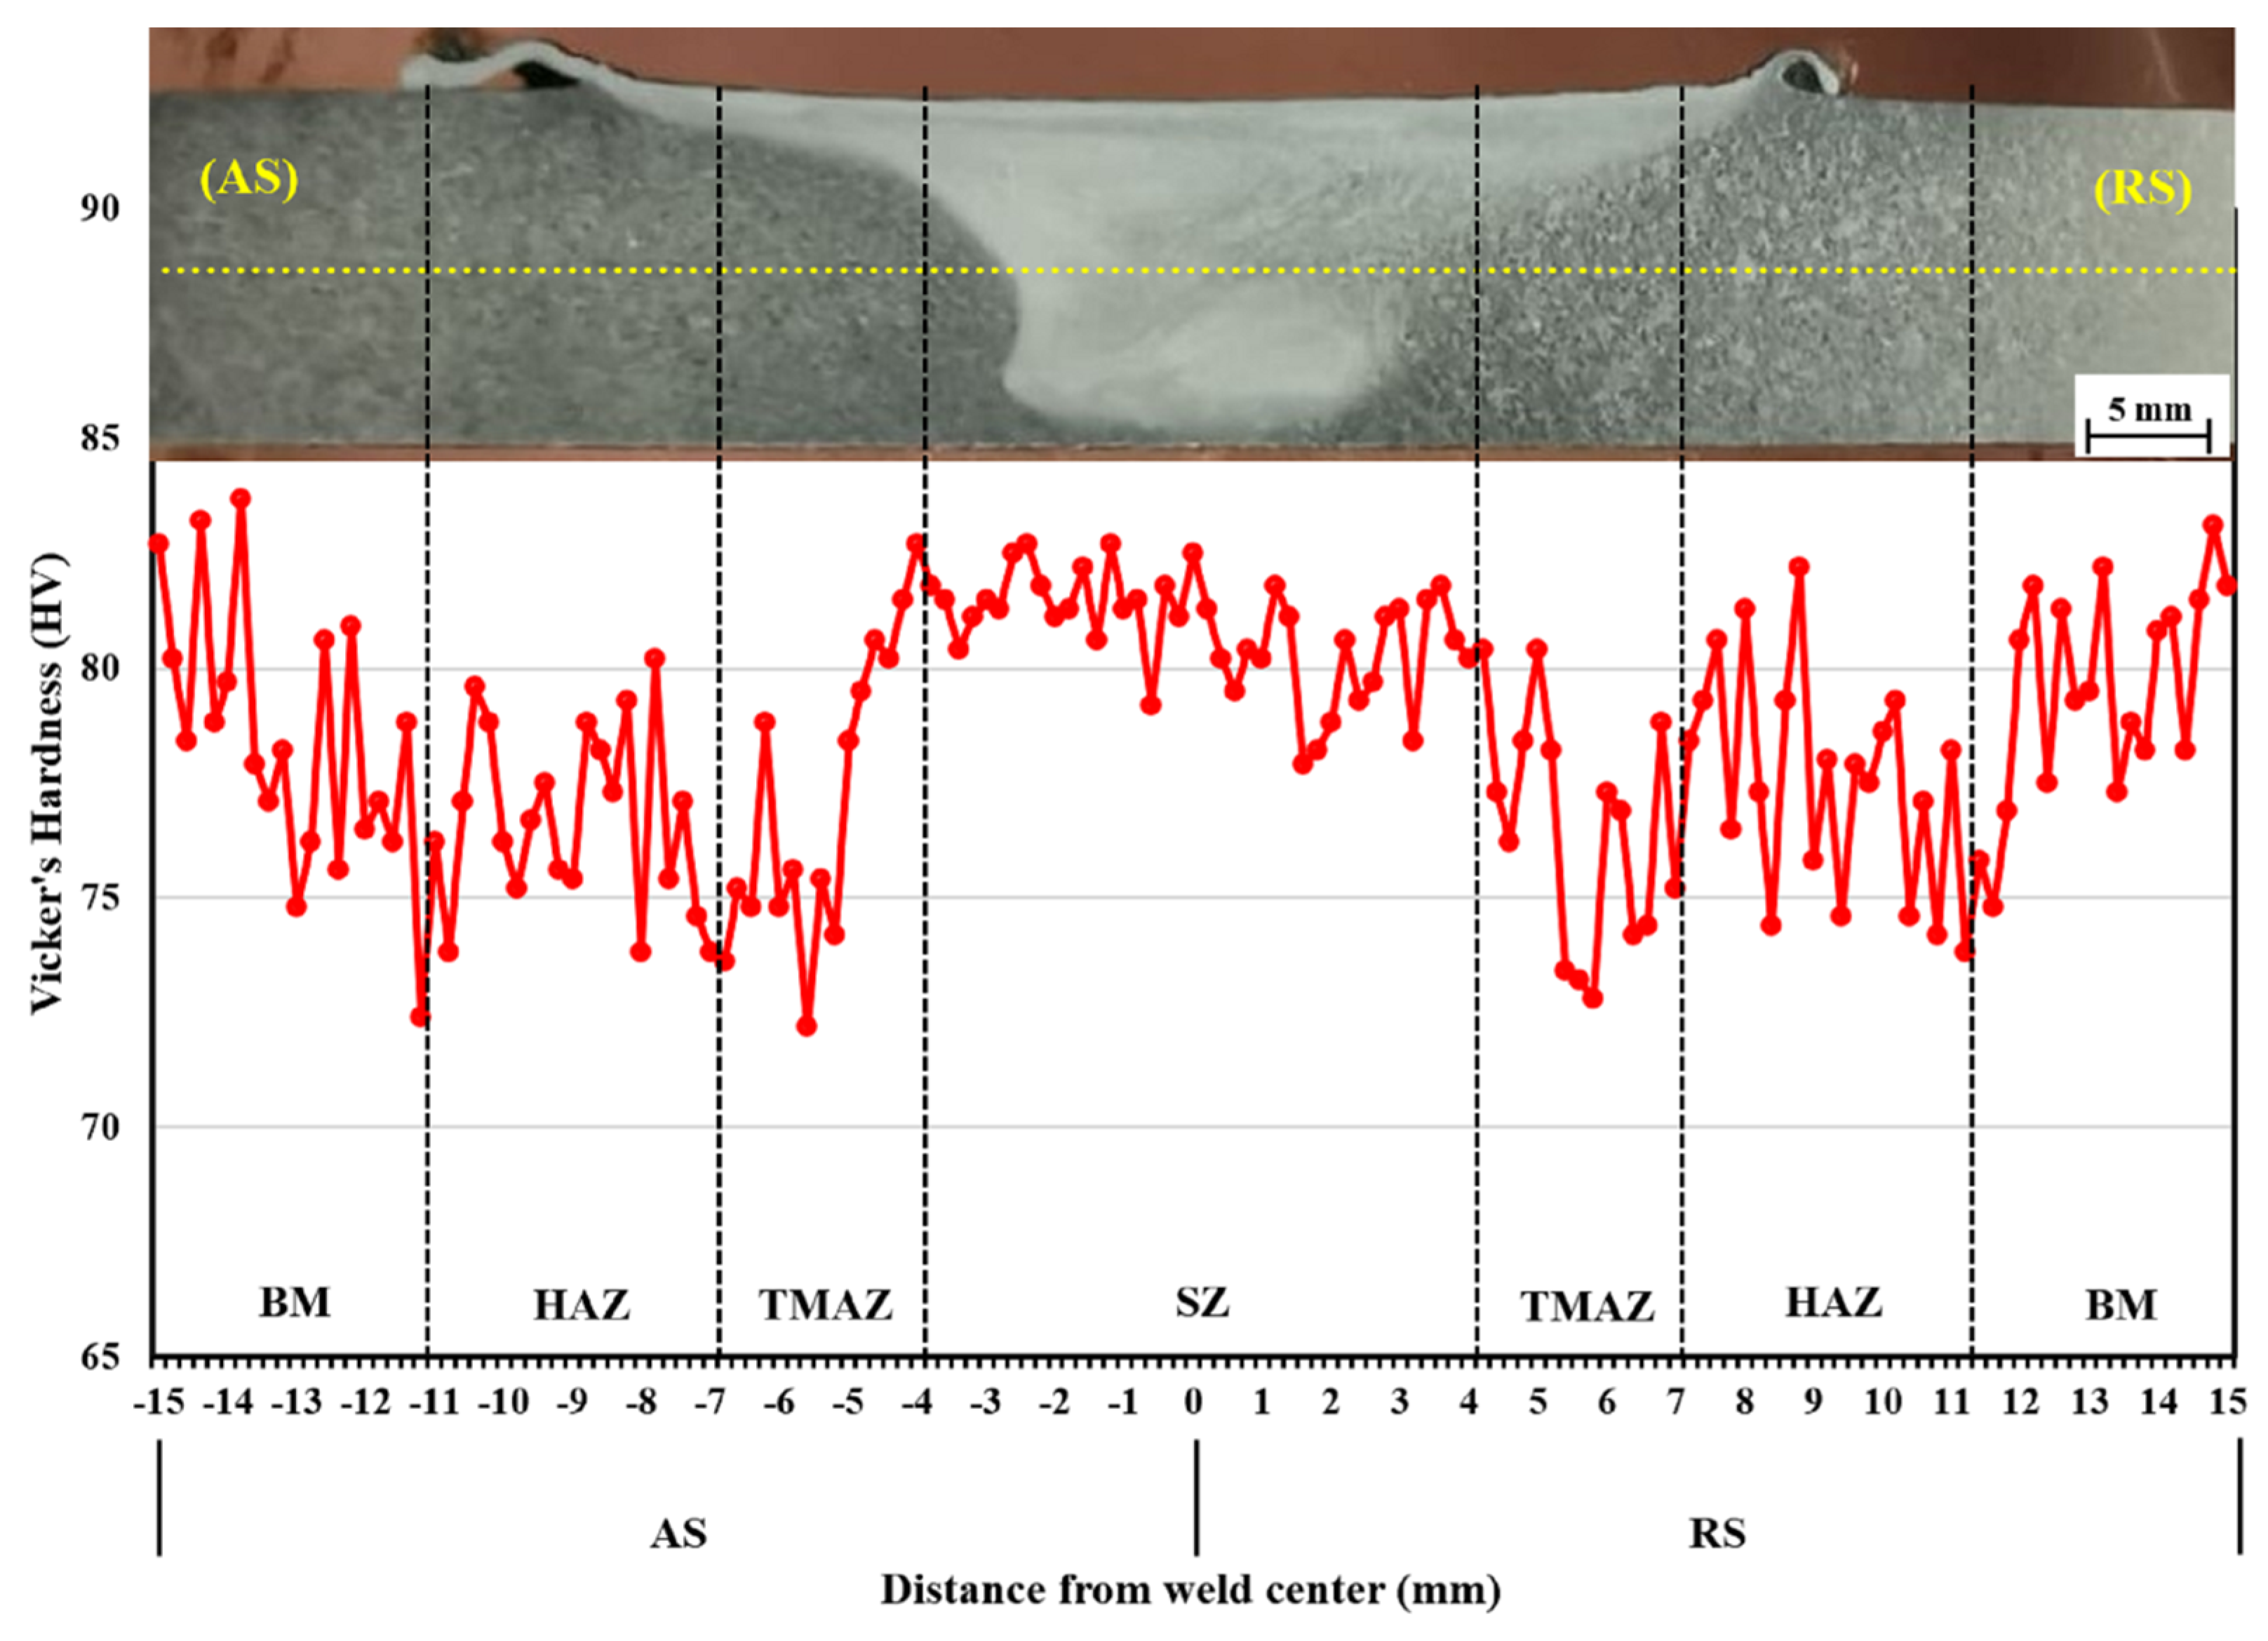
Welding hardness test was performed across the SZ, the HAZ, the TMAZ, and the BM using a Vickers’s microhardness tester (SHIMADZU: model: HMV-G Series; Tokyo, Japan) at a load of 0.2 kgf, an indentation distance of 0.2 mm, and an indentation time of 10 s. The distance between the test points was 15 mm from the center of the workpiece on both the advancing side (AS) and the retreating side (RS), as shown in Figure 6.
The specimens were prepared for macrostructural analysis using the resin aluminum casting technique. They were then polished using different grades of emery papers: from P220 to P1200. Then, the samples were polished with alumina powder (1–3 micron). Thereafter, the samples were etched with a mixture of 100 mL H2O and 3 mL HF for 25 s. Finally, they were rinsed with distilled water and wiped clean with alcohol. A hot air gun was used to blow over the samples in order to dry them faster.
The specimens were prepared for microstructural analysis with the same procedure as macrostructural workpieces, except that the samples were etched with the mixture of 190 mL H2O, 5 mL HNO3, 3 mL HCl, and 2 mL HF for 10 s. These chemicals were obtained from UBU Materials Laboratory, Ubon Ratchathani University, Ubon Ratchathani, Thailand. An optical electron microscope (LEICA; model: SDM2500M; Wetzlar, Germany) was used to observe the microstructure of the welded joint at the HAZ, the TMAZ, and the SZ. It was equipped with SEM (FEI; model: Quanta 450 FEG; Zurich, Switzerland). EDS (Oxford Instruments; model: X-Max 50; Oxford, UK) was used to analyze the chemical composition.

2.4. Experimental Design with the Taguchi Method

The Taguchi method, which combines experiment design theory and the quality loss function concept, is widely utilized in engineering analyses and the development of robust products and processes. This method helps one to acquire data in a controlled way, while avoiding the effort and cost of conducting experiments, i.e., it saves experimental time, reduces the cost, and establishes the significant factors quickly [23]. In this research, Taguchi’s L9 orthogonal array, which comprises nine experiments corresponding to a number of tests with three factors on three levels, was conducted for different parameters; namely, rotational speed, welding speed, and tool profile, as shown in Table 1.

3. Results and Discussion

3.1. Signal-to-Noise Ratio (S/N Ratio)

The signal-to-noise ratio (S/N ratio) was analyzed for each level of the process parameters, wherein a higher S/N ratio indicates a better weld quality characteristic (the higher, the better) [24,25]. Therefore, the optimal process parameter was the one with the highest S/N ratio. The equation used to calculate the S/N ratio is shown below.
S / N = 10 l o g 10 1 n i = 1 n 1 y i 2
The two output parameters were the tensile strength and hardness value in the SZ of the welded joints. The mean scores and S/N ratio of the tensile strength are presented in Table 2. The S/N mean scores and S/N ratio of the tensile strength are shown in Table 3 and Table 4. The mean scores and S/N ratio of the hardness value in the SZ are shown in Table 5. The S/N mean scores and S/N ratio of the hardness value in the SZ are presented in Table 6 and Table 7.

3.1.1. S/N Ratio for Tensile Strength

The optimal FSW process parameters for the successful friction stir welding of aluminum alloy SSM 5083 obtained from the tensile strength and the S/N ratio were as follows: A1B1C2: a rotational speed of 1000 rpm, a welding speed of 10 mm/min, and with a threaded cylindrical tool pin profile.
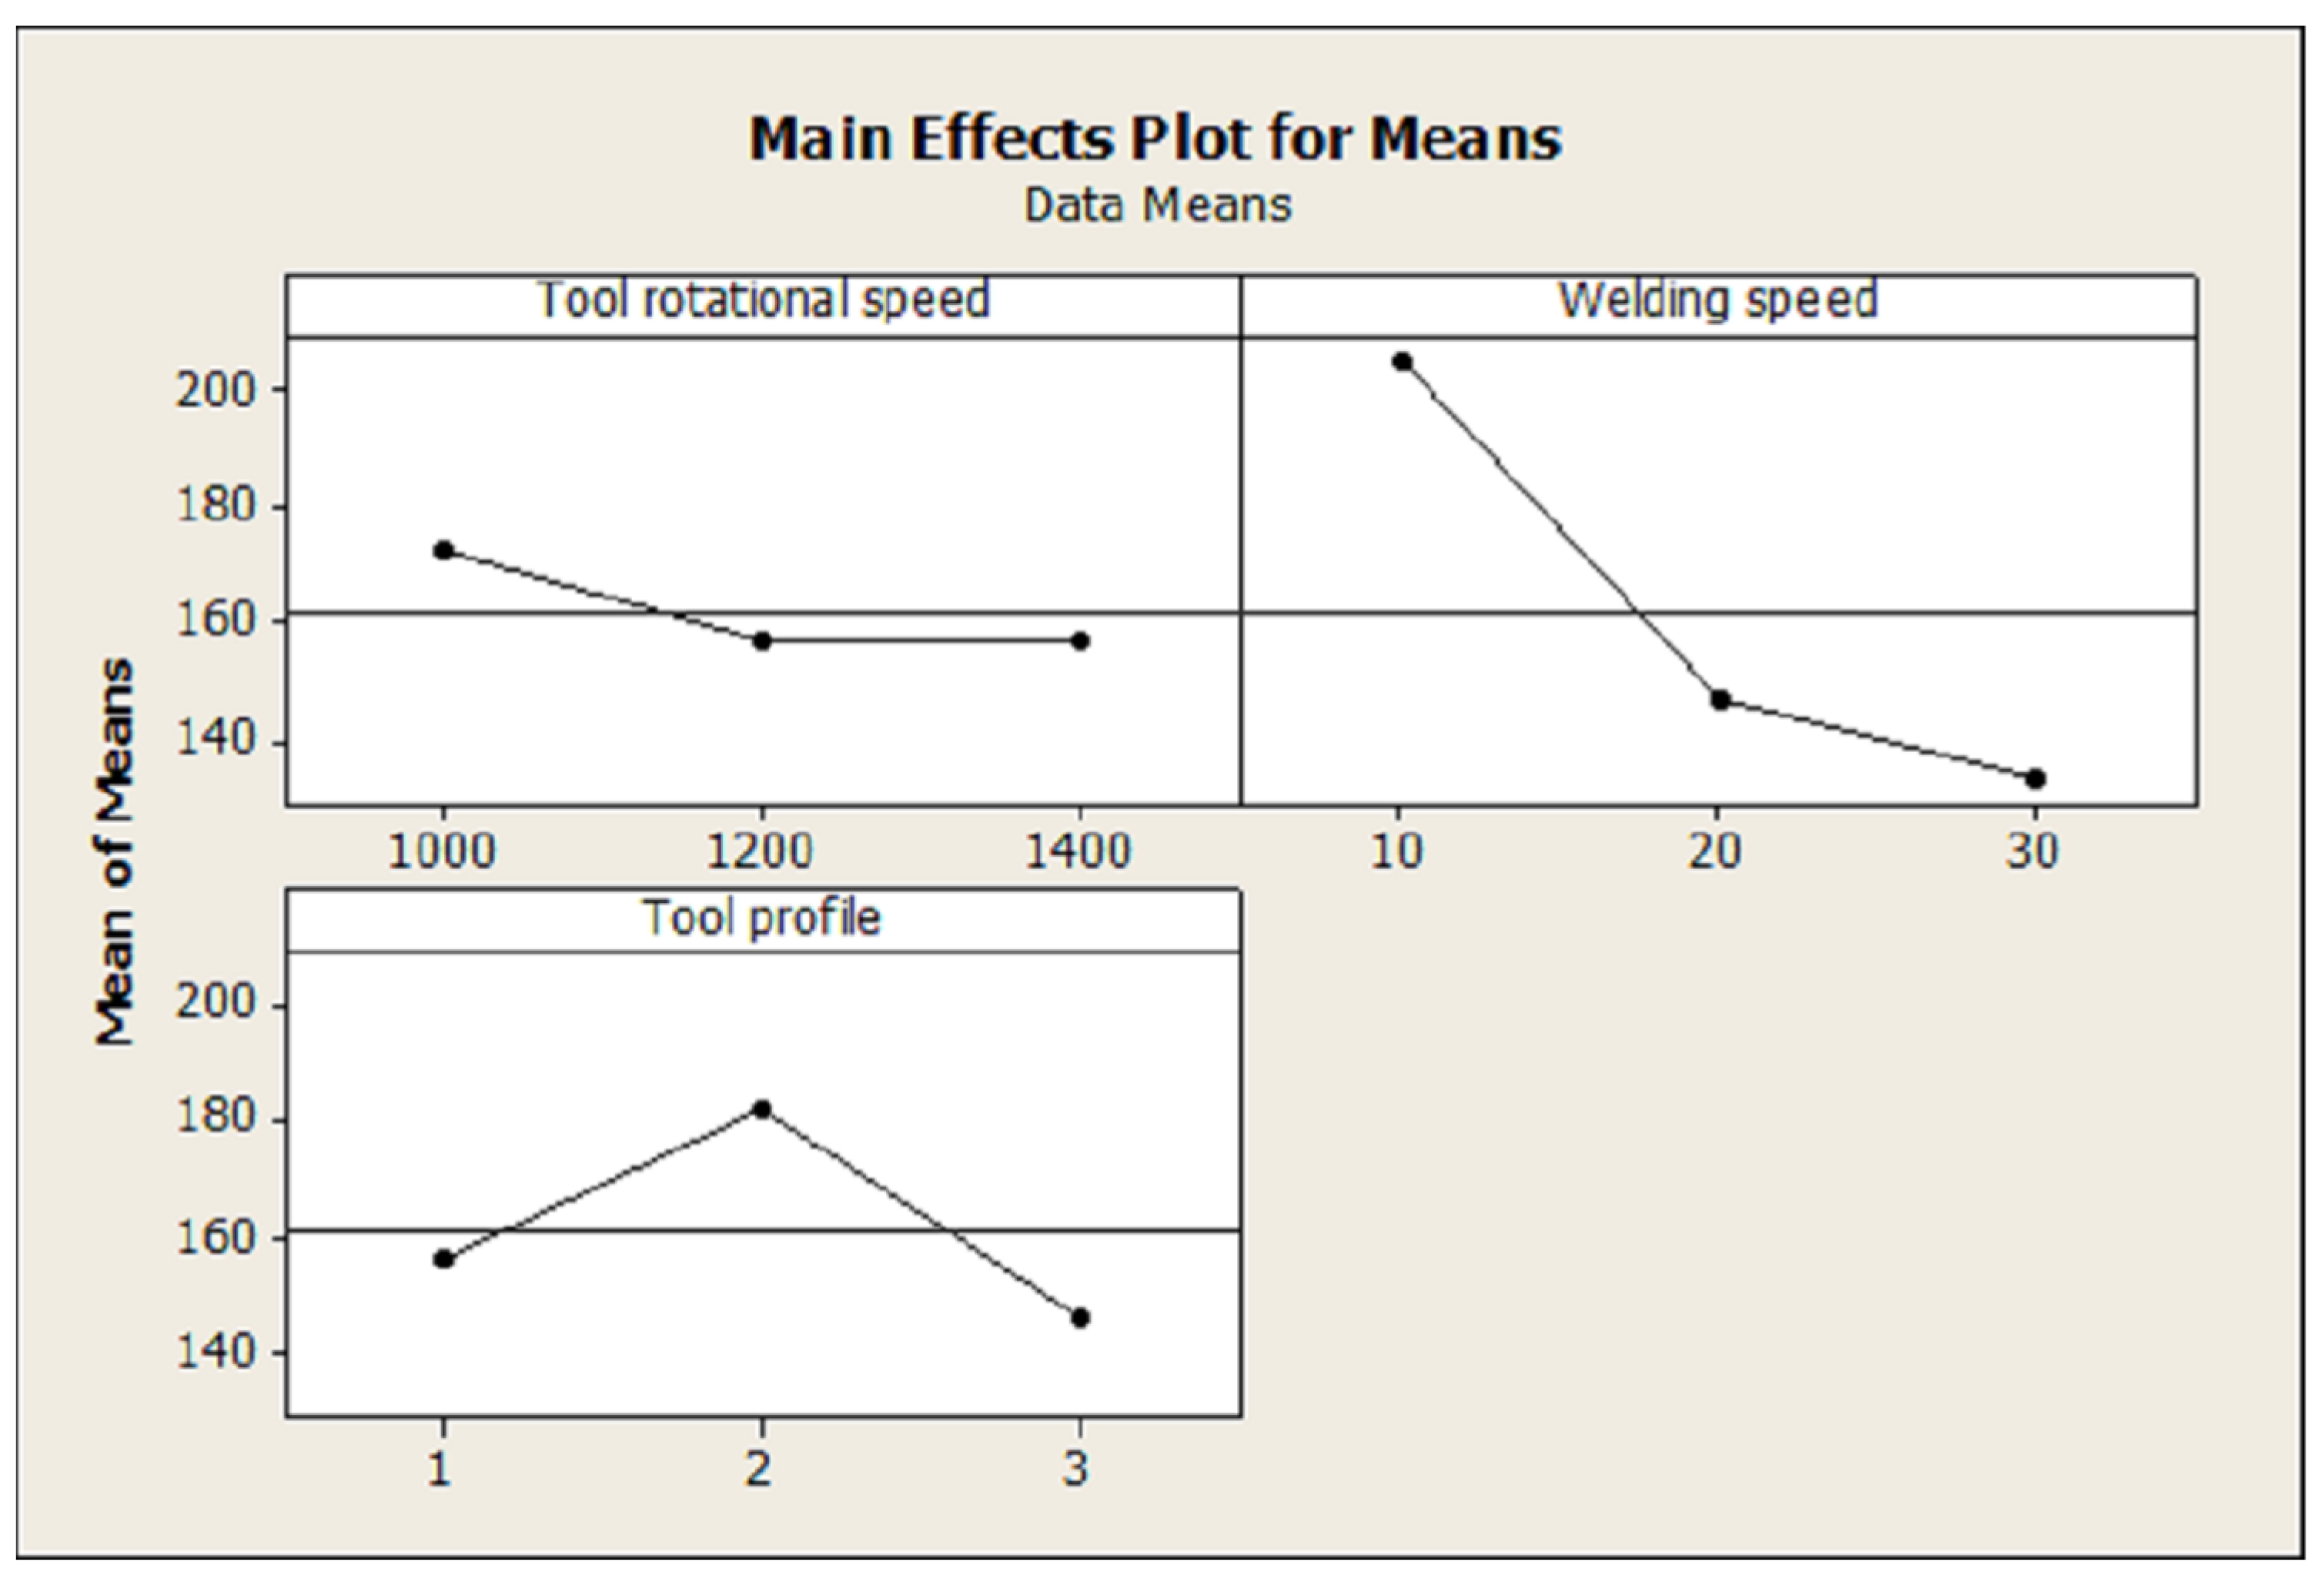
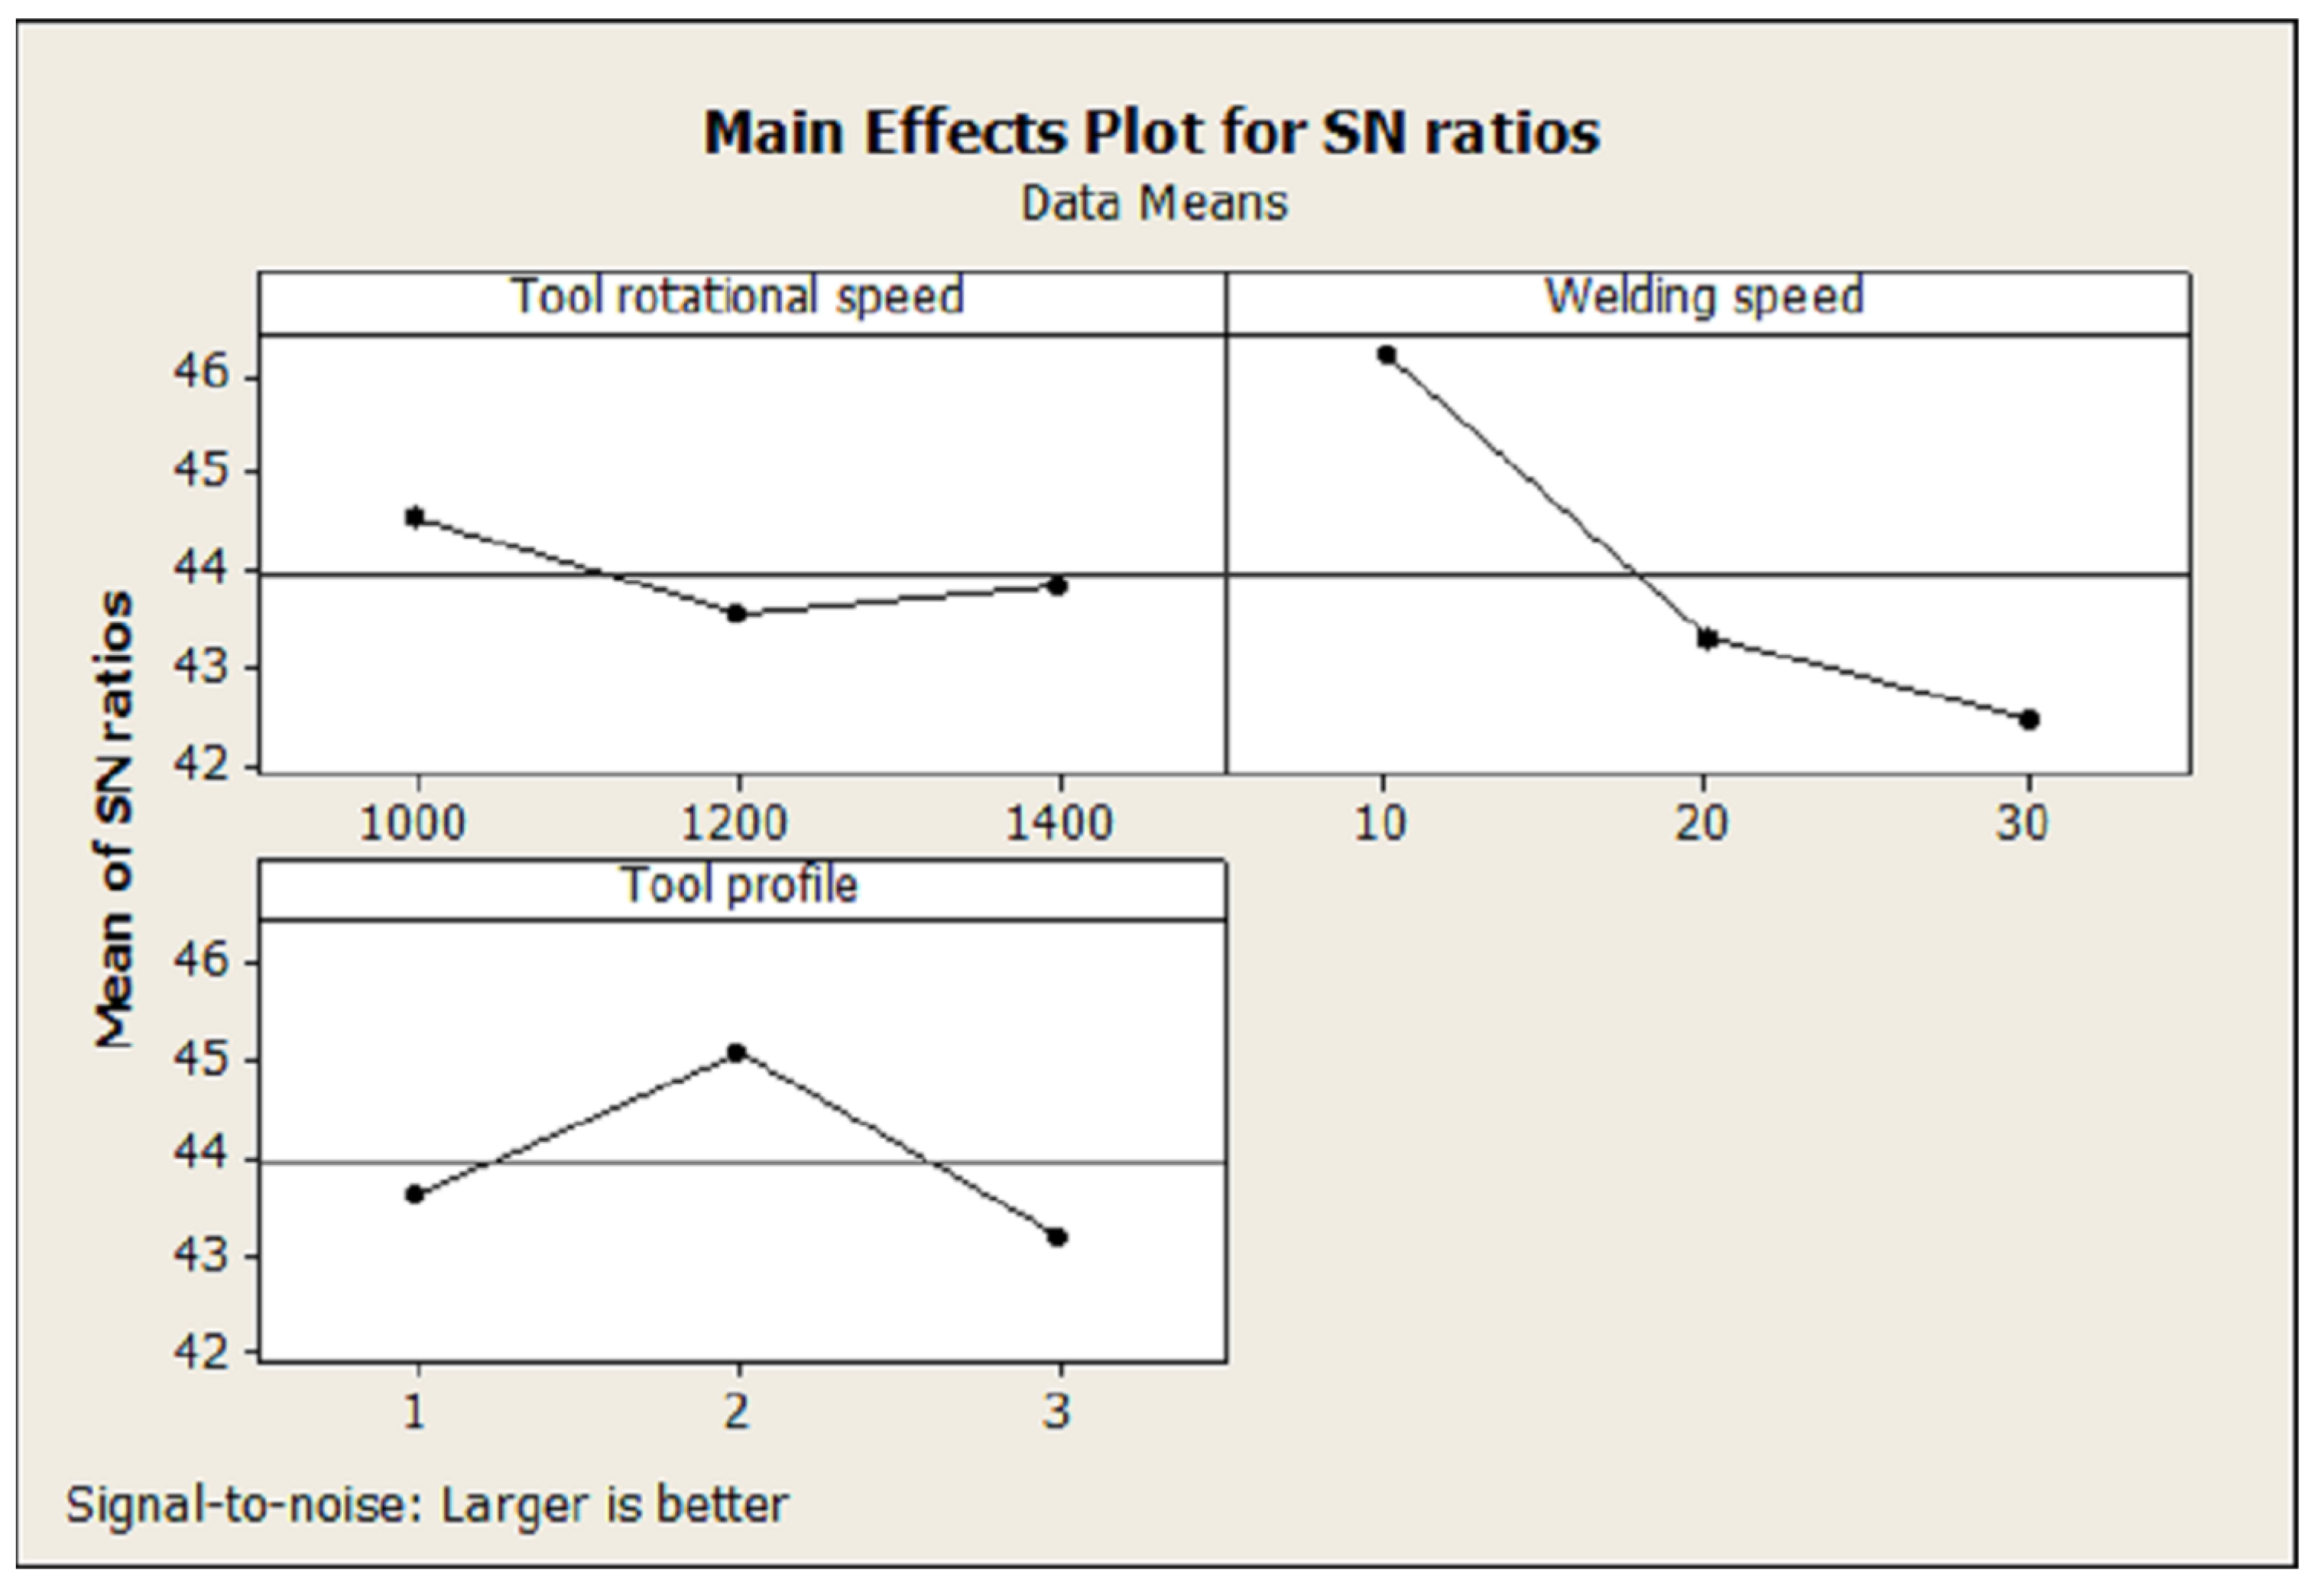
The main effects plot for the means for tensile strength is shown in Figure 7. It was found that the tensile strength reached its maximum at a rotational speed of 1000 rpm, a welding speed of 10 mm/min, and with a threaded cylindrical tool pin profile.
The main effects plot for the S/N ratio means is shown in Figure 8. It was found that the maximum S/N ratio was at a rotational speed of 1000 rpm, a welding speed of 10 mm/min, and with a threaded cylindrical tool pin profile.
Table 3 shows the response table for the means for tensile strength. It was found that the level 1 rotational speed maximum response was at 172.0, the level 1 welding speed maximum response was at 204.7, and the level 2 tool pin profile maximum response was at 181.7.
Table 4 shows the response table for the means for the S/N ratio against tensile strength. It was found that the level 1 rotational speed maximum response was at 44.53, the level 1 welding speed maximum response was at 46.81, and the level 2 tool pin profile maximum response was at 45.08.

3.1.2. S/N Ratio for the Hardness in the SZ

The optimal FSW process parameters for the successful friction stir welding of aluminum alloy SSM 5083 obtained from the hardness in the SZ and the S/N ratio were as follows: A2B1C2: a rotational speed of 1200 rpm, a welding speed of 10 mm/min, and with a threaded cylindrical tool pin profile.
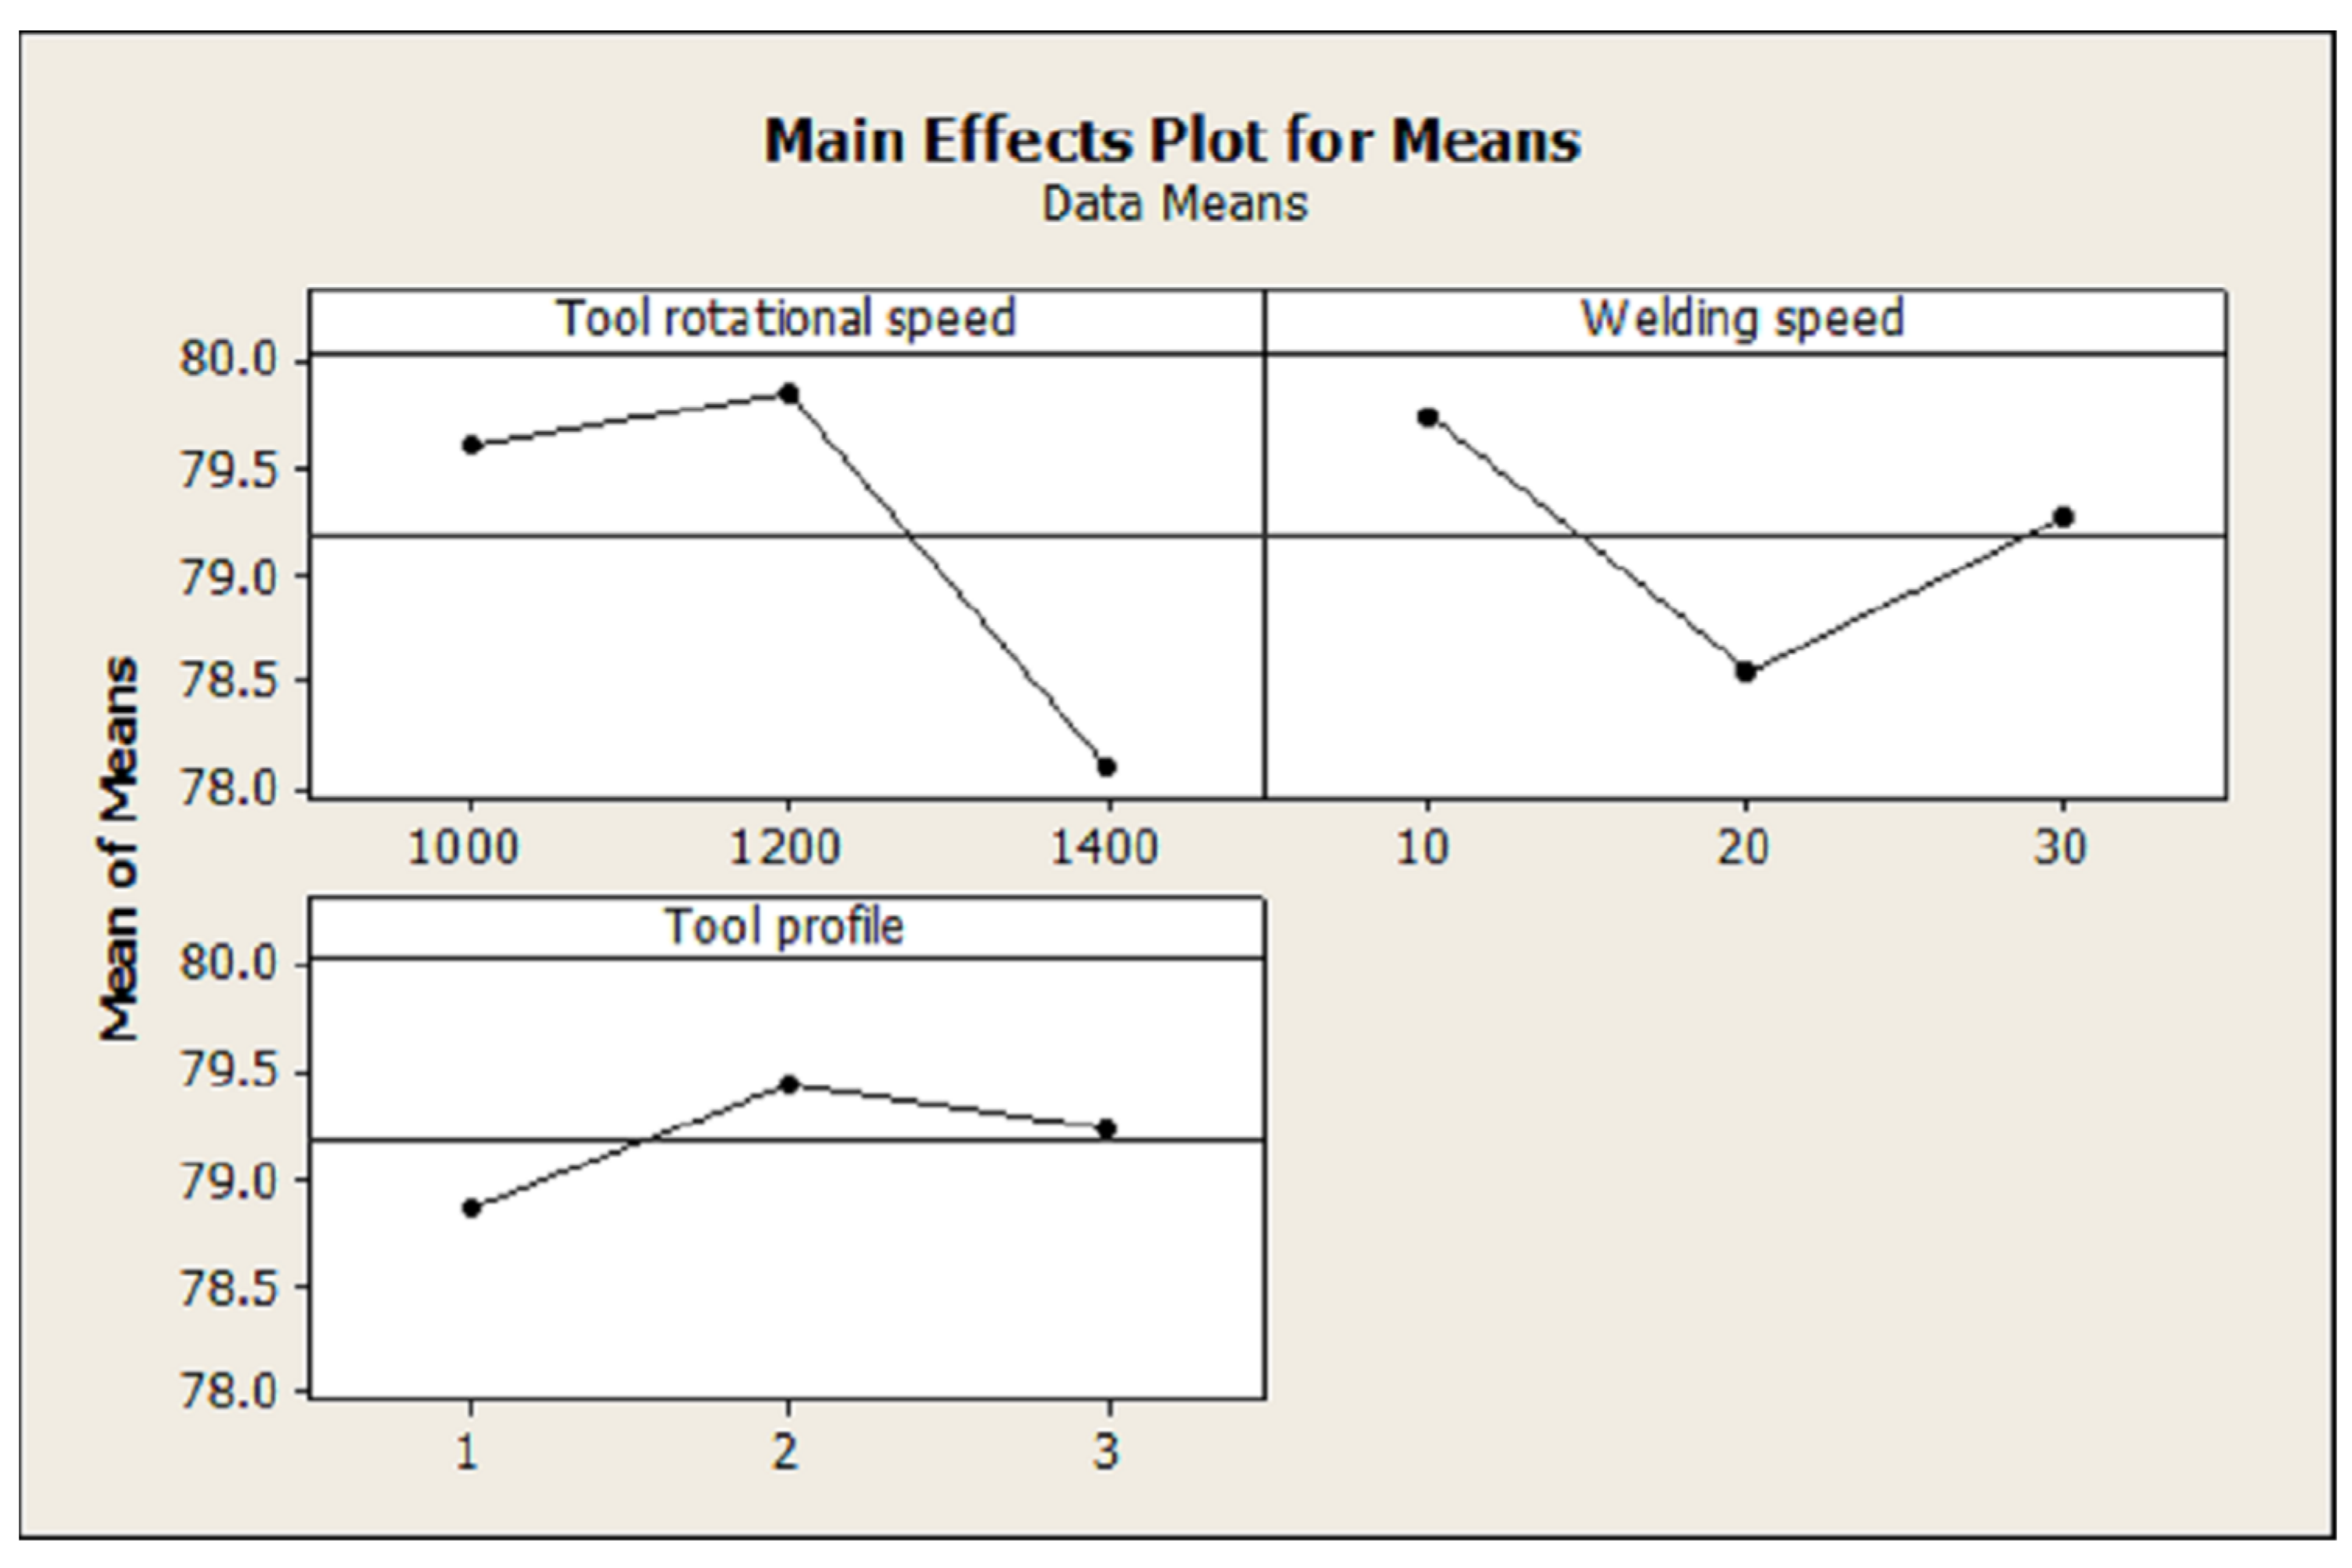
The main effects plot for the means of the hardness in the SZ is shown in Figure 9. It was found that the maximum hardness in the SZ was at a rotational speed of 1200 rpm, a welding speed of 10 mm/min, and with a threaded cylindrical tool pin profile.
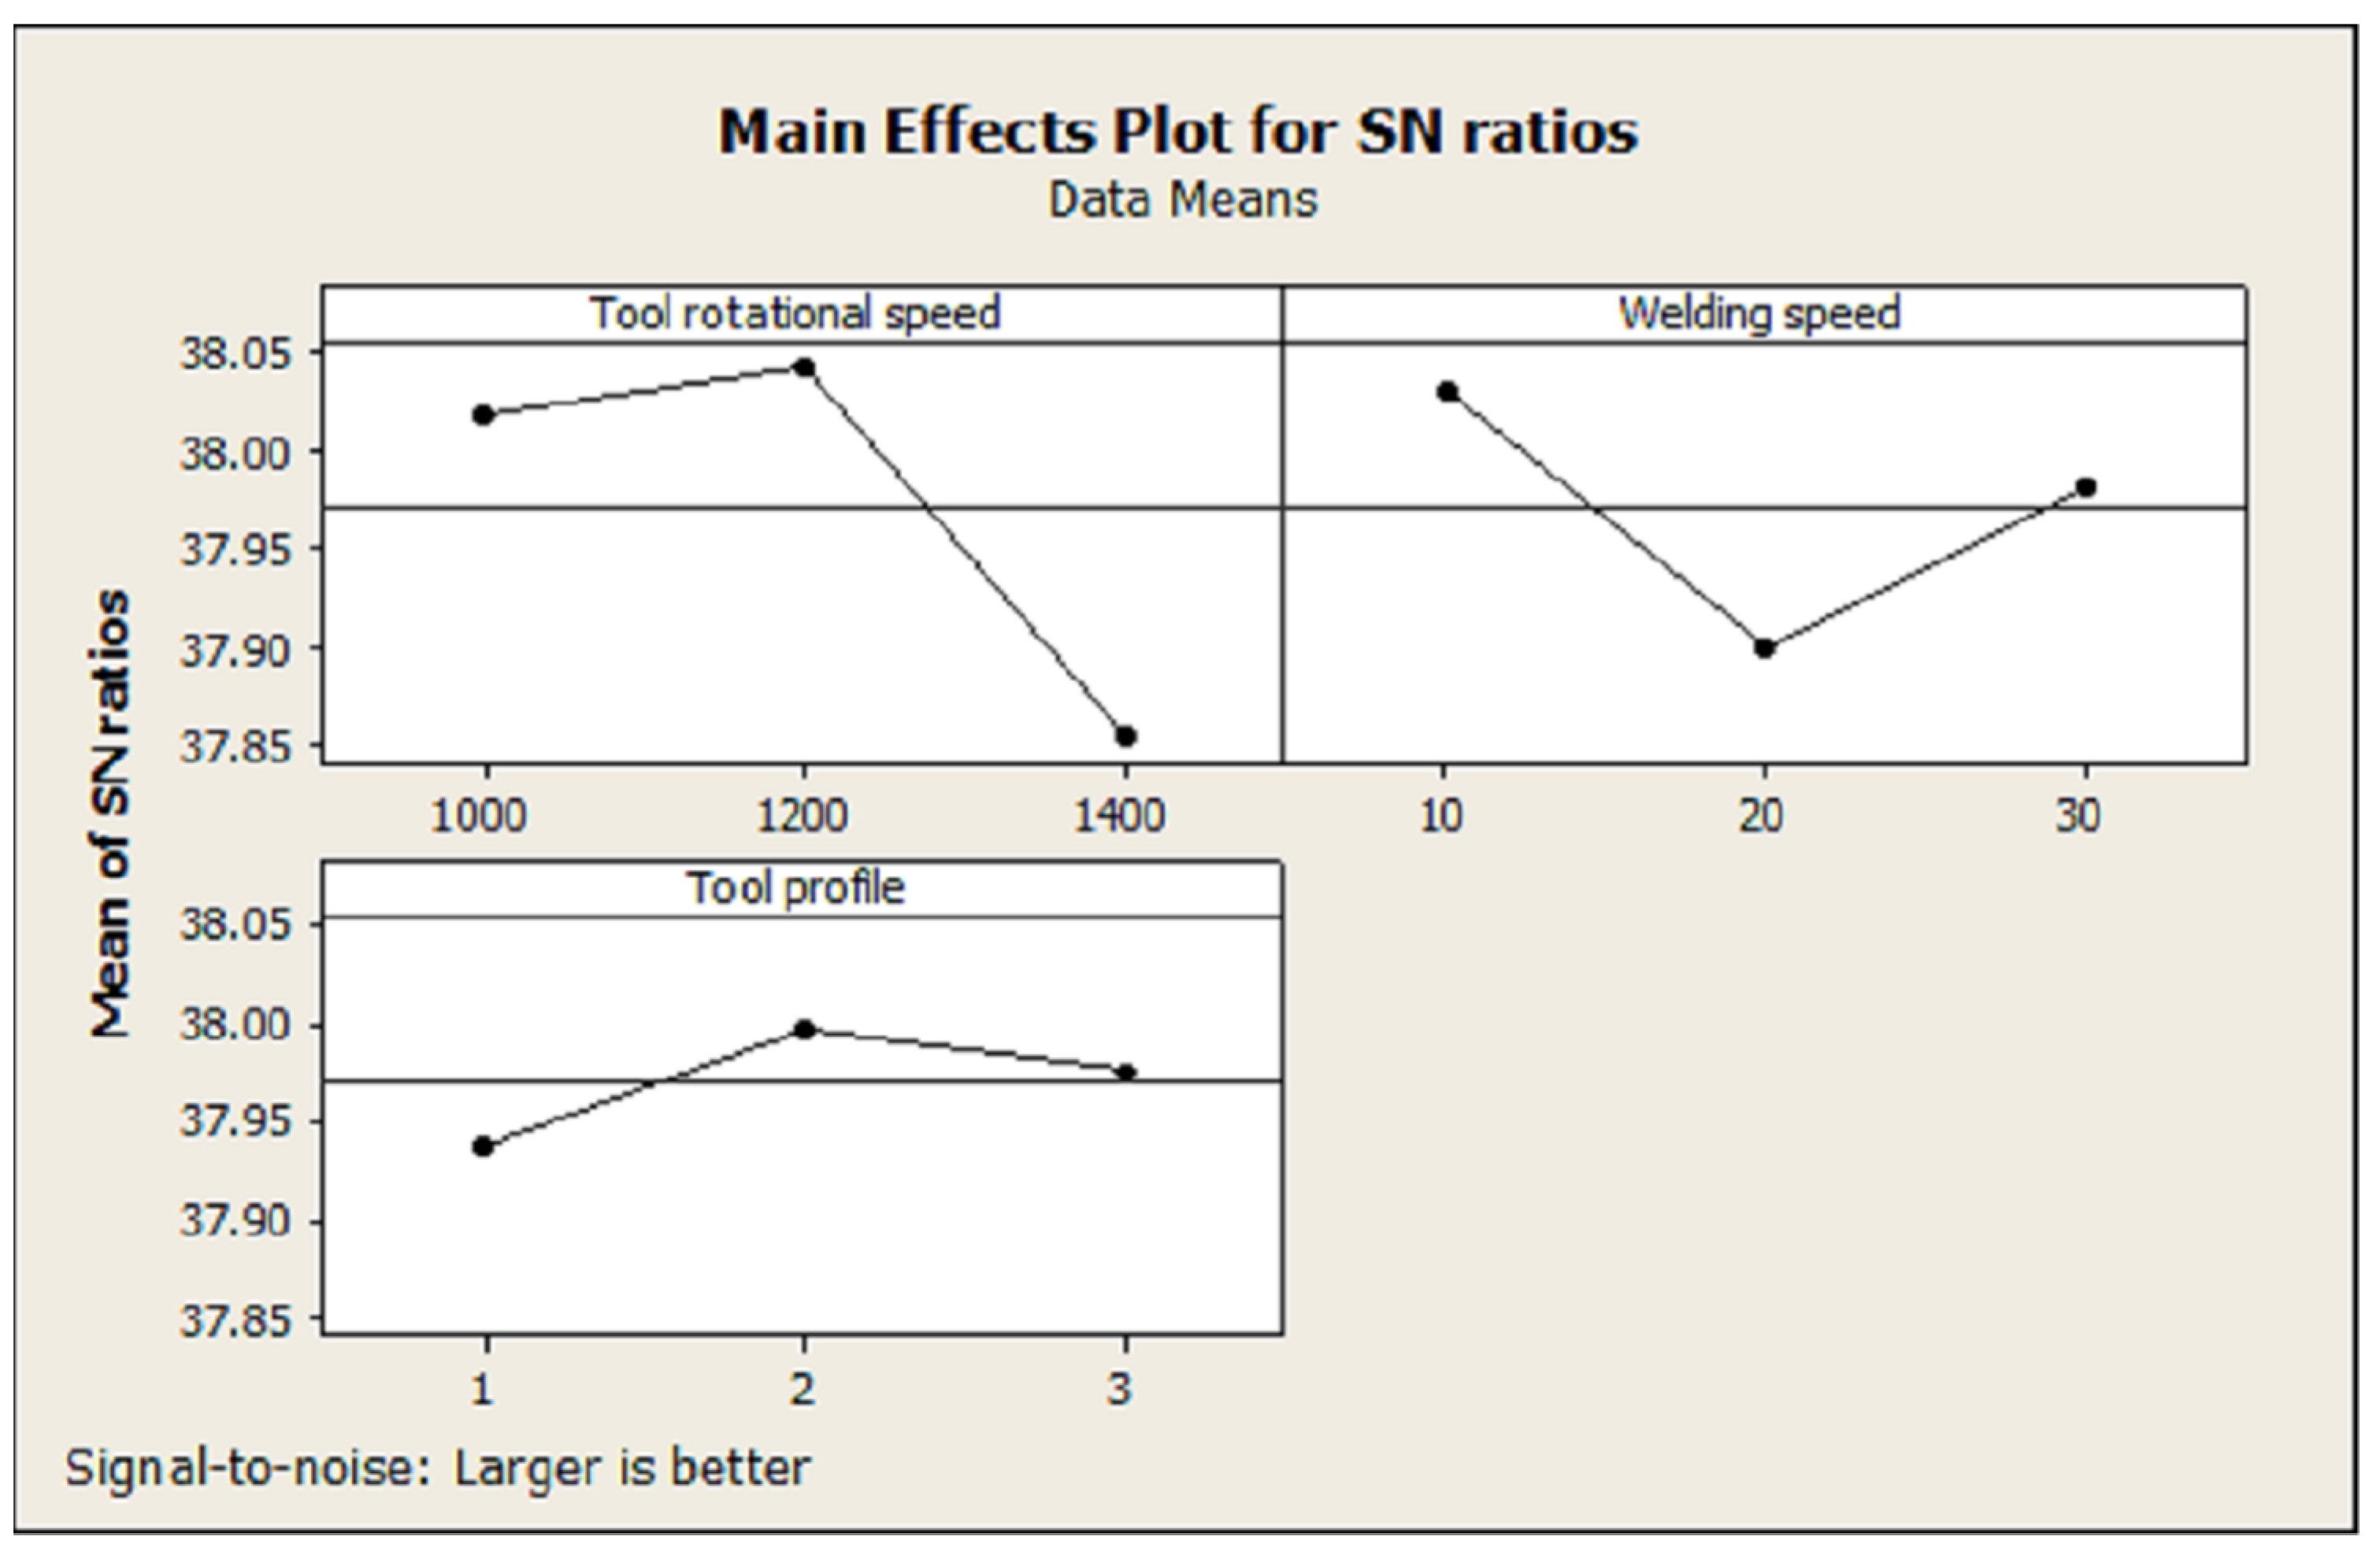
The main effects plot for the means of the S/N ratio is shown in Figure 10. It was found that the maximum S/N ratio was at a rotational speed of 1200 rpm, a welding speed of 10 mm/min, and with a threaded cylindrical tool pin profile.
Table 6 shows the response table means for the hardness in the SZ. It was found that that the level 2 rotational speed maximum response was at 79.83, the level 1 welding speed maximum response was at 79.73, and the level 2 tool pin profile maximum response was at 79.43.
Table 7 shows the response table means for the S/N ratio. It was found that the level 2 rotational speed maximum response was at 38.04, the level 1 welding speed maximum response was at 38.03, and the level 2 tool pin profile maximum response was at 38.00.

3.2. Analysis of Variance (ANOVA)

The percentage contribution of each parameter was determined by ANOVA, i.e., by applying a statistical treatment to the results of the experiments. Table 8, Table 9, Table 10 and Table 11 show the results obtained from the ANOVA for the tensile strength and hardness in the SZ. The result proves that the most significant process parameter influencing the tensile strength at a 95% confidence level was welding speed. Contrarily, no parameter (rotational speed, welding speed, or tool profile) influenced the hardness in the SZ. This corresponds to the results of the hardness values in the SZ of nine samples in the FSW of SSM 5083 aluminum alloy, which are approximately the same as those shown in Table 5.
Table 8 shows the results obtained by the ANOVA for the tensile strength calculated using mean values. In general, concerning the probability distribution, the degrees of freedom (DF) were used to identify the number of variables for the calculation by the ANOVA. At DF = 2, it was found that the coefficient of determination (R-Sq) = 98.3%, indicating that all parameters, i.e., rotational speed, welding speed, and tool profile, were significant process parameters. The parameter delivering the highest sequential sum of squares (Seq SS), adjusted sum of squares (Adj SS), adjusted mean squares (Adj MS), F-value, and percentage contribution is the most significant parameter. Herein, the welding speed was the most significant parameter with the highest values. Moreover, a parameter with a value of p ≤ 0.05 becomes significant. Therefore, the most significant process parameter influencing the tensile strength at a 95% confidence level was the welding speed.
Table 9 shows the results obtained by the ANOVA for the tensile strength calculated using the S/N ratio. At DF = 2, it was found that (R-Sq) = 98.5%, indicating that all parameters, i.e., rotational speed, welding speed, and tool profile, were significant process parameters. Herein, the welding speed was the most significant parameter with the highest values. Moreover, a parameter with a value of p ≤ 0.05 becomes significant. Therefore, the most significant process parameter influencing the tensile strength at a 95% confidence level was the welding speed.
Table 10 shows the results obtained by the ANOVA for the hardness in the SZ, calculated using mean values. At DF = 2, it was found that (R-Sq) = 43.6%, indicating that all parameters, i.e., rotational speed, welding speed, and tool profile, were insignificant process parameters. Moreover, a parameter with a value of p > 0.05 becomes insignificant. Therefore, none of the three parameters influenced the hardness in the SZ at a 95% confidence level.
Table 11 shows the results obtained by the ANOVA for the hardness in the SZ, calculated using the S/N ratio. At DF = 2, it was found that (R-Sq) = 43.4%, indicating that the rotational speed, welding speed, and tool profile were insignificant process parameters. Moreover, a parameter with a value of p > 0.05 becomes insignificant. Therefore, none of the three parameters influenced the hardness in the SZ at a 95% confidence level.

3.3. Regression Analysis

In order to establish a mathematical relationship between the parameters and tensile strength, a regression analysis was carried out using the three uncoded parameters and their interactions. From the results of the experiments, the optimal FSW process parameters were coupled with the optimal tensile strength when the rotational speed was at 1000 rpm, the welding speed was at 10 mm/min, and with the threaded cylindrical tool pin profile. The predictive tensile strength according to the Taguchi analysis was 235.22 MPa. Accordingly, a quadratic model, including linear and interaction terms, was developed, as given in the following equation:
Tensile strength = 290 − 0.0392 Rotational speed − 3.57 Welding speed − 5.2 Tool profile (MPa)
The predictive tensile strength was
Tensile strength = 290 − (0.0392 × 1000) − (3.57 × 10) − (5.2 × 2) = 204.7 MP
From the results of the experiments, the optimal FSW process parameters were coupled with the optimal hardness in the SZ when the rotational speed was at 1200 rpm, the welding speed was at 10 mm/min, and with the threaded cylindrical tool pin profile. The predictive hardness in the SZ according to the Taguchi analysis was 80.64 HV. Accordingly, a quadratic model, including linear and interaction terms, was developed, as given in the following equation:
Hardness = 83.8 − 0.00375 Rotational speed − 0.0233 Welding speed + 0.183 Tool profile (HV)
The predictive hardness was
Hardness = 83.8 − (0.00375 × 1200) − (0.0233 × 10) + (0.183 × 2) = 79.43 HV

3.4. Confirmation Analysis

The experimental confirmation test was the final step to verify the accuracy of the results based on Taguchi’s design approach. The average of the results from the confirmational experiment was compared with the predicted average based on the parameters and levels tested. In this study, a confirmational experiment for tensile strength of aluminum alloy SSM 5083 was obtained at 236 MPa by utilizing the levels of the optimal process parameters (A1B1C2). For the hardness in the SZ, it was obtained at 84 HV by utilizing the levels of the optimal process parameters (A2B1C2).

3.5. Analysis of Tensile Tests

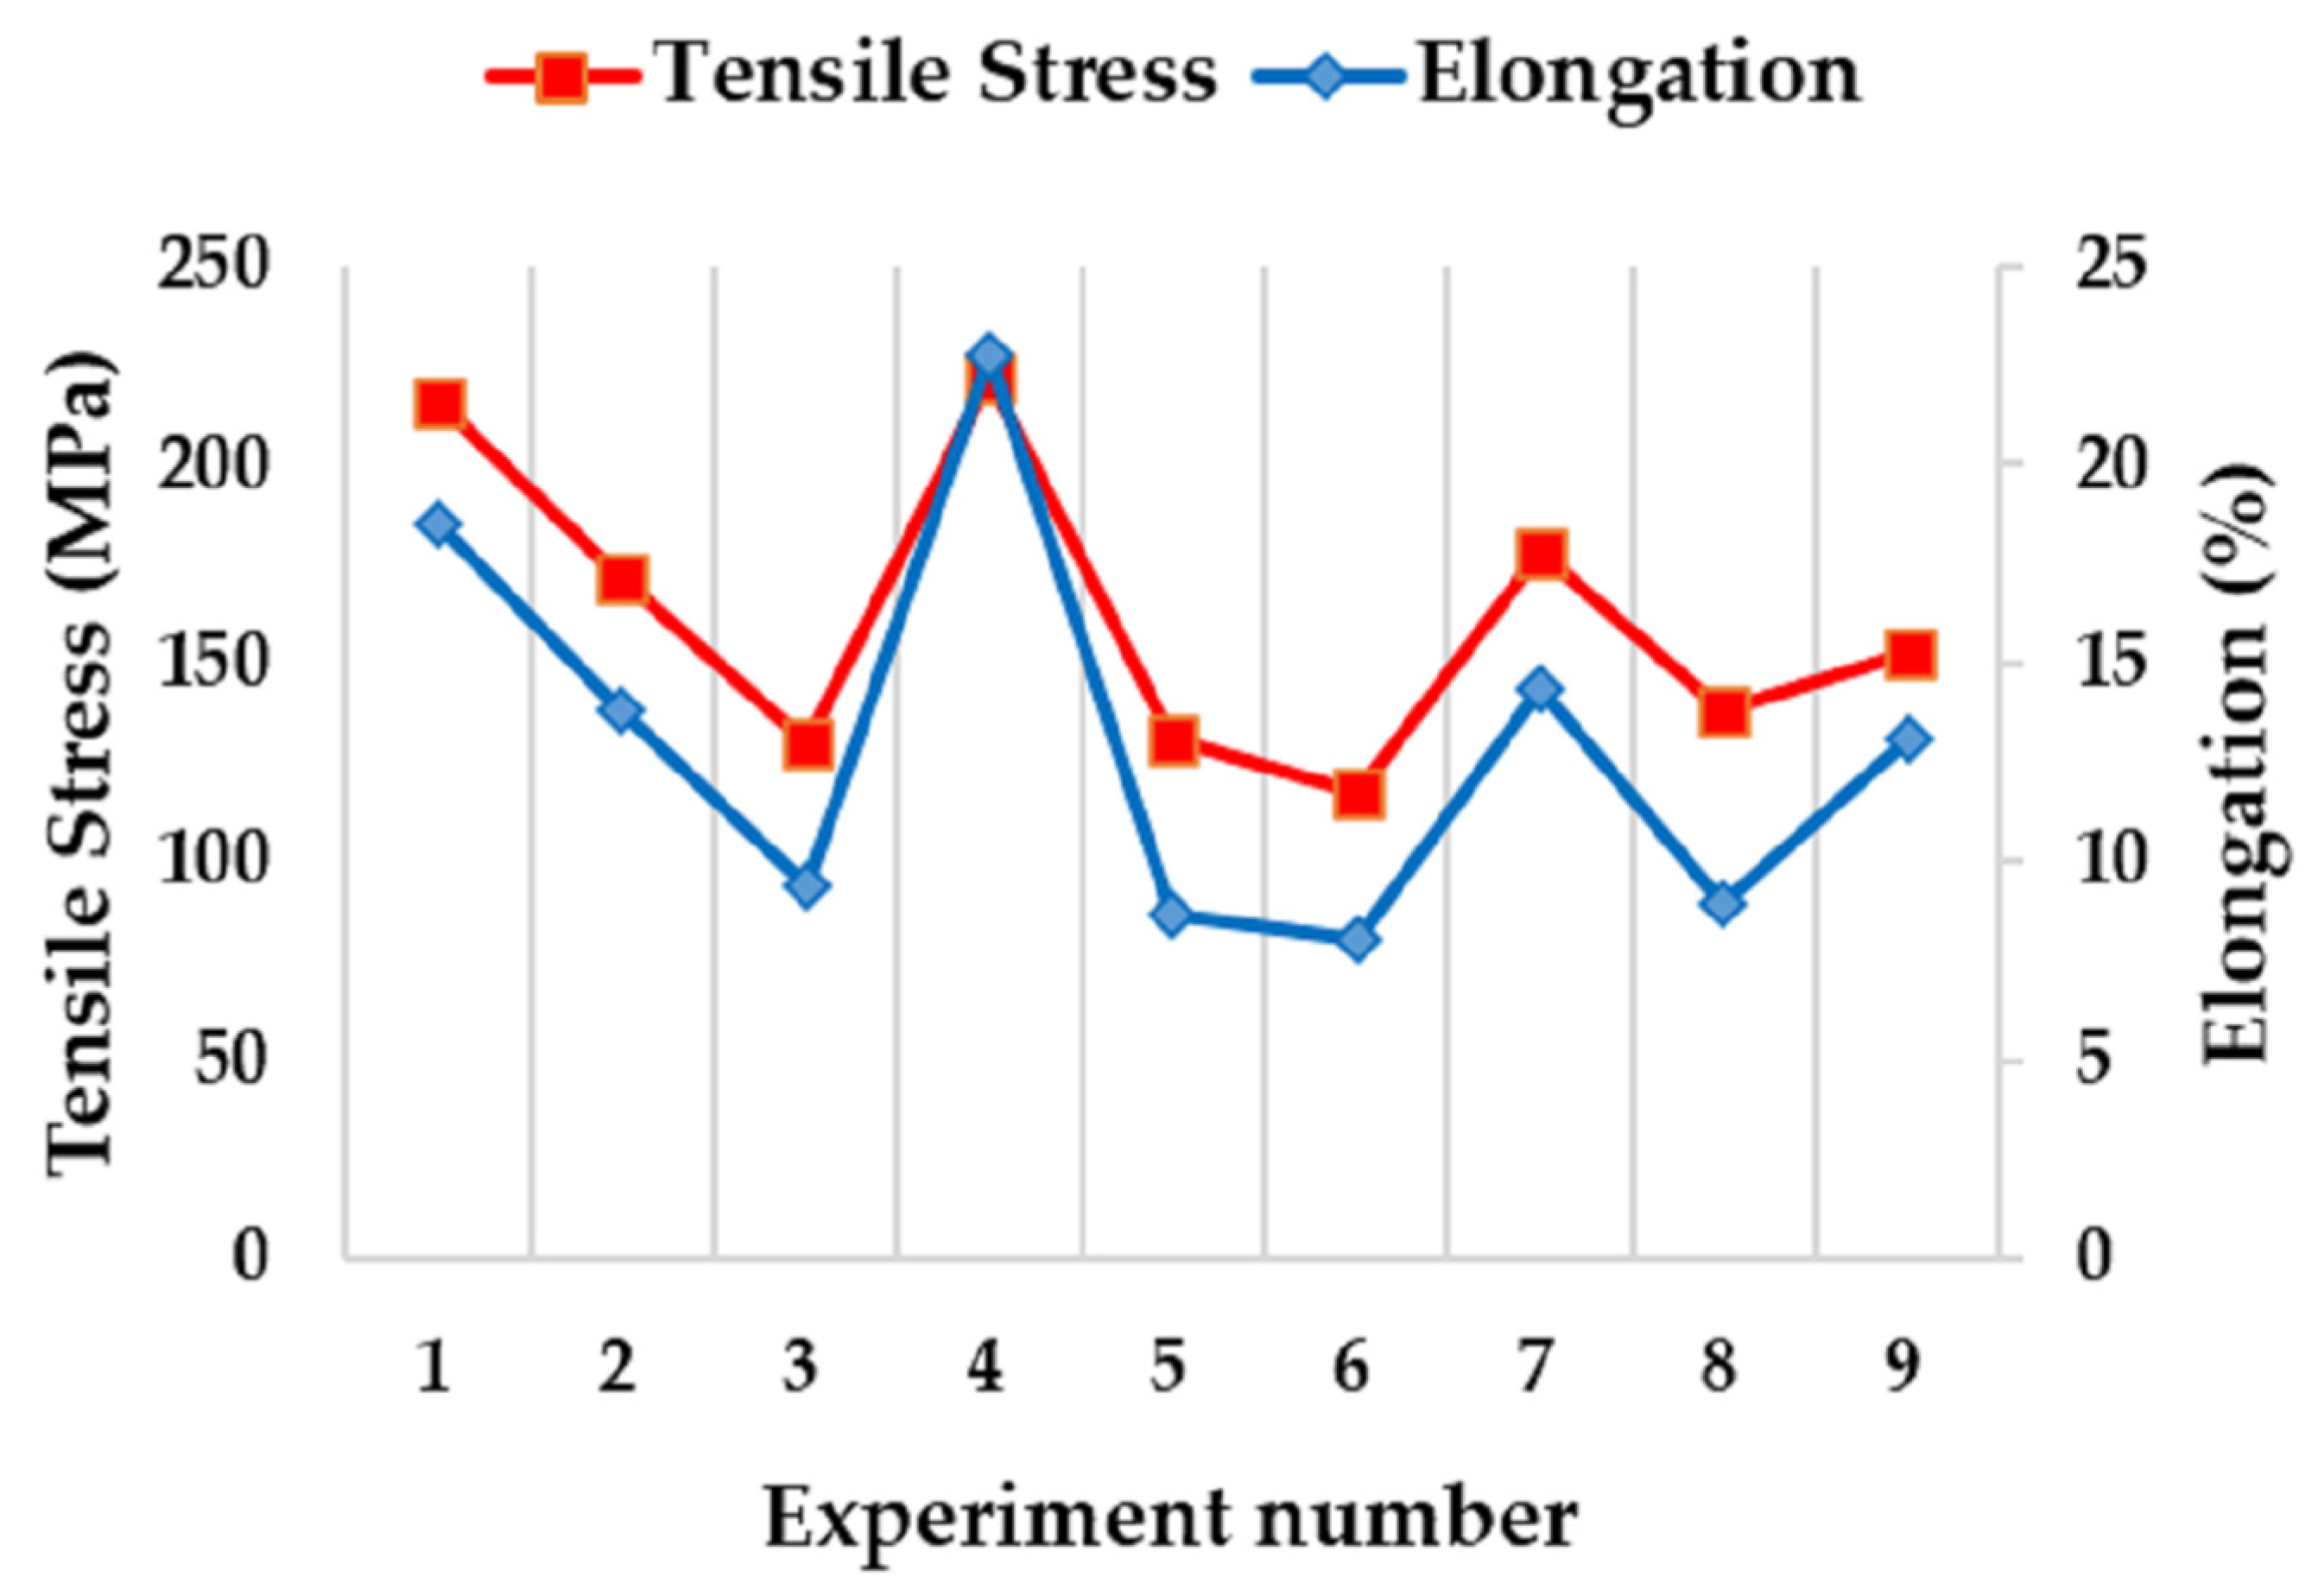
From the tensile strength analysis, it was found that the defect location of the specimens occurred at the heat-affected zone on the advancing side (AS-HAZ) because the HAZ had the lowest mechanical properties compared to the other areas. This was because fractures often occurred in the HAZ [26], as shown in Figure 11. The fourth sample (A1B1C2) had the maximum tensile strength at 221 MPa, whereas the sixth sample (A2B3C1) had the lowest tensile strength at 117 MPa, as shown in Figure 12.

3.6. Vickers Hardness Analysis

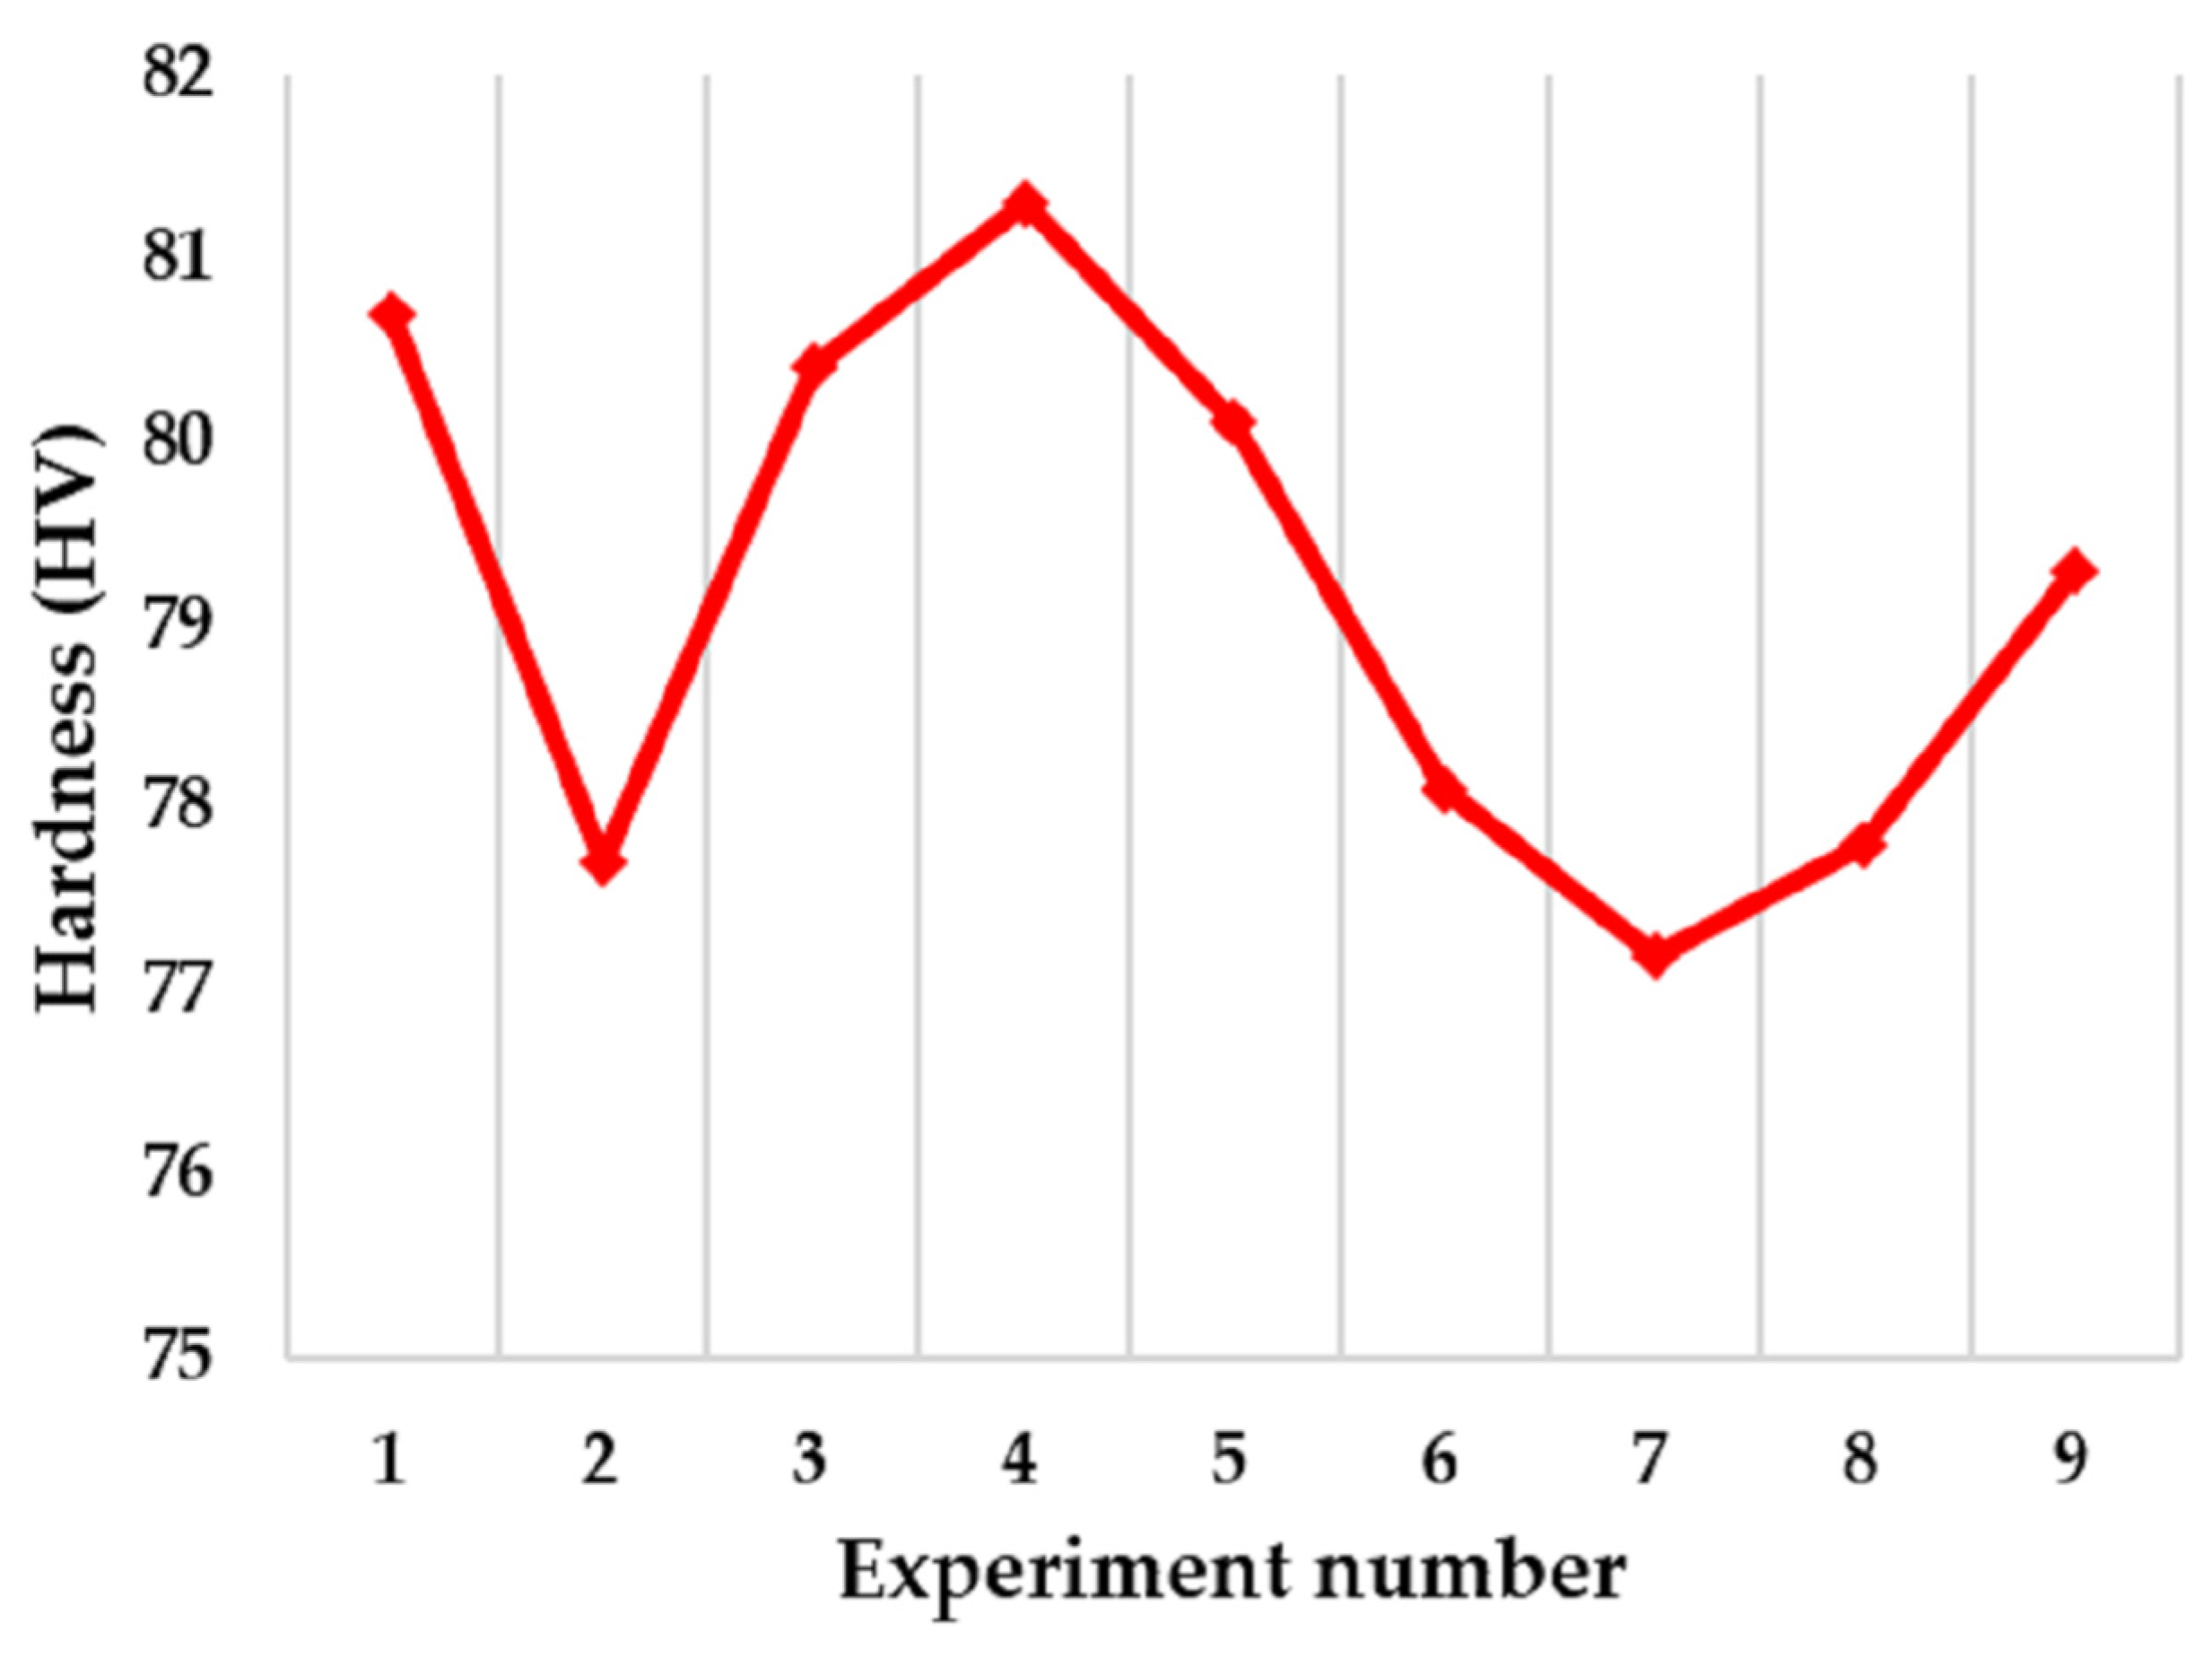
From the analysis of the hardness in the SZ, as shown in Figure 13, the fourth sample (A2B1C2) had the maximum hardness in the SZ at 81.3 HV, which was in line with the hardness values of the base material at 85 HV, because this type of aluminum cannot improve the thermal–mechanical properties and the hardness mechanism is caused by a solid solution [3]. The lowest hardness value occurred at the AS-HAZ, and nearby, at the thermal–mechanically affected zone on the advancing side (AS-TMAZ), as shown in Figure 14, which corresponded to the fracture of the tensile test, wherein the specimen fractured in the AS-HAZ, as shown in Figure 11.

3.7. Macrostructural Examination

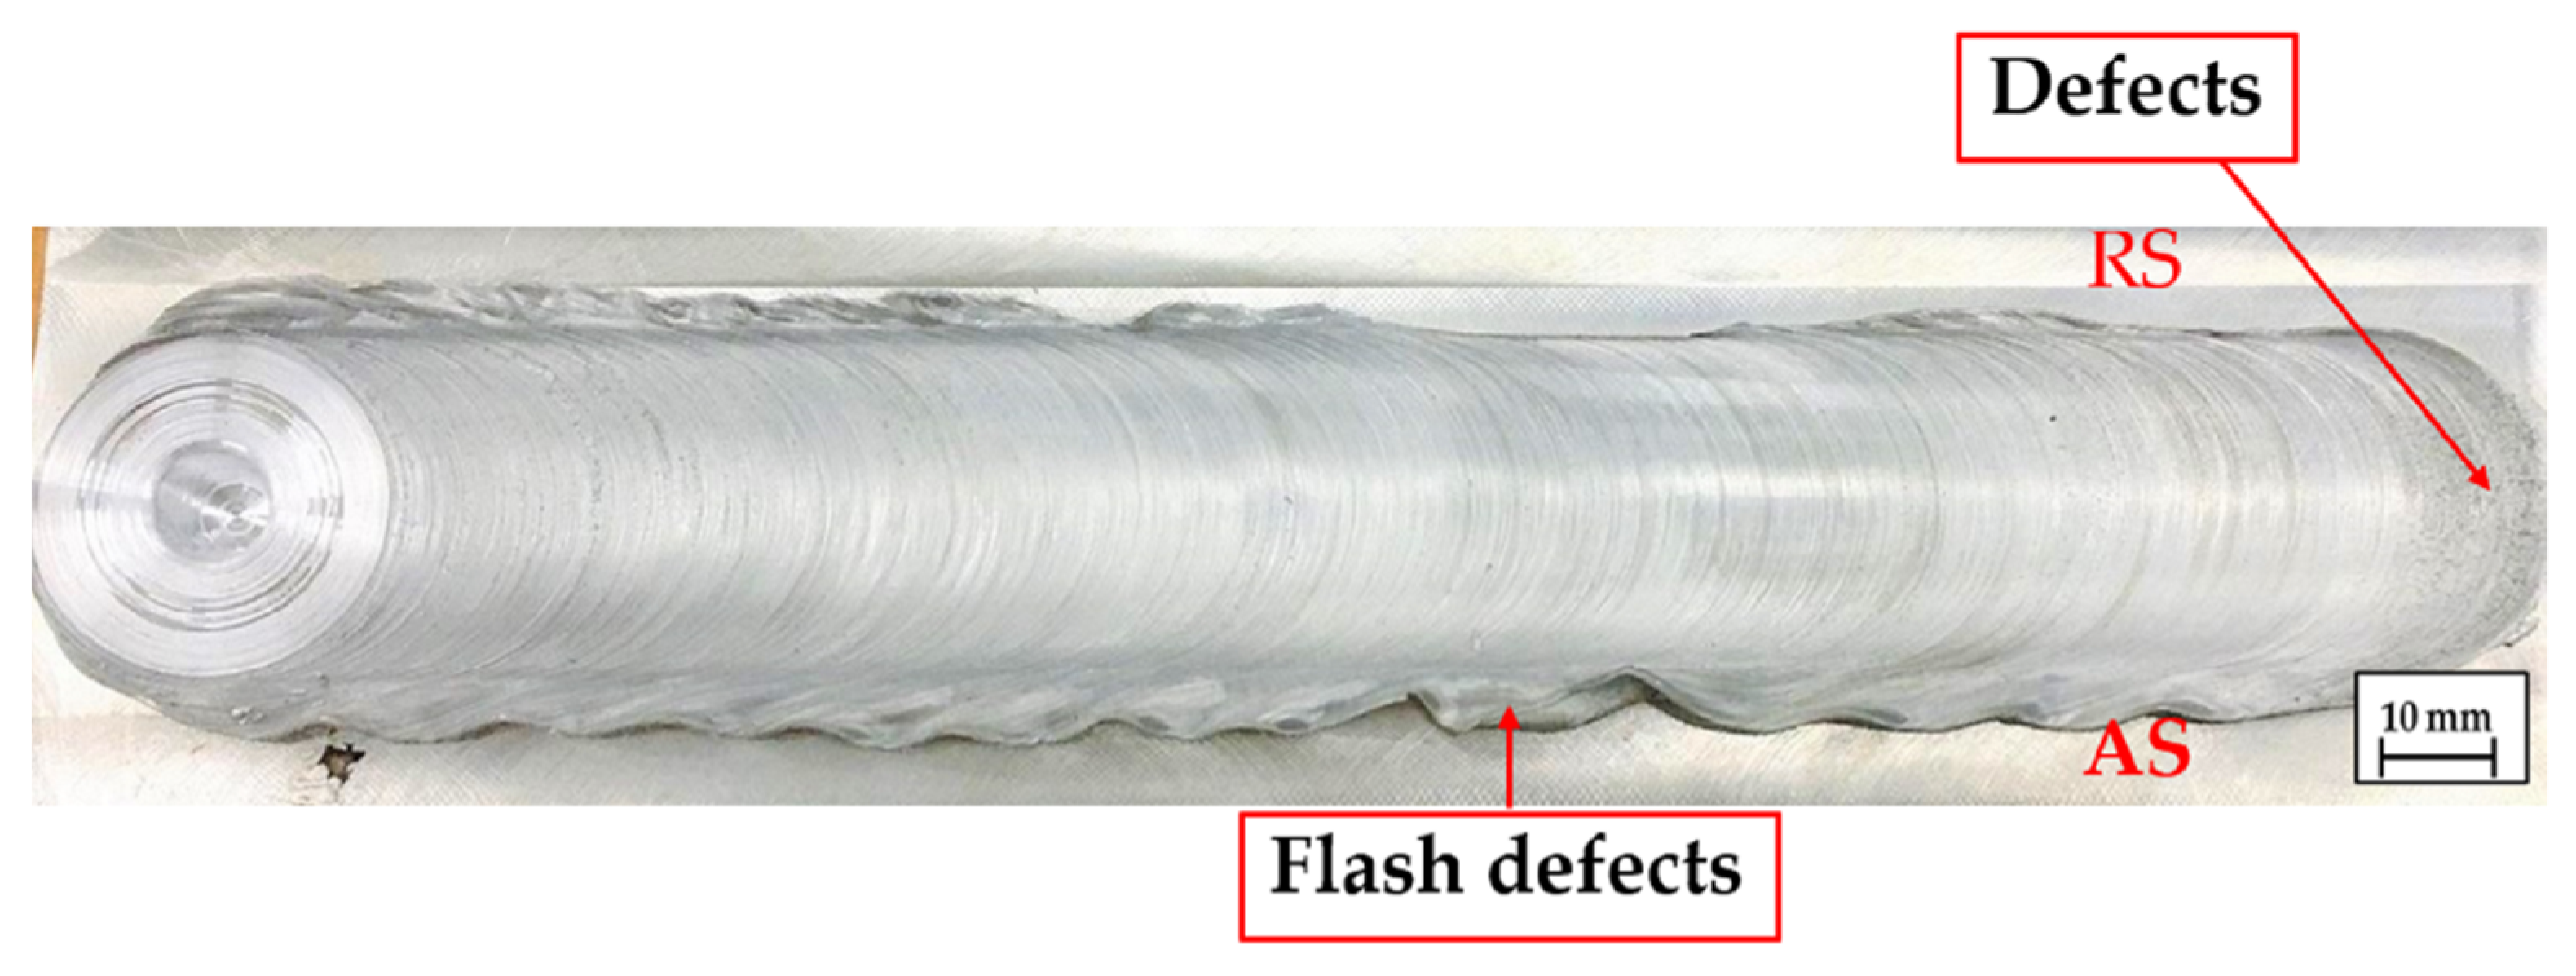
The macrostructural examination was performed in order to investigate the FSW characteristics of aluminum alloy SSM 5083 at the optimal conditions for tensile strength (a rotational speed of 1200 rpm, a welding speed of 10 mm/min, and with a threaded cylindrical tool pin profile). It was found that many welding burrs occurred on both the advancing side and retreating side, and various defects were noted on the surface due to insufficient heat input, causing deformation and irregular metal flow, as shown in Figure 15. In addition, there were certain hollow defects at the bottom of the welded joint on the advancing side due to insufficient metal flow, as shown in Figure 16.

3.8. Microstructural Examination

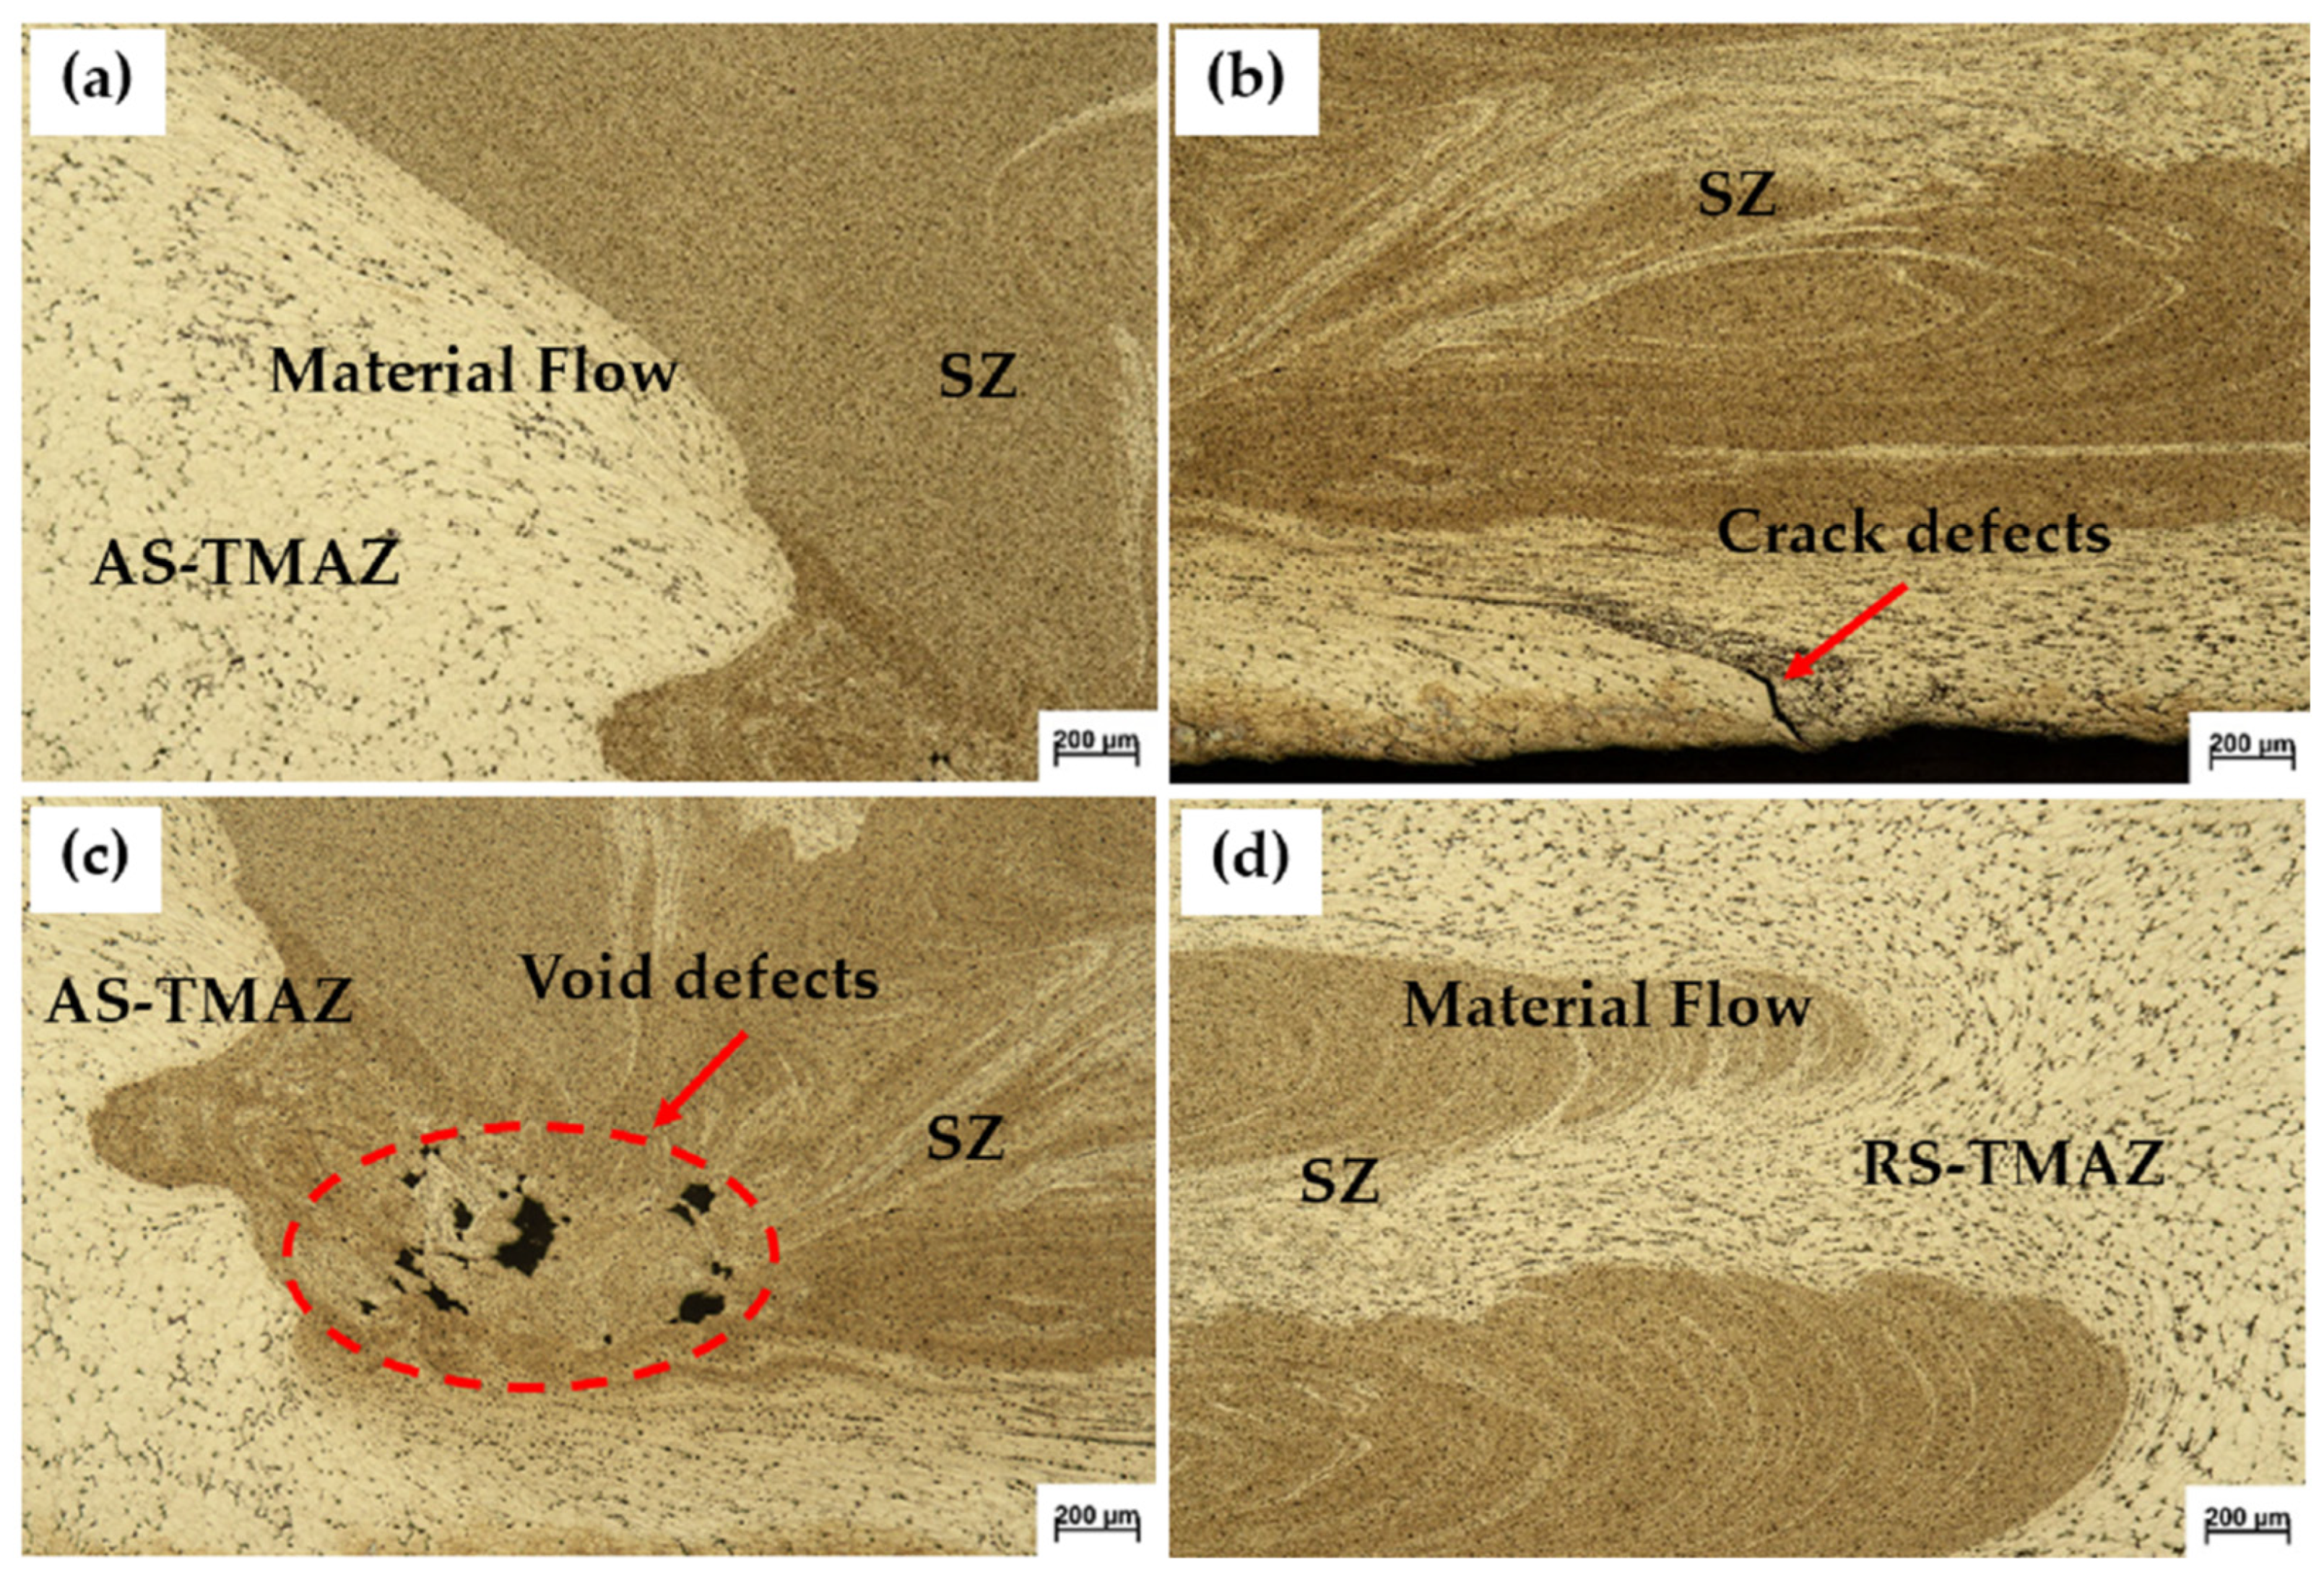
According to the microstructural examination of the welded joint, the joint fabricated with the rotational speed of 1200 rpm, a welding speed of 10 mm/min, and a threaded cylindrical tool pin profile recorded superior hardness in the SZ. Figure 17a shows the AS-TMAZ, in which large grains were formed by the rotation of the pin, causing the flow of metal. The structure in this area was not coordinated; thus, it affected the strength of the weld joint, which is relevant to the cracking position of the tensile test specimen, as shown in Figure 13. In Figure 17b, fine grains occurred and there was metal flow from both the AS-TMAZ and the thermal–mechanically affected zone on the retreating side (RS-TMAZ), causing appropriate consolidation. However, there were crack defects and irregular consolidation found in the lower central joint due to the lower heat input from the rotating pin. In Figure 17c, there were many void defects in the AS-TMAZ due to the lower heat input from the rotating pin [27,28]. Moreover, as can be seen in Figure 17d, fine grains occurred and there was metal flow in the RS-TMAZ, causing appropriate consolidation.
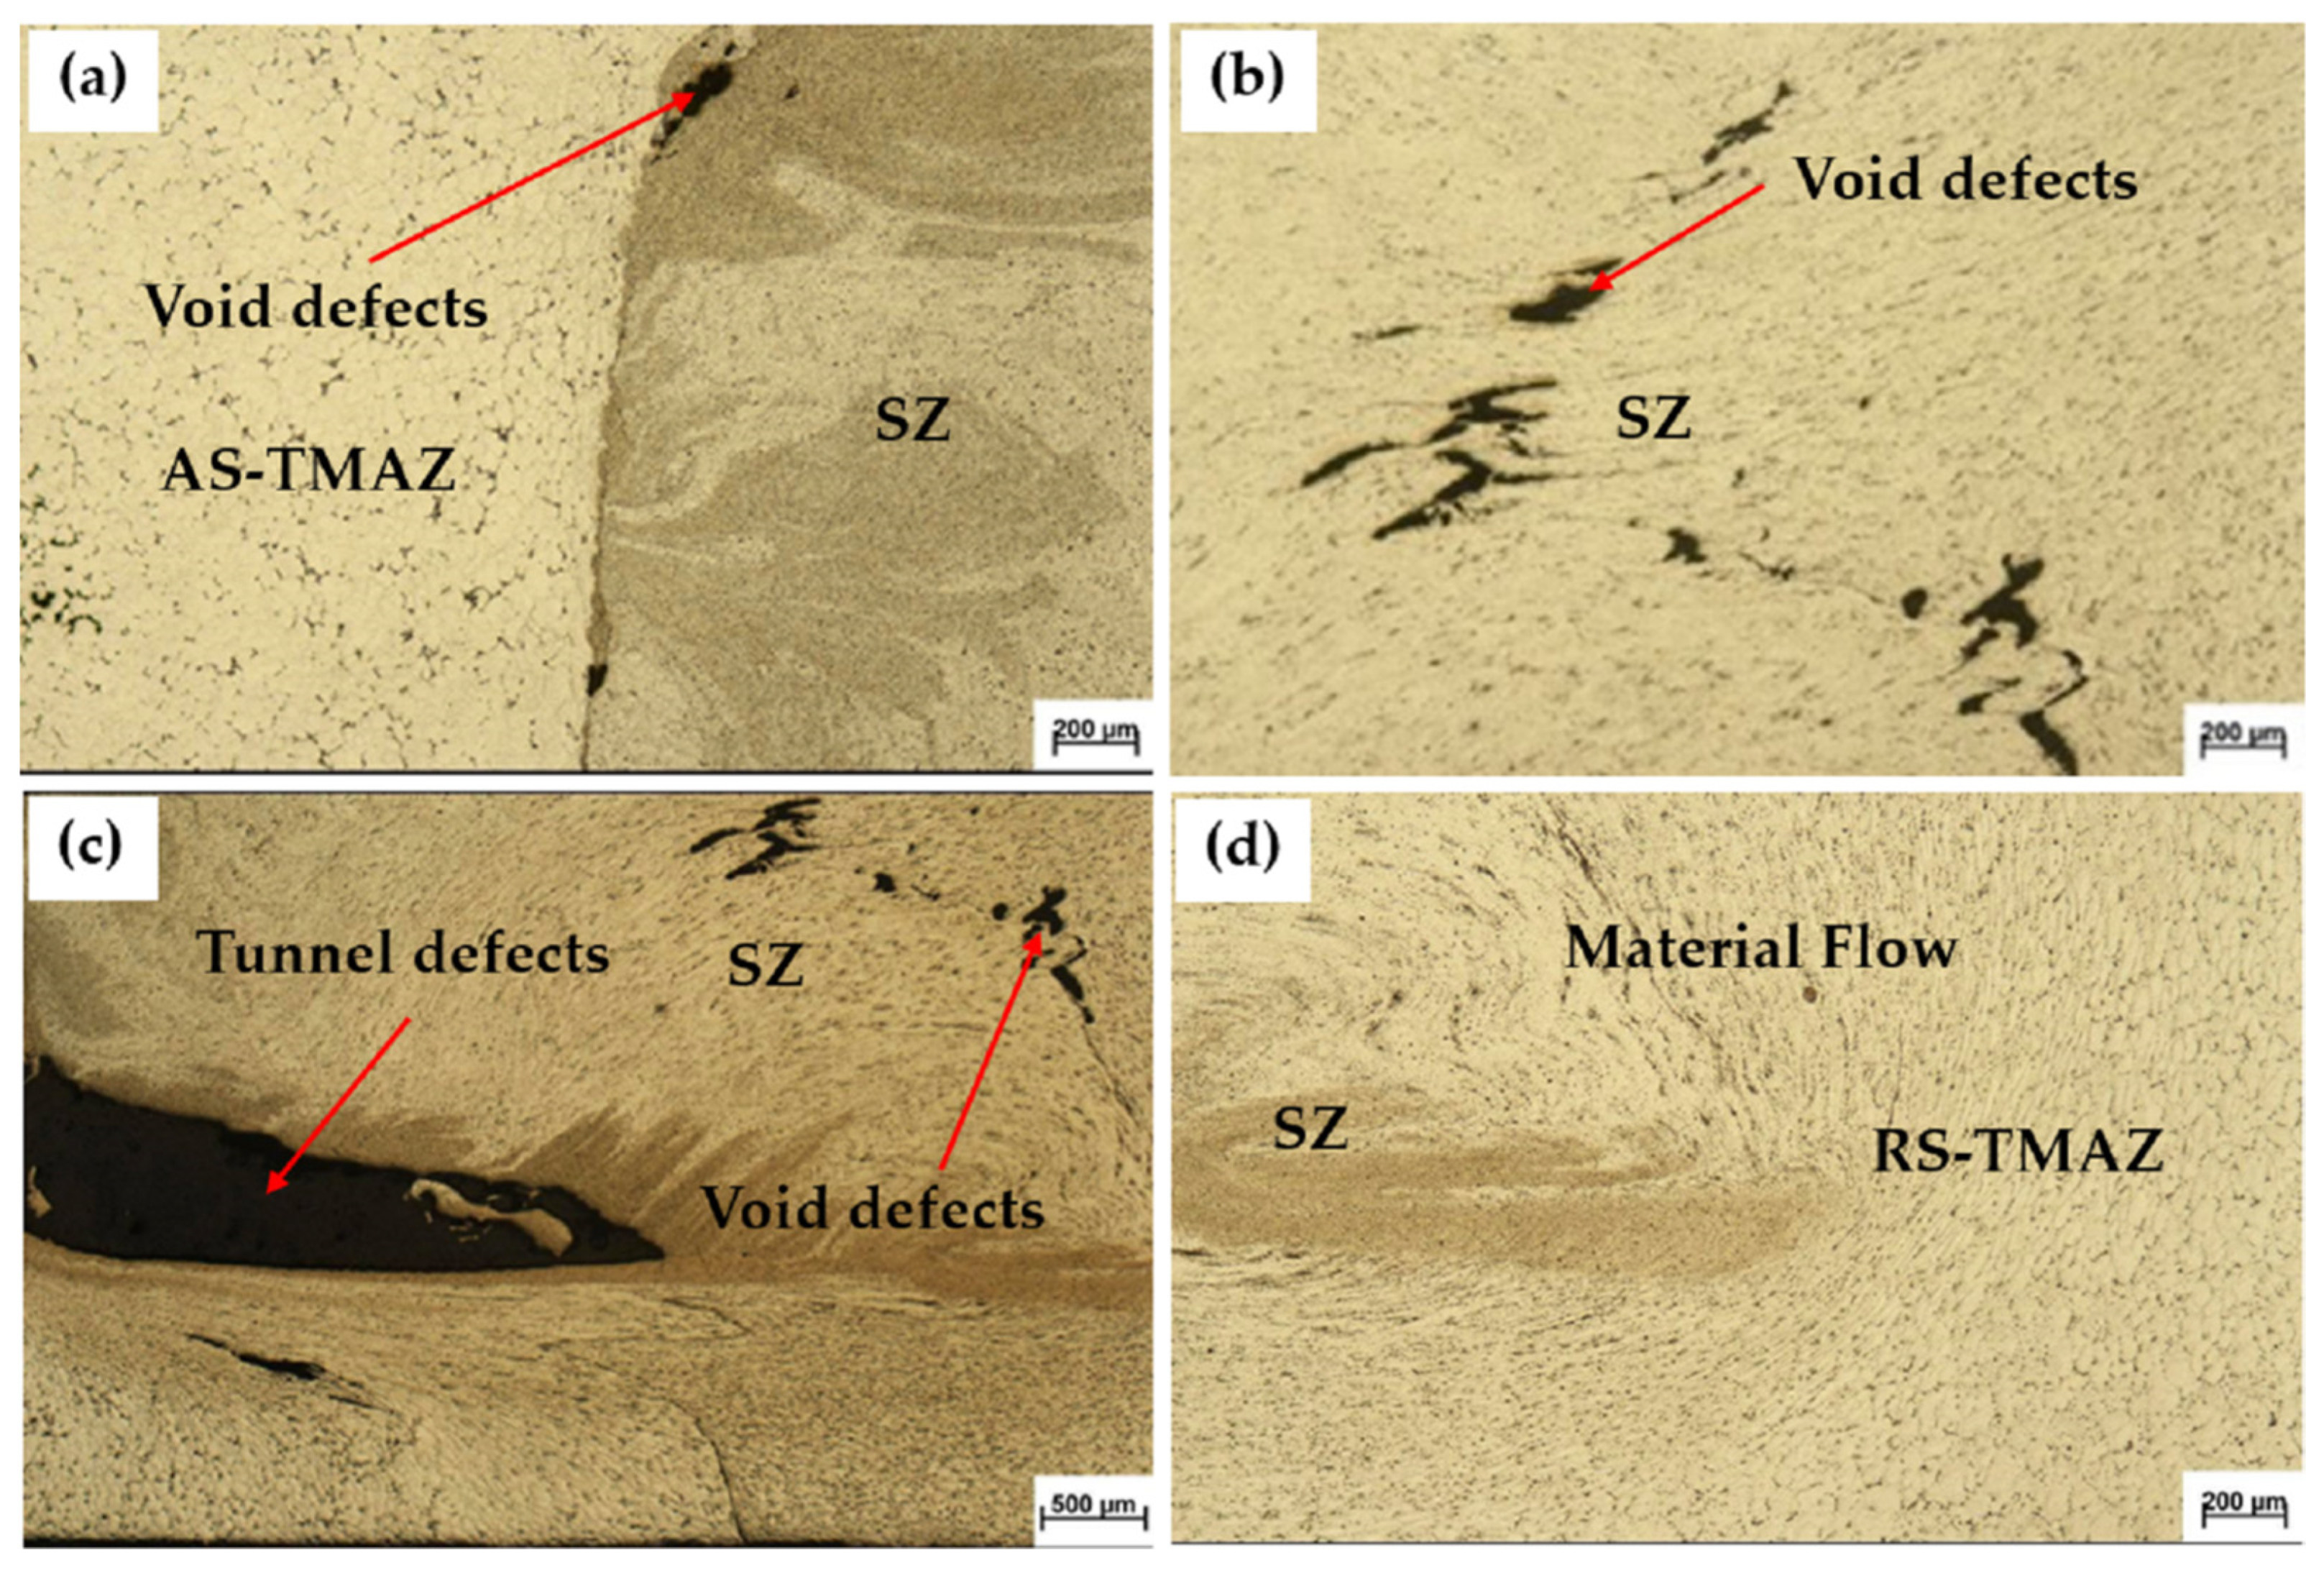
On the basis of the microstructural examination, the sixth sample (with a rotational speed of 1200 rpm, a welding speed of 30 mm/min, and a straight cylindrical tool pin profile) had a void defect in the AS-TMAZ, as shown in Figure 18a. This defect occurred due to irregular metal flow during casting, which changed the predefine grain structure of the specimen. A low heat input caused the sample to be plastically deformed. Increasing the welding speed caused insufficient consolidation and welded joint hardness. As can be seen in Figure 18b, there were many void defects in the SZ. Figure 18c shows voids and tunnel defects at the pin tip on the advancing side caused by insufficient heat input and plastic deformation. An insufficient metal flow can negatively affect the mechanical properties [29,30]. Moreover, as shown in Figure 18d, the RS-TMAZ was free from defects due to the higher temperature compared to the advancing side. A high thermal input resulted from sufficient metal flow and plastic deformation, which affected the effective consolidation in the SZ [27,28]. Compared with the sixth specimen, the fourth sample, which received a proper heat input, exhibited more effective consolidation.
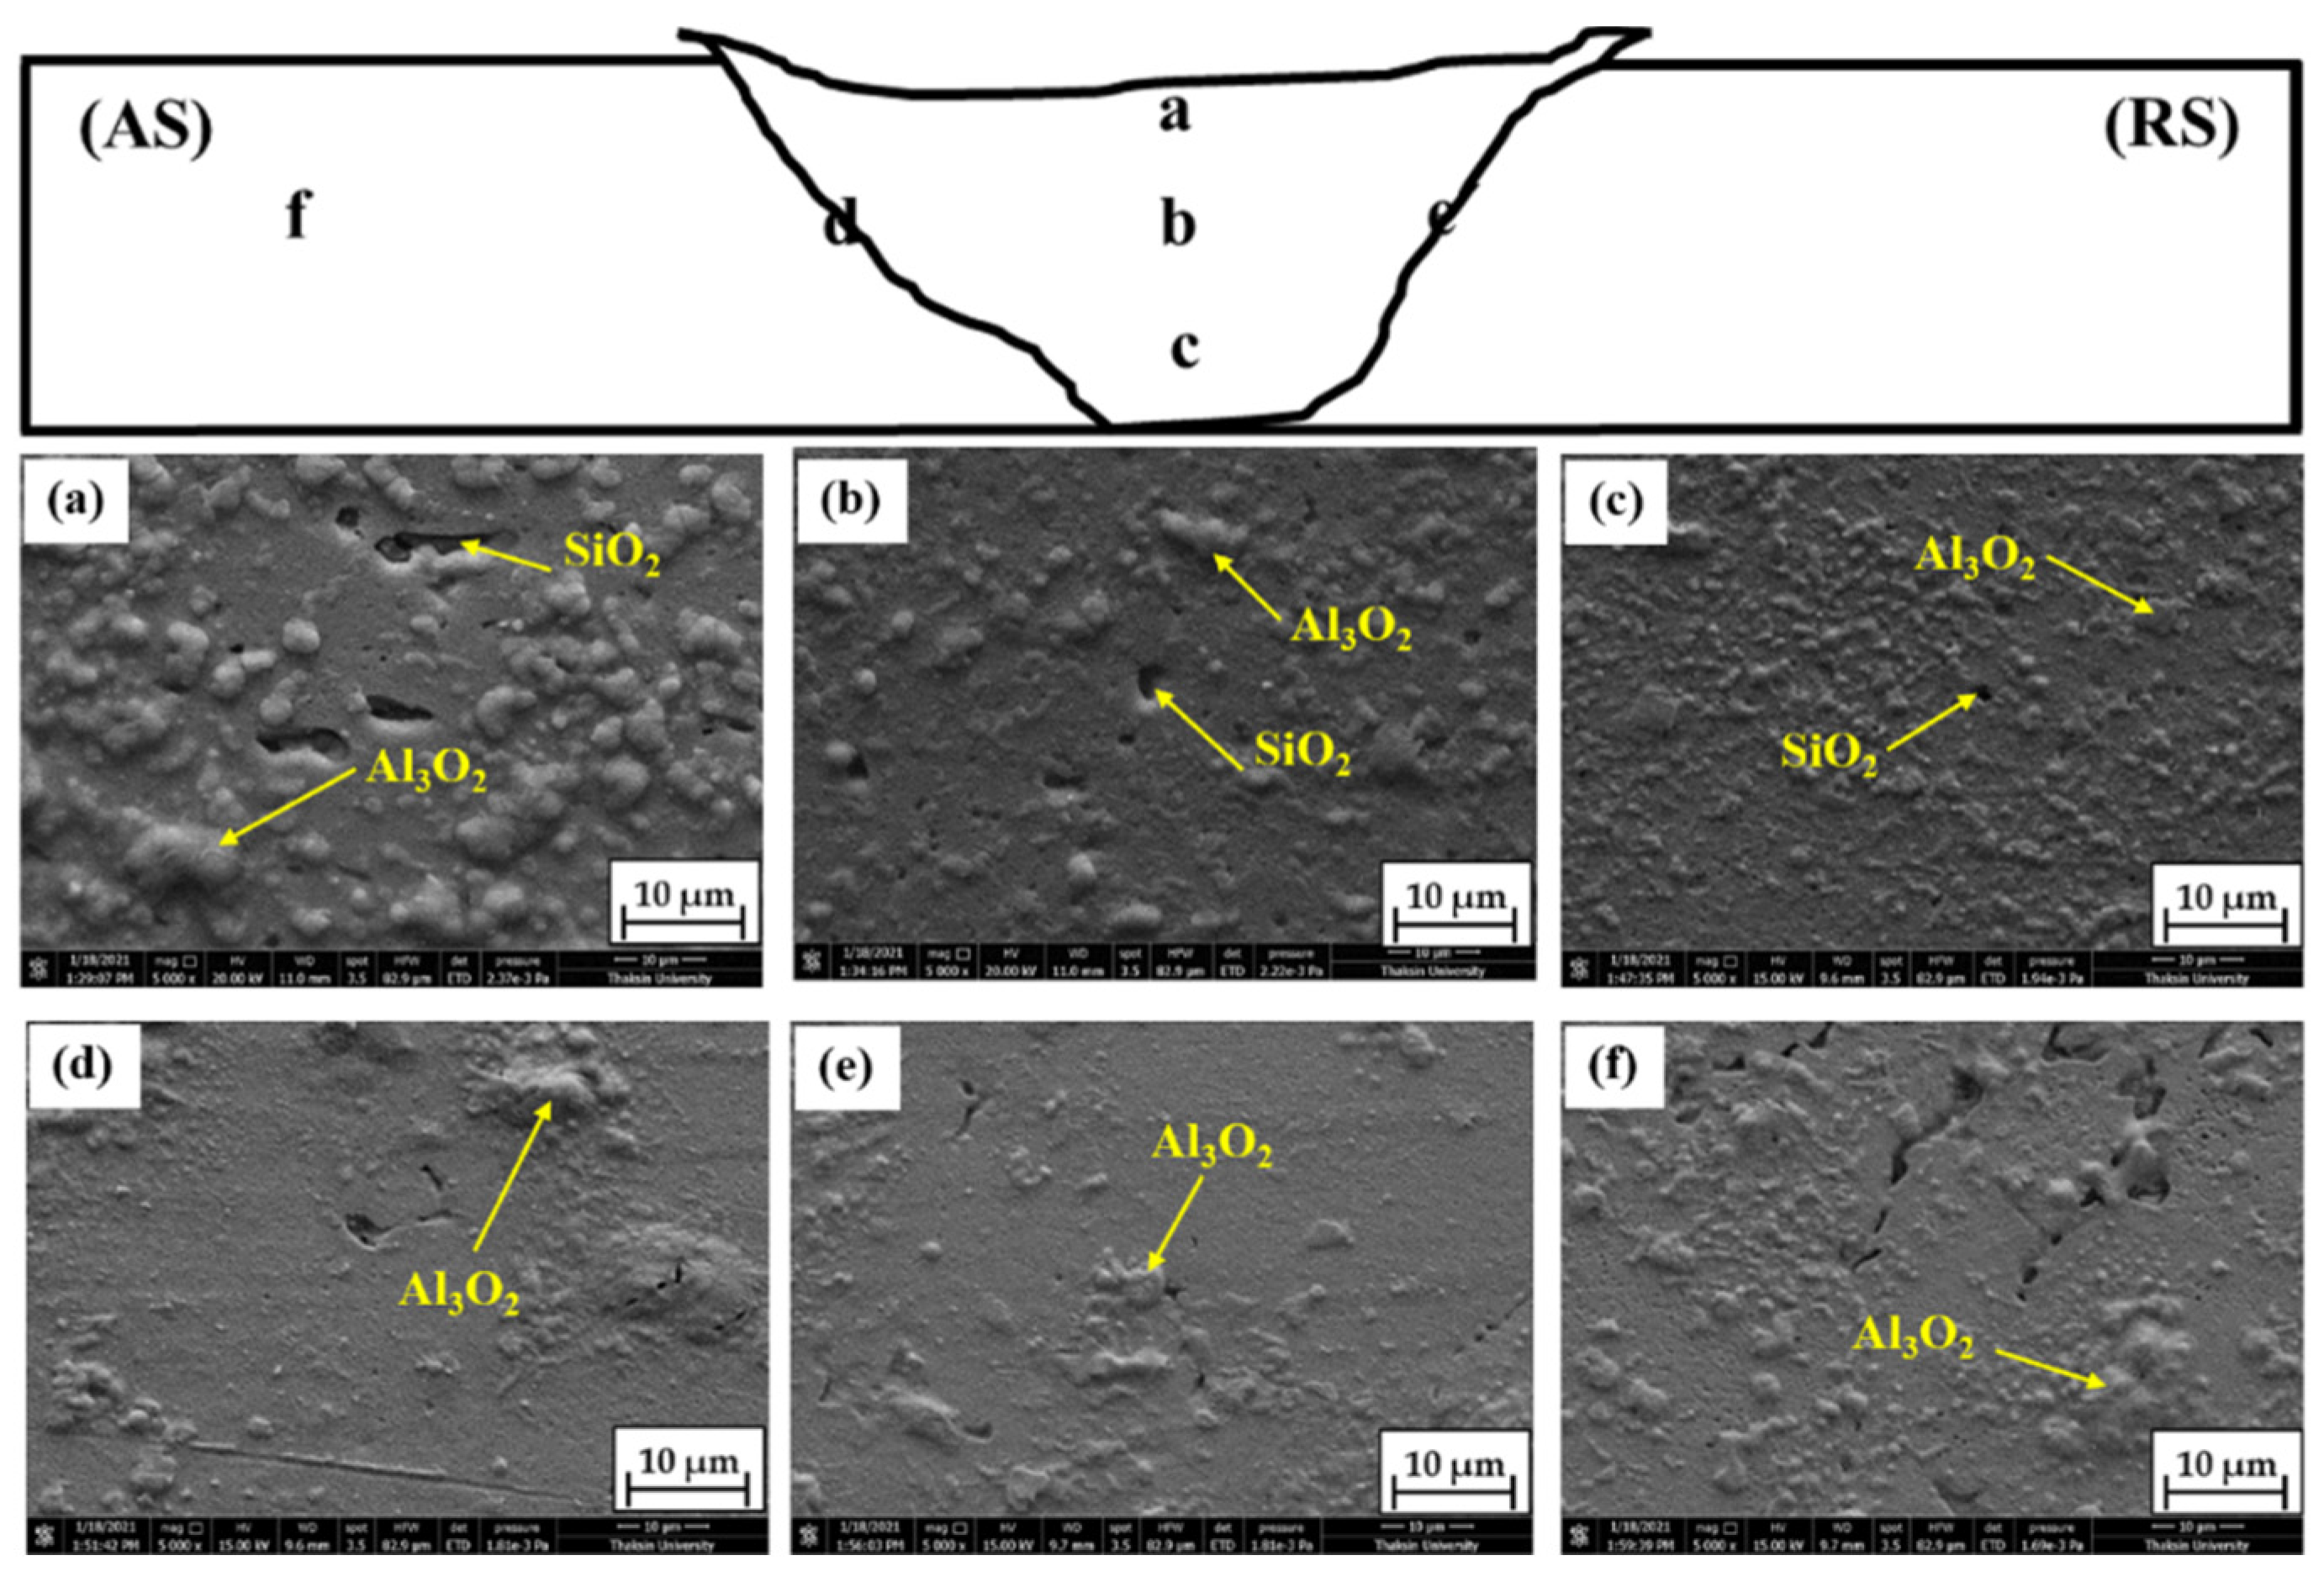
According to SEM of the welded joint at the optimal conditions (A1B1C2), the welded region was composed of an Al2O3 phase [31] and SiO2 phase, which is consistent with the EDS results in Figure 20. The amount of SiO2 was 22.34%. The small size and distribution of SiO2 particles affected the homogeneity and strength of the welded joint [32]. The amount of Al2O3 was 11.67%.
Figure 19a revealed that the surface morphology in the upper position of the weld had a large number of Al2O3 phases. The average Al2O3 particle size was 2.354 µm. The SiO2 phase was found with a porous, large, and wormlike structure.
Figure 19b shows the morphology of the surface characteristics at the center of the weld, in which the Al2O3 particles were slightly rough. The average Al2O3 particle size was 2.313 µm. The small porous SiO2 phase spread over the area.
Figure 19c shows the surface morphology at the bottom of the weld. It had relatively uniform distribution characteristics of Al2O3 phase particles. The average particle size was 2.105 µm and a small porous SiO2 phase occurred.
In Figure 19d, it can be seen that the morphology of the TMAZ surface on the advancing side was relatively smooth. The convex particles were raised at some points. The average particle size was 1.320 µm.
Figure 19e shows that the surface morphology of the TMAZ position on the retreating side was relatively smooth and homogeneous. The average particle size was 2.161 µm.
Figure 19f shows that the surface morphology in the BM was characterized by rough particles with a long hollow line. The average particle size was 1.912 µm.
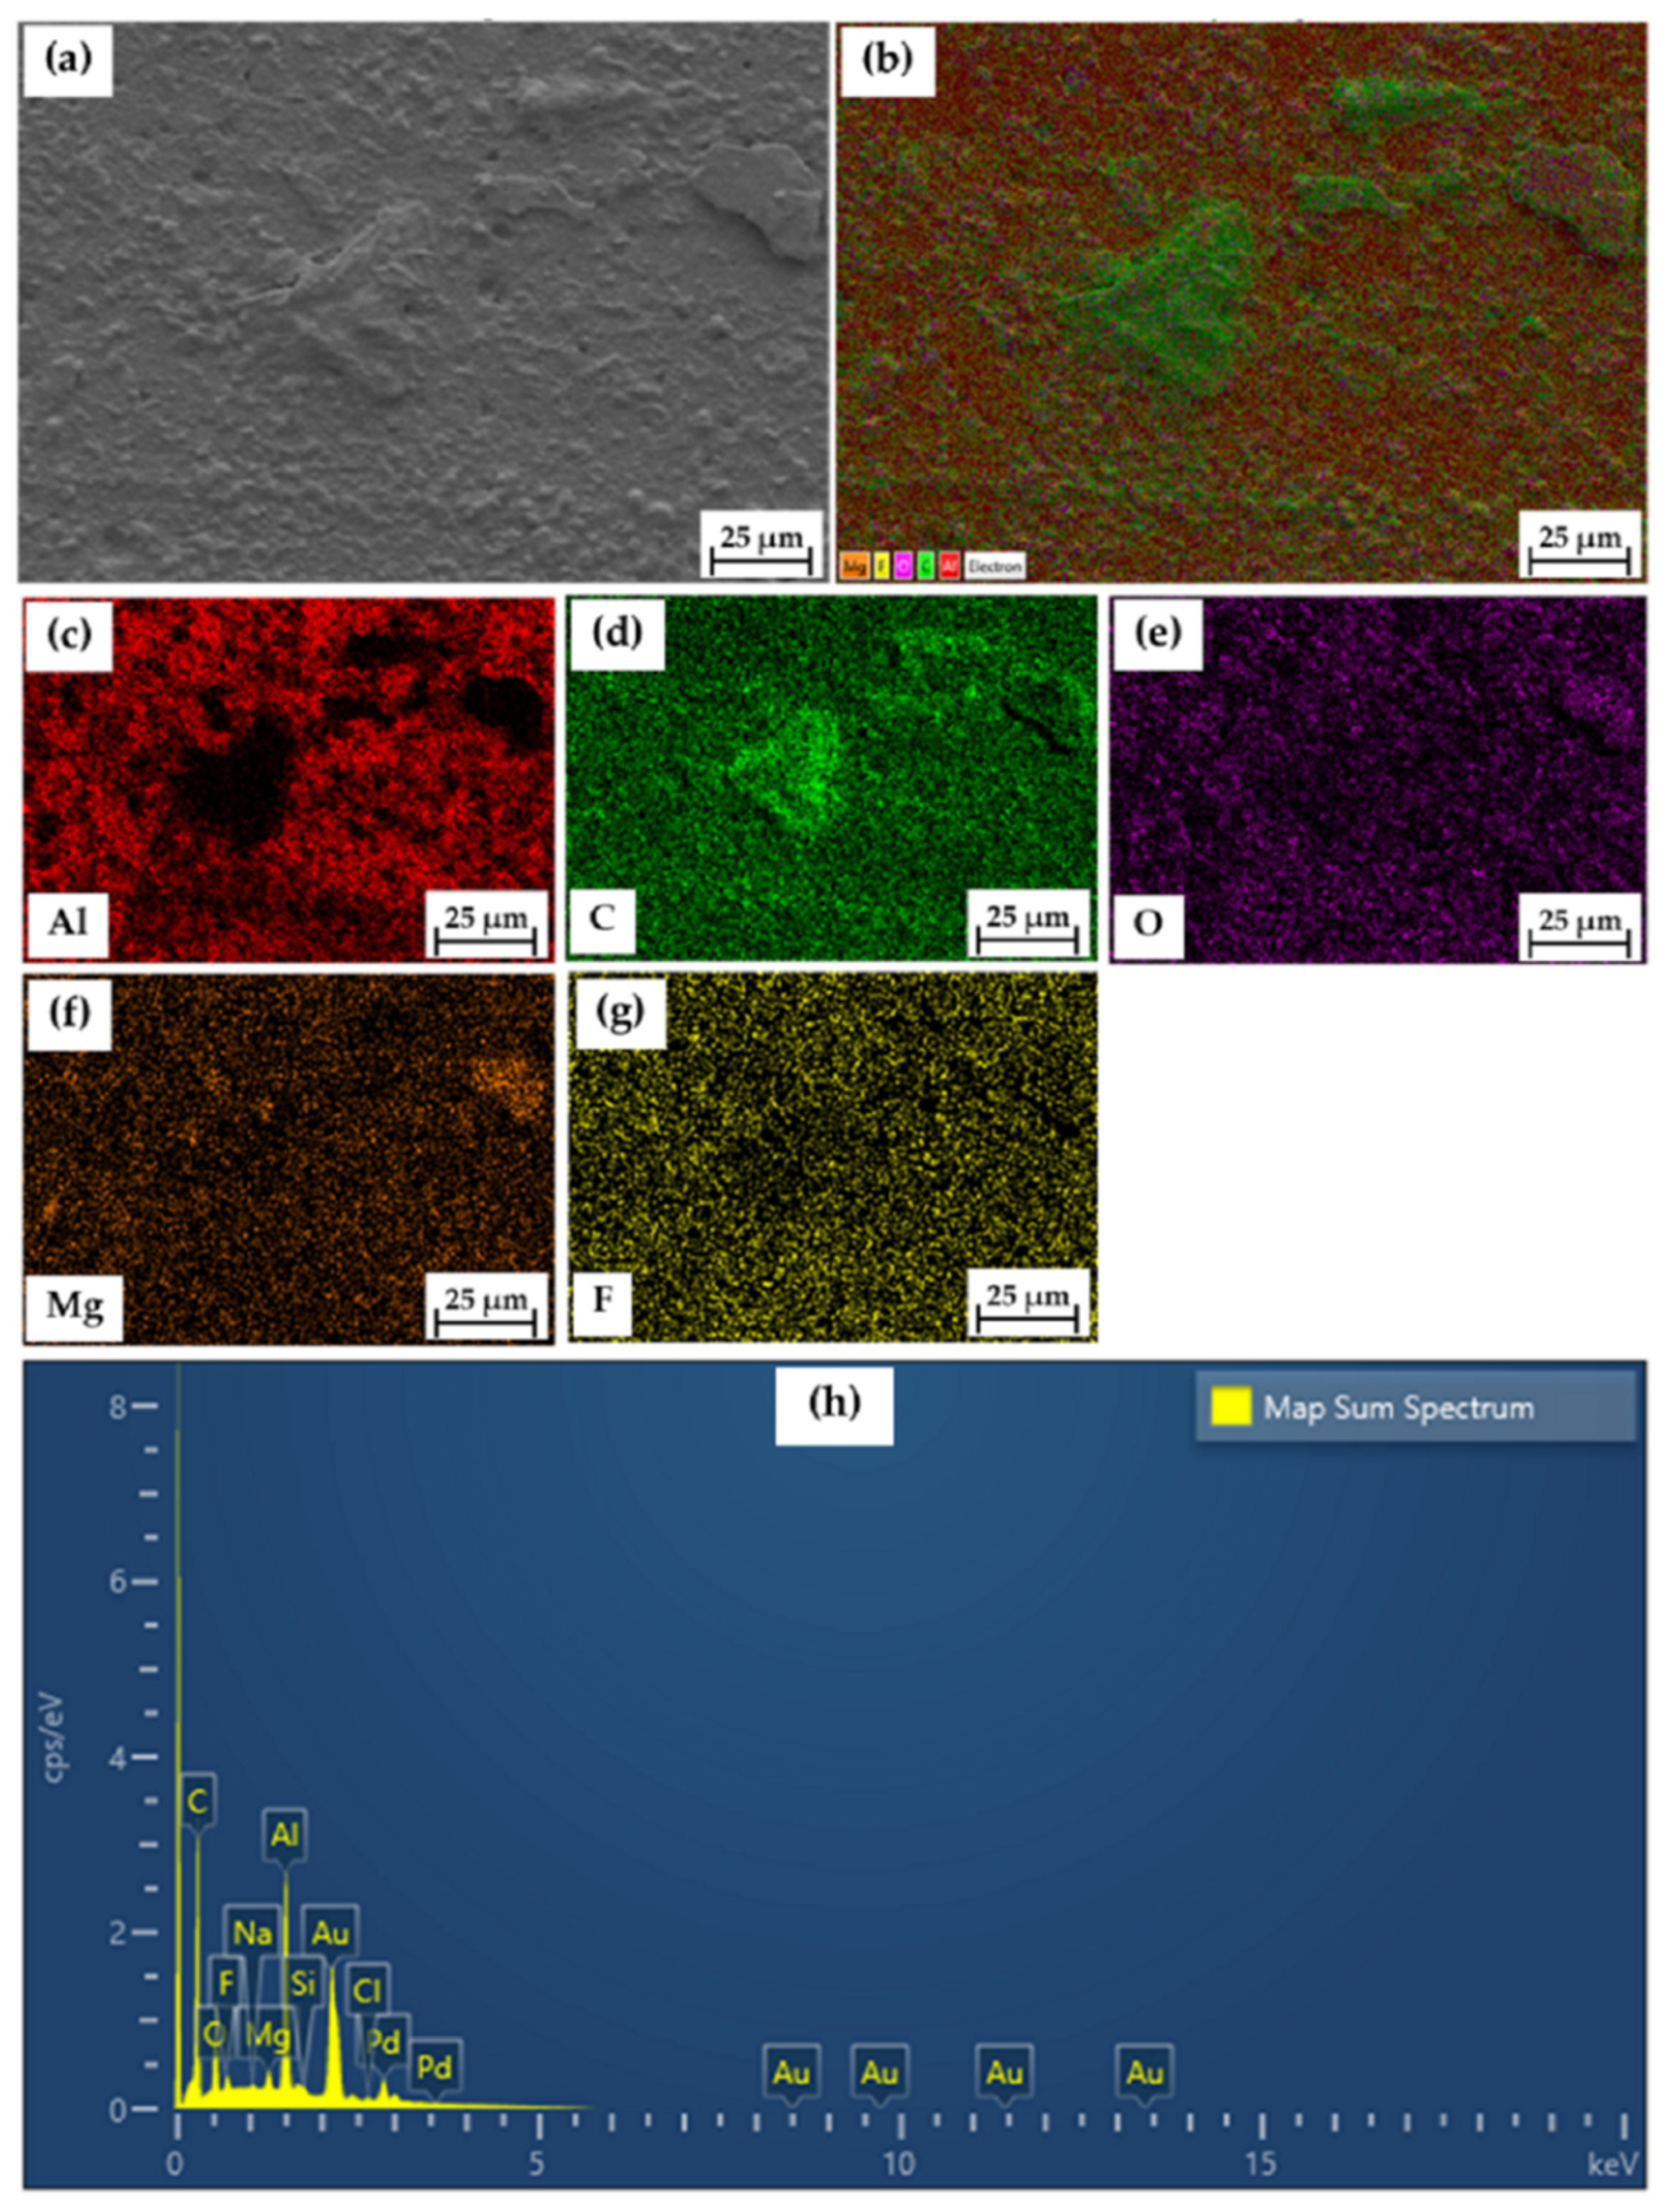
An EDS analysis was performed at a rotational speed of 1200 rpm, a welding speed of 10 mm/min, and with a threaded cylindrical tool pin profile in the SZ, as shown in Figure 19b and Figure 20a. According to the analysis, C (Figure 20c), O (Figure 20d), and Al (Figure 20e) were the dominant elements dispersed throughout the area, as shown in Figure 20b; they were followed by F (Figure 20f) and Mg (Figure 20g). This is consistent with the results from the SEM images in which Al2O3 and SiO2 were found.
Table 12 shows the results regarding their weight, atomic percentage value, and standard label. The amount of C = 55.86% corresponds to the distribution of the largest quantity of elements, as shown in Figure 20b (see the green dots). Moreover, O = 22.34%, with the standard label of SiO2, and Al = 11.67% with the standard label of Al2O3, which is consistent with the results from the SEM in Figure 19. In addition, the amounts of Pd, F, Mg, Si, Cl, and Na decreased.

4. Conclusions

In the present work, the Taguchi and ANOVA techniques were used to study the effect of FSW process parameters on the mechanical properties of aluminum alloy SSM 5083 using the tensile strength and hardness value in the SZ for the welded workpiece. The following important conclusions were drawn from this investigation.
  • The optimal FSW process parameters of aluminum alloy SSM 5083 obtained from the tensile strength and the S/N ratio were A1B1C2, i.e., a rotational speed of 1000 rpm, a welding speed of 10 mm/min, and a threaded cylindrical tool pin profile. The predicted tensile strength was 235.22 MPa, while the confirmational analysis showed the tensile strength to be 236 MPa;
  • The optimal FSW process parameters of aluminum alloy SSM 5083 obtained from the hardness value in the SZ and the S/N ratio were A2B1C2, i.e., a rotational speed of 1200 rpm, a welding speed of 10 mm/min, and a threaded cylindrical tool pin profile. The predicted hardness value in the SZ was 80.64 HV, while the confirmational analysis showed the hardness value in the SZ to be 84 HV;
  • On the basis of the ANOVA, it was found that the most significant process parameter influencing the tensile strength at a 95% confidence level was the welding speed. Contrarily, none of the parameters, i.e., rotational speed, welding speed, or tool profile, influenced the hardness in the SZ;
  • The microstructure in the SZ area showed the material flowed and gathered well. A void defect was found on the retreating side. From the SEM analysis, surface morphology was found at the top of the weld. The particles were gray, which is the Al2O3 phase. The particles were not smooth and an SiO2 phase was found. Moreover, the size of the hole tended to continue narrowing towards the bottom of the weld in the RS-TMAZ, with good flow in the TMAZ area. On the RS, uniform particle distribution and minimal porosity were found in the AS-TMAZ. The average particle size was 1.320 µm. On the basis of the EDS analysis at the center of the weld, carbon, oxygen, and aluminum were distributed in large quantities throughout the area with some of fluorine, magnesium, etc.
In conclusion, the welding speed was found to be the most important parameter in the FSW of aluminum alloy SSM 5083, having a direct influence on the thermal level in the welded joints resulting from sufficient material flow.

Author Contributions

Conceptualization, K.S.; methodology, K.N.; software, K.N.; validation, K.S.; formal analysis, K.S. and K.N.; investigation, K.S.; data curation, K.S.; writing—original draft preparation, K.N. and K.S.; writing—review and editing, K.N. and K.S.; visualization, K.N.; supervision, K.S.; project administration, K.N. Both authors have read and agreed to the published version of the manuscript.

Funding

This research received no external funding.

Data Availability Statement

The data presented in this study are available on request from the corresponding author.

Acknowledgments

The authors would like to thank Department of Industrial Engineering, Faculty of Engineering, Ubon Ratchathani University in Thailand.

Conflicts of Interest

The authors declare no conflict of interest.

References

  1. Nakata, K.; Kim, Y.G.; Ushio, M.; Hashimoto, T.; Jyogan, S. Weldability of high strength aluminum alloys by friction stir welding. ISIJ Int. 2000, 40, 15–19. [Google Scholar] [CrossRef]
  2. Wannasin, J.; Janudom, S.; Rattanochaikul, T.; Canyook, R.; Burapa, R.; Chucheep, T.; Thanabumrungkul, S. Research and development of gas induced semi-solid process for industrial applications. Trans. Nonferrous Met. Soc. China 2010, 20, 1010–1015. [Google Scholar] [CrossRef]
  3. Mishra, R.S.; Ma, Z.Y. Friction stir welding and processing. Mater. Sci. Eng. 2005, 50, 1–78. [Google Scholar] [CrossRef]
  4. Kumar, S.; Srivastava, A.K.; Singh, R.K.; Dwivedi, S.P. Experimental study on hardness and fatigue behavior in joining of AA5083 and AA6063 by friction stir welding. Mater. Today Proc. 2020, 25, 646–648. [Google Scholar] [CrossRef]
  5. Koilraj, M.; Sundareswaran, V.; Vijayan, S.; Koteswara Rao, S.R. Friction stir welding of dissimilar aluminum alloys AA2219 to AA5083 Optimization of process parameters using Taguchi technique. Mater. Des. 2012, 42, 1–7. [Google Scholar] [CrossRef]
  6. Durga Prasad, M.V.R.; Namala, K.K. Process Parameters Optimization in Friction Stir Welding by ANOVA. Mater. Today Proc. 2018, 5, 4824–4831. [Google Scholar] [CrossRef]
  7. Raweni, A.; Majstorovic, V.; Sedmak, A.; Tadic, S.; Kirin, S. Optimization of AA5083 Friction Stir Welding Parameters Using Taguchi Method. Teh. Vjesn. Tech. Gaz. 2018, 25, 861–866. [Google Scholar]
  8. Bayazid, S.M.; Farhangia, H.; Ghahramania, A. Investigation of friction stir welding parameters of 6063-7075 Aluminum alloys by Taguchi method. Procedia Mater. Sci. 2015, 11, 6–11. [Google Scholar] [CrossRef] [Green Version]
  9. Shojaeefard, M.H.; Akbari, M.; Khalkhali, A.; Asadi, P.; Parivar, A.H. Optimization of microstructural and mechanical properties of friction stir welding using the cellular automaton and Taguchi method. Mater. Des. 2014, 64, 660–666. [Google Scholar] [CrossRef]
  10. Javadi, Y.; Sadeghi, S.; Najafabadi, M.A. Taguchi optimization and ultrasonic measurement of residual stresses in the friction stir welding. Mater. Des. 2014, 55, 27–34. [Google Scholar] [CrossRef]
  11. Gite, R.A.; Loharkar, P.K.; Shimpi, R. Friction stir welding parameters and application: A review. Mater. Today Proc. 2019, 19, 361–365. [Google Scholar] [CrossRef]
  12. Sillapasa, K.; Mutoh, Y.; Miyashita, Y.; Seo, N. Fatigue Strength Estimation Based on Local Mechanical Properties for Aluminum Alloy FSW Joints. Materials 2017, 10, 186. [Google Scholar] [CrossRef] [Green Version]
  13. Singh, V.P.; Patel, S.K.; Ranjan, A.; Kuriachen, B. Recent research progress in solid state friction-stir welding of aluminum–magnesium alloys: A critical review. J. Mater. Res. Technol. 2020, 9, 6217–6256. [Google Scholar] [CrossRef]
  14. Hakem, M.; Lebailli, S.; Miroud, J.; Bentaleb, A.; Toukali, S. Welding and characterization of 5083 aluminum alloy. In Proceedings of the Conference METAL 2012 Proceedings, 21st International Conference on Metallurgy and Materials, Hotel Voronez I, Brno, Czech Republic, 23–25 May 2012. [Google Scholar]
  15. Kasman, S.; Yenier, Z. Analyzing dissimilar friction stir welding of AA5754/AA7075. Int. J. Adv. Manuf. Technol. 2014, 70, 145–156. [Google Scholar] [CrossRef]
  16. Salehi, M.; Saadatmand, M.; Aghazadeh Mohandesi, J. Optimization of process parameters for producing AA6061/SiC nanocomposites by friction stir processing. Trans. Nonferrous Met. Soc. China 2012, 22, 1055–1063. [Google Scholar] [CrossRef]
  17. Kim, N.-K.; Kim, B.-C.; An, Y.-G.; Jung, B.-H.; Song, S.-W.; Kang, C.-Y. The Effect of material arrangement on mechanical properties in friction stir welded dissimilar A5052/A5J32 aluminum alloys. Met. Mater. Int. 2009, 15, 671–675. [Google Scholar] [CrossRef]
  18. Reza-E-Rabby, M.D.; Anthony, P.R. Effect of tool pin thread forms on friction stir weldability of different aluminum alloys. Procedia Eng. 2014, 90, 637–642. [Google Scholar] [CrossRef]
  19. Roshan, S.B.; Jooibari, M.B.; Teimouri, R.; Asgharzadeh-Ahmadi, G.; Falahati-Naghibi, M.; Sohrabpoor, H. Optimization of friction stir welding process of AA7075 aluminum alloy to achieve desirable mechanical properties using ANFIS models and simulated annealing algorithm. Int. J. Adv. Manuf. Technol. 2013, 69, 1803–1818. [Google Scholar] [CrossRef]
  20. Gibson, B.T.; Lammlein, D.H.; Prater, T.J.; Longhurst, W.R.; Cox, C.D.; Ballun, M.C.; Strauss, A.M. Friction stir welding: Process automation and control. J. Manuf. Processes 2014, 16, 56–73. [Google Scholar] [CrossRef]
  21. Amini, S.; Amiri, M.R.; Barani, A. Investigation of the effect of tool geometry on friction stir welding of 5083-O aluminum alloy. Int. J. Adv. Manuf. Technol. 2015, 76, 255–261. [Google Scholar] [CrossRef]
  22. ASTM International. Standard Test Methods for Tension Testing of Metallic Materials E 8M—04. In Annual Book of ASTM Standard; ASTM International: West Conshohocken, PA, USA, 1996; Volume 03.01, pp. 1–24. [Google Scholar]
  23. Rao, S.R.; Padmanabhan, G. Application of Taguchi methods and ANOVA in optimization of process parameters for metal removal rate in electrochemical machining of Al/5%SiC composites. Int. J. Eng. Res. Appl. 2012, 2, 192–197. [Google Scholar]
  24. Vijayan, S.; Raju, R.; Subbaiah, K.; Sridhar, N.; Rao, S.R.K. Friction stir welding of Al–Mg alloy-optimization of process parameters using Taguchi method. Exp. Tech. 2010, 34, 37–44. [Google Scholar] [CrossRef]
  25. D’Urso, G.; Giardini, C. The influence of process parameters and tool geometry on mechanical properties of friction stir welded aluminum lap joints. Int. J. Mater. Form. 2010, 3, 1011–1014. [Google Scholar] [CrossRef]
  26. Shahraki, S.; Khorasani, S.; Behnagh, R.A.; Fotouhi, Y.; Bisadi, H. Producing of AA5083/ZrO2 nanocomposite by friction stir processing (FSP). Metall. Mater. Trans. B 2013, 44, 1546–1553. [Google Scholar] [CrossRef]
  27. Cho, J.-H.; Boyce, D.E.; Dawson, P.R. Modeling strain hardening and texture evolution in friction stir welding of stainless steel. Mater. Sci. Eng. A 2005, 398, 146–163. [Google Scholar] [CrossRef]
  28. Nandan, R.; DebRoy, T.; Bhadeshia, H.K.D.H. Recent advances in friction-stir welding-process-weldment structure and properties. Prog. Mater Sci. 2008, 53, 980–1023. [Google Scholar] [CrossRef] [Green Version]
  29. Zhao, Y.; Zhou, L.; Wang, Q.; Yan, K.; Zou, J. Defects and tensile properties of 6013 aluminum alloy T-joints by friction stir by friction stir welding. Mater. Des. 2014, 57, 146–155. [Google Scholar] [CrossRef]
  30. Salari, E.; Jahazi, M.; Khodabandeh, A.; Nanesa, H.G. Influence of tool geometry and rotational speed on mechanical properties and defect formation in friction stir lap welded 5456 aluminum alloy sheets. Mater. Des. 2014, 58, 381–389. [Google Scholar] [CrossRef]
  31. Ilman, M.N.; Triwibowo, N.A.; Wahyudianto, A.; Muslih, M.R. Environmentally assisted fatigue behaviour of stress relieved metal gas (MIG) AA5083 welds in 3.5% NaCl solution. Int. J. Fatigue 2017, 100, 285–295. [Google Scholar] [CrossRef]
  32. Abbasi, M.; Abdollahzadeh, A.; Bagheri, B.; Omidvar, H. The Effect of SiC Particle Addition During FSW on Microstructure and Mechanical Properties of AZ31 Magnesium Alloy. J. Mater. Eng. Perform. 2015, 24, 5037–5045. [Google Scholar] [CrossRef]
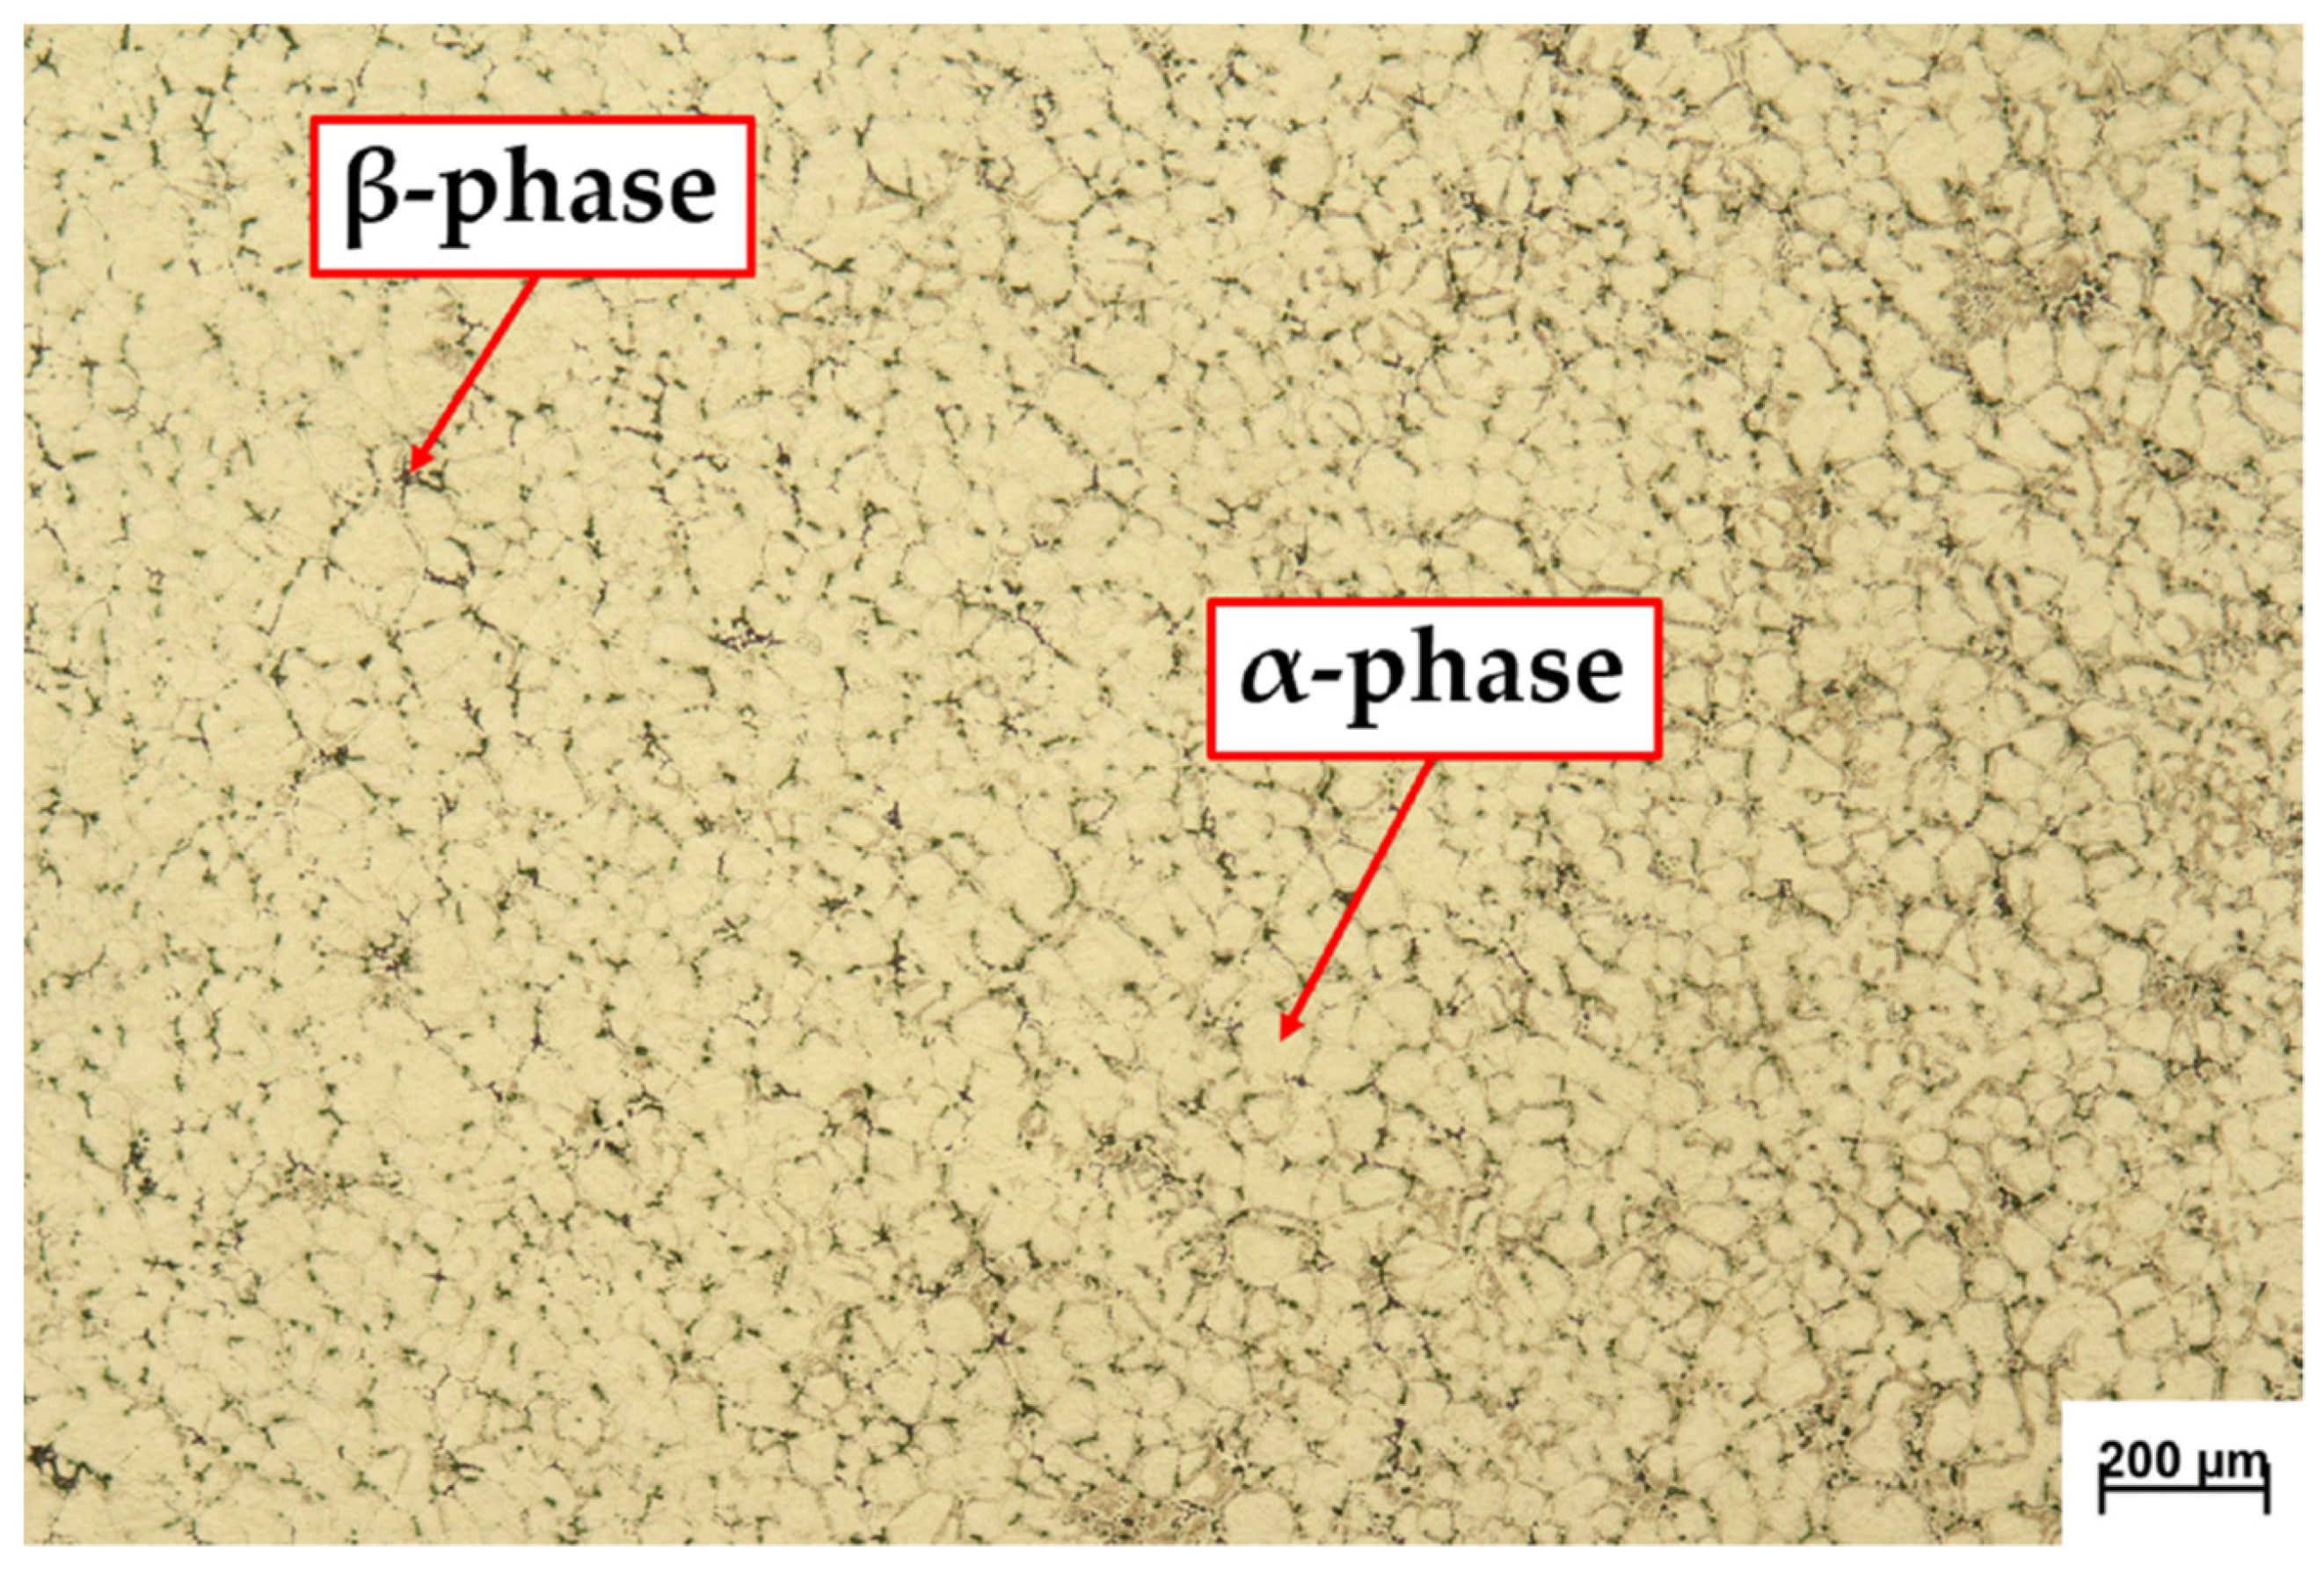
Figure 1. Microstructure of the base SSM 5083 aluminum alloys.
Jmmp 05 00088 g001
Figure 2. (a) Material dimensions and butt joint characteristics; (b) friction stir welding process (FSWp) of SSM 5083 aluminum alloys.
Jmmp 05 00088 g002
Figure 3. Tool profile for friction stir welding of SSM 5083 aluminum alloys: (a) straight cylindrical; (b) threaded cylindrical; (c) tapered cylindrical.
Jmmp 05 00088 g003
Figure 4. The cutting distance of the welding workpiece for mechanical properties testing and metallurgical structural analysis.
Jmmp 05 00088 g004
Figure 5. Dimensions of the ASTM E 8M-04 standard tensile specimen [22].
Jmmp 05 00088 g005
Figure 6. Profile of hardness test positions.
Jmmp 05 00088 g006
Figure 7. Main effects plot for the means for tensile strength.
Jmmp 05 00088 g007
Figure 8. Main effects plot for the S/N ratio for tensile strength.
Jmmp 05 00088 g008
Figure 9. Main effects plot for the means of hardness in the SZ.
Jmmp 05 00088 g009
Figure 10. Main effects plot for the S/N ratio for hardness in the SZ.
Jmmp 05 00088 g010
Figure 11. Fracture specimen of tensile test for a rotational speed of 1200 rpm, a welding speed of 10 mm/min, and with a threaded cylindrical tool pin profile.
Jmmp 05 00088 g011
Figure 12. The average tensile stress values and elongation (%) of nine samples.
Jmmp 05 00088 g012
Figure 13. The average hardness values in the SZ of the nine samples.
Jmmp 05 00088 g013
Figure 14. The hardness values at a rotational speed of 1200 rpm, a welding speed of 10 mm/min, and with a threaded cylindrical tool pin profile.
Jmmp 05 00088 g014
Figure 15. Welding characteristics of aluminum alloy SSM 5083 at the optimal conditions for tensile strength (a rotational speed of 1200 rpm, a welding speed of 10 mm/min, and with a threaded cylindrical tool pin profile).
Jmmp 05 00088 g015
Figure 16. Macrostructural characteristics of FSW process of alloy SSM 5083 at the optimal conditions for tensile strength (a rotational speed of 1200 rpm, a welding speed of 10 mm/min, and with a threaded cylindrical tool pin profile).
Jmmp 05 00088 g016
Figure 17. Microstructure of the welded joint at a rotational speed of 1200 rpm, a welding speed of 10 mm/min, and with a threaded cylindrical tool pin profile: (a) AS-TMAZ; (b) SZ; (c) pin tip on the AS; (d) RS-TMAZ.
Jmmp 05 00088 g017
Figure 18. Microstructure of the welded joint at a rotational speed of 1200 rpm, a welding speed of 30 mm/min, and a straight cylindrical tool pin profile: (a) AS-TMAZ; (b) SZ; (c) pin tip on the AS; (d) RS-TMAZ.
Jmmp 05 00088 g018
Figure 19. Microstructural analysis of the welded joints using FE-SEM: (a) SEM at a; (b) SEM at b; (c) SEM at c; (d) SEM at d; (e) SEM at e; (f) SEM at f.
Jmmp 05 00088 g019
Figure 20. EDS analysis of welded joints: (a) SEM micrographs of SSM 5083; (b) element dispersion; (c) dispersion of C; (d) dispersion of O; (e) dispersion of Al; (f) dispersion of F; (g) dispersion of Mg; (h) dispersion of elements.
Jmmp 05 00088 g020
Table 1. Parameters values and their three levels.
LevelA
Rotational Speed
(RPM)
B
Welding Speed
(mm/min)
C
Tool Profile
Level 1100010Straight cylindrical
Level 2120020Threaded cylindrical
Level 3140030Tapered cylindrical
Table 2. Experimental layout: L9 orthogonal array, mean tensile strength values, and S/N ratio values.
Experiment
No.
A
Rotational Speed
(RPM)
B
Welding Speed
(mm/min)
C
Tool Profile
Tensile Strength (MPa)S/N Ratio
1100010Straight cylindrical21546.64
2100020Threaded cylindrical17144.65
3100030Tapered cylindrical13042.27
4120010Threaded cylindrical22146.88
5120020Tapered cylindrical13142.34
6120030Straight cylindrical11741.36
7140010Tapered cylindrical17845.00
8140020Straight cylindrical13842.79
9140030Threaded cylindrical15343.69
Table 3. Response table for means for tensile strength.
LevelRotational Speed
(RPM)
Welding Speed
(mm/min)
Tool Profile
1172.0204.7156.7
2156.3146.7181.7
3156.3133.3146.3
Delta15.771.335.3
Rank312
Table 4. Response table means for the S/N ratio for tensile strength.
LevelRotational Speed
(RPM)
Welding Speed
(mm/min)
Tool Profile
144.5346.1843.60
243.5343.2745.08
343.8342.4543.21
Delta1.003.741.87
Rank312
Table 5. Experimental layout: L9 orthogonal array, means values hardness, and S/N ratio values.
Experiment
No.
A
Rotational Speed
(RPM)
B
Welding Speed
(mm/min)
C
Tool Profile
Hardness
(HV)
S/N Ratio
1100010Straight cylindrical80.738.13
2100020Threaded cylindrical77.737.80
3100030Tapered cylindrical80.438.10
4120010Threaded cylindrical81.338.20
5120020Tapered cylindrical80.138.07
6120030Straight cylindrical78.137.85
7140010Tapered cylindrical77.237.75
8140020Straight cylindrical77.837.81
9140030Threaded cylindrical79.337.98
Table 6. Response table for the means of hardness in the SZ.
LevelRotational Speed
(RPM)
Welding Speed
(mm/min)
Tool Profile
179.6079.7378.87
279.8378.5379.43
378.1079.2779.23
Delta1.731.200.57
Rank123
Table 7. Response table for the S/N ratio for hardness in the SZ.
LevelRotational Speed
(RPM)
Welding Speed
(mm/min)
Tool Profile
138.0238.0337.94
238.0437.9038.00
337.8537.9837.98
Delta0.190.130.06
Rank123
Table 8. Analysis of variance for the means of tensile strength.
SourceDFSeq SSAdj SSAdj MSFp% Contribution
Rotational speed2490.9490.9245.442.570.2804.34
Welding speed28630.28630.24315.1145.210.02276.43
Tool profile21980.21980.2990.1110.370.08817.53
Error2190.9190.995.44 1.70
Total811,292.2
S = 9.770; R-Sq = 98.3%; R-Sq(adj) = 93.2%.
Table 9. Analysis of variance for the signal-to-noise ratios for tensile strength.
SourceDFSeq SSAdj SSAdj MSFp% Contribution
Rotational speed21.56861.56860.78433.410.2275.06
Welding speed223.126723.126711.563450.330.01974.64
Tool profile25.83165.83162.915812.690.07318.82
Error20.45950.45950.2297 1.48
Total830.9864
S = 0.4793; R-Sq = 98.5%; R-Sq(adj) = 94.1%.
Table 10. Analysis of variance for hardness means.
SourceDFSeq SSAdj SSAdj MSFp% Contribution
Rotational speed25.30895.30892.65440.510.66128.95
Welding speed22.19562.19561.09780.210.82511.98
Tool profile20.49560.49560.24780.050.9542.70
Error210.335610.33565.1678 56.37
Total818.3356
S = 2.273; R-Sq = 43.6%; R-Sq(adj) = 0.0%.
Table 11. Analysis of variance for the signal-to-noise ratios for hardness.
SourceDFSeq SSAdj SSAdj MSFp% Contribution
Rotational speed20.0638320.0638320.0319160.510.66228.93
Welding speed20.0259760.0259760.0129880.210.82811.78
Tool profile20.0059070.0059070.0029530.050.9552.68
Error20.1248860.1248860.062443 56.61
Total80.220601
S = 0.2499; R-Sq = 43.4%; R-Sq(adj) = 0.0%.
Table 12. The results of EDS analysis.
ElementLine
Type
Apparent
Concentration
K Ratiowt%wt%
Sigma
Atomic
%
Standard
Label
CK series0.760.0076255.860.4968.80C Vit
OK series0.590.0019922.340.3120.66SiO2
FK series0.150.000302.990.162.32CaF2
NaK series0.010.000060.210.040.14Albite
MgK series0.050.000361.020.040.62MgO
AlK series0.650.0046711.670.146.40Al2O3
SiK series0.020.000160.390.030.20SiO2
ClK series0.020.000140.300.030.13NaCl
PdK series0.210.002125.220.120.73Pd
Total 100.00 100.00
Publisher’s Note: MDPI stays neutral with regard to jurisdictional claims in published maps and institutional affiliations.