Article

Work Envelope Expansion and Parametric Optimization in WAAM with Relative Density and Surface Aspect as Quality Constraints: The Case of Al5Mg Thin Walls with Active Cooling

by
Leandro João da Silva
1,*,
Felipe Ribeiro Teixeira
1,
Douglas Bezerra Araújo
1,
Ruham Pablo Reis
1 and
Américo Scotti
1,2
1
Center for Research and Development of Welding Processes (Laprosolda), Federal University of Uberlandia (UFU), Uberlândia, MG 38408-100, Brazil
2
Division of Welding Technology, Production Technology West, Department of Engineering Science, University West, 461 32 Trollhättan, Sweden
*
Author to whom correspondence should be addressed.
J. Manuf. Mater. Process. 2021, 5(2), 40; https://doi.org/10.3390/jmmp5020040
Submission received: 6 April 2021 / Revised: 18 April 2021 / Accepted: 21 April 2021 / Published: 23 April 2021

Abstract

:
The successful and efficient production of parts with specific features by Wire + Arc Additive Manufacturing (WAAM) strongly depends on the selection of proper and typically interrelated deposition parameters. This task might be particularly challenging in the making of thin walls, which might be highly impacted by processing conditions and heat accumulation. In this context, this study aims at expanding the work envelope and optimizing the parametric conditions in WAAM with relative density and surface aspects of the preforms as quality constraints. The experimental approach was based on the deposition of thin Al5Mg walls by the CMT process on its standard welding setup and with an active cooling technique to enhance the deposition robustness. Internal voids were estimated by Archimedes’ method. The surface quality of the walls was assessed through the visual aspect and the surface waviness by cross-section analysis. All the conditions presented relative density higher than 98%. The upgrade of the standard welding hardware to WAAM purposes through the addition of a supplementary shielding gas nozzle to the torch and the intensity of the heat sinking from the part significantly expanded the process work envelope, with its applicability being successfully demonstrated with multi-objective optimization. To sum up, a decision-making procedure is presented towards achieving intended preform quality.

1. Introduction

Wire + Arc Additive Manufacturing (WAAM) is a Directed Energy Deposition (DED) technique that uses an electric arc as a heat source and metallic wire as a feedstock. Because WAAM is based on welding equipment and consumables, one can say that WAAM is currently the most cost-accessible metal additive manufacturing process. Due to the nature of arc-based deposition processes—high deposition rate and large molten pool—WAAM has been proven as suitable to produce medium to large components with medium complexity. However, the successful and efficient production of parts with specific features by WAAM strongly depends on a cautious process planning, which includes an integrated selection of several and typically interrelated process parameter, such as build setup conditions, deposition parameters, consumables, path planning, thermal management, and post-processing [1].
To meet all these requirements, the end-users must use a systematic method for parameter selection (technically termed parametrization). Differently from well-established AM processes for polymers, whose transition from 3D model data to a machine code might be considered automatic, metal additive manufacturing processes still require a labor-intensive process for parameter investigation and selection, as reported by Dahat et al. [2], Gierth et al. [3], and Yehorov et al. [4] for WAAM.
Although numerical models are becoming increasingly accurate across a wide spectrum, especially in terms of thermomechanical-related features, their use for parametrization tasks still requires expensive hardware and specialized labor and are often slow. As an alternative solution, experimental approaches in conjunction with statistical tools have been widely used to formulate empirical models to predict bead geometry for a given parametric setup and vice-versa. Parametric charts are another experimental-based approach to parameter selection that has been developed for WAAM [2], although are still more widespread in joining processes such as in Gas Metal Arc Welding (GMAW) metal transfer maps [5]. Table 1 outlines recent investigations on charts for parameter selection and approaches for their expansion and robustness improvement in WAAM processes.
However, these empirical parametrization approaches for WAAM may be quite limited due to low robustness. Moreover, they may offer low flexibility if only standard hardware, typically derived from welding counterparts, are employed. Additionally, the challenge of finding optimized setups becomes more complex when quality constraints typical of the additive manufacturing route are brought onto the table. Thus, the present study deals with the deposition parameter selection task and aims at expanding the work envelope in WAAM of thin walls and applying it for optimizing the parametric conditions, specifically with relative density and surface aspects of the preforms as quality constraints. An Al5Mg alloy is used as a case study due to its appeal for lightweight structures.

2. Methodology

The strategy to reach the proposed aims is based on the following steps:
(a)
Establishment of an operational map (hardware capabilities/limitations);
(b)
Design of a work envelope: A region within the operational map that meets some acceptance criteria;
(c)
Expansion of the work envelope through an upgrade of the welding hardware to WAAM purposes and improvement of process robustness;
(d)
Application of multi-objective numerical optimization based on the work envelope data;
(e)
Ordering of a decision-making procedure towards achieving intended preform quality features.

2.1. Experimental Procedures

WAAM of thin-walled structures might be particularly challenging because they are highly impacted by processing conditions and heat accumulation (poor heat sinking by conduction). Therefore, all the depositions were carried out using the Near-immersion Active Cooling (NIAC) thermal management technique to improve the process robustness, i.e., to keep a similar and stable condition all over the deposition time. According to this technique concept, the preform is deposited inside a work tank that is filled with water, whose level rises as the metal layers are deposited, with the distance separating the deposition and water levels being the main parameter for heat sinking control. Similar results in terms of preform geometry can be achieved without any special thermal management technique, but at the expense of a production time imperatively longer due to the cooling periods needed to keep correspondingly low interpass temperature levels (as it would be accomplished with a rather more specific thermal management technique) [14]. Moreover, due to its ability to prevent heat accumulation, and therefore its drawbacks, the NIAC technique has been proved to be capable of coupling increased manufacturing productivity with improved mechanical and geometric qualities [15]. The experimental rig and deposition details are presented in Figure 1.
The deposition runs, generally conditioned as summarized in Table 2, were carried out on vertical substrates clamped to the work tank to mimic wall-like preforms in terms of heat flux and stiffness since the onset of deposition. To mitigate the effects of hydrogen external sources, the substrates were lightly sanded just before each deposition run and the wire surface was continuously cleaned by a felt clamped to it right before the drive rolls, as shown in Figure 2.

2.2. Measurements

The following responses were measured:
  • Deposition parameters: Voltage, current, and wire feed speed;
  • Relative density;
  • Total Wall Width—TWW [6];
  • Effective Wall Width—EWW [6];
  • Surface Waviness—SW [6];
  • Layer Height—LH [6].
The actual deposition parameters were measured with an in-house DAQ system. The voltage probes were attached to the contact tube and substrate support to eliminate the inductive effect of the power source cables. The current was measured by a hall-effect transducer. The wire feed speed (WFS) measurements were performed by an optical encoder system clamped to the wire right after the drive rolls. The average instantaneous power method [16] was employed to calculate the arc energy per unit length of deposit as given by Equation (1).
A r c   e n e r g y = P i n s t T S = 1 n k = 1 n U k I k T S
where:
  • Arc energy: Arc energy per unit length of deposit (J/mm);
  • Pinst: Average instantaneous arc power (W);
  • TS: Travel speed (mm/s);
  • U: Deposition voltage (V);
  • I: Deposition current (A).
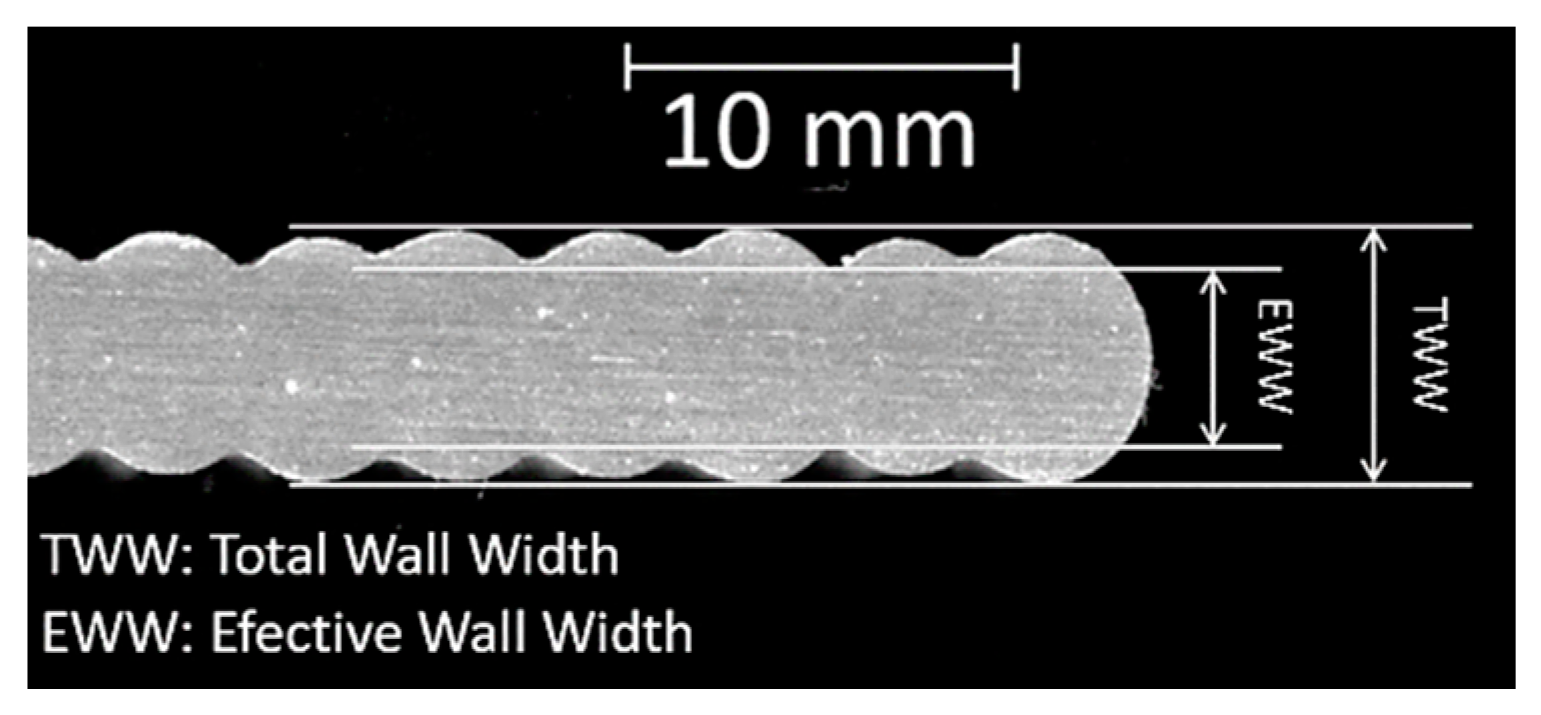
The presence of internal voids (mainly porosity) was assessed through relative density determination via Archimedes’ method, with the wire density estimated by the same method and used as reference. Considering the definitions from Martina et al. [6] and illustrated in Figure 3, the TWW, EWW, and SW dimensions were measured from cross-section macrographs by using an image analysis algorithm and Equation (2). It is worth mentioning that, although there are other standardized parameters to characterize surface texture, e.g., ANSI/ASME B46.1, the definitions from Martina et al. [6] were chosen to enable a straightforward comparison with the current WAAM literature, which rather employs such a notation.
S W = T W W E W W 2
During the building process, the heights of the preforms from the substrate at the 4th (PHL4) and 12th (PHL12) layers were measured with a Vernier caliper at the 50, 100, and 150 mm horizontal lengths. These average data were used to estimate the average LH as below (Equation (3)). The first 4 layers were disregarded to ensure that the process had already reached a steady-state regime.
L H = P H L 12 a v g P H L 4 a v g 8

2.3. Operational Map and Work Envelope

Initially, it is important to distinguish an operational map from a work envelope. In the present study, the operational map is a wider view exposing the hardware capability/limitations. More specifically, the work envelope is an area inside the operational map, wherein parametric conditions result in preforms that meet some acceptance criteria.

2.3.1. Definition of the Operational Map Boundaries: Hardware Capabilities

For a given WFS, the TS was increased and decreased from an average value (10 mm/s) in steps of 1.67 mm/s until reaching the wall quality limits, which were visually assessed in terms of humping formation and molten pool collapse. The layer-edge to water distance (LEWD) value of the NIAC thermal management technique was set at 20 mm, the measured interpass temperature (via IR pyrometry at the mid-length of each layer as per da Silva [17]) was kept below 50 °C, and the CTWD parameter was adjusted for each layer during the dwell times. This TS screening approach was inspired by Yehorov et al. [4], but while they increased the TS during the ongoing deposition, in this work, the TS was changed layer after layer. Similar approaches were used by Dahat et al. [2] and Plangger et al. [18] to raise operational maps for high-strength low-alloy steels, both using the CMT process.
The WFS and TS upper limits revealed are due to the hardware limitations, while their lower limits are due to the lack of fusion tendency, poor wettability between layers, and low production. For relatively low WFS and high TS values, the layer tends to become undulated (with humping). In contrast, for high WFS and low TS values, the molten pool grows and tends to collapse due to its large volume, corroborating Yehorov et al.’s [4] findings. The operational map boundaries were hence delimited by Equations (4) and (5) as follows.
3.0       T S   ( mm s )   25
4.0       W F S   ( m min )   10.5

2.3.2. Starting Point for the Development of the Work Envelope

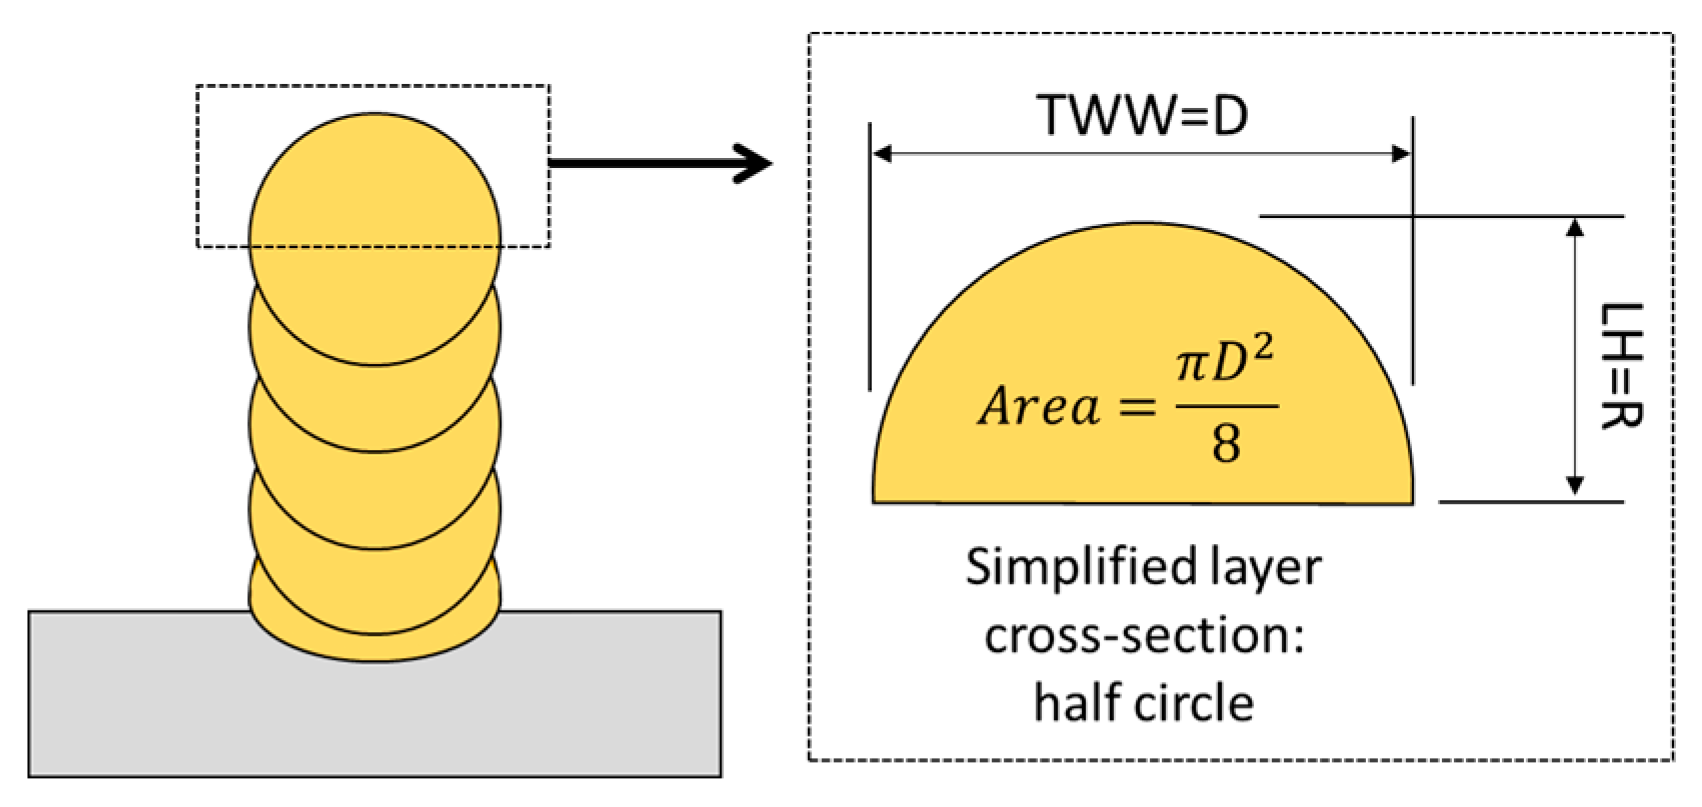
As a starting point for the development of the work envelope, a geometric relationship between the deposition parameters and the basic layer geometry was applied. This simplified modelling considers the layer cross-section as being a semi-circle, where its diameter (D) and radius (R) respectively represent the TWW and LH, as illustrated in Figure 4. Ríos et al. [7] showed that the layer geometry indeed tends to fit a semi-cylindrical geometry due to surface tension effects.
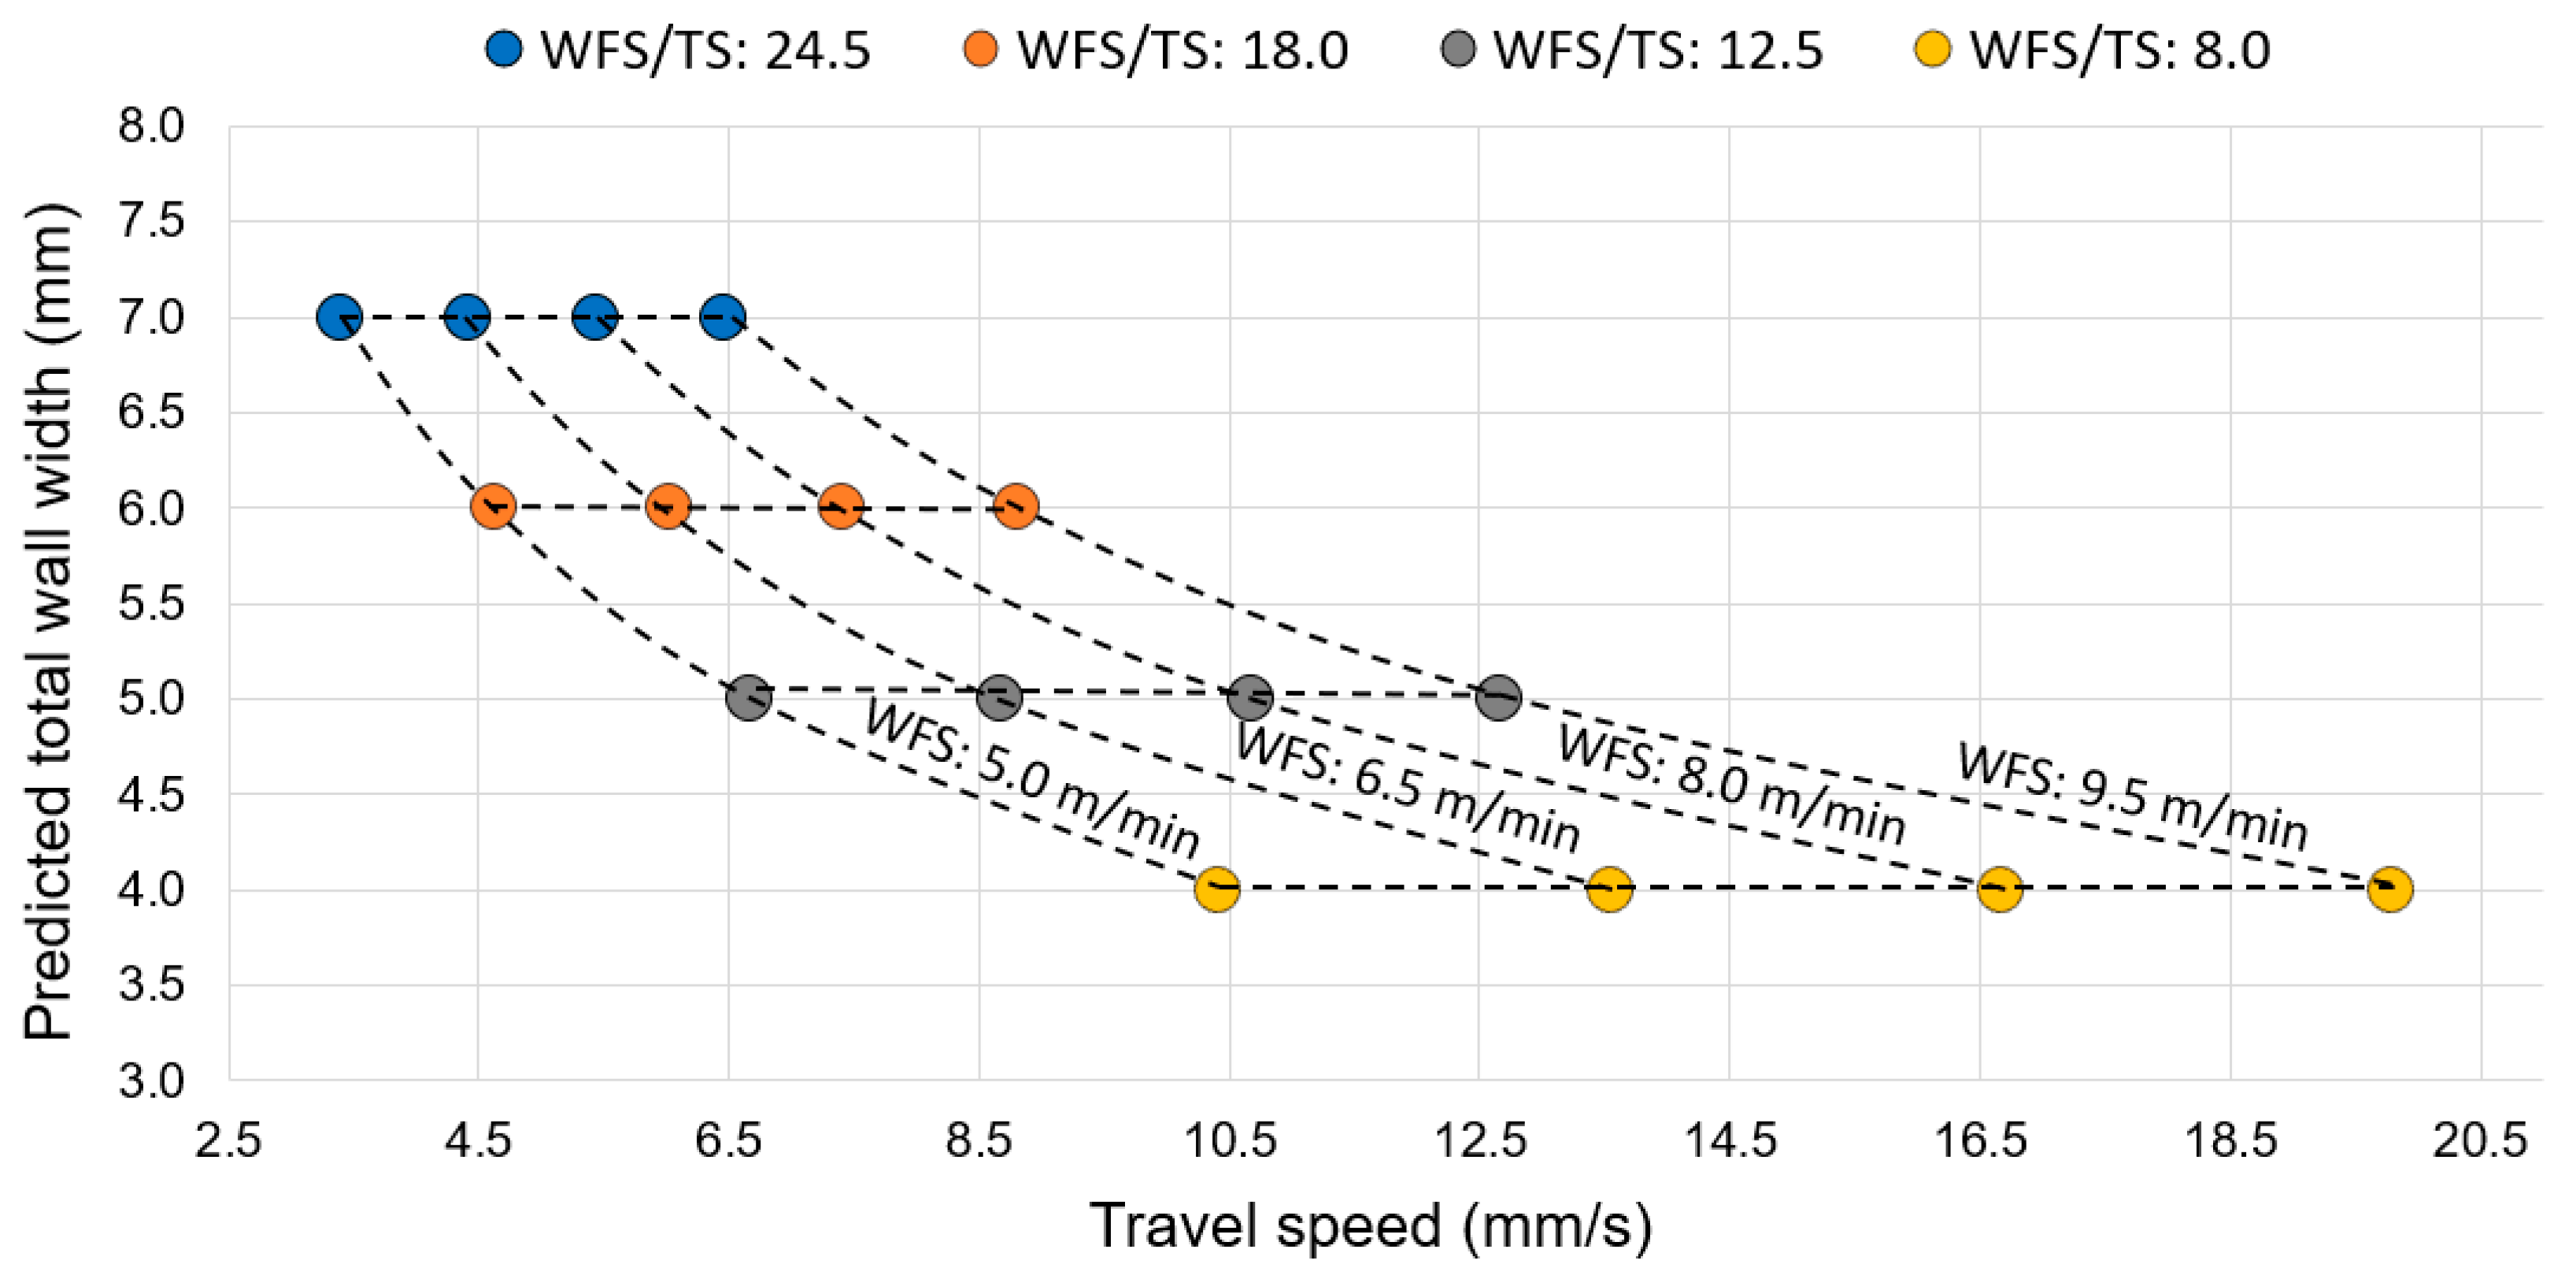
By considering a feasible wall width range as between 4 and 7 mm, which is in concordance with the literature [19,20], the WFS, TS, and LH values were predicted through a geometrical correlation presented in Equation (6).
π TWW 2 8 = WFS TS Wire area
where:
  • TWW: Total wall width (mm);
  • WFS: Wire feed speed (mm/s);
  • TS: Travel speed (mm/s);
  • WFS/TS: Wire deposition per unit length of deposit (-);
  • Wirearea: Wire cross-section area (mm2).
Figure 5 shows the work envelope as predicted, which was built considering variations of the TWW value in steps of 1 mm. It can be noticed that the WFS and TS values estimated all fall into a processable area of the operational map (Equations (4) and (5)). In this parametric chart, the WFS and TS parameters can be selected for a target TWW (y-axis). Moreover, through the WFS/TS ratio (secondary x-axis), values for the WFS and TS could be selected to achieve more production. However, some divergences are expected in the practical scenario due to the plasma jet pressure over the molten pool as well as caused by the interaction of the Earth’s gravity and molten pool volume and surface tension, which were not taken into account in this simplified prediction model.

2.3.3. The Work Envelope: Matrix of Experiments

Table 3 shows the matrix of experiments used in the experimental approach of the work envelope. This parametric combination was based on the proposed analytical model (Figure 4) and corresponds to the same data used to build the work envelope predicted in Figure 5. As reasonable repeatability is an intrinsic characteristic in WAAM due to multilayer depositions in each condition (12 layers), providing the process is stable, as it is the case with CMT and CNC systems, replicates were not performed. Nevertheless, three cross-sections were sampled from each wall (run) for evaluation.

2.3.4. The Work Envelope: Acceptance Criteria

As aforementioned, the work envelope is an area inside of the operational map and where the preforms reach one or more acceptance criteria. As no specific standards for WAAM of Al were found, pertinent acceptance criteria were established based on welding standards (i.e., AWS D1.2 Structural Welding Code—Aluminum) and related literature, as presented in Table 4.

3. Results

3.1. Deposition Parameters Analyses

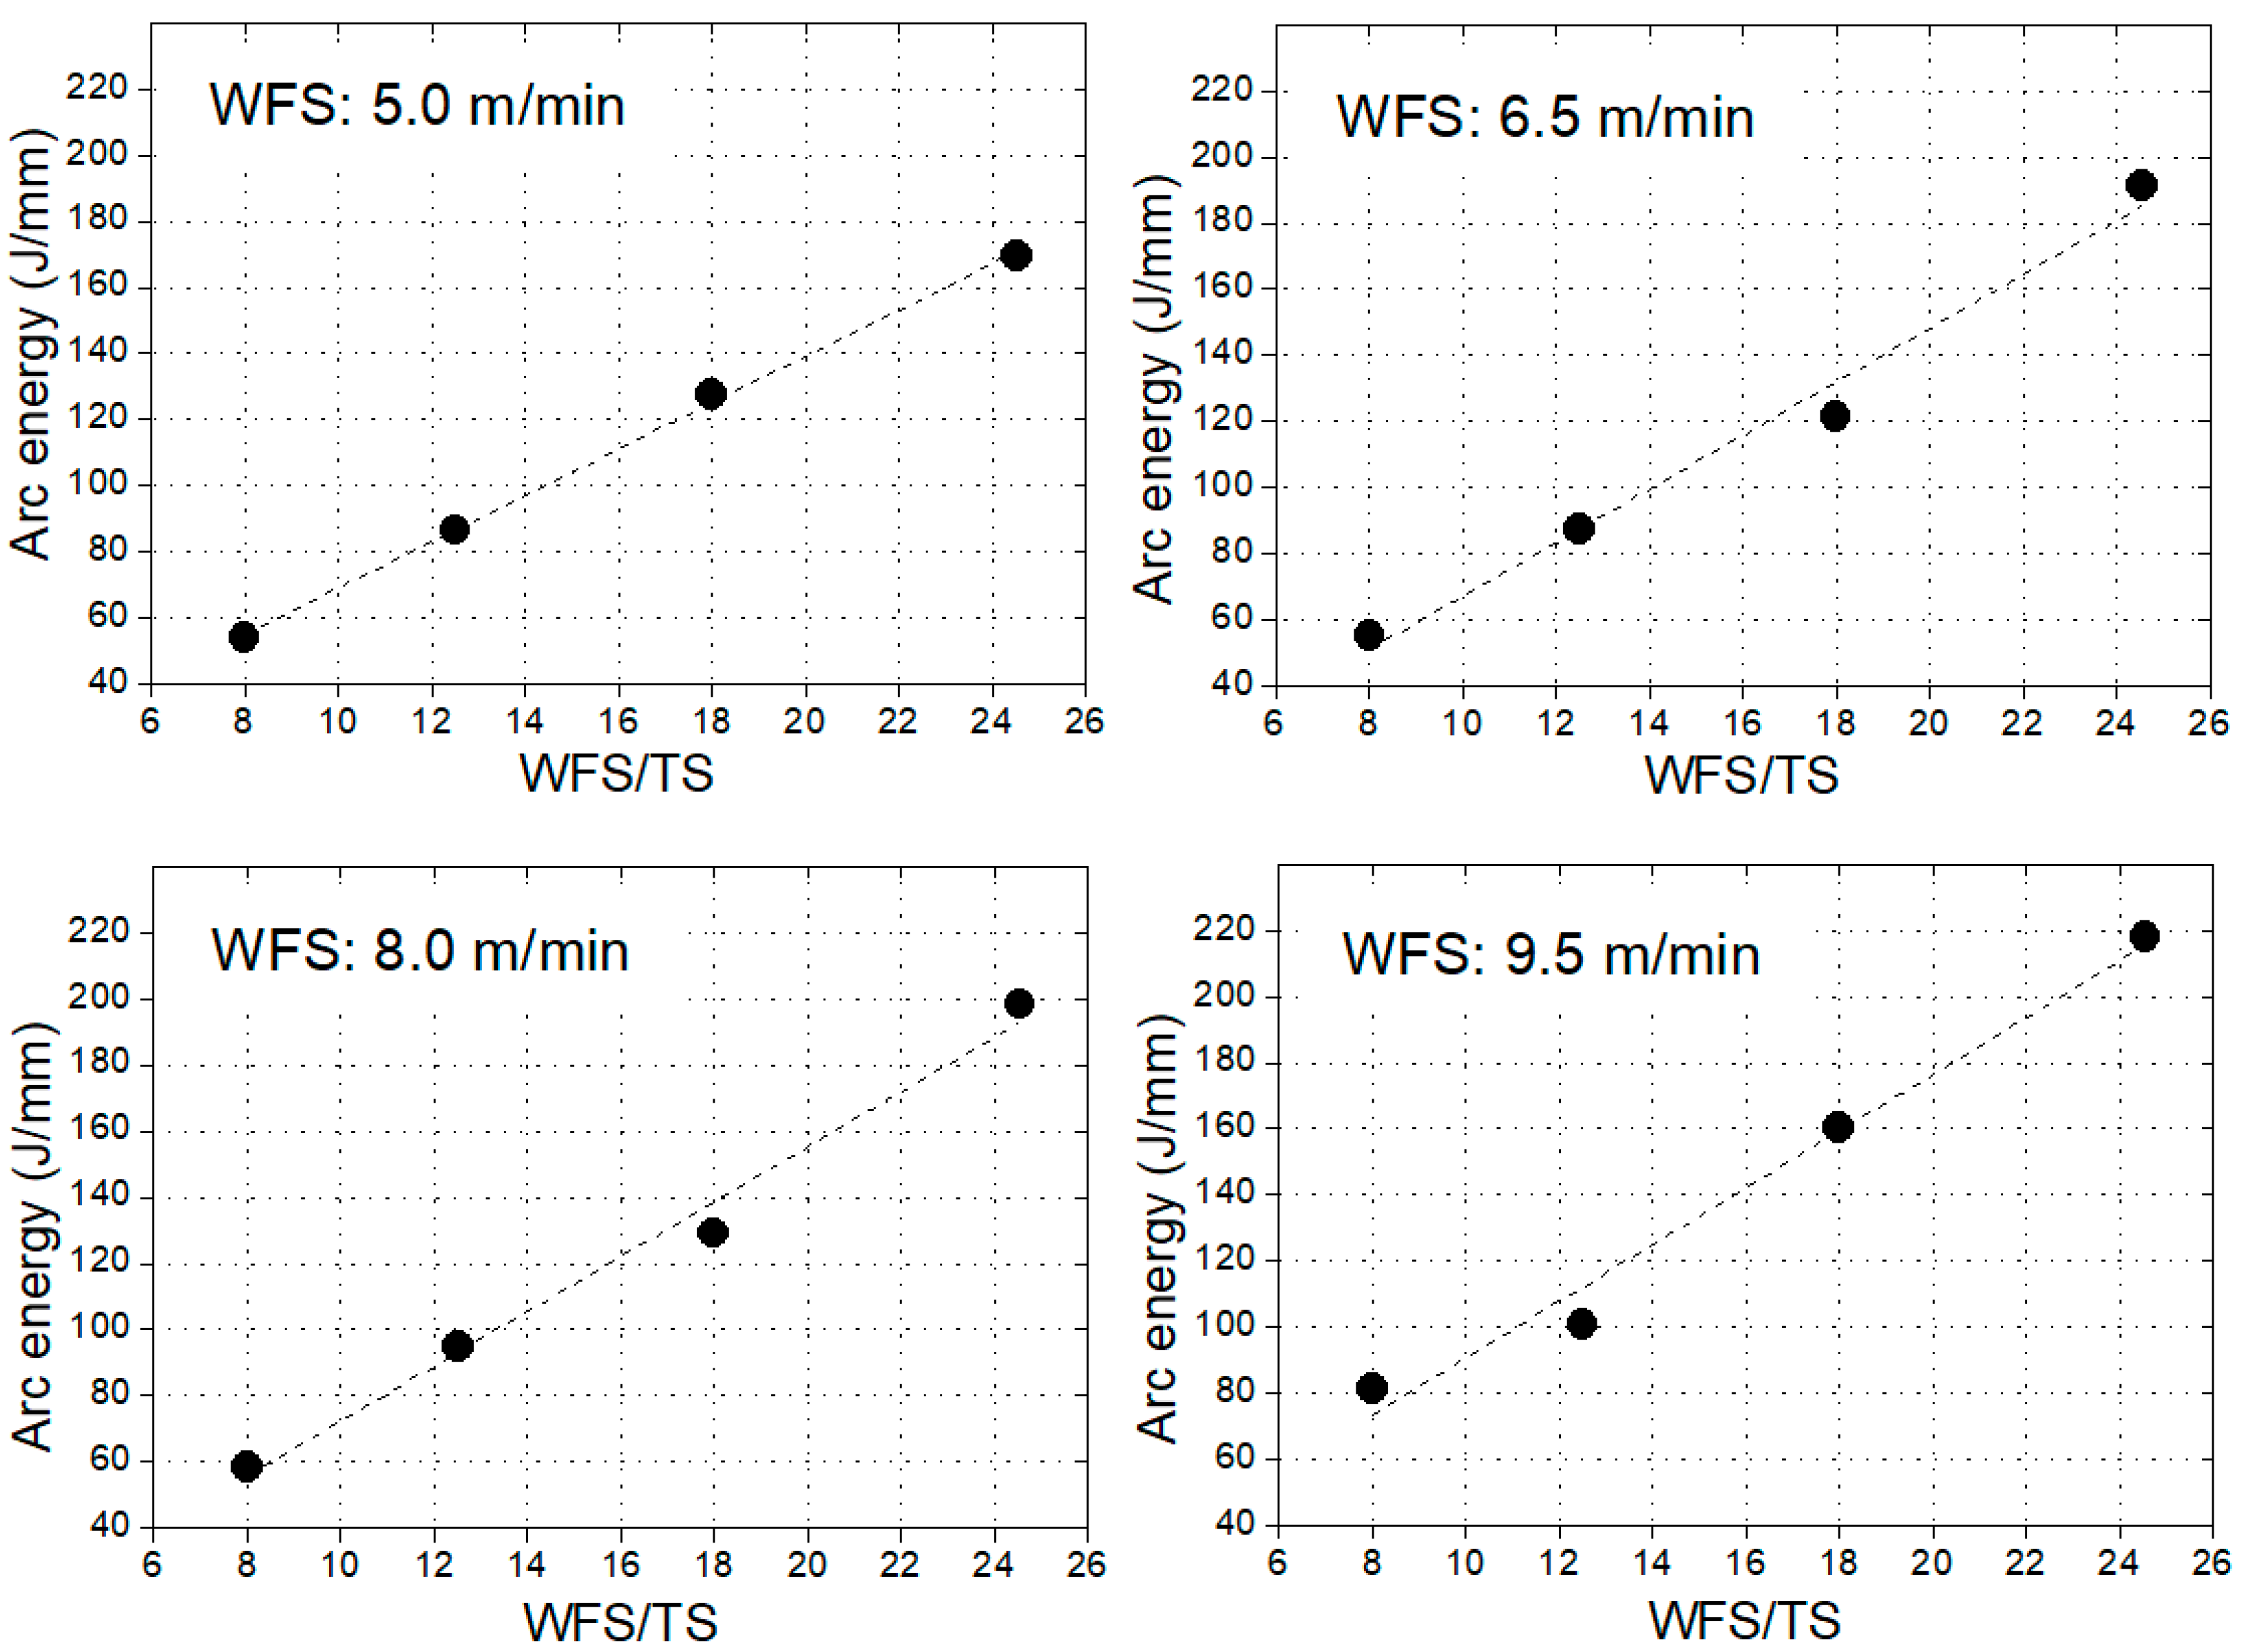
Two especially important factors to describe the thermal and geometric features in WAAM, as in arc welding, are the arc energy per unit length of deposit (hereinafter referred to as arc energy) and the wire deposition per unit length of deposit (hereinafter referred to as WFS/TS). For non-consumable electrode WAAM processes, like the PA and the GTA ones, these factors are independent, i.e., they can be selected separately. However, this is not the case for a consumable electrode WAAM process, such as the GMA one. In the CMT case (a variant of the GMA process), where the arc length is maintained as very short, the arc energy may be proportional to the WFS/TS ratio for a given WFS range. Aiming at the validation of such an assumption, the arc energy was plotted against WFS/TS values, as shown in Figure 6. As seen, the relationship between the arc energy and WFS/TS can be quite fitted to a linear behavior, so that, within the range of the WFS used, the arc energy is directly proportional to the WFS/TS ratio. In practice, this supports the statement that the higher the WFS/TS ratio, the higher the arc energy per unit length of deposit.

3.2. Work Envelope

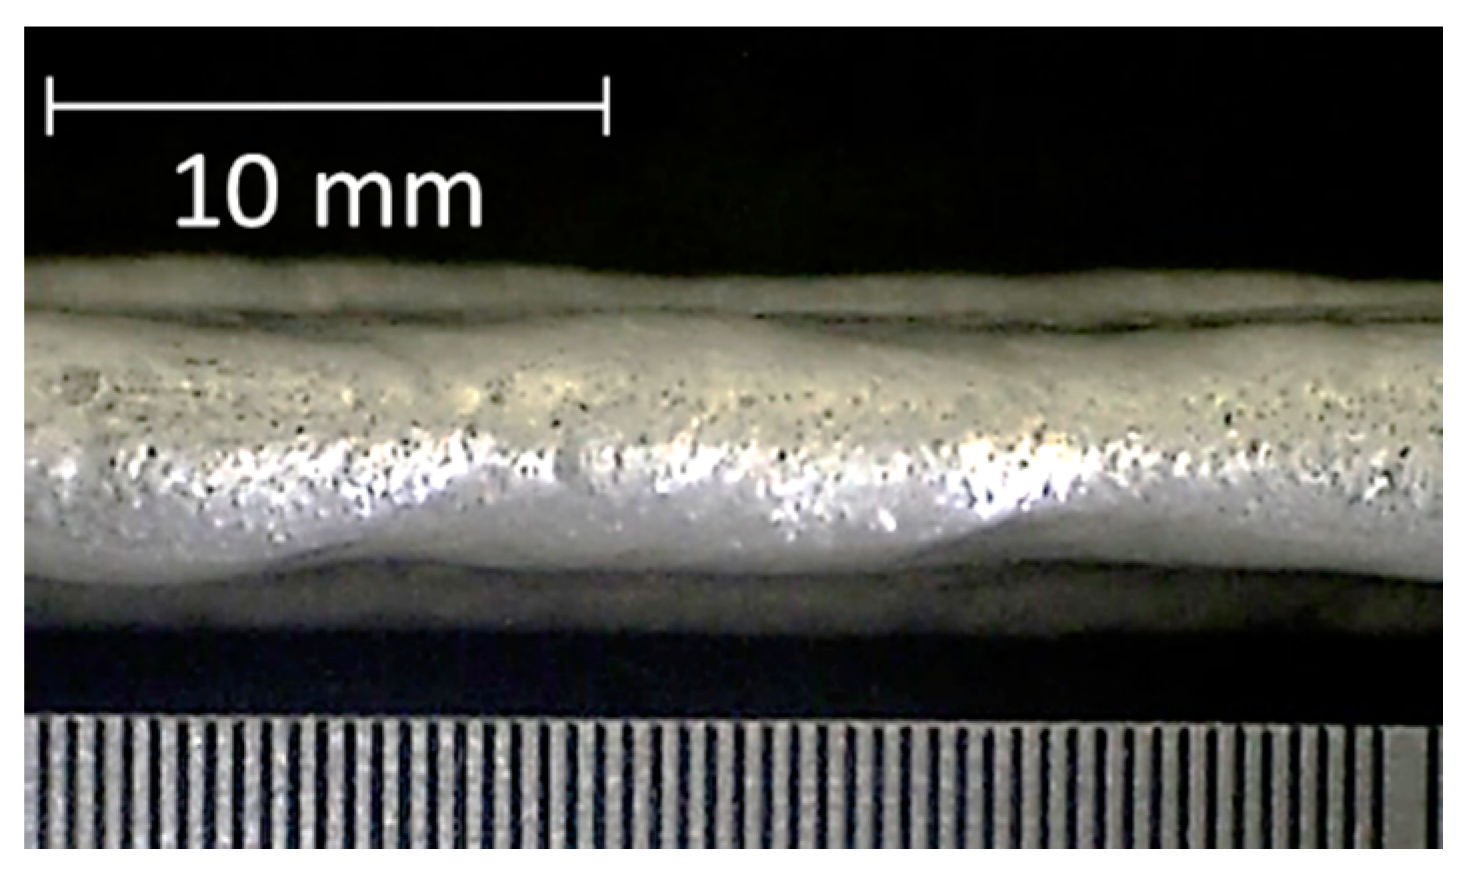
The preforms deposited with the WFS of 8.0 and 9.5 m/min did not reach the acceptance criteria of the surface aspect. For these conditions, the preform surface was always rough and matte due to excessive oxidation, as an example shown in Figure 7. This behavior could be related to a poor shielding action from the gas system employed. Factually, the nozzle that was used is designed for welding, where the shielding gas flux hits the plate in a large area (equivalent to the gas nozzle) and tends to spread out evenly. However, for WAAM of thin walls, usually narrower than the gas nozzle itself, most of the shielding gas flux tends to pass straight down and laterally along the wall sides, losing part of its shielding capability.
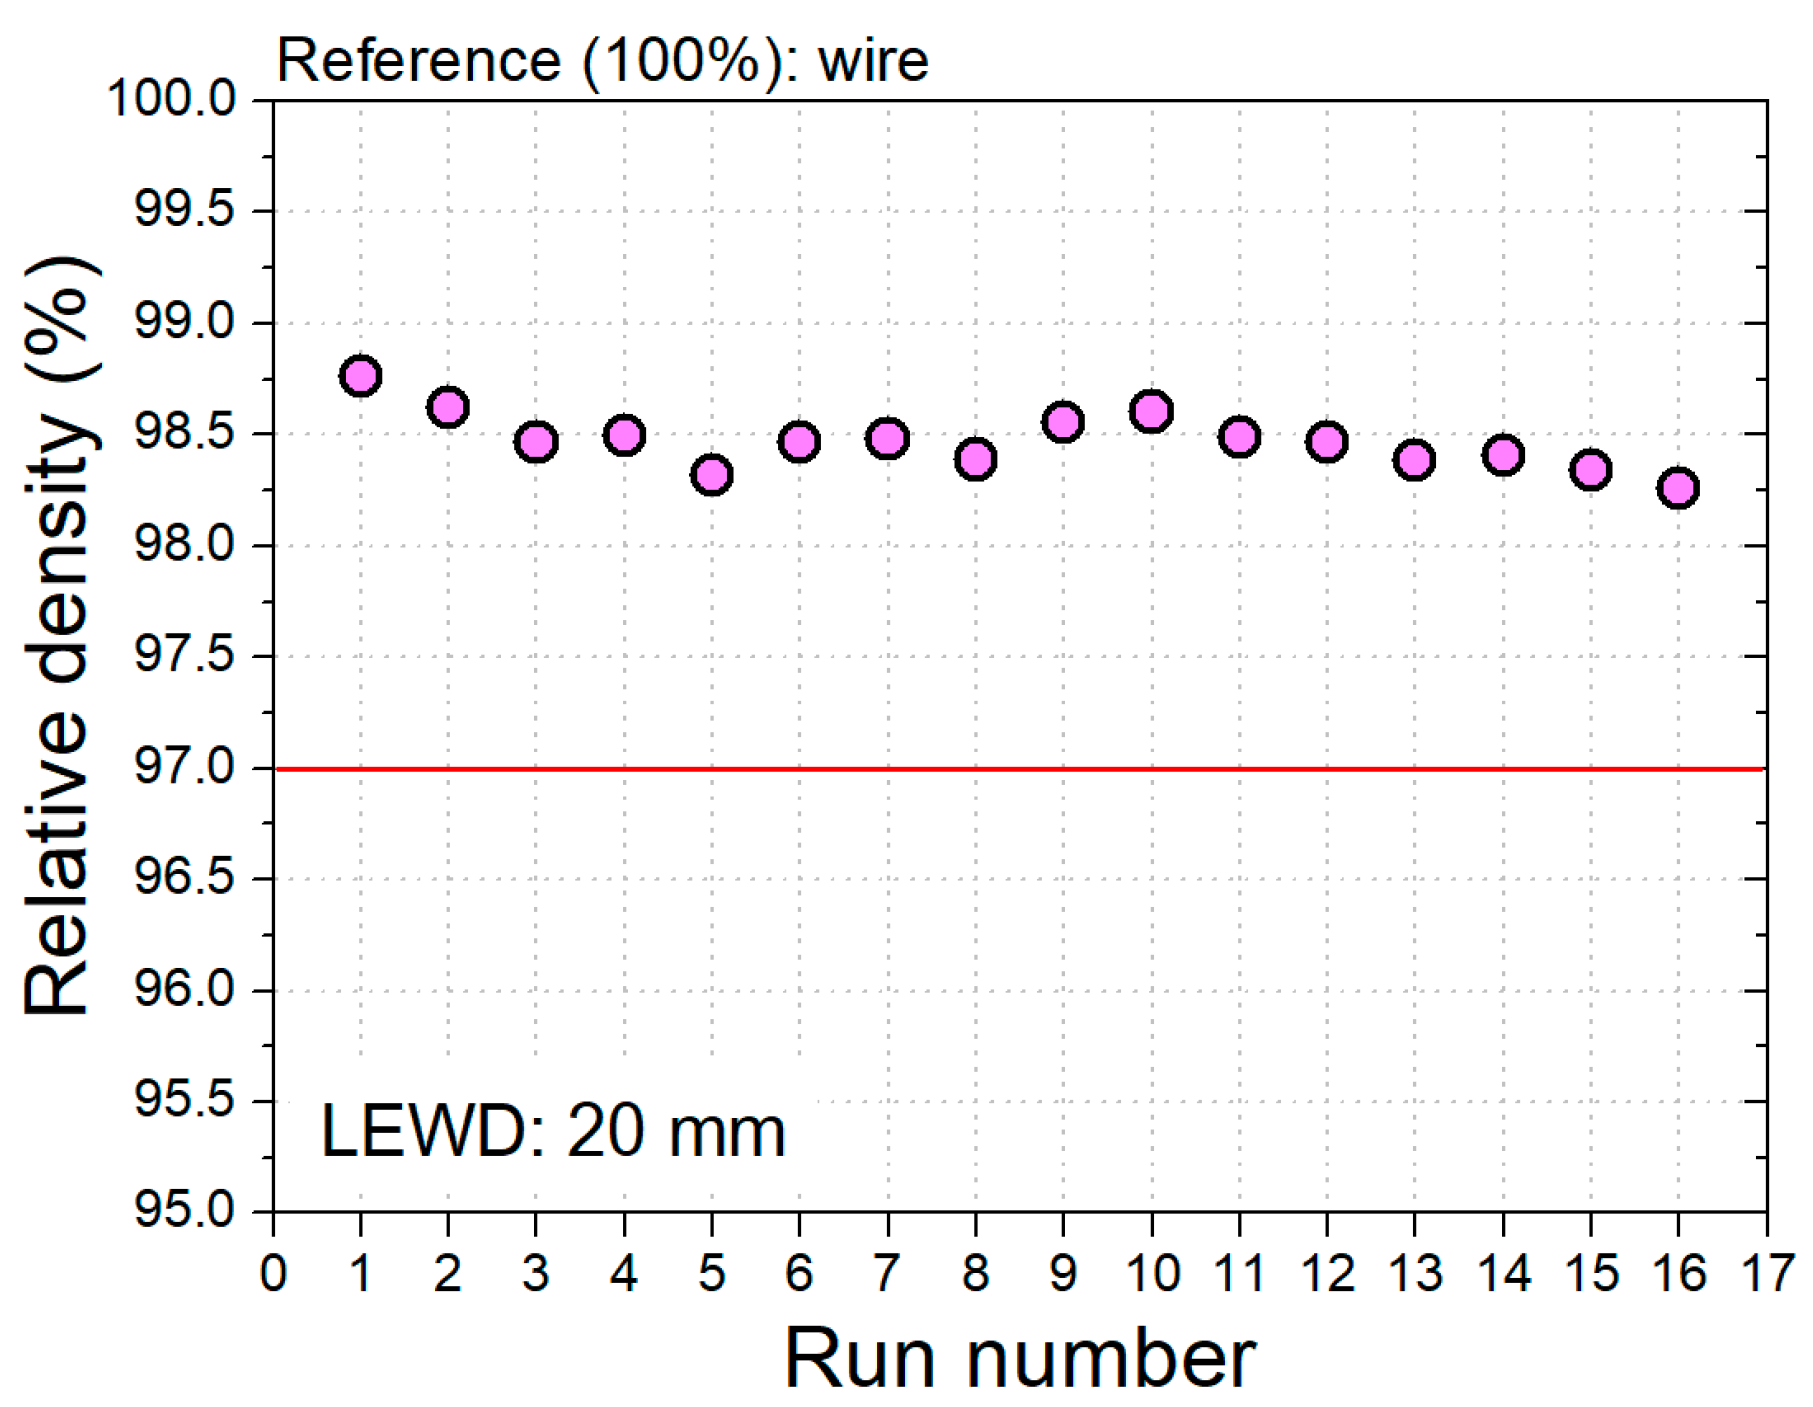
In terms of relative density (taken as porosity measure), all preforms reached an acceptable level, as shown in Figure 8. This outcome corroborates previous results [12,15].
An atlas of the typical cross-sections of the preforms is presented in Figure 9, where the WFS values determine the lines while the WFS/TS ratio determines the columns. For all the conditions, the TWW remained nearly constant along the preform height, which suggests that there was no significant heat accumulation and that all deposition conditions were kept constant throughout the layers.
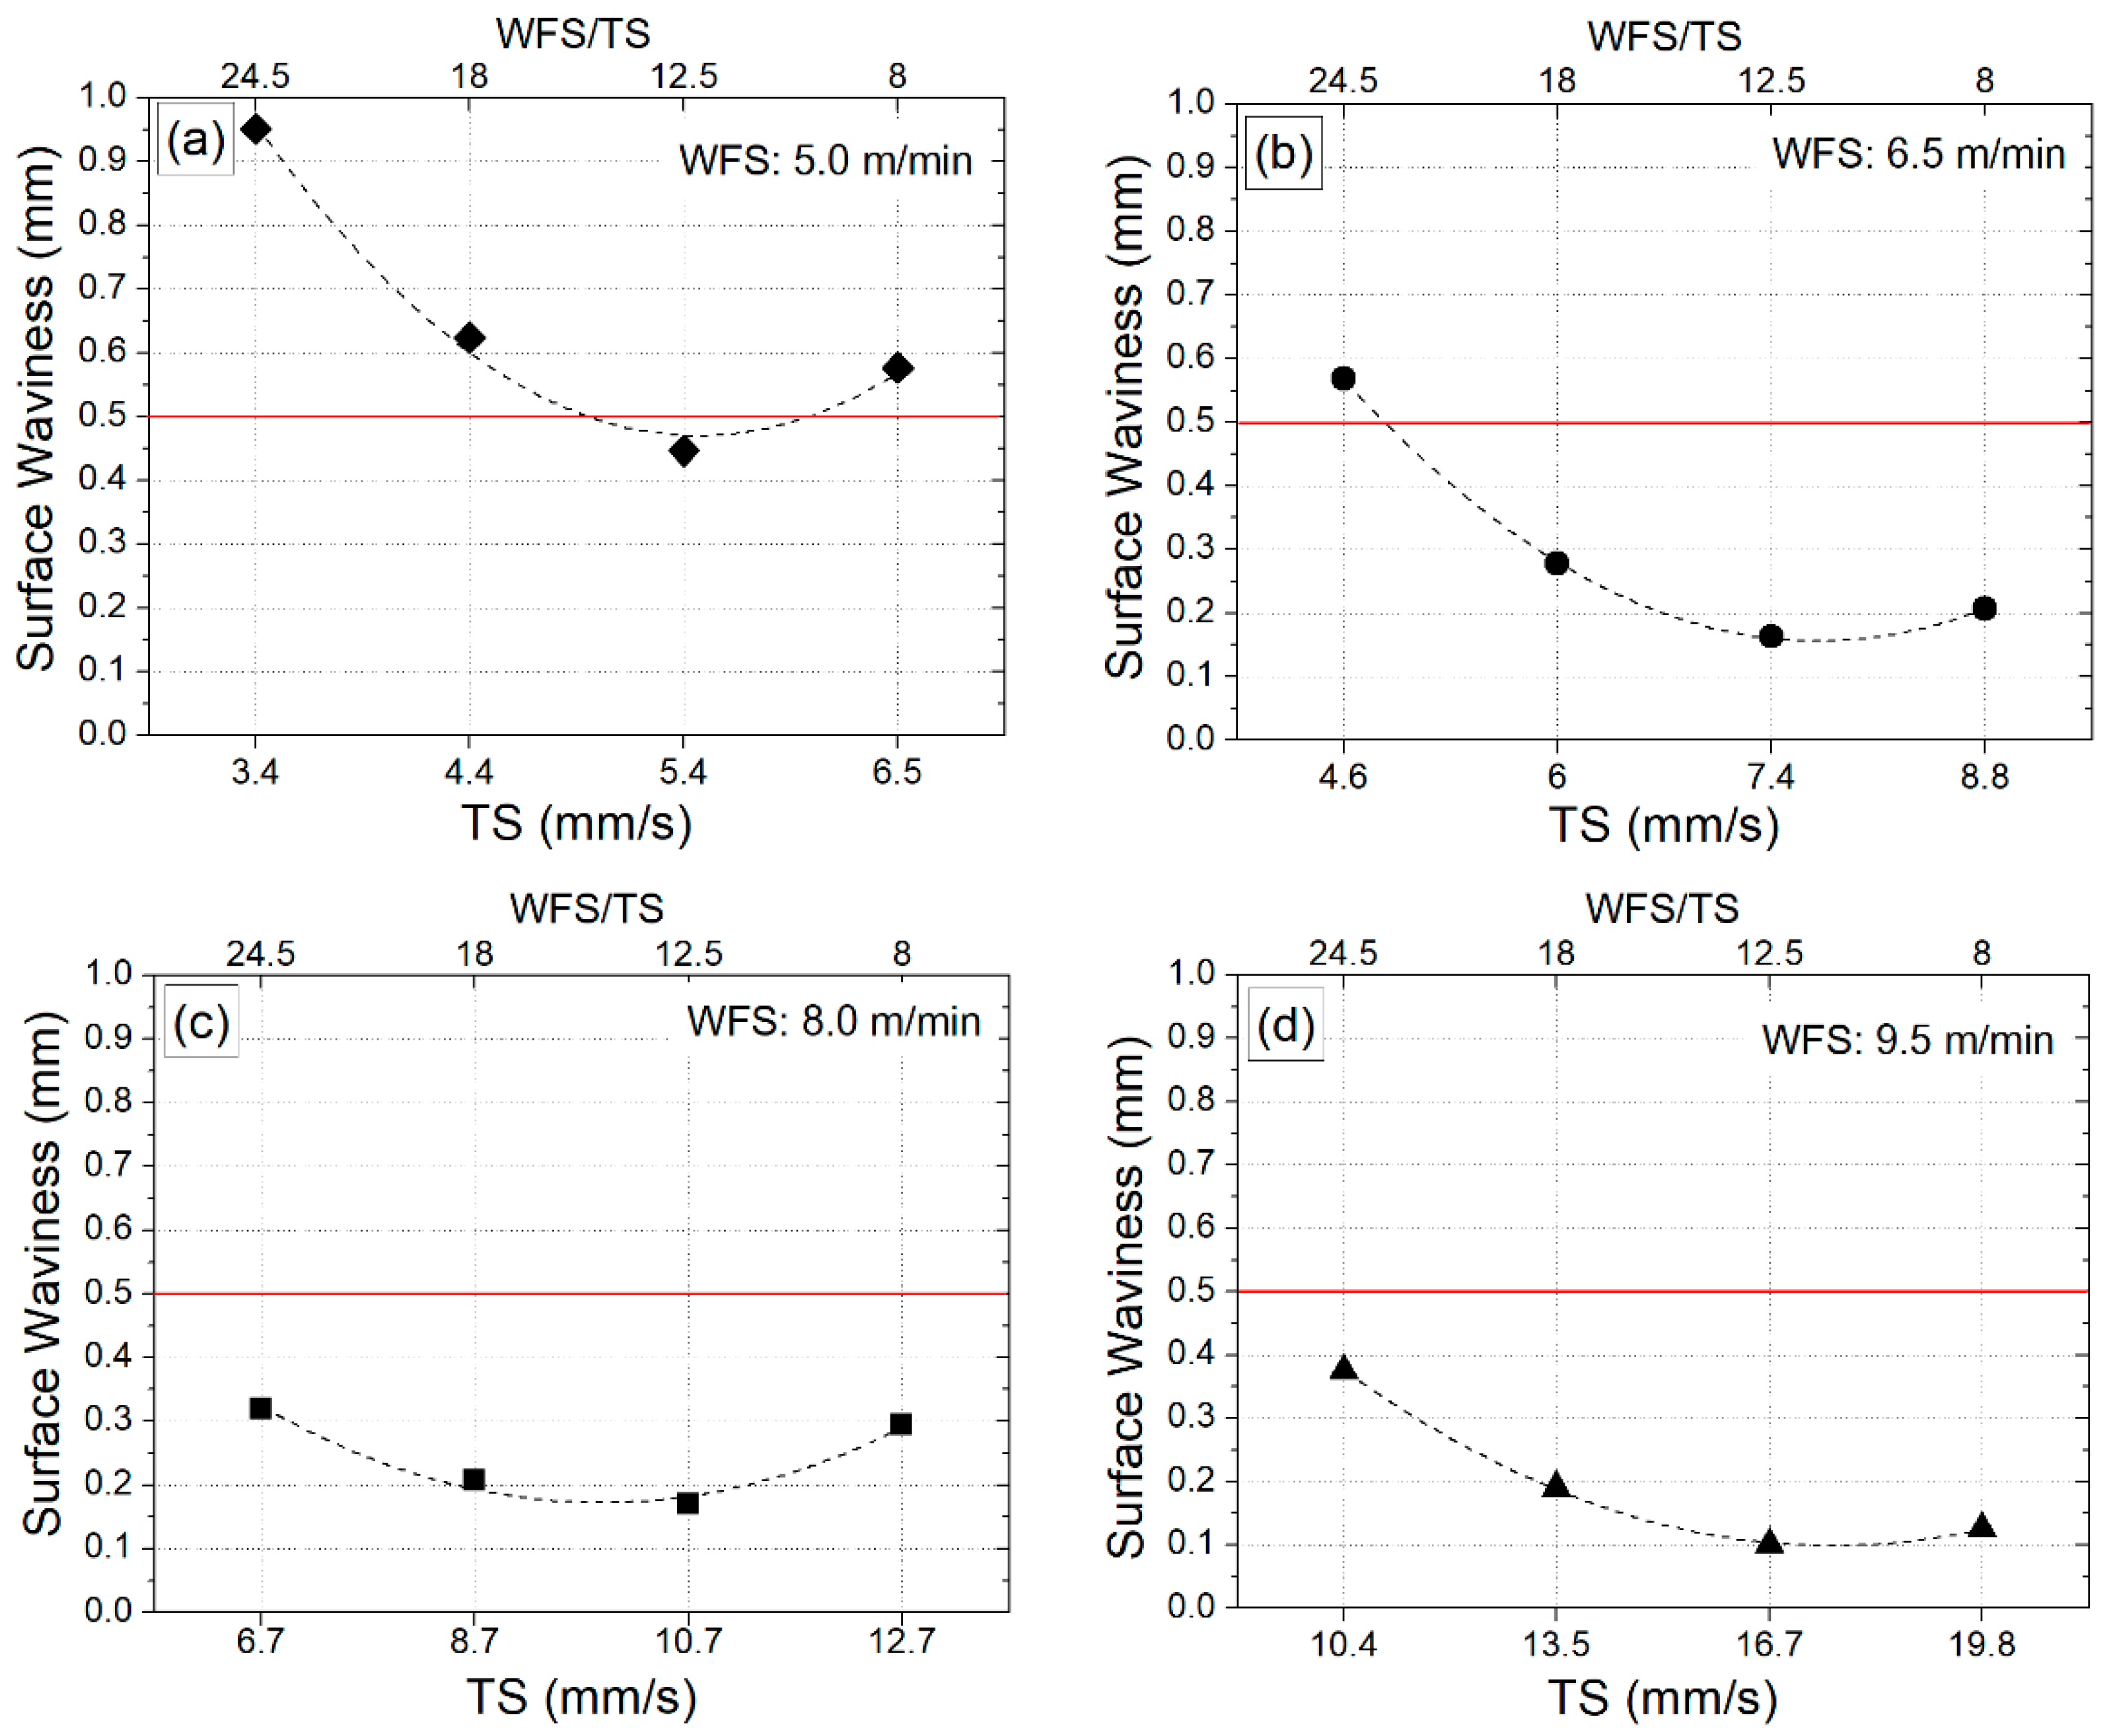
In general, the SW levels of these preforms were higher for lower WFS values, not reaching the acceptance criteria when such a parameter was set at 5.0 m/min, as shown in Figure 10. It is interesting to notice, also in Figure 10, that for all conditions, the SW evolution tends to fit a positive parabolic pattern with minimum values around the WFS/TS at 12.5 (arc energy per unit length of deposit: 90–100 J/mm). This behavior might be related to the amount of remelting of the previous layer. Just like with welding penetration, there may be competition between the effects caused by the WFS/TS ratio and the arc energy per unit length of deposit, such as the following alternatives:
  • Due to a higher WFS/TS, i.e., a higher wire deposition per unit length of deposit, the liquid volume of the molten pool interposed between the arc root and the previous layer is large, so that the heat input coming from the arc needs to pass through this liquid barrier first before reaching the solid previous layer and melt it more effectively; or
  • Due to a lower WFS/TS, i.e., a lower arc energy per unit length of deposit, there is insufficient remelting of the previous layer.
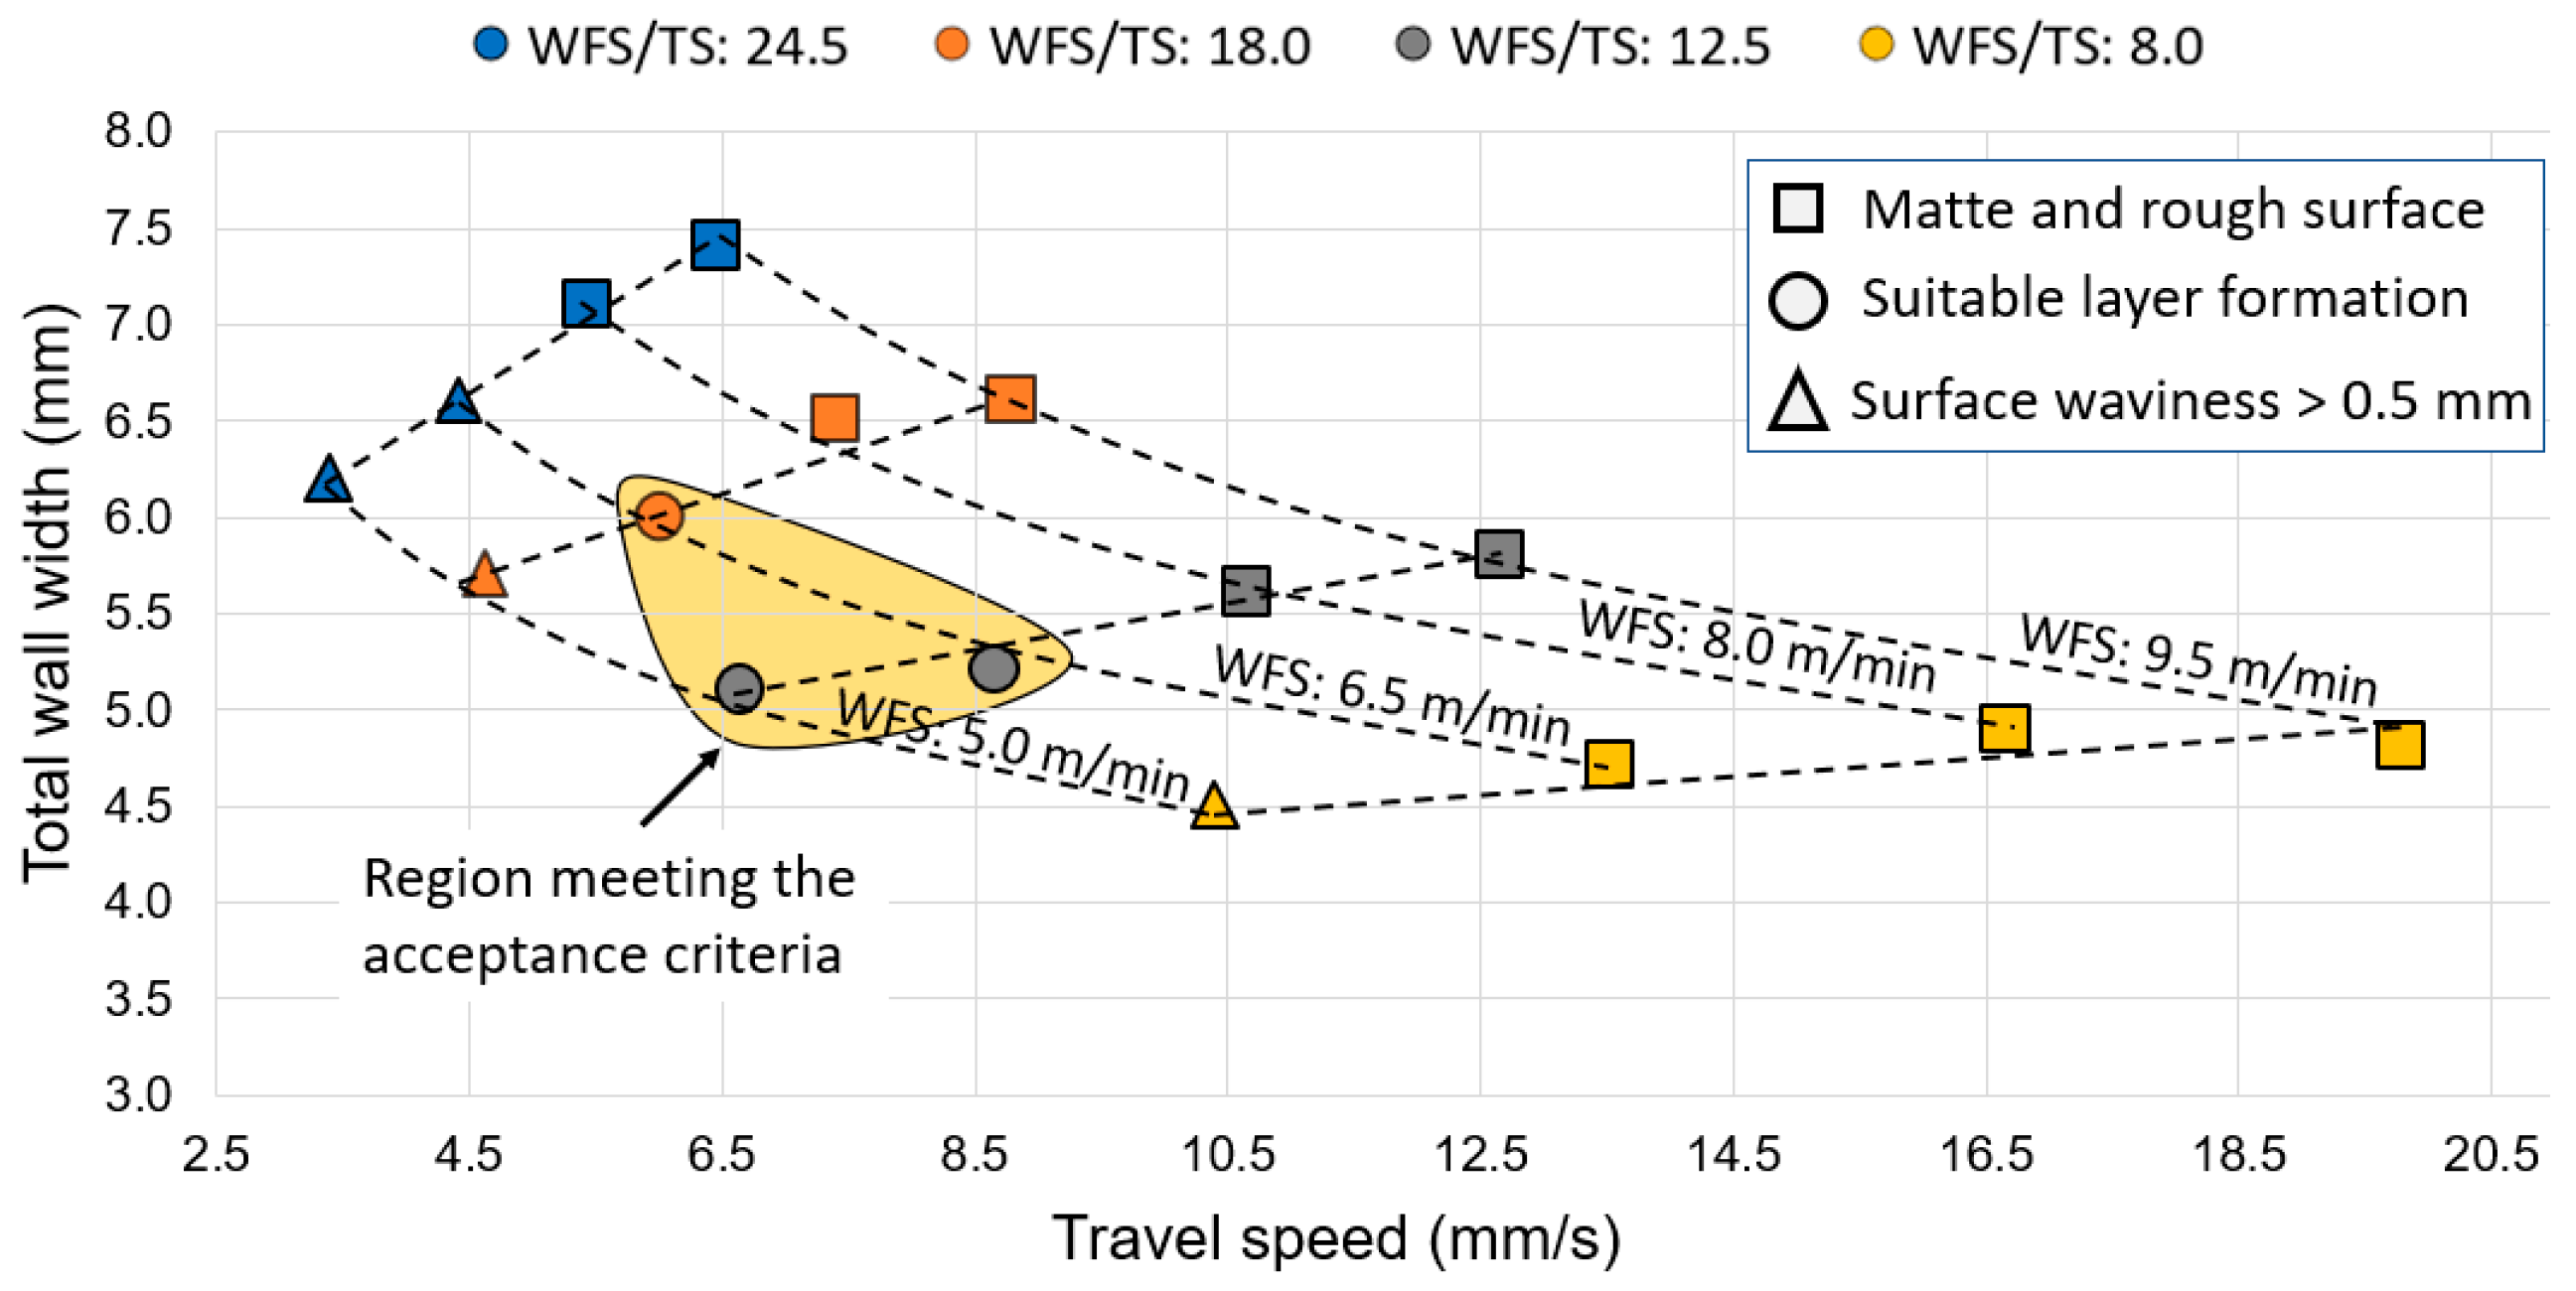
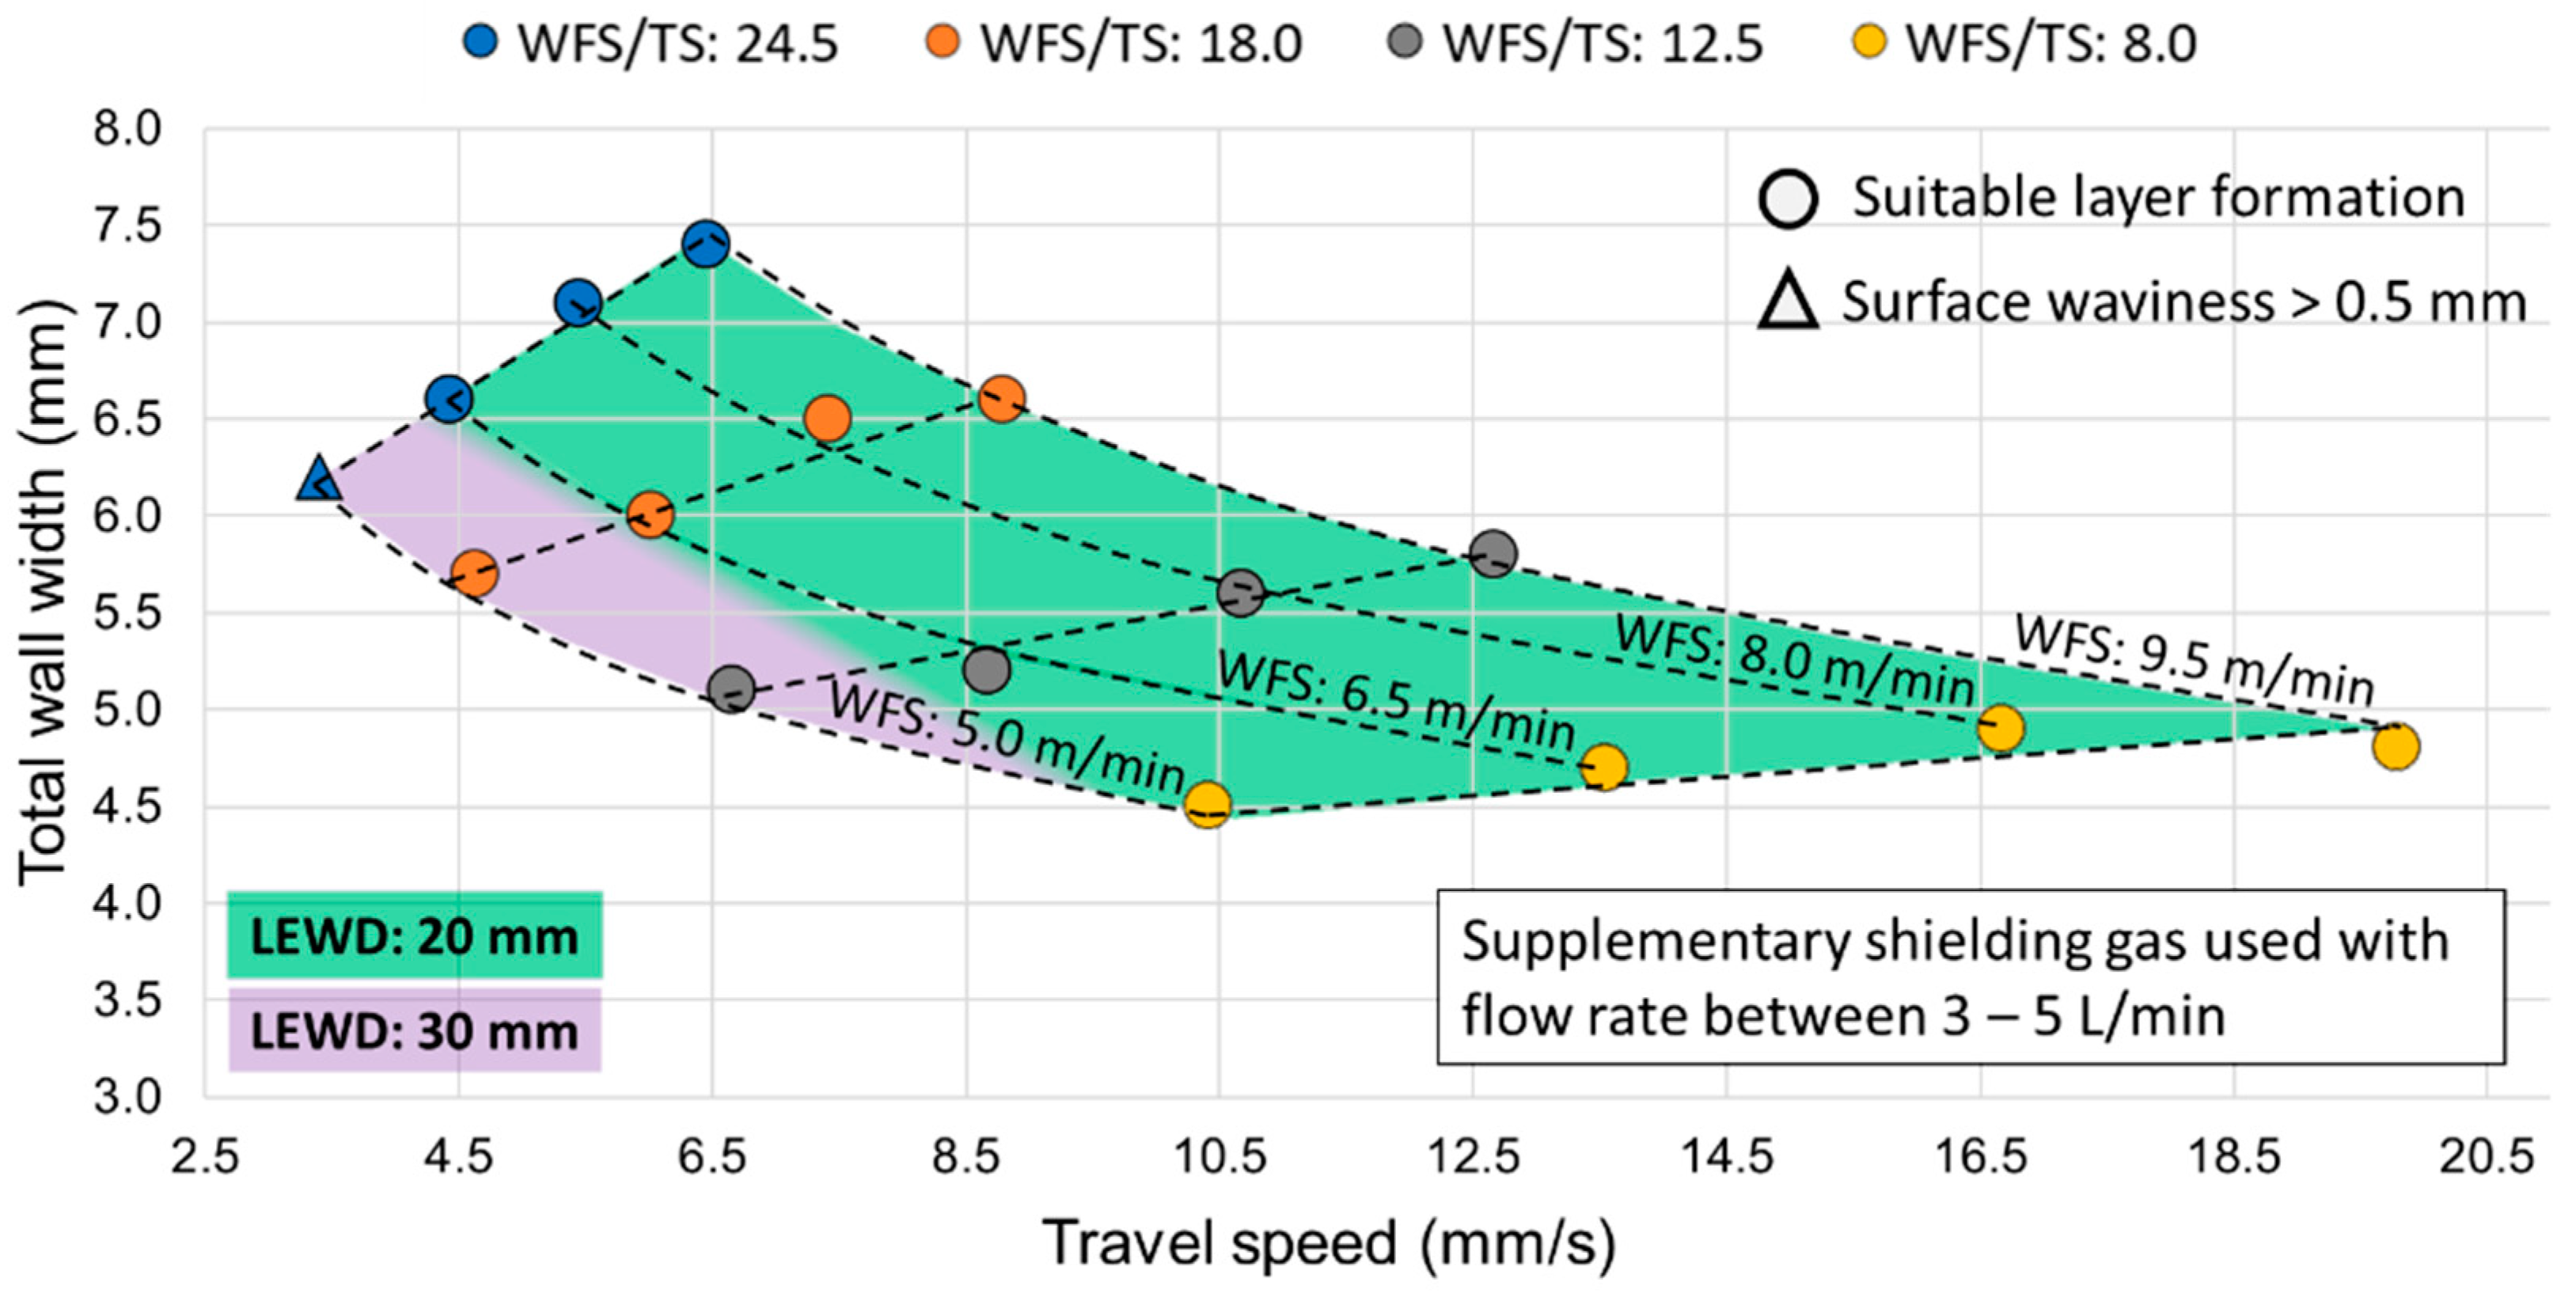
Up to this point, as indicated in Figure 11, the work envelope delineated from the experimental approach applied is quite restricted, i.e., only 3 out of 16 runs met all the acceptance criteria (Table 4). Furthermore, it is worth highlighting that the maintenance of a similar WFS/TS in this parametric chart is no guarantee of sound preforms.

3.2.1. Work Envelope Expansion

The main limitations perceived in the work envelope so far (initial results) are the excessive oxidation of the layer top surface deposited with higher WFS values and the excessive SW of the preform lateral surface deposited with lower WFS values. Aiming at the expansion of the work envelope, a few actions were implemented to deal with such setbacks.
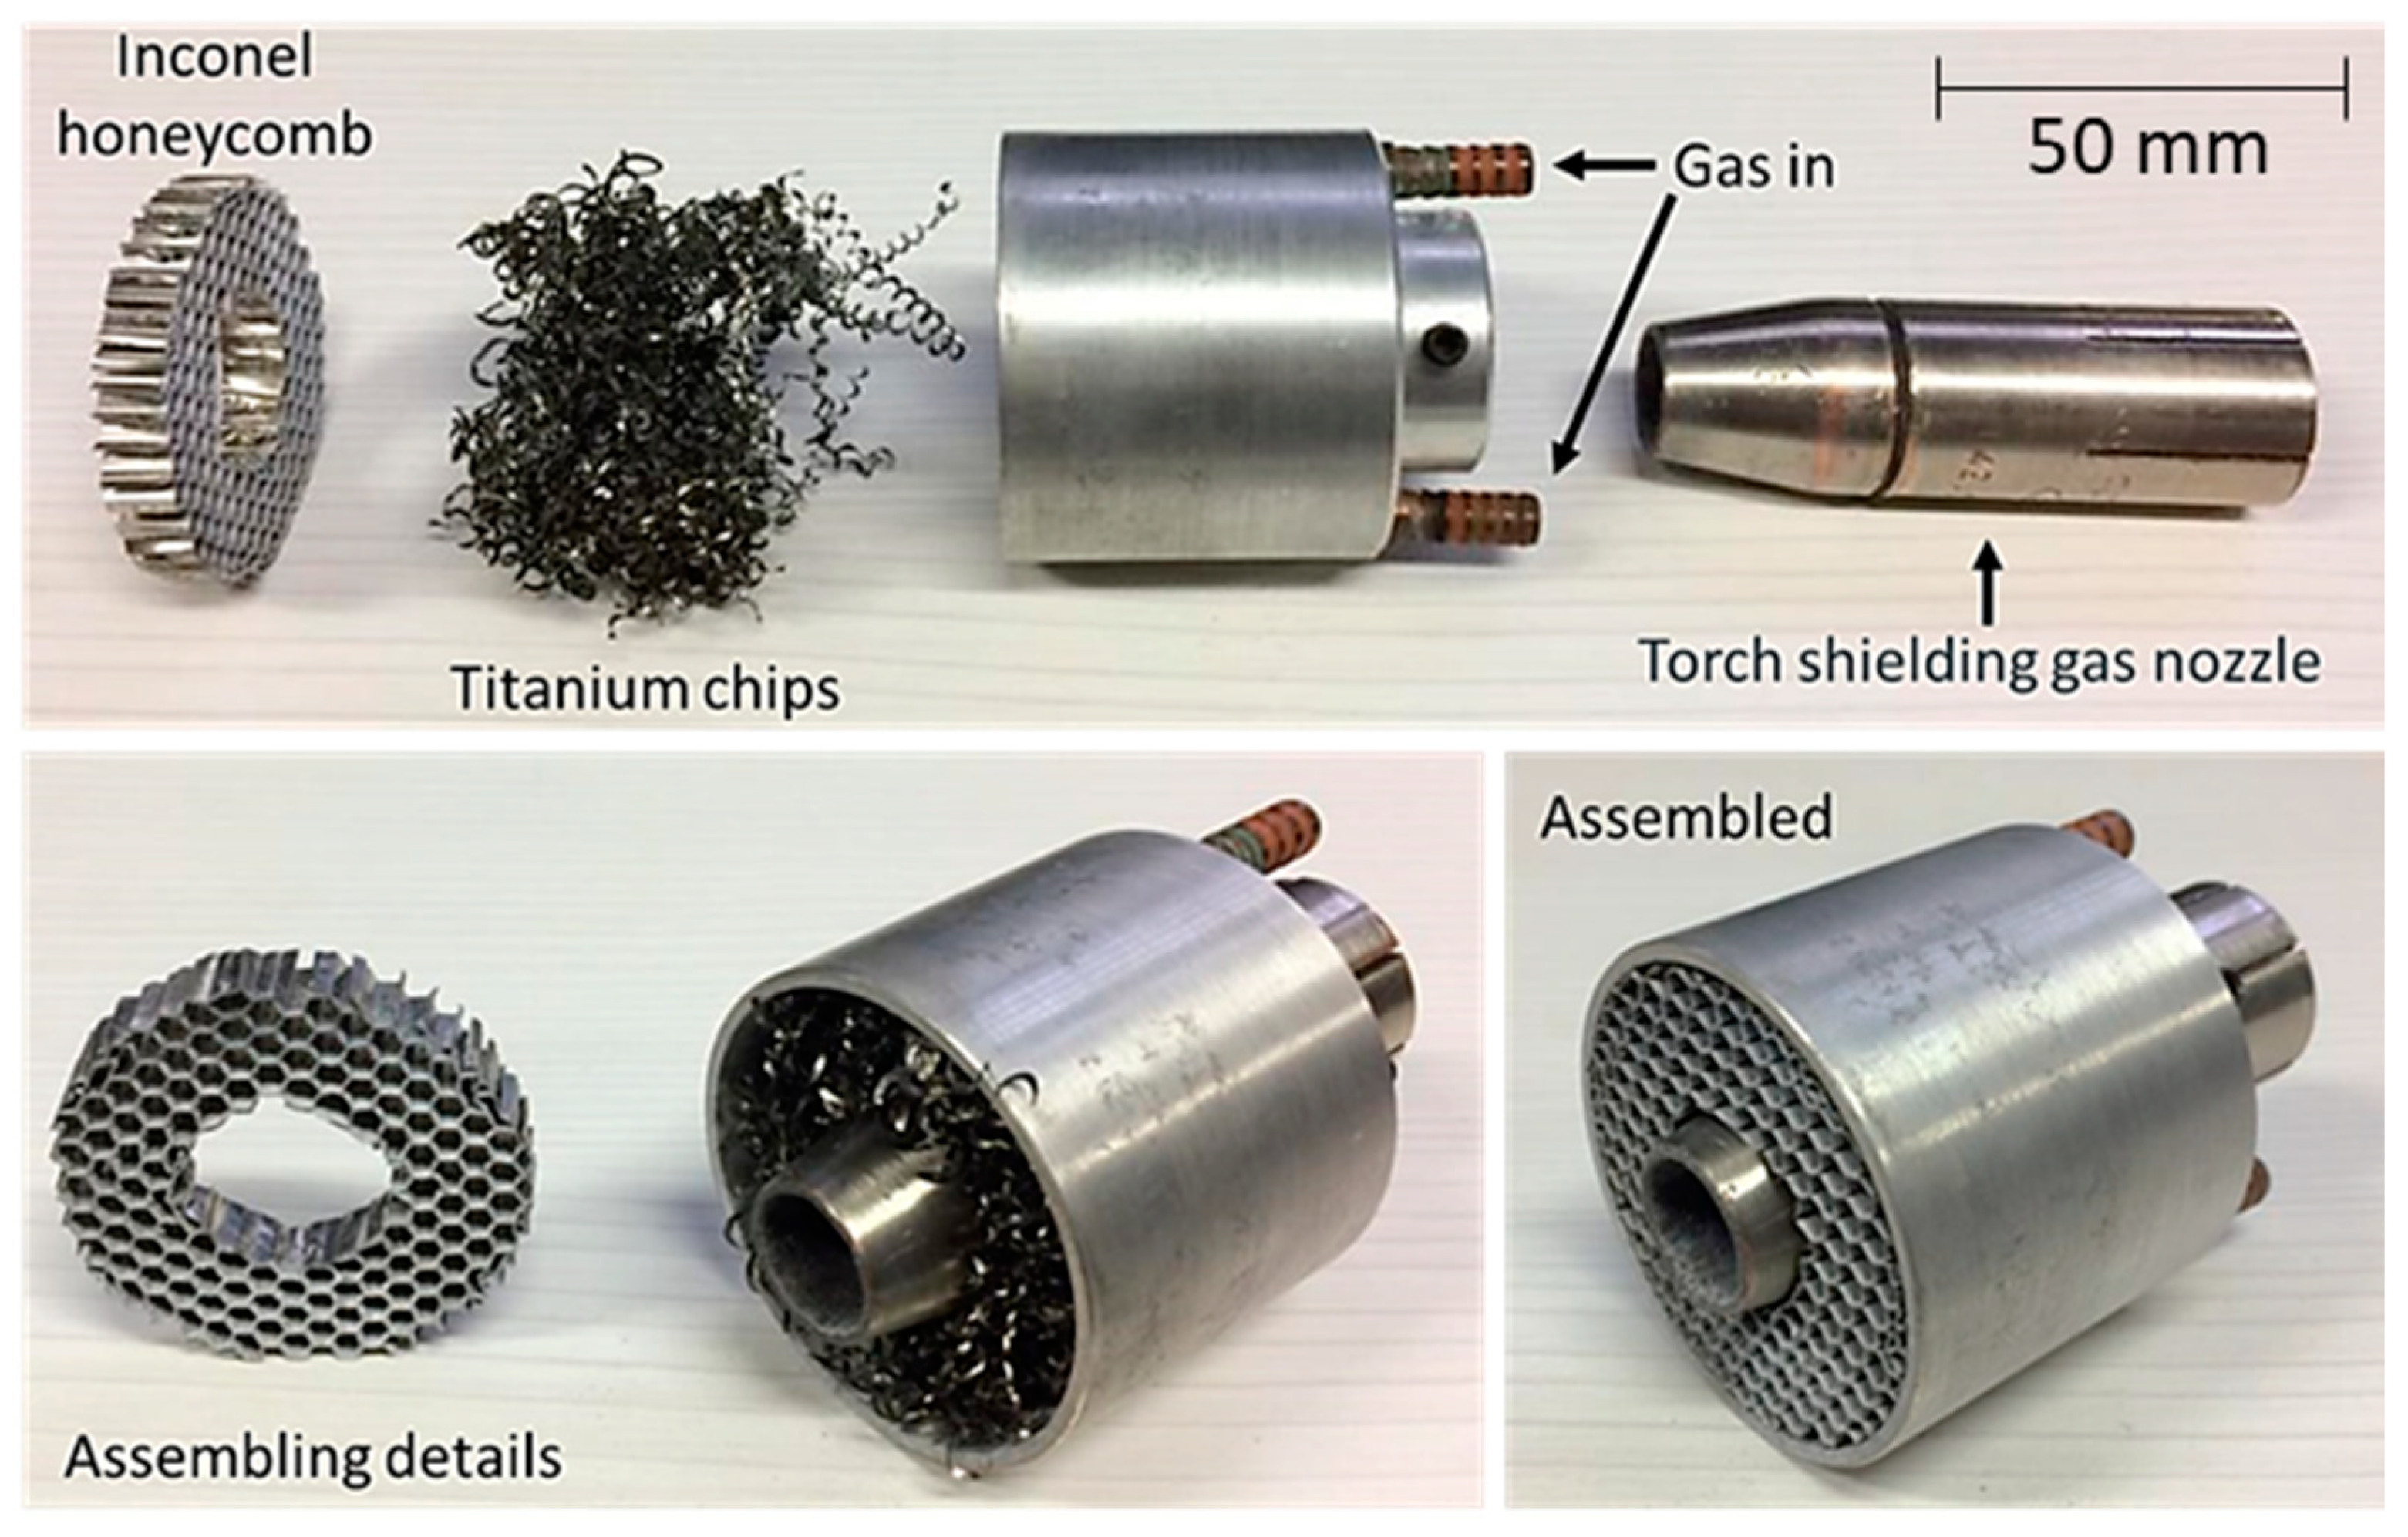
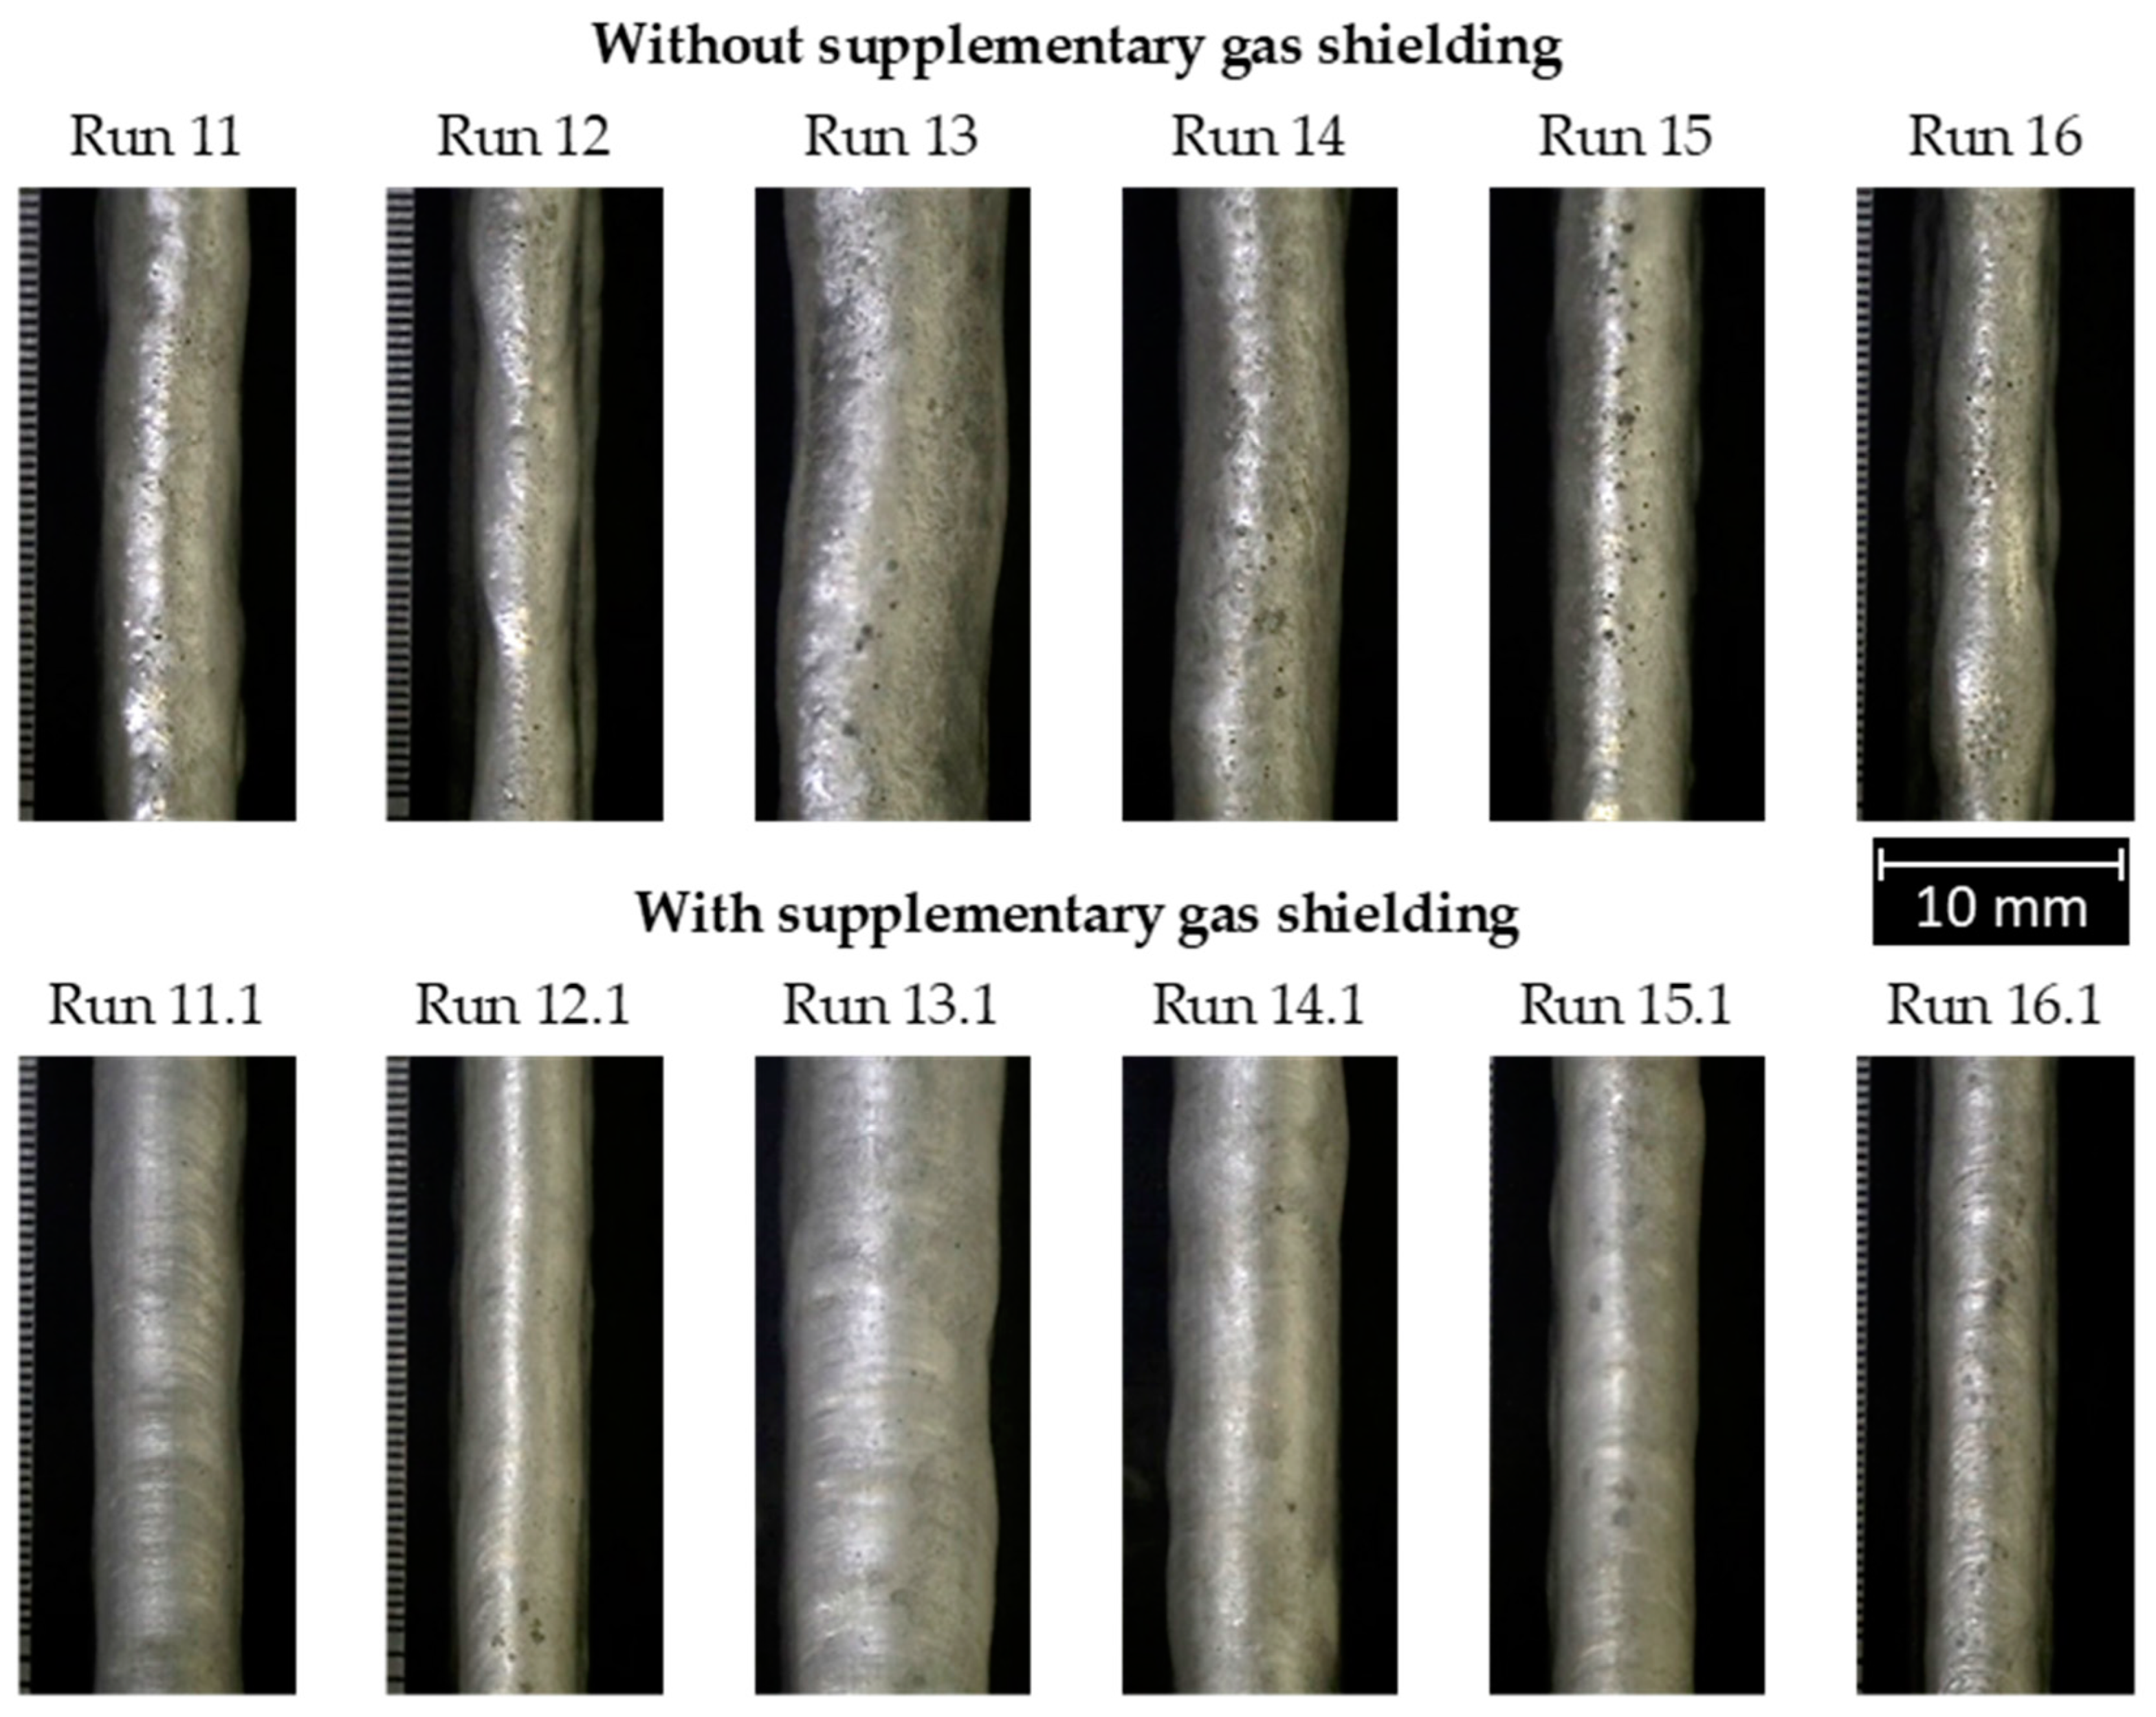
To cope with the excessive oxidation, a supplementary shielding gas system was devised, as shown in Figure 12. This Al-body device is filled with fine Ti chips, which act as a gas diffuser as well as aid as an active filter for the shielding gas due to its high binding affinity with oxygen. A Ni-alloy honeycomb was placed at the exit of the device to laminarize the gas flow as it goes out the supplementary nozzle. Through simple smoke tests, it was verified that a laminar gas flow is indeed achieved for a gas flow rate range of 3–5 L/min. The effectiveness of the supplementary shielding gas device is highlighted in Figure 13. As is clearly seen, the preforms deposited under this device were free of excessive oxidation, smoother, and brighter. Therefore, one can say that the issue of excessive oxidation of the layer top surface was troubleshot.
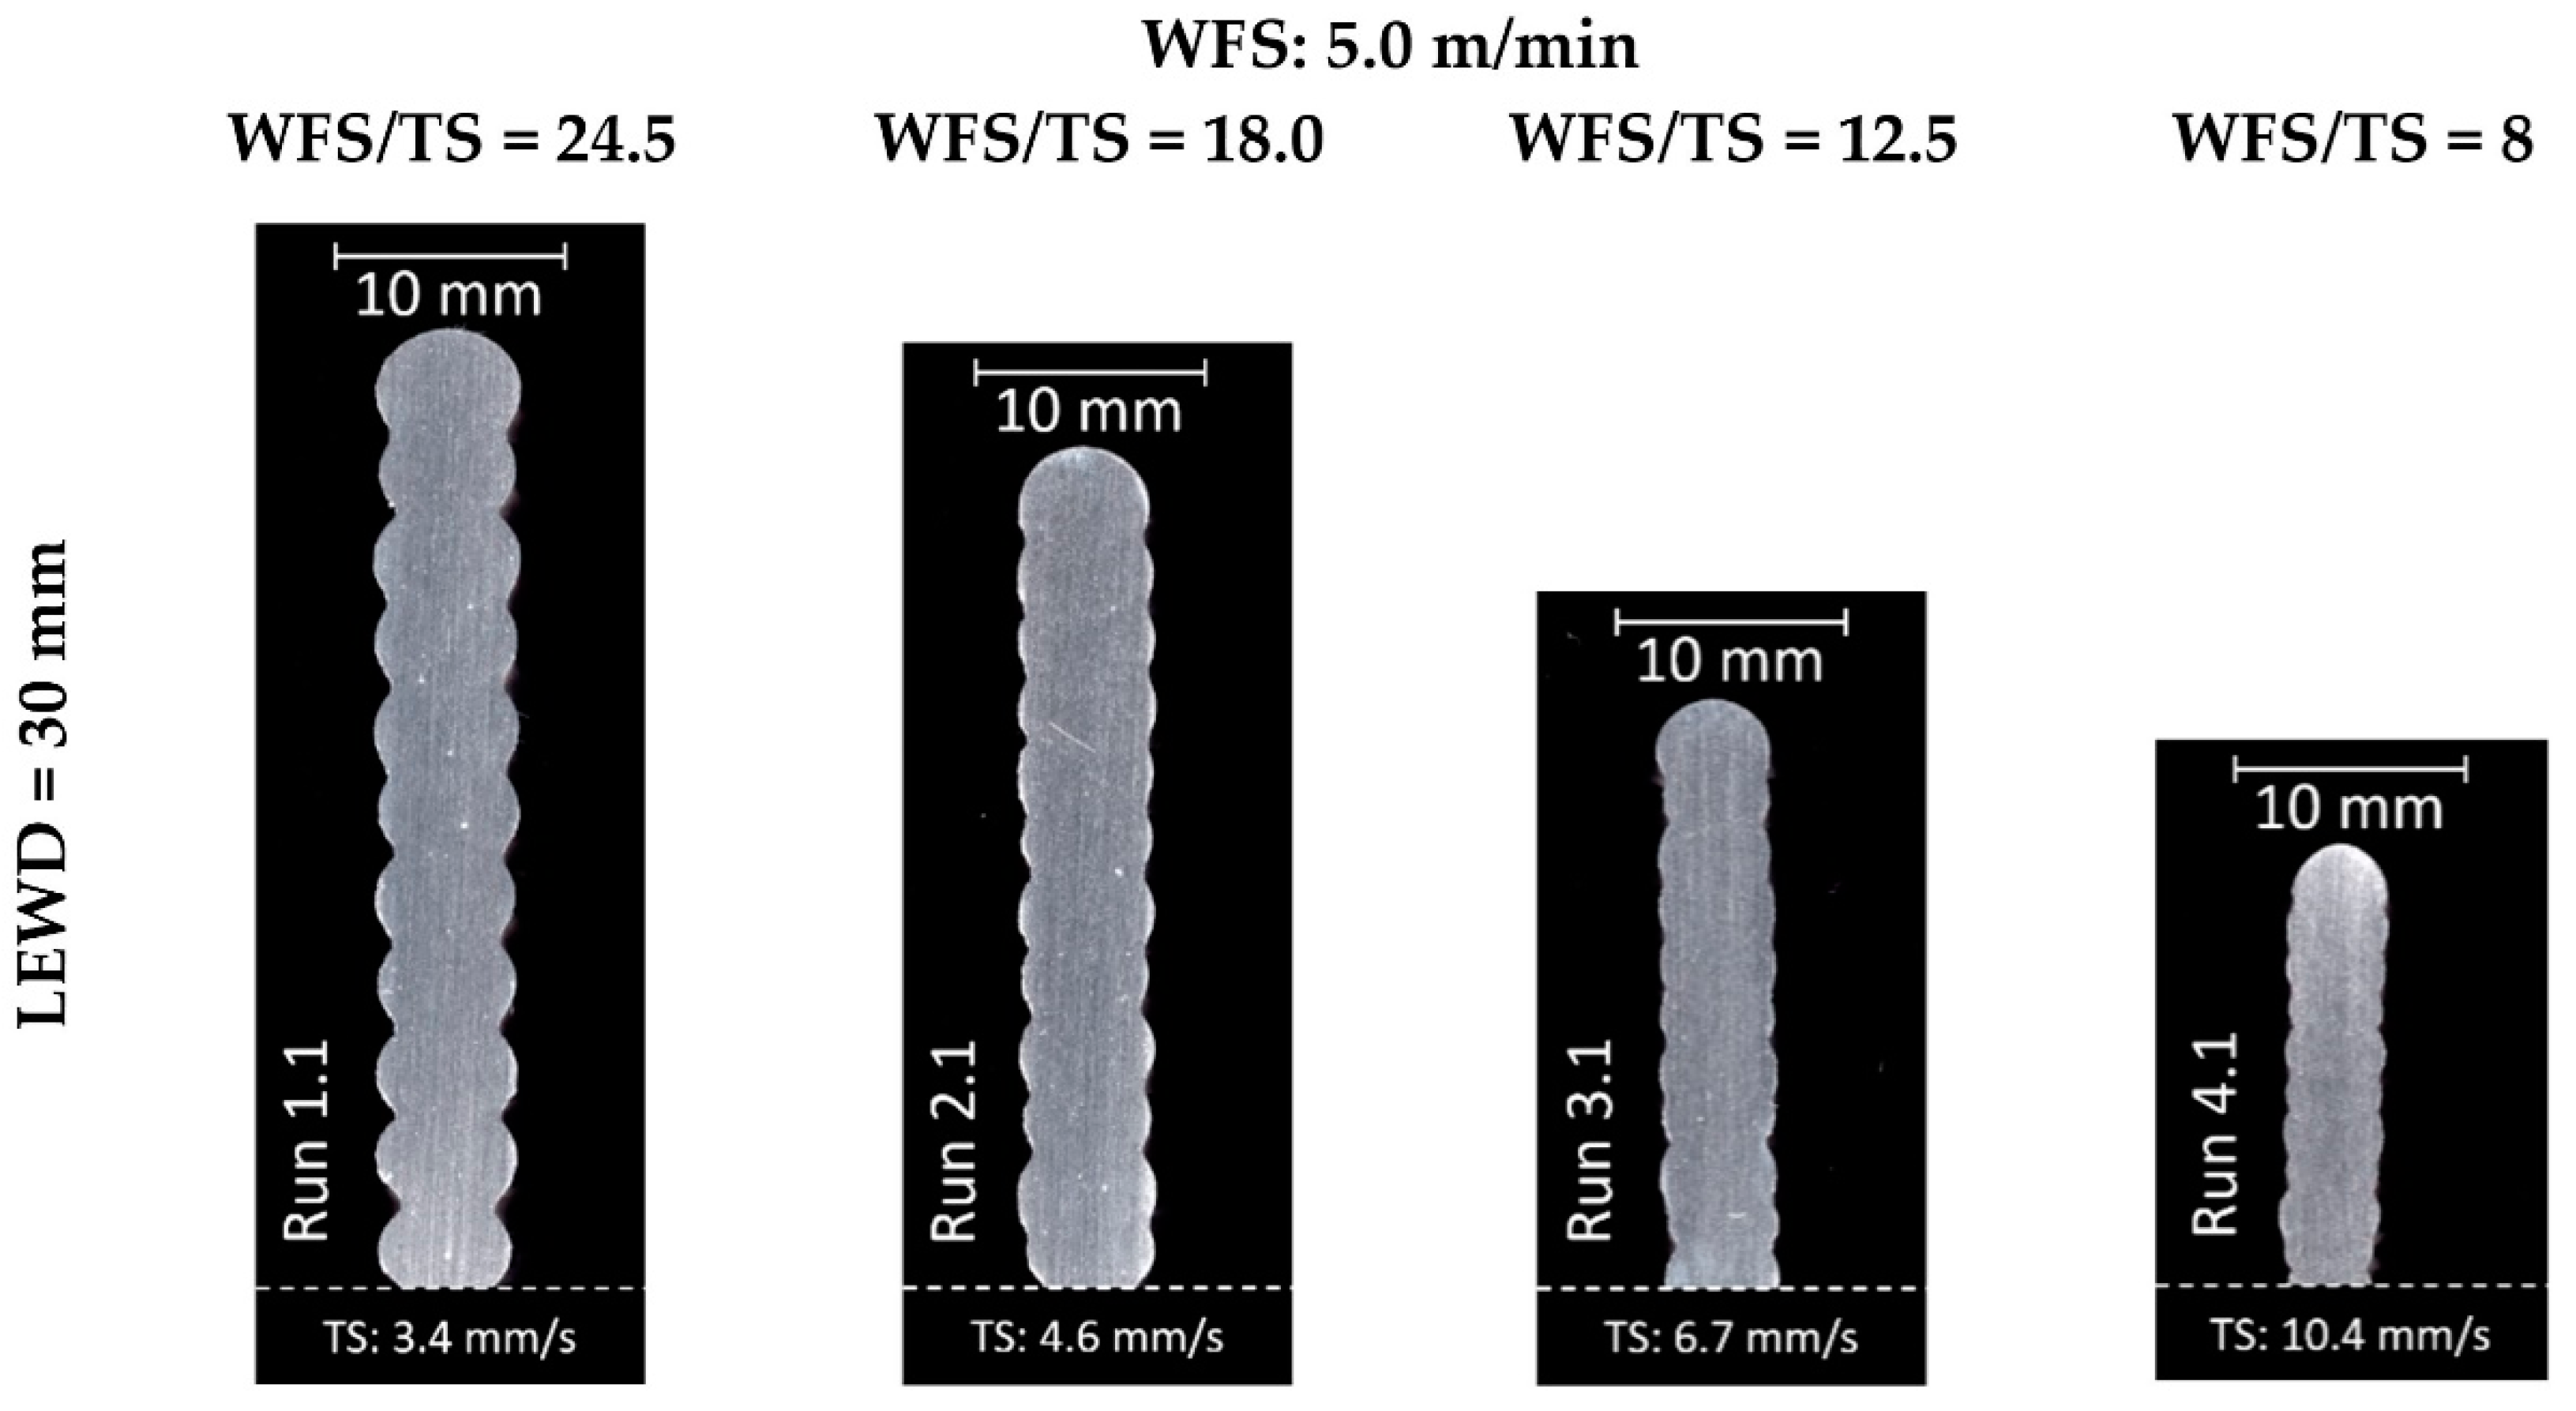
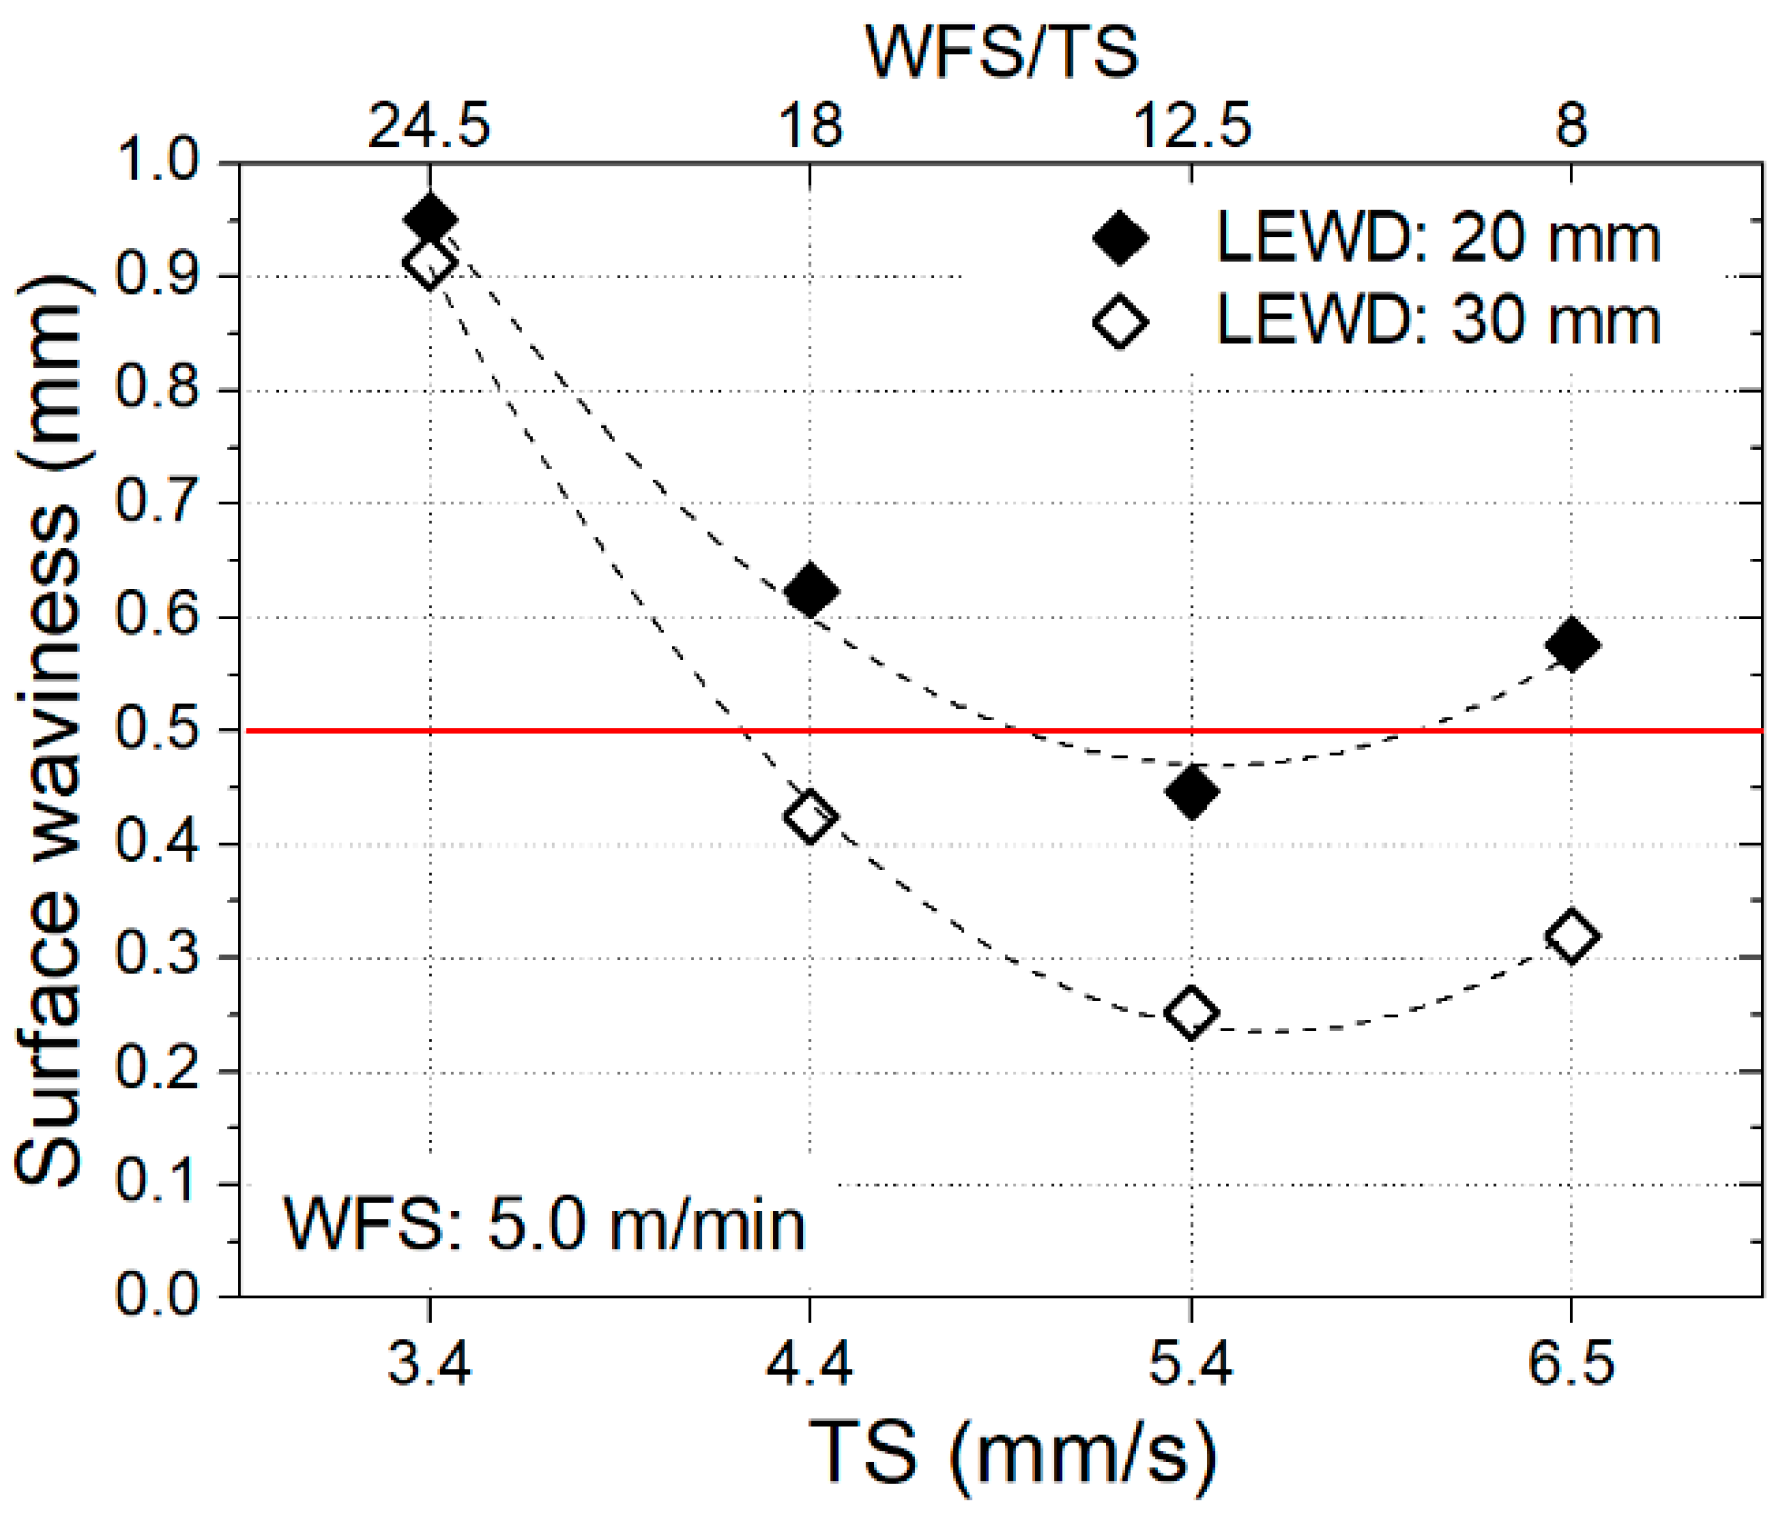
As stated previously, the higher surface waviness for the preforms deposited with the WFS at 5 m/min may be related to the low remelting of the previous layer. Aiming at the validation of this statement, the deposition conditions used for such WFS level were repeated with the LEWD parameter changed from 20 to 30 mm. The idea was to reduce the NIAC’s heat sinking effect and hence allow a higher remelting of the previous layer. As expected, no significant changes in the relative density were observed due to the LEWD increase. In terms of geometry, as seen in Figure 14, the TWW levels remained quite similar, but the preforms deposited with the higher LEWD value were more regular than those accomplished with the LEWD at 20 mm.
The effectiveness of reducing the NIAC’s heat sinking effect to improve the SW is highlighted in Figure 15, where a significantly lower SW is generally seen for the preforms deposited with the LEWD parameter at 30 mm. It is believed that further improvement of the condition with the highest arc energy (Run 11.1) could be achieved by using a LEWD even larger than 30 mm.

3.2.2. Expanded Work Envelope

After troubleshooting the excessive oxidation and high SW levels for low WFS conditions, the experimental-based work envelop was updated, as shown in Figure 16. The work envelope area that now meets the acceptance criteria was significantly expanded compared with the initial results (Figure 11). Besides the WFS and TS effects, this updated parametric chart now considers the change in the LEWD parameter and the use of the supplementary shielding gas device for all the conditions.
Concerning geometry, it can be said that the trends predicted by the analytical model find experimental support so that it can be employed as a first approximation for parameter selection. Compared with the predicted work envelope (Figure 5), the main difference in the experimental results is the TWW increase when raising the WFS and TS even if the WTS/TS ratio is kept constant. This behavior may be related to the intensification of the plasma jet pressure over the molten pool due to the WFS increase and, consequently, of the electric current.
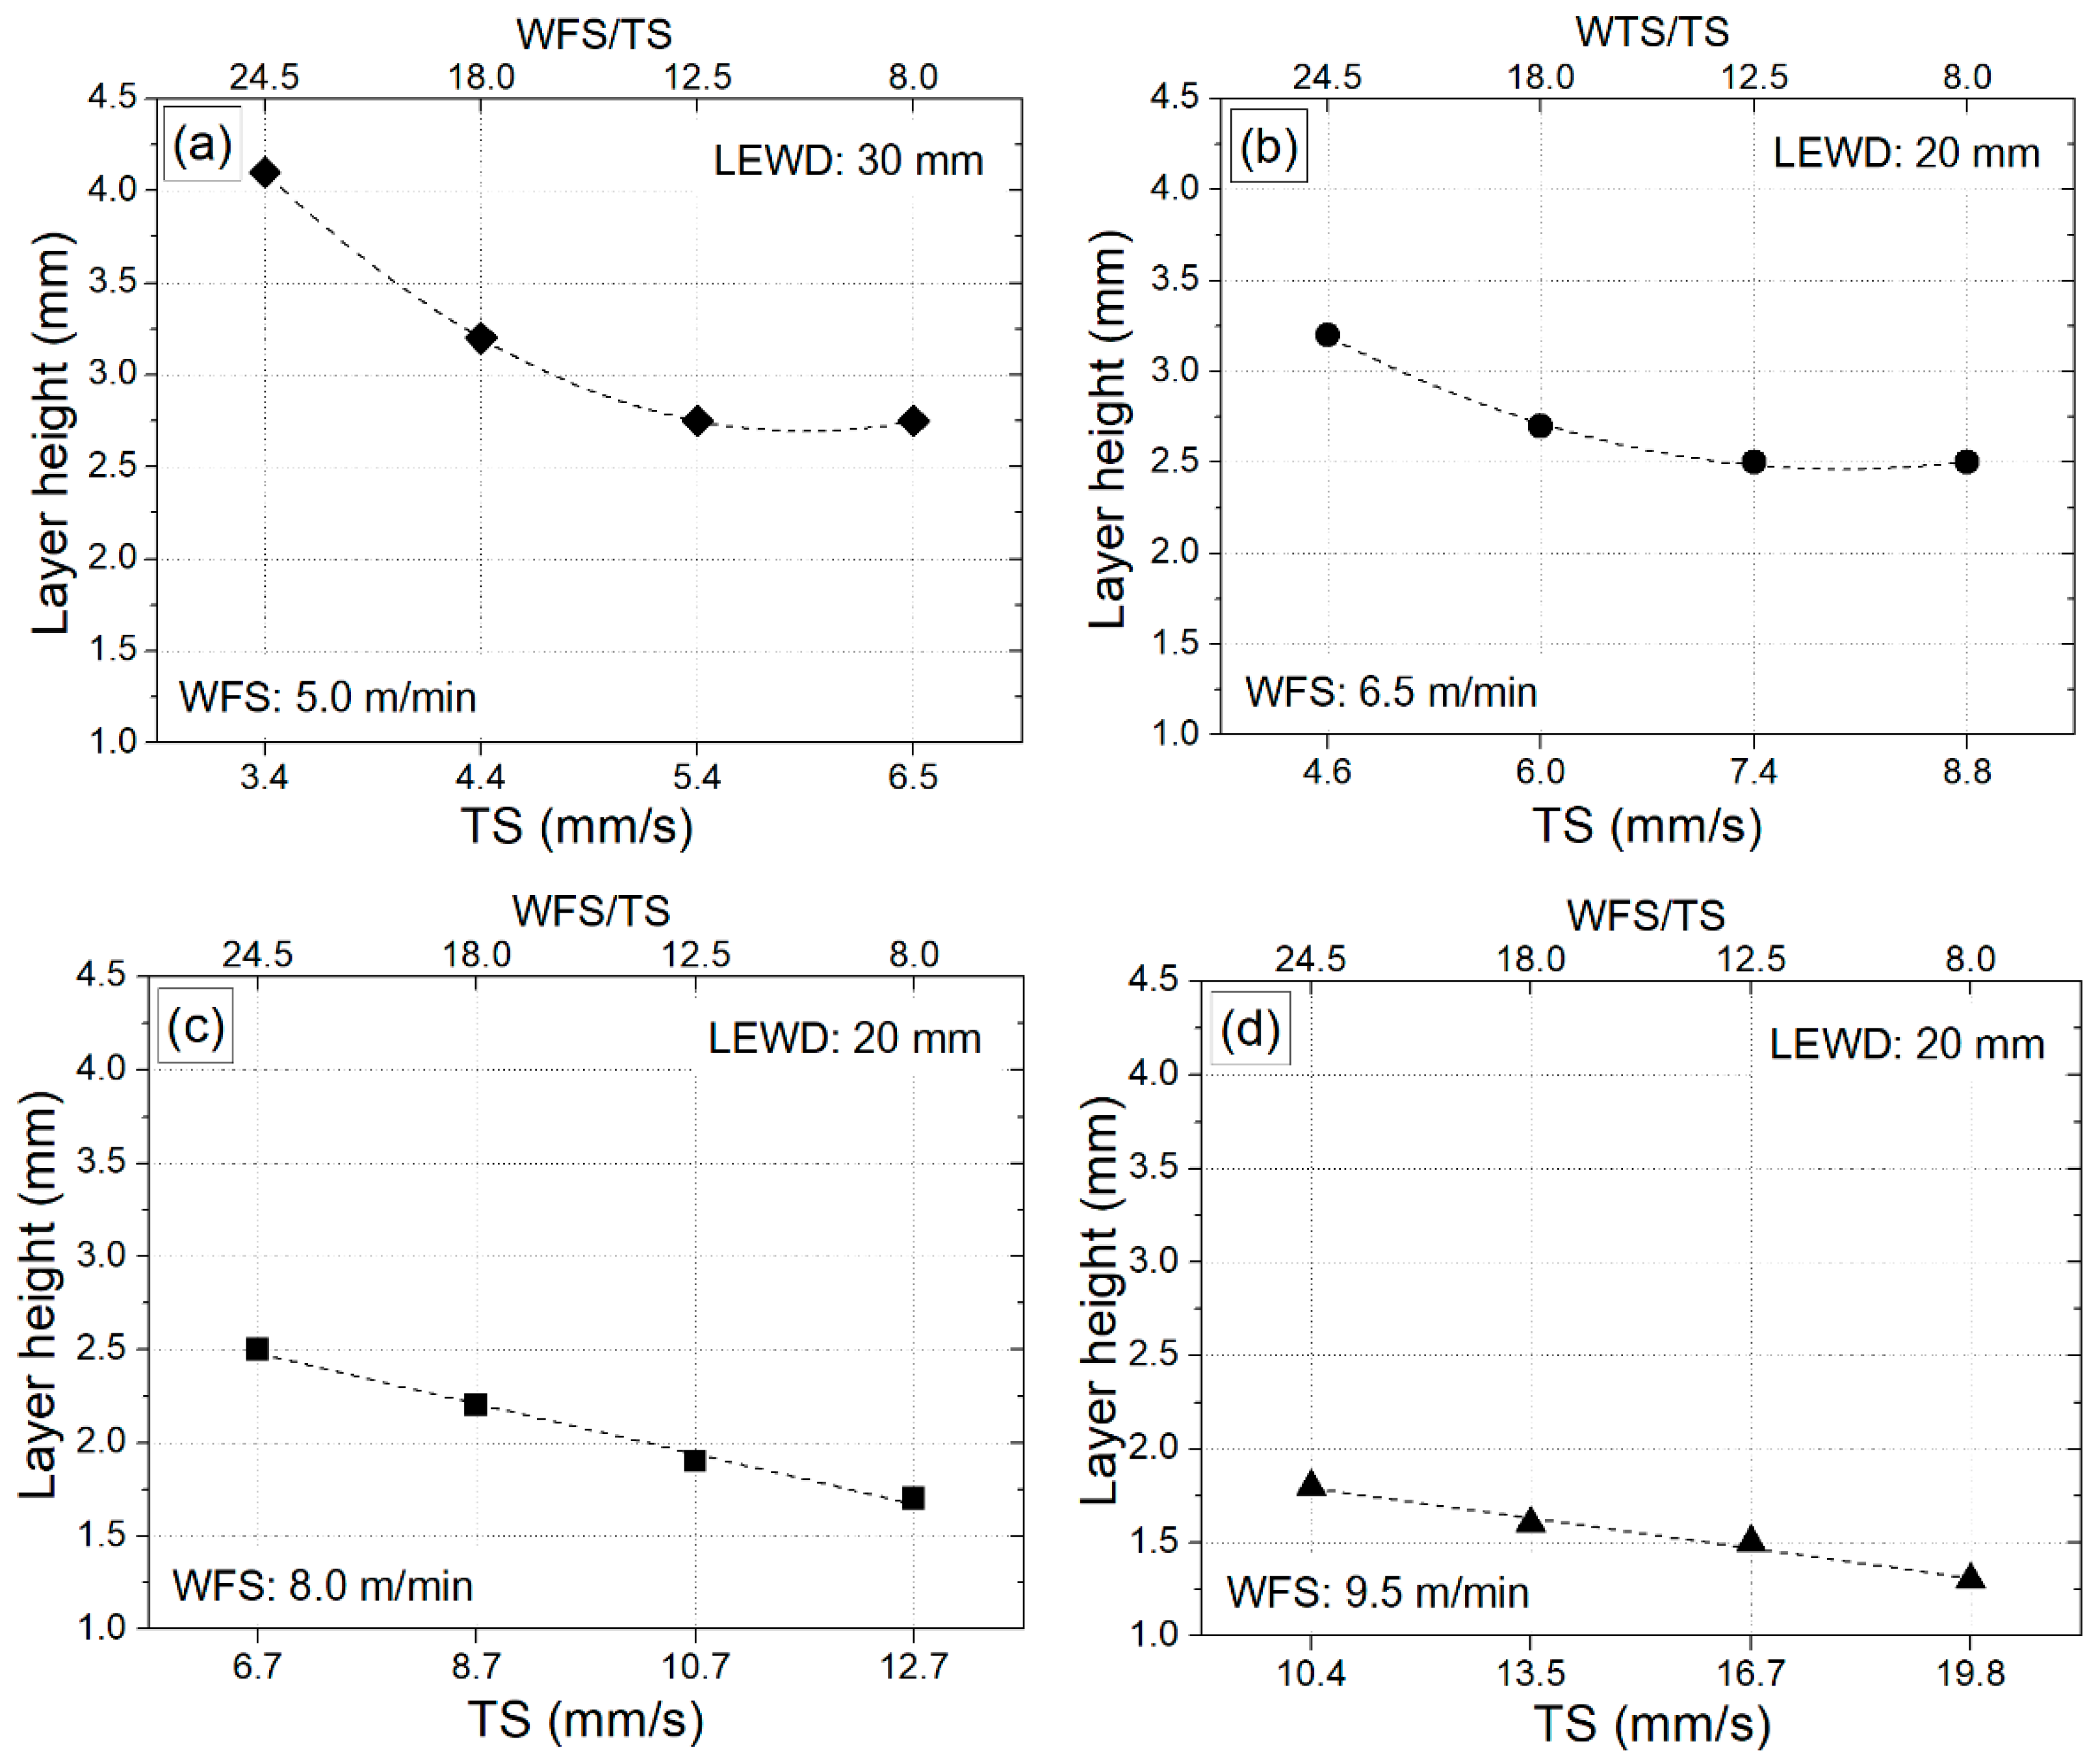
For WAAM, if the programed height increment between layers does not correspond to the actual individual layer height, it could lead to CTWD variations and, consequently, affect deposition. Given the importance of the LH outcome, Figure 17 compiles the results for such a geometrical feature according to the expanded work envelope. As predicted by the analytical model, there is a general trend of LH decrease as the TS is increased.

3.3. Parameter Selection Route for WAAM with NIAC

The success and efficiency of a WAAM operation strongly depend on the accurate selection of the deposition parameters. In this sense, the expanded work envelope chart (Figure 16) can be a useful tool. However, when production cost and surface quality are taken into account, the task for selecting parameters becomes more complex [4].
Surface quality is directly related to SW, so that the lower the SW, the better the surface quality. For high-cost and/or difficult-to-machine materials, a minimal SW is desirable to depend on less excess of material to be machined on post-processing (low material waste). In contrast, for non-expensive and/or easy-to-machine materials, a moderate SW level might be acceptable if the production is wanted to be high (application of high WFS and TS levels). Considering the material general cost and machinability, a parameter selection procedure for WAAM is proposed based on the following alternatives:
  • For non-expensive and/or easy-to-machine materials, a moderated SW is acceptable, and then the parameters to improve the production can be selected directly from the expanded work envelope (Figure 16); or
  • For high-cost and/or difficult-to-machine materials, a minimum SW is required, and then empirical modeling and numerical optimization should be performed simultaneously to meet a target geometry with the lowest SW possible.

3.3.1. Empirical Modeling of the Expanded Work Envelope

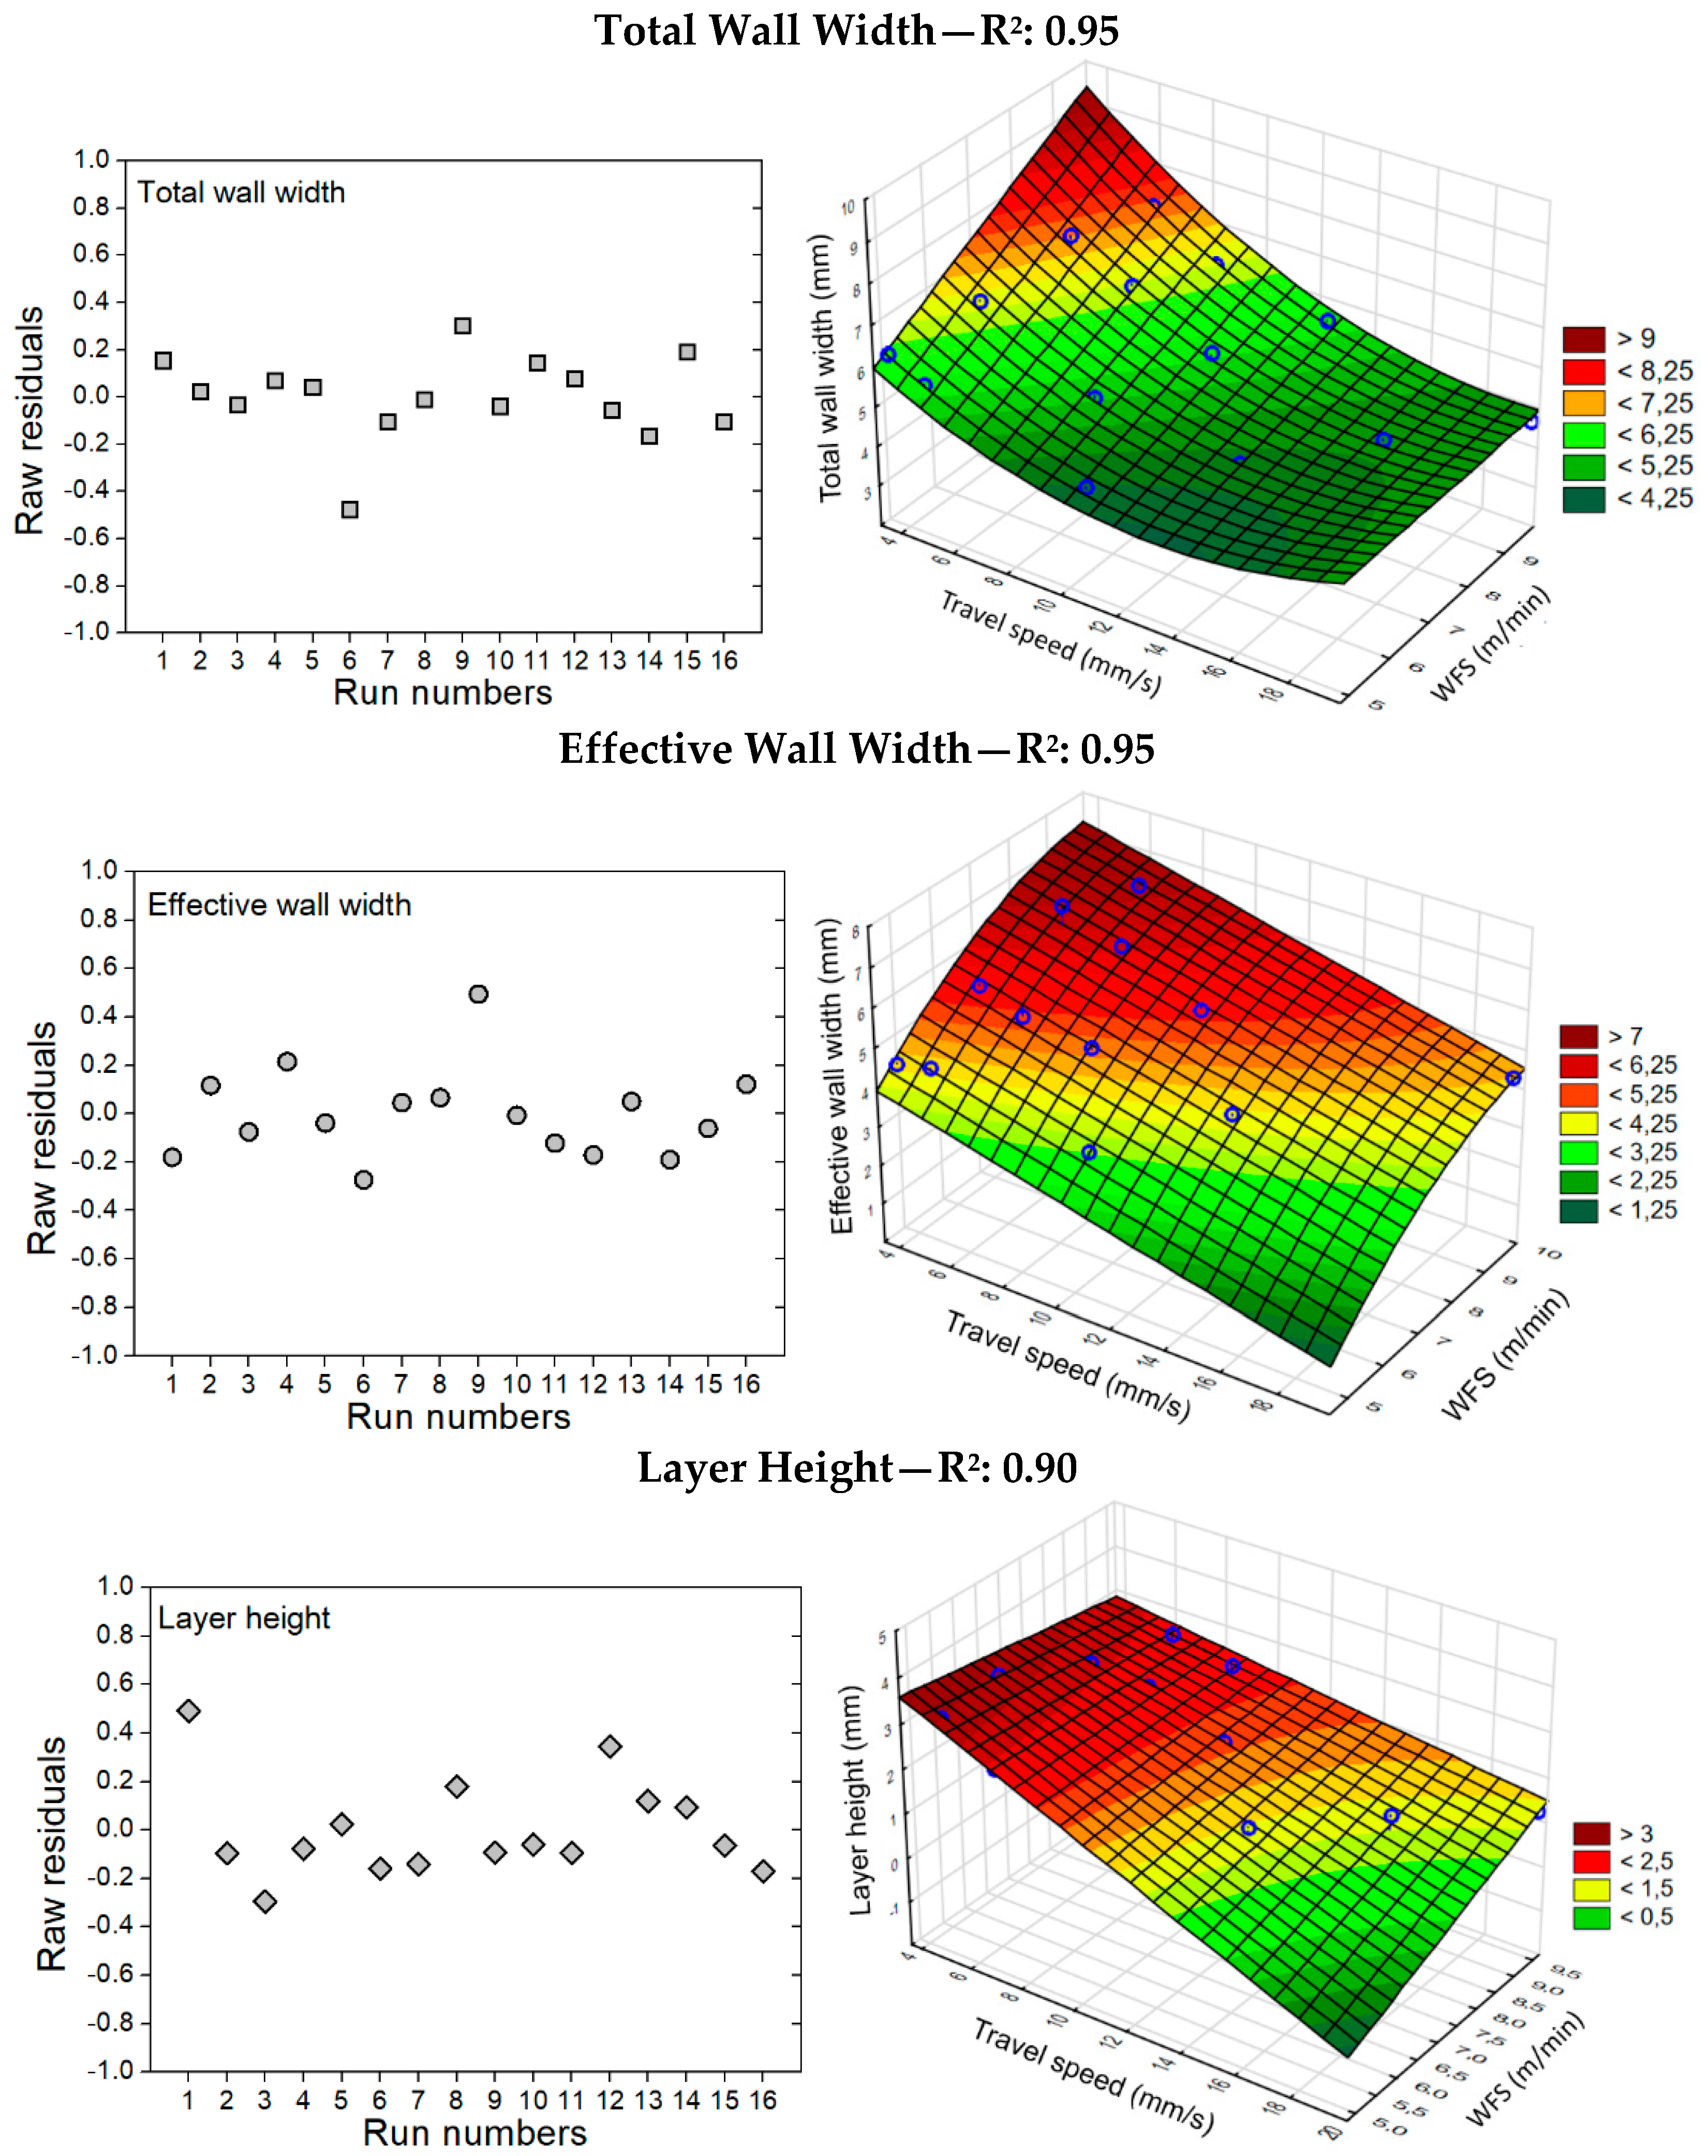
An empirical model was developed for the expanded work envelope (Figure 16), as depicted in Figure 18, by using a statistics software according to the following steps:
(a)
Multiple regressions were performed considering all the predictors;
(b)
The significance of each predictor was evaluated through ANOVA (p-value);
(c)
The model was systematically reduced by removing the terms with the highest p-values one at a time until only the significant predictors remained;
(d)
A critical analysis of the model was carried out considering the R2 value;
(e)
The residual plots were evaluated;
(f)
The response surfaces were plotted, and their equations extracted.
As expected, the layer model presented in Figure 4 and Equation (6) differs from the empirical formulation (Equations (7)–(9)) due to oversimplification in the first case.
f ( T W W ) = 3.337 + 0.815 W F S 0.267 T S + 0.017 T S 2 0.041 W F S T S
f ( E W W ) = 2.134 0.086 W F S 2 + 1.861 W F S 0.166 T S + 0.0005 L W E D 2
f ( L H ) = 5.865 0.280 W F S 0.426 T S + 0.0355 W F S T S

3.3.2. Numerical Optimization and Experimental Validation

The empirical model was numerically optimized through the Differential Evolution [23] method in conjunction with a multi-objective function based on the individual mean squared error [24]. This optimization aimed at estimating the WFS, TS, LEWD, and LH values for a given target wall width with a minimum difference between TWW and EWW, i.e., with the minimum SW or the best surface quality possible. This aim was translated into the following composite objective function (Equation (10)) based on the individual mean squared errors:
  M i n i m i z e   [ ( T f ( E W W ) ) 2 + ( f ( T W W ) f ( E W W ) ) 2 ]
where:
  • T: target wall width;
  • f(TWW): total wall width function—Equation (7);
  • f(EWW): effective wall width function—Equation (8).
Table 5 shows the WAAM parameters that were estimated for different target wall widths (T) after the proposed optimization. As one can see, all estimated parameters fall into the expanded work envelope (Figure 16). Moreover, a lower SW level is expected as the WFS/TS ratios were in the 8–16 range.
The experimental validation of the empirical modeling and optimization procedure was performed by means of a deposition with the parametric combination found for a target wall width (T) of 5 mm. As shown in Figure 19, the predicted parameters resulted in a preform with an EWW value quite near the target and with an SW level quite low.

3.3.3. Decision-Making Procedure towards Preform Quality

Figure 20 orders a general sequence of steps for achieving intended preform quality features in WAAM taking into account the strategy of work envelope (including expansion) and parametric optimization as explored above.
According to this flowchart of decision-making procedure towards preform quality in WAAM, it all begins with a critical analysis of the 3D model of the part to be additively manufactured considering design rules as, for instance, postulated by Lockett et al. [25]. If there is no work envelope for the material of choice, the feasibility of developing one should be assessed considering factors such as the material weldability, commercial availability, and cost, etc. The target wall width is determined by the minimum section of the component. It could be a stacked single pass deposition or a combination of multiple passes, as discussed by Yehorov et al. [4]. The deposition parameters may be changed along the building process, even though most of the WAAM equipment does not allow such an approach. The required surface quality may be linked to the material cost and its machinability. Depending on the case, the parameters can be selected directly from the work envelope or through numerical optimization. However, regardless of the choice, both should be experimentally validated before slicing the 3D model, which precedes the generation of the deposition path and subsequent execution of the actual deposition of material via WAAM.

4. Conclusions

The present study aimed at expanding the work envelope and optimizing the parametric conditions in WAAM with relative density and surface aspects of the preforms as quality constraints. Based on the results, the following conclusions are drawn:
  • The experimentally based work envelope was quite limited using only the standard welding hardware. The main drawbacks were the excessive oxidation of the top surface of the layers deposited with high WFS values and the excessive SW in the lateral of the preforms deposited with low WFS values. All the preforms reached an acceptable level of relative density;
  • To deal with the excessive oxidation, a supplementary shielding gas system was successfully devised. To reduce the SW, the Near-immersion Active Cooling thermal management was reduced by increasing the LEWD parameter from 20 to 30 mm. After these troubleshooting steps, the work envelope was significantly expanded. Therefore, the increments to standard welding hardware allowed the expansibility of the WAAM work envelop;
  • For all the conditions assessed, the SW levels tended to fit a positive parabolic behavior with minimum values with the WFS/TS ratio around 12.5 (arc energy per unit length of deposit in 90–100 J/mm). However, it is worth mentioning that the maintenance of a constant WFS/TS ratio does not guarantee sound preforms;
  • In general terms, for non-expensive and/or easy-to-machine materials, a moderated SW is acceptable, and hence the parameters for high production can be selected directly from the expanded work envelope;
  • Also, in general terms, for high-cost and/or difficult-to-machine materials, a minimum SW is required, and hence the empirical modeling and the numerical optimization should be performed to meet a target geometry with a minimum SW simultaneously.
To sum up, even though the methodology was based on the deposition of Al5Mg alloy via the CMT process and despite the fact that the relative density and surface aspects of the preforms were taken as quality constraints, other materials, processes, and/or quality features might be explored by following the same strategy of work envelope (including expansion) and parametric optimization as introduced here towards achieving the intended preform quality in WAAM.

Author Contributions

Conceptualization, L.J.d.S., R.P.R. and A.S.; methodology, L.J.d.S. and R.P.R.; software, D.B.A.; validation, L.J.d.S. and F.R.T.; formal analysis, L.J.d.S. and F.R.T.; investigation, L.J.d.S. and F.R.T.; writing—original draft preparation, L.J.d.S.; writing—review and editing, R.P.R.; supervision, A.S. All authors have read and agreed to the published version of the manuscript.

Funding

This research was supported by the Brazilian Coordination for the Improvement of Higher Education Personnel (CAPES), through Finance Code 001, and by the Brazilian National Council for Scientific and Technological Development (CNPq), through grants 302863/2016-8 and 315092/2018-1.

Data Availability Statement

This study did not report any data.

Acknowledgments

The authors acknowledge the Center for Research and Development of Welding Processes (Laprosolda) at the Federal University of Uberlândia for the laboratorial infrastructure. The authors also recognize Fronius International GmbH, for a kind support throughout this work.

Conflicts of Interest

The authors declare no conflict of interest.

Abbreviations

AMAdditive manufacturing
CMTCold metal transfer (controlled dip transfer GMAW process)
CTWDContact tube to work distance (mm)
DDiameter (equivalent to TWW in the cross-sectional profile model)
DAQData acquisition system
DEDDirected energy deposition
EWWEffective wall width (mm)
F(EWW)Effective wall width empirical function
F(TWW)Total wall width empirical function
GMAGas metal arc (deposition process)
GMAWGas metal arc welding (welding process)
GTAGas tungsten arc (deposition process)
IDeposition current (A)
IRInfra-red (pyrometry)
LHLayer height (mm)
NIACNear-immersion active cooling (thermal management technique)
PHPreform height (mm)
PinstAverage instantaneous power (W)
RRadius (equivalent to LH in the cross-sectional profile model)
SWSurface waviness (mm)
TTarget wall width (mm)
TSTravel speed (mm/s)
TWWTotal wall width (mm)
UDeposition voltage (V)
WAAMWire + Arc Additive Manufacturing
WFSWire feed speed (m/min)
WFS/TSWire deposition per unit length of deposit (dimensionless)
WireareaWire cross-section area (mm2)

References

  1. Jafari, D.; Vaneker, T.H.J.; Gibson, I. Wire and arc additive manufacturing: Opportunities and challenges to control the quality and accuracy of manufactured parts. Mater. Des. 2021, 202, 109471. [Google Scholar] [CrossRef]
  2. Dahat, S.; Hurtig, K.; Andersson, J.; Scotti, A. A methodology to parameterize wire + arc additive manufacturing: A case study for wall quality analysis. J. Manuf. Mater. Process. 2020, 4, 14. [Google Scholar] [CrossRef] [Green Version]
  3. Gierth, M.; Henckell, P.; Ali, Y.; Scholl, J.; Bergmann, J.P. Wire Arc Additive Manufacturing (WAAM) of aluminum alloy AlMg5Mn with energy-reduced Gas Metal Arc Welding (GMAW). Materials 2020, 13, 2671. [Google Scholar] [CrossRef] [PubMed]
  4. Yehorov, Y.; da Silva, L.J.; Scotti, A. Balancing WAAM Production Costs and Wall Surface Quality through Parameter Selection: A Case Study of an Al-Mg5 Alloy Multilayer-Non-Oscillated Single. J. Manuf. Mater. Process. Artic. 2019, 3, 32. [Google Scholar] [CrossRef] [Green Version]
  5. Scotti, A. Mapping transfer modes for stainless steel gas metal arc welding. Sci. Technol. Weld. Join. 2000, 5, 227–234. [Google Scholar] [CrossRef]
  6. Martina, F.; Mehnen, J.; Williams, S.W.; Colegrove, P.; Wang, F. Investigation of the benefits of plasma deposition for the additive layer manufacture of Ti-6Al-4V. J. Mater. Process. Technol. 2012, 212, 1377–1386. [Google Scholar] [CrossRef] [Green Version]
  7. Ríos, S.; Colegrove, P.A.; Martina, F.; Williams, S.W. Analytical process model for wire + arc additive manufacturing. Addit. Manuf. 2018, 21, 651–657. [Google Scholar] [CrossRef]
  8. Ali, Y.; Henckell, P.; Hildebrand, J.; Reimann, J.; Bergmann, J.P. Wire arc additive manufacturing of hot work tool steel with CMT process. J. Mater. Process. Technol. 2019, 269, 109–116. [Google Scholar] [CrossRef]
  9. Marinelli, G.; Martina, F.; Ganguly, S.; Williams, S. Effect of shielding gas composition and welding speed on autogenous welds of unalloyed tungsten plates. Int. J. Refract. Met. Hard Mater. 2019, 85, 105043. [Google Scholar] [CrossRef] [Green Version]
  10. Michel, F.; Lockett, H.; Ding, J.; Martina, F.; Marinelli, G.; Williams, S. A modular path planning solution for Wire + Arc Additive Manufacturing. Robot. Comput. Integr. Manuf. 2019, 60, 1–11. [Google Scholar] [CrossRef]
  11. Henckell, P.; Gierth, M.; Ali, Y.; Reimann, J.; Bergmann, J.P. Reduction of energy input in wire arc additive manufacturing (WAAM) with gas metal arc welding (GMAW). Materials 2020, 13, 2491. [Google Scholar] [CrossRef] [PubMed]
  12. Scotti, F.M.; Teixeira, F.R.; da Silva, L.J.; de Araújo, D.B.; Reis, R.P.; Scotti, A. Thermal management in WAAM through the CMT Advanced process and an active cooling technique. J. Manuf. Process. 2020, 57, 23–35. [Google Scholar] [CrossRef]
  13. Ding, D.; Zhao, R.; Lu, Q.; Pan, Z.; Li, H.; Wang, K.; He, K. A shape control strategy for wire arc additive manufacturing of thin-walled aluminium structures with sharp corners. J. Manuf. Process. 2021, 64, 253–264. [Google Scholar] [CrossRef]
  14. Da Silva, L. Near-Immersion Active Cooling for Wire + Arc Additive Manufacturing: From Concept to Application; Universidade Federal de Uberlândia: Uberlândia, Brazil, 2019. [Google Scholar]
  15. da Silva, L.J.; Souza, D.M.; de Araújo, D.B.; Reis, R.P.; Scotti, A. Concept and validation of an active cooling technique to mitigate heat accumulation in WAAM. Int. J. Adv. Manuf. Technol. 2020, 107, 2513–2523. [Google Scholar] [CrossRef]
  16. Jorge, V.L.; Gohrs, R.; Scotti, A. Active power measurement in arc welding and its role in heat transfer to the plate. Weld. World 2017, 847–856. [Google Scholar] [CrossRef]
  17. da Silva, L.J.; Reis, R.P.; Scotti, A. The Potential of IR Pyrometry for Monitoring Interpass Temperature in Wire + Arc Additive Manufacturing. Evol. Mech. Eng. 2019, 3, 1–4. [Google Scholar] [CrossRef]
  18. Plangger, J.; Schabhüttl, P.; Vuherer, T.; Enzinger, N. Cmt additive manufacturing of a high strength steel alloy for application in crane construction. Metals 2019, 9, 650. [Google Scholar] [CrossRef] [Green Version]
  19. Zhang, C.; Li, Y.; Gao, M.; Zeng, X. Wire arc additive manufacturing of Al-6Mg alloy using variable polarity cold metal transfer arc as power source. Mater. Sci. Eng. A 2018, 711, 415–423. [Google Scholar] [CrossRef]
  20. Da Silva, L.J.; Scotti, F.M.; Fernandes, D.B.; Reis, R.P.; Scotti, A. Effect of O2 content in argon-based shielding gas on arc wandering in WAAM of aluminum thin walls. CIRP J. Manuf. Sci. Technol. 2021, 32, 338–345. [Google Scholar] [CrossRef]
  21. Williams, S.W.; Martina, F.; Addison, A.C.; Ding, J.; Pardal, G.; Colegrove, P. Wire + Arc Additive Manufacturing. Mater. Sci. Technol. 2016, 32, 641–647. [Google Scholar] [CrossRef] [Green Version]
  22. Da Silva, C.L.M.; Scotti, A. The influence of double pulse on porosity formation in aluminum GMAW. J. Mater. Process. Technol. 2006, 171, 366–372. [Google Scholar] [CrossRef]
  23. Storn, R.; Price, K. Differential Evolution—A simple and efficient adaptive scheme for global optimization over continuous spaces. J. Glob. Optim. 1997, 11, 341–359. [Google Scholar] [CrossRef]
  24. Koksoy, O.; Yalcinoz, T. Mean square error criteria to multiresponse process optimization by a new genetic algorithm. Appl. Math. Comput. 2006, 175, 1657–1674. [Google Scholar] [CrossRef]
  25. Lockett, H.; Ding, J.; Williams, S.; Martina, F.; Lockett, H. Design for Wire + Arc Additive Manufacture: Design rules and build orientation selection Design for Wire + Arc Additive Manufacture: Design rules and build orientation selection. J. Eng. Des. 2017, 28, 568–598. [Google Scholar] [CrossRef] [Green Version]
Figure 1. Experimental rig developed by da Silva [14] and cross-sectional schematic representation of the deposition region: (1) NIAC work tank, (2) NIAC water level control, (3) AM CMT torch, (4) AM motion system on the gantry, (5) NIAC pressurized water tank, (6) NIAC hydraulic and pneumatic control, and (7) AM CNC control.
Jmmp 05 00040 g001
Figure 2. Cleaner pad (felt) clamped to the wire to mitigate the effect of external impurities and its assembly detail.
Jmmp 05 00040 g002
Figure 3. Geometrical features measured to characterize surface texture.
Jmmp 05 00040 g003
Figure 4. Simplified model for the cross-sectional layer geometry and its correlation with the deposition parameters.
Jmmp 05 00040 g004
Figure 5. Predicted work envelop.
Jmmp 05 00040 g005
Figure 6. Correlation between the WFS/TS ratio and the arc energy per unit length of deposit for the CMT process. The WTS/TS ratio (X axis) is dimensionless, and to calculate it, the WFS and TS values must be in the same units.
Jmmp 05 00040 g006
Figure 7. Surface aspect of run 12 (WFS of 8 m/min.), which did not meet the acceptance criteria.
Jmmp 05 00040 g007
Figure 8. Relative density of the preforms produced according to Table 3 (acceptance criteria: Above the red line).
Jmmp 05 00040 g008
Figure 9. Atlas of the typical cross-sections of the preforms in terms of WFS values and WFS/TS ratios.
Jmmp 05 00040 g009
Figure 10. Surface waviness according to WFS and TS values (acceptance criteria: Below the red line): (a) WFS: 5.0 m/min, (b) WFS: 6.5 m/min, (c) WFS: 8.0 m/min and (d) WFS: 9.5 m/min.
Jmmp 05 00040 g010
Figure 11. Experimentally based work envelope: Initial results.
Jmmp 05 00040 g011
Figure 12. Supplementary shielding gas nozzle devised (Ø 50 mm) to mitigate excessive oxidation of the layer top surface.
Jmmp 05 00040 g012
Figure 13. Visual effectiveness of the supplementary shielding gas device.
Jmmp 05 00040 g013
Figure 14. Typical cross-sections of the preforms deposited with the WFS at 5 m/min and LEWD at 30 mm.
Jmmp 05 00040 g014
Figure 15. Comparison of surface waviness according to WFS and TS values for the LEWD parameter set at 20 and 30 mm (acceptance criteria: Below the red line).
Jmmp 05 00040 g015
Figure 16. Experimentally based work envelope expanded after troubleshooting the excessive oxidation and SW issues.
Jmmp 05 00040 g016
Figure 17. Layer height values according to the expanded work envelope: (a) WFS: 5.0 m/min, (b) WFS: 6.5 m/min, (c) WFS: 8.0 m/min and (d) WFS: 9.5 m/min.
Jmmp 05 00040 g017
Figure 18. Summary of the multivariate regression performed for the TWW, EWW, and LH responses: R2 values, residual plots, response surfaces, and regression equations.
Jmmp 05 00040 g018
Figure 19. Typical cross-section of the preform deposited for experimental validation of the empirical modeling and optimization procedure and respective WAAM parameters (target wall width (T) of 5.0 mm).
Jmmp 05 00040 g019
Figure 20. Flowchart of decision-making procedure towards preform quality in WAAM.
Jmmp 05 00040 g020
Table 1. Collection of contributions on parametric charts and approaches for their expansion and robustness improvement in WAAM.
ReferenceProcess MaterialContribution
Martina et al. [6]Plasma
Ti6Al4V
Designed an operational map from experimental trials by using statistical tools for WAAM.
Ríos et al. [7]Plasma
Ti6Al4V
Proposed an analytical process model for predicting layer height and wall width, which includes inter-pass temperature and material properties.
Ali et al. [8]GMA
Hot work tool steel
Assessed the effect of process parameters on bead geometry and highlighted the difference between adjusted and measured wire feed speed for the CMT process.
Marinelli et al. [9]GTA
Unalloyed tungsten
Expanded the work envelope in terms of travel speed by changing the shielding gas composition.
Michel et al. [10]Plasma
Ti6Al4V
Developed a path planning solution by incorporating the modularity of design into the path planning task.
Henckell et al. [11]GMA
Low-alloyed steel
Expanded the work envelope by a systematic variation of the CTWD value.
Scotti et al. [12]GMA
Al5Mg
Improved the process robustness via an active cooling technique and by systematically varying the electrode polarity ratio.
Ding et al. [13]GMA
Al5Si
Developed a process planning to achieve better shape accuracy and material efficiency in structures with sharp corners.
Table 2. Deposition conditions for the parameter selection procedure.
Arc deposition equipmentFronius CMT—TransPuls Synergic 500
Deposition materialAWS ER 5356-Ø 1.0 mm Wire
SubstrateAl5052 (220 × 38.1 × 6.4 mm) plate
CTWD 112 mm
Shielding gasCommercial argon (15 L/min)
Cooling liquidTap water at around 20 °C
Work tank volume50 L
Preform geometrySingle wall with 12 layers and length of 200 mm
Building strategySingle-pass multi-layers bidirectional deposition
Dwell time10 s/layer
Thermal managementNear-immersion Active Cooling—NIAC
1 CTWD stands for “contact tube to work distance”.
Table 3. Matrix of experiments to build the work envelop.
RunPredicted TWW
(mm)
Predicted LH
(mm)
WFS
(m/min)
TS
(mm/min)
WFS/TS
(-) 1
17.03.55.03.424.5
26.03.05.04.618.0
35.02.55.06.712.5
44.02.05.010.48.0
57.03.56.54.424.5
66.03.06.56.018.0
75.02.56.58.712.5
84.02.06.513.68.0
97.03.58.05.524.5
106.03.08.07.418.0
115.02.58.010.712.5
124.02.08.016.78.0
137.03.59.56.524.5
146.03.09.58.818.0
155.02.59.512.712.5
164.02.09.519.88.0
1 The WTS/TS ratio is dimensionless and to calculate it the WFS and TS values must be in the same units.
Table 4. Acceptance criteria for the work envelope.
FeaturesMethod of InspectionAcceptance Criteria
Surface aspectVisualThe surface of the layer shall be smooth, shiny, and sufficiently free from coarse undulations, grooves, overlaps, abrupt ridges, and valleys.
Surface wavinessCross-section analysesThe surface waviness shall be lower than 0.5 mm [21].
Relative
density
Archimedes’ methodThe preform relative density shall be higher than 97% [22].
Table 5. WAAM parameters estimated through numerical optimization for different target wall width (T) values.
T (mm)4.04.55.05.56.06.5
WFS (m/min)6.97.78.78.59.49.4
TS (mm/min)14.114.815.211.710.89.3
LH (mm)1.41.51.722.22.3
LEWD (mm)272220202020
Publisher’s Note: MDPI stays neutral with regard to jurisdictional claims in published maps and institutional affiliations.