Article

The Role of Substrate Surface Roughness on in-Pack Aluminization Kinetics of Ni-Base Superalloy

Department of Materials Science, Faculty of Mechanical Engineering and Aeronautics, Rzeszow University of Technology, Powstancow Warszawy 12, 35-959 Rzeszow, Poland
*
Author to whom correspondence should be addressed.
J. Manuf. Mater. Process. 2020, 4(1), 15; https://doi.org/10.3390/jmmp4010015
Submission received: 25 January 2020 / Revised: 17 February 2020 / Accepted: 20 February 2020 / Published: 22 February 2020

Abstract

:
The Ni-base superalloys facing high temperature require further protection against high temperature oxidation. One of the most common methods providing high temperature oxidation resistance is the production of aluminide layers (NiAl-coatings). It is known that the thickness of produced diffusion layer can be controlled by the temperature and time of aluminization process. However, no research on the effect of surface roughness on aluminization kinetics was conducted so far. Then, to elucidate the effect of surface roughness on aluminization kinetics, diffusion layers were obtained by an in-pack aluminization method on the IN 617 alloy with differently prepared surfaces, namely polished, ground using 220 grit SiC paper and 80 grit SiC paper. The obtained results revealed that different surface preparation does not affect the chemical and phase composition of produced layers. However, a strong influence of surface preparation method on aluminide layers thicknesses was observed. Namely, it was found that the increase in substrate surface roughness results in an increase of aluminization kinetics. The dependence between surface roughness and thickness of aluminide layers was found to be logarithmic. Moreover, it was found that the aluminization kinetics is influenced, especially at early stages of the aluminization process.

1. Introduction

The metallic materials experiencing high temperatures suffer due to high temperature oxidation i.e., they start oxidizing, i.e., the metals react with oxygen to produce so-called oxide scales. The oxide scales consist of MxOy (ceramics); therefore, they possess completely different mechanical properties (e.g., coefficient of thermal expansion (CTE)), in comparison with metals/alloys. The mismatch of CTE leads to the occurrence of stresses at the oxide scale/alloy interface. These stresses can be relaxed by crack formation within the oxide scale, whereas crack linking causes oxide scale spallation. The areas with spalled oxide scale are in direct contact with the atmosphere; therefore, they start to react once again. Repetition of spalling and re-growth of the oxide scale leads to reducing of the component wall thicknesses. The latter causes a decrease in mechanical properties of metallic components, which in turn leads to catastrophic failure. Therefore, the formation of as much protective oxide scale as possible is desired. Based on Ni, Cr, and Al content, Ni-base alloys are classified to be nickel oxide (NiO), chromia-(Cr2O3) or alumina (Al2O3) forming alloys [1]. Among the above-mentioned oxides, NiO is claimed to be a non-protective oxide scale due to its relatively high growth rate [2]. Chromia scale (Cr2O3) is classified to be a protective oxide scale. Despite the protective properties of chromia scale, chromia forming alloys cannot be successively used at temperatures above 1050 °C, due to relatively high volatilization of chromia species [3]. Alumina scale (Al2O3) is the most protective oxide scale and its formation during exposure at high temperature is desirable [4]. In the case of providing a sufficient durability of the materials used in the hottest regions of gas turbines and/or jet engines, a further protection against high temperature oxidation has to be provided [5]. In general, the protective coatings providing high temperature oxidation resistance can be manufactured either by plasma spraying of MCrAlY-types coatings (where M = Ni or Co) [6,7,8,9] or by aluminide layers manufacturing [10]. The aluminide coatings consisting of an β-NiAl phase can be produced using slurries containing Al [11,12], physical or chemical vapor deposition [13], additive manufacturing [14,15], or by in-pack thermochemical treatment [16,17]. It was shown that the thickness of produced aluminide coatings can be controlled by the time [18,19] and process temperature [20,21]. It is known from the literature that the surface roughness can influence the high temperature processes’ kinetics [22,23]. The effect of substrate roughness on the thickness of aluminide coatings described in the literature is limited and not consistent. Sreenath et al. [24] investigated the influence of surface roughness of low alloyed steel on the thickness of an aluminide layer produced by pack diffusion aluminization. The authors did not find any obvious effects. On the contrary, in the work of Dong et al. [25], the effect of substrate surface roughness on the thickness of an aluminide layers formed on 316L stainless steel was found. The authors found that the thickness of FeAl-coatings decreased with increasing gradation of SiC paper used for substrate surface preparation prior to the aluminizing process.
It is well known that the oxidation resistance of elements with an aluminide coatings mainly depends on Al-reservoir. Then, it is expected that manufacturing of thicker coatings will result in longer component lifetime. So far, no single research was conducted to investigate the effect of surface roughness of Ni-base superalloys on kinetics of aluminide layer growth during in-pack aluminization. Therefore, the aim of the present study is to investigate and quantitatively describe the role of substrate surface roughness on kinetics of the in-pack aluminization process of the Ni-base superalloy IN 617.

2. Materials and Methods

In the present work, aluminide coatings were made by in-pack thermochemical treatment using Ni-base superalloy IN 617 (GoodFellow Cambridge Limited, United Kingdom) with following nominal chemical composition: Ni-bal., Cr-22.0, Co-12.5, Mo-9.0, Al-1.2, Mn-0.5, C-0.1 and B-0.01 wt.% as a substrate. From a bar of base alloy, rectangular specimens with dimensions of 15 × 15 × 4 mm were cut. Then, all surfaces were ground using an abrasive SiC papers with increasing gradation up to 1000 grit. For such prepared samples, three types of surface preparation methods were performed. Namely, the first set of specimens was polished using 1 µm diamond suspension (set I), the second set was left with surface ground up to 1000 grit (set II), and the third set was ground using SiC paper with 80 grit (set III). Each set consisted of two samples with the same surface preparation steps. The substrate surface roughness was analyzed using a laser profilometer Sensofar S-Neox Non-contact 3D Optical Profiler (Sensofar, Barcelona, Spain). To minimize the effect of anisotropy of the ground surfaces, the roughness was always performed in the direction perpendicular to the grinding direction. After surface roughness description samples were subjected for aluminizing in powder mixture consisting of 3% NH4Cl (POCH S.A., Gliwice, Poland), 15% Al (Przedsiębiorstwo Wielobranżowe “B & K”, Bytom, Poland), and 82% Al2O3 (Oerlikon METCO, Salzgitter, Germany) (expressed in wt.%). The aluminizing was performed in tube furnace at 1000 °C according to the following procedure: samples were placed in rectangular, open crucible filled with the powder mixture up to half height and then filled up with the mixture to full height of crucible to provide a full contact of all samples’ surfaces with powder mixture. Then, the crucible was placed into the glass tube, closed and flushed with a high purity argon (5 N) for one hour. After flushing, a tube with crucible was moved into the hot zone of the furnace (heated up to 1000 °C) and kept for one hour. After one hour of aluminizing, the tube with a crucible was moved outside the furnace (cold zone) and cooled down under constant argon flux. The same procedure was applied for aluminizing for five hours (time for exposure in the hot zone of the furnace). After cooling, the samples were taken out from the crucible, their surfaces were cleaned from powder mixture particles remaining at the surfaces by blowing with compressed air and subsequent ultrasonic cleaning in ethanol and subjected for phase analysis. For phase composition identification, an X-ray diffractometer Miniflex II made by Rigaku was employed. The copper lamp (CuKα, λ = 0.1542 nm) with a voltage of 40 kV was used as an X-ray source. The measured 2θ angle ranged between 20–120° with a step size of 0.02°/s. After X-ray diffraction XRD measurement, the depth profiles showing distribution and concentration of alloying elements as function of sputtering time of aluminized samples using glow discharge optical emission spectrometer (GD-OES) made by Horiba Jobin Yvon (HJY, Longjumeau, France). was done. The quantification of GD-OES depth profiles was done according to the procedures described in references [26,27,28]. After depth profiling, the samples were prepared for microstructure studies using standard metallographic procedures. Cross-sections analyses were obtained using a light optical microscope (LOM) Nikon EPIPHOT 300 (Nikon, Tokyo, Japan) and scanning electron microscope (SEM) Hitachi S3400N (Toshiba, Tokyo, Japan). The SEM analysis was performed under 15.0 kV operating voltage with 40 Pa pressure using backscattered electron (BSE) mode measured by an energy dispersive spectrometer (EDS). The thickness of the coatings was calculated based on thirteen measurements on three different, randomly chosen locations on the cross-sections.

3. Results

3.1. Substrate Surface Roughness Description

Based on the measurement of surface roughness by a laser profilometer, parameters Ra (describing surface roughness) and SDR (indicating surface-to-volume ratio) were calculated according to the equation presented in Ref. [29] and shown in Table 1.

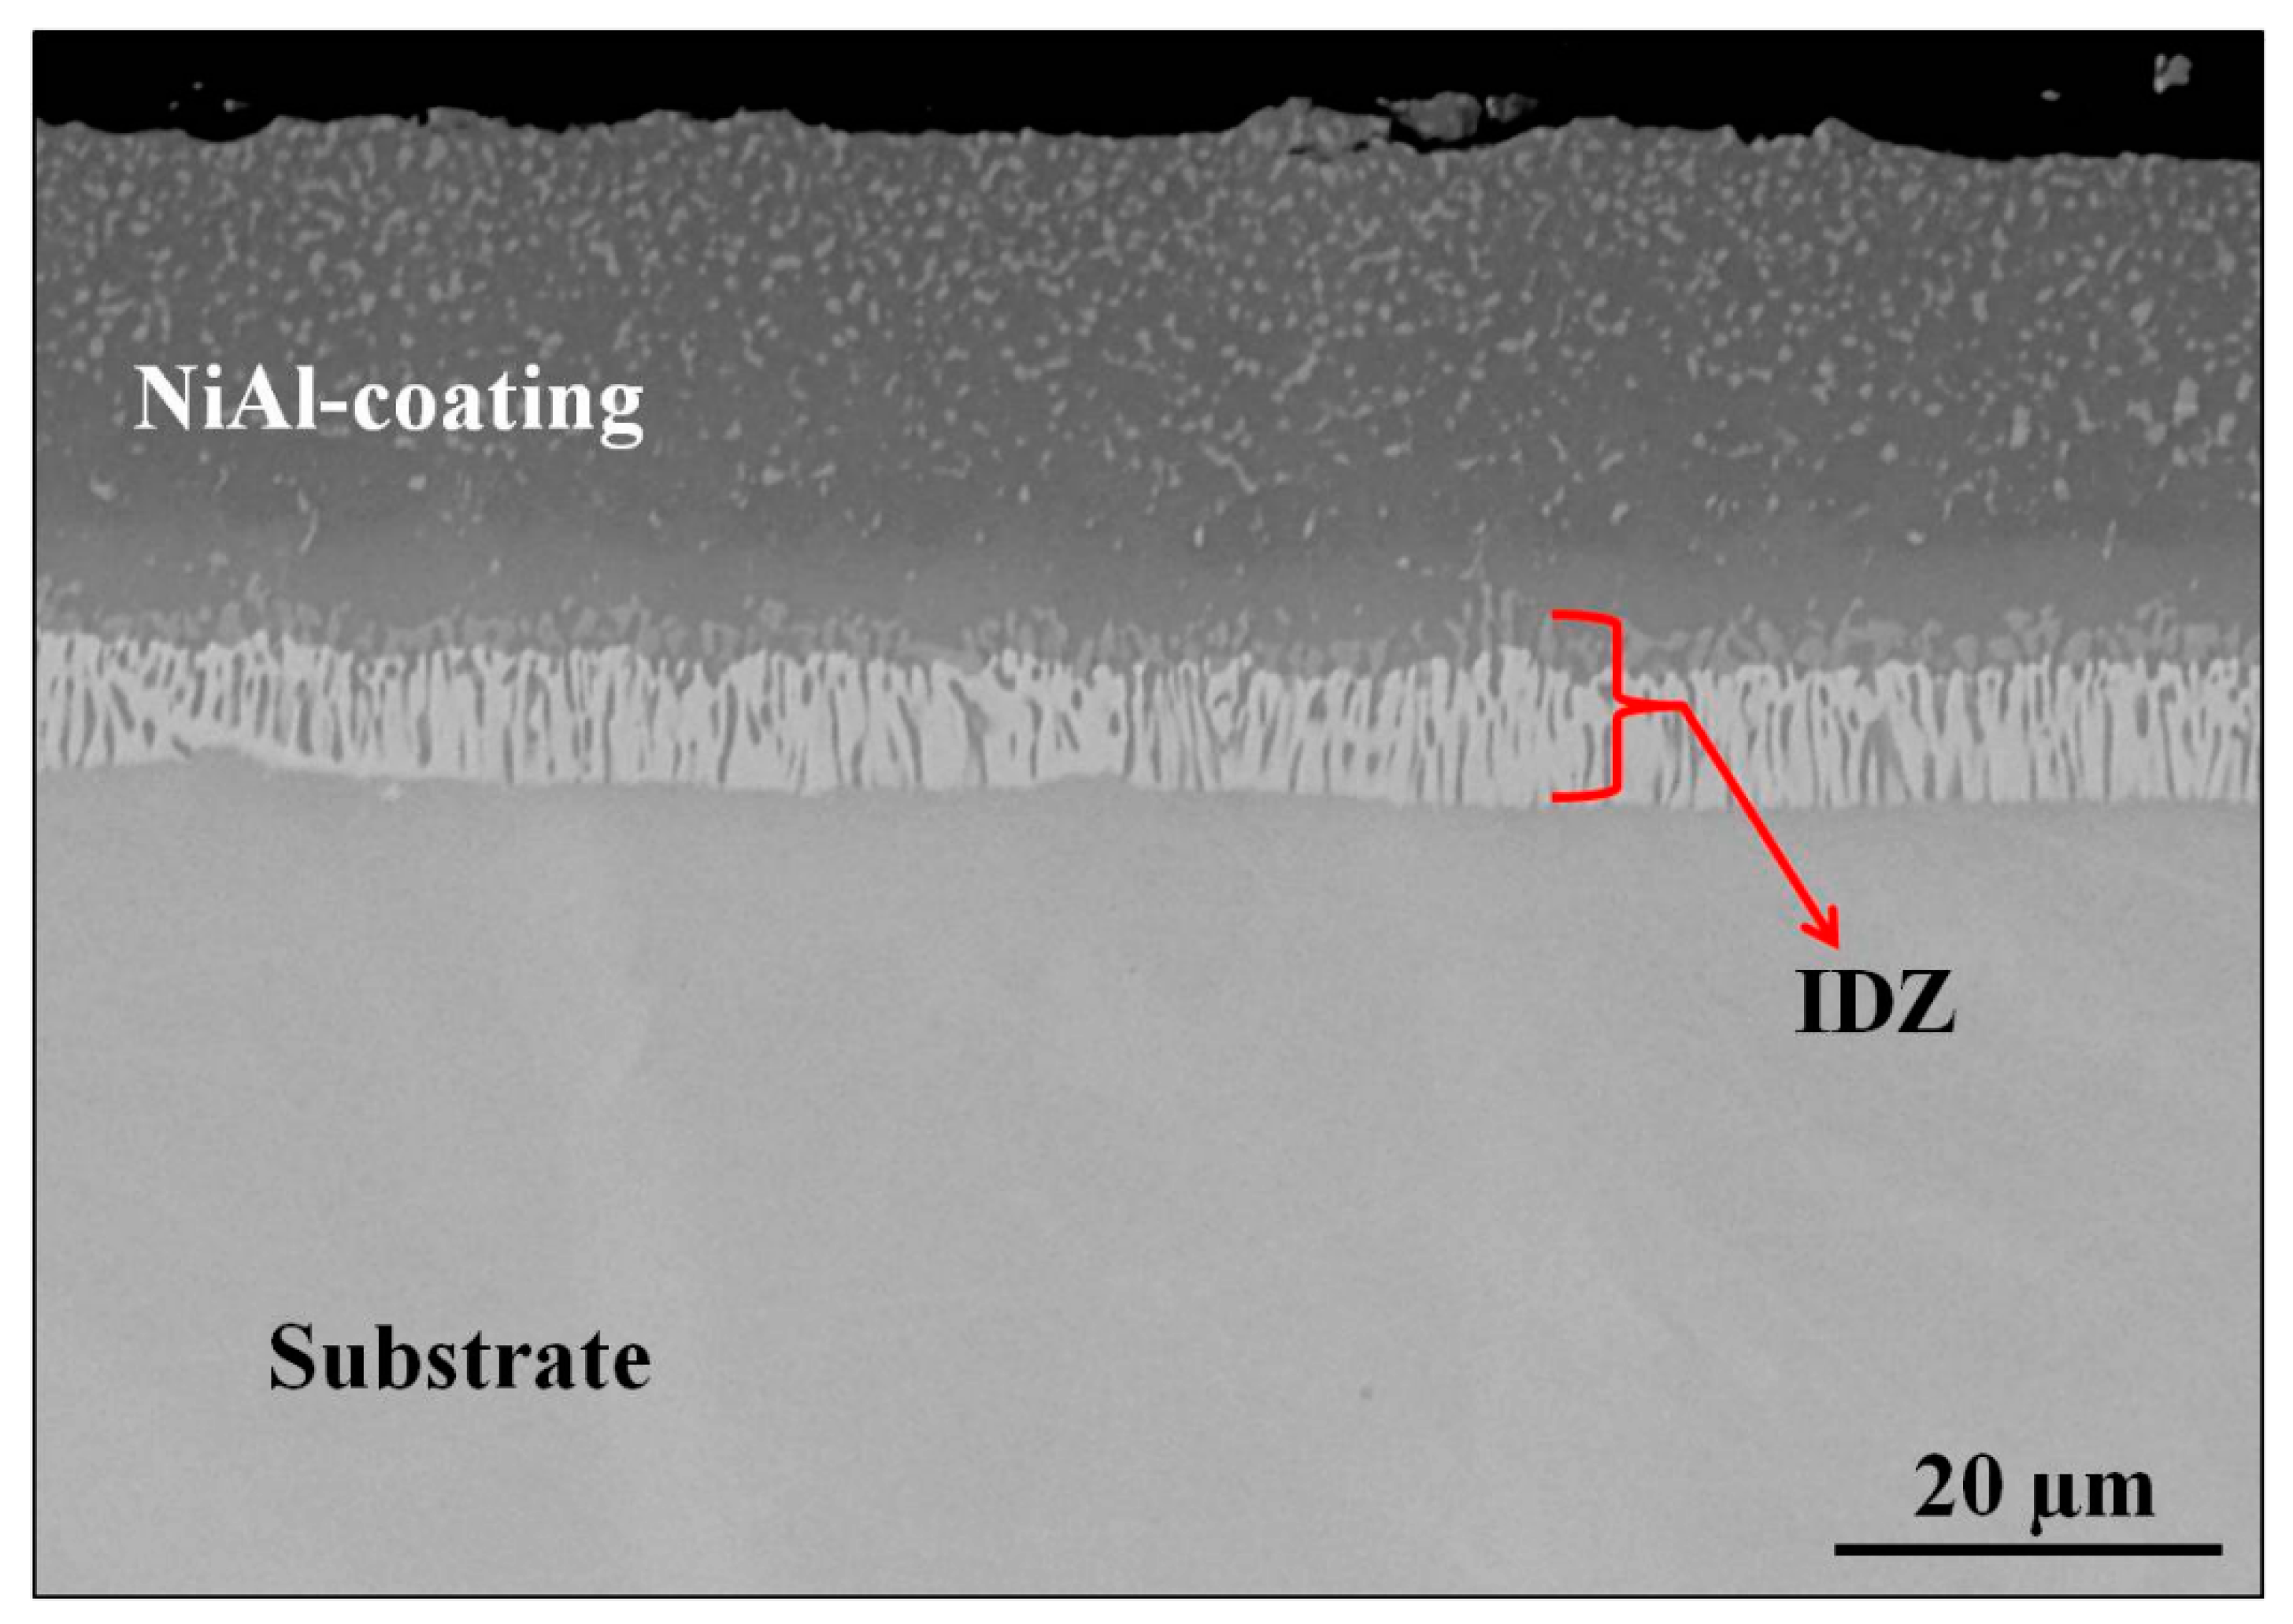
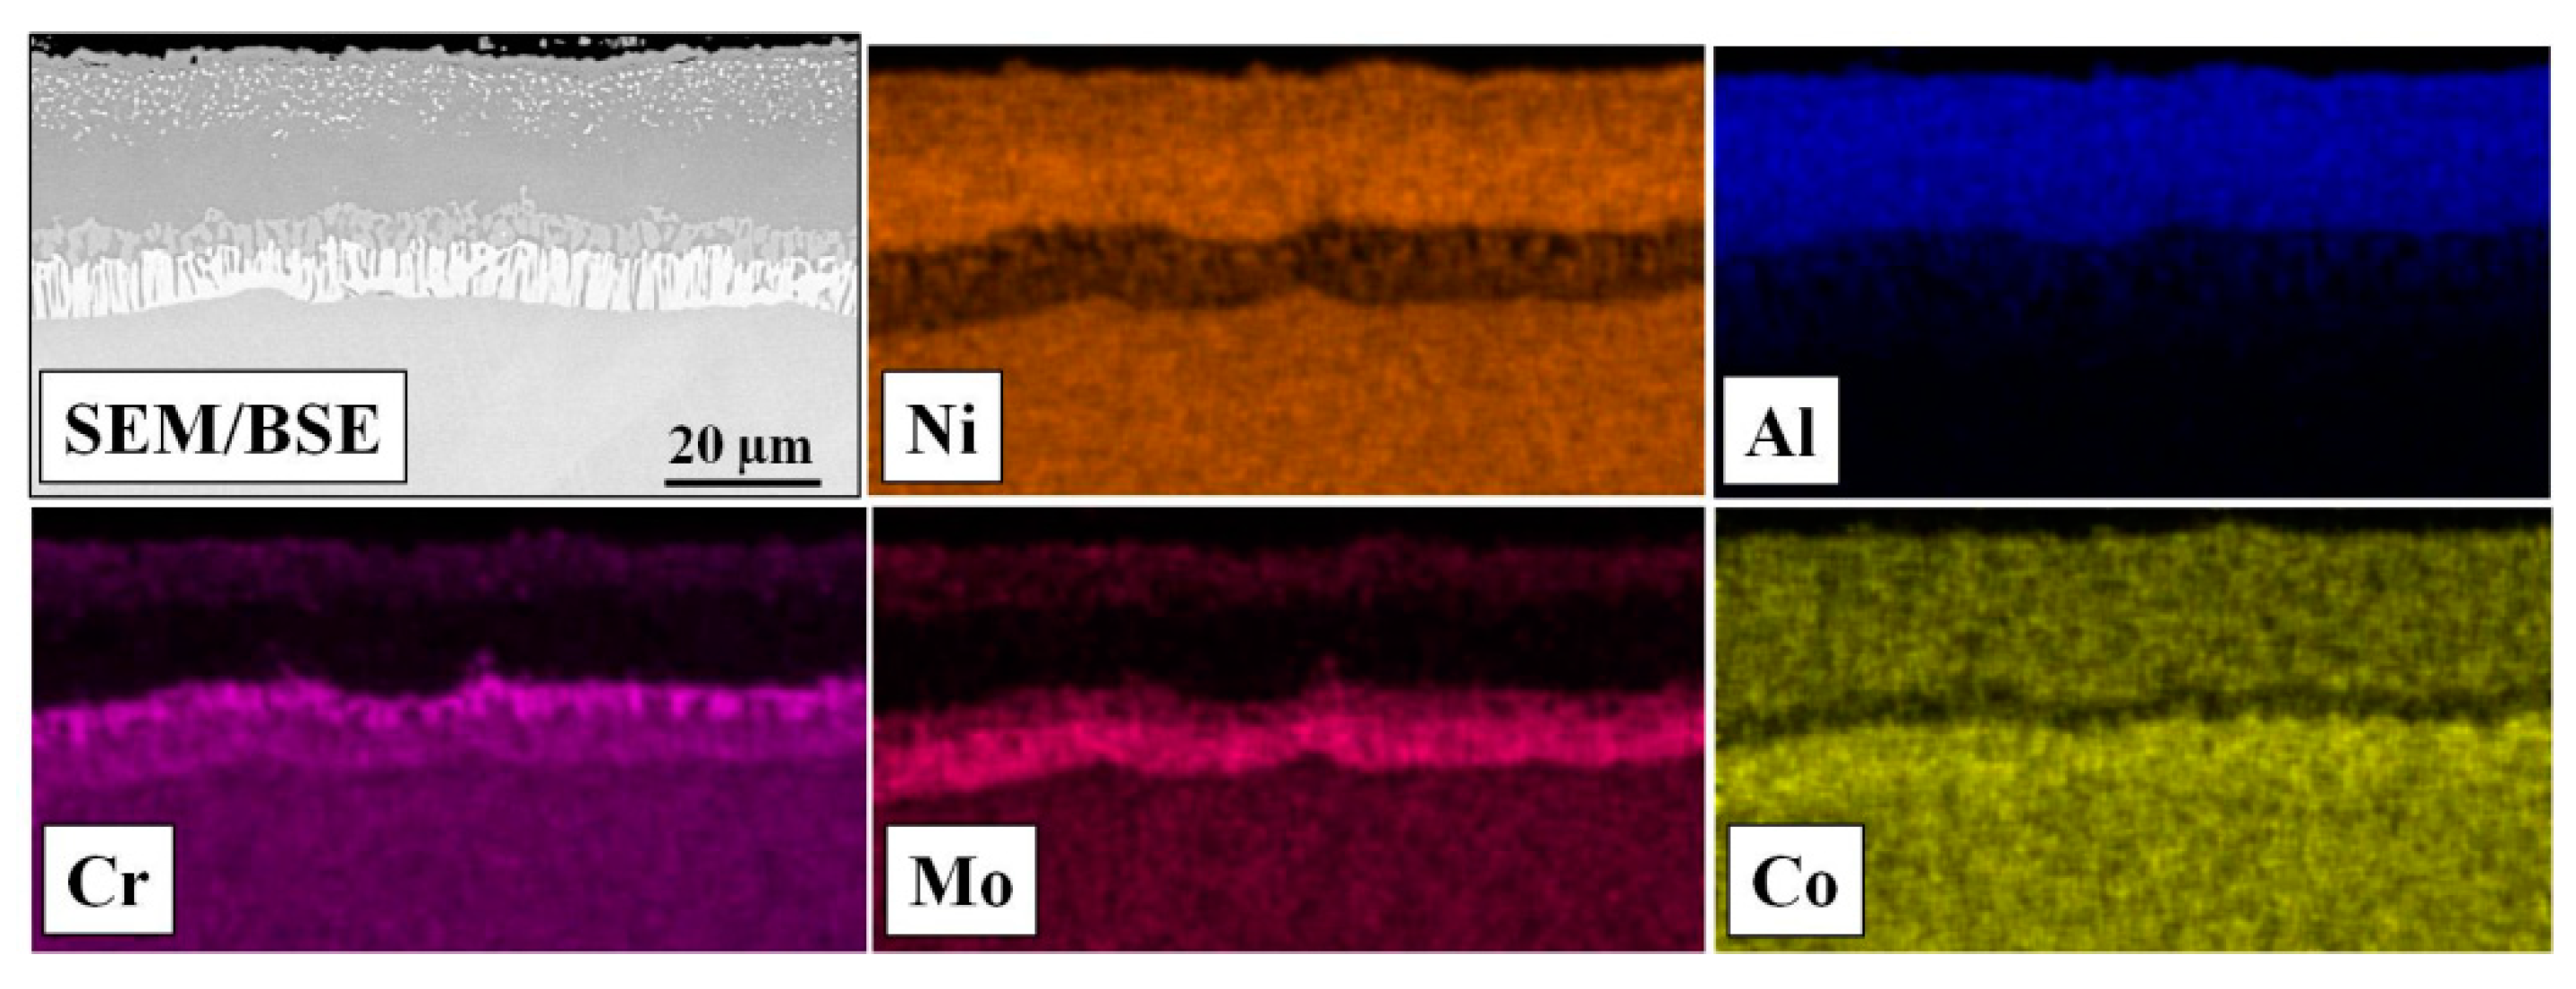
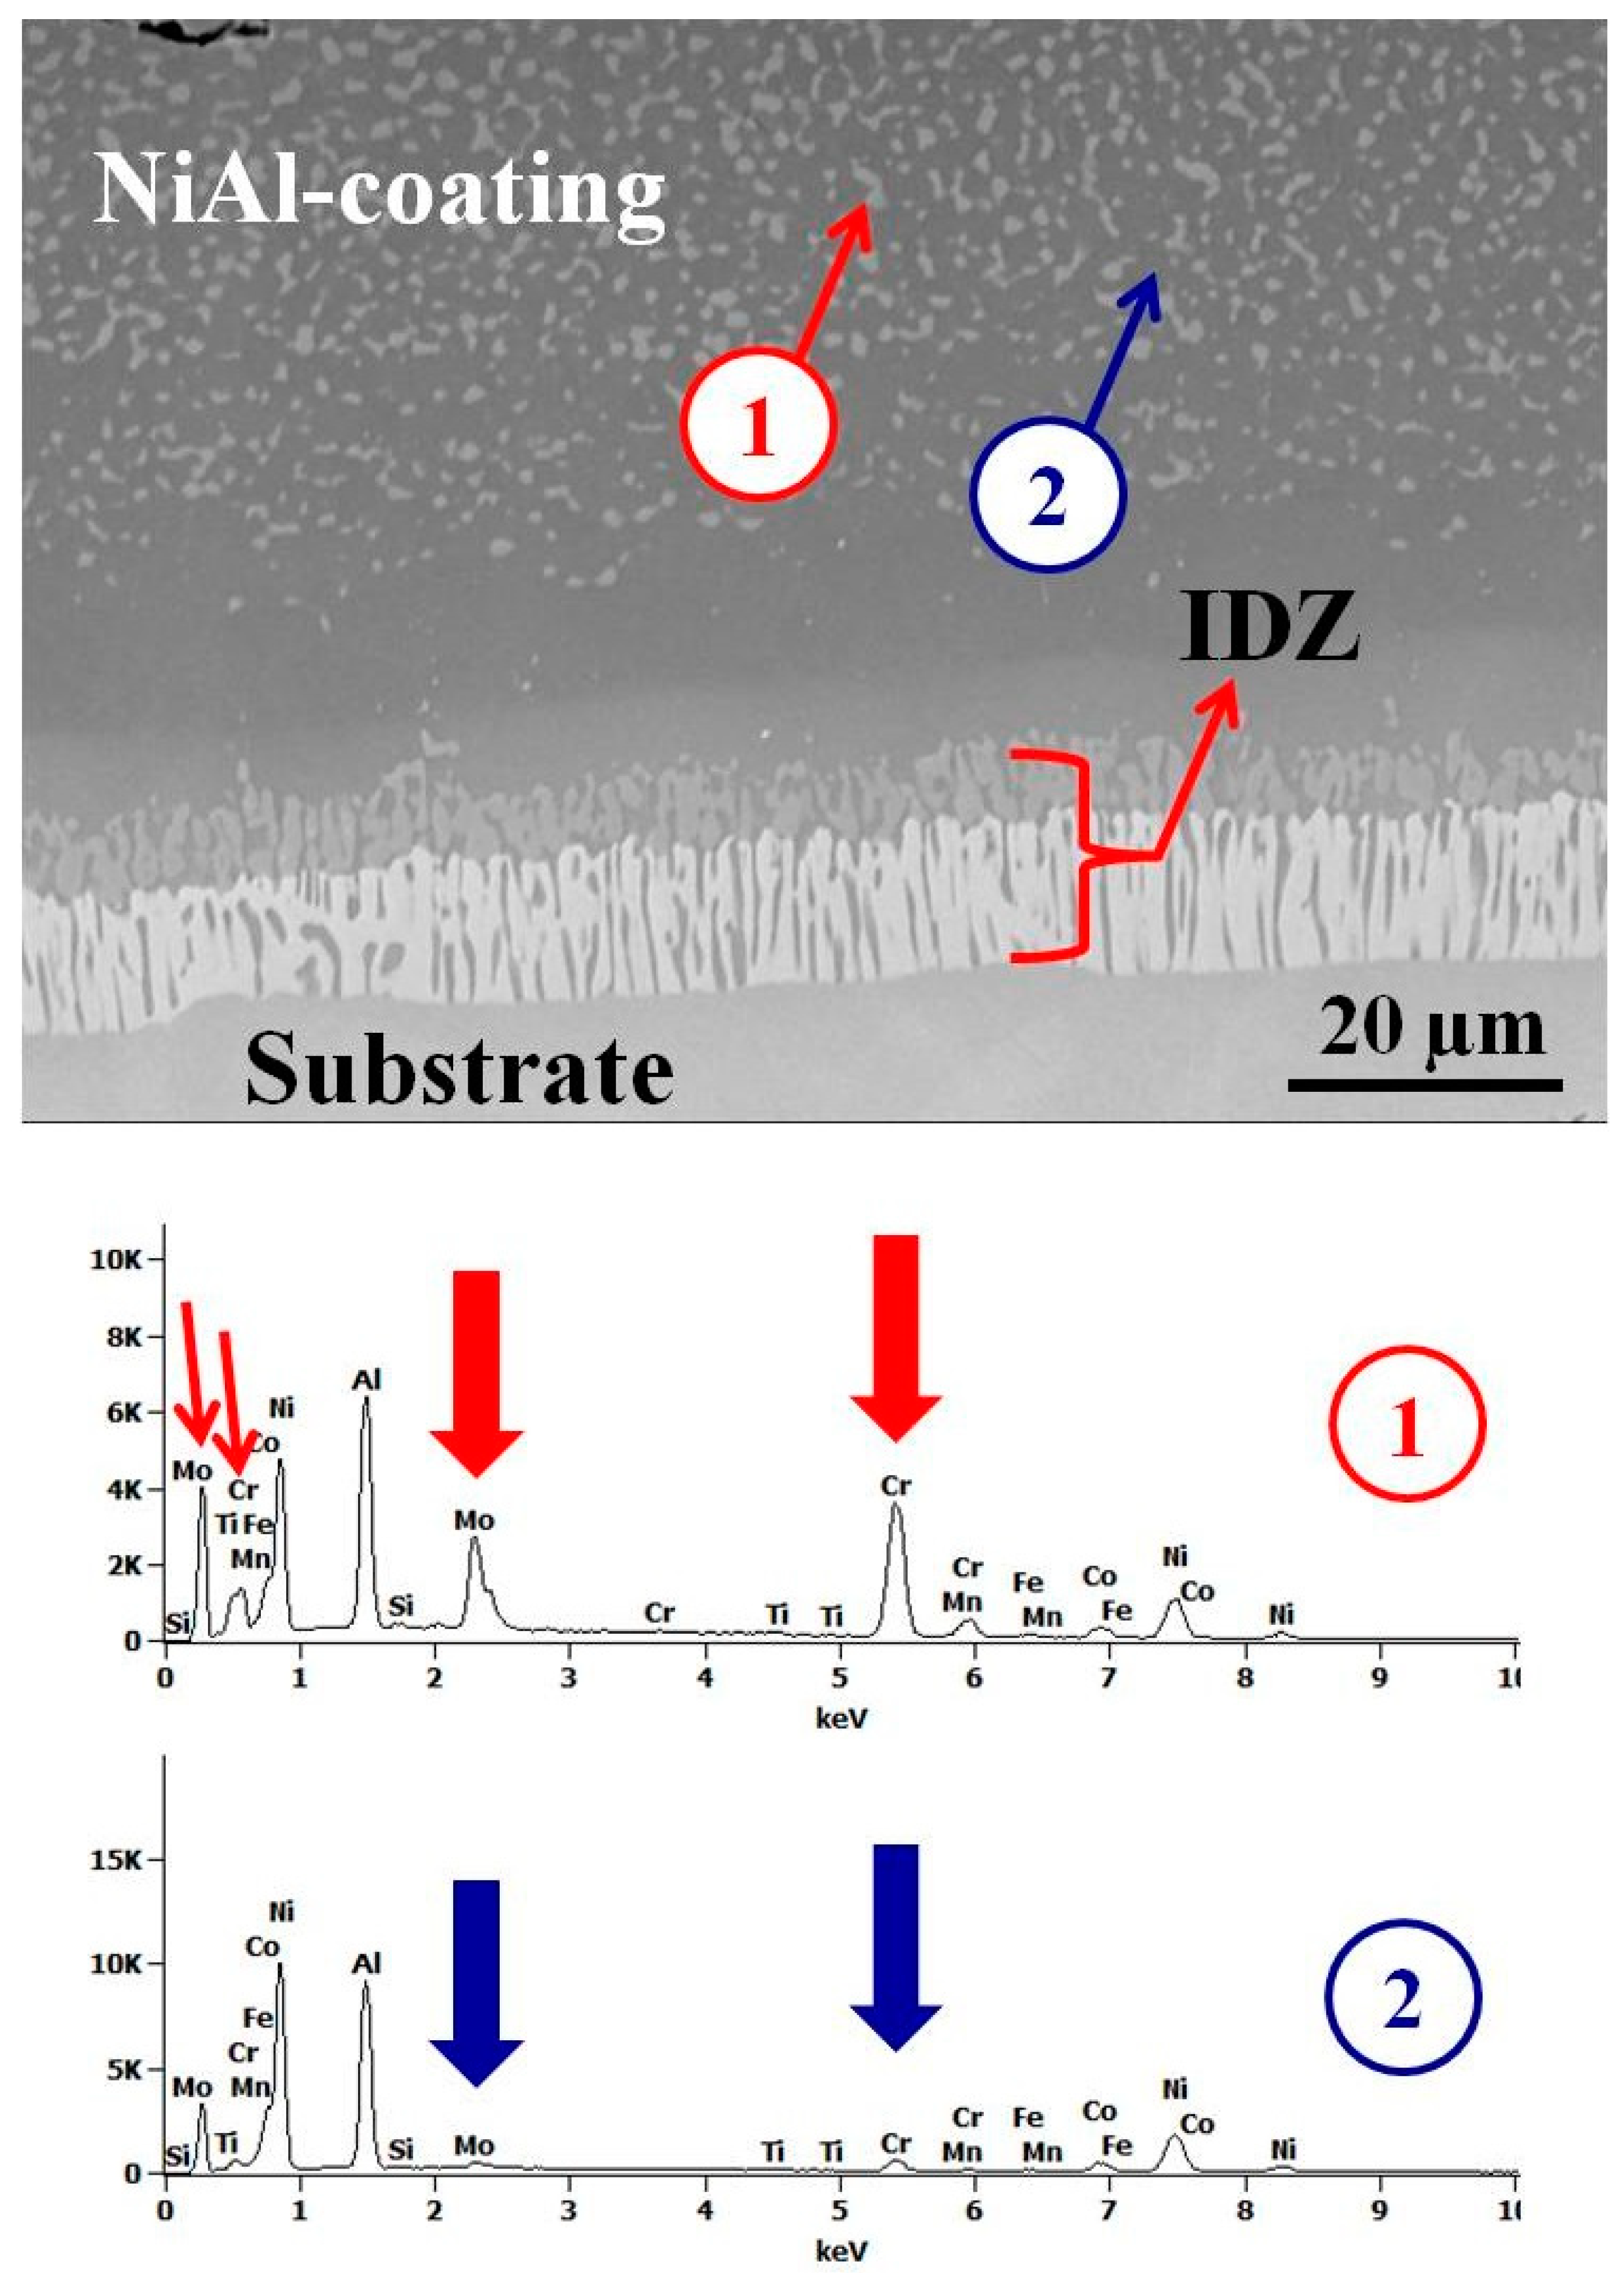
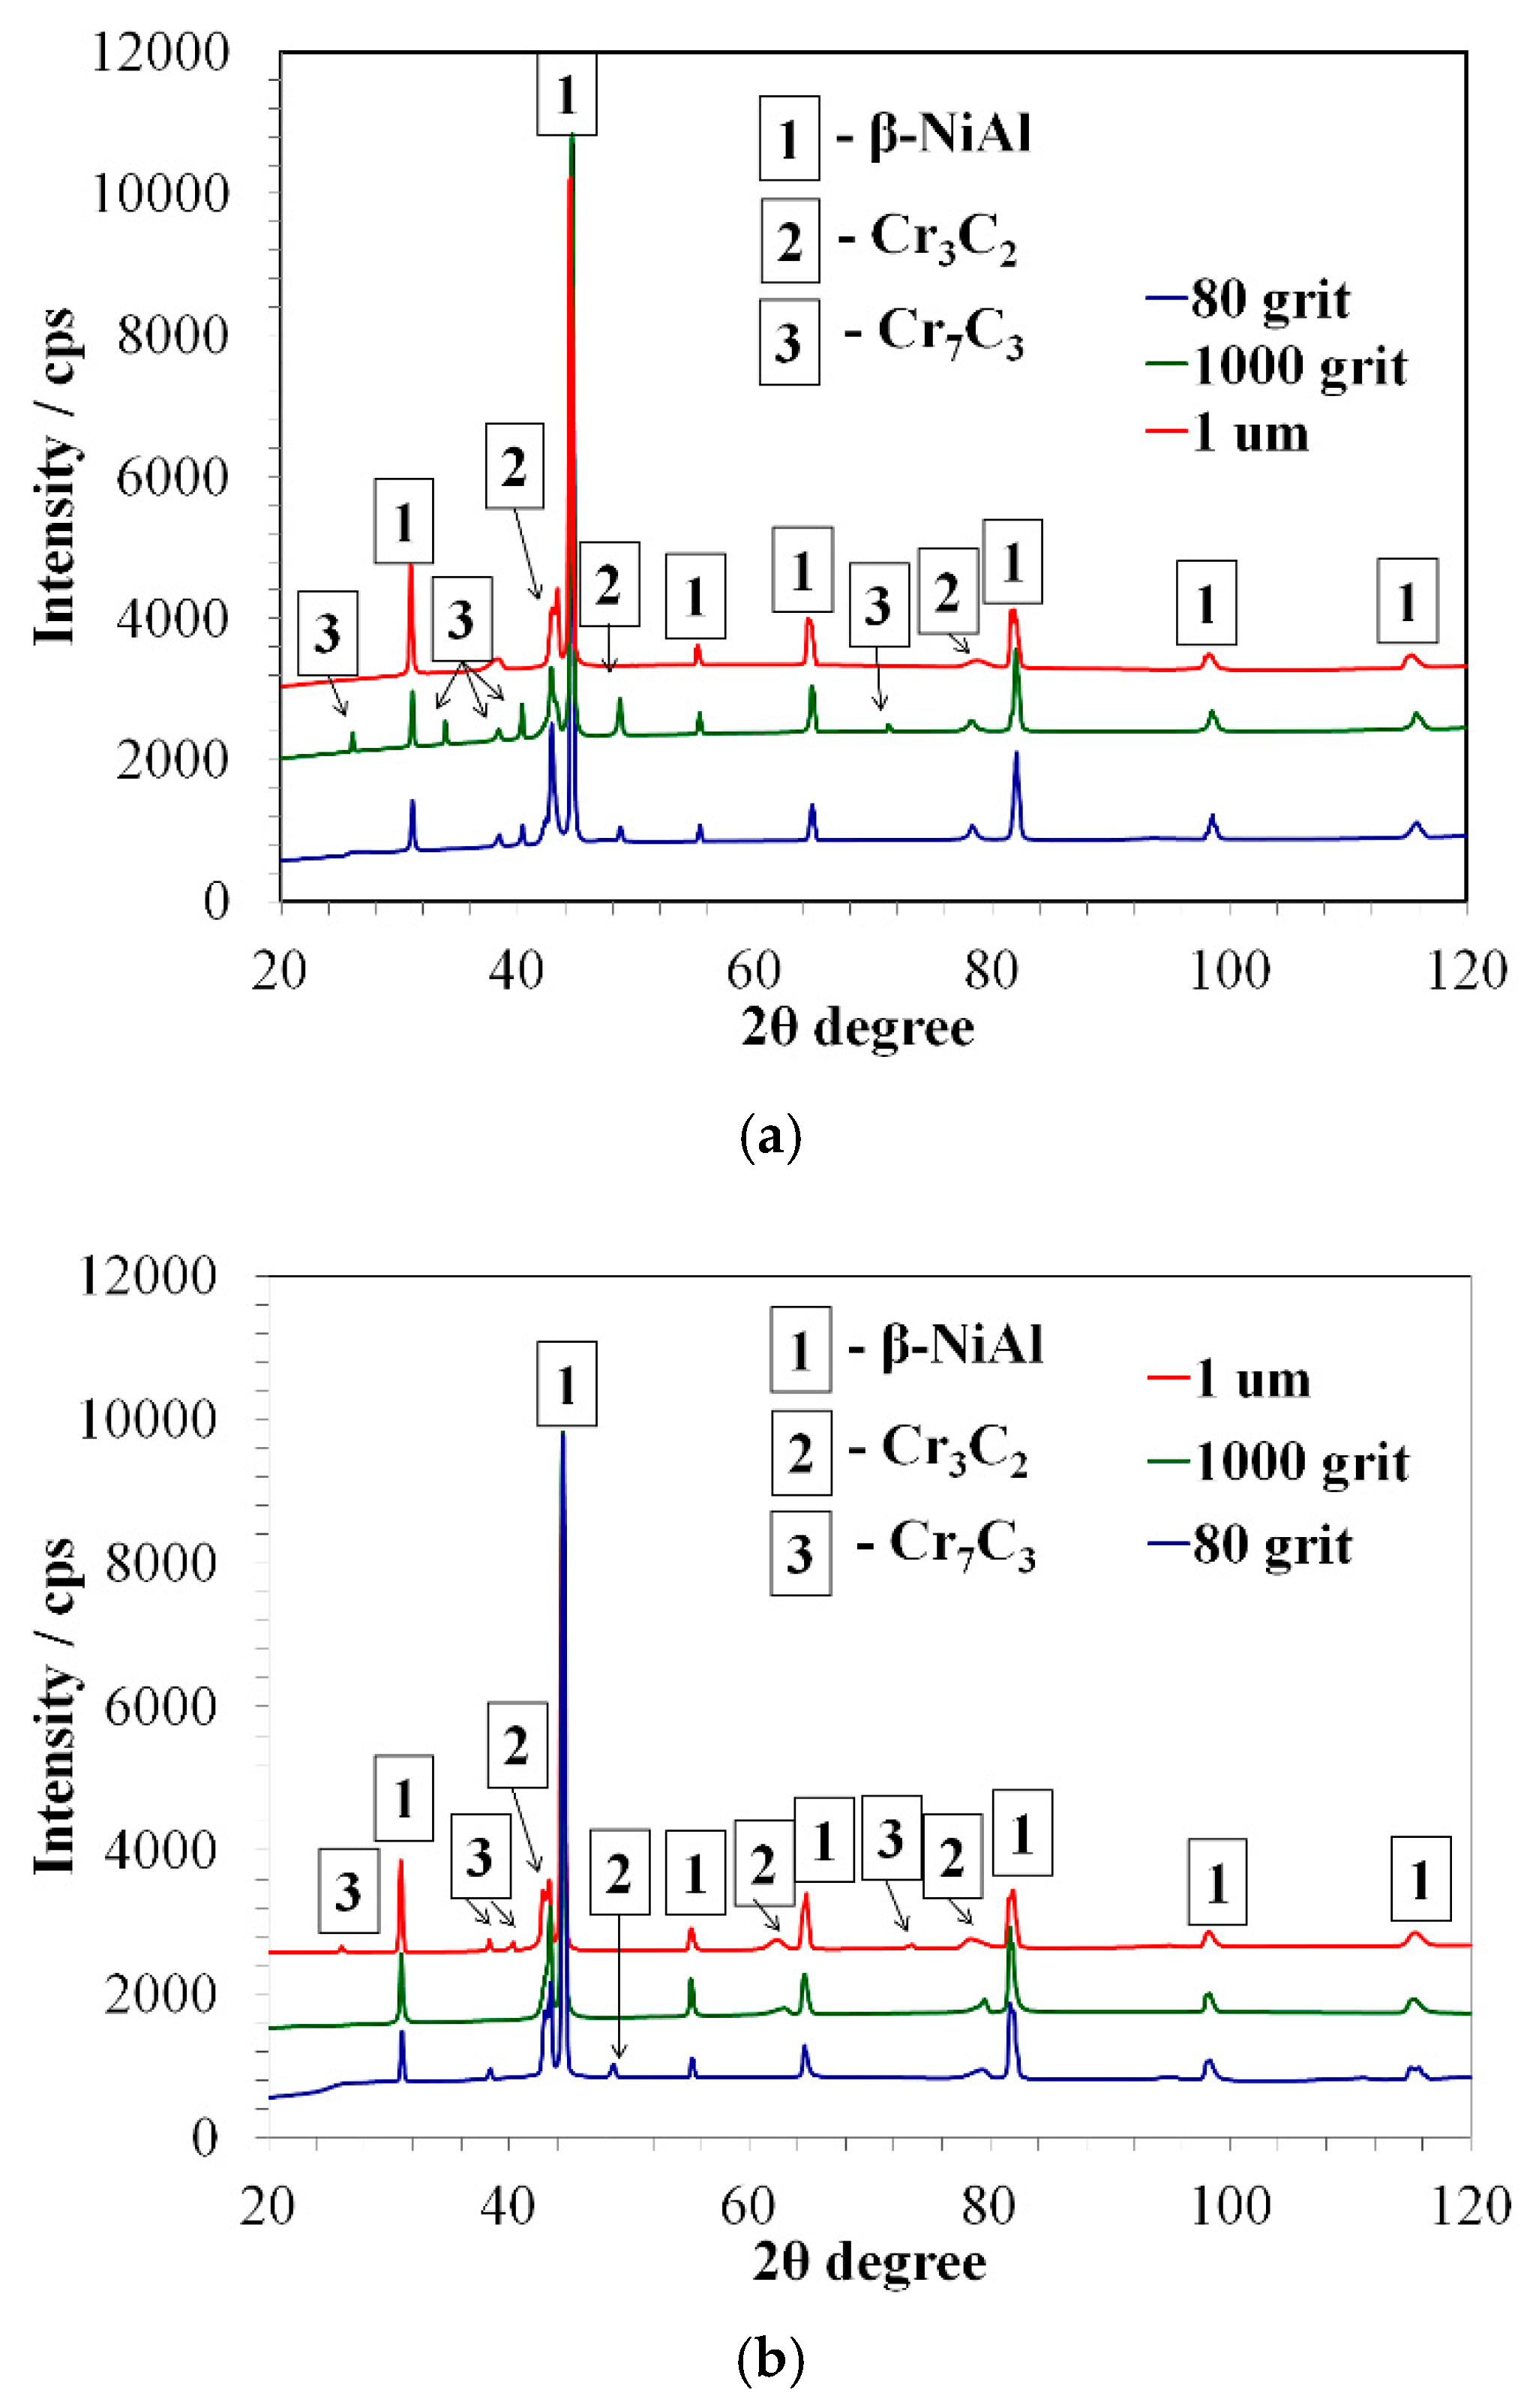
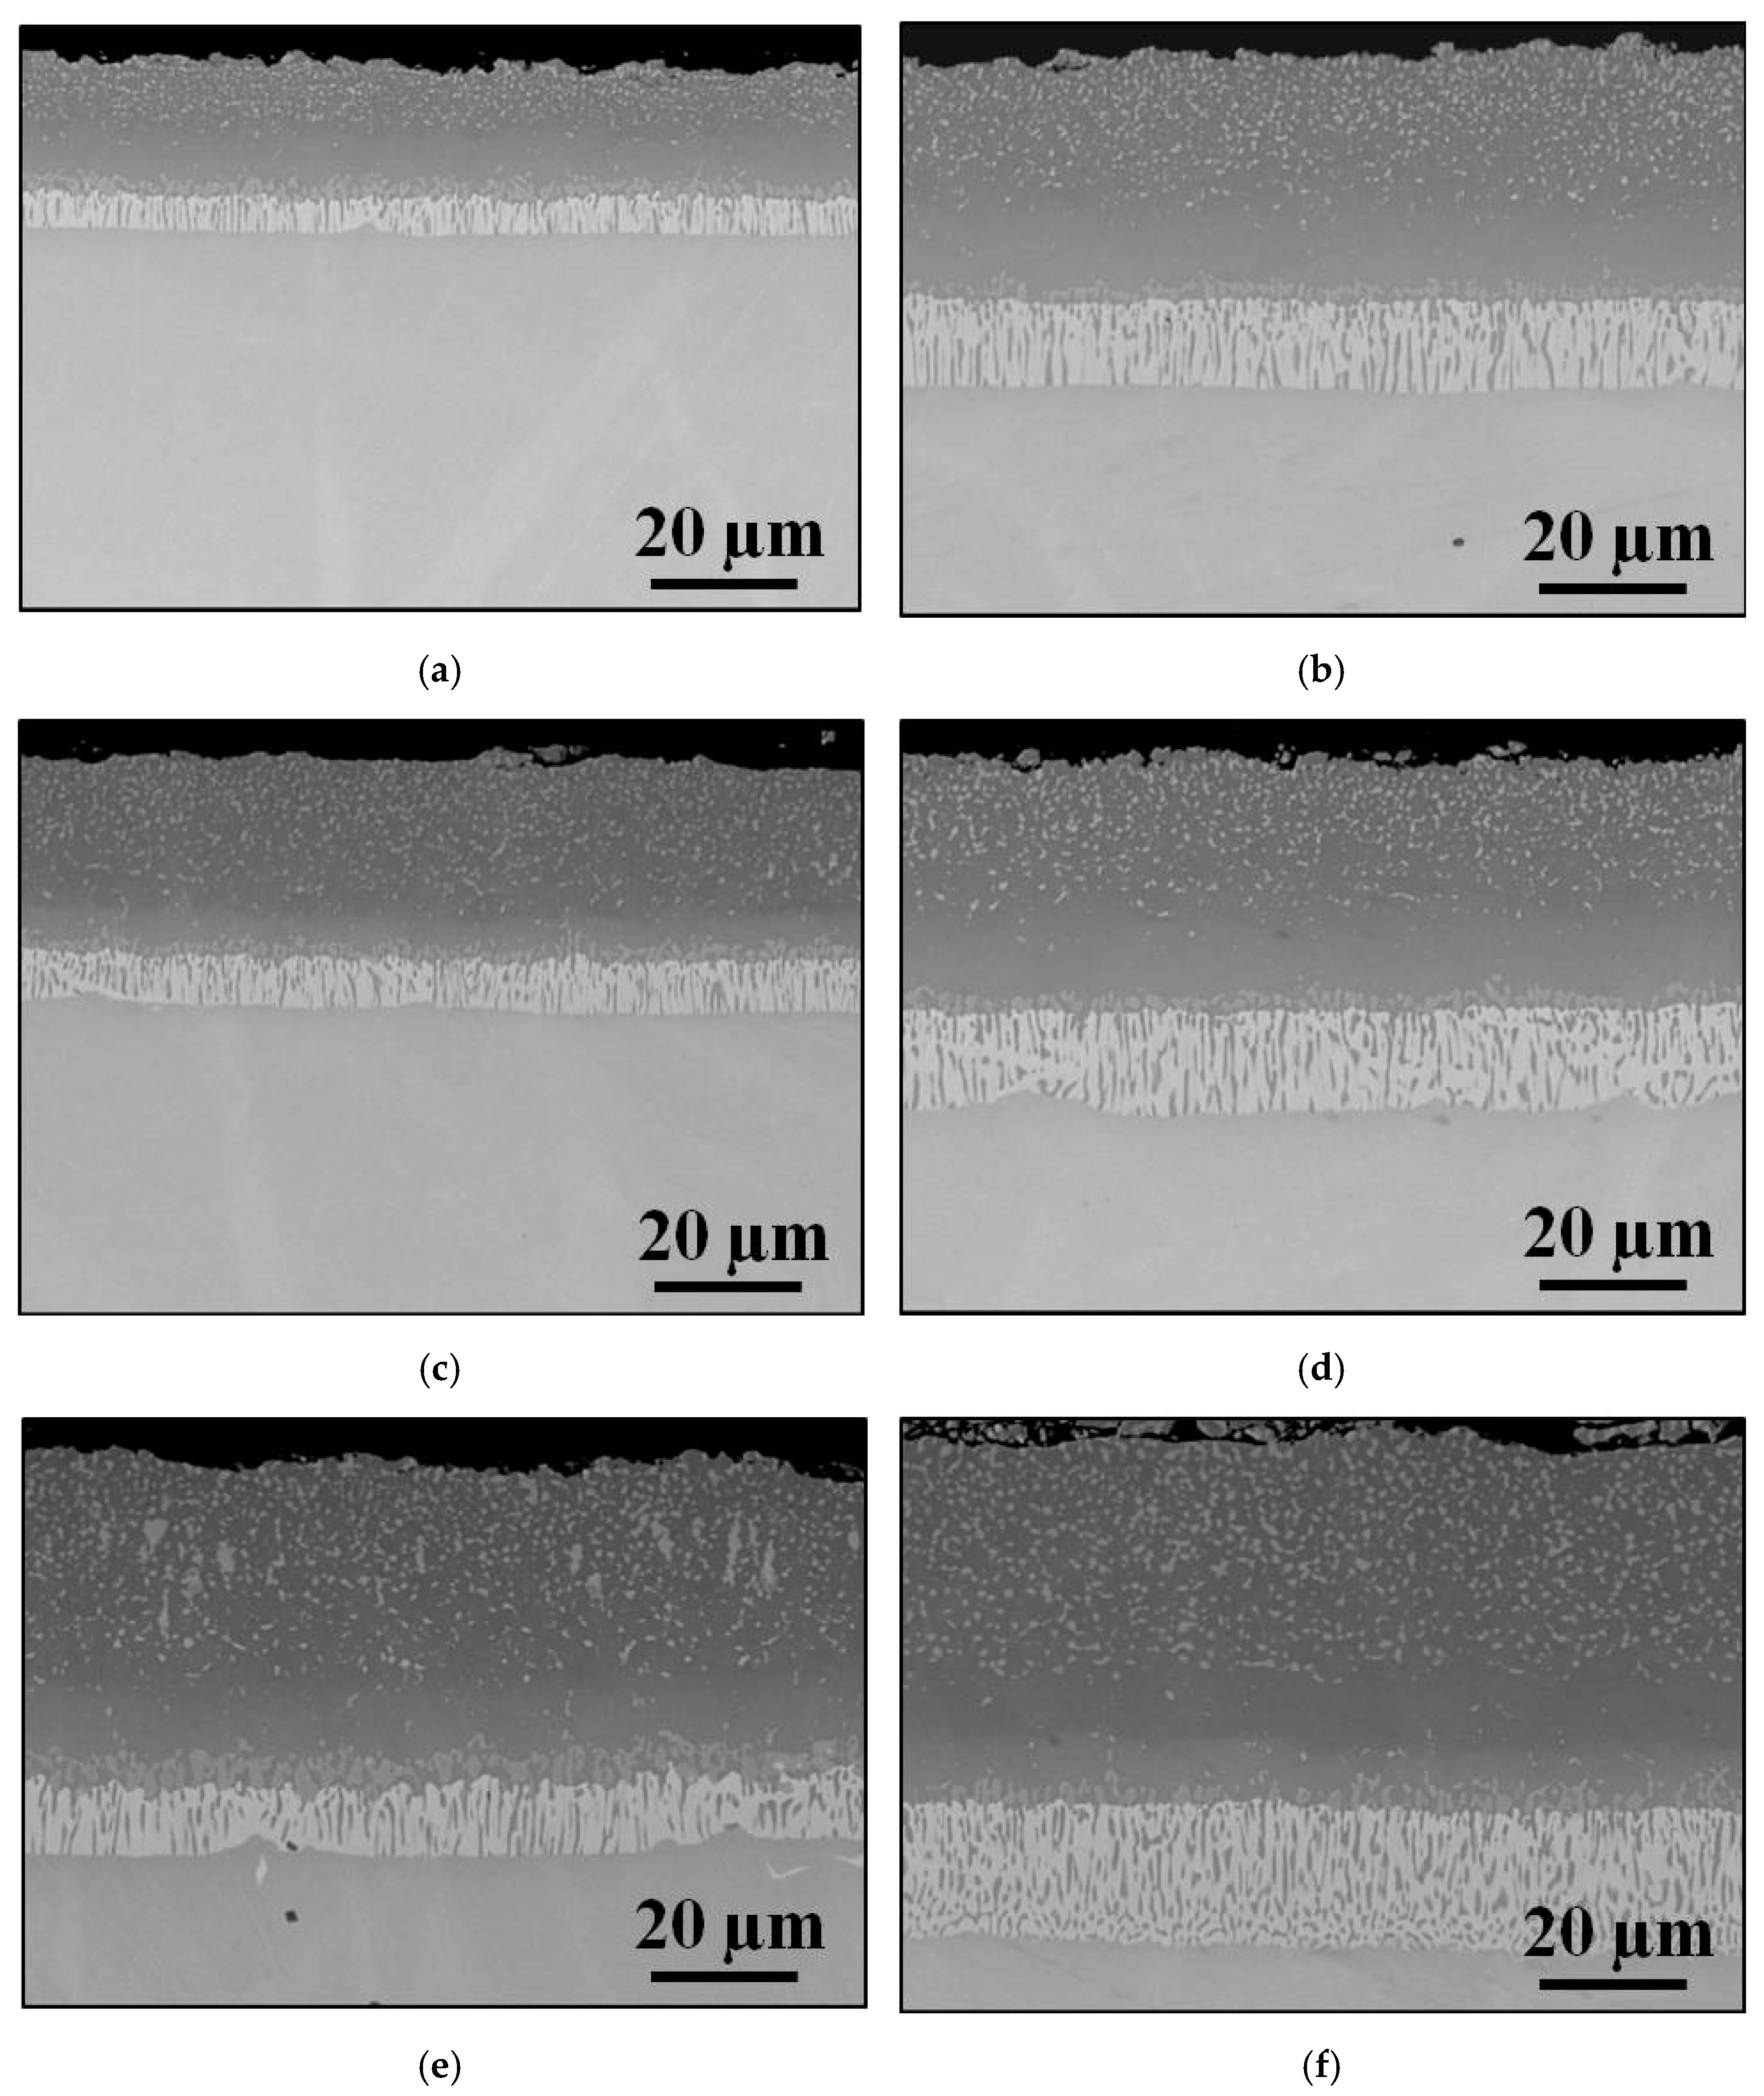
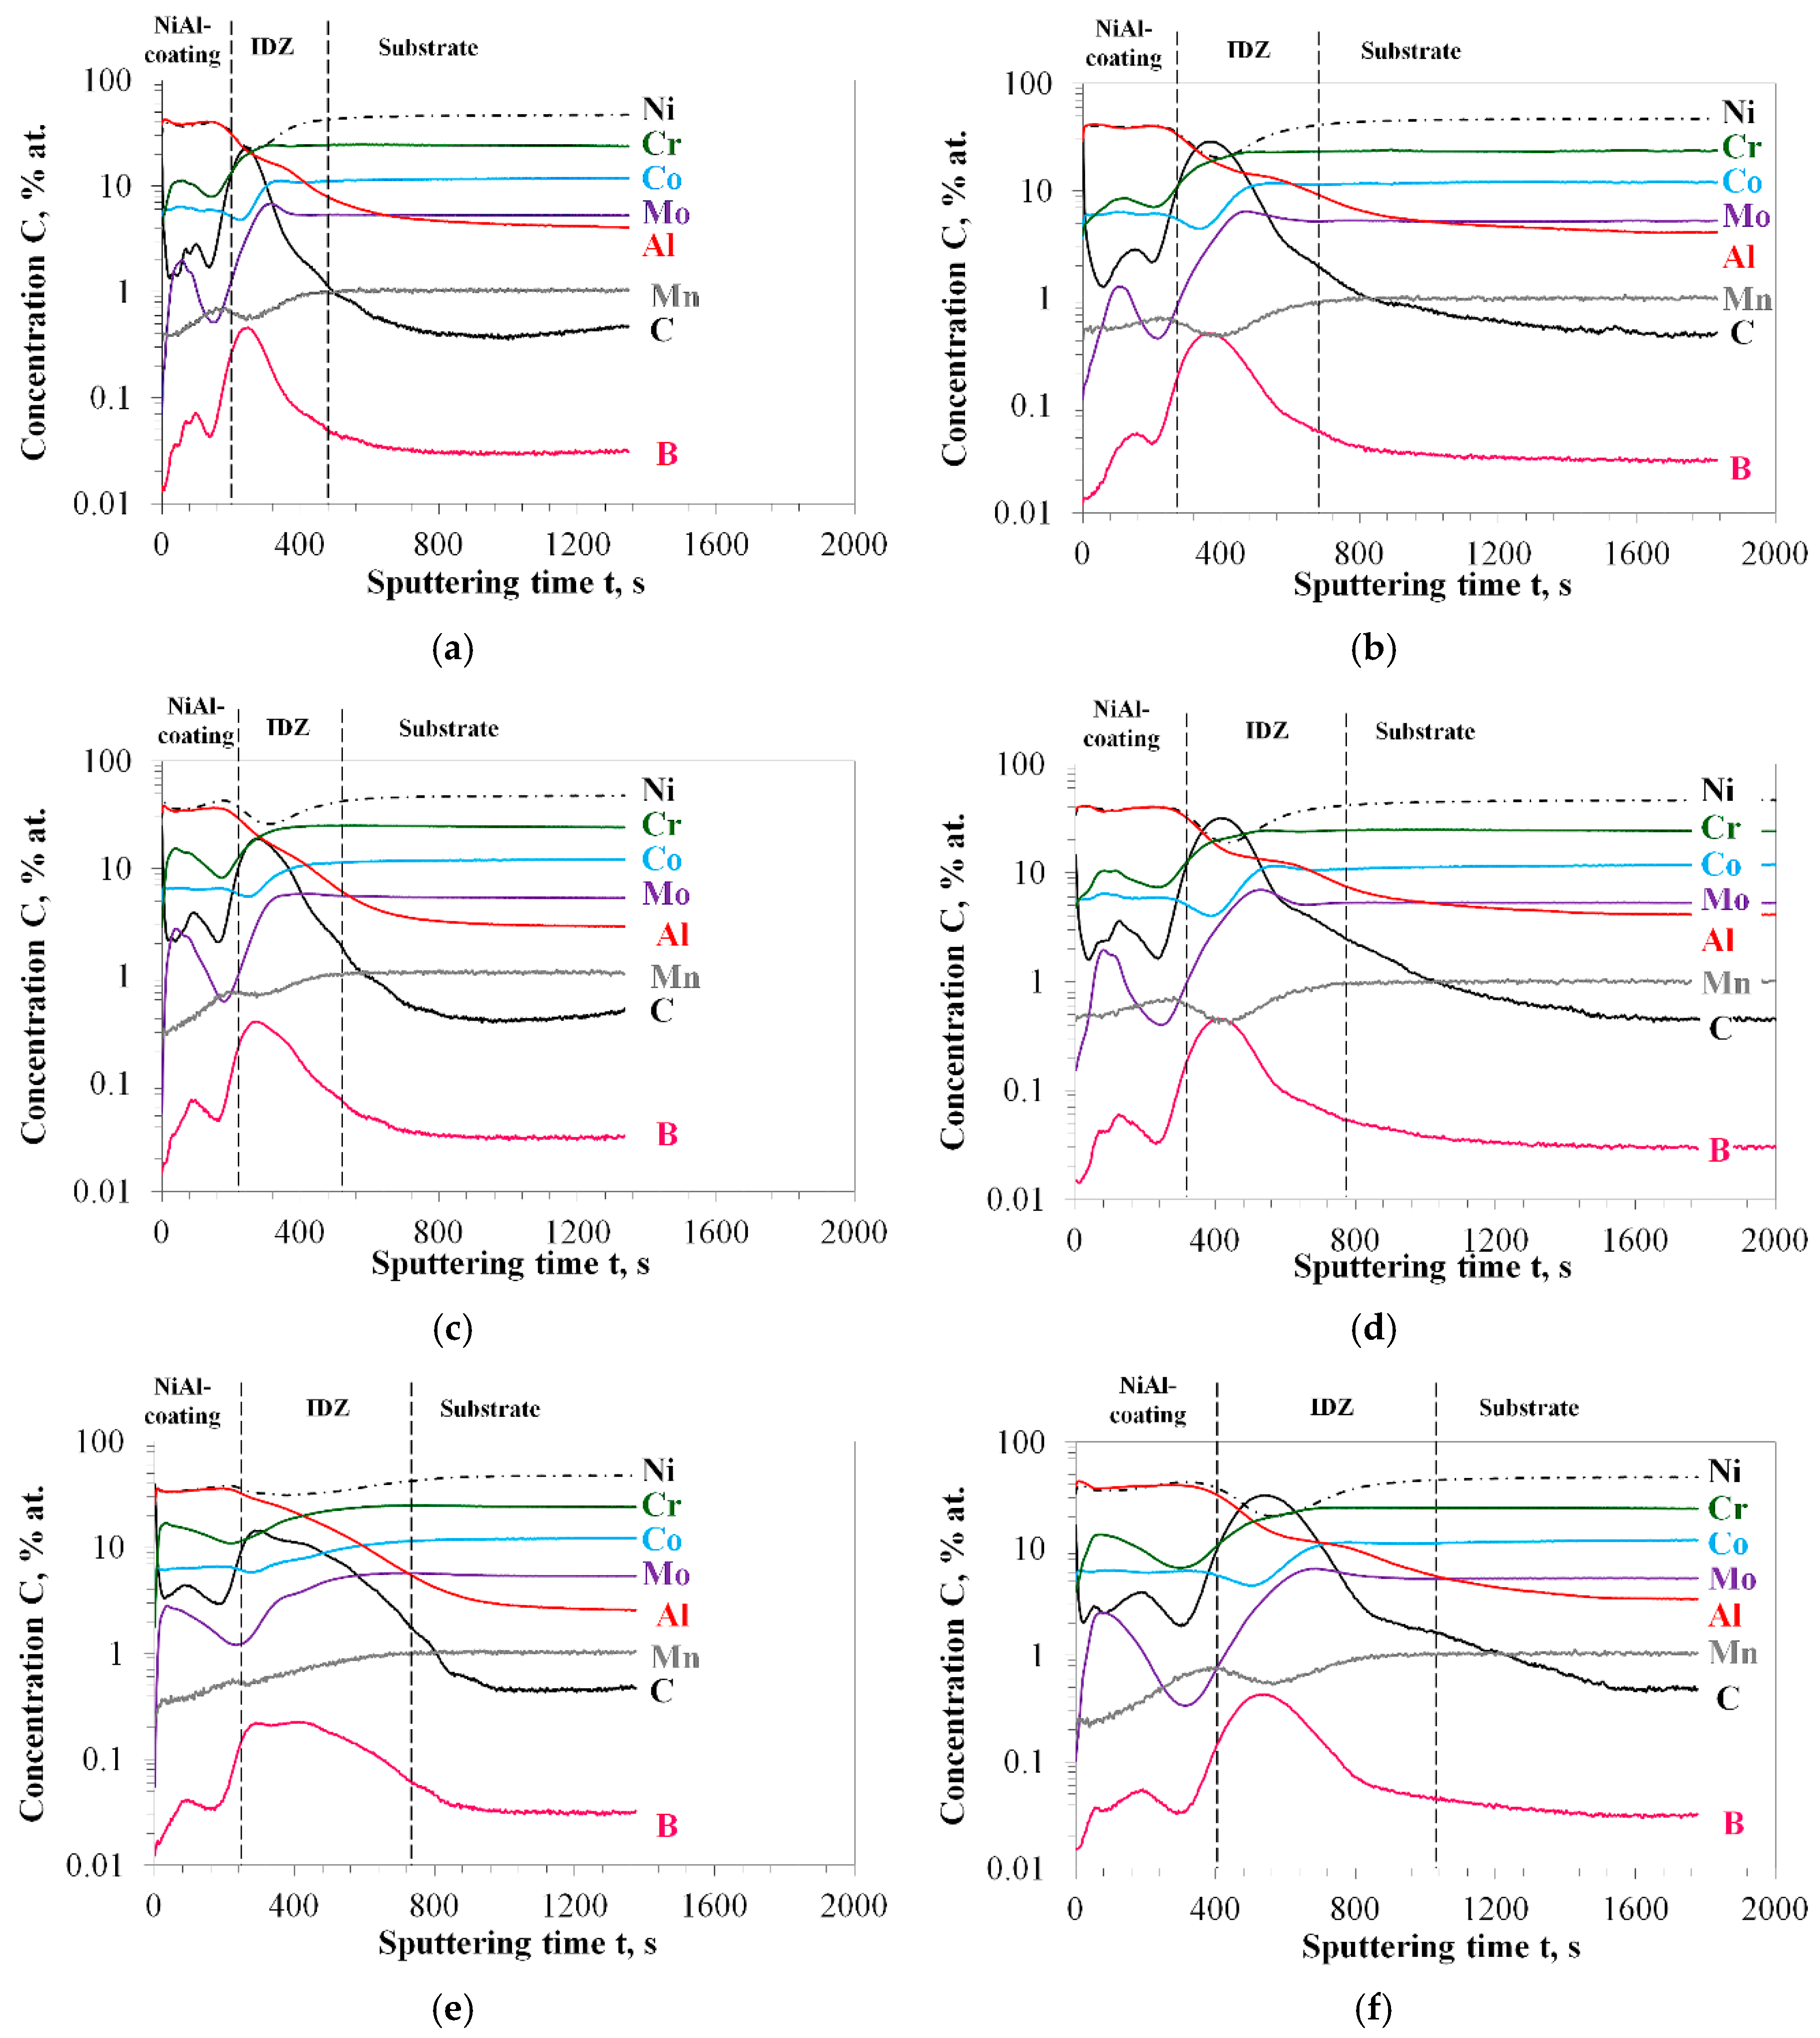
3.2. Characterization of Aluminized IN 617

A typical microstructure of IN 617 after in-pack aluminization consists of three layers: an outer NiAl-coating, an interdiffusion zone (IDZ), and substrate zone as depicted in Figure 1. The presence of NiAl-coating in the outer part of the sample is confirmed by SEM/EDS elemental maps shown in Figure 2. Elemental maps revealed that IDZ is also divided into two sub-zones. Both sub-zones are rich in Cr and Mo; however, the upper part of this zone is richer in Cr, whereas the bottom part in Mo. Bright precipitates are observed within an outer NiAl-coating in a dark grey matrix. The SEM/EDS point analysis revealed that the bright precipitates are enriched in Cr and Mo (point 1 in Figure 3 and the respective EDS spectrum) in comparison with a dark grey matrix, which is rich in Ni and Al (point 2 in Figure 3 and the respective EDS spectrum). The XRD analysis performed on the surface of an aluminized IN 617 shown in Figure 4 allowed an identification of the phases in the near-surface region as β-NiAl (dark grey phase) and carbides Cr3C2 and Cr7C3 as bright precipitates. Since the thickness of an outer NiAl-coating is higher than 20 µm, then measurement of the phases present in the IDZ is hardly possible for this type of analysis.

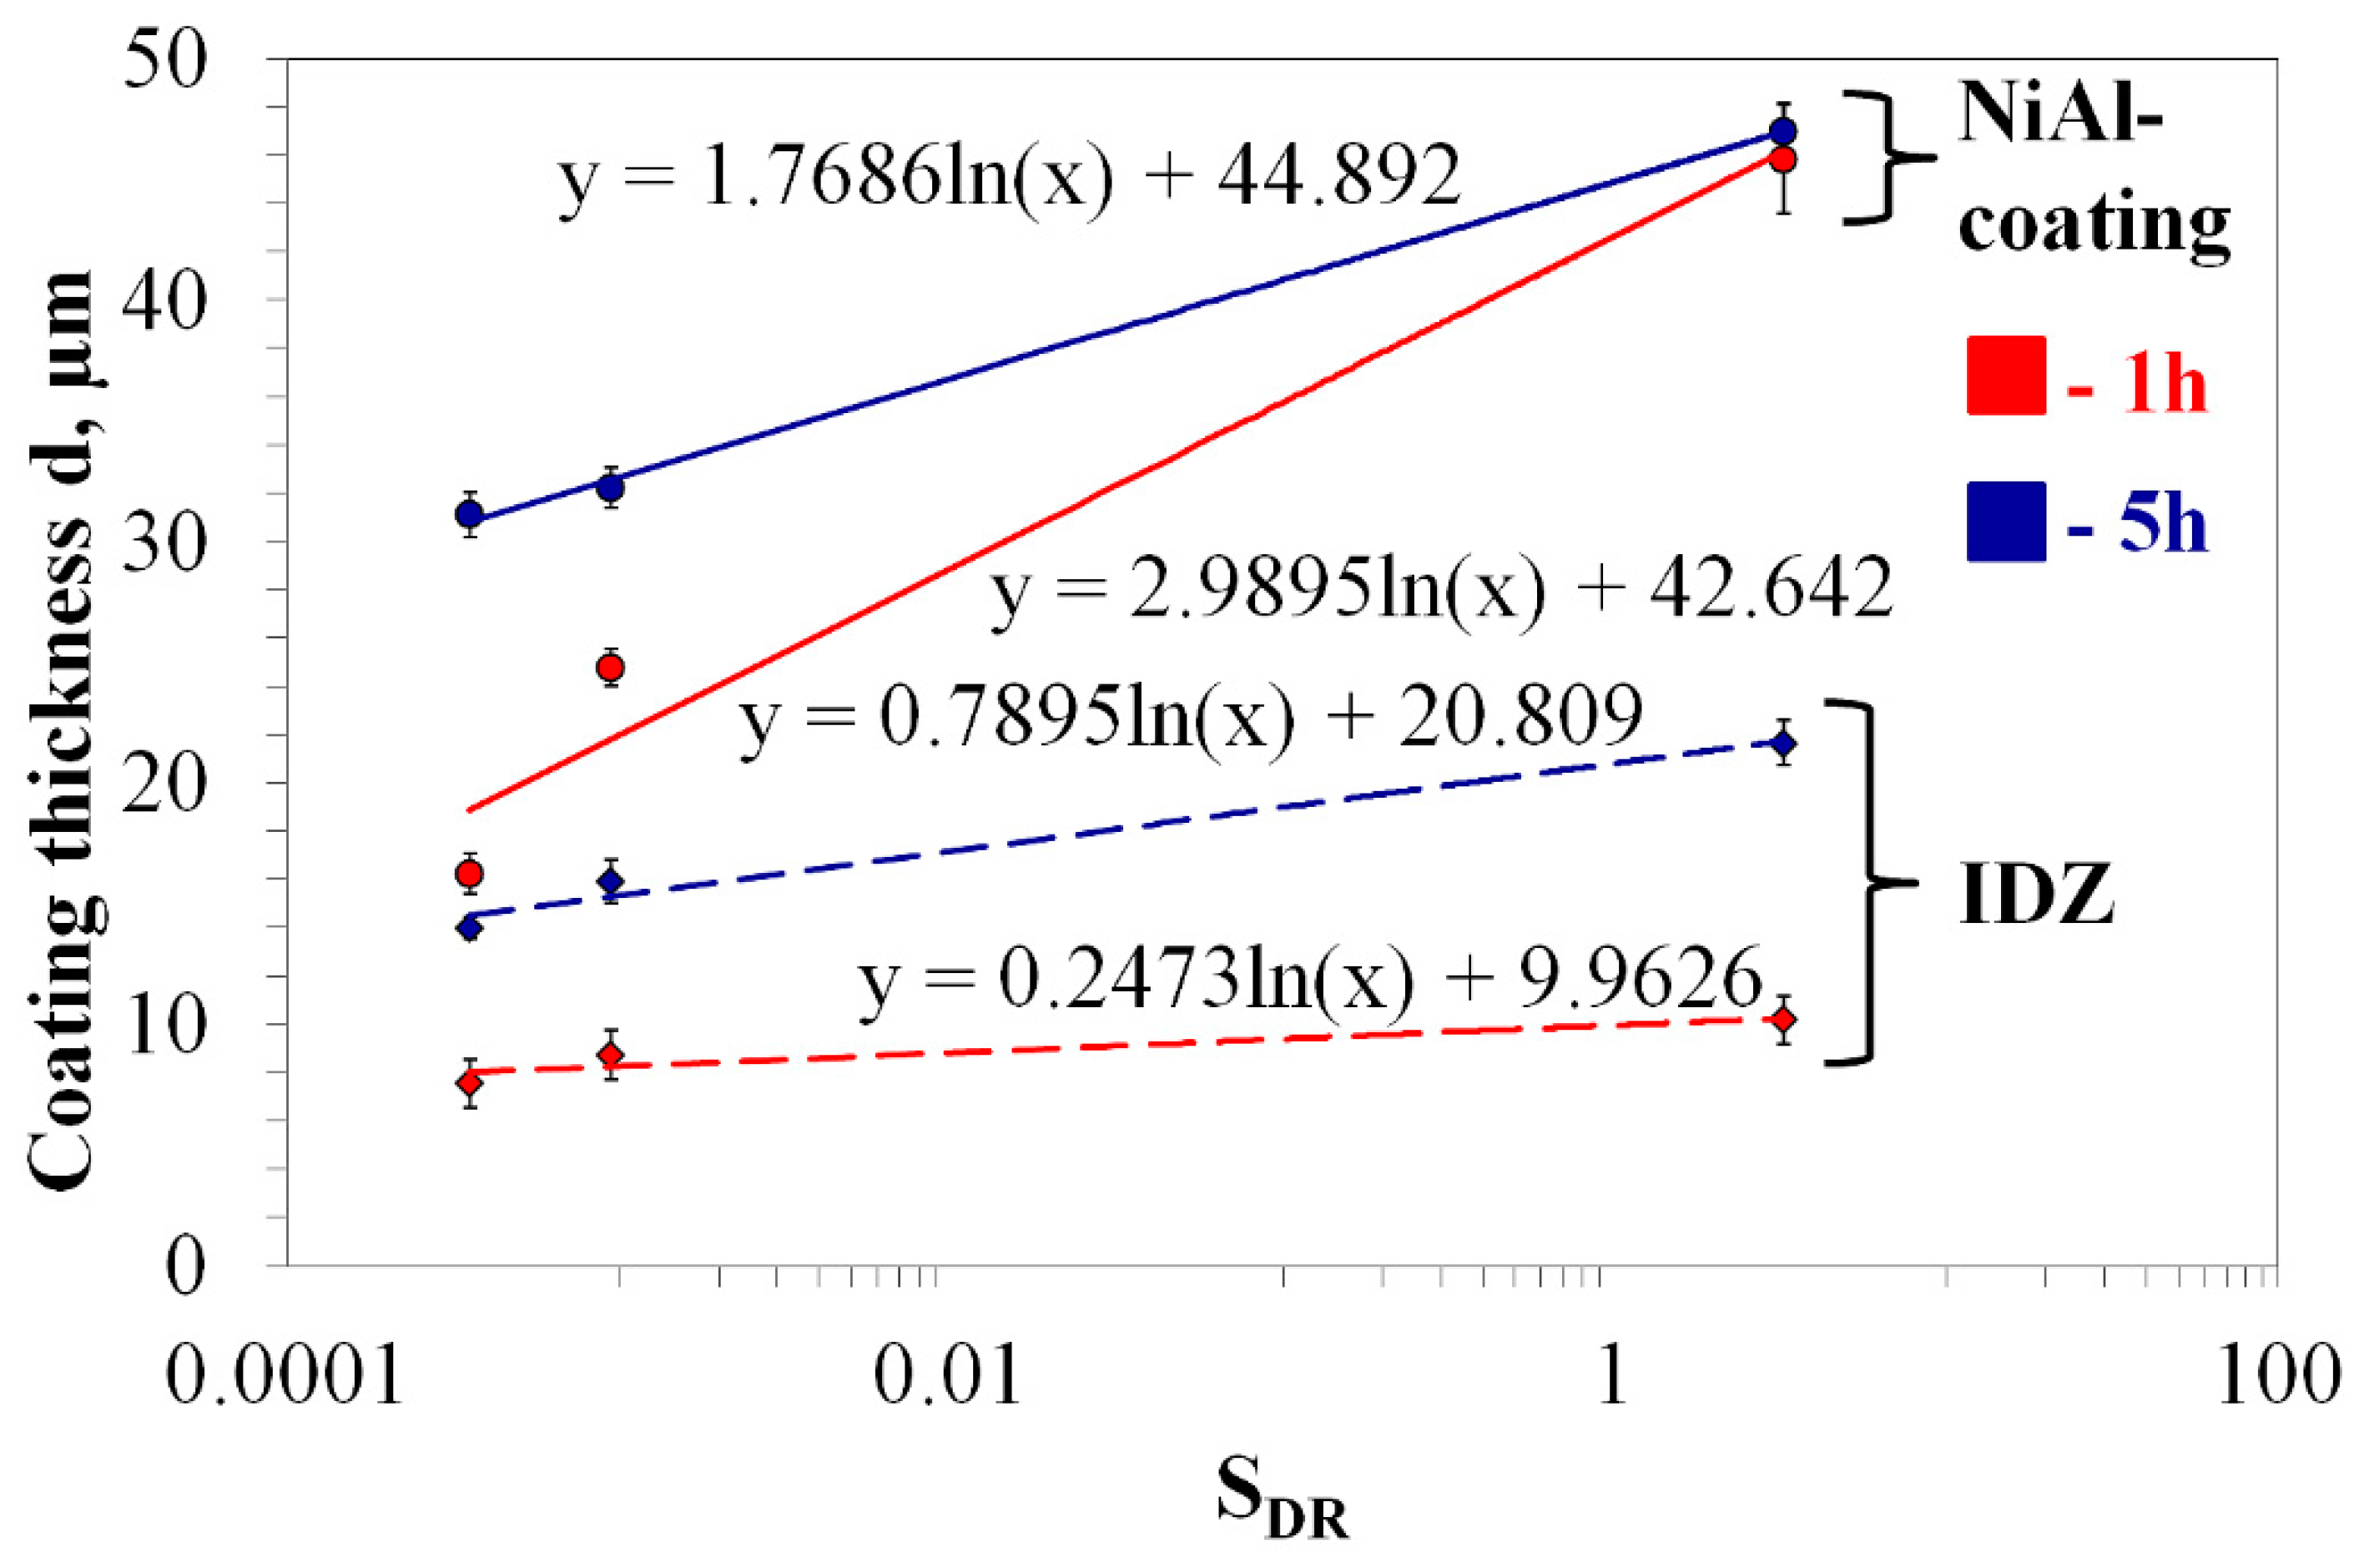
3.3. Effect of Surface Roughness on Aluminization Kinetics of IN 617

The microstructures of IN 617 after in-pack aluminizing are shown in Figure 5. As visible, an increase in time of aluminizing results in an increase in depth of NiAl-coating as well as IDZ for all of types of surface preparation methods (compare Figure 5a–f). However, after both aluminization times (1 h and 5 h), an effect of surface preparation methods on depth of aluminide layers and IDZ is also observed (compare Figure 5a,c,e—1 h, and Figure 5b,d,f—5 h). One can observe that a more rough surface preparation method results in the thickening of produced coatings and IDZ at both tested times. Since the coating quality is not affected by initial substrate roughness in their volume (all coatings are dense over their thicknesses), then their very outer surface seems to be affected by initial substrate roughness and time of aluminizing. Namely, the presence of loose particles and/or defragmented are observed on the surface of aluminized alloy with surface ground by 1000 grit sand-paper (Figure 5c,d), and partial defragmentation of outer part of the coating is observed for aluminized alloy with surface ground by 80 grit sand-paper (Figure 5e,f). Defragmentation of the outer part of aluminide layer most probably occurred during the cross-sections preparation.
The GD-OES depth profiles measured on all samples (depicted in Figure 5) are shown in Figure 6. Qualitatively, all measured GD-OES depth profiles are similar. In the NiAl-coating zone (see description in Figure 6), an enrichment of Ni and Al is obviously observed. In the outer part of the NiAl-coating, a co-enrichment of Cr and Mo is observed. In all measured GD-OES depth profiles, a small quantity of Co (up to 6 at.%) in the NiAl-coating is observed. Since the in-pack aluminizing process is a high activity process, then the coating grows inwardly. The alloy contains 12.5 wt.% Co (12.1 at.%); then, it is assumed that, during coating growth, not every atom of Co diffused back into the alloy, and it remains at the level of about 6 at.%. The backward diffusion of Co caused its depletion in the outer part of IDZ and slight enrichment in the bottom part of IDZ. In the IDZ, a strong enrichment in Cr, Mo, C, and B is observed accompanied with a drop in an Al concentration profile. It is worth mentioning that the max concentration of B is up to a few tenths of at.%. After longer sputtering time, a zone of a non-affected substrate is observed, where measured concentration for the elements is constant. As mentioned, the measured depth profiles are qualitatively similar. For major alloying elements, the differences are marginally in local elements’ concentrations and mainly in the sputtering times. However, it can be observed that, with an increase in initial surfaces roughness and longer growth times, C becomes the dominant element within the IDZ. This can be correlated with thickening of an outer NiAl-coating accompanied with the widening of IDZ in which carbides are formed.

4. Discussion

In the present work, the influence of surface preparation method on aluminizing kinetics was investigated. To evaluate this issue, surfaces of IN 617 were prepared by different methods, namely polishing and grinding using 220 grit and with 80 grit sand paper. Obviously, it was noticed that more rough surface preparation results in a higher Ra value. Apparently, increasing the Ra parameter is accompanied with increasing surface-to-volume ratio (represented by SDR parameter). However, it is noticeable that the differences between the aforementioned parameters calculated for polished and ground (1000 grit) surfaces are very small. Contrarily, values obtained for surfaces ground with 80 grit sand-paper are significantly higher in comparison with polished and ground with 1000 grit paper (Table 1). The obtained analytical results showed that the different substrate surface roughness did not alter the phase composition of the aluminizing products. In all aluminized IN 617 specimens, a presence of β-NiAl as well as two types of carbides, namely Cr3C2 and Cr7C3,, was observed. The findings by XRD analysis were confirmed by GD-OES depth profiles; namely, in the regions where carbides formation was expected—in the outer part of the NiAl-coating and in the IDZ—a co-enrichment of Cr, Mo and C was observed (see Figure 6a–f). There is a slight mismatch between the XRD and GD-OES results; namely, XRD results showed formation of Cr-carbides only, while, in GD-OES, co-enrichment of Cr and Mo is observed in the region of carbides’ presence; however, Mo is enriched maximum up to few at.%. Moreover, Mo can substitute Cr in carbides without changing the lattice parameters; then, XRD identifies the phases as Cr-carbides. No changes in chemical composition of aluminized IN 617 were observed for all investigated samples after aluminization. Then, one can conclude that the surface mechanical modification did not affect the phase composition.
On the contrary, a clear effect of surface roughness on aluminization kinetics is observed (see e.g., Figure 5). To evaluate the effect of surface preparation method on aluminization kinetics, depths of an outer NiAl-coatings and IDZ’s were measured on the cross-sections of each aluminized samples. The results are shown in Figure 7. To quantify the effect of surface preparation method on aluminization kinetics, a plot showing the dependence of measured coatings depths as a function of SDR parameter was produced. As visible in Figure 7, increasing SDR parameter resulted in an increase of coatings depths—both NiAl-coatings as well as IDZ’s. The direct dependence between SDR (parameter describing surface-to-volume ratio) and the thicknesses of the NiAl-coatings (marked with filled circles in Figure 7) and IDZ’s (shown by filled rectangles in Figure 7) was found to be logarithmic, except the curve obtained for NiAl-coatings after 1 h of aluminizing. It is clear from Figure 7 that the increase in SDR parameter is proportional to the increase of aluminization kinetics. However, one should mention that the slope of fitting curve differs, namely after a 5 h process, is higher in comparison with 1 h. Moreover, as observed for NiAl-coatings after 1 h of aluminization, logarithmic fitting failed; namely, a bigger increase in NiAl-coatings thickness is found. After the first hour of aluminizing, an increase from SDR = 0.000355% to SDR = 0.000943% resulted in a bigger change of NiAl-coating thickness. This finding is confirmed by an SEM investigation of the cross-sections (Figure 5), GD-OES depth profiles (Figure 6), and coating thickness measurement (Figure 7). This indicates that the kinetics of in-pack aluminization process is much more affected by surface roughness at the early stages of process than after a longer time.

5. Conclusions

The results obtained in the present work allowed for formulating the following conclusions:
  • Different surface roughness did not affect the phase composition of aluminide layers and IDZ produced on the alloys with differently prepared surfaces.
  • Strong influence of surface roughness on aluminization process kinetics was observed at both exposure times, namely an increase of surface-to-volume ratio (represented by SDR parameter) resulted in an increase of both: NiAl-coating and IDZ’s thicknesses.
  • The dependence between the SDR parameter and the measured thicknesses was found to be logarithmic. The slope of the fitting curves was different for different measured zones and exposure times.
  • Aluminization kinetics is much more influenced by a surface preparation method at early stages of the process rather than later.

Author Contributions

Conceptualization, W.J.N.; Data curation, W.J.N., P.W., K.G., M.T., and B.W.; Formal analysis, W.J.N. and B.W.; Funding acquisition, W.J.N. and B.W.; Investigation, W.J.N., M.T., P.W., and K.G.; Methodology, W.J.N.; Resources, W.J.N. and B.W.; Supervision: W.J.N.; Validation, W.J.N.; Writing—original draft, W.J.N.; Writing—review and editing, W.J.N. and M.T. All authors have read and agreed to the published version of the manuscript.

Funding

This research received no external funding.

Conflicts of Interest

The authors declare no conflict of interest.

References

  1. Giggins, C.S.; Pettit, F.S. Oxidation of Ni-Cr-Al Alloys Between 1100 °C and 1200 °C. Solid State Sci. 1971, 118, 1782–1790. [Google Scholar]
  2. Danielewski, M.; Grzesik, Z.; Mrowec, S. On the oxidation mechanism of Ni–Pt alloys at high temperatures. Corros. Sci. 2011, 53, 2785–2792. [Google Scholar]
  3. Holcomb, G.R. Calculation of Reactive-evaporation Rates of Chromia. Oxid. Met. 2008, 69, 163–180. [Google Scholar] [CrossRef] [Green Version]
  4. Birks, N.; Meier, G.H.; Petit, F.S. Introduction to the High- Temperature Oxidation of Metal; Cambridge University Press: Cambridge, UK, 2006. [Google Scholar]
  5. Nicholls, J.R.; Simms, N.J. Shreir’s Corrosion; Richardson, T., Ed.; Elsevier: Amsterdam, NL, USA, 2010; Volume 1, pp. 518–540. [Google Scholar]
  6. Darolia, R. Thermal barrier coatings technology: Critical review, progress update, remaining challenges and prospects. Int. Mater. Rev. 2013, 58, 315–348. [Google Scholar] [CrossRef]
  7. Nowak, W.; Naumenko, D.; Mor, G.; Mor, F.; Mack, D.E.; Vassen, R.; Singheiser, L.; Quadakkers, W.J. Effect of processing parameters on MCrAlY bondcoat roughness and lifetime of APS-TBC systems. Surf. Coat. Technol. 2014, 260, 82–89. [Google Scholar] [CrossRef]
  8. Hejrani, E.; Sebold, D.; Nowak, W.J.; Mauer, G.; Naumenko, D.; Vassen, R.; Quadakkers, W.J. Isothermal and cyclic oxidation behavior of free standing MCrAlY coatings manufactured by high-velocity atmospheric plasma spraying. Surf. Coat. Technol. 2017, 313, 191–201. [Google Scholar] [CrossRef]
  9. Nowak, W.J.; Kubaszek, T.; Góral, M.; Wierzba, B. Durability of underaluminized thermal barrier coatings during exposure at high temperature. Surf. Coat. Technol. 2020, 382, 125236. [Google Scholar] [CrossRef]
  10. Zielińska, M.; Zagula-Yaworska, M.; Sieniawski, J.; Filip, R. Microstructure and oxidation resistance of an aluminide coating on the nickel based superalloy MAR M247 deposited by the CVD aluminizing process. Arch. Metall. Mater. 2013, 58, 697–701. [Google Scholar] [CrossRef]
  11. Rannou, B.; Bouchaud, B.; Balmain, J.; Bonnet, G.; Pedraza, F. Comparative Isothermal Oxidation Behaviour of New Aluminide Coatings from Slurries Containing Al Particles and Conventional Out-of-Pack Aluminide Coatings. Oxid. Met. 2014, 81, 139–149. [Google Scholar] [CrossRef]
  12. Rannou, B.; Velasco, F.; Guzmán, C.; Kolarik, V.; Pedraza, F. Aging and thermal behavior of a PVA/Al microspheres slurry for aluminizing purposes. Mater. Chem. Phys. 2012, 134, 360–365. [Google Scholar] [CrossRef]
  13. Romanowska, J.; Zagula-Yavorska, M.; Sieniawski, J.; Markowski, J. Zirconium Modified Aluminide Coatings Obtained by the CVD and PVD Methods. Open J. Met. 2013, 3, 92–99. [Google Scholar] [CrossRef] [Green Version]
  14. Dehghanghadikolaei, A.; Ibrahim, H.; Amerinatanzi, A.; Hashemi, M.; Moghaddam, N.S.; Elahinia, M. Improving corrosion resistance of additively manufactured nickel–titanium biomedical devices by micro-arc oxidation process. J. Mater. Sci. 2019, 54, 7333–7355. [Google Scholar] [CrossRef]
  15. Dehghanghadikolaei, A.; Fotovvati, B. Coating Techniques for Functional Enhancement of Metal Implants for Bone Replacement: A Review. Materials 2019, 12, 1795. [Google Scholar] [CrossRef] [PubMed] [Green Version]
  16. Gao, F.; Huang, X.; Liu, R.; Yang, Q. A Study of Pack Aluminizing Process for NiCrAlY Coatings Using Response Surface Methodology. J. Mater. Eng. Perform. 2014, 23, 83–91. [Google Scholar] [CrossRef]
  17. Bozza, F.; Bolelli, G.; Giolli, C.; Giorgetti, A.; Lusvarghi, L.; Sassatelli, P.; Scrivani, A.; Candeli, A.; Thoma, M. Diffusion mechanisms and microstructure development in pack aluminizing of Ni-based alloys. Surf. Coat. Technol. 2014, 239, 147–159. [Google Scholar] [CrossRef]
  18. Nowotnik, A.; Sieniawski, J.; Góral, M.; Pytel, M.; Dychtoń, K. Microstructure and kinetic growth of aluminide coatings deposited by the CVD method on Re 80 superalloy. Arch. Mater. Sci. Eng. 2012, 55, 22–28. [Google Scholar]
  19. Nowotnik, A.; Góral, M.; Pytel, M.; Dychtoń, K. Influence of coatings deposition parameters on microstructure of aluminide coatings deposited by CVD method on Ni-superalloys. Sol. St. Phen. 2013, 197, 95–100. [Google Scholar] [CrossRef]
  20. Kochmańska, A.; Kochmański, P.; Kawiak, M. The structure of aluminide coatings on alloy steels in the area of the welded joints. Inż. Mater. 2017, 3, 131–135. [Google Scholar]
  21. Kochmańska, A.E. Aluminide coatings on Inconel 617 obtained by slurry method with inorganic binder. J. Achiev. Mater. Manuf. Eng. 2017, 85, 49–55. [Google Scholar] [CrossRef]
  22. Nowak, W.J.; Ochał, K.; Wierzba, P.; Gancarczyk, K.; Wierzba, B. Effect of Substrate Roughness on Oxidation Resistance of an Aluminized Ni-Base Superalloy. Metals 2019, 9, 782–795. [Google Scholar] [CrossRef] [Green Version]
  23. Serafin, D.; Nowak, W.J.; Wierzba, B. The effect of surface preparation on high temperature oxidation of Ni, Cu and Ni-Cu alloy. Appl. Surf. Sci. 2019, 476, 442–451. [Google Scholar] [CrossRef] [Green Version]
  24. Sreenath, S.; Shivakumar, M.R. Evaluation of Surface Finish and its Effect on Packed Diffusion Aluminisation of Low Alloy Steel Component. Int. J. Appl. Innov. Eng. Man. 2018, 7, 77–83. [Google Scholar]
  25. Dong, J.; Sun, Y.; He, F.; Huang, H.; Zhen, J. Effects of substrate surface roughness and a luminizing agent composition on the aluminide coating coatings by low-temperature pack cementation. Mater. Res. Express 2018, 6, 036409. [Google Scholar] [CrossRef]
  26. Pfeifer, J.P.; Holzbrecher, H.; Quadakkers, W.J.; Speier, J. Quantitative analysis of oxide films on ODS-alloys using MCs+-SIMS and e-beam SNMS. J. Anal. Chem. 1993, 346, 186–191. [Google Scholar] [CrossRef]
  27. Quadakkers, W.J.; Elschner, A.; Speier, W.; Nickel, H. Composition and growth mechanisms of alumina scales on FeCrAl-based alloys determined by SNMS. Appl. Surf. Sci. 1991, 52, 271–287. [Google Scholar] [CrossRef]
  28. Nowak, W.J. Characterization of oxidized Ni-based superalloys by GD-OES. J. Anal. At. Spectrom. 2017, 32, 1730–1738. [Google Scholar] [CrossRef]
  29. Nowak, W.J.; Serafin, D.; Wierzba, B. Effect of surface mechanical treatment on the oxidation behavior of FeAl-model alloy. J. Mater. Sci. 2019, 54, 9185–9196. [Google Scholar] [CrossRef] [Green Version]
Figure 1. Representative image showing typical microstructure of the aluminide layer obtained on IN 617 during pack thermochemical treatment. The typical zones are marked in the figure as follows: NiAl-coating describes the aluminide layer, IDZ shows the interdiffusion zone, and the substrate shows the zone of unaffected IN 617.
Jmmp 04 00015 g001
Figure 2. SEM/EDS elemental concentration maps performed on the representative cross section of aluminized IN617 in the as-prepared condition. More intensive color indicates higher concentrations of a given element.
Jmmp 04 00015 g002
Figure 3. SEM/EDS image showing the microstructure of the aluminide layer on IN 617 with the marked points of EDS point analysis and the EDS spectra obtained for marked points 1 and 2, respectively. The arrows show the peaks’ intensities obtained for Cr and Mo.
Jmmp 04 00015 g003
Figure 4. X-ray diffraction (XRD) patterns obtained from aluminized IN 617 after: (a) 1 h and (b) 5 h of the in-pack aluminization process.
Jmmp 04 00015 g004
Figure 5. Scanning electron microscopy in backscattered electron mode SEM/BSE images of the aluminized IN 617 after: (a,c,e) 1 h and (b,d,f) 5 h of in-pack aluminization of IN 617 with: (a,b) 1 µm polished, (c,d) 1000 grit and (e,f) 80 grit ground surfaces.
Jmmp 04 00015 g005
Figure 6. GD-OES depth profiles obtained on aluminized IN 617 after: (a,c,e) 1 h and (b,d,f) 5 h of in-pack aluminization of IN 617 with: (a,b) 1 µm polished, (c,d) 1000 grit and (e,f) 80 grit ground surfaces.
Jmmp 04 00015 g006
Figure 7. Plot showing dependence of measured coating thickness as a function of SDR parameter describing a surface-to-volume ratio.
Jmmp 04 00015 g007
Table 1. Roughness parameters describing samples surface calculated based on laser profilometry.
ParameterSurface Preparation Method
Polishing (1 µm)Grinding (1000 Grit)Grinding (80 Grit)
Ra (µm)0.009490.01130.473
SDR (%)0.0003550.0009433.23

