Article

A Finite Element Study of Thermo-Mechanical Fields and Their Relation to Friction Conditions in Al1050 Ring Compression Tests

1
Department of Materials Engineering, Nuclear Research Center—Negev (NRCN), Beer-Sheva 84190, Israel
2
Department of Mechanical Engineering—Center for thermo-mechanics and failure of materials (CTMFM), Shamoon College of Engineering, Beer-Sheva 84100, Israel
3
Rotem Industries—Ltd, Rotem Industrial park, Mishor Yemin 86800, Israel
*
Author to whom correspondence should be addressed.
J. Manuf. Mater. Process. 2018, 2(4), 83; https://doi.org/10.3390/jmmp2040083
Submission received: 22 November 2018 / Revised: 13 December 2018 / Accepted: 14 December 2018 / Published: 17 December 2018

Abstract

:
The most accepted method for determining friction conditions in metal forming is the ring compression test (RCT). At high temperatures, extraction of the friction coefficient, μ, commonly requires numerical analysis due to the coupling between the mechanical and thermal fields. In the current study, compression tests of cylindrical specimens and RCT experiments were conducted on commercially pure aluminium (Al1050) at several temperatures, loading rates, and lubrication conditions. The experiments were used in conjunction with a coupled thermo-mechanical finite element analysis to study the dependence of the friction coefficient on those parameters. It is demonstrated that due to the coupling between friction conditions and material flow stress, both μ and flow stress data should be determined from the cylinder and ring specimens simultaneously and not subsequently. The computed friction conditions are validated using a novel method based on identification of the plastic flow neutral radius. It is shown that, due to heat loss mechanisms, the experimental system preparation stage must be incorporated in the computational analysis. The study also addresses the limitation of the RCT in the presence of high friction conditions. The computational models are finally used to examine the thermo-mechanical fields, which develop during the different processes, with an emphasis on the effect of friction conditions, which were then correlated to the resulting microstructure in the RCTs.

Graphical Abstract

1. Introduction

Friction is an important parameter in any plastic forming process. The friction between the specimen and the tools has a significant influence on the final shape of the product, its microstructure, residual stress distribution, defects that are created during the forming process, and the lifespan of the tools. Therefore, it is important to characterize the parameters that govern friction (such as lubrication, temperature, strain rate, etc.) to optimize the forming process and control the quality and characteristics of the product. Numerical methods are commonly used today to investigate and optimize metal forming processes.
In the numerical modelling of metal forming, it is imperative to apply representative friction conditions in order to obtain reliable results from the simulation. Various experimental methods were developed for characterizing friction conditions. The most commonly used is the ring compression test (RCT), which provides a connection between the friction conditions and geometrical changes of the ring, which is axially compressed between two flat and parallel plates (as the inner diameter may increase, decrease, or remain constant depending on the friction conditions in the interface between the ring and the plates). One of the most advantageous characteristics of the RCT over other available methods for extracting the friction coefficient/factor is that it requires only dimensional measurements, which makes it simple and easy to implement even under conditions of high temperatures and strain rates. The RCT method was used for the first time in [1] for qualitative comparison between different lubricants for cold extrusion. A method for quantitative evaluation of friction coefficients was developed by Male and Cockroft in [2], introducing calibration curves. These curves were obtained experimentally, and correlate between the (percent of) change in the inner diameter and the (percent of) reduction in height during the ring deformation for each value of the friction coefficient/parameter. An analytical method for derivation of the calibration curves was formulated in [3]; however, the theory necessitates simplifying assumptions of: No barreling, no strain hardening, and a constant coefficient of friction, which may cause significant deviations from the actual experimental conditions. Therefore, later studies derived the curves numerically. One recent example is the work in [4], which used finite element analysis to construct calibration curves for a modified geometry of an RCT specimen. It was demonstrated that using the finite element (FE) method calibration curves, the experimental results could be obtained. Nevertheless, the work reported in [4] only considered friction under room temperature conditions. Another study reported in [5] investigated the RCT of Ti-6Al-4V at a single high temperature value and under different lubrication conditions. A thermo-mechanical FE model was used to generate calibration curves for the different friction conditions. Using these curves, the friction coefficient or friction factor, was identified. The friction factor, m, is defined so that 0 ≤ m ≤ 1. When m = 0 there is no friction and m = 1 indicates the limit of sticking friction conditions, so that μ = m / 3 [6]. The FE model was also used to study the influence of thermal conduction between the tools and specimen during the RCT on the derived calibration curves.
It should be noted that, regardless of the mode of derivation, any set of calibration curves matches a specific set of materials and experimental conditions, including the temperature, strain rate, choice of lubricant, and the specimen and tool materials.
RCTs have been widely used to investigate the influence of experimental parameters on the friction conditions. Those include primarily the effects of temperature [7,8], strain rate [9,10], lubricants, surface quality, material properties, and composition on the friction factor. These studies demonstrate the existence of a complex relation between all the parameters in the ring compression tests due to the coupling between the thermal and mechanical fields. Nevertheless, the sensitivity of μ (or m) to the strain rate seems to be significantly smaller than its sensitivity to temperature.
In the current study, upsetting experiments on cylindrical Al1050 specimens and RCTs were conducted at a wide range of temperatures under different strain rates in conjunction with coupled thermo-mechanical FE modelling. In addition to characterizing the Al1050 flow stress curves and friction coefficients under different experimental conditions, the computational models were used in conjunction with metallographic specimens to correlate between the thermo-mechanical fields and changes in material grain texture. A novel validation method of the computed friction values is also presented, based on the location of the neutral radius.
The highlights of this study are:
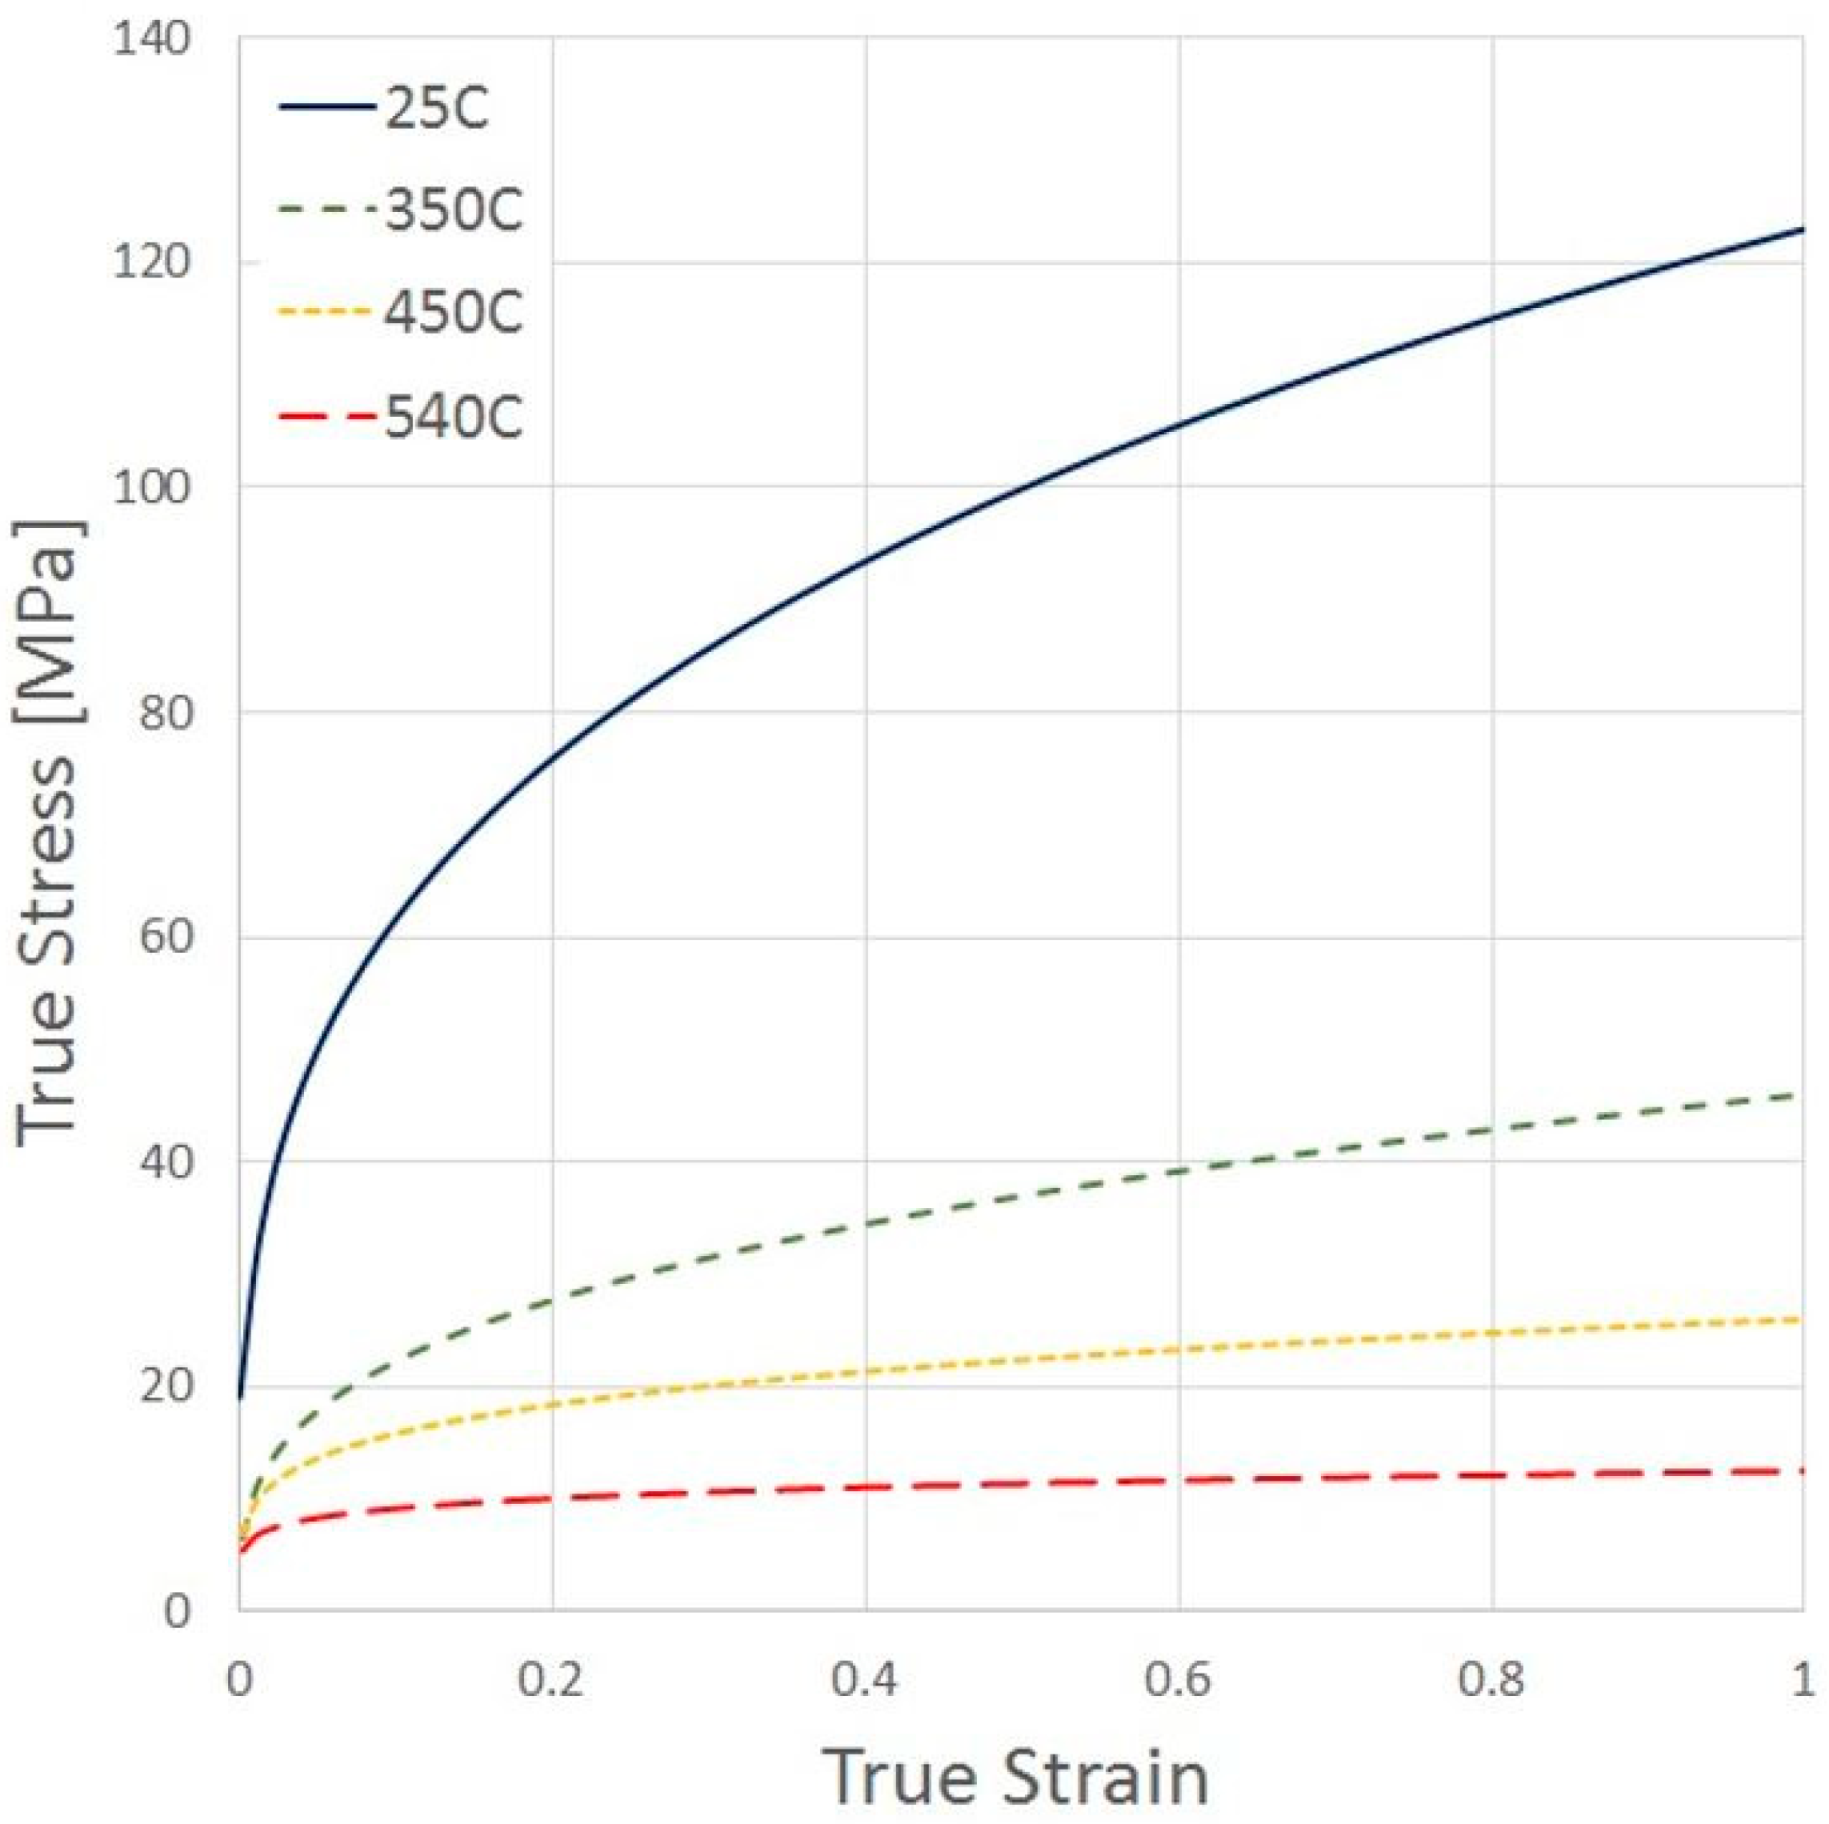
  • Flow stress curves for Al1050 at different temperatures and strain rates are reported.
  • Friction coefficients for lubricated and unlubricated contact between the specimen and tools at different temperatures and strain rates are determined.
  • The heat loss during system RCT preparation is modeled and quantified demonstrating a non-negligible effect on friction and flow stress determination.
  • A novel method for validating computed friction values by comparing the neutral radius from the FE model to metallurgical characterization is presented.
Following this introduction, the manuscript contains five additional sections. Section 2 presents the upsetting experiments of both cylinders and rings. Their FE representation, including verification, is discussed in Section 3. Section 4 is devoted to model validation and the characterization of friction conditions and flow stress associated with different combinations of process parameters. The thermo-mechanical fields, which develop under different conditions, are investigated in Section 5 using both the FE models and metallography. The summary and conclusions are provided in Section 6.

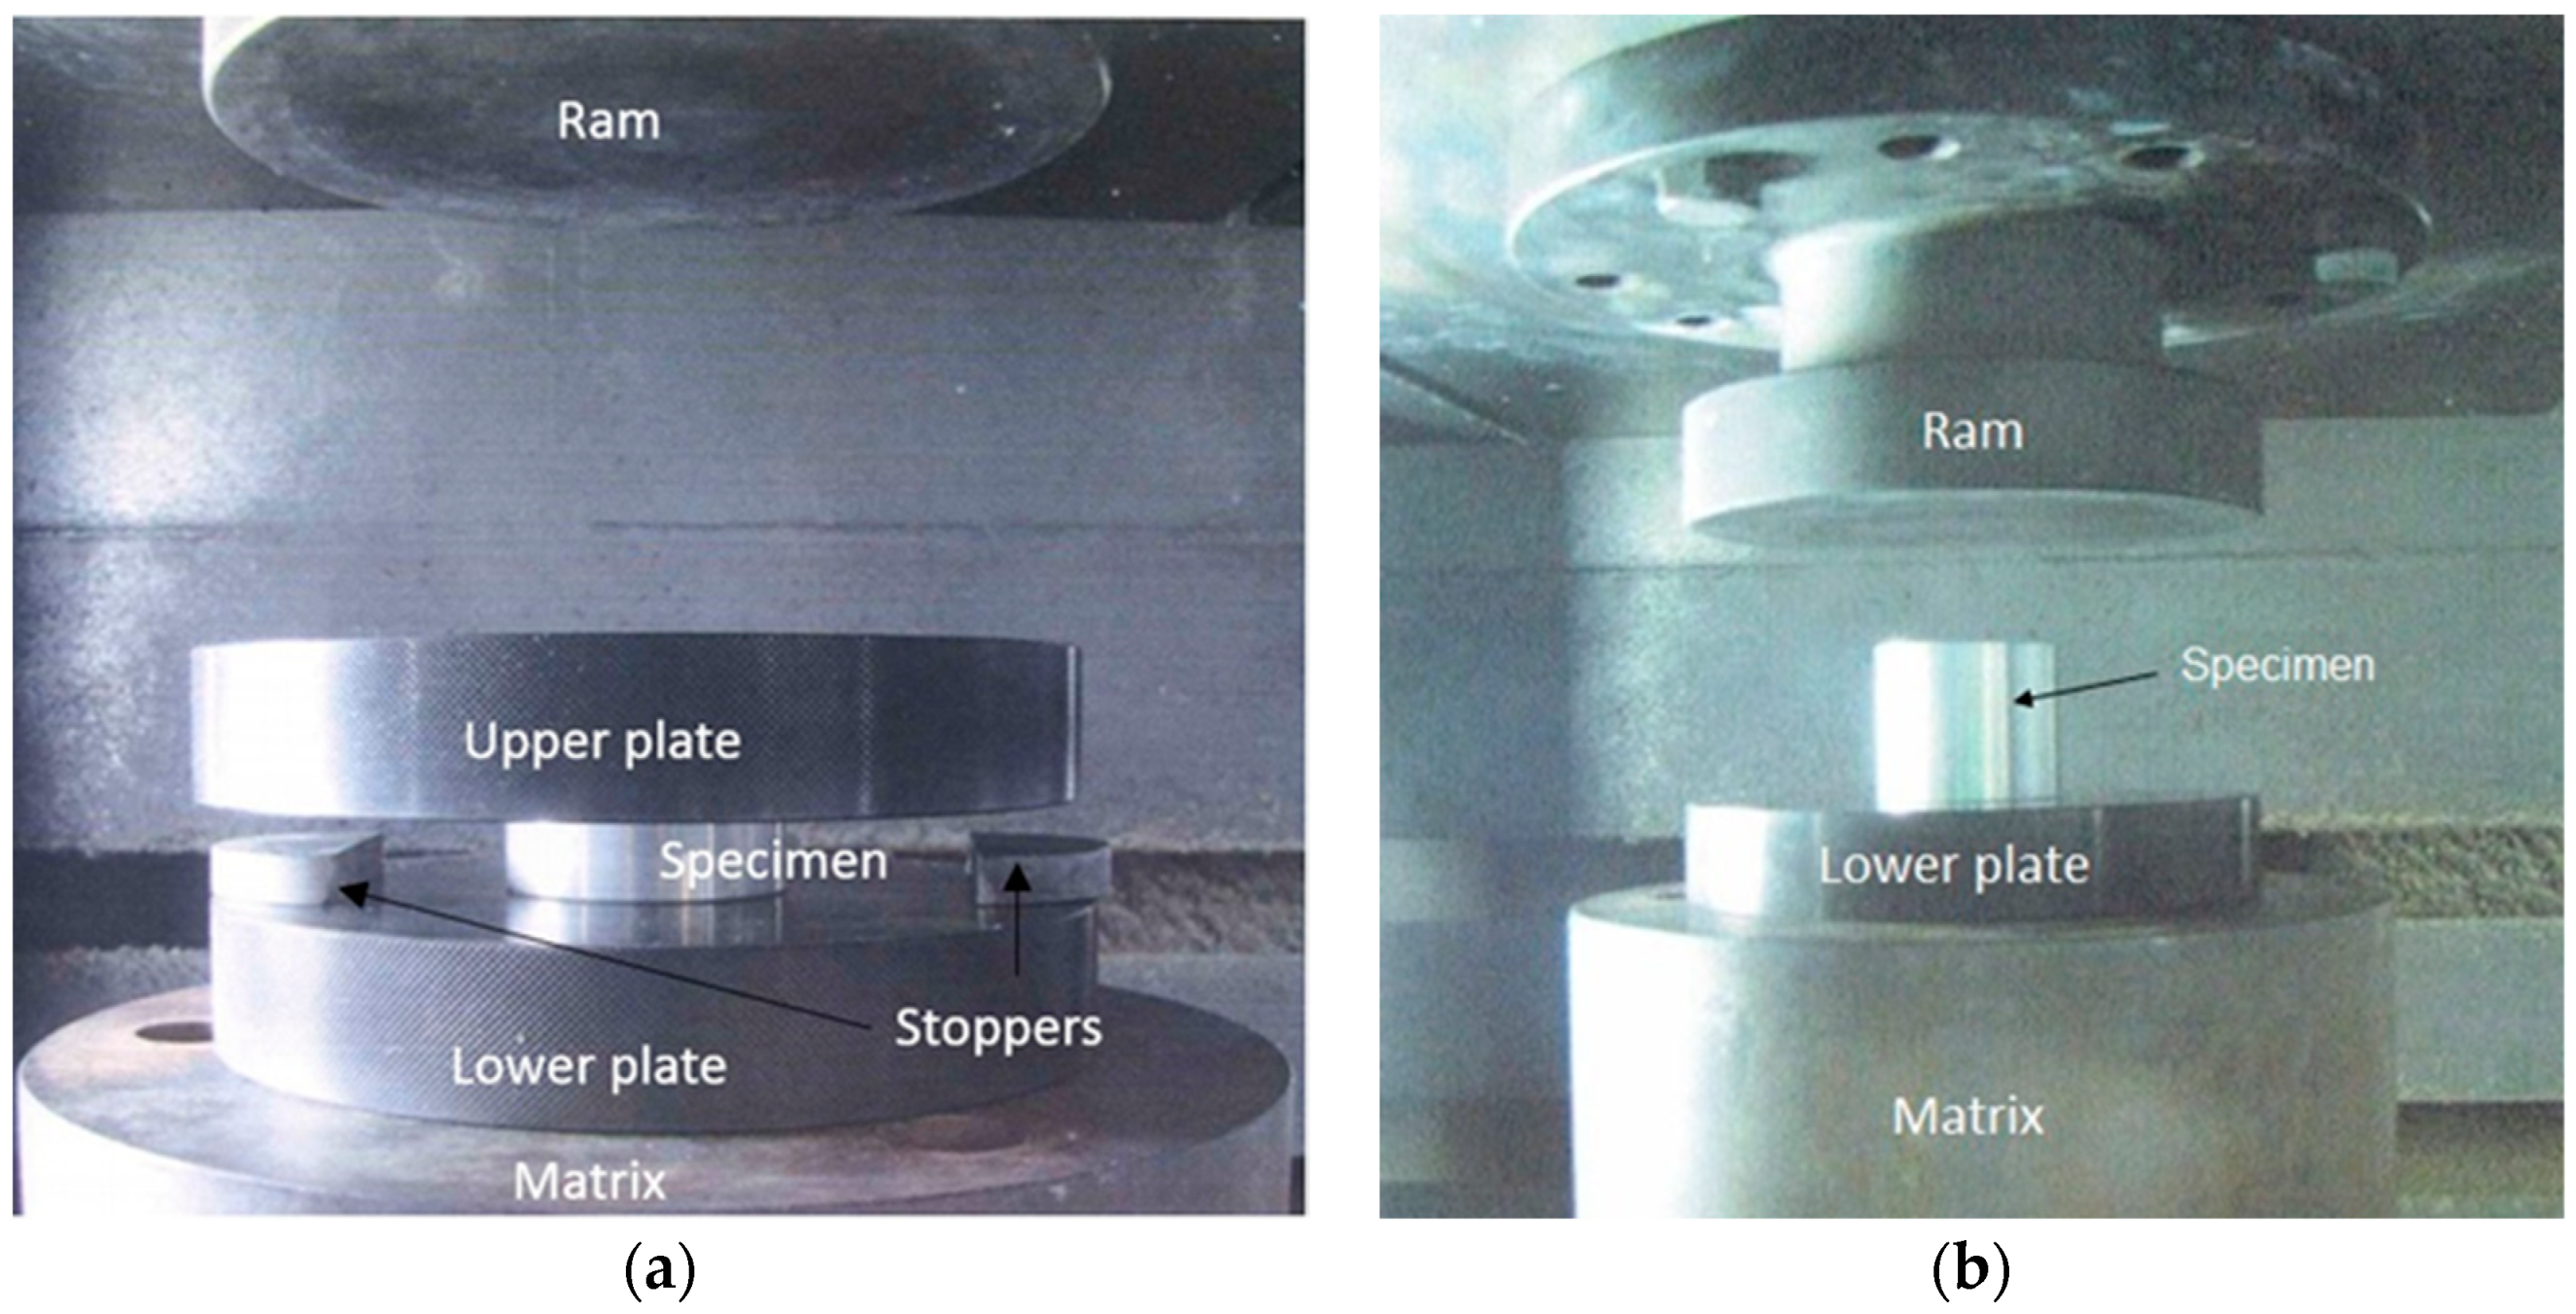
2. Experimental Setup for Al1050 Upsetting Tests

In this study, upsetting experiments were conducted on Al1050 cylindrical and ring specimens. The experimental setup is illustrated in Figure 1. The experimental system included a stationary base and a ram, which was given a constant velocity. In addition, upper and lower H13 steel plates were placed above and below the specimen. Those plates were heated (using a Laboratory Chamber Furnace, Carbolite-Gero, Hope, UK) to the same initial temperature as the specimen, in order to reduce its heat loss as a result of its contact with the tools during the upsetting test. The temperature of the tools and specimen was monitored during the heating process to ensure that the temperature was stabilized at the chosen value. The tools and specimen were kept at the chosen temperature for about 15 min after stabilization in order to obtain a homogenous temperature state. Temperature was measured during the system preparation and upsetting experiment by a thermo-couple, which was inserted into a designated bore within the pressing plates. The temperature measurements of the specimens were taken during heating using thermo-couples, which were placed in contact with their surface. The temperature measurements, for all parts of the experiments, were recorded using a 12-channel Chino graphic recorder of the KR2S series. The upsetting experiments were performed on a 100 Ton capacity hydraulic press. The chosen total reduction in height was 60% for the cylinders and 50% for the ring experiments. The fixed amount of deformation was ensured by using a set of metal stoppers (also made of H13 steel) of the final deformation height, which were positioned on the lower pressing plate near the specimen. The displacement was measured using a Linear Variable Differential Transformer (LVDT) positioned parallel to the pressing plates so as to compensate for machine stiffness.
Experimental parameters of the upsetting tests were chosen so that the flow stress could be obtained for several values of temperatures (25, 350, 450, 540 (°C)) and strain rates (350, 1200 [mm/min]), as can be seen in Table 1 for the cylindrical specimens. The cylindrical specimen diameter was D0 = 30 mm and its height was h0 = 40 mm for all experiments. Since the FEM was later applied in order to characterize the materials mechanical behavior (see Section 3), two different test velocities were sufficient for identifying the strain rate sensitivity of the material as described in [11].
The ring compression tests were conducted on the same material, Al1050. The rings’ outer and inner diameters were D0 = 48 mm and Di = 24 mm, and their height was h0 = 16 mm, so the relation between D0:Di:h0 matches the 6:3:2 relation accepted as a standard for RCTs (see [7]). The experimental parameters for the RCTs included two different lubrication conditions (a liquid graphite-based lubricant, T-50, and no lubrication) in addition to different temperatures and ram velocities. Lubrication was applied to both the top and bottom faces of the pressing plates and the specimen. For the cylinders, all upsetting experiments were performed without application of a lubricant. The RCT experiment parameters are detailed in Table 2.
It should be noted that all specimens (both cylinders and rings) were fully annealed at T = 540 °C prior to experiments.

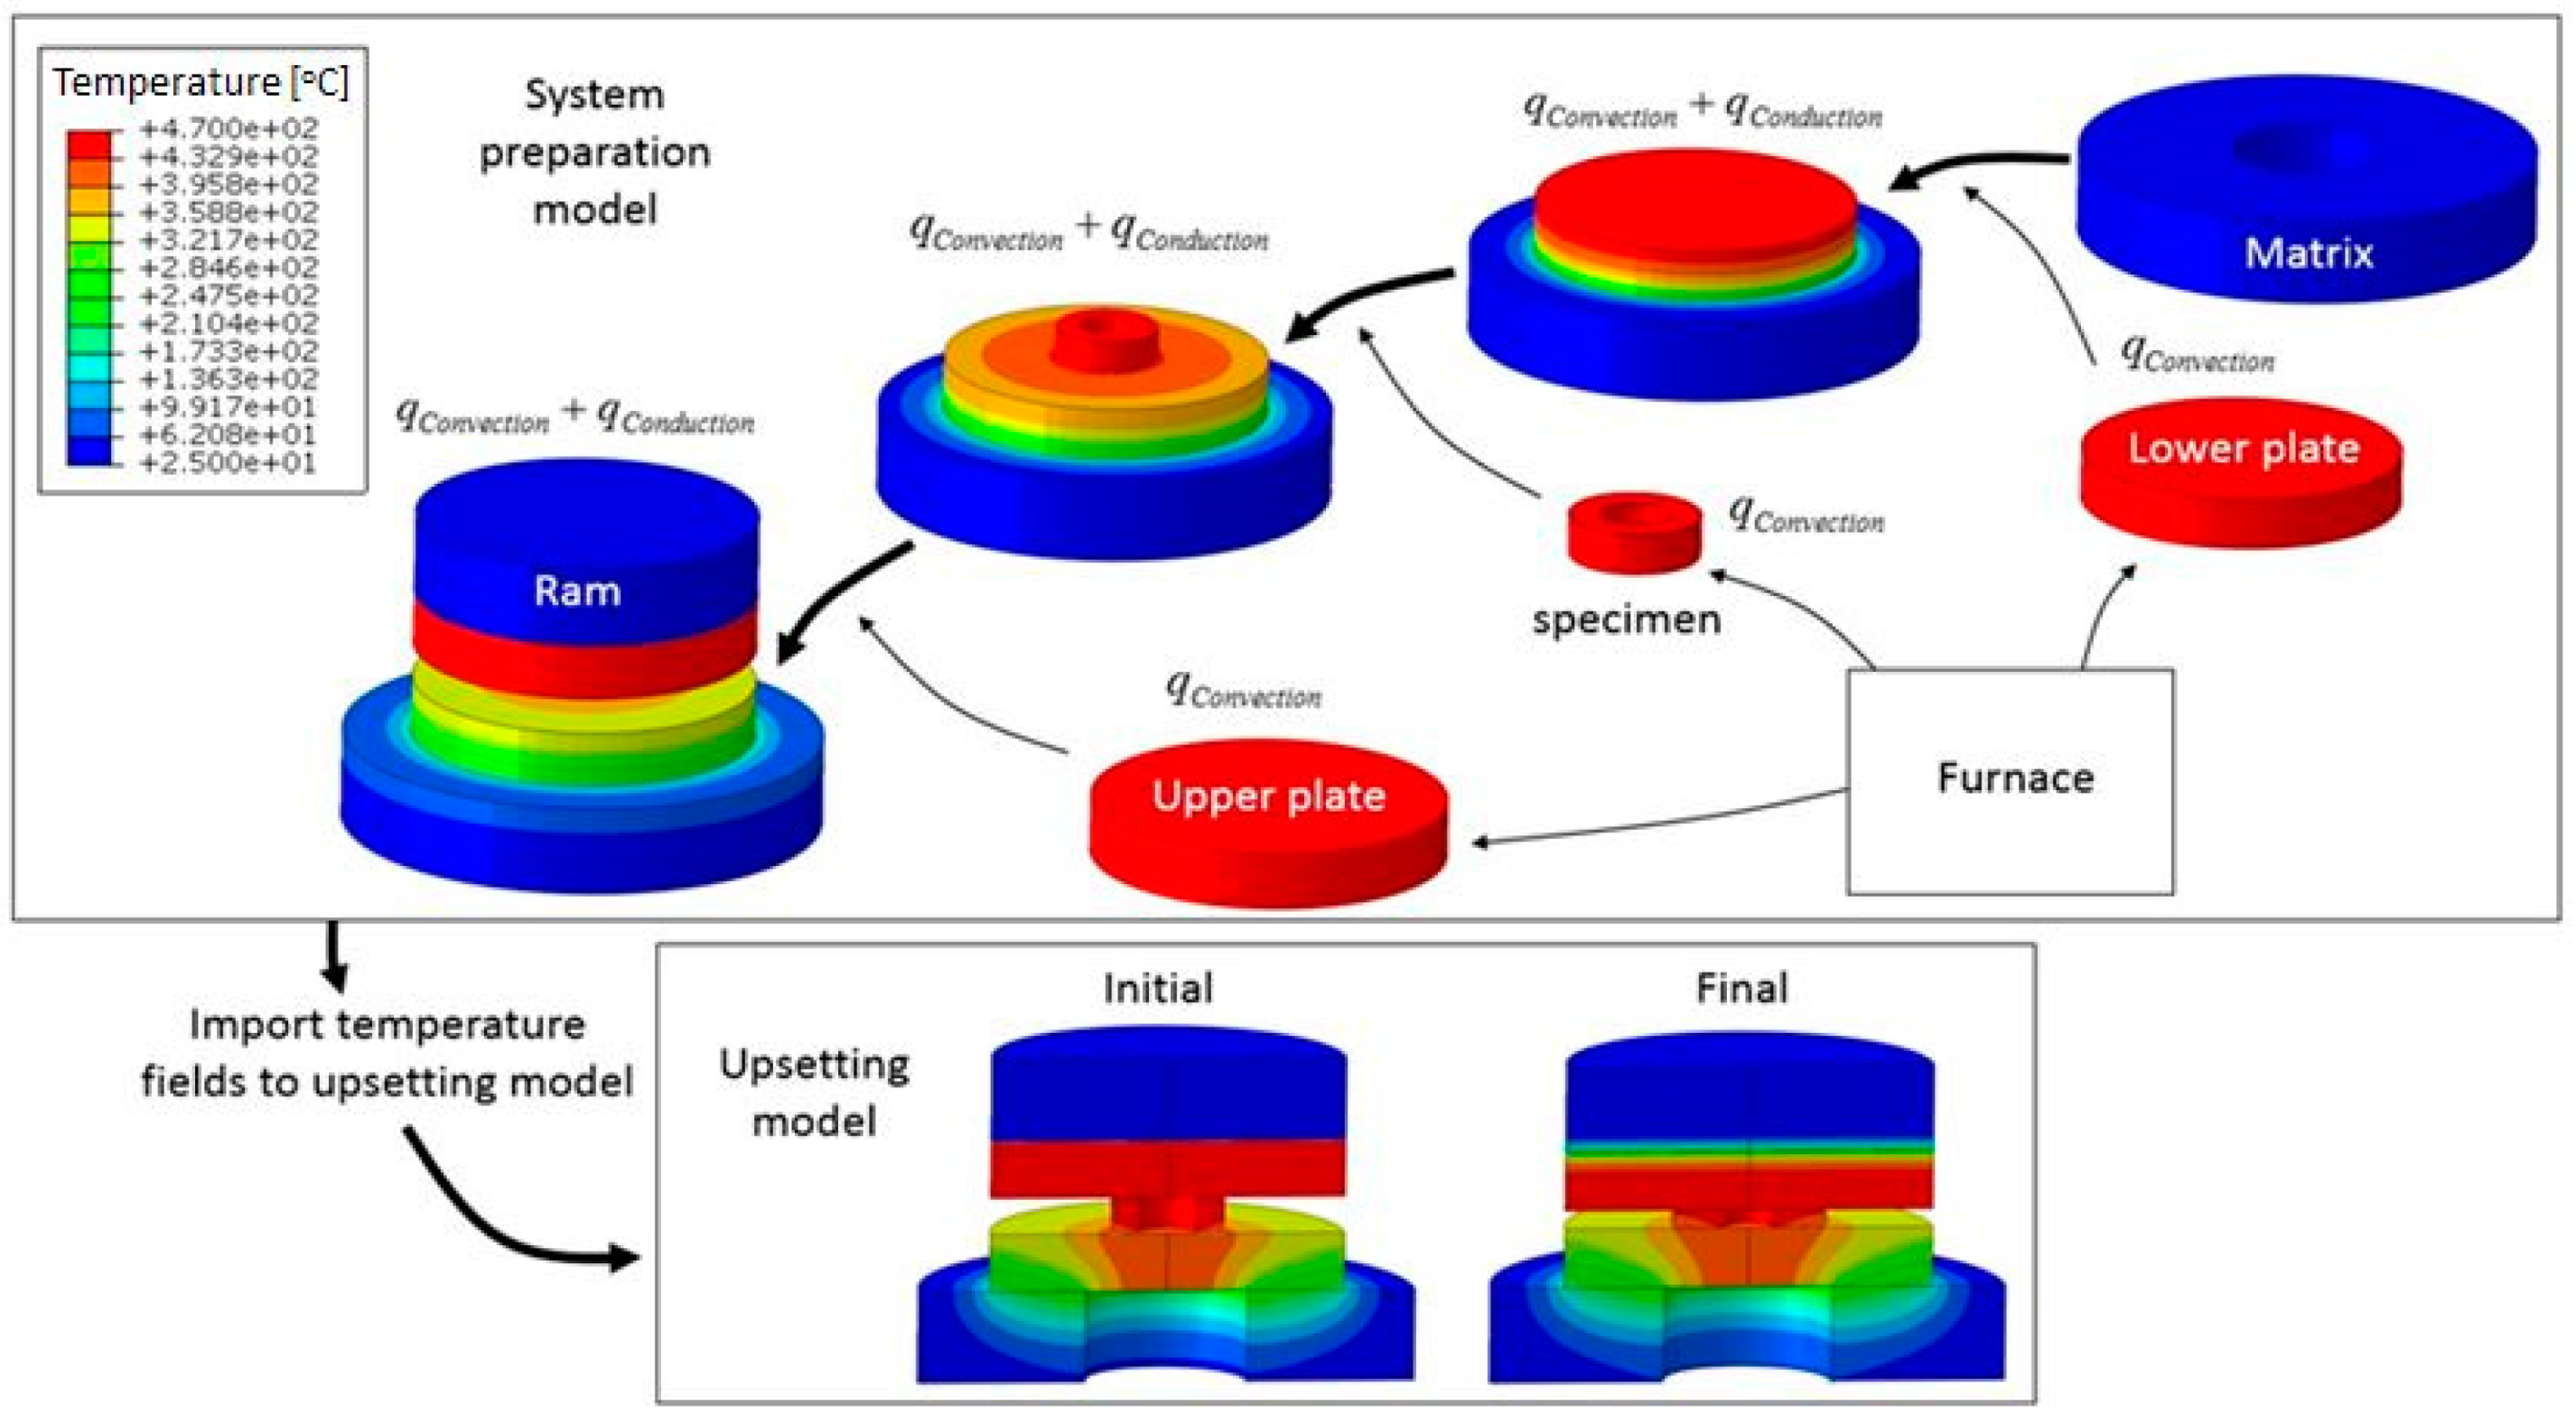
3. Computational Modeling of the Upsetting Tests

During the upsetting process at high temperatures, heat is lost during the system preparation due to convection and contact conductance. The mechanical and thermal fields, such as the strain, stress, and temperature, are inhomogeneous. Therefore, analytical analysis is inadequate and numerical computations must be utilized. The governing equations are the momentum (given here in the updated configuration) and the heat transfer equations (see [12]):
V σ ( u ) : d ( v ) d V S t · v d S V f · v d V = V ρ u ¨ v d V
2 T + q ˙ k = 1 α T t ;   q ˙ = η σ : ε ˙
In Equation (1), u and v are the displacement and virtual displacement vectors, respectively, σ, d, t, and f are the Cauchy stress tensor, rate of deformation tensor, surface traction vector, and body force vector, respectively, and ρ is the material density. In Equation (2), k is the material conductivity, and α is the thermal diffusivity. The coupling between Equations (1) and (2) takes place through σ in Equation (1), which depends on the local temperature, and also through the heat generated due to deformation energy dissipated into heat, indicated by the term, q ˙ in Equation (2).

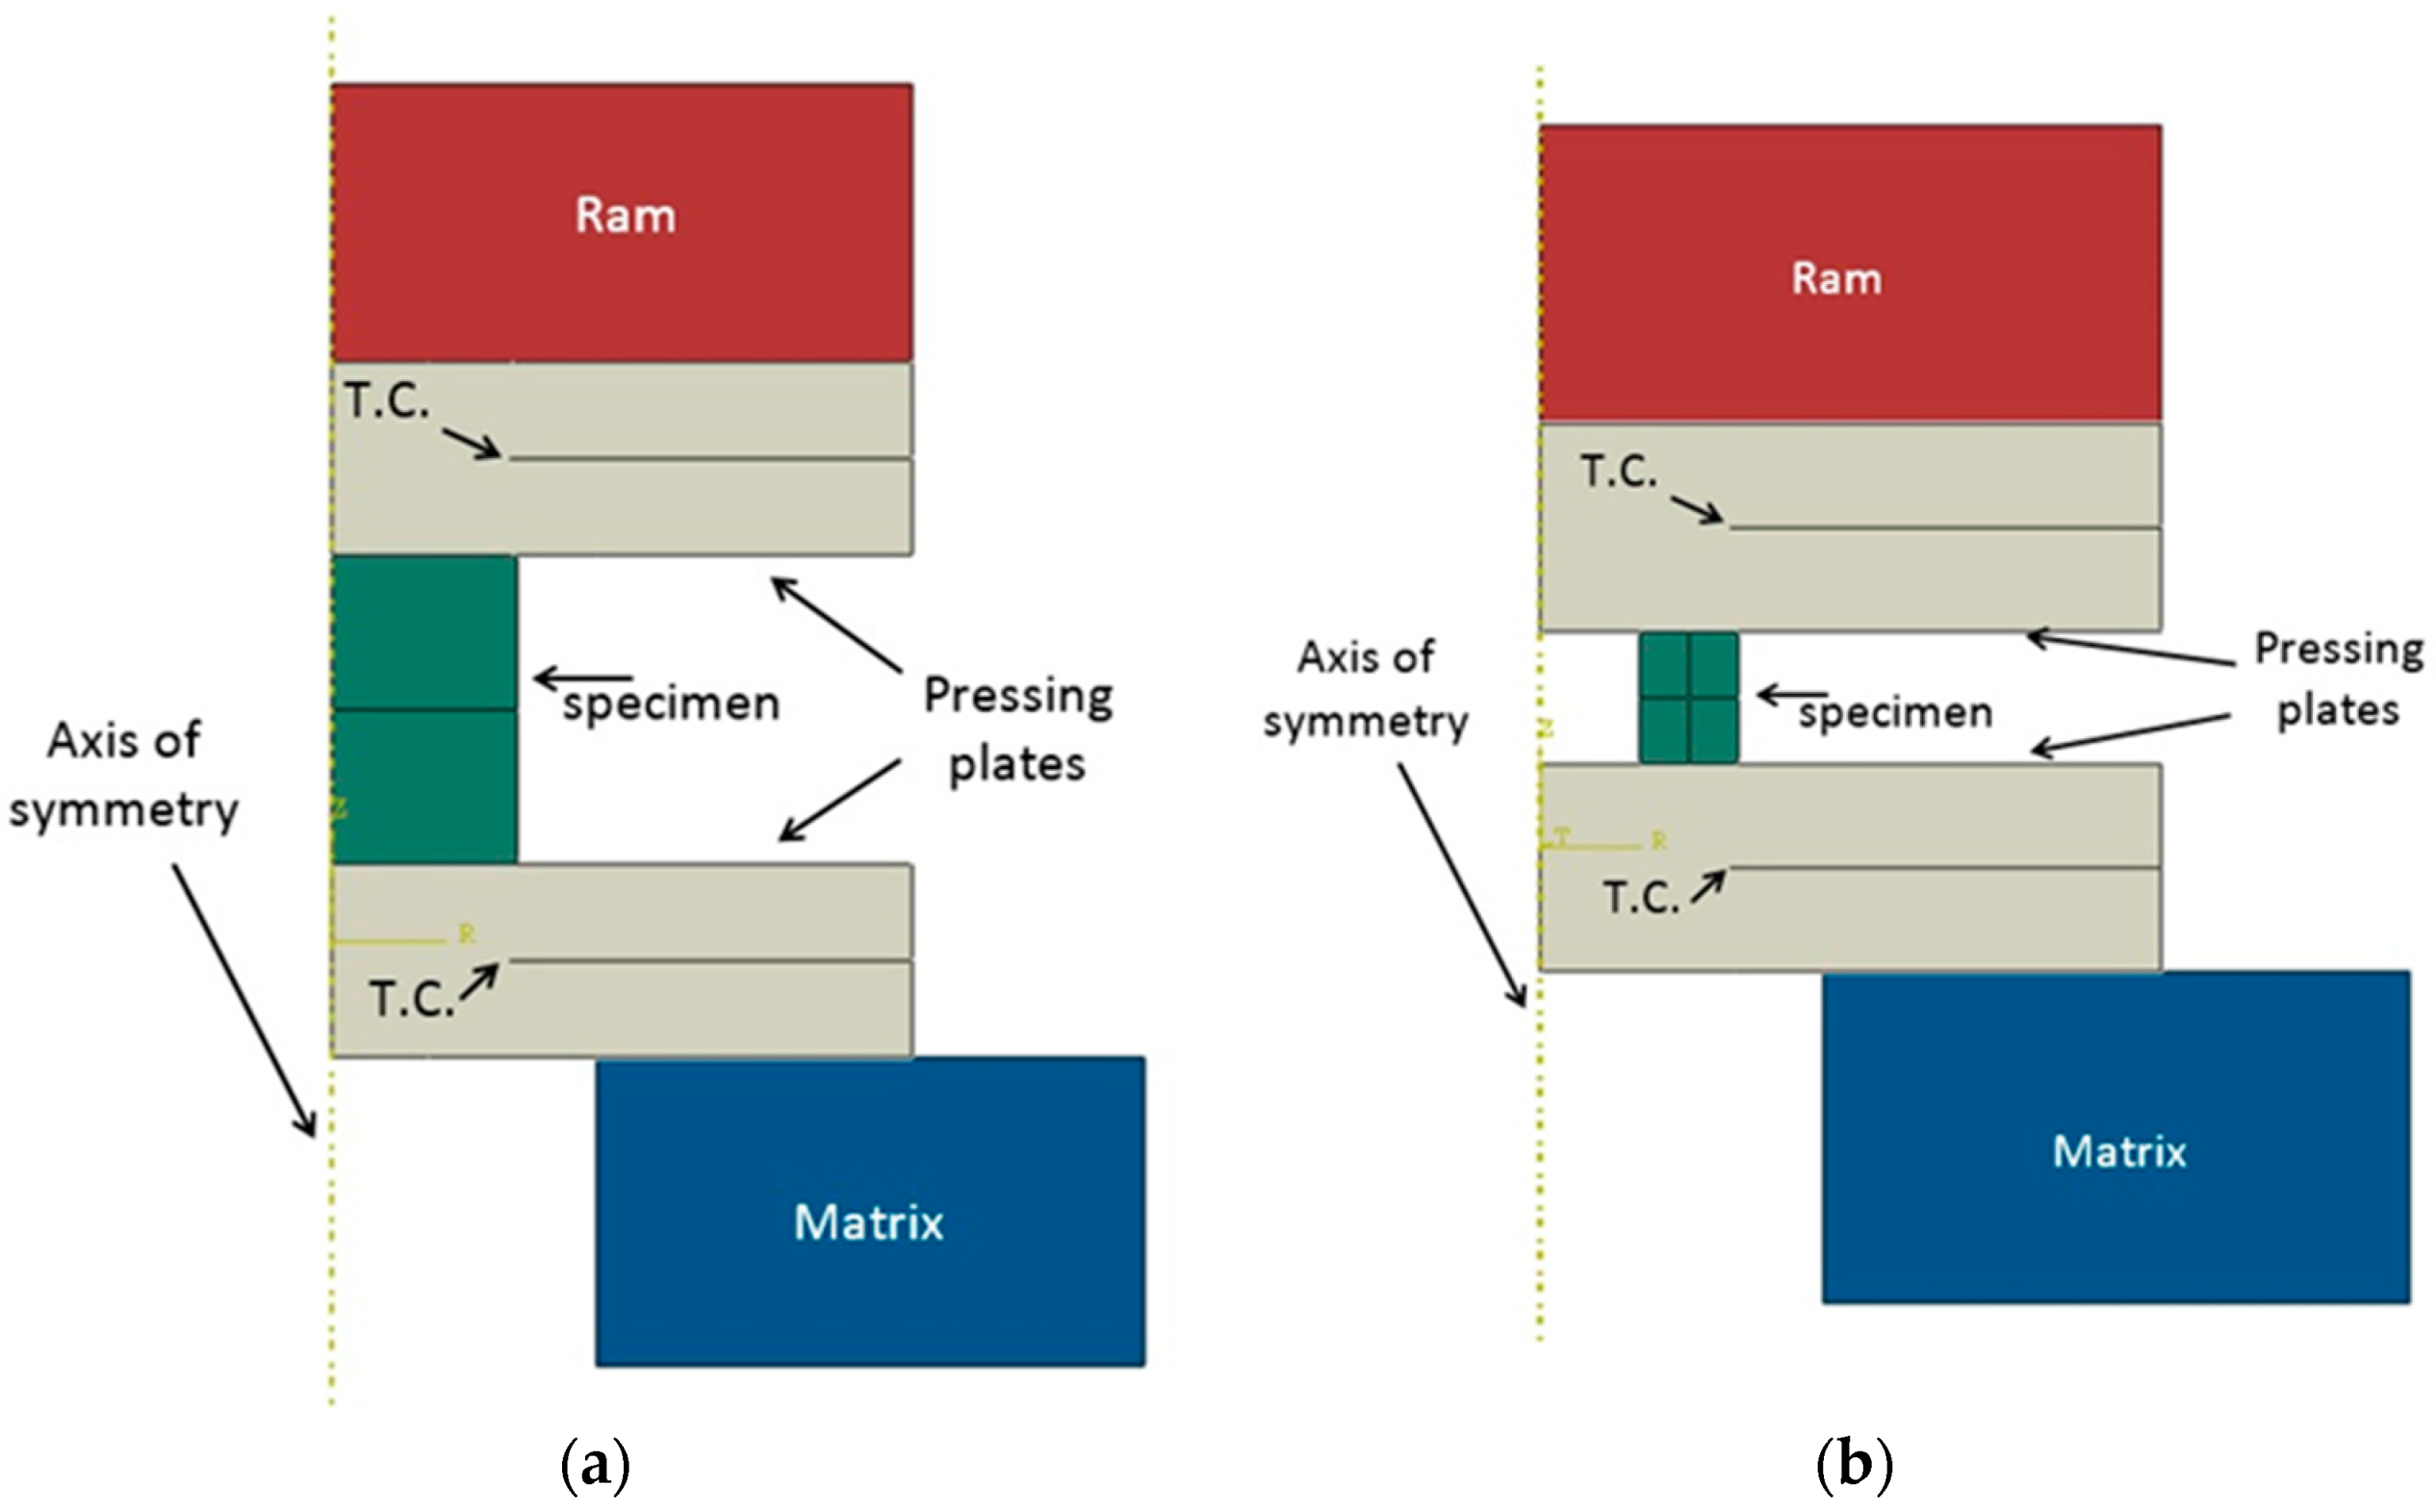
3.1 Model Definitions

In this study, the commercial finite element program, ABAQUS/Standard 6.14, was used to simulate the upsetting experiments. Exploiting the system’s symmetry, the model was a 2D axi-symmetric section of the upsetting setup, which included the specimen, plates, and some of the ram, as can be seen in Figure 2.
A J2 (Von Mises) based yield surface with isotropic strain hardening was used for the specimen while the plates were assumed to deform only in the elastic range due to their relative high yield stress even at the high testing temperatures, and the ram and matrix were defined as rigid. The rigid plastic constitutive law used for the specimen was assumed to be both temperature and strain rate dependent and encoded in tabular form into the FE program. A coupled transient analysis was conducted with a two-way coupling between the thermal and mechanical fields. Following initial computations and examination of the plastic strain rate (not shown herein), it was concluded that the heat generated by plastic deformation (using η = 0.9 in the examination) has negligible influence on the computed results and was therefore not considered in further analysis.
Velocity boundary conditions were prescribed to the (rigid) ram while homogenous Dirichlet boundary conditions were prescribed to the (rigid) matrix. A penalty-type contact constraint was specified between the specimen, plates, and ram using a constant friction coefficient. The friction coefficient for each combination of experimental parameters was determined from analyzing the experimental results of both the cylinder and ring specimens’ upsetting, as discussed in Section 4.3.
Heat loss while transferring the tools and specimen from the furnace to the experimental system, convection heat loss to the surrounding air, and through the contacting surfaces between the specimen and plates may decrease the temperature in the specimens significantly. In order to examine the temperature distribution within the specimen and the temperature changes during the system preparation, a thermo-mechanical model was developed for each of the high temperature experiments. This included transferring the lower plate, specimen, and upper plate from the furnace to the press and placing them one on top of each other (see Figure 3 for an example of a ring specimen, the cylindrical specimens were treated similarly). The FE models took into account heat loss by convection to the surroundings and by conduction between the tool surfaces (radiation heat loss was negligible). The thermal contact conductance was specified on the interface between the specimen, plates, and tools. The length of stay in air and duration of contact between all system components were estimated from thermo-couple measurements not shown herein (total time of system preparation was about 50 s in average). Thermo-couples were placed within both pressing plates so that continuous readings were taken from the heating stage until the end of the experiment. Additional temperature measurements were available from the heating furnace of the billet.
The computation included all stages of the experimental system preparation. The initial temperature distribution of the system components for computing the upsetting stage was imported from the respective preparation model. The numerical modeling of the system preparation also enabled the calibration of the contact conductance (hc = 105 (W)/(m2·K)) and thermal convection coefficient (h = 10 (W)/(m2·K)), which is the limiting value for natural convection).
To examine whether the coupled thermo-mechanical analysis was necessary, thermal and mechanical fields were compared between a coupled thermo-mechanical model with system preparation, one without system preparation, and a mechanical (non-coupled) model. An example of the results obtained for the upsetting conditions of specimen A7 (see Table 1) is shown in Figure 4. In this specimen, the largest difference in the initial temperature between the billet and plates was observed. In the thermo-mechanical model with no preparation, the constant initial temperatures were taken from the measurements at the furnace and defined as homogeneous throughout each component.
It can be observed from Figure 4 that the influence of the preparation process on the thermo-mechanical fields is significant. Differences are especially pronounced regarding the temperature value and distribution at the cross-section of the cylinder as well as the value and distribution of the equivalent stress. The average temperature difference computed by the models with and without preparation in this example is about 35 °C. However, the resulting force-displacement curves and dimensions obtained from the thermo-mechanical models with and without preparation were similar. Mechanical fields obtained from the (non-coupled) mechanical model were similar to those obtained for the thermo-mechanical model without preparation and therefore are not presented in Figure 4. It is therefore demonstrated that, when the experimental setup includes system preparation, it is necessary to use thermo-mechanical models, which include the preparation stage. This will enable a more accurate determination of the temperature for which the characterized flow stress is appropriate (which, as in the example shown in Figure 4, may be significantly different from the target temperature the furnace was set to).
Therefore, all models used in this study were coupled thermo-mechanical (temperature dependent flow stress for the entire temperature range was incorporated within each model), which included the experimental system preparation stage. In general, the thermal distribution obtained within the billets after the upsetting using the coupled FE models was usually about 10 °C.
All computational models underwent a thorough process of solution verification as outlined in detail in Appendix A.

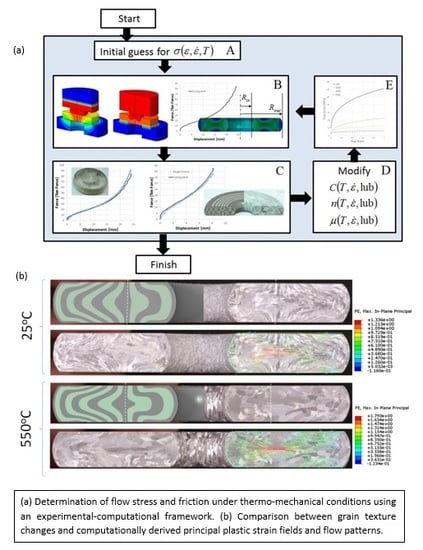
4. Determination of Flow-Stress Manifolds and Friction Conditions

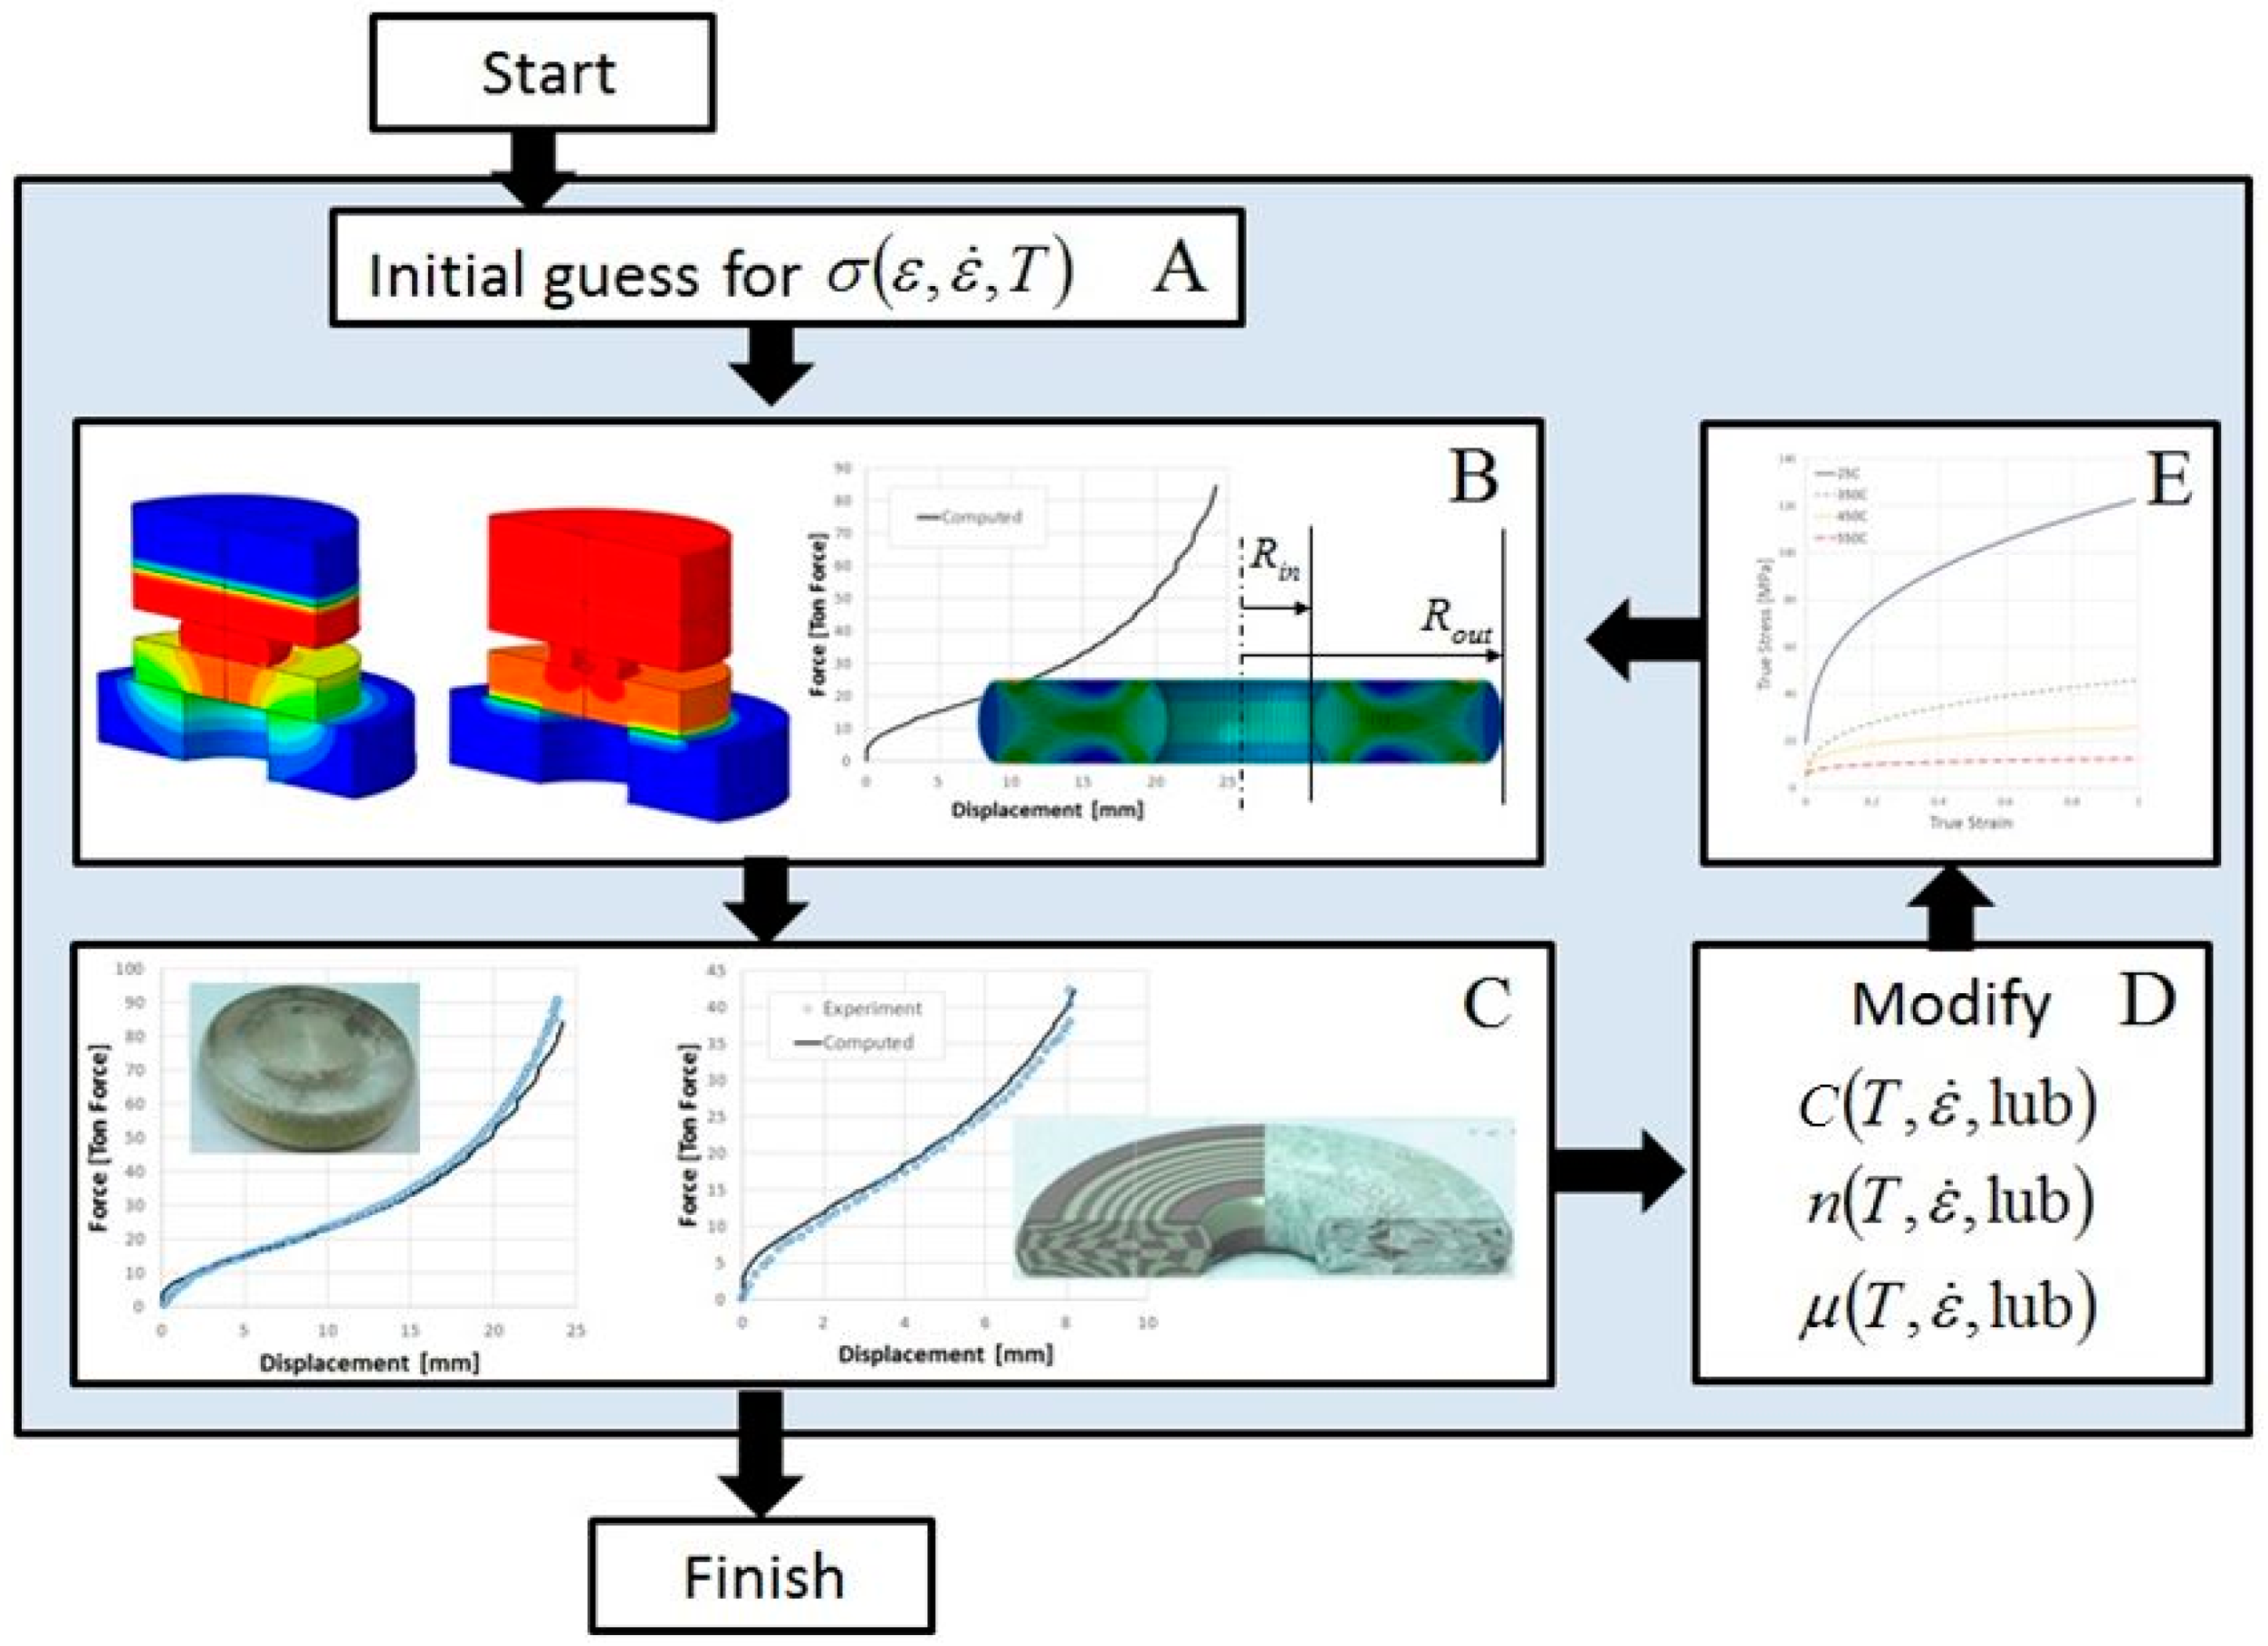
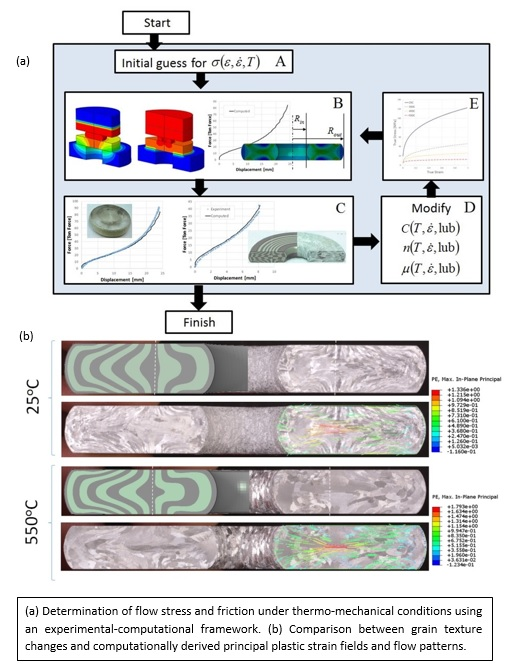
4.1. Iterative Process for Determining Flow Stress Manifolds

The flow stress (FS) curves of the material as well as the friction coefficient were determined by an iterative process aimed at minimization of a target function.
An initial estimation for the FS is needed to conduct the first computation. Therefore, for every temperature and strain rate, the average FS and strain was estimated by using the simple analytical expression in Equation (3) for cylindrical upsetting, which neglects heat loss and the barreling effect due to friction (see [13]):
σf (F, h) = (4·F·(h0 − ∆h))/(π·D02·h0); εf = ln(1−∆h/h0)
where D0 is the initial diameter of the billet, h0 is its initial height; F and ∆h are the experimentally measured load and ram displacements, respectively. The computed load-displacement curve and deformed shape (measurements of the diameters at the top, center, and bottom of the deformed specimens obtained for the experimentally obtained height) were compared to the experimental results. This iterative process was terminated once a relative error of less than 4% between all experimental and computed values was obtained. When comparing the specimen dimensions (outer and, for the ring, also inner diameters), the target function was simply computed by:
E r r o r = ( D E x p D N u m D E x p ) .
When comparing the force-displacement curves, the curves are sampled in N equally spaced intervals and the target function was defined by:
E r r o r = 1 N i = 1 N ( F E x p i F N u m i F E x p i ) .
In each iteration, the stress-strain relation of the form, σ = C·εn (known as Hollomon’s equation), was corrected (by changing either C, n, or both) and the set of computations was performed again. The iterative process is schematically presented in Figure 5.
In this study, as the cylinders are compressed with no lubrication and the friction is significant, the flow stress cannot be calibrated separately from the friction coefficient. The numerical models have shown that one can obtain a good fit for the experimental results from cylinder upsetting, in terms of force-displacement curve and measured dimensions, and yet not obtain a reasonable fit for the experimental results from the RCTs, using the same flow stress and friction coefficient calibrated from the cylinder upsetting alone (see Figure 6 for an example). One should keep in mind that the experimental parameters for both cases include also the same lubrication conditions (no lubrication for both A1 and R1 samples presented in Figure 6), so that the force-displacement curve for the ring cannot be recalibrated using a different value of μ. Therefore, both the flow stress relation and μ need to be matched for the cylinder and ring specimens simultaneously for the same experimental parameters.

4.2. Flow Stress Manifolds for Al1050

The following Table summarizes the true stress-plastic strain relations (σ = C·εn) calibrated for Al1050 under different temperature and strain rate conditions, using the iterative process described in Section 4.1. The average experimental strain rate was calculated from the ram velocity by using (see [13]):
ε ˙ = v o 2 ln ( h 0 / h ) h 0 h
Using Equation (4) an average strain rate of 〈 ε z z ̇ 〉 = 0.11 for a ram velocity of vz = 350 mm/min and an average strain rate of 〈 ε z z ̇ 〉 = 0.38 for a ram velocity of vz = 1200 mm/min was obtained. The flow stress curves obtained from the iterative analysis, for the different strain rates examined, were not significantly different for all temperatures considered. It should be noted that, for different strain rates, the flow stress was sometimes expressed with the following power law, σ = C· ε s ̇ , where s is the strain rate sensitivity, or by the Sinh-Arrhenius type relation (the strain rate sensitivity is commonly indicated by m, however, this notation was modified to avoid confusion with the friction factor, also marked by m). Experiments on metals at different strain rates (at a constant temperature) were conducted in [14]. It was shown that s increases with temperature, moderately at low temperatures and then more rapidly above about half of the melting temperature (T > TM/2). However, this behavior depends not only on temperature, but also on the order of magnitude of the strain rates. The experimental results conducted in this study demonstrate that the strain rates within the examined range are not high enough for the flow stress (or s) to change significantly, even at high temperatures. As a consequence, the stress-strain relations at all temperatures were approximated by Hollomon’s equation. Table 3 provides average values (in terms of strain rate) of Hollomon’s coefficients for each temperature.
A graphical representation of the average flow stress for 0.11 ≤ 〈 ε z z ̇ 〉 ≤ 0.38 at different temperatures, obtained using the iterative process described herein, is shown in Figure 7:
One can observe from Table 3 that as the temperature increases the flow stress decreases and the strain hardening (slope) also decreases, as expected.

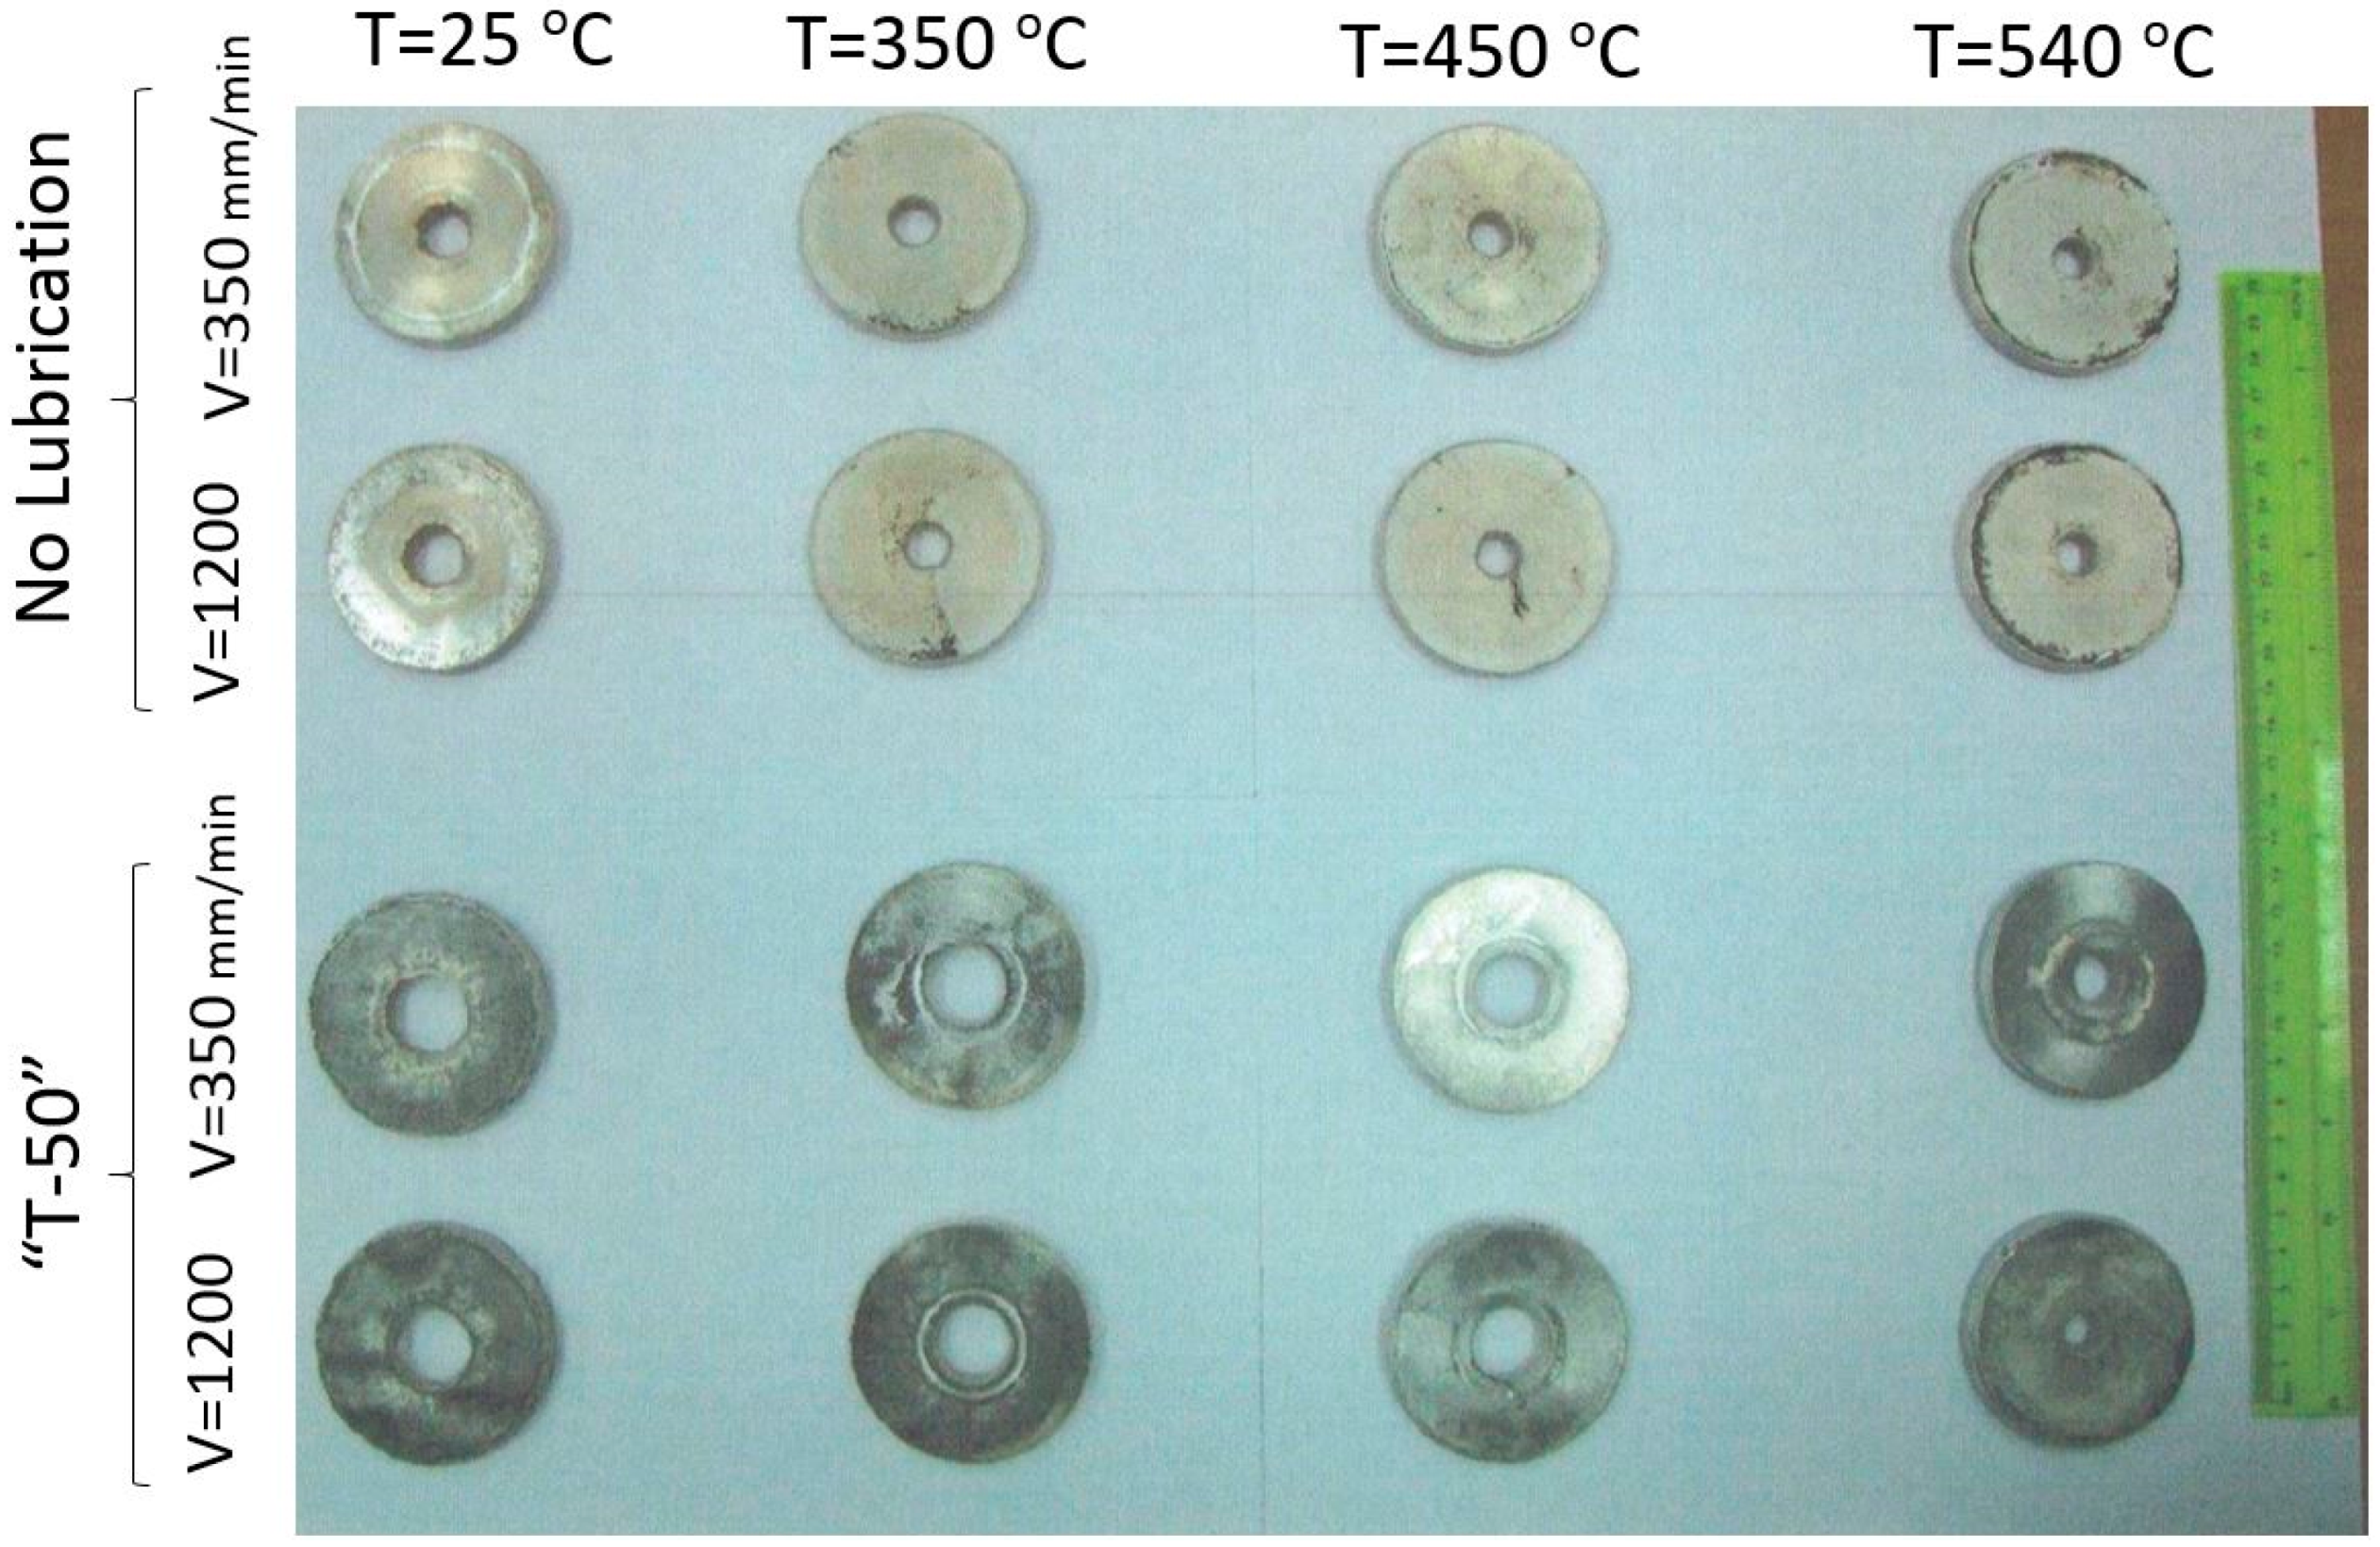
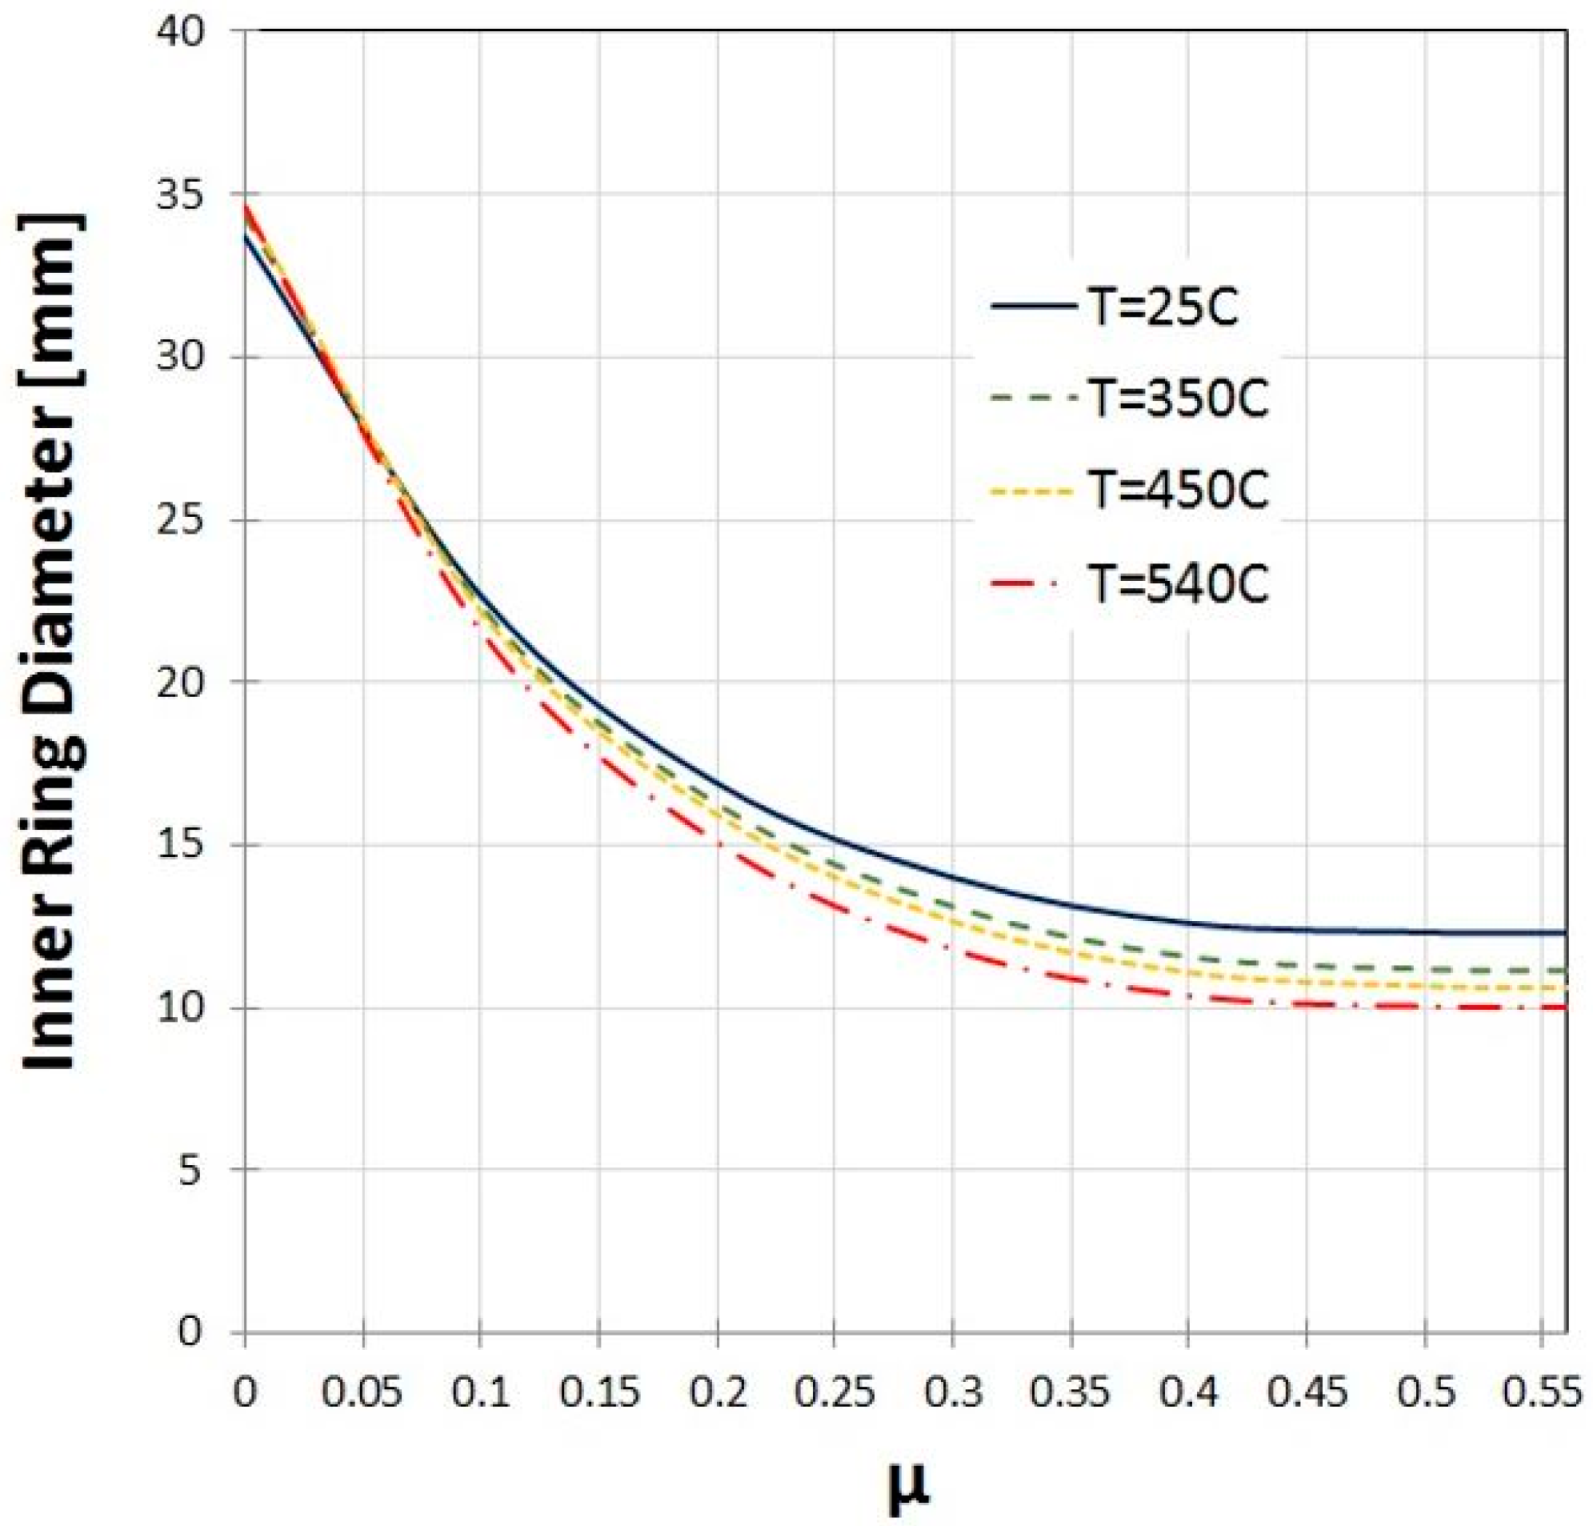
4.3. Determining the Friction Conditions
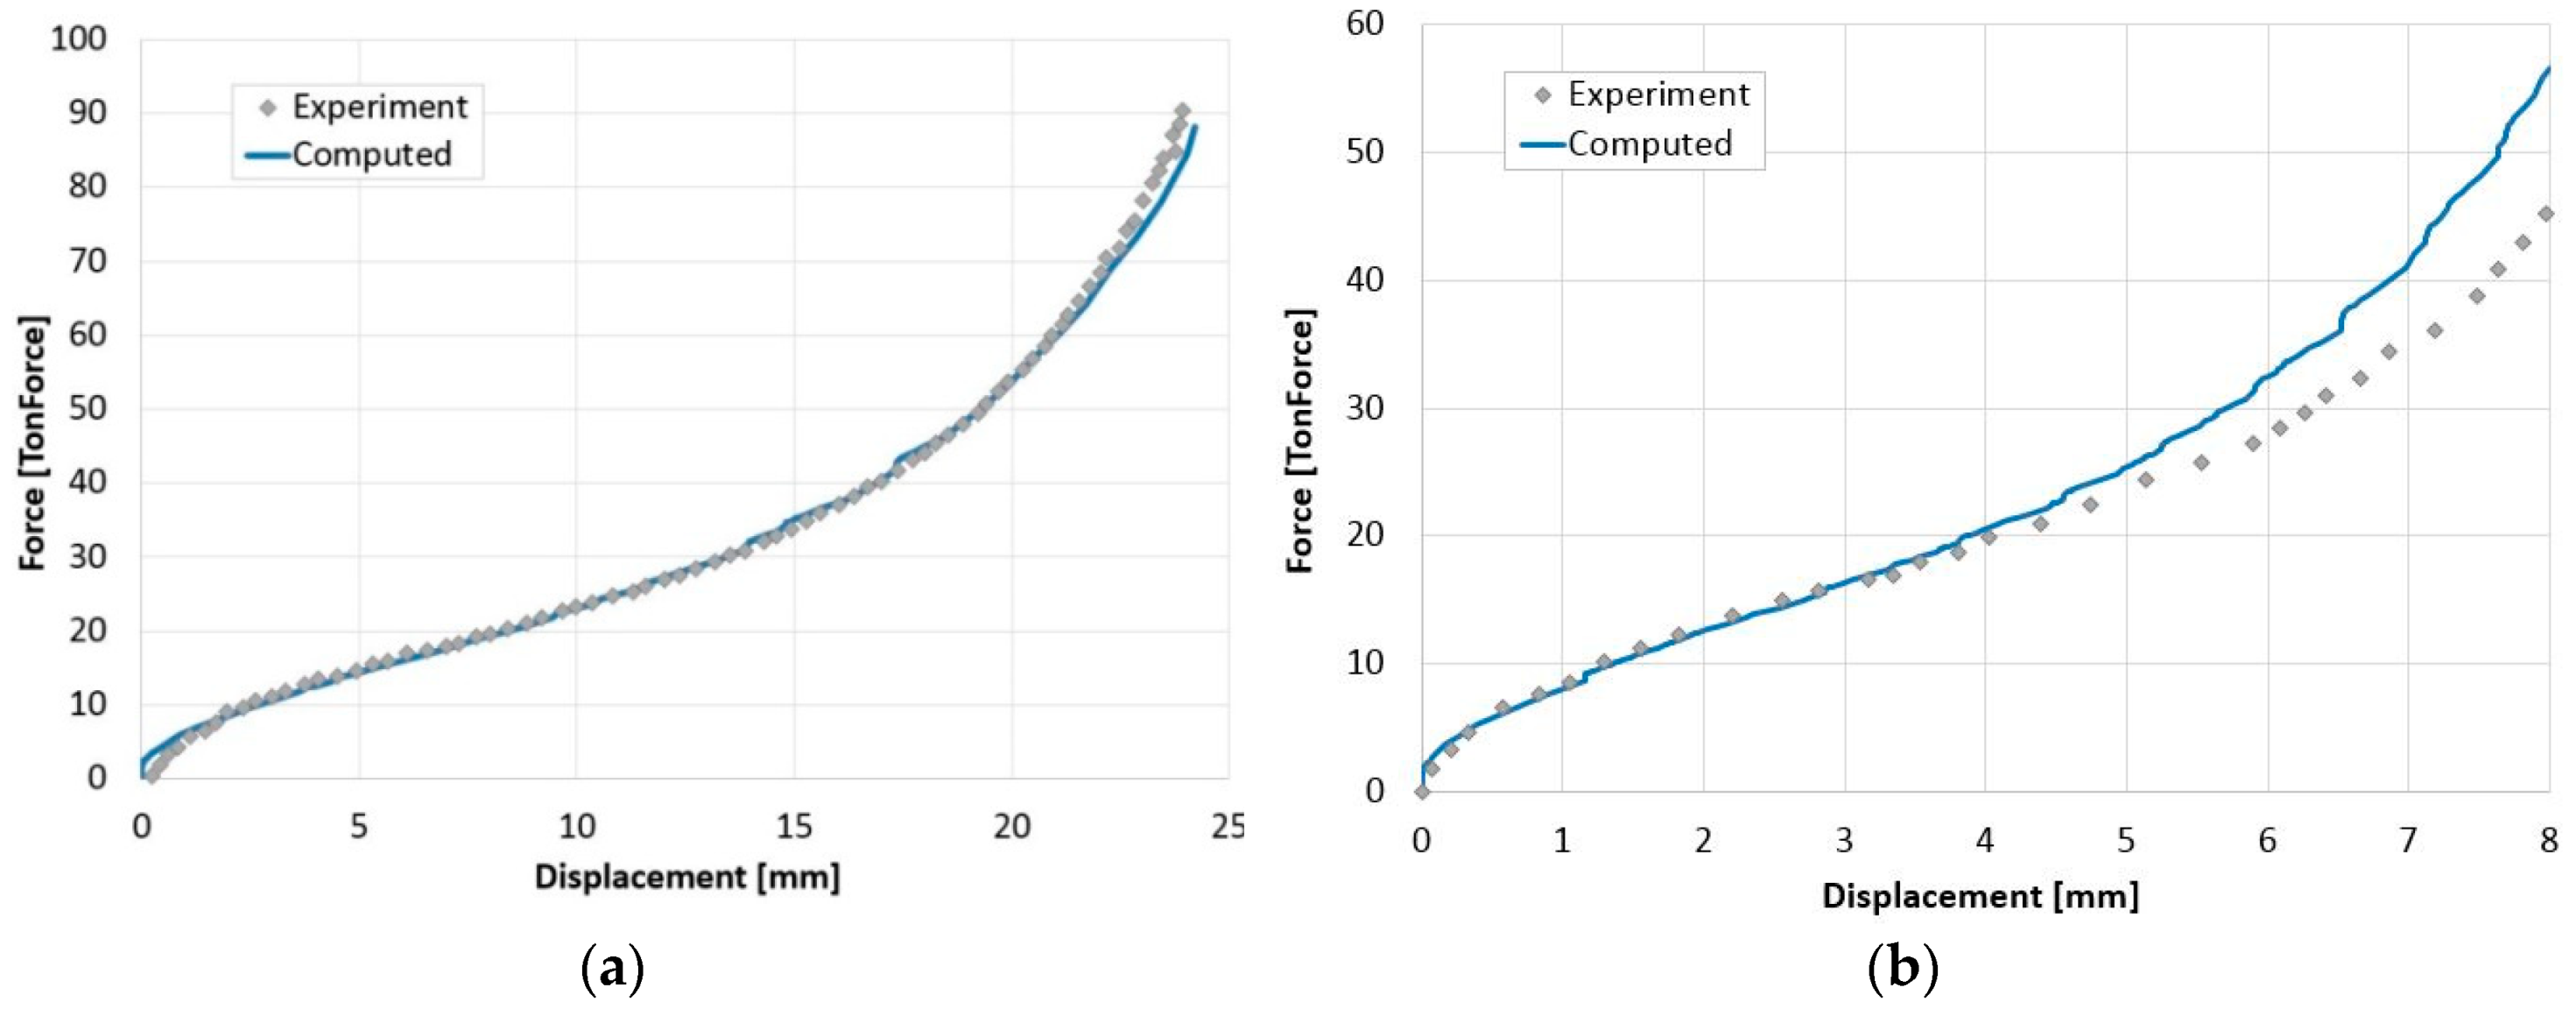
The RCT method correlates between the friction coefficient and the dimensional changes, especially the inner diameter. In Figure 8, an upper view of the compressed rings is shown.
Usually, the macroscopic deformations of the ring are measured and the friction coefficient is obtained by comparing them to dimensions from analytical or numerical models. In this study, the Coloumb friction model was utilized. The model defines a friction coefficient, μ, such that μ = Friction force/Normal force = τ/p, where τ is the frictional shear stress and p is the normal stress. The frictional shear factor, m = τ/k, is also commonly used, where k is the flow stress in pure shear. The friction coefficient, μ, (or factor m) is not necessarily constant in metal forming processes, including RCTs. However, it is customary to refer to a single representative value, which is in fact an average value, of μ (or m) for each RCT with specific experimental parameters. It was shown in [15] that when the frictional shear stress, τ, reaches the material shear flow stress, k, the internal shear of the material becomes preferable since it requires less energy than sliding against the surface of the tools during the plastic forming. The sticking condition is therefore defined as: τ = μpk. In the limiting case, τ = k = 0.577σy (k = 0.577σy according to the Huber-Von Mises yield criterion or 0.5σy according to Tresca), where σy is the material yield stress. μ is therefore theoretically limited to 0.577 in metal forming.
To determine the friction coefficient for each combination of experimental parameters, different values of μ were examined at the interface between the specimen (either cylinder or ring) and pressing plates. As discussed in Section 3.1, the flow stress and friction conditions could not be calibrated separately, so that both the flow stress relation and μ needed to be checked for the cylinder and ring specimens simultaneously, and result in a good fit for all geometrical dimensions and the force-displacement relation (this includes both lubricated and unlubricated experiments). It should be noted, that the force-displacement curves may serve as additional means for validation, however, they cannot be used for calibration of the friction coefficient on their own, since they are less sensitive to changes in friction conditions.
The inner diameter of the ring specimen was highly sensitive to μ. However, numerical calculations have shown that increasing μ (between 0 and 0.577) results in those dimensions approaching an asymptotic value. Figure 9 shows the relation between the computed inner ring diameter and friction coefficient. It is demonstrated that for Al1050 μ above ~0.45, it is hard to determine the exact value of μ by only measuring the inner diameter as the friction value may lie within the range, 0.45 ≤ μ ≤ 0.577. For Al1050, the RCT is therefore inappropriate for determining the friction coefficients at high friction conditions, which are usually obtained without lubrication. These conditions may be necessary for some metal forming processes, such as bridge die extrusion, at which the presence of lubrication may interrupt the welding of the metal streams.
The calibrated values of μ for all experimental parameters are presented in Table 4.
It can be seen from the results presented in Table 4 that for the same average strain rate, μ increases with temperature (this is more evident for the RCT upsetting with lubrication as μ does not approach the limiting value in these cases). For the same temperature, increasing the strain rate slightly decreases μ. There is an exception to this rule at 540 [°C], where μ for specimen R16 (with lubrication) is significantly larger that for specimen R15, for which the ram velocity is smaller. This is evident from Figure 8 as well, which demonstrates that the inner diameter of specimen R16 resembles that of the non-lubricated specimens (a small inner diameter results from a high coefficient μ). The inner diameter of R15, which was compressed at the same temperature, is also significantly smaller than other lubricated specimens compressed at lower temperatures. This behavior may be explained by the loss of lubrication abilities as a result of oxidation at the highest temperature. This hypothesis is supported by the work presented in [16], which demonstrated that graphite-based lubricants oxidate approximately above 540 [°C], impeding their lubricating abilities. In general, it can be seen from Table 4 that the effect of temperature on μ is more pronounced than the effect of the strain rate, for the examined ranges.

4.4. Validation

The computed force-displacement curves using the converged mesh (see Appendix A) and the FS shown in Figure 7 are presented in Figure 10, together with the experimentally obtained curves.
Figure 10 demonstrates that a good approximation of the experimental force-displacement curves was obtained. As an additional mean of validation, the computed values of the upper, lower, and maximum deformed specimen diameters were compared to the experimentally measured values as can be seen in Figure 11.
To further validate the simulated friction conditions, after determining the friction coefficient, µ, the computed plastic strain distribution and principal directions from the FE models were compared to material flow patterns observed in metallographic characterizations of the specimens, as shown in Figure 12, Figure 13 and Figure 14.
The ring specimen in the FE model was divided into 13 longitudinal strips, 1 mm each (except for the external ones which are 0.5 mm wide), so that the deformation of each region could be easily observed. The neutral radius, which separates the material which flows outwards and inwards during the compression of the ring, was identified, and is represented by white dashed lines in Figure 12, Figure 13 and Figure 14. As shown in Figure 12, Figure 13 and Figure 14, there is a good correlation between the predicted location of the neutral radius in the computations and the observed location in the metallographic cross-sections. Figure 12, Figure 13 and Figure 14 also demonstrate the very good correlation between the direction of the computed principal plastic strain and the observed material flow patterns.
It is shown that temperature and lubrication can greatly affect the friction conditions between tools and the specimen. The strain rate (in the examined range) seems to have no notable influence on the friction conditions. In Table 5, a comparison between the predicted and observed neutral radius location is provided.

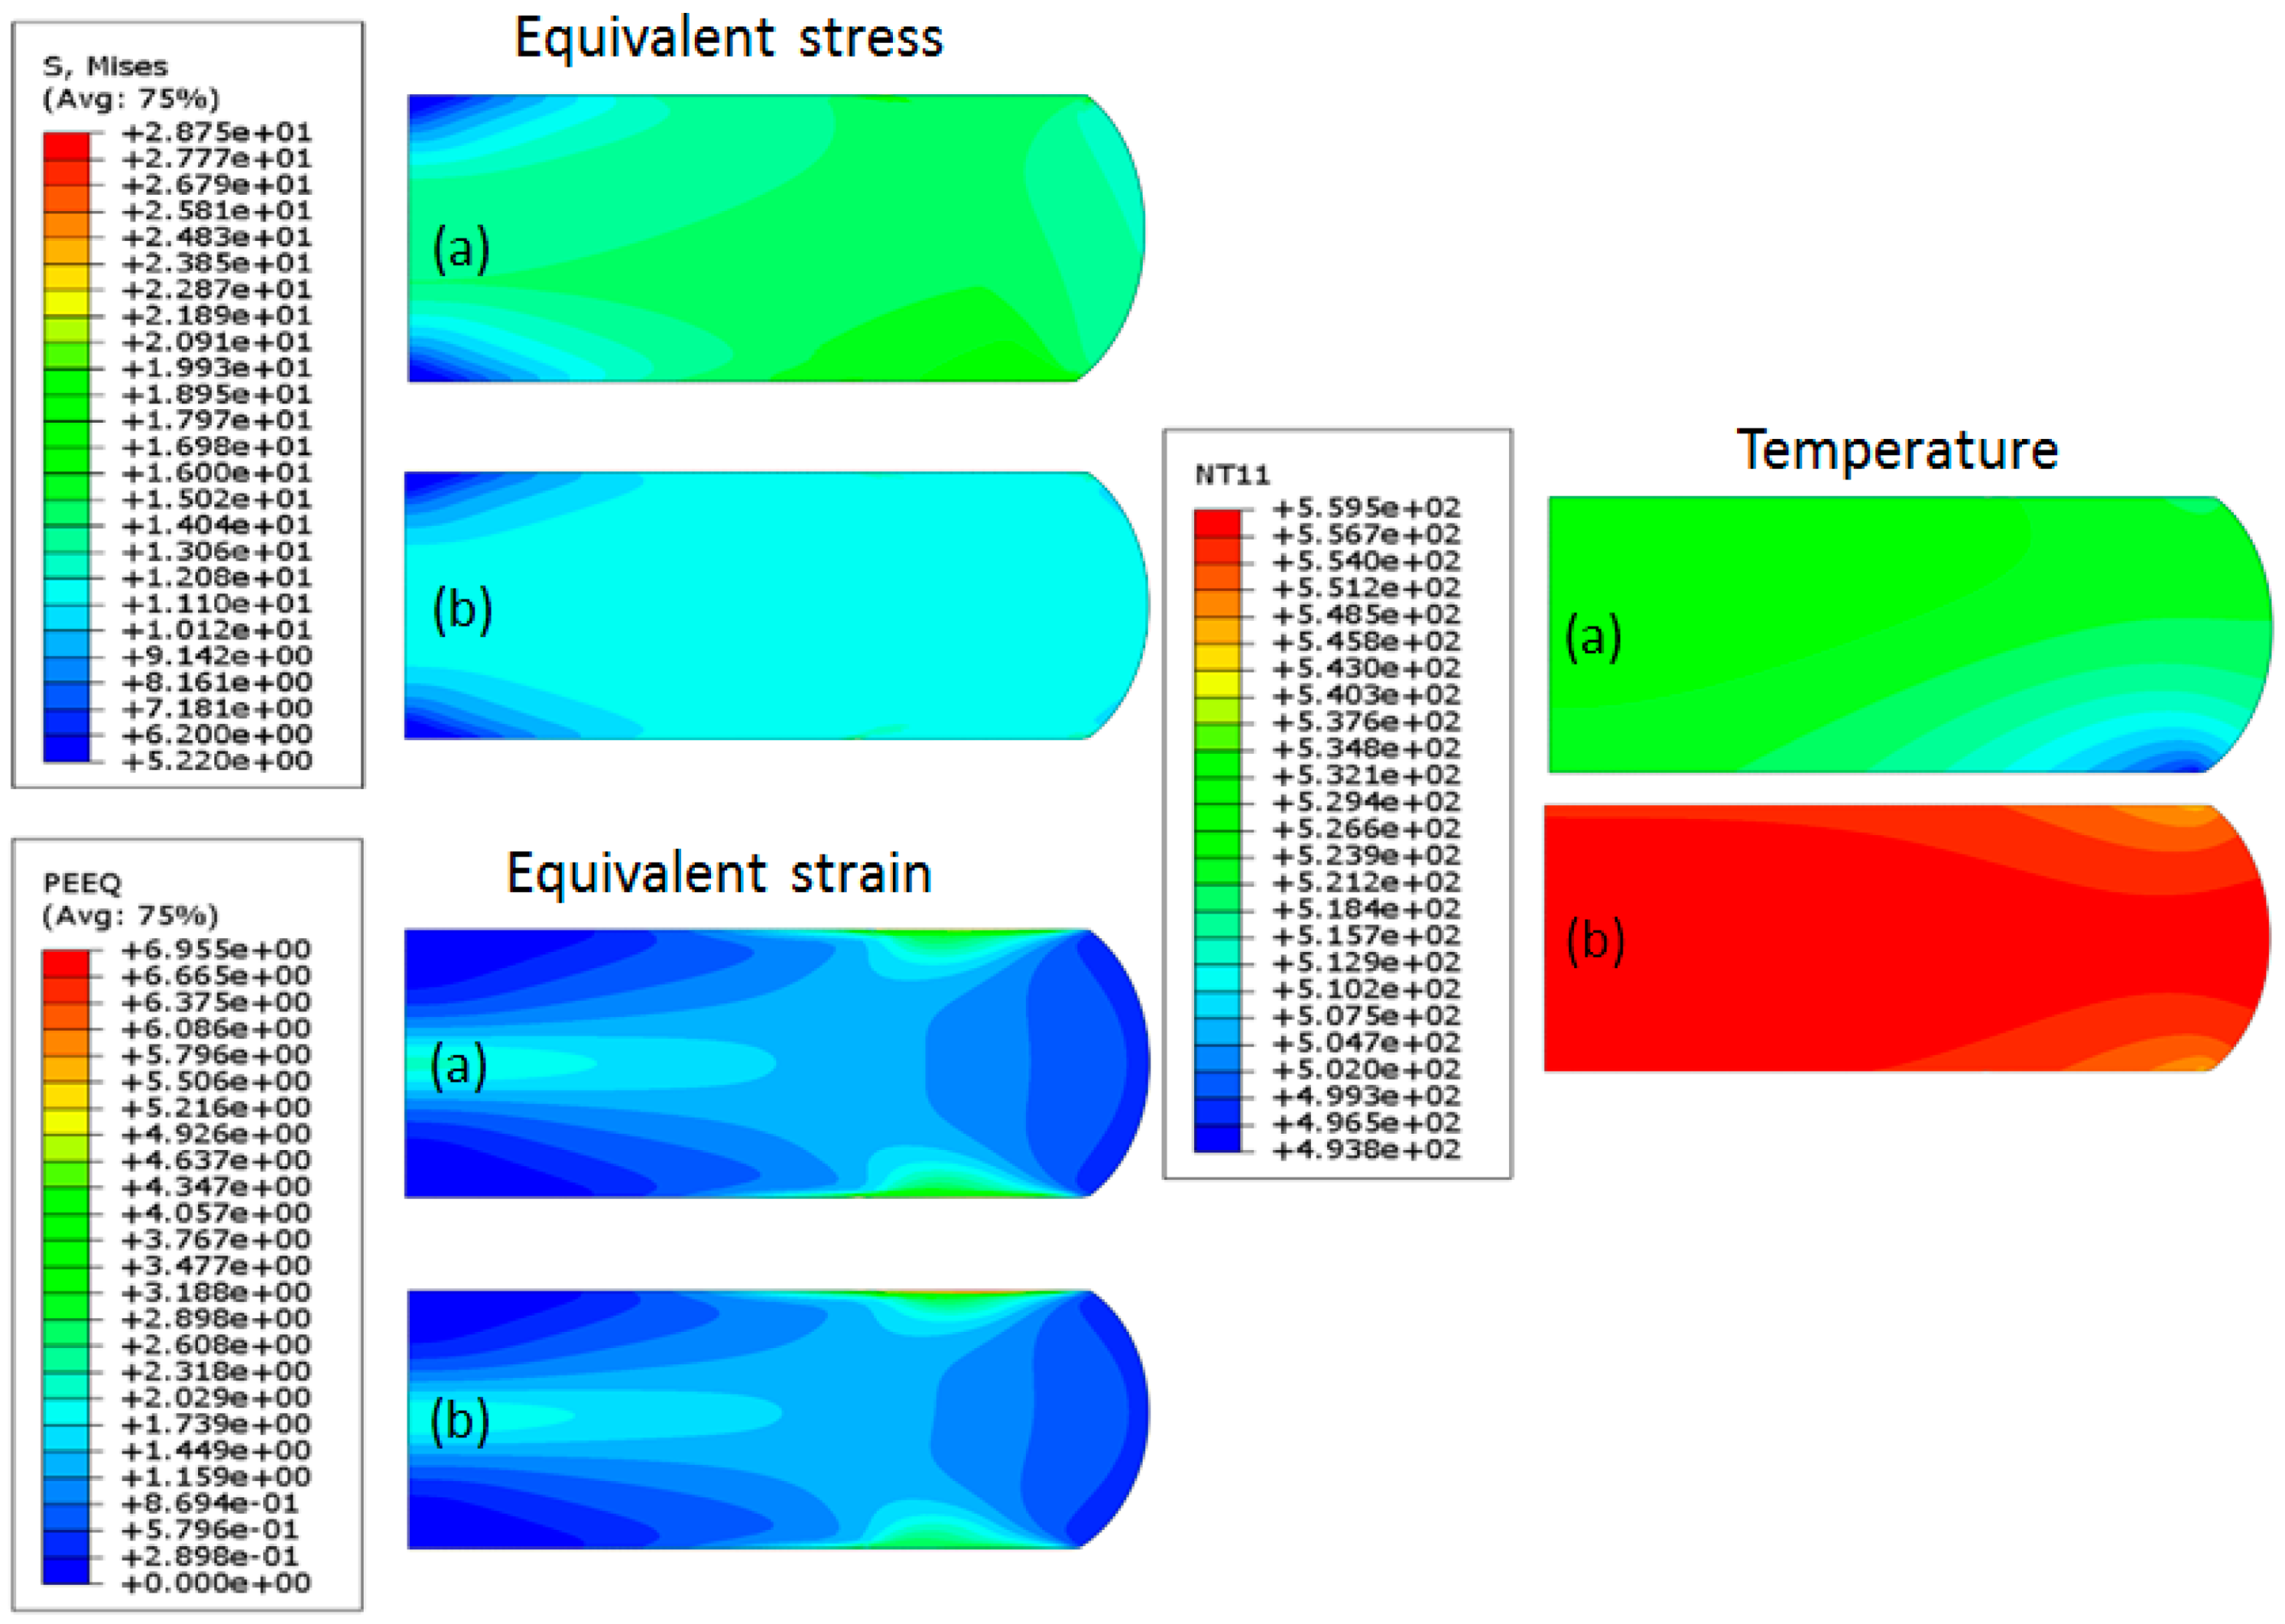
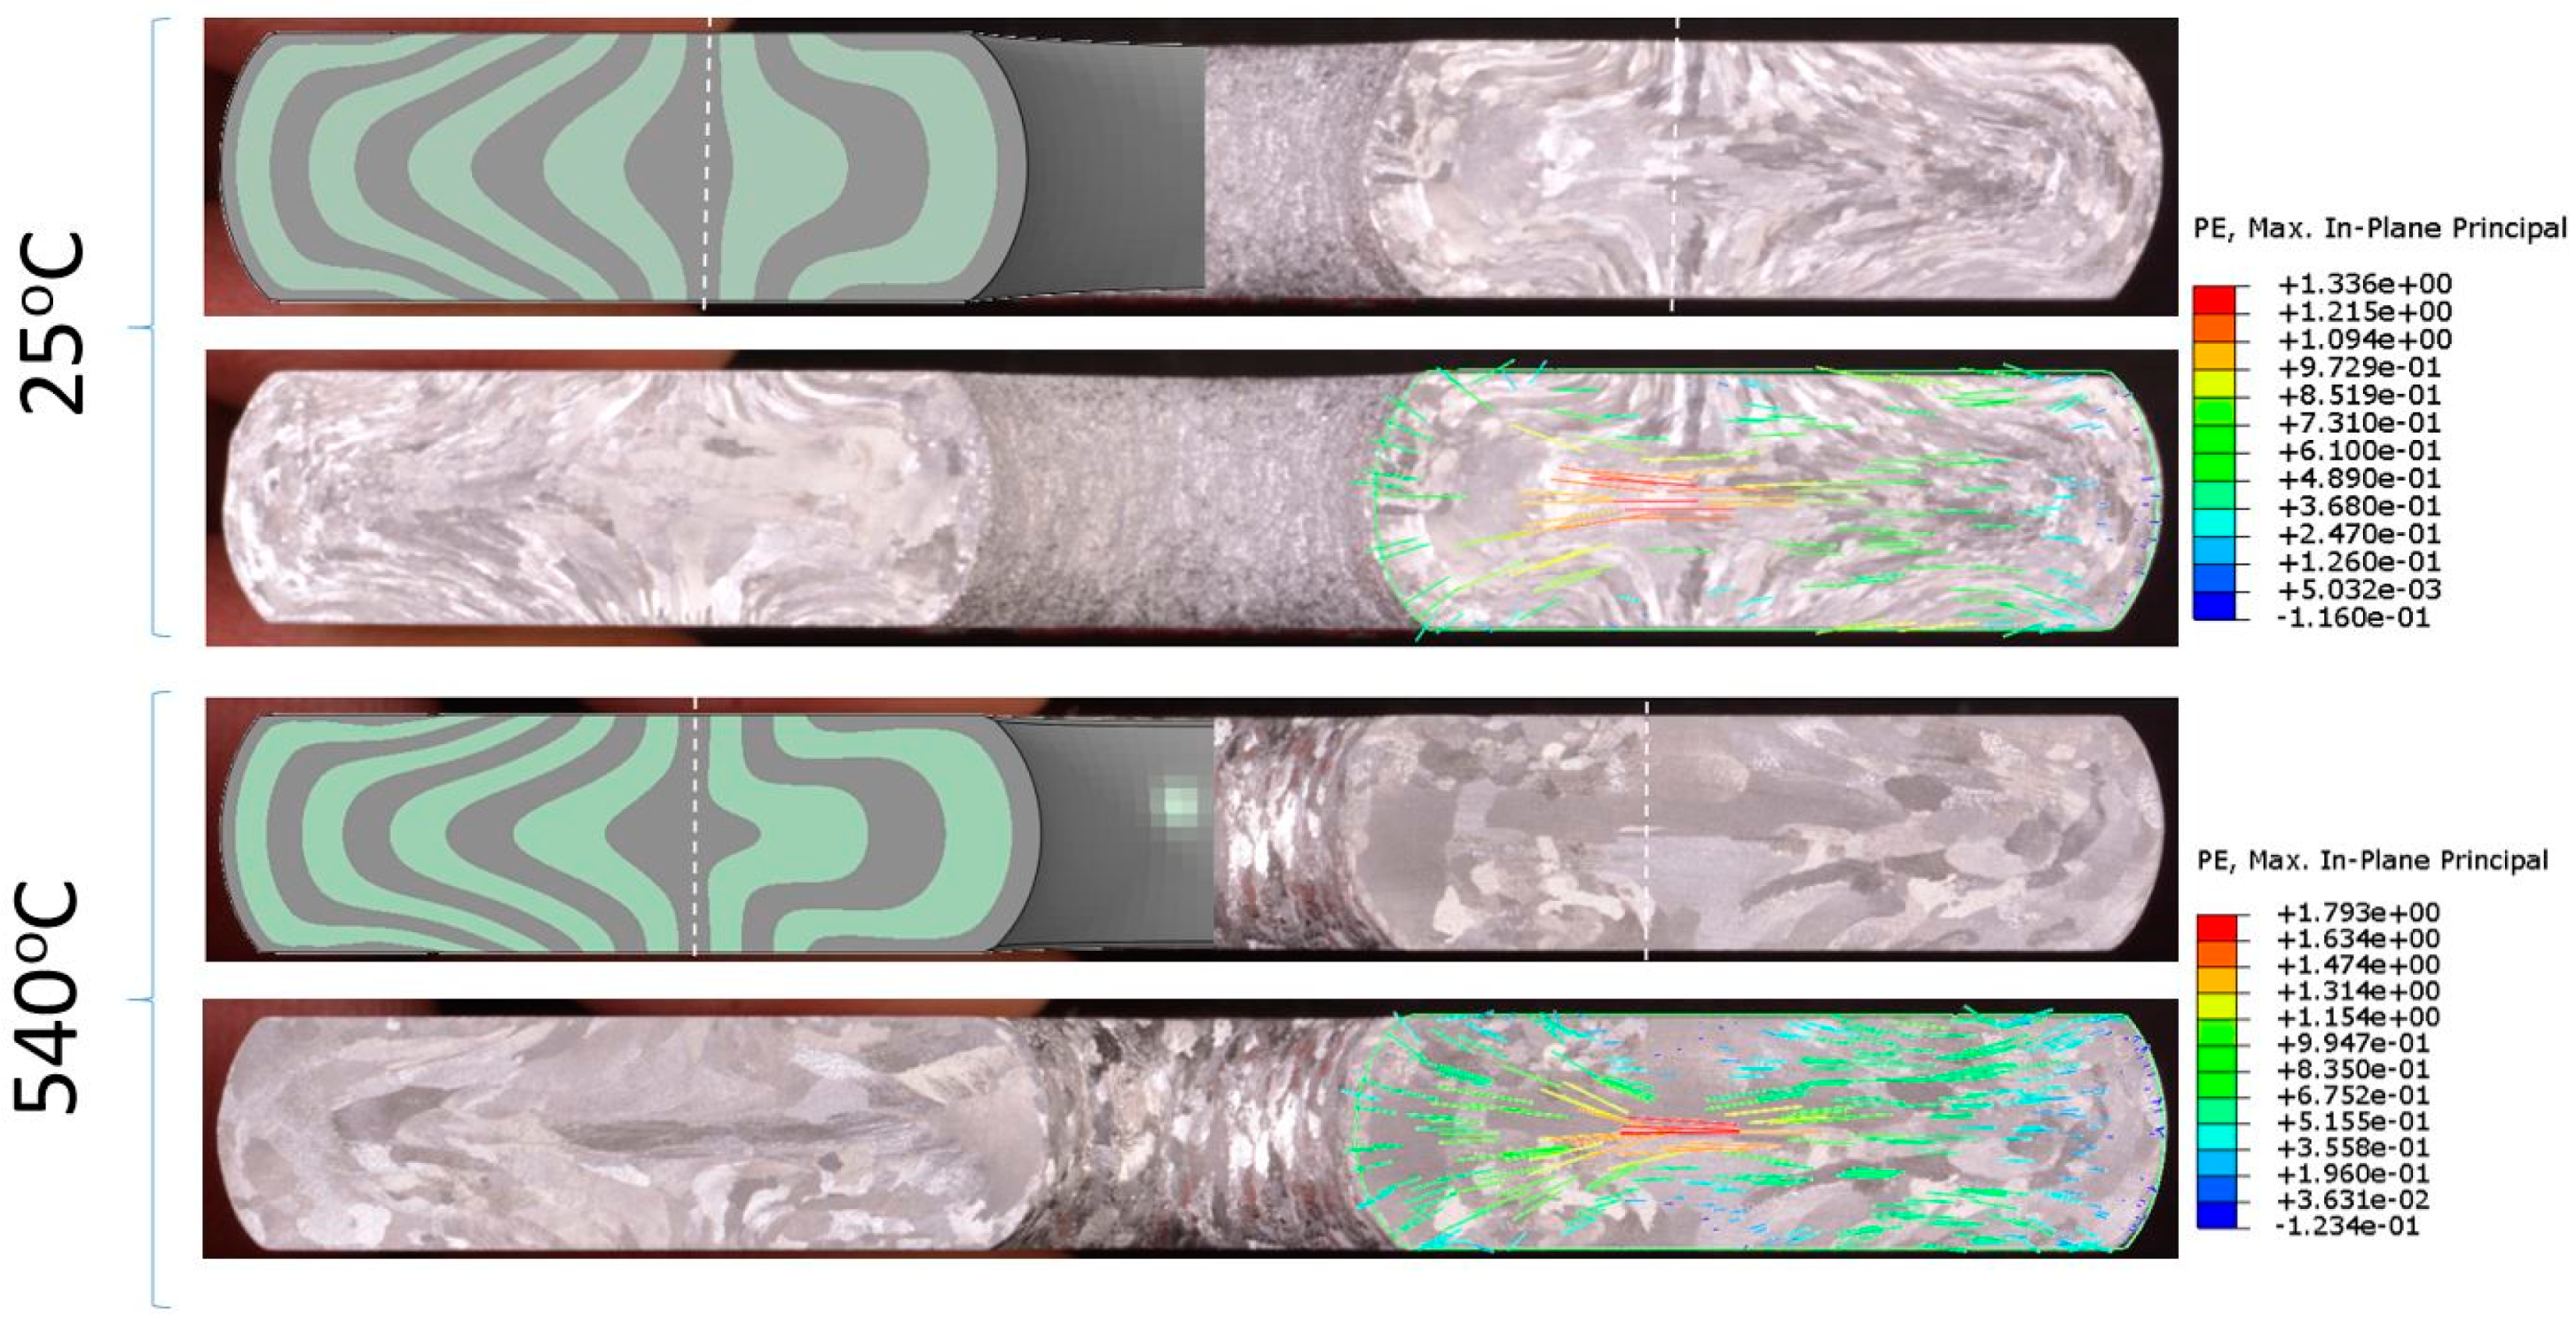
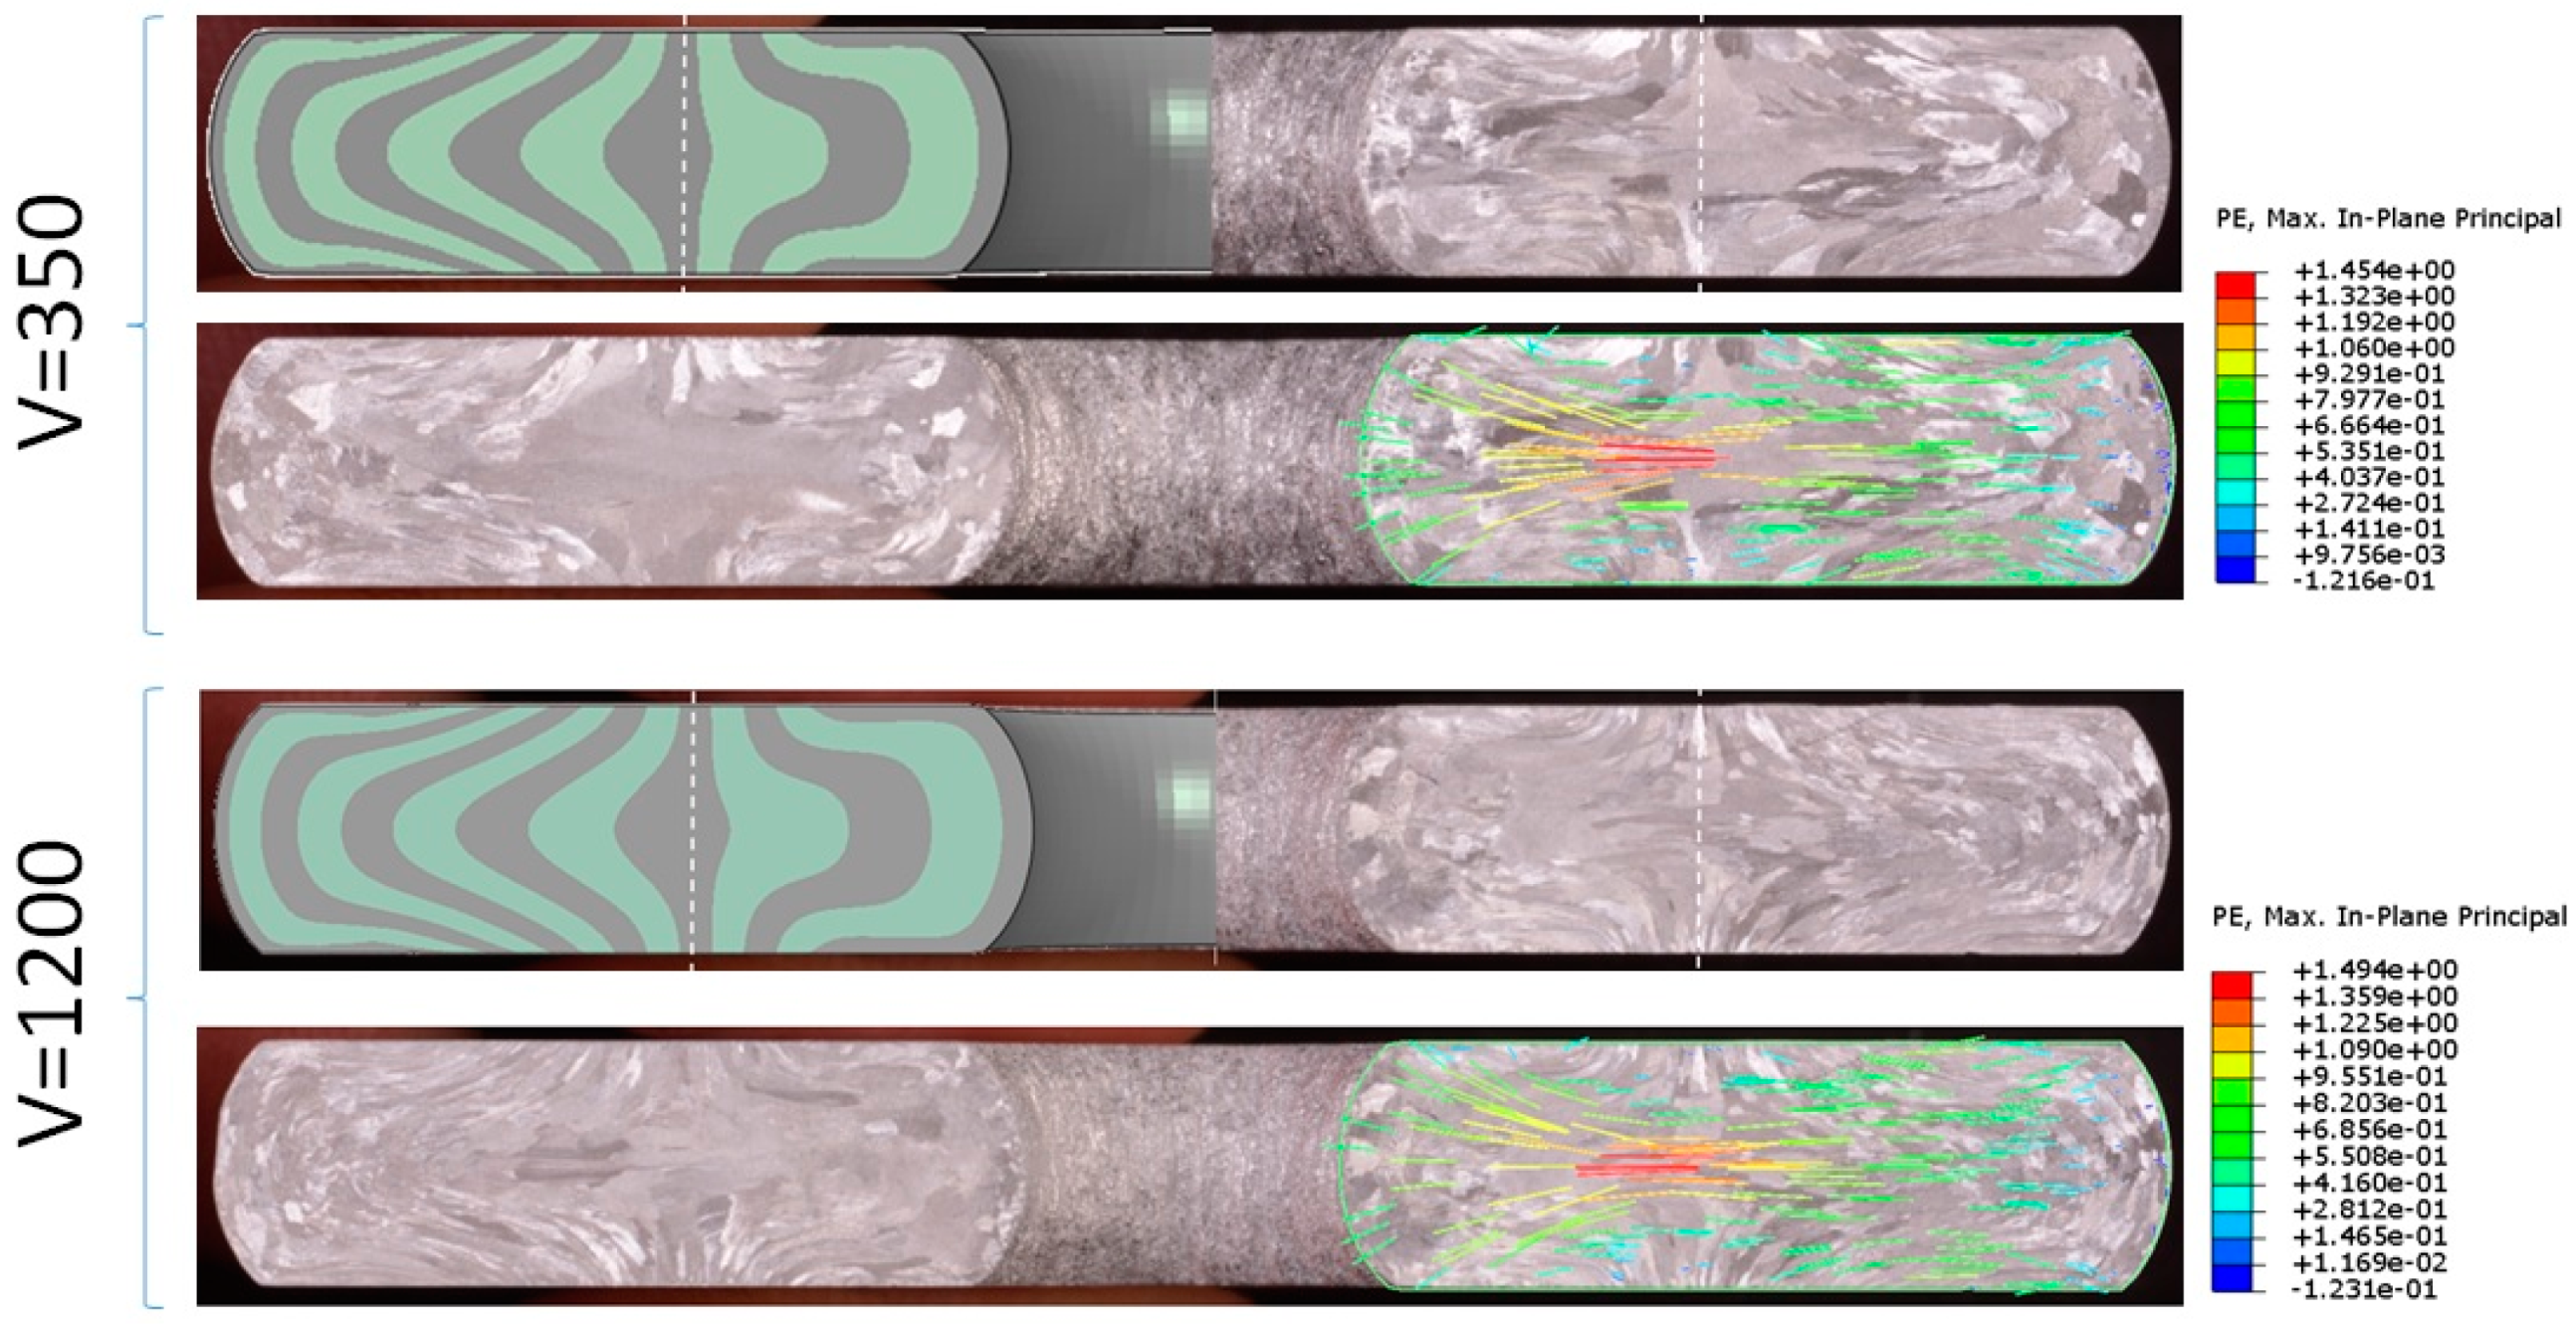
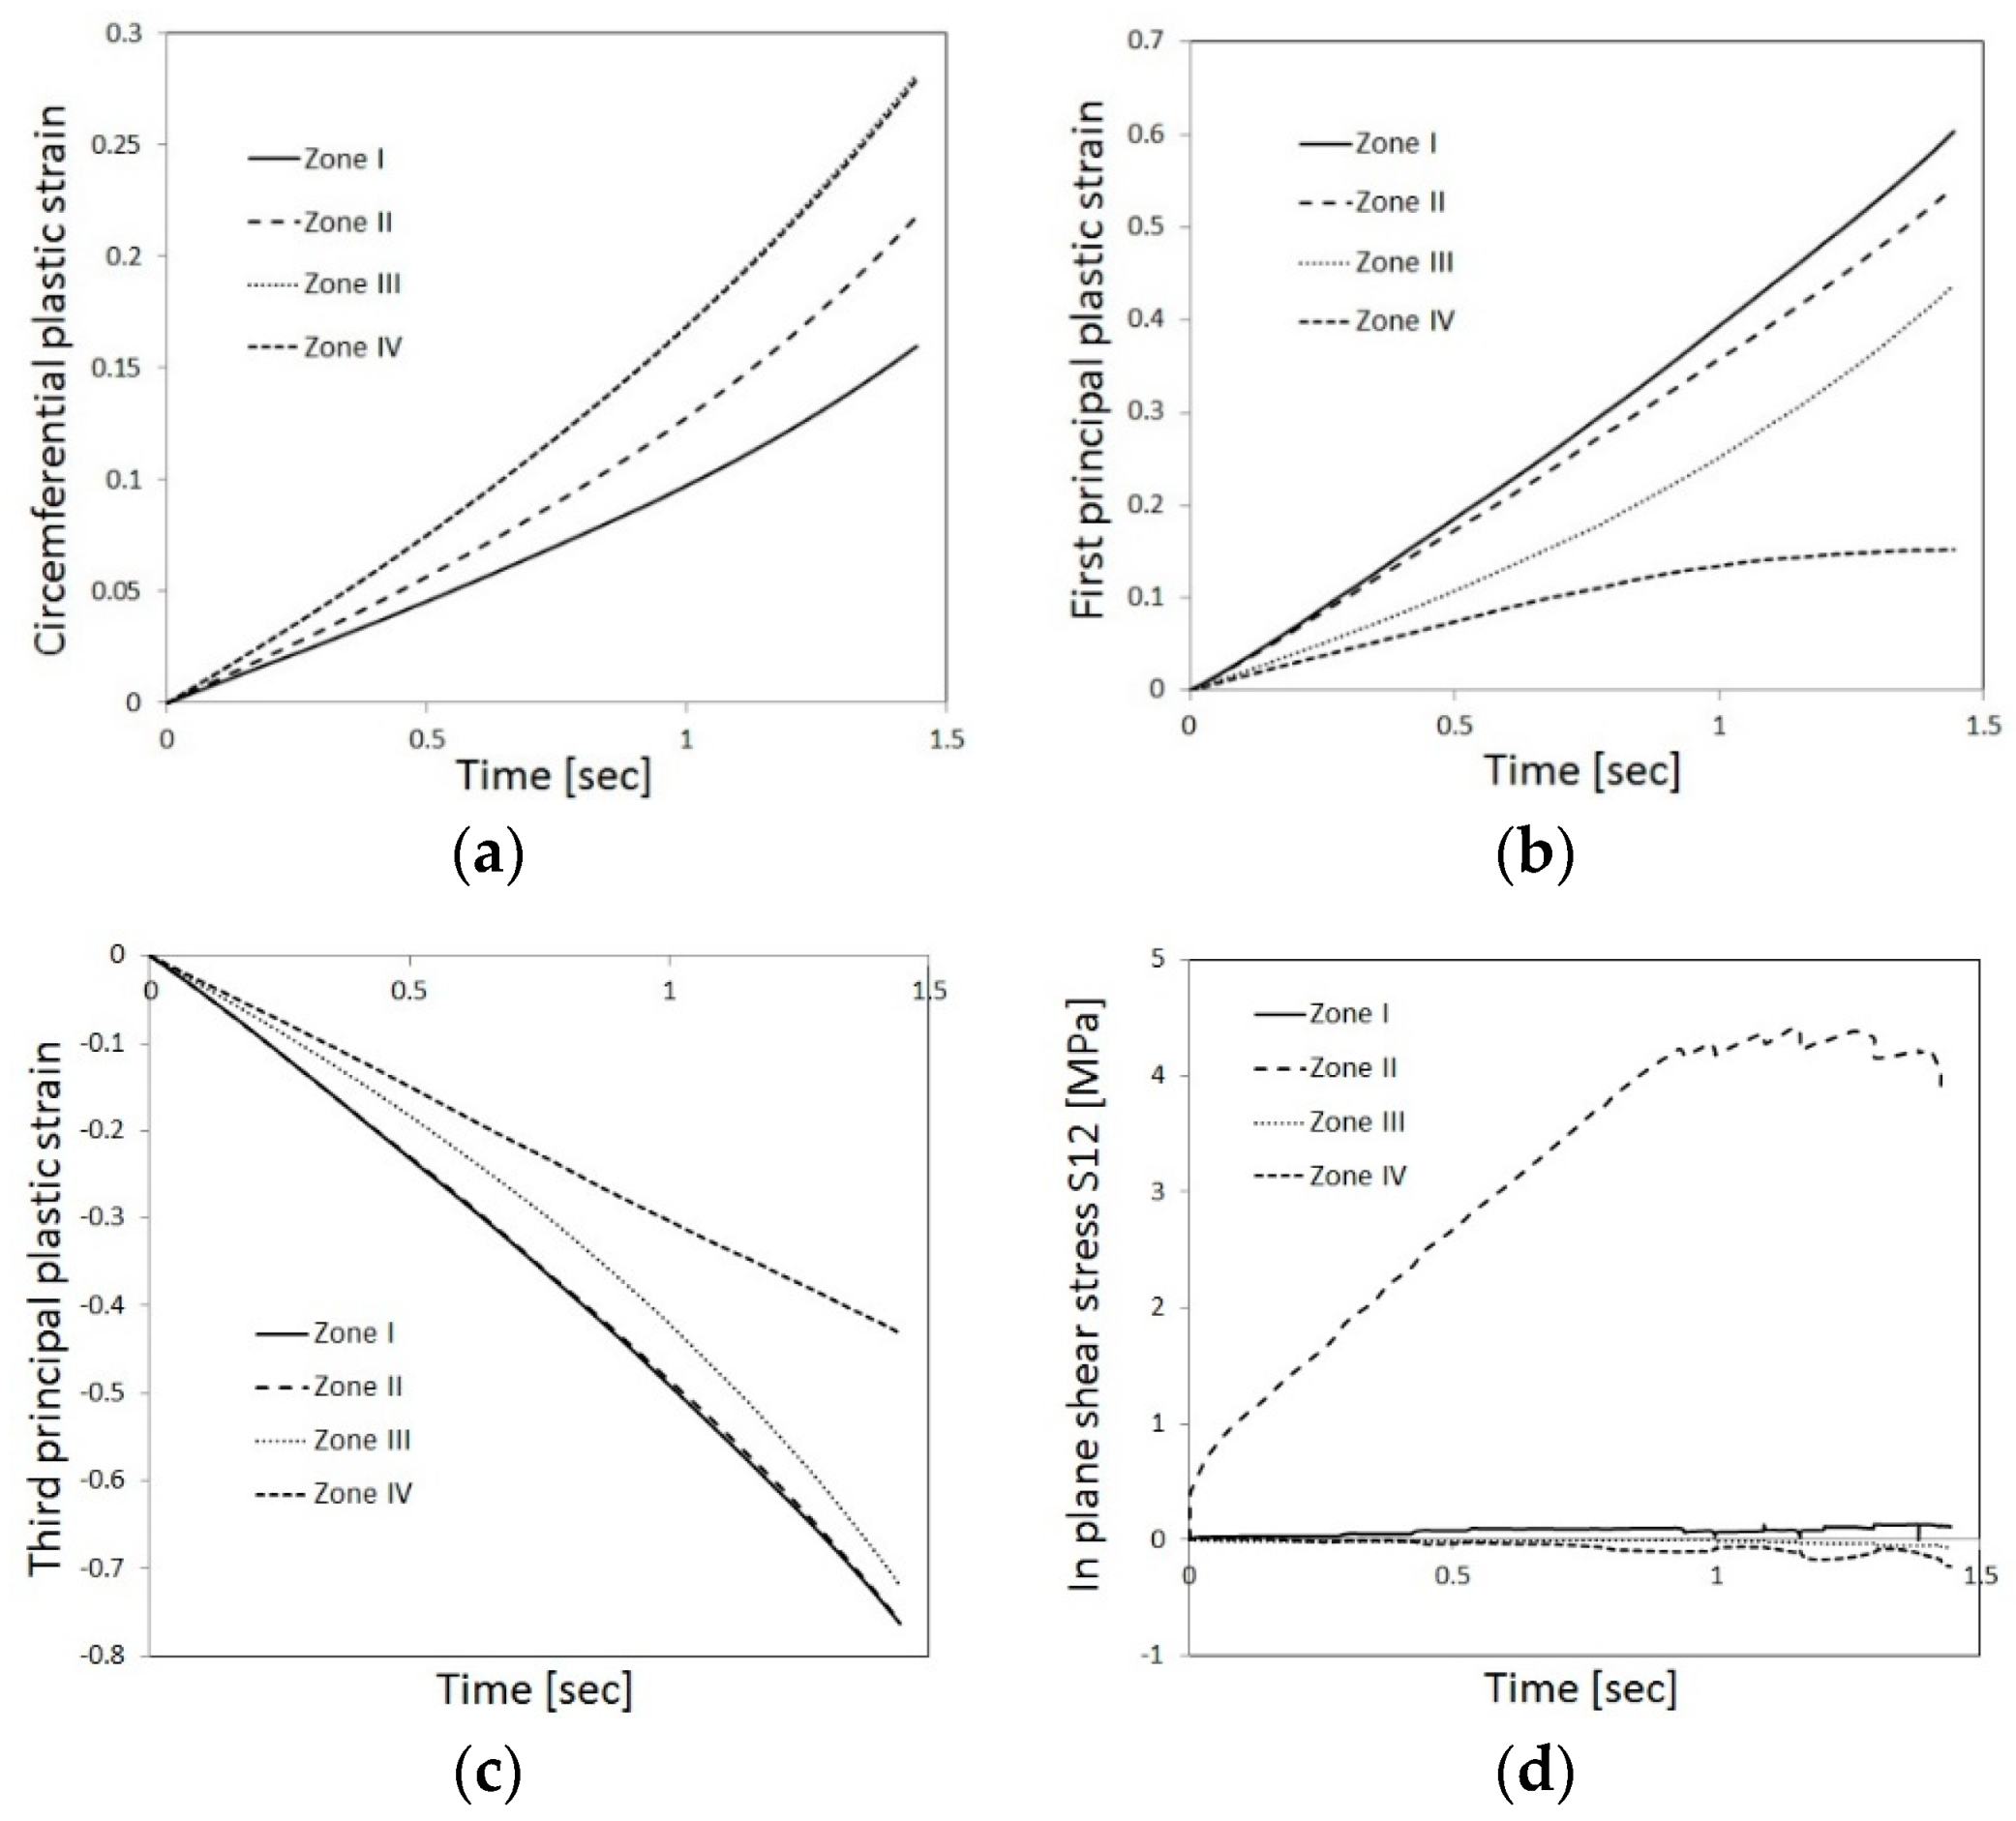
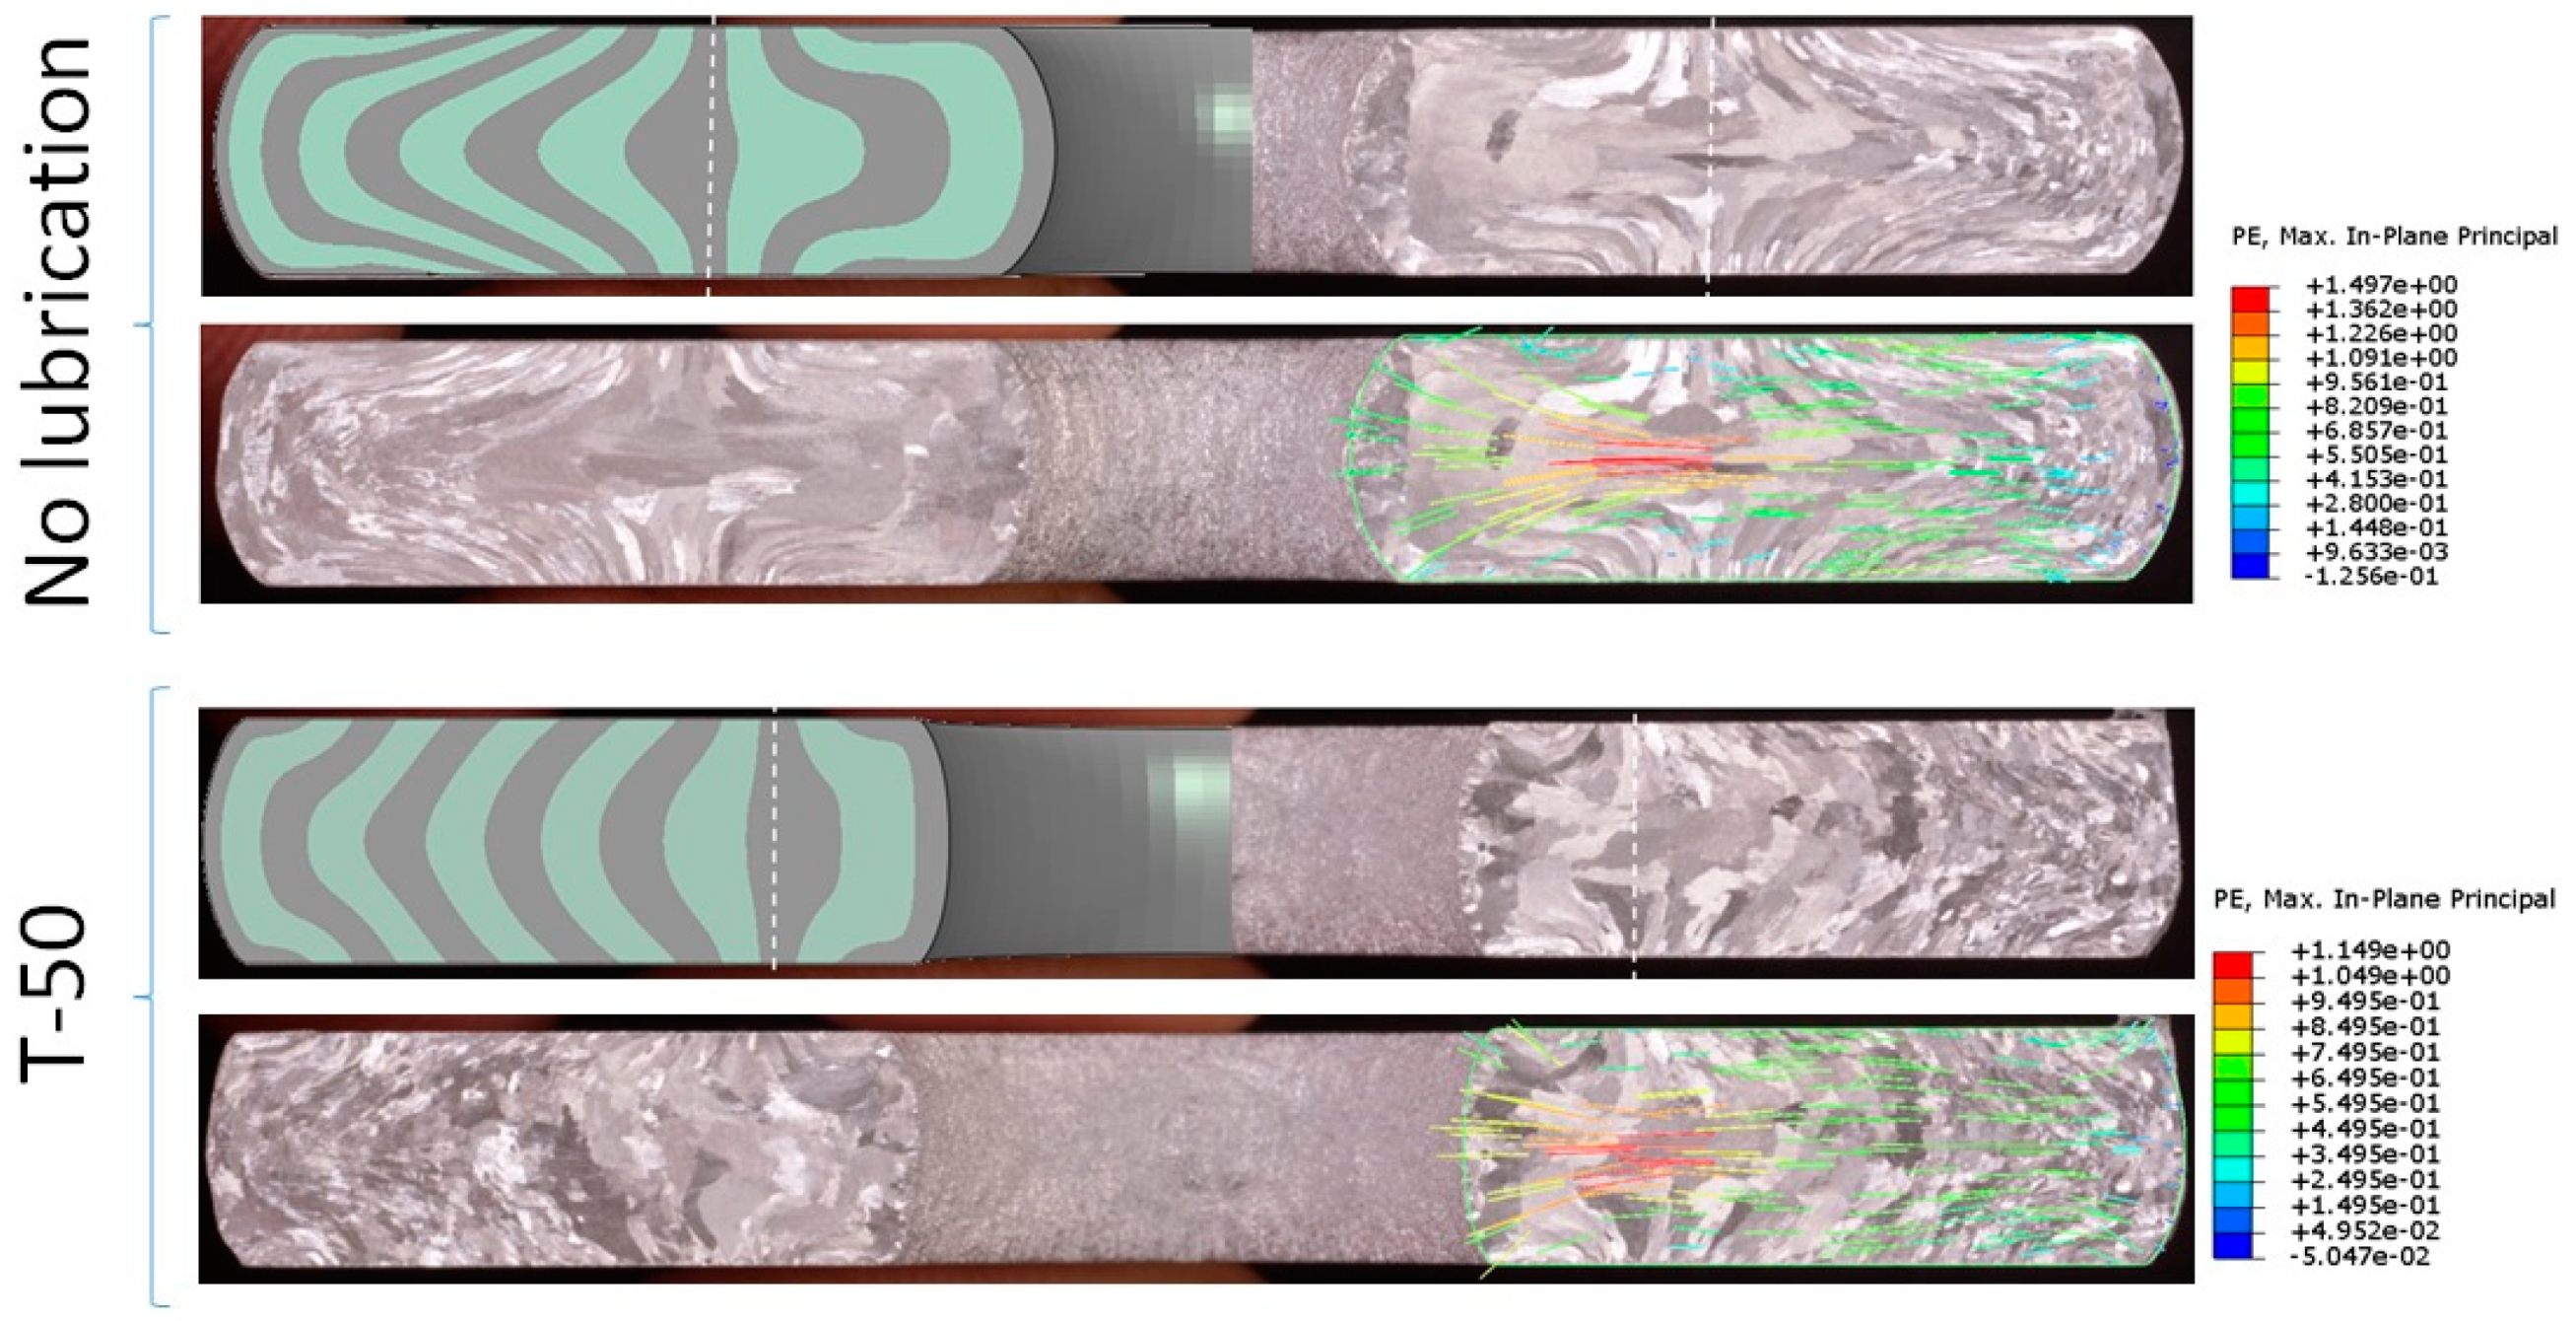
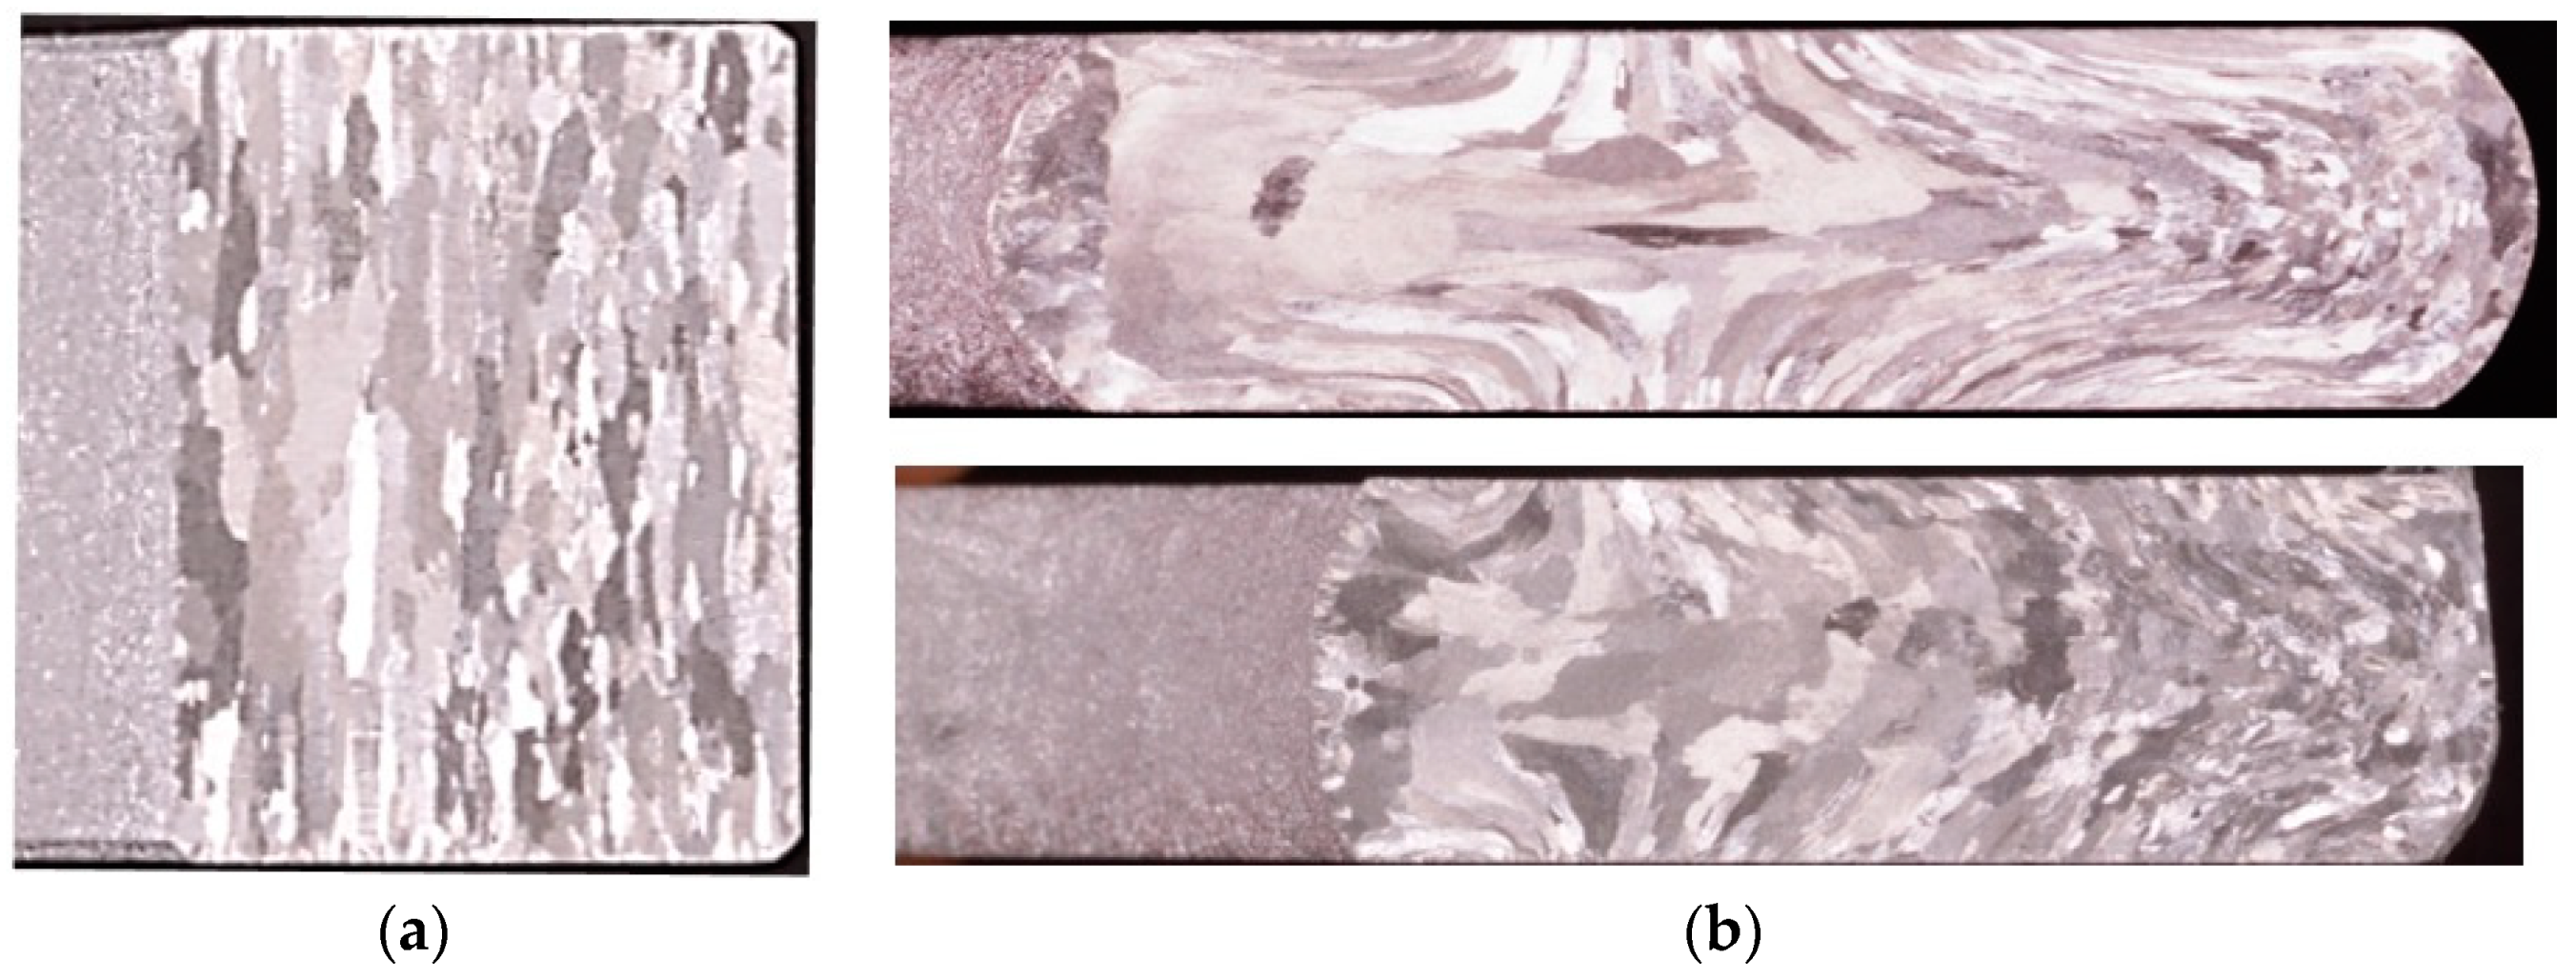
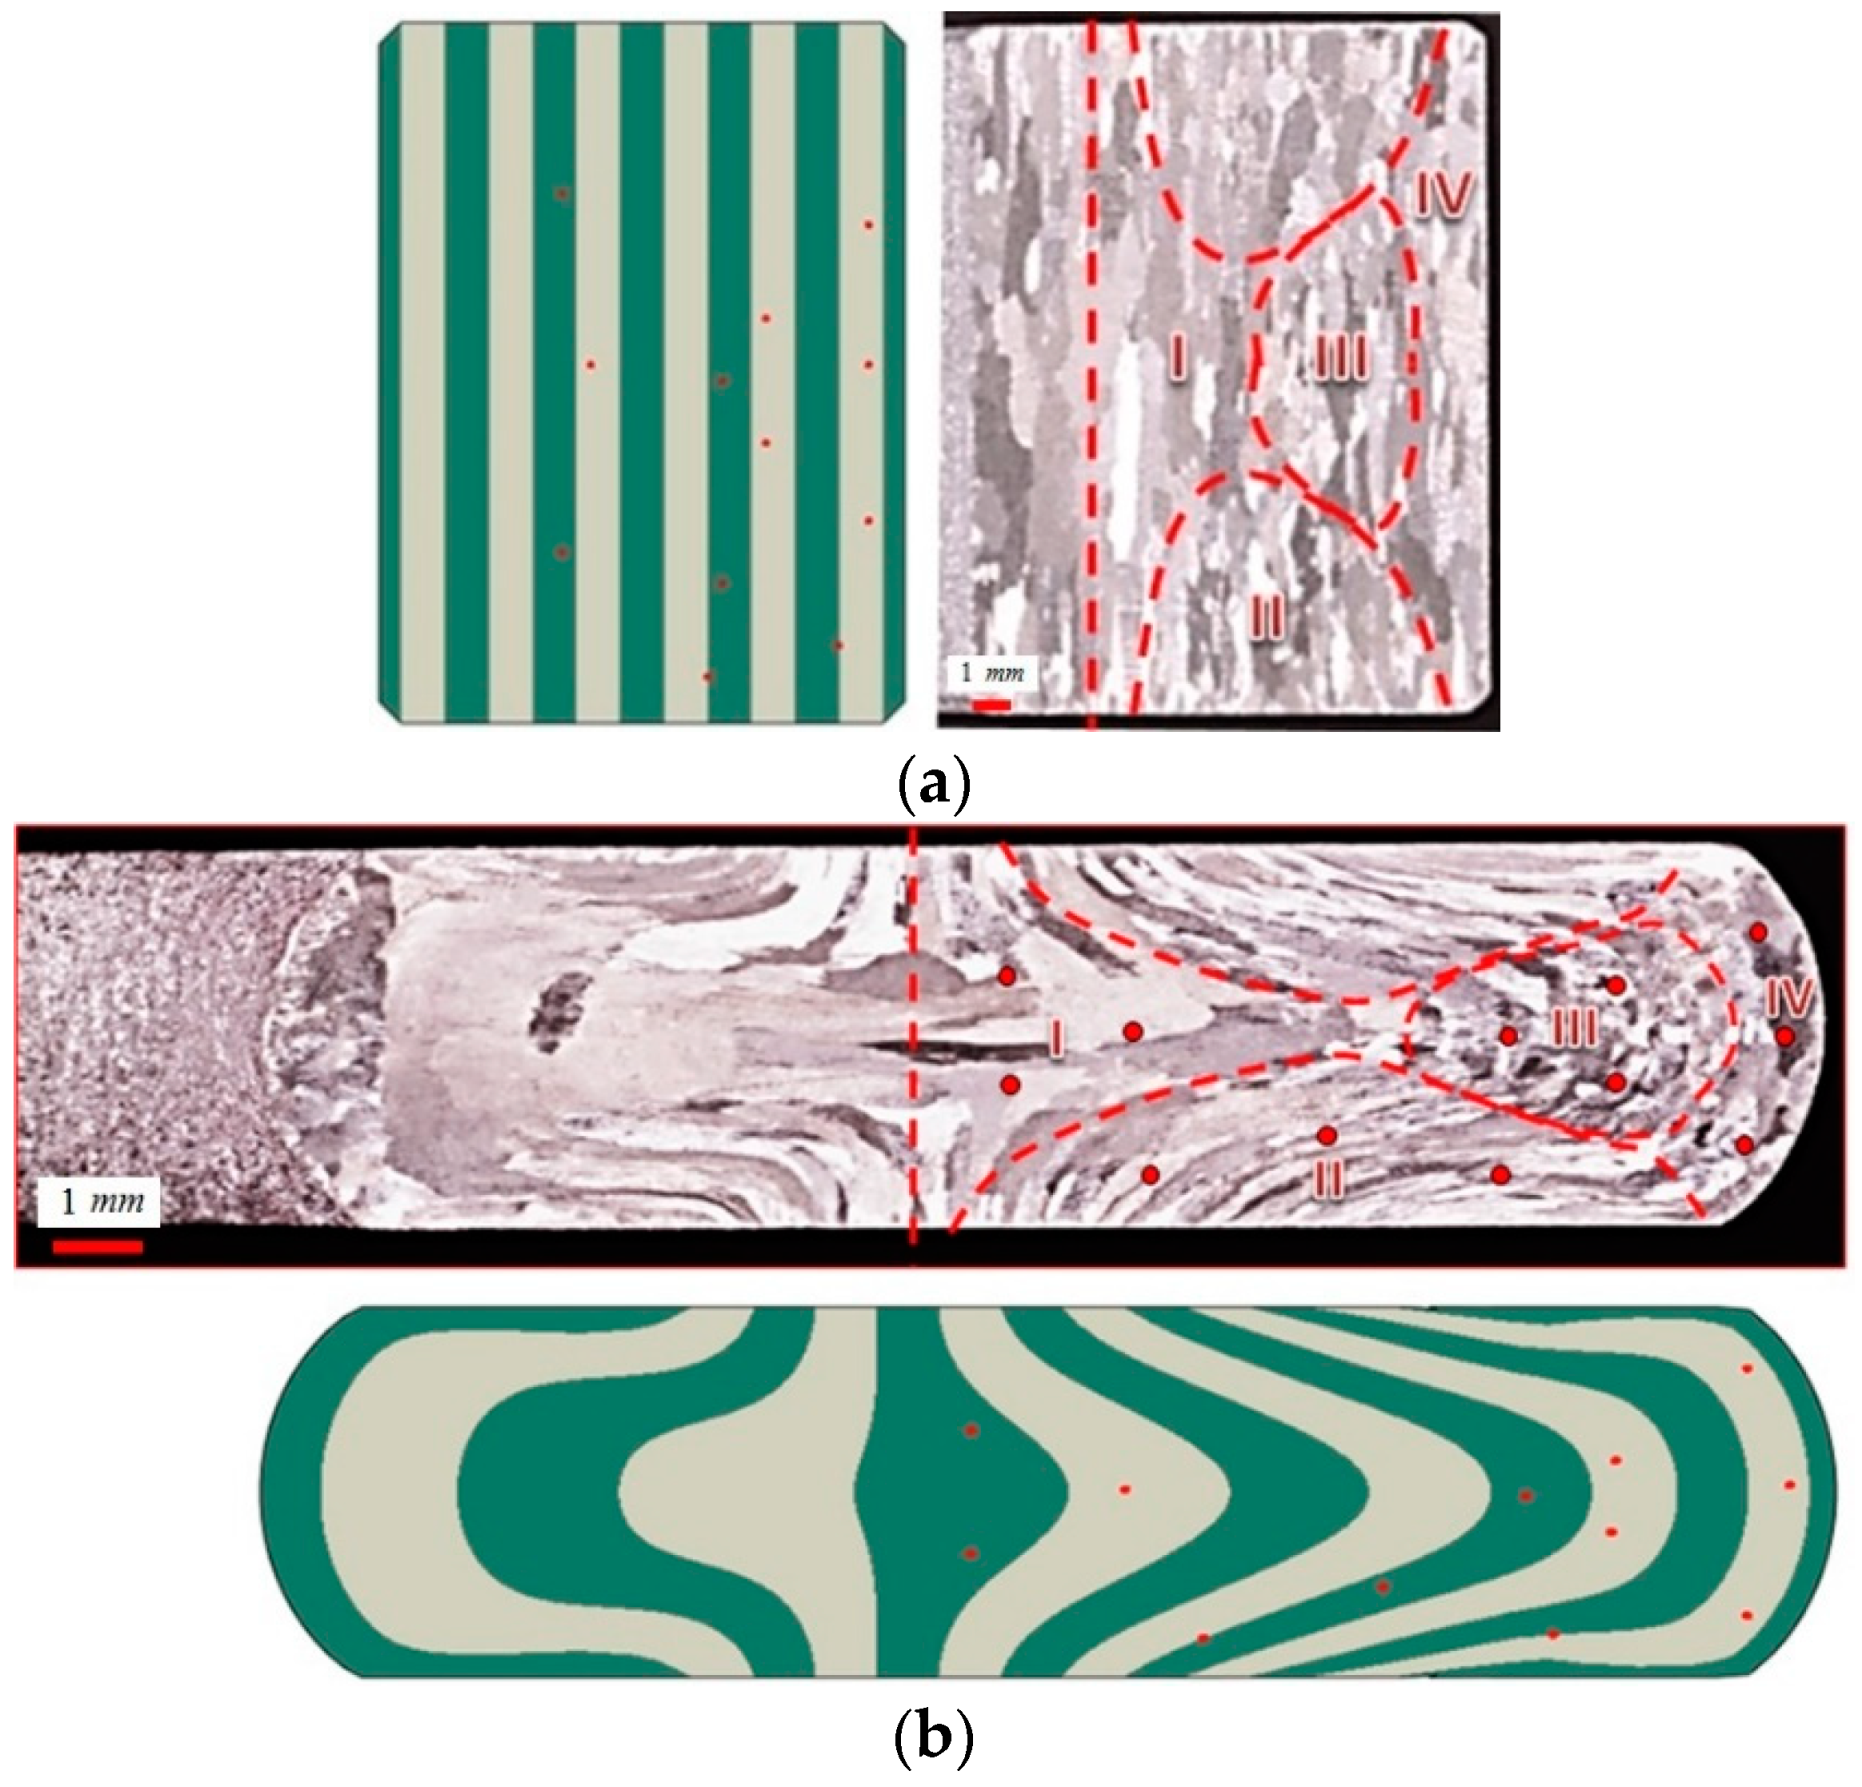
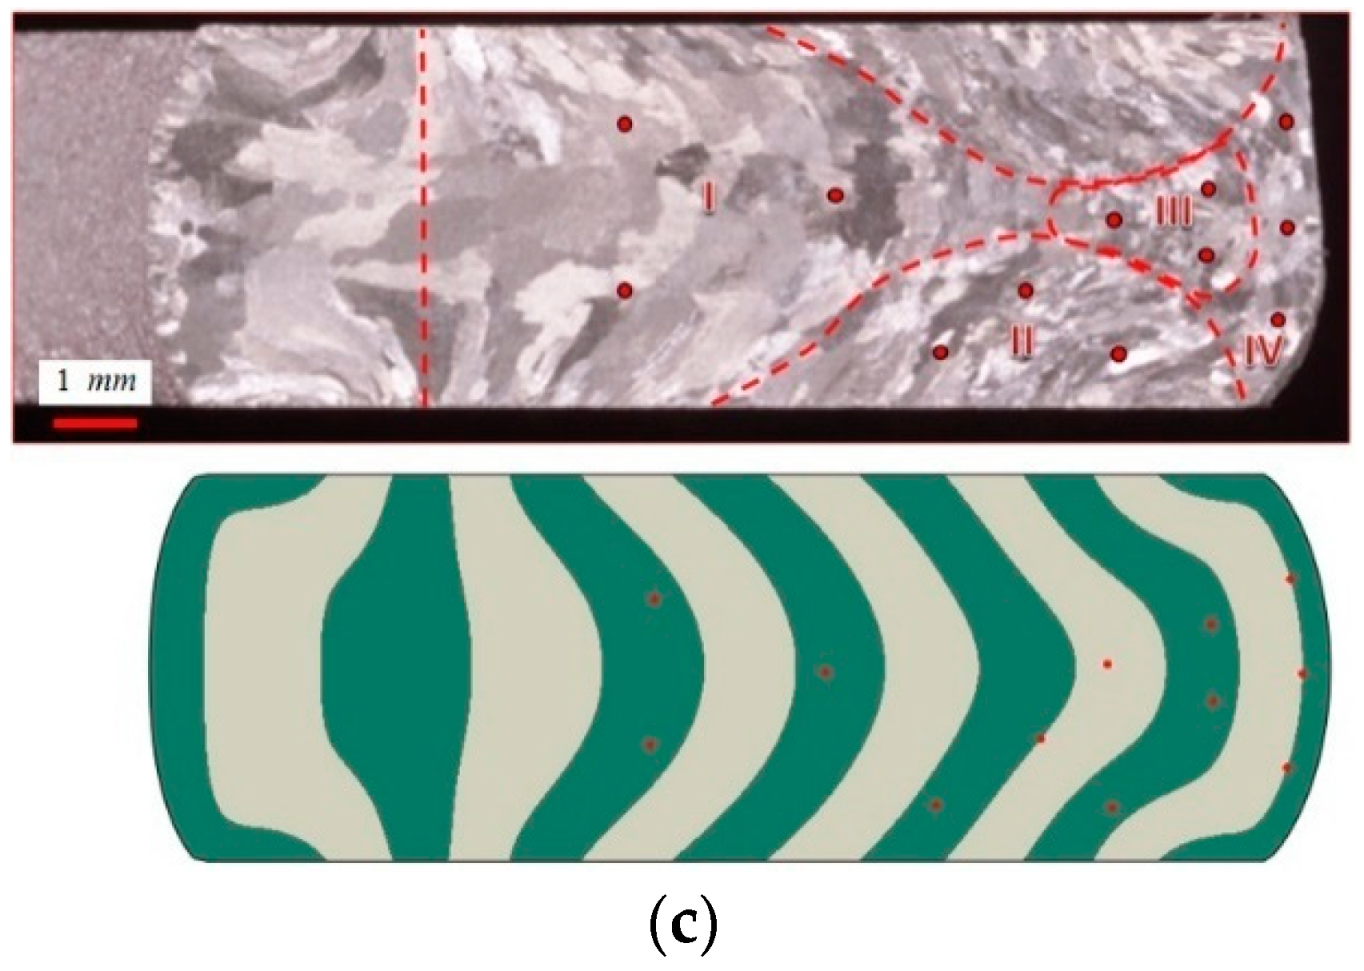
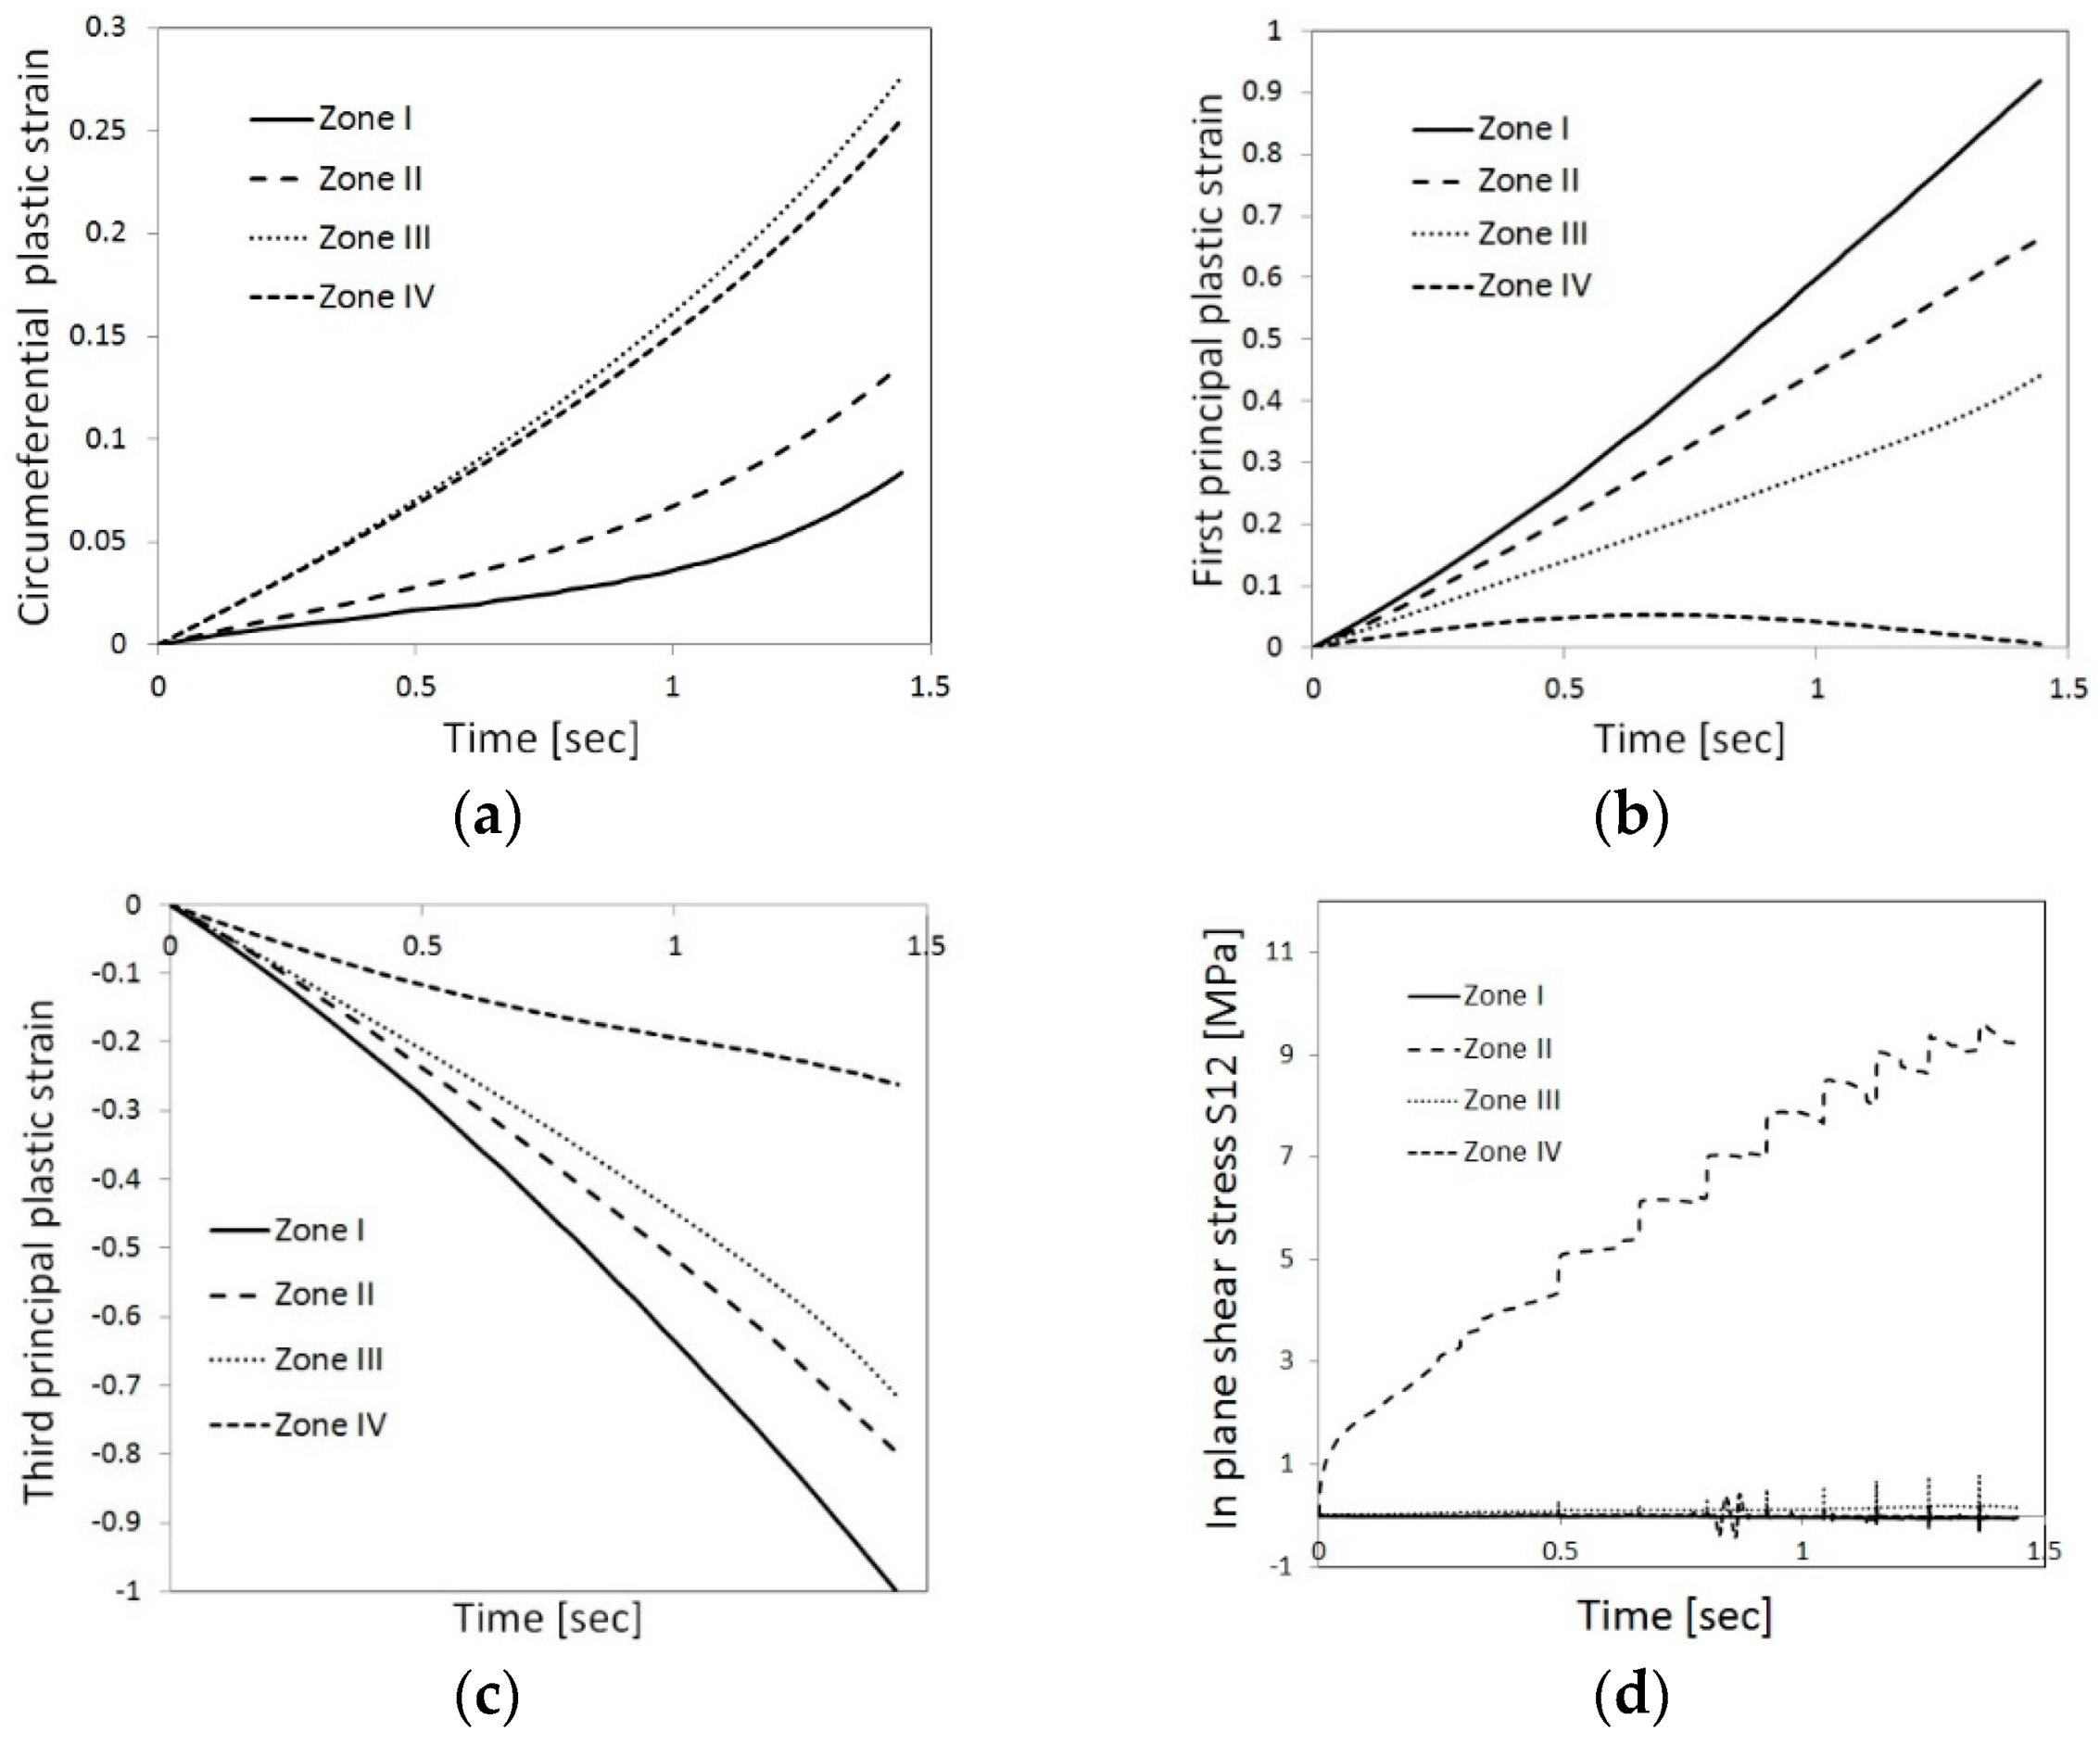
5. Relation Between Friction Induced Texture and Thermo-Mechanical Fields

Changes in grain texture during metal forming can induce anisotropy in mechanical properties. Friction can play a critical role in texture evolution, especially in the vicinity of the specimen-tool interface. The FE models were used herein in conjunction with metallographic characterization to investigate how the computed thermo-mechanical fields and friction conditions affect the resulting grain texture. This is demonstrated as an example for the RCTs at 450 °C in Figure 15 and Figure 16. Figure 15 presents a metallographic cross section of a ring before deformation against that of the deformed specimens obtained following compression at 450 °C with (R13) and without (R5) the use of lubrication. The deformed microstructures were divided into four distinct zones, which are characterized by different grain textures (see Figure 16). The respective zones before deformation are also marked on the pre-deformed cross-section. In each zone, three representative nodes were chosen from which thermo-mechanical field values were extracted (also shown in Figure 16).
As Figure 17 and Figure 18 show, high values of average maximum and minimum principal plastic strain, which are oriented in the radial and axial directions, respectively, develop in the deformed zone, I, for both R5 and R13. This zone is characterized by elongated grains oriented in the radial direction (Figure 16). The direction and values of the principal plastic strains in this region are therefore in accordance with the observed texture.
In both R5 and R13, the circumferential plastic strain, which develops in zone I, is minimal. On the other hand, the computed circumferential plastic strains are high in zone III (in both R5 and R13). Zone III is characterized by, what appear to be, small grains. Since aluminium has a high stacking fault energy, dynamic recrystallization processes do not occur even at hot forming conditions (see [13]). This is also evident from the shape of the flow stress curves obtained in this study (Figure 7), which indicate dynamic recovery processes at high temperatures. Another possible mechanism for changes in grain size is static recrystallization, which can occur at regions in which high plastic strains develop during the process (during the cooling stage of the specimen in air under natural convection conditions, as it requires thermal energy). The highest equivalent plastic strain values develop, in all cases, at the mid-height of the neutral radius. Nevertheless, it is evident from metallographic cross-sections (see Figure 12, Figure 13 and Figure 14) that no static recrystallization occurred following the upsetting tests, as those areas are characterized by elongated grains. This implies that the small cross section of the grains in zone III is the result of their elongation in the circumferential direction. The computed results for zone II demonstrate large axial plastic strain as well as high values of in-plane shear stress, which may explain the curved elongated grain texture that is observed in that region. It can also be observed that the curvature of the texture in zone II is less pronounced for specimen R5 than for specimen R13. This is in accordance with the differences in computed shear stress values, which are higher for specimen R13. In general, it is demonstrated that a good correlation is observed between the texture and the computed strain and stress fields. It should be noted that these correlations do not hold if the specimen undergoes subsequent heat treatment, which may lead to static recrystallization processes. Accumulation of local plastic strains (commonly associated with dislocation density) is known to serve as a driving force for local static recrystallization processes. In that case, the analysis of the thermo-mechanical fields presented herein may be utilized to both predict the initial texture conditions prior to the treatment and provide an indication of preferred recrystallization sites within the specimen. This issue will be addressed in future work.

6. Summary and Conclusions

In this study, the friction conditions in hot metal forming of Al1050 were investigated under different temperatures, loading rates, and lubrication conditions. The flow stress curves and the friction coefficient, μ, associated with different experimental parameters for Al1050 were obtained using FE computations in conjunction with open die upsetting experiments.
It was shown that for every set of experimental parameters, the flow stress relation and μ need to be matched for the cylinder and ring specimens simultaneously. When comparing the results of the numerical simulation to metallographic specimens, the plastic flow pattern across the ring for different friction conditions are predicted well by the FE models.
For no lubrication conditions, the friction coefficient value obtained at the Al1050-H13 steel interface was μ = 0.4 at room temperature and μ > 0.45 for T ≥ 350 °C. It was computationally demonstrated that for Al1050, the RCTs are no longer sensitive to μ values above 0.45 and are therefore inappropriate for determining high friction values. When using a graphite-based lubricant (T-50), similar values of the friction coefficient were obtained for a wide range of temperatures (0.15 ≤ μ ≤ 0.17 at 25 ≤ T ≤ 450 °C), and an increase in μ was observed at higher temperatures.
In addition, a novel method of validating computed friction values from metallographic characterization was presented, utilizing the location of the neutral radius.
Importantly, the system preparation stage induces a significant deviation from isothermal conditions and therefore a coupled thermo-mechanical simulation is required in order to obtain a better representation, especially of the thermal fields, by the FE model. This is also important for attributing the derived flow stress to a more representative (averaged) temperature of the specimen and to describe, more accurately, the thermo-mechanical fields that develop during the process.
Because aluminum does not undergo dynamic recrystallization, it is possible to correlate between the thermo-mechanical fields and grain texture evolution. In this study, metallographic cross section observations were used to demonstrate the connection between grain texture orientation and curvature and time dependent strain and stress fields.

Author Contributions

Conceptualization, N.U.N.; Formal analysis, B.M. and E.P.; Methodology, B.M., E.P. and N.U.N.; Writing—original draft, B.M.; Writing—review & editing, E.P.

Funding

This research received no external funding.

Acknowledgments

The authors would like to thank Yosi Hadad, David Hai David and Yaniv Zriker from the NRCN for their assistance in performing the experiments.

Conflicts of Interest

The authors declare no conflict of interest.

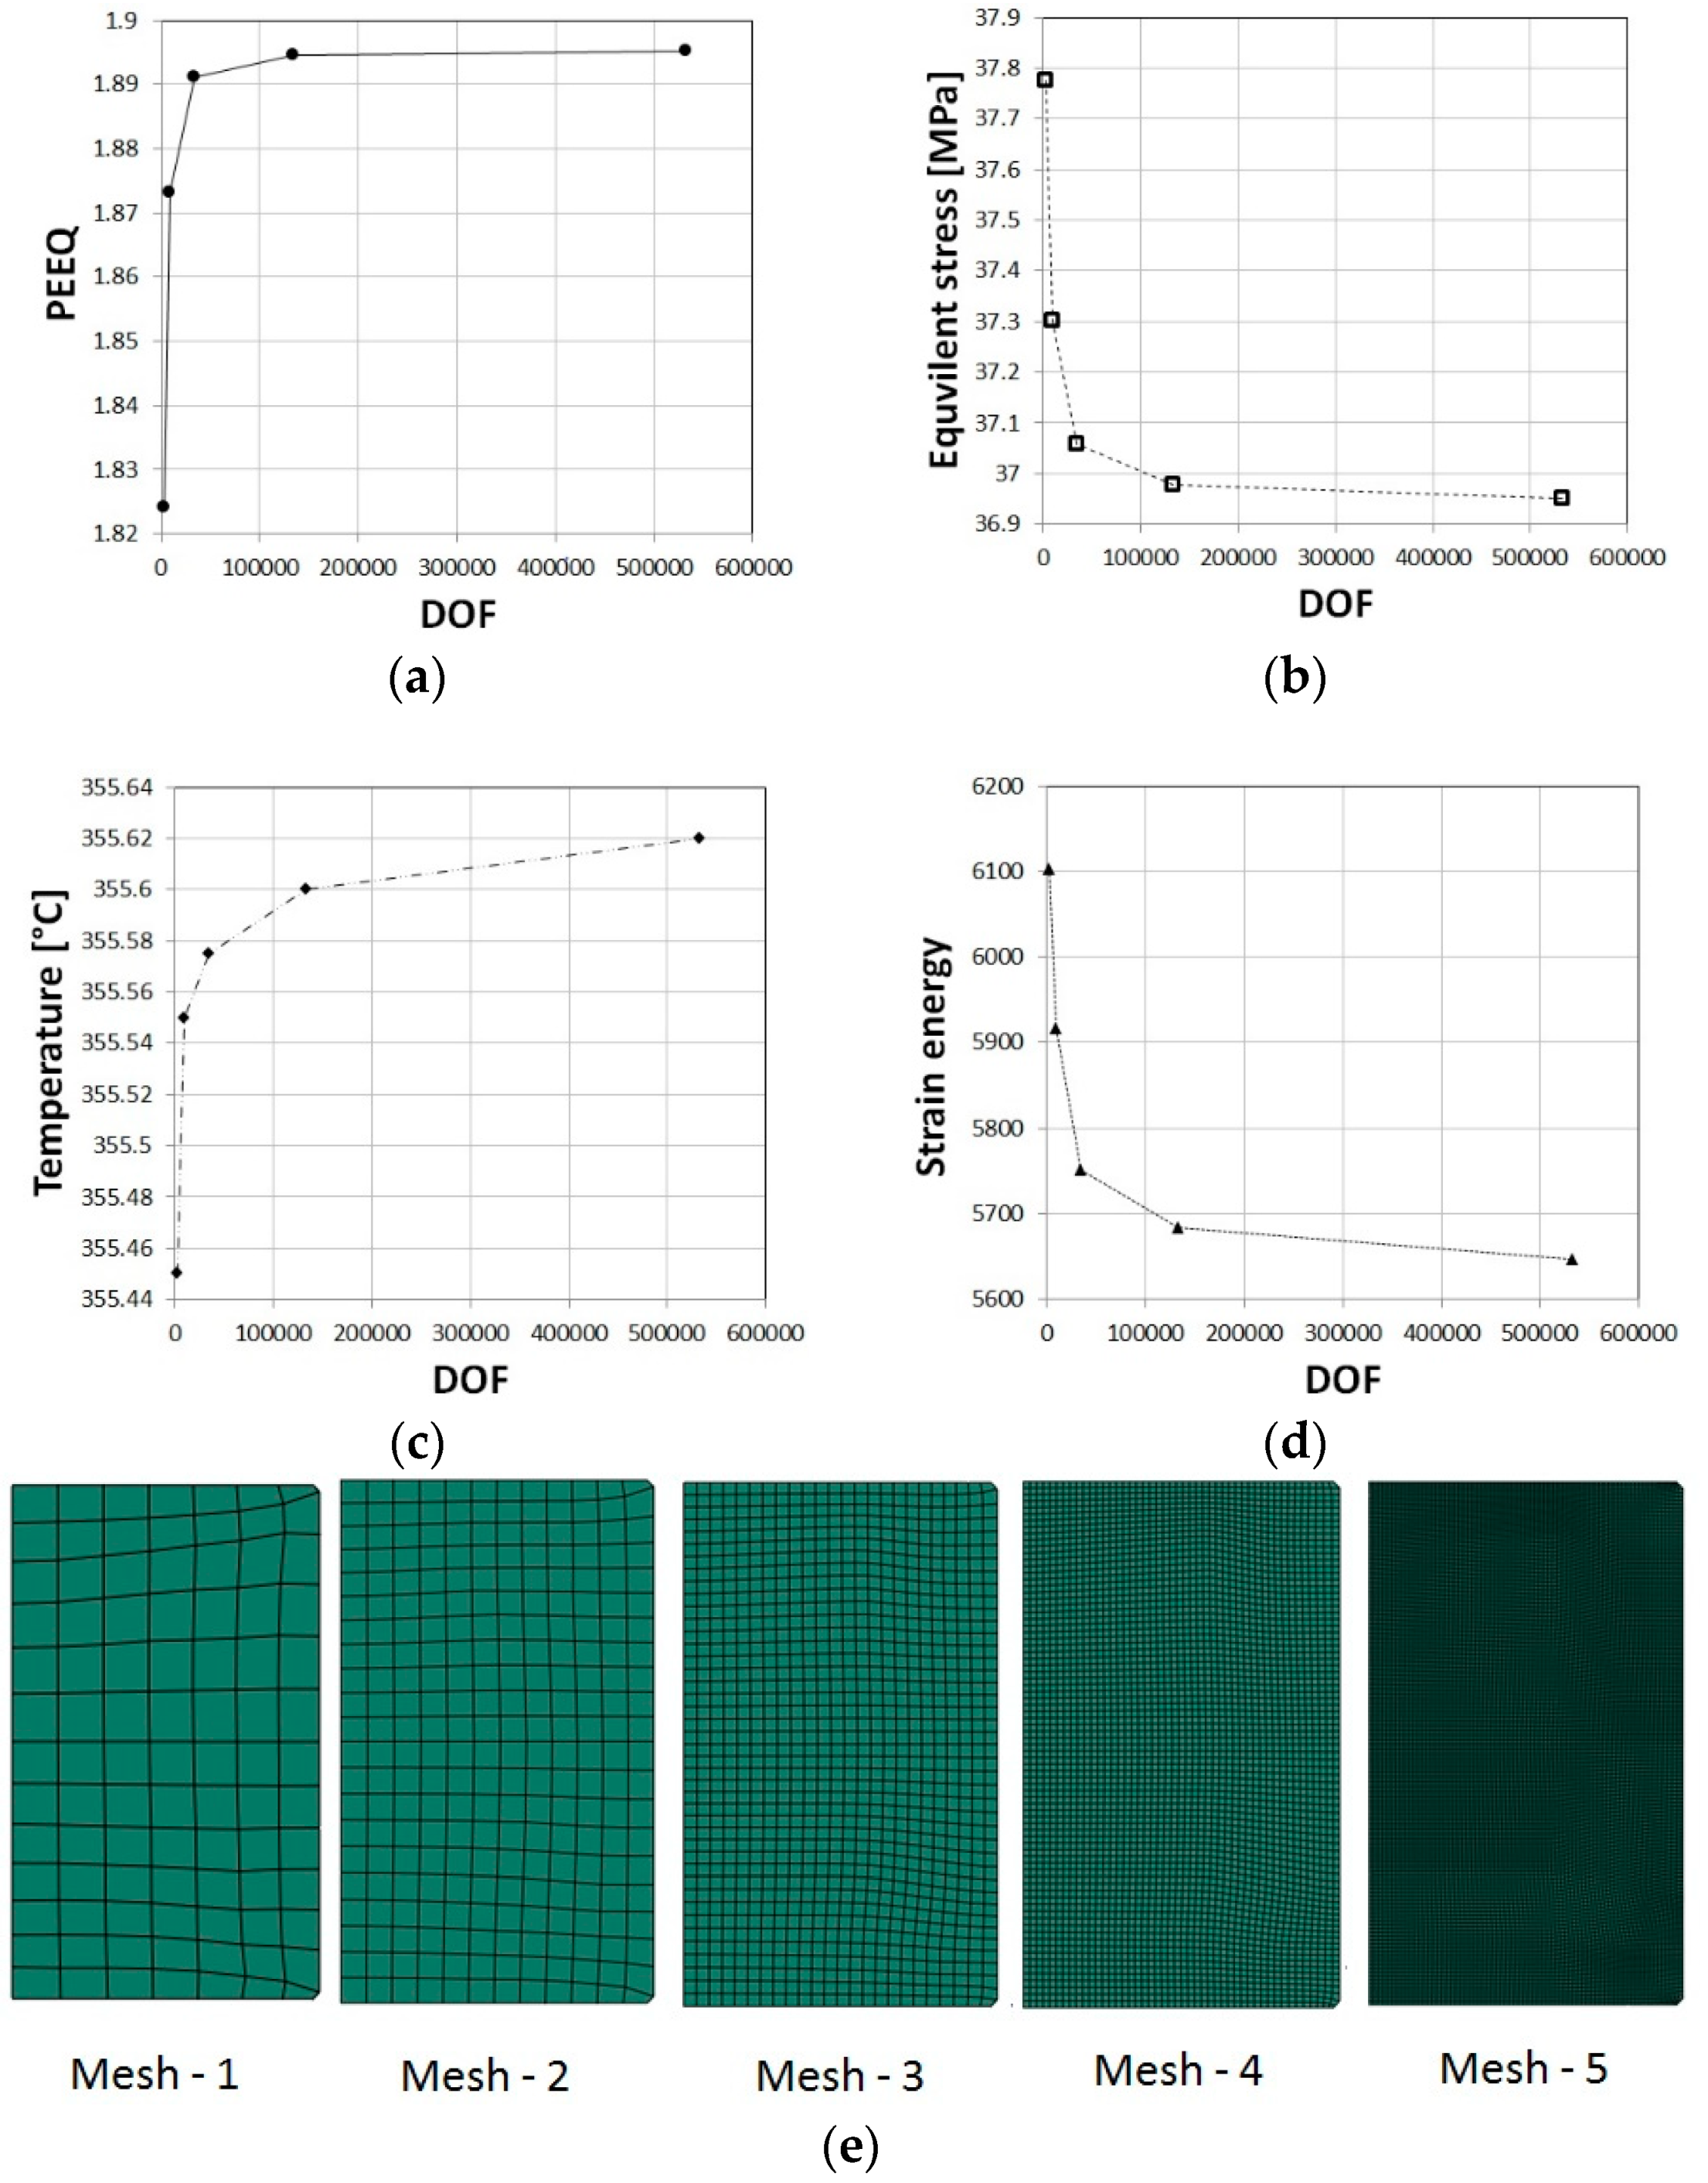
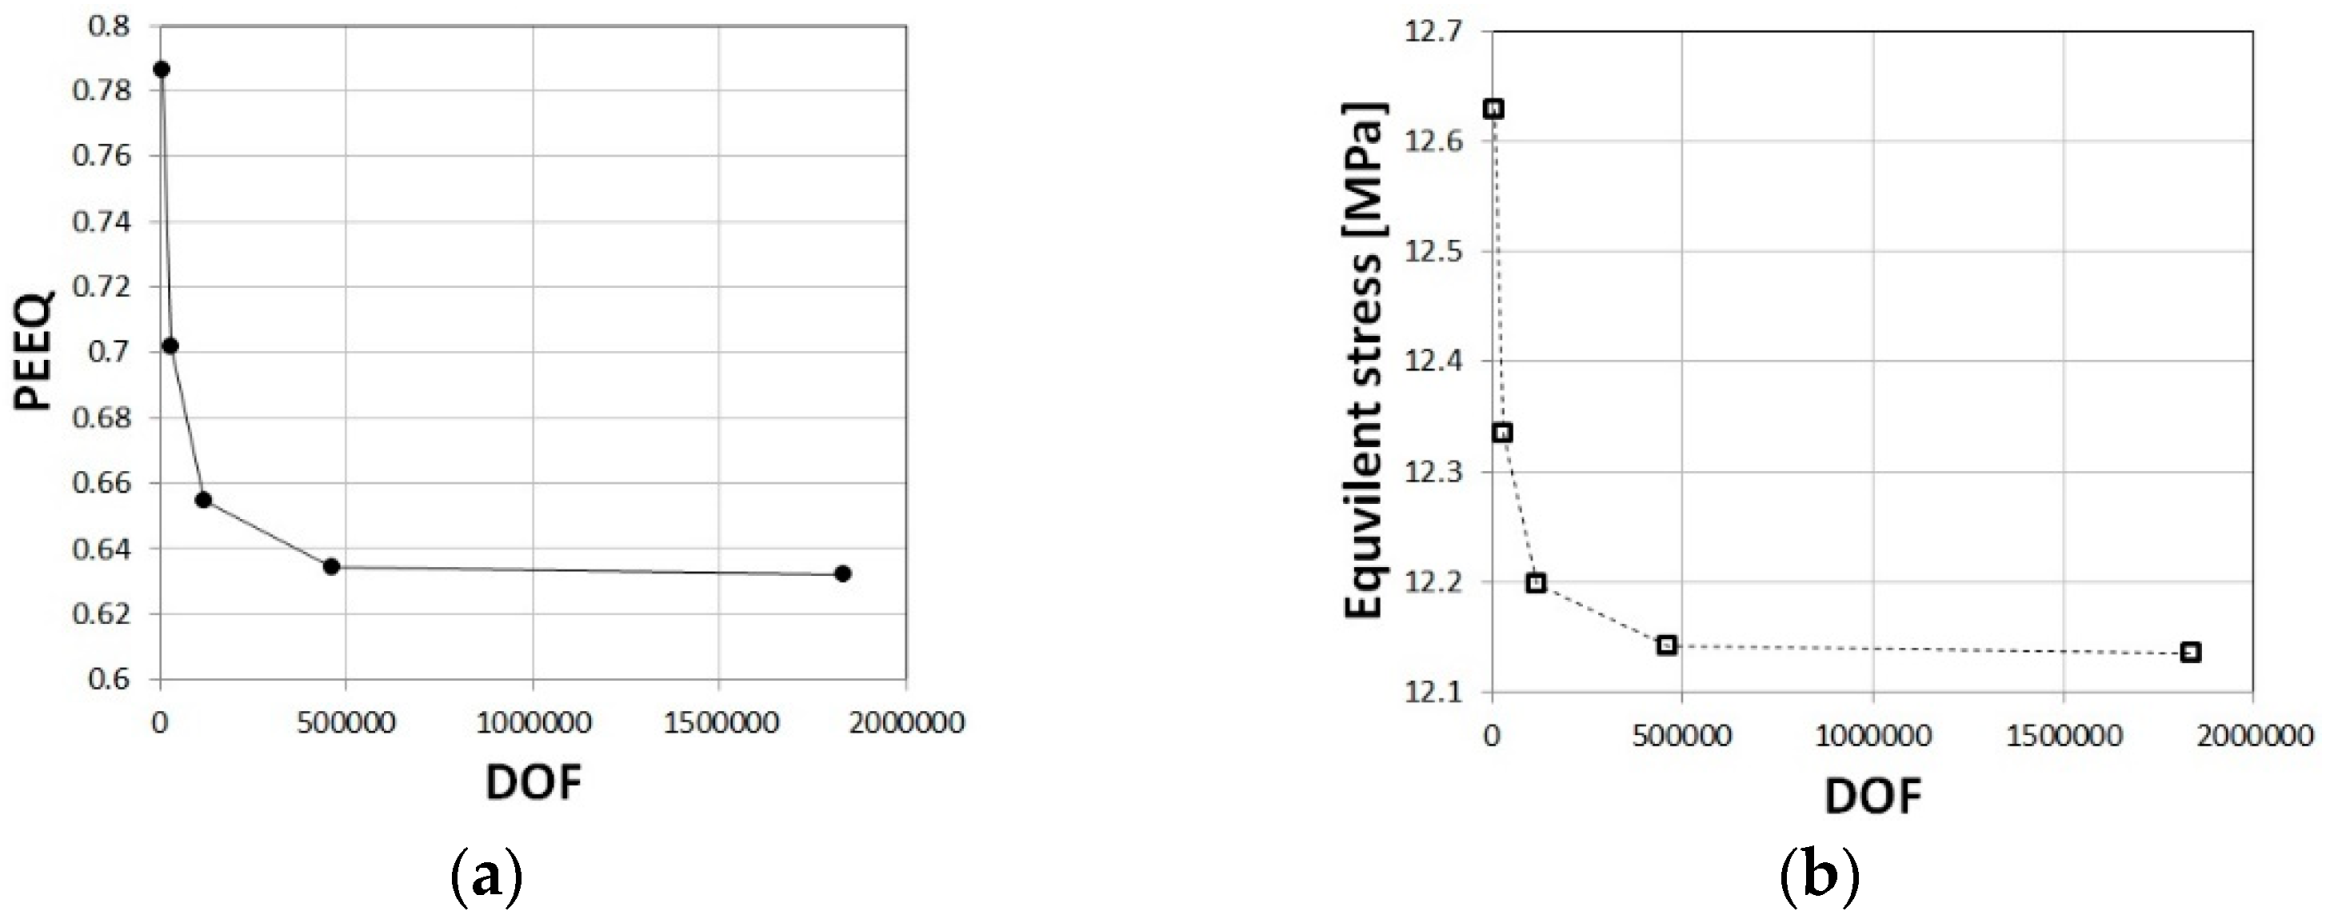
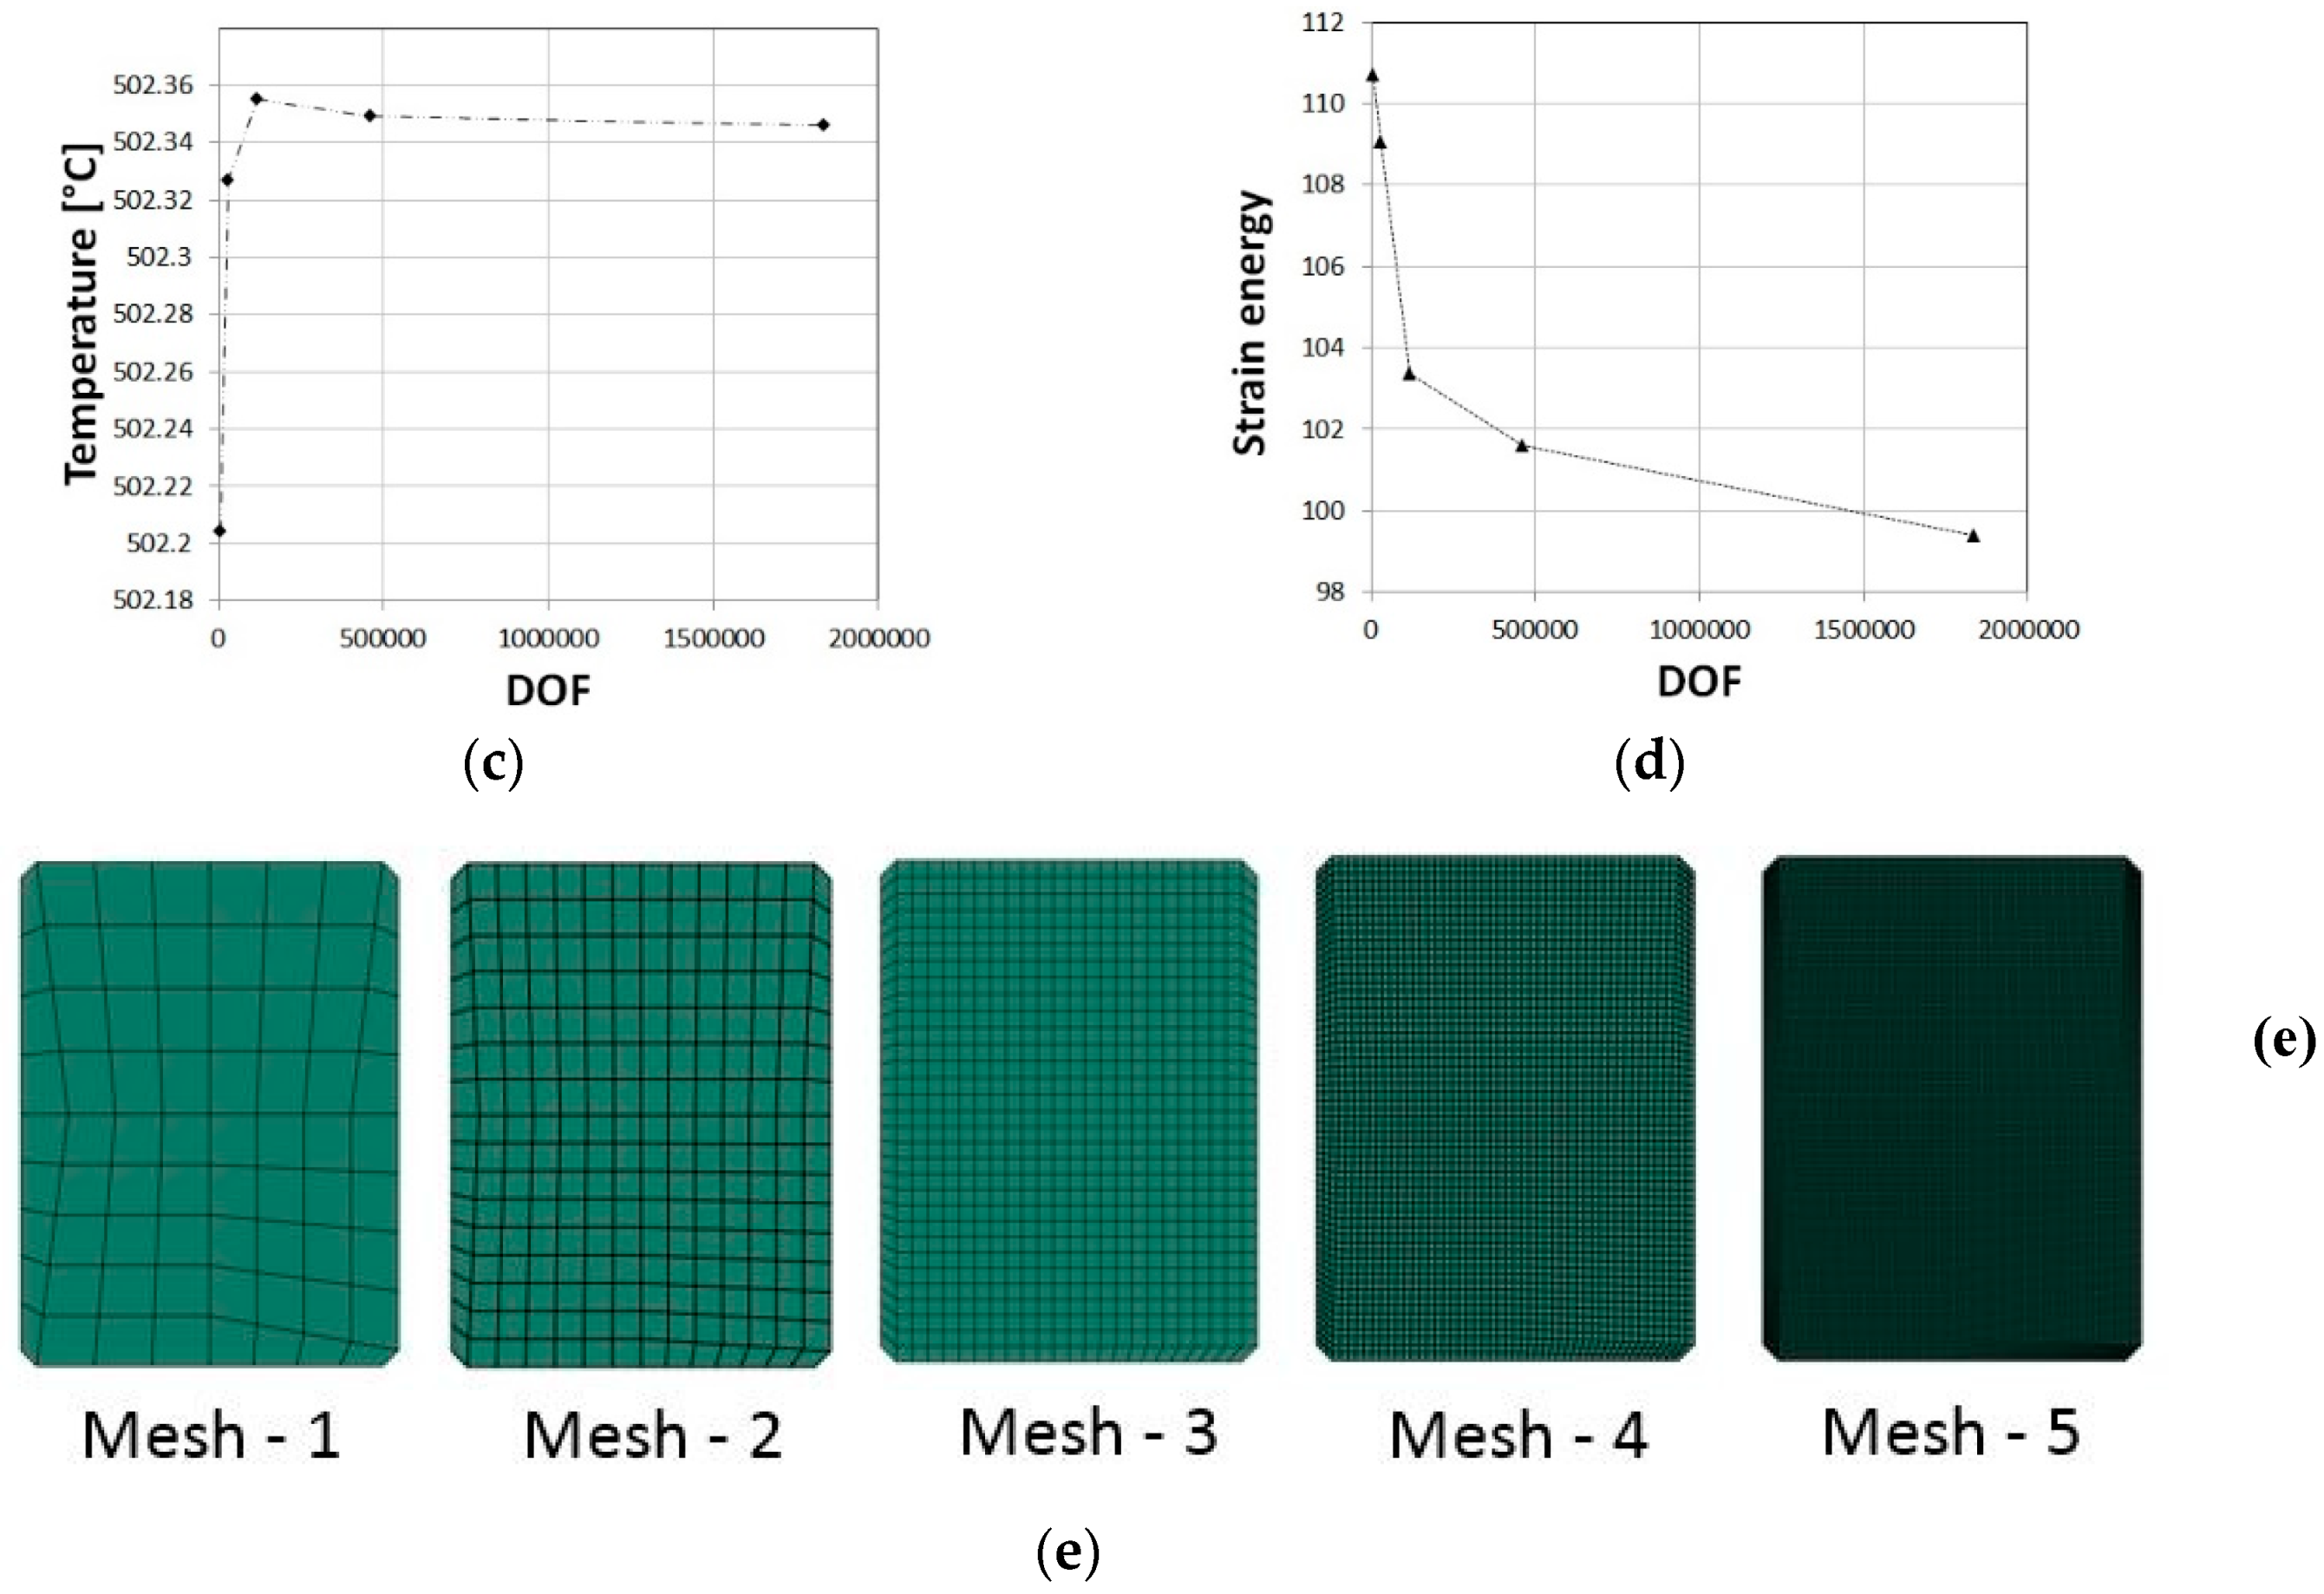
Appendix A. Verification of the Computational Models

To ensure that the discretization error was minimal, convergence tests were performed. The number of degrees of freedom (DOFs) was increased by uniform refinement of the mesh and the equivalent plastic strain, von-misses stress (using the Cauchy stress tensor), and temperature were extracted as well as the global strain energy. The mesh included 795-176910 elements or 2768-533099 DOF, respectively, for the cylindrical specimens, and 2532-607922 elements or 8297-1834577 DOF for the ring specimens. The solution was examined for 5 degrees of mesh refinement, and the number of DOF was increased by a uniform refinement of the mesh. Figure A1 and Figure A2 demonstrate that convergence was achieved for both global values, such as strain energy, and local values, such as equivalent strain and temperature, for the cylindrical and ring specimen, respectively. The convergence was examined at several points (middle height of the specimen, at the center, and inner/outer surfaces) and the convergence presented in Figure A1 and Figure A2 refers to the location and time for which the largest changes were obtained for different values of DOF.
Figure A1. Verification of cylinder upsetting simulations: convergence in equivalent plastic strains (a), von-mises stress (b), and temperature (c). Convergence in strain energy values (d). Examples of the specimen mesh used in the convergence study (e).
Jmmp 02 00083 g0a1
Figure A2. Verification of ring upsetting simulations: convergence in equivalent plastic strains (a), von-mises stress (b), and temperature (c). Convergence in strain energy values (d). Examples of the specimen mesh used in the convergence study (e).
Jmmp 02 00083 g0a2aJmmp 02 00083 g0a2b

References

  1. Kunogi, M. A new method of cold extrusion. J. Sci. Res. Inst. 1957, 50, 215–246. [Google Scholar] [CrossRef]
  2. Male, A.T.; Cockroft, M.G. A method of the determination of the coefficient of friction of metals under conditions of bulk plastic deformation. J. Inst. Metals 1964, 93, 38–46. [Google Scholar] [CrossRef]
  3. Avitzur, B. Metal Forming: Process and Analysis; Robert, E., Ed.; Krieger Publishing Company, Inc.: Huntington, NY, USA, 1968. [Google Scholar]
  4. Hu, C.; Ou, H.; Zhao, Z. An alternative evaluation method for friction condition in cold forging by ring with boss compression test. J. Mater. Process. Technol. 2015, 30, 18–25. [Google Scholar] [CrossRef]
  5. Zhu, Y.; Zeng, W.; Ma, X.; Tai, Q.; Li, Z.; Li, X. Determination of the friction factor of Ti-6Al-4V titanium alloy in hot forging by means of ring compression test using FEM. Tribol. Int. 2011, 44, 2074–2080. [Google Scholar] [CrossRef]
  6. Rajesh, E.; SivaPrakash, M. Analysis of friction factor by employing the ring compression test under different lubricants. IJSER 2013, 4, 1163–1171. [Google Scholar]
  7. Male, A.T.; DePierre, V. The validity of mathematical solutions for determining friction from the ring compression test. J. Lub. Technol. 1970, 92, 389–397. [Google Scholar] [CrossRef]
  8. Ramesh, B.; Senthilvelan, T. Studies on ring compression test using finite element analysis on sintered Aluminium alloys. Tech. Sci. Press 2012, 7, 167–185. [Google Scholar] [CrossRef]
  9. Fereshteh-Saniee, F.; Peaeshki, S.M. Simultaneous determination of interfacial friction and flow curves of temperature and rate dependent materials for bulk metal forming processes. Mat. Trans. 2012, 53, 201–208. [Google Scholar] [CrossRef]
  10. Petrov, P.; Petrov, M.; Vasileva, E.; Dubinchin, A. Research on friction during hot deformation of Al alloys at high strain rate. Int. J. Mater. Form. 2008, 1, 1255–1258. [Google Scholar] [CrossRef]
  11. Altan, T.; Ngaile, G.; Shen, G. Cold and Hot Forging: Fundamentals and Applications; ASM International: Materials Park, OH, USA, 2005. [Google Scholar]
  12. Zienkiewicz, O.C.; Taylor, R.L. The Finite Element Method Vol.2: Solid Mechanics; Butterworth Heinmann: Boston, MA, USA, 2000. [Google Scholar]
  13. Dieter, G.E.; Kuhn, H.A.; Semiatin, L.S. Workability and Process Design; ASM International: Materials Park, OH, USA, 2003. [Google Scholar]
  14. Dixit, U.S.; Narayanan, R.G. Metal Forming: Technology and Process Modelling; McGraw-Hill Education: New York, NY, USA, 2013. [Google Scholar]
  15. Sofuoglu, H. Physical Modelling in FEA of Friction Encountered in Large Deformation Processes. Ph.D. Thesis, Texas Tech University, Lubbock, TX, USA, 1993. [Google Scholar]
  16. Wu, Y. Study of Interface Friction Reduction Using Laser Microtexture Die Surface in Metal Forming. Ph.D. Thesis, Ohio State University, Columbus, OH, USA, 2008. [Google Scholar]
Figure 1. Experimental setup of: (a) a ring upsetting test, (b) a cylindrical specimen upsetting test. The upper pressing plate is not shown in this setup.
Jmmp 02 00083 g001
Figure 2. An finite element (FE) geometric model of the upsetting process of the (a) cylindrical and (b) ring upsetting specimens with T.C. indicating the thermo-couple locations.
Jmmp 02 00083 g002
Figure 3. An example of the computational stages for simulating the system preparation of specimen R13.
Jmmp 02 00083 g003
Figure 4. Thermo-mechanical fields (equivalent stress, equivalent strain, and temperature) for the upsetting conditions of specimen A7 as obtained from: (a) a thermo-mechanical model, including calculation of the pre-upsetting system preparation; (b) a thermo-mechanical model without preparation (constant initial temperatures).
Jmmp 02 00083 g004
Figure 5. Iterative process for determining the flow stress and friction conditions at different temperatures and strain rates: (A) initial guess of the flow stress manifold based on analytical analysis, (B) FE analysis simulations of all experiments, (C) comparison between computed and experimental results, (D) modification of the flow stress data and friction coefficients, (E) input of new flow stress manifolds and friction conditions into the analysis.
Jmmp 02 00083 g005
Figure 6. Experimental vs. numerical force-displacement curve for specimen A1, flow stress determined from cylinder upsetting alone (a). Experimental vs. numerical force-displacement curve for specimen R1, which has the same experimental conditions (b).
Jmmp 02 00083 g006
Figure 7. Flow stress curves for Al1050 using the converged FE model at different temperatures.
Jmmp 02 00083 g007
Figure 8. An upper view of the Al1050 rings after upsetting.
Jmmp 02 00083 g008
Figure 9. Dependence of the minimum (middle height) inner diameter on μ for specimens with a ram velocity of 350 mm/min at various temperatures.
Jmmp 02 00083 g009
Figure 10. Comparison between experimental and computed force-displacement curves for the Al1050 upsetting process, at different temperatures for 〈 ε z z ̇ 〉 = 0.11 (a) and 〈 ε z z ̇ 〉 = 0.38 (b).
Jmmp 02 00083 g010
Figure 11. Comparison between computed and measured inner ring diameter for experiments R1-R16 (a) and an example of a computed and measured force-displacement curve for specimen R15 (b).
Jmmp 02 00083 g011
Figure 12. Comparison between predicted and experimental ring neutral radius and flow patterns for specimens R2 (top) and R8 (bottom), which represent the effect of temperature for unlubricated rings loaded at V = 1200 mm/min.
Jmmp 02 00083 g012
Figure 13. Comparison between predicted and experimental ring neutral radius and flow patterns for specimens R5 (top) and R13 (bottom), which represent the effect of lubrication at 450 °C, V = 350 mm/min.
Jmmp 02 00083 g013
Figure 14. Comparison between predicted and experimental ring neutral radius and flow patterns for specimens R3 (top) and R4 (bottom), which represent the effect of strain rate, on unlubricated rings at 350 °C.
Jmmp 02 00083 g014
Figure 15. Metallographic specimen of the pre-deformed ring (a), and of the deformed unlubricated specimen R5 (top) and lubricated specimen R13 (bottom) (b) both tested at 450 °C.
Jmmp 02 00083 g015
Figure 16. Segmentation into parts with different texture: Pre-deformed microstructure of (a) specimen R5 (b) and R13 (c). Metallography (top) is presented against numerically obtained flow lines (bottom). Locations of nodes from which data was extracted are marked in red. Metallography includes also the notation of the zones.
Jmmp 02 00083 g016aJmmp 02 00083 g016b
Figure 17. Average values of thermo-mechanical fields within specimen R5 at each zone: Out-of-plane (circumferential) principal strain (a), maximum in-plane (b), and minimum in-plane (c) principal strains, and the shear stress (d) evolution with time.
Jmmp 02 00083 g017
Figure 18. Average values of thermo-mechanical fields within specimen R13 at each zone: out-of-plane (circumferential) principal strain (a), maximum in-plane (b), and minimum in-plane (c) principal strains, and the shear stress (d) evolution with time.
Jmmp 02 00083 g018
Table 1. Upsetting experiment parameters for cylindrical specimens: Initial temperatures and ram velocity.
Experiment NotationA1A2A3A4A5A6A7A8
Specimen temp [°C]2525350350450450540540
Pressing plates temp [°C]2525350350450450540540
Ram and matrix temp [°C]2525252525252525
Ram velocity [mm/min]3501200350120035012003501200
Table 2. Ring compression tests (RCTs) parameters: Initial temperatures, ram velocity, and lubrication conditions.
Experiment NotationR1R2R3R4R5R6R7R8
Specimen temp [°C]2525350350450450540540
Pressing plates temp [°C]2525350350450450540540
Ram and matrix temp [°C]2525252525252525
Ram velocity [mm/min]3501200350120035012003501200
Experiment NotationR9R10R11R12R13R14R15R16
Specimen temp [°C]2525350350450450540540
Pressing plates temp [°C]2525350350450450540540
Ram and matrix temp [°C]2525252525252525
Ram velocity [mm/min]3501200350120035012003501200
Table 3. Flow-stress relations for Al1050 at different temperatures as determined from the iterative process.
Specimen Temp [°C]25350450540
Flow stress [MPa] σ = 123 · ε 0.3 σ = 46 · ε 0.315 σ = 26 · ε 0.215 σ = 12.5 · ε 0.135
Table 4. Friction coefficients obtained from analysis of the upsetting experiments.
Experiment NotationR1R2R3R4R5R6R7R8
Specimen temp [°C]2525350350450450540540
Ram velocity [mm/min]3501200350120035012003501200
Lubrictionnonenonenonenonenonenonenonenone
μ 0.40.4>0.45>0.45>0.45>0.45>0.45>0.45
Experiment NotationR9R10R11R12R13R14R15R16
Specimen temp [°C]2525350350450450540540
Ram velocity [mm/min]3501200350120035012003501200
LubrictionT-50T-50T-50T-50T-50T-50T-50T-50
μ 0.150.150.170.160.170.160.28>0.45
Table 5. A comparison between the predicted and observed neutral radius location for different temperatures, loading rates, and friction conditions.
ExperimentComputed [mm]Measured [mm]Relative Error [%]
R215.5215.053.12
R817.1016.921.06
R516.2416.531.75
R1315.6815.103.84
R316.6016.490.67
R417.1416.782.14

