Article

SAREnv: An Open-Source Dataset and Benchmark Tool for Informed Wilderness Search and Rescue Using UAVs

by
Kasper Andreas Rømer Grøntved
1,*,
Alejandro Jarabo-Peñas
1,
Sid Reid
2,
Edouard George Alain Rolland
1,
Matthew Watson
2,
Arthur Richards
2,
Steve Bullock
2 and
Anders Lyhne Christensen
1
1
SDU UAS Center, MMMI, University of Southern Denmark, 5230 Odense, Denmark
2
Faculty of Science and Engineering, University of Bristol, Bristol BS8 1TR, UK
*
Author to whom correspondence should be addressed.
Drones 2025, 9(9), 628; https://doi.org/10.3390/drones9090628
Submission received: 14 July 2025 / Revised: 29 August 2025 / Accepted: 2 September 2025 / Published: 5 September 2025

Abstract

Highlights

What are the main findings?
  • We introduce SAREnv, a novel, open-source benchmark for wilderness search and rescue (SAR), which includes a dataset of 60 high-resolution geospatial scenarios and probabilistic lost person models derived from empirical data.
  • A comprehensive evaluation framework is provided with four baseline multi-agent path-planning algorithms, three quantitative performance metrics, and tools that enable users to generate custom synthetic SAR datasets.
What is the implication of the main finding?
  • This work addresses a deficiency in SAR research by providing a standardized framework for the systematic and reproducible comparison of UAV search strategies.
  • The open-source nature of this benchmark is intended to accelerate innovation by enabling researchers to rigorously validate novel algorithms against established baselines, facilitating the development of more effective autonomous systems for real-world operations.

Abstract

Unmanned aerial vehicles (UAVs) play an increasingly vital role in wilderness search and rescue (SAR) operations by enhancing situational awareness and extending the capabilities of human teams. Yet, a lack of standardized benchmarks has impeded the systematic evaluation of single- and multi-agent path-planning algorithms. This paper introduces an open-source dataset and evaluation framework to address this gap. The framework comprises 60 geospatial scenarios across four distinct European environments, featuring high-resolution probability maps. We present a lost person probabilistic model derived from statistical models of lost person behavior. We provide a suite of tools for evaluating search paths against four baseline methods: Concentric Circles, Pizza Zigzag, Greedy, and Random Exploration, using three quantitative metrics: Accumulated probability of detection, time-discounted probability of detection, and lost person discovery score. We provide an evaluation framework to facilitate the comparative analysis of single- and multi-agent path-planning algorithms, supporting both the baseline methods presented and custom user-defined path generators. By providing a structured and extensible framework, this work establishes a foundation for the rigorous and reproducible assessment of UAV search strategies in complex wilderness environments.

1. Introduction

Search and rescue (SAR) operations have long incorporated robots and unmanned aerial vehicles (UAVs) to help locate lost persons in vast and difficult terrains [1,2]. These UAVs provide invaluable aerial reconnaissance, expanding both the field of view and the operational speed of human teams. In practice, SAR teams combine terrain data, lost person demographics, and other contextual information to guide their search for mission-critical real-time imagery. A common approach involves determining the probable lost person locations based on the terrain profile, such as elevation, vegetation, trails, and the characteristics of the lost person [3]. The search then typically begins from a designated initial planning point (IPP) [4,5], as illustrated in Figure 1 as the center of the circles.
A wide range of algorithmic approaches for autonomous SAR planning [1] in different challenges [6] have been explored. Classic techniques focus on coverage path planning (CPP), aiming to systematically sweep a polygonal area with minimal overlap [7]. In parallel, probabilistic search methods try to maximize the expected likelihood of locating the lost person, using either adaptive [8] or non-adaptive strategies [9]. For example, greedy search policies may target the current highest-probability location, while partially observable Markov decision process (POMDP)-based methods model sequential decision making over time [10].
Another class of methods, known as ergodic exploration, seeks to allocate search effort proportionally to the underlying probability distribution by ensuring that the time spent in each region is proportional to the spatial density of lost persons [11,12]. Similarly, probabilistic priors are also leveraged in sampling-based planning algorithms to bias exploration toward high-information regions, thus maximizing expected information gain across the environment [13,14].
Despite these advances, the SAR community lacks standardized benchmarks and public datasets to systematically evaluate search strategies [15]. This absence hinders the reproducibility and comparability of algorithmic innovations. In contrast, computer vision has greatly benefited from canonical datasets such as CIFAR-10 [16] and ImageNet [17], which have catalyzed progress through standardized evaluation pipelines. Although there are some vision-based SAR datasets, such as the maritime-focused SeaDronesSee dataset [18] and the combined thermal and image-based wilderness SAR datasets WiSARD [19], there is currently no publicly available dataset for evaluating UAV-based search planning strategies in wilderness settings.
Many recent approaches to UAV-based search and rescue rely on high-resolution environmental data and probabilistic models to guide decision making. However, direct comparisons between methods are often ad hoc, and each study uses its own terrain, parameters, and simulation conditions [15]. This makes it difficult to assess whether a proposed algorithm generalizes well across different environments and how well it performs given a specific metric. To address this gap, we introduce a comprehensive public dataset and evaluation framework for SAR search planning using UAVs, based on real data from lost person behavior [5].
Our contribution comprises 60 high-resolution SAR environments sampled within Europe (details in Section 2). These scenarios encompass a variety of climates (dry and temperate) and topographies (flat and mountainous) to ensure diverse evaluation conditions. Each data point includes a 30 × 30 m resolution probability map of the prior probabilities of finding a lost person, which is modeled on established lost person behavior statistics [5] (details in Section 2.1); see the example in Figure 1. Furthermore, to facilitate robust algorithmic evaluation, we provide a benchmarking framework that allows for direct comparison against two exhaustive baseline models, a greedy planner, and a random planner using common performance metrics (details in Section 3). An example of its usage is shown in Listing 1, which demonstrates how to evaluate search paths generated by the predefined baselines in a single environment and visualize the results for straightforward comparison.
Listing 1. A simple search path evaluation code example to evaluate the predefined baselines.
evaluator = ComparativeEvaluator(
   dataset_directory=data_dir,
   evaluation_sizes=["large"],
   num_drones=10,
   num_lost_persons=100,
)

results = evaluator.run_baseline_evaluations()
evaluator.plot_results(results)
In summary, our work fills a critical gap by providing a standardized open-source benchmark and dataset for SAR search planning, namely, a dataset of detailed geospatial scenarios, corresponding probability models derived from the lost person behavior model, a suite of baseline planners, and common evaluation metrics. By providing a shared and realistic testing ground, this work lays the foundation for objective, systematic, and directly comparable evaluations of search algorithms in wilderness SAR. This resource is intended to accelerate progress in informed drone search as common benchmarks have advanced other fields [15]. Our wilderness SAR dataset [20] and tools have been made publicly available on GitHub under the MIT license (https://github.com/namurproject/SAREnv, accessed on 1 September 2025), facilitating reproducible research and fostering innovation in SAR drone missions.

Related Work

The time-critical nature of SAR operations, compounded by the finite endurance and range of UAVs, requires the use of optimized path planning. The probability of survivor recovery decreases rapidly over time [5], motivating the development of information-driven search strategies and requiring a rigorous comparison of path-planning methodologies.
A fundamental approach to area search is coverage path planning (CPP), where the primary objective is to generate a route that ensures that a sensor footprint passes over the entirety of a defined area at least once [21]. Its applications are diverse, ranging from agricultural spraying [22] to terrain mapping [23]. In the context of SAR, search teams have long employed coverage-based patterns, such as expanding spirals or parallel sweeps [24,25]. For UAV-based SAR missions, the most elementary CPP method is the boustrophedon, or “lawnmower,” pattern, which is simple to implement manually or autonomously [26]. However, a principal limitation of exhaustive coverage methods is their inherent inefficiency in terms of time and energy consumption, particularly when applied to large, complex search areas [27]. To mitigate these inefficiencies, several adaptations have been proposed. One strategy involves decomposing the search area into smaller and manageable cells, enabling parallel coverage by a team of multiple UAVs to reduce the total mission time [28,29]. Another approach is hierarchical teaming, which employs a high-altitude UAV for coarse, wide-area surveillance. A secondary low-altitude UAV is then tasked with performing a detailed and fine-grained search within specific RoIs [30].
In contrast to exhaustive coverage, informative path planning aims to maximize the acquisition of relevant information per unit of time or distance traveled [31,32]. This is often achieved by incorporating a probabilistic framework, such as a probability of containment (POC) map, which represents the likelihood that the lost person is located at different points within the search area. For instance, Lin and Goodrich [33] demonstrated a method where the UAV’s path is directed toward regions with the highest probability of containing the target, thereby prioritizing the most promising areas first. Hybrid methodologies combine the strengths of both coverage and informative path planning. An alternative to conventional informative path planning is to adapt coverage path planning techniques. In this approach, the operational area is partitioned into disjointed high-likelihood sub-regions based on a prior probability map. Each sub-region is then treated as a node in a traveling salesman problem, allowing the determination of the optimal sequence for executing the coverage tasks [34].
The lack of standardized datasets and benchmarks in SAR path planning complicates the quantitative comparison of different algorithms, often forcing researchers to rely on custom simulations with limited generalizability. To address the scarcity of publicly available real-world data, the generation of large-scale synthetic datasets, similar to approaches in related fields, presents a viable solution to create robust and repeatable test cases [35]. This work addresses a gap in the state of the art: the absence of a standardized framework for rigorously comparing UAV path-planning algorithms in wilderness SAR, which is paramount if such systems are to be safely and efficiently implemented in real-world applications [1,36]. We introduce a benchmark dataset to enable reproducible evaluations. Our contribution is a suite of realistic environments designed for testing both single- and multi-drone path-planning strategies. By providing a common ground with complex terrain and configurable scenarios, this dataset establishes a necessary foundation for the objective and systematic comparison of path-planning algorithms.

2. Materials and Methods

For each of the four types of terrain—temperate flat, temperate mountainous, dry flat, and dry mountainous—we selected 15 representative regions of interest (RoIs), resulting in a total of 60 geospatial scenarios within Europe. These RoIs were curated to span a wide range of environmental conditions and are categorized into three types based on their geospatial characteristics: (i) Feature-rich areas contain a high density of various elements, such as roads, trails, water bodies, and buildings, explicitly excluding urban regions; (ii) feature-homogeneous areas are dominated by a single land cover or feature type, for example, extensive forested regions or large agricultural fields; (iii) water-dominant areas include substantial water presence, encompassing coastlines, large lakes, and major rivers.
Each scenario includes global metadata describing key attributes of the environment and spatial parameters. These fields specify the environment type, climate zone, central coordinates of the region, resolution of the probability map, and search radius. Specifically, the metadata comprise the type of environment, which describes the terrain, the climate classification, and the IPP, given as latitude and longitude coordinates representing the center of the region. The resolution defines the size (in meters) of each cell in the probability map, while the search radius (in kilometers) sets the extent of the RoI. Furthermore, the dataset includes geospatial features relevant to SAR extracted from OpenStreetMap [37] and categorized according to the lost person behavior framework [5]. Each feature is represented in GeoJSON format with associated properties such as feature type, geometric area, and the probability that a lost person is located within that feature.
Beyond providing this standardized dataset, we have also made a set of tools available that enable users to generate customized scenarios that are tailored to their specific requirements. An example of generating a dataset with the default probabilities and features can be seen in Listing 2. These tools allow modification of key parameters such as probability map resolution, search radii, and selection or weighting of geospatial features. This flexibility allows researchers and practitioners to create diverse test cases and adapt the dataset to a wide range of environments and operational contexts, facilitating the broader experimentation and evaluation of SAR search-planning algorithms.
Listing 2. Data-generation example code, which uses default feature types and probabilities. The code generates a dataset at a specific location, which is in a flat environment and a temperate climate.
data_gen = DataGenerator()

initial_planning_point = LON, LAT
output_dir = "sarenv_dataset"

data_gen.export_dataset(
   center_point=initial_planning_point,
   output_directory=output_dir,
   environment_climate=CLIMATE_TEMPERATE,
   environment_type=ENVIRONMENT_TYPE_FLAT,
   meter_per_bin=30,
)

2.1. Feature Extraction and Environment Model

An informed search strategy relies critically on the quality of the environmental model and the accuracy of the resulting prior probability map for the lost person’s location. To ensure robust performance, our framework employs a systematic methodology for constructing these components. The process starts by extracting a discrete set of relevant geospatial features, denoted as F = { f 1 , f 2 , , f N } .
The environmental model is built using geospatial features sourced from OpenStreetMap (OSM). The choice of which features to extract is informed by empirical findings from lost person behavior [5], which identifies strong correlations between found locations and specific environmental characteristics, as summarized in Table 1. Our toolset enables the automatic querying and extraction of these feature classes from OSM data for any specified RoI, thereby streamlining the model construction process.
RoIs are circular areas centered on the IPP, with their sizes statistically derived from the dispersal patterns in Table 2. To support analysis on multiple different scales, the dataset provides four nested RoIs, which are referenced as small, medium, large, and extra large. The radii of these RoIs correspond, respectively, to the first quartile, median, third quartile, and 95th percentile of the horizontal distance traveled. For example, the radius of the extra-large RoI can be up to 19.3 km for certain scenarios.
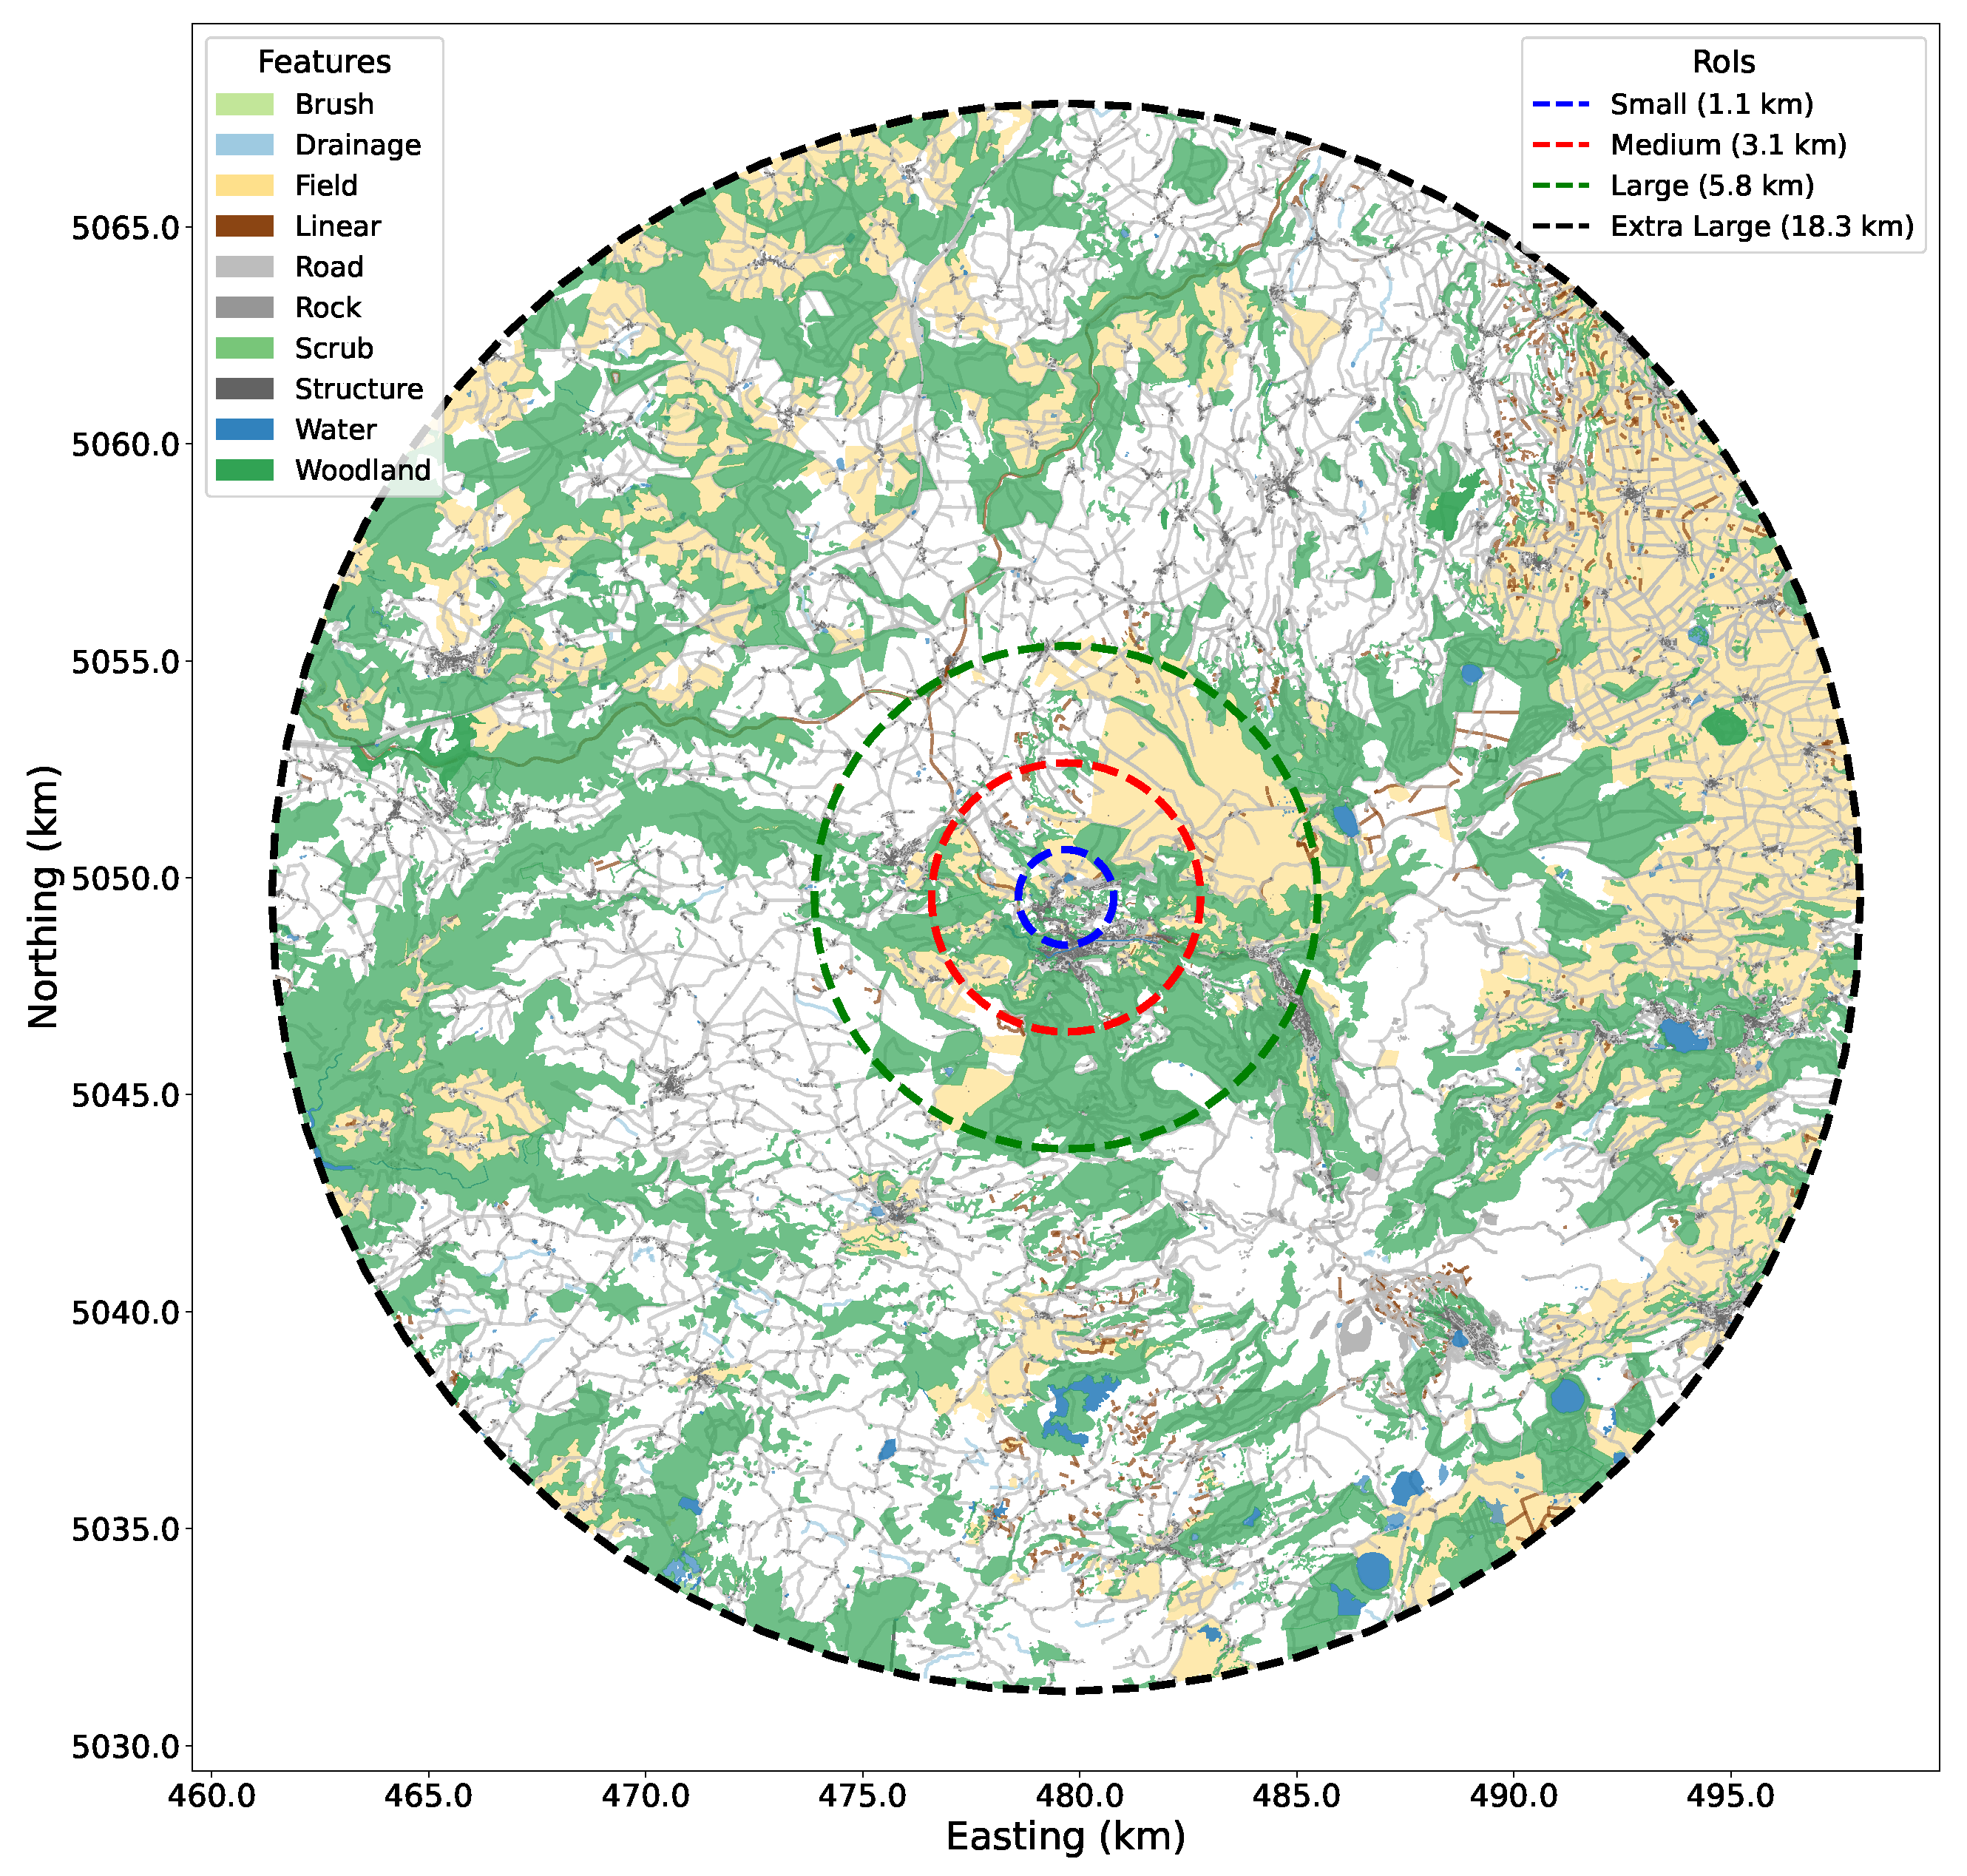
A critical preprocessing step involves translating linear OSM features, such as trails or streams, into searchable two-dimensional areas. This is accomplished by applying a buffer, the same size as the grid size of the probability map, to the linear geometry, creating an area that constitutes a feature f i F . Figure 2 visualizes the polygonal features extracted within the extra-large RoI, corresponding to the area where 95% of lost persons are found.

2.2. Probability Map Generation

Estimating the likelihood of locating a lost person in specific geographic areas is a critical component of SAR operations. This section details a quantitative methodology for assigning probabilities to a discrete set of geospatial features, F , to generate a probabilistic map. The approach is based on statistical distributions derived from lost person behavior [5] and the statistics in Table 1 and Table 2 and integrates two primary sources of information: the intrinsic likelihood of the different feature types, as in Table 1, and the spatial likelihood associated with the distance to the IPP. The result is a normalized probability of area (POA) for each geospatial feature, as seen in Table 2, which forms the basis for the strategic allocation of search resources and the evaluation of SAR algorithms.
At the core of this methodology is the calculation of a relative score for each feature, which is subsequently normalized across the search domain. This score relies on two categories of probabilistic input. First, feature type probability, P type ( τ ) : the prior probability that a lost person is found in a feature of type τ based on historical data [5]. Second, the spatial likelihood, modeled via a normal distribution to reflect the likelihood of finding a lost person at a certain distance from the IPP.
The computation proceeds in multiple stages. First, we define a weight based on the feature classification. Let T ( f ) denote the type of feature f. The type-based weight is assigned as:
ω type ( f ) = P type ( T ( f ) )
Next, we compute a spatial weight, ω spatial ( f ) , based on the Euclidean distance d between a given point in the environment and the IPP. This weight models the distance-dependent likelihood of locating a lost person and is derived from the empirical distance statistics presented in Table 2. A common method for assessing spatial distance involves the use of statistical Euclidean distances, corresponding to the small, medium, large, and extra large areas in our case, and is based on historical data [38]. However, the observed distance data do not necessarily follow a standard spatial distribution such as a Gaussian, that is, ω spatial ( d ) N ( μ L P B , σ L P B ) , where μ L P B and σ L P B denote the mean and standard deviation of the distance from the IPP.
To better capture the characteristics of the data, such as positive skew, we evaluated three candidate probability distributions: the normal distribution, the gamma distribution, which is positively skewed and exhibits heavier tails, and the log-normal distribution, which is strictly positive and also positively skewed. For each environment listed in Table 2, we fitted the distance data to each distribution using least-squares minimization and computed the root mean square error (RMSE) between the empirical and fitted values. The total RMSE in the four different environment types (temperate mountainous, temperate flat, dry mountainous, and dry flat) was 6.83 km for the normal distribution, 2.02 km for the gamma distribution, and 1.76 km for the log-normal distribution. These results indicate that the log-normal distribution provides the best overall fit to the data.
Consequently, we redefine the spatial likelihood model to follow a logarithmic normal distribution ω s p a t i a l ( d ) L N ( μ L P B , σ L P B ) . Here, μ L P B and σ L P B represent the parameters of the log-normal distribution, estimated from the log-transformed distance data for each environment.
Assuming the independence between the type of feature and the spatial location, we compute the overall likelihood score S ( f ) for a given geospatial feature f as the product of its weight of the type of feature ω type ( f ) and its spatial likelihood:
S ( f ) = ω type ( f ) · ω spatial ( f )
This formulation yields a continuous distance-informed likelihood function that prioritizes geospatial features located at distances from the IPP that are statistically consistent with observed lost person behavior [5]. Finally, individual scores are normalized to produce a valid probability distribution in the set F . The resulting P O A for each feature f i is:
P O A ( f i ) = S ( f i ) j = 1 N S ( f j )
The complete set of probabilities P O A ( F ) makes up the final probabilistic map. This map is a core component of the dataset and serves as a foundational tool to evaluate and compare the performance of SAR algorithms.
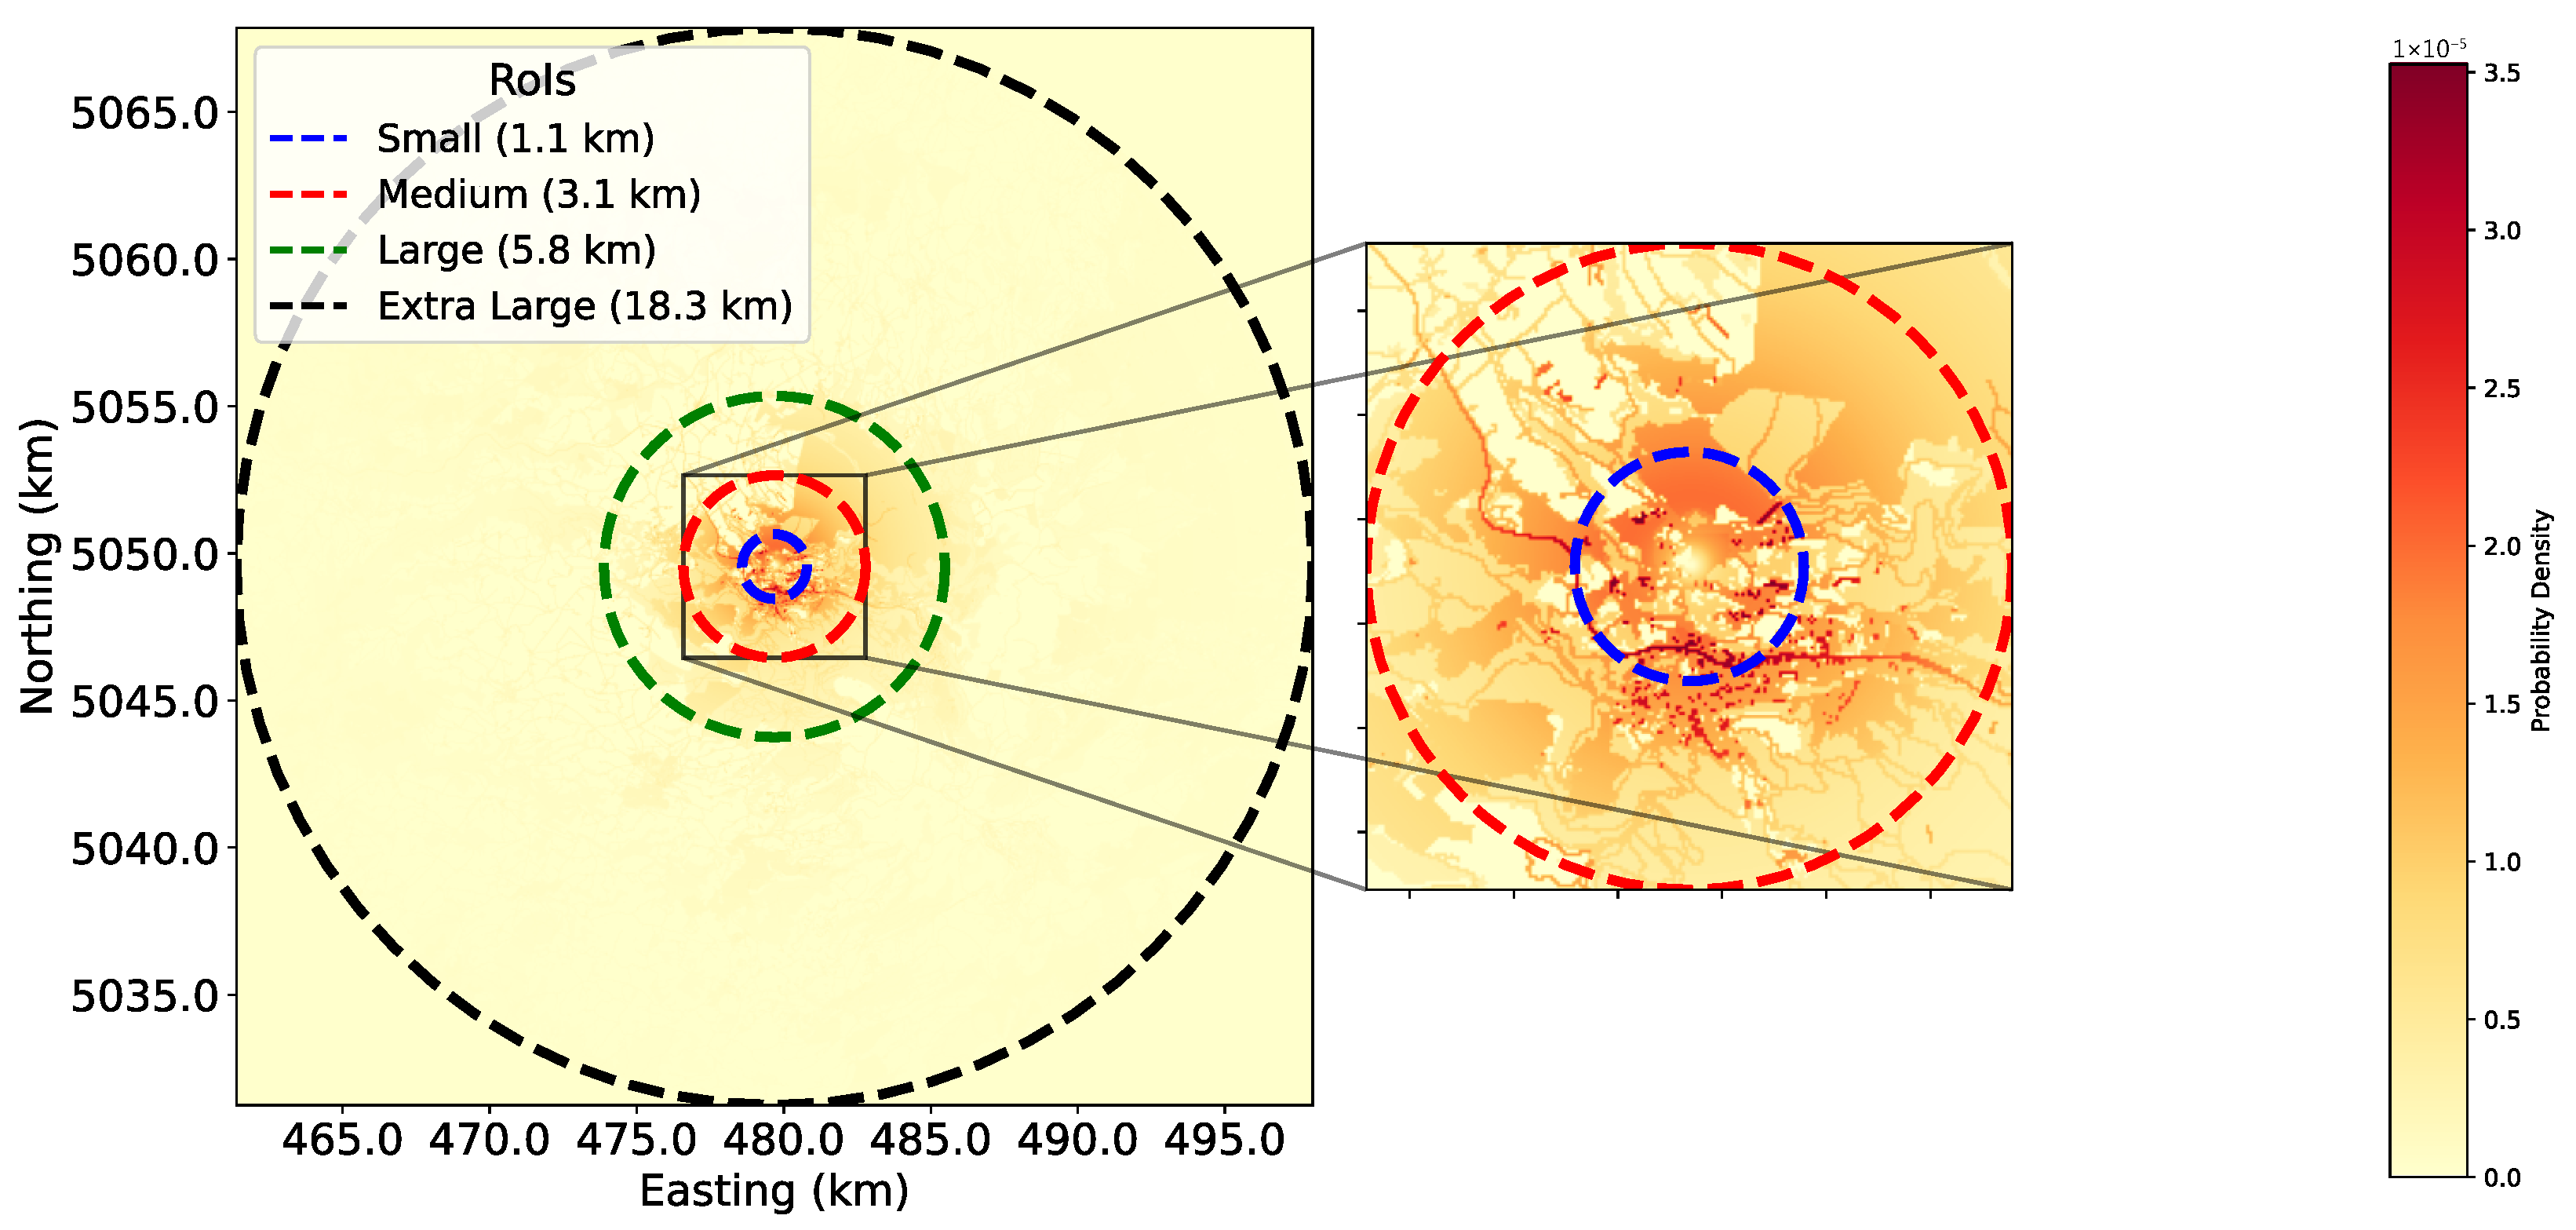
For use in robotic applications, feature-based vector data are converted into a spatially explicit grid map. This representation is advantageous because it provides a uniform and computationally efficient data structure that is directly compatible with the discretized state spaces commonly used in many robotic path-planning algorithms [1,39]; see Figure 3 for an example.
The conversion process comprises two primary stages. First, each feature in F is independently rasterized into a separate binary grid. A grid is initialized with zero values at a user-defined spatial resolution and assigned to the geographic limits of the data. The algorithm then iterates through all geometric entities within that class and projects them onto the grid to denote their spatial occupancy. This procedure is repeated for all feature classes, yielding a set of binary grids, where each grid represents the spatial extent of a specific feature.
In the second stage, these binary grids are weighted and aggregated to generate a final composite probability map. Each binary grid is multiplied by a feature-specific probability scalar, representing the risk or likelihood associated with that feature. The resulting weighted layers are subsequently combined into a single map. In locations where features overlap, the highest probability value takes precedence. This method ensures that high-probability features are not obscured by features assigned a lower probability. The final output is a single grid map where each cell’s value quantifies the maximum feature-based probability at that location.
In summary, the sampling-based and rasterization approaches presented offer complementary strengths for deriving probabilities from GIS data. Sampling enables precise queries at specific coordinates, while rasterization produces a spatially complete and computationally efficient probability grid. Together, these methods provide high location precision and broad spatial coverage, forming a robust foundation for subsequent robotic planning.

2.3. Modeling Lost Person Locations

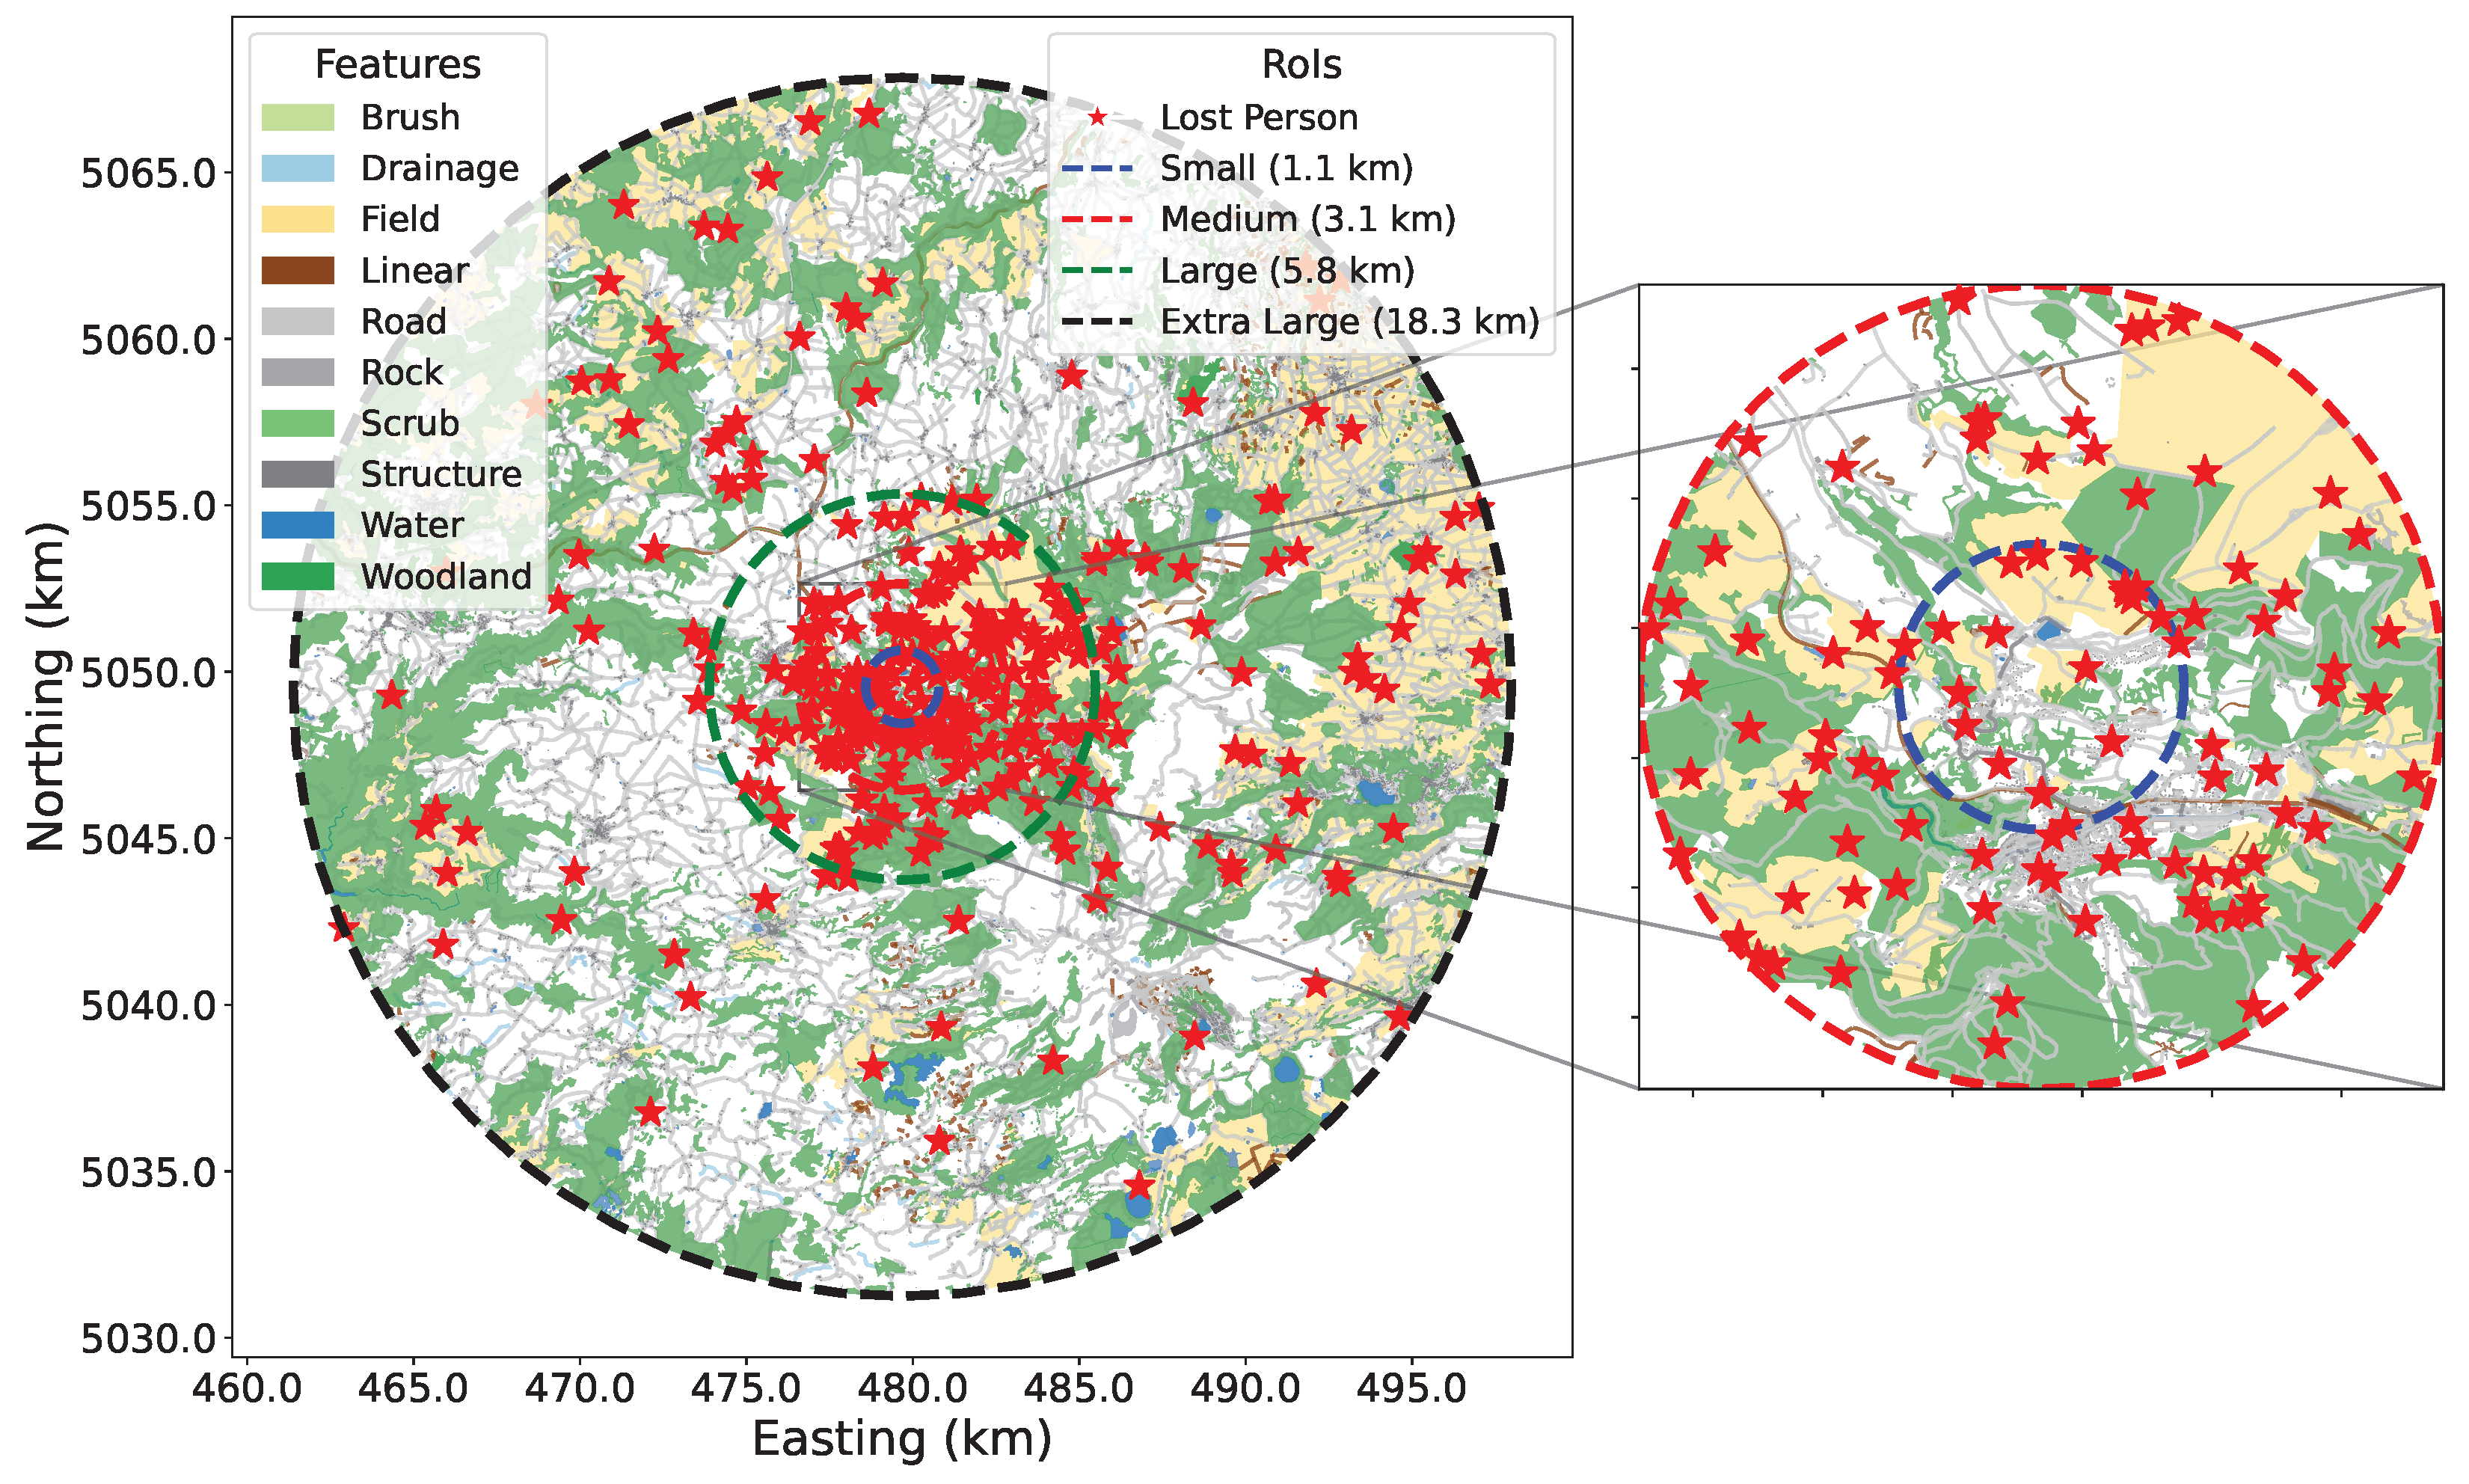
A critical component of this dataset is the capacity for quantitative assessment of path-planning algorithms. To facilitate this, it is necessary to generate synthetic lost person locations within the environment based on established probability distributions. The synthetic locations of lost persons are sampled according to the probability distributions detailed in the previous section. The generation consists of a two-step method, where, first, the type of feature is sampled based on the probability correlated with said feature, weighted by the area they occupy according to Equation (3), and second, the location is randomly sampled within that feature. For linear features, the point is sampled within a buffer radius, the same size as the grid size of the rasterized probability map. By employing a sampling-based method that utilizes only the discrete features, f, the random generation of points is performed in a computationally efficient manner. This approach provides an alternative to loading the entire rasterized probability map and using that as the underlying distribution, which significantly reduces processing and memory overhead. This ensures that the simulated scenarios are representative of realistic SAR statistics. A user-definable parameter controls the percentage of sampled points that are placed uniformly at random within the search area, rather than being drawn from the probability distribution. This feature allows for the evaluation of algorithm performance under varying degrees of model uncertainty and thus directly impacts the classic exploit/explore trade-off in planning algorithms. Figure 4 illustrates the spatial distribution of lost persons within a representative environment. It should be noted that the pseudo-random number generator can be seeded by the user to ensure reproducible results.

3. Results

To enable the standardized and reproducible evaluation of UAV search strategies, we provide an open-source SAR evaluation benchmark. This framework enables the direct comparison of novel algorithms against a set of provided baseline planners using a suite of quantitative performance metrics. The benchmark is designed to operate on the provided dataset or user-generated scenarios, accounting for sensor parameters and the probabilistic distribution of lost person locations. An example of its use is provided in Listing 1.

3.1. Baseline Planning Algorithms

The framework includes several baseline path-planning algorithms to serve as a reference for comparison. These algorithms generate trajectories for a specified number of drones, starting from the IPP. The included baseline planning algorithms are the following:
  • Concentric Circles: A series of concentric circular paths is created and segmented equally among the available drones.
  • Pizza Zigzag: The circular search area is divided into wedge-shaped “slices,” with each drone assigned to cover one slice using a zigzag pattern (boustrophedon).
  • Greedy: A path generator following a greedy policy, prioritizing not revisiting cells, and performing random exploration if all neighboring spaces are visited.
  • Random Exploration: Random exploration throughout the environment.
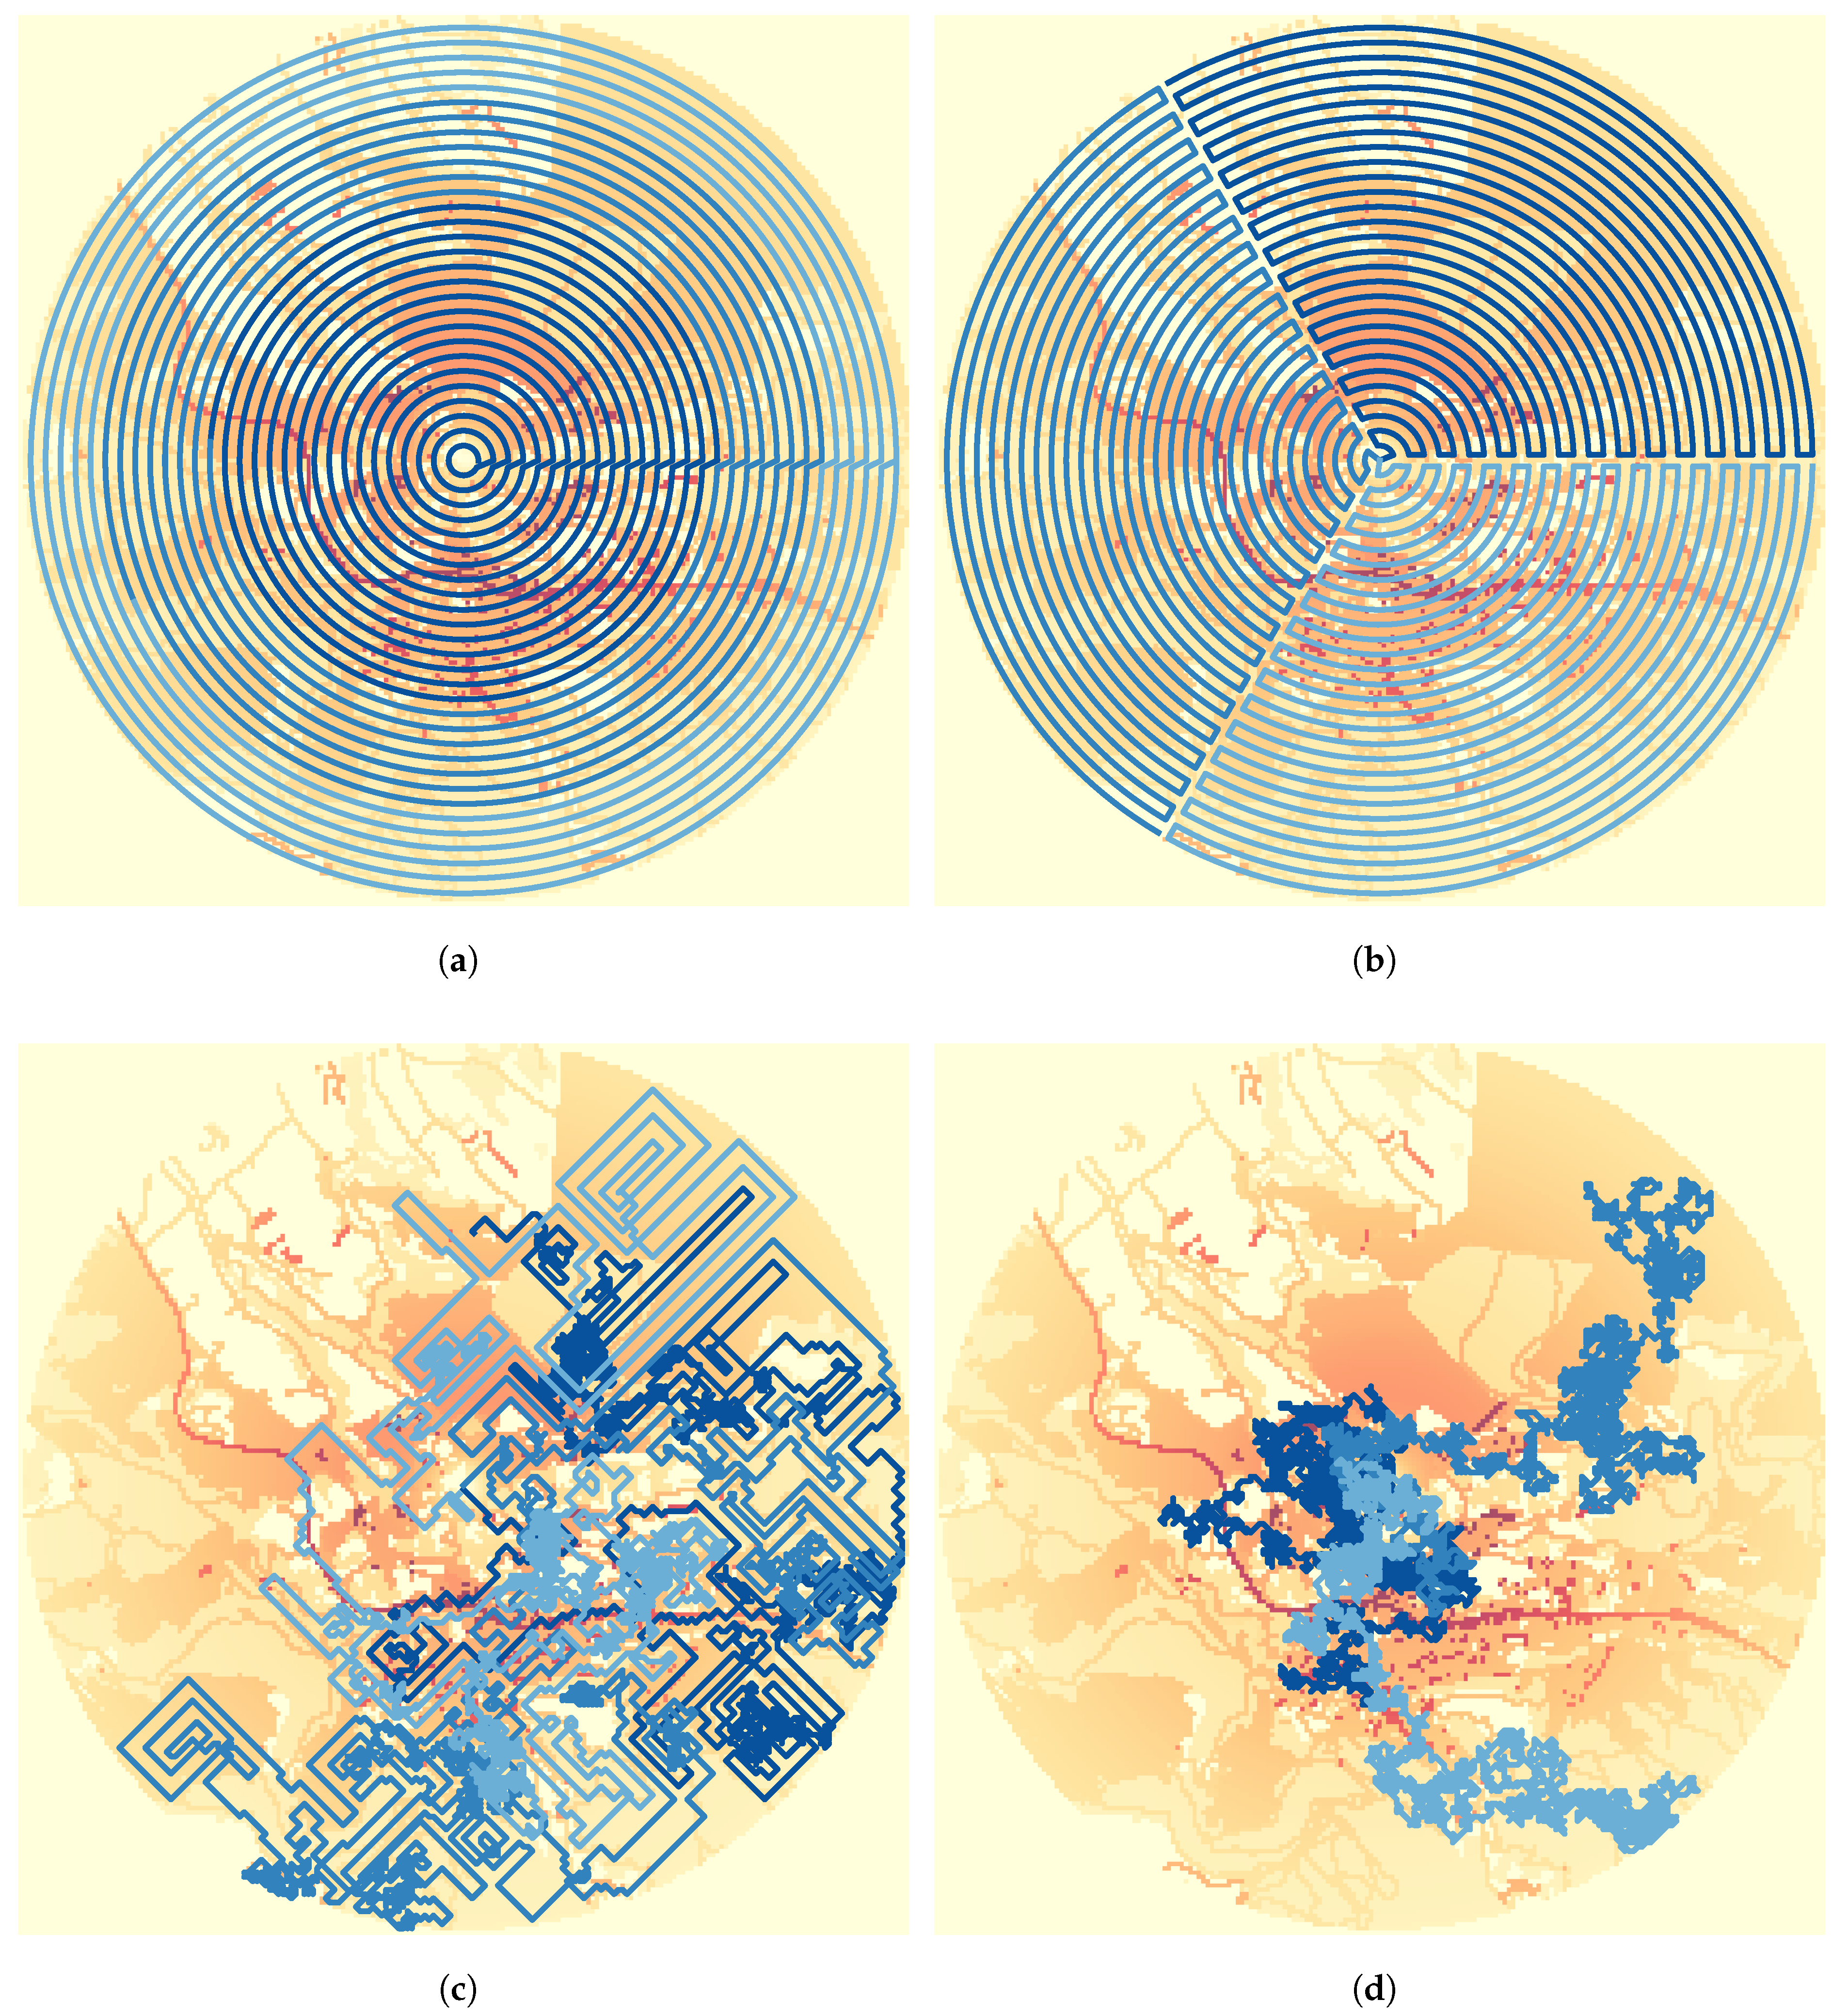
The search algorithms we evaluated fall into two categories based on their coverage strategy. Exhaustive planners, such as the Concentric Circles and Pizza Zigzag patterns, are designed to systematically cover the entire search area. In contrast, non-exhaustive planners like the Greedy and Random Exploration algorithms do not guarantee complete coverage. The Greedy planner, for example, iteratively directs the UAV to the adjacent location with the highest probability density. Figure 5 shows an example of the Concentric Circles, Pizza Zigzag, Greedy, and Random Exploration algorithms on a medium map. The performance of any given search path π is quantified using a set of metrics that evaluate its overall efficiency and effectiveness. Supplementary Video S1 shows examples of these metrics and how they change over time for the different path-planning algorithms.

3.2. Accumulated Probability of Detection

The accumulated probability of detection metric quantifies the probability of detecting a lost person given a planned path and a prior probability distribution over the search region. It is computed as the integral of the prior probability over the portions of the environment visible from the path. Formally, for a path π , the likelihood is  
L ( π ) = A π P prior ( x ) d x
where A π denotes the area visible from π , and P p r i o r ( x ) is the prior probability of a lost person being in the location x.
This formulation has been used in various SAR planning works [40], where cost functions are designed to minimize the accumulated probability of not detecting the target. Using L ( π ) , the search paths are biased toward areas of high probability, leading to more informed coverage strategies.

3.3. Time-Discounted Probability of Detection

To incentivize early discovery of high-likelihood regions, we introduce a temporal discount factor on the accumulated probability gain. Specifically, for each area segment x observed at time t, the contribution to the score is discounted by λ t , where λ ( 0 , 1 ) controls the severity of the discount and can be seen in Equation (5). We chose this exponential function because it provides a flexible and intuitive way to model time-based discounting, starting with no discount at time t = 0 and smoothly decreasing as time progresses.
I ( π ) = A π λ t ( x ) P prior ( x ) d x
Here, t ( x ) is the time at which the location x is observed. Similar constructs have been used in early detection-sensitive planning approaches, where post-deadline detections are penalized through multiplicative factors [40].
The discount factor, λ , is calculated based on a terminal time, t e n d , by which a desired proportion of the total discounted value has been accumulated. To ensure that 95% of the cumulative value, derived from the integral of the function over an infinite horizon, is captured by t e n d , the discount factor is calculated using the following equation:
λ = ( 0.05 ) 1 t e n d
This calculation of λ is especially important in domains such as SAR operations, where the certainty of a lost person’s location exhibits temporal decay. By defining t e n d as a critical operational window, for example, the survivability limit, the resulting λ provides a quantitative basis for resource allocation, concentrating 95% of operational assets in the search areas of highest probability. This strategy optimizes efficiency under resource constraints, accepting a calculated risk of missing outlier scenarios that reside in the remaining 5% of the probability distribution.

3.4. Lost Person Discovery Score

The lost person discovery score measures the number of synthetic lost persons discovered during a path π . In each test case, a fixed number of lost persons is sampled from a predefined distribution. π is then evaluated based on the number of lost persons successfully located and is defined in Equations (7) and (8).
D ( π ) = i = 1 N I ( π , v i )
I ( π , v i ) = 1 if   lost   person   v i   is   discovered   during   the   path   π 0 otherwise
Raw counts of lost persons found have been widely used in benchmarking settings such as RoboCup Rescue [41]. More recent formulations include time-weighted variants where early detections yield higher scores, as seen in [42], which optimizes both discovery count and discovery time using multi-objective planning.
Together, these metrics and baseline planners provide an assessment for rigorously benchmarking search strategies in wilderness SAR environments and are evaluated in Section 3.5.

3.5. Benchmark Evaluations

We evaluated the baseline planning algorithms in 60 distinct datasets, evaluating their performance using the metrics described above: accumulated probability of detection, discounted probability of detection, and lost person discovery score. Since all evaluation methods are included within the dataset, these results are fully reproducible by any dataset user and require minimal code, as seen in Listing 1.
The results presented in Figure 6a indicate that, when budgets are insufficient for the UAVs to cover the entire environment, the greedy planner’s performance is comparable to that of exhaustive methods. This is attributed to the short-term prioritization of high-value areas by the greedy planner, and that the start positions of the agents are in high-probability areas. Conversely, when the budget is sufficient for near-complete coverage of the area, the greedy planner’s performance diminishes due to the lack of long-term planning. It is important to note that if the greedy planner were to start in a low- or uniform-probability area, the greedy method degrades to a behavior analogous to the random exploration algorithm, due to its short-term planning. Figure 6a,c, show that the exhaustive methods generally outperform exploratory methods for both the cumulative probability of detection and the lost person discovery score. However, as shown in Figure 6b, when considering the time-discounted probability of detection, which favors initial exploration, the Greedy and Random Exploration methods demonstrate better or equivalent performance.
Our framework supports custom path generators, enabling the scientific community to evaluate their methods against an established baseline using either their datasets or the one provided in this work [20]. A code example for this functionality is provided in Listing 3.
Listing 3. Instantiation of the ComparativeDatasetEvaluator for batch evaluation. This example demonstrates the evaluation of two path generation algorithms, a custom generator (CustomLine) and a predefined baseline (Greedy), across 60 datasets of varying sizes (“small,” “medium,” and “large”). The evaluate method executes the comparison and stores the resulting metrics.
custom_generators = {
  "CustomLine": create_custom_path_generator(),
  "Greedy": PathGenerator("Greedy", paths.generate_greedy_path),
}

evaluator_custom = ComparativeDatasetEvaluator(
  dataset_dirs=[f"sarenv_dataset/{i}" for i in range(1, 61)],
  budget=100_000,
  num_drones=args.num_drones,
  evaluation_sizes=["small", "medium", "large"],
  custom_generators=custom_generators,
)
metrics_df, time_series_df = evaluator.evaluate(output_dir="results")

4. Discussion

Synthetic data generation using SAREnv offers a valuable solution to the scarcity of real-world SAR data by enabling the creation of large-scale, diverse, and repeatable test cases at low cost [35]. This approach introduces a critical trade-off. The primary drawback is the “sim-to-real” gap, where the performance of an algorithm in simulation may not directly translate to real-world efficacy [43]. The validity of synthetic benchmarks is contingent on the accuracy of the underlying environmental and behavioral models. The fidelity of these evaluations can be improved by incorporating simulated human behavior models, which aim to predict the actions and trajectories of a lost person based on psychological and environmental factors over time [5,44,45]. A foundational assumption in our framework is the statistical independence between feature-type probabilities and spatial probabilities derived from the distance to the IPP (Equation (2)). This assumption may be invalid in scenarios where a correlation exists between the distance traveled and the type of feature sought by a lost person [5]. Such a discrepancy could lead to an inaccurate probability map, thereby guiding search algorithms along sub-optimal paths. However, our current dataset and the SAREnv framework do not incorporate the duration of time a person has been missing, nor the complexities introduced by time-dependent probabilities. Addressing this limitation in future work could improve the temporal fidelity of the models.
The rasterization method for handling overlapping geospatial features, which assigns the maximum probability value to intersecting cells, currently does not consider the cumulative effect when multiple favorable features converge. This limitation may cause planners to undervalue feature-rich zones. The data in lost person behavior [5] provide a path to refinement by providing statistical distributions for how far from a feature individuals are typically found. This could be used to generate a more nuanced probability gradient, although it introduces a trade-off between model fidelity and computational complexity. Deploying the framework to a new region requires high-resolution geospatial data and baseline statistics on lost person behavior, analogous to the OpenStreetMap and ISRID data used in this work. The fidelity of the probability maps is fundamentally dependent on adapting the models to local terrain and behavioral patterns. The current version is EU-centric, as its scenarios were sampled from European environments, because data with as much detail are few and far between in other regions. However, the architecture is designed for broader applicability, and the open-source tools provided are extensible, enabling users to integrate new datasets and probability models tailored to other geographical contexts, once the data are available.
Scalability is another important consideration. The benchmark is designed to scale effectively with the number of UAVs; exhaustive planners can partition the workloads, while exploratory methods lend themselves to parallelization, as the presented planners do not rely on inter-agent coordination. However, scaling the search area presents a greater challenge, as the computational cost of generating higher-resolution or larger maps increases with the RoI, although our approach already demonstrates the capability to generate very large search areas, up to a size of 1170 km 2 at a resolution of 30 m.
Despite these short-commings, the SAREnv dataset and framework already provide a substantial contribution to the SAR research community. By combining high-resolution geospatial data with a probabilistic lost person behavior model, it enables the creation of standardized, repeatable, and diverse test scenarios that have previously been lacking in the domain. The modular architecture of the framework is designed to facilitate the integration of custom probability models, environmental feature layers, and path-planning algorithms, supporting both controlled benchmarking and exploratory validation. Furthermore, the framework and dataset are version controlled, ensuring that algorithmic comparisons remain reproducible over time and enabling fair evaluations as new methods emerge. This capability not only facilitates the consistent replication of experiments but also encourages collaborative refinement of the benchmark, increasing its validity. Consequently, SAREnv constitutes a scalable, extensible, and transparent foundation for advancing autonomous SAR technologies.

5. Conclusions

This paper presented a systematic methodology and an open-source framework and dataset [20] to address the lack of standardized benchmark evaluation for UAV-based wilderness SAR path planning. To address this gap, our framework provides 60 realistic geospatial scenarios, probability maps derived from empirical lost person behavior data [5], a suite of evaluation metrics, and four baseline planners to facilitate reproducible and comparative research. The evaluation of the provided algorithms confirmed the key information on the trade-off between the different search strategies in the baseline. Although exhaustive planners are effective in maximizing total area coverage, our results demonstrated that the Greedy algorithm provides better performance in time-critical scenarios under the metric of time-discounted probability of detection. This finding underscores the critical trade-off between exhaustive coverage and the rapid and targeted investigation of high-probability areas. By offering pre-defined metrics and baseline algorithms, the framework facilitates consistent and objective benchmarking of different search strategies, and at the same time allows researchers to implement and compare their own algorithms seamlessly. The current implementation utilizes existing lost person data; however, the methodology is designed to adapt to novel use cases that may incorporate different features and underlying probability distributions. The framework is intended to support the generation of new datasets for novel applications. The open-source nature of the framework also allows researchers to integrate custom datasets, path-planning methods, and probability models, thereby fostering collaboration and innovation within the field of SAR-based single- and multi-agent path planning.

6. Future Work

Building on this foundation, future work will focus on improving the fidelity of the environmental model. Key improvements will include integrating more advanced models that account for terrain elevation and time-dependent probability decay, enabling the generation of even more realistic probability distributions. To enhance the global applicability of the framework, we will integrate supplementary geospatial data sources to complement OpenStreetMap. This work aims to address current inconsistencies in data coverage and detail and generally extend the dataset to contain datapoints outside the EU, especially in developing countries. Furthermore, the lost person behavior also presents models regarding the demographics of the lost person, which, in future work, will be used to increase the fidelity of our framework.
We aim to iteratively expand on this framework, including the augmentation of the dataset, the refinement of the underlying models, the incorporation of additional baseline algorithms, and a comprehensive analysis of their performance. By providing an open-source and extensible framework, this work establishes a foundation for the rigorous and comparative evaluation of path-planning algorithms, with the ultimate goal of accelerating innovation in autonomous SAR technology.

Supplementary Materials

The following supporting information can be downloaded at: https://www.mdpi.com/article/10.3390/drones9090628/s1, Video S1: SAREnv: UAV Search and Rescue Dataset and Evaluation Framework.

Author Contributions

Conceptualization, K.A.R.G., A.J.-P., S.R. and A.L.C.; Methodology, K.A.R.G., A.J.-P. and S.R.; Software, K.A.R.G. and A.J.-P.; Validation, K.A.R.G.; Formal analysis, K.A.R.G.; Investigation, K.A.R.G.; Resources, K.A.R.G.; Data curation, K.A.R.G. and E.G.A.R.; Writing—original draft, K.A.R.G., A.J.-P., S.R. and A.L.C.; Writing—review & editing, K.A.R.G., A.J.-P., S.R., E.G.A.R., S.B. and A.L.C.; Visualization, K.A.R.G. and E.G.A.R.; Supervision, M.W., A.R., S.B. and A.L.C.; Project administration, A.L.C.; Funding acquisition, A.L.C. All authors have read and agreed to the published version of the manuscript.

Funding

This work was supported by the Innovation Fund Denmark for the DIREC project (9142-00001B), the Independent Research Fund Denmark under grant 10.46540/4264-00105B (the NAMUR project), and the WildDrone MSCA Doctoral Network funded by EU Horizon Europe under grant agreement no. 101071224.

Data Availability Statement

The data and code presented in this study are openly available in https://github.com/namurproject/SAREnv (accessed on 1 September 2025) [20].

Conflicts of Interest

The authors declare no conflicts of interest.

References

  1. Queralta, J.P.; Taipalmaa, J.; Pullinen, B.C.; Sarker, V.K.; Gia, T.N.; Tenhunen, H.; Gabbouj, M.; Raitoharju, J.; Westerlund, T. Collaborative Multi-Robot Search and Rescue: Planning, Coordination, Perception, and Active Vision. IEEE Access 2020, 8, 191617–191643. [Google Scholar] [CrossRef]
  2. Hoang, M.T.; van Berkel, N.; Grøntved, K.A.R.; Skov, M.; Christensen, A.L.; Merritt, T. Drone Swarms to Support Search and Rescue Operations: Opportunities and Challenges. In Cultural Robotics: Social Robots and their Emergent Cultural Ecologies; Springer: Cham, Switzerland, 2023; pp. 163–176. [Google Scholar]
  3. Grøntved, K.; Bahodi, M.T.; Christensen, A.L. Automated Task Generation for Multi-Drone Search and Rescue Operations. In Proceedings of the Distributed Computing and Artificial Intelligence, 21st International Conference, Salamanca, Spain, 25–27 June 2024; Springer: Cham, Switzerland, 2024; pp. 266–271. [Google Scholar]
  4. Lin, L.; Goodrich, M.A. A Bayesian approach to modeling lost person behaviors based on terrain features in Wilderness Search and Rescue. Comput. Math. Organ. Theory 2010, 16, 300–323. [Google Scholar] [CrossRef]
  5. Koester, R.J. Lost Person Behavior: A Search and Rescue Guide on Where to Look for Land, Air, and Water; dbS Productions: Charlottesville, VA, USA, 2008. [Google Scholar]
  6. Drew, D.S. Multi-Agent Systems for Search and Rescue Applications. Curr. Robot. Rep. 2021, 2, 189–200. [Google Scholar] [CrossRef]
  7. Choset, H.; Pignon, P. Coverage Path Planning: The Boustrophedon Decomposition. In Proceedings of the International Conference on Field and Service Robotics, Espoo, Finland, 11–13 June 2001; Finish Society of Automation: Helsinki, Finland, 2001; pp. 203–209. [Google Scholar]
  8. Ge, Z.; Jiang, J.; Coombes, M. Multi-Uav Search and Rescue in Wilderness Using Smart Agent-Based Probability Models. arXiv 2024, arXiv:2411.10148. [Google Scholar] [CrossRef]
  9. Fan, X.; Li, H.; Chen, Y.; Dong, D. UAV Swarm Search Path Planning Method Based on Probability of Containment. Drones 2024, 8, 132. [Google Scholar] [CrossRef]
  10. Waharte, S.; Trigoni, N. Supporting Search and Rescue Operations with UAVs. In Proceedings of the 2010 International Conference on Emerging Security Technologies, EST 2010, Canterbury, UK, 6–7 September 2010; Howells, G., Sirlantzis, K., Stoica, A., Huntsberger, T., Arslan, T., Eds.; IEEE Computer Society: Los Alamitos, CA, USA, 2010; pp. 142–147. [Google Scholar] [CrossRef]
  11. Miller, L.M.; Silverman, Y.; MacIver, M.A.; Murphey, T.D. Ergodic Exploration of Distributed Information. IEEE Trans. Robot. 2016, 32, 36–52. [Google Scholar] [CrossRef]
  12. Ivic, S.; Andrejcuk, A.; Druzeta, S. Autonomous Control for Multi-Agent Non-Uniform Spraying. Appl. Soft Comput. 2019, 80, 742–760. [Google Scholar] [CrossRef]
  13. McCammon, S.; Hollinger, G.A. Topological Path Planning for Autonomous Information Gathering. Auton. Robot. 2021, 45, 821–842. [Google Scholar] [CrossRef]
  14. Moon, B.G.; Chatterjee, S.; Scherer, S.A. TIGRIS: An Informed Sampling-Based Algorithm for Informative Path Planning. In Proceedings of the IEEE/RSJ International Conference on Intelligent Robots and Systems, IROS 2022, Kyoto, Japan, 23–27 October 2022; pp. 5760–5766. [Google Scholar] [CrossRef]
  15. Balta, H.; Muscato, G.; Orlando, G. Integrated Data Management for a Fleet of Search-and-Rescue Robots. J. Field Robot. 2016, 33, 489–508. [Google Scholar] [CrossRef]
  16. Krizhevsky, A. Learning Multiple Layers of Features From Tiny Images; Technical Report; University of Toronto: Toronto, ON, Canada, 2009. [Google Scholar]
  17. Deng, J.; Dong, W.; Socher, R.; Li, L.; Li, K.; Li, F.-F. ImageNet: A Large-Scale Hierarchical Image Database. In Proceedings of the 2009 IEEE Computer Society Conference on Computer Vision and Pattern Recognition (CVPR 2009), Miami, FL, USA, 20–25 June 2009; IEEE Computer Society: Los Alamitos, CA, USA, 2009; pp. 248–255. [Google Scholar] [CrossRef]
  18. Varga, L.A.; Kiefer, B.; Messmer, M.; Zell, A. SeaDronesSee: A Maritime Benchmark for Detecting Humans in Open Water. In Proceedings of the 2022 IEEE/CVF Winter Conference on Applications of Computer Vision (WACV), Waikoloa, HI, USA, 3–8 January 2022; IEEE Computer Society: Los Alamitos, CA, USA, 2022; pp. 3686–3696. [Google Scholar] [CrossRef]
  19. Broyles, D.; Hayner, C.R.; Leung, K. WiSARD: A Labeled Visual and Thermal Image Dataset for Wilderness Search and Rescue. In Proceedings of the IEEE/RSJ International Conference on Intelligent Robots and Systems, IROS 2022, Kyoto, Japan, 23–27 October 2022; pp. 9467–9474. [Google Scholar] [CrossRef]
  20. Grøntved, K.A.R.; Jarabo-Peñas, A.; Reid, S.; Rolland, E.G.A.; Christensen, A.L. SAREnv: UAV Search and Rescue Dataset and Evaluation Framework. 2025. Available online: https://github.com/namurproject/SAREnv (accessed on 1 September 2025).
  21. Galceran, E.; Carreras, M. A Survey on Coverage Path Planning for Robotics. Robot. Auton. Syst. 2013, 61, 1258–1276. [Google Scholar] [CrossRef]
  22. Vazquez-Carmona, E.V.; Vasquez-Gomez, J.I.; Herrera-Lozada, J.C.; Antonio-Cruz, M. Coverage Path Planning for Spraying Drones. Comput. Ind. Eng. 2022, 168, 108125. [Google Scholar] [CrossRef]
  23. Torres, M.; Pelta, D.A.; Verdegay, J.L.; Torres, J.C. Coverage Path Planning With Unmanned Aerial Vehicles for 3D Terrain Reconstruction. Expert Syst. Appl. 2016, 55, 441–451. [Google Scholar] [CrossRef]
  24. Foo, G. Emergency Response and Search & Rescue: An Operational Book; Dimersar: Mississauga, ON, Canada, 2012. [Google Scholar]
  25. Hart, S. UAV Operator Decision-Making in a Search and Rescue Application. Master’s Thesis, University of Bristol, Bristol, UK, 2023. [Google Scholar]
  26. Bähnemann, R.; Lawrance, N.R.J.; Chung, J.J.; Pantic, M.; Siegwart, R.; Nieto, J.I. Revisiting Boustrophedon Coverage Path Planning as a Generalized Traveling Salesman Problem. In Proceedings of the Field and Service Robotics—Results of the 12th International Conference, FSR 2019, Tokyo, Japan, 29–31 August 2019; Ishigami, G., Yoshida, K., Eds.; Springer Proceedings in Advanced Robotics. Springer: Berlin/Heidelberg, Germany, 2019; Volume 16, pp. 277–290. [Google Scholar] [CrossRef]
  27. Choset, H. Coverage for Robotics—A Survey of Recent Results. Ann. Math. Artif. Intell. 2001, 31, 113–126. [Google Scholar] [CrossRef]
  28. Nielsen, L.D.; Sung, I.; Nielsen, P. Convex Decomposition for a Coverage Path Planning for Autonomous Vehicles: Interior Extension of Edges. Sensors 2019, 19, 4165. [Google Scholar] [CrossRef] [PubMed]
  29. Dong, W.; Liu, S.; Ding, Y.; Sheng, X.; Zhu, X. An Artificially Weighted Spanning Tree Coverage Algorithm for Decentralized Flying Robots. IEEE Trans. Autom. Sci. Eng. 2020, 17, 1689–1698. [Google Scholar] [CrossRef]
  30. Ha, I.; Cho, Y. A Probabilistic Target Search Algorithm Based on Hierarchical Collaboration for Improving Rapidity of Drones. Sensors 2018, 18, 2535. [Google Scholar] [CrossRef]
  31. Rosselló, N.B.; Carpio, R.F.; Gasparri, A.; Garone, E. Information-Driven Path Planning for UAV With Limited Autonomy in Large-Scale Field Monitoring. IEEE Trans. Autom. Sci. Eng. 2022, 19, 2450–2460. [Google Scholar] [CrossRef]
  32. Bai, S.; Shan, T.; Chen, F.; Liu, L.; Englot, B. Information-Driven Path Planning. Curr. Robot. Rep. 2021, 2, 177–188. [Google Scholar] [CrossRef]
  33. Lin, L.; Goodrich, M.A. UAV Intelligent Path Planning for Wilderness Search and Rescue. In Proceedings of the 2009 IEEE/RSJ International Conference on Intelligent Robots and Systems, St. Louis, MO, USA, 11–15 October 2009; pp. 709–714. [Google Scholar] [CrossRef]
  34. Vasquez-Gomez, J.I.; Herrera-Lozada, J.C.; Olguin-Carbajal, M. Coverage Path Planning for Surveying Disjoint Areas. In Proceedings of the 2018 International Conference on Unmanned Aircraft Systems (ICUAS), Dallas, TX, USA, 12–15 June 2018; pp. 899–904. [Google Scholar]
  35. Zhao, Z.; Shen, H.; Liang, X.; Wang, L.; Han, B. Construction of a Virtual Dataset of Maritime Search and Rescue Targets for Unmanned Aerial Vehicles. Ocean Eng. 2025, 328, 120926. [Google Scholar] [CrossRef]
  36. Sy Nguyen, V.; Jung, J.; Jung, S.; Joe, S.; Kim, B. Deployable Hook Retrieval System for UAV Rescue and Delivery. IEEE Access 2021, 9, 74632–74645. [Google Scholar] [CrossRef]
  37. OpenStreetMap Contributors. Planet Dump. 2017. Available online: https://planet.osm.org (accessed on 1 September 2025).
  38. Doherty, P.J.; Guo, Q.; Doke, J.; Ferguson, D. An Analysis of Probability of Area Techniques for Missing Persons in Yosemite National Park. Appl. Geogr. 2014, 47, 99–110. [Google Scholar] [CrossRef]
  39. Tan, C.S.; Mohd-Mokhtar, R.; Arshad, M.R. A Comprehensive Review of Coverage Path Planning in Robotics Using Classical and Heuristic Algorithms. IEEE Access 2021, 9, 119310–119342. [Google Scholar] [CrossRef]
  40. Li, Q.; Ramezani, R.; Hwangbo, M.; Bellingham, J.G. Path Planning with Probabilistic Target Detection and Localization. In Proceedings of the AIAA Scitech 2020 Forum, Orlando, FL, USA, 6–10 January 2020; American Institute of Aeronautics and Astronautics: Reston, VA, USA, 2020. [Google Scholar]
  41. Kohlbrecher, S.; Stumpf, A.; Meyer, J.; Klingauf, U. Rescue Robot Capabilities for Victim Localization and Characterization in the Robocup Rescue League. In RoboCup 2014: Robot World Cup XVIII; Springer: Berlin/Heidelberg, Germany, 2015; pp. 106–117. [Google Scholar] [CrossRef]
  42. Trojanowski, K.; Mikitiuk, A.; Grzeszczak, J.; Guinand, F. Complete Coverage and Path Planning for a Team of UAVs in a Realistic Urban Environment Using Evolutionary Algorithms. In Applications of Evolutionary Computation; Springer: Berlin/Heidelberg, Germany, 2024. [Google Scholar] [CrossRef]
  43. Carpin, S.; Lewis, M.; Wang, J.; Balakirsky, S.; Scrapper, C. Bridging the Gap Between Simulation and Reality in Urban Search and Rescue. In Proceedings of the RoboCup 2006: Robot Soccer World Cup X; Springer: Berlin/Heidelberg, Germany, 2007; pp. 1–12. [Google Scholar]
  44. Jain, V.; Jena, R.; Li, H.; Gupta, T.; Hughes, D.; Lewis, M.; Sycara, K. Predicting human strategies in simulated search and rescue task. Accepted at NeurIPS 2020. In Proceedings of the Workshop on Artificial Intelligence for Humanitarian Assistance and Disaster Response (AI+ HADR 2020), Virtual Event, 12 December 2020. [Google Scholar] [CrossRef]
  45. Heintzman, L.; Hashimoto, A.; Abaid, N.; Williams, R.K. Anticipatory Planning and Dynamic Lost Person Models for Human-Robot Search and Rescue. In Proceedings of the 2021 IEEE International Conference on Robotics and Automation (ICRA), Xi’an, China, 30 May–5 June 2021; pp. 8252–8258. [Google Scholar] [CrossRef]
Figure 1. A representation of our environment model and benchmark methodology that models four different regions of interest (RoIs) represented by circles. The center of each circle indicates the initial planning point (IPP). The figure includes a probability map based on the lost person model, shown as the yellow/red area over the terrain, and displays potential search paths for the UAVs that utilize our provided lost person model.
Drones 09 00628 g001
Figure 2. Illustration of the data in the temperate mountainous terrain and the different radii corresponding to the temperate mountainous environment type as per Table 2 and included in the accompanying dataset (#19).
Drones 09 00628 g002
Figure 3. A probability map of environment #19 of the accompanying dataset generated using our framework.
Drones 09 00628 g003
Figure 4. An example of 300 generated lost person locations distributed throughout a search environment. The majority of points are clustered in high-probability areas.
Drones 09 00628 g004
Figure 5. Four coverage path strategies for three drones displayed over a medium probability heatmap of environment #19 in the accompanying dataset. The individual paths for each drone are distinguished by different shades of blue. The strategies shown are (a) Concentric Circles, (b) Pizza Zigzag, (c) Greedy, and (d) Random Exploration.
Drones 09 00628 g005
Figure 6. Evaluation of baseline algorithm performance (mean and 95% confidence intervals shown as whiskers) on the complete dataset of 60 environments using two different budgets per UAV. The figure presents the (a) accumulated probability of detection, (b) time-discounted probability of detection, and (c) lost person discovery score. The experimental setup consisted of five UAVs operating in medium-sized environments.
Drones 09 00628 g006
Table 1. Distribution of find locations for lost persons by environmental feature, reported as percentages for temperate and dry environments. The table shows the proportion of cases found in each feature class, with sample sizes indicated by n.
Find Location (%)TemperateDry
n312196
Structure13%10%
Road13%17%
Linear25%31%
Drainage12%18%
Water8%9%
Brush2%2%
Scrub3%3%
Woods7%6%
Field14%1%
Rock4%2%
Table 2. Horizontal distances from the IPP and their corresponding circular radii for each environment type. These values define the radii for the four nested RoIs used for search analysis and planning: small, medium, large, and extra large.
Horizontal Distance from the IPP *TemperateDry
Mountains Flat Mountains Flat
n56827422158
Small1.1 (3.8)0.6 (1.1)1.6 (8.0)1.3 (5.3)
Medium3.1 (30.2)1.8 (10.2)3.2 (32.2)2.1 (13.8)
Large5.8 (105.7)3.2 (32.2)6.5 (132.7)6.6 (136.8)
Extra large18.3 (1052.1)9.9 (307.9)19.3 (1170.2)13.1 (539.1)
* Shown in the format: radii (km) (area ( km 2 )).
Disclaimer/Publisher’s Note: The statements, opinions and data contained in all publications are solely those of the individual author(s) and contributor(s) and not of MDPI and/or the editor(s). MDPI and/or the editor(s) disclaim responsibility for any injury to people or property resulting from any ideas, methods, instructions or products referred to in the content.