Article

Reliability Analysis of Multi-Rotor Drone Electric Propulsion System Considering Controllability and FDEP

1
Science and Technology Innovation Research Institute, Civil Aviation University of China, Jinbei Road No. 2898, Tianjin 300300, China
2
Sino-European Institute of Aviation Engineering, Civil Aviation University of China, Jinbei Road No. 2898, Tianjin 300300, China
3
College of Safety Science and Engineering, Civil Aviation University of China, Jinbei Road No. 2898, Tianjin 300300, China
*
Author to whom correspondence should be addressed.
Drones 2025, 9(8), 572; https://doi.org/10.3390/drones9080572
Submission received: 7 July 2025 / Revised: 29 July 2025 / Accepted: 31 July 2025 / Published: 13 August 2025

Abstract

The electric propulsion system serves as the power source for multi-rotor drones, helping them complete various maneuvering actions. The reliability of this system directly affects whether the drone can successfully complete its mission. The multi-rotor drone propulsion system is a k-out-of-n system with functional dependence (FDEP). With the insufficient basis for selecting k-values, the problem of incalculable reliability caused by computational space explosion due to voting gates, and the uncertain impact of functional dependence on system reliability, we propose a reliability evaluation method based on controllability theory and BN (Bayesian network) reconstruction. The drone is dynamically modeled, and a control model is built, and k-values are selected through different failure combination controllability evaluations. We model the system with BN, use functional dependent components as BN node inputs, and reconstruct BN via an adder model to solve the problem of exponential growth in the conditional probability table. This paper analyzes system reliability, safety, and the impact of FDEP on the system, and conducts component importance analysis. The result provides important reference for the reliability, safety assessment, and dynamic maintenance processes of multi-rotor drone.

1. Introduction

The increasing popularity of rotor craft has resulted in our growing utilization in both civilian and military field [1], including search, rescue operations, agricultural irrigation, cargo transportation and manned flights [2]. The propulsion system is a pivotal component of the drone system. The failure of the propulsion system directly leads to the crash of the drone, posing a huge threat to the safety of ground personnel and property. Therefore, it is necessary to analyze the propulsion system of the drone [3]. Its normal operation must be based on the operation of the power system and communication lines, so that the propulsion system is in a FDEP state with multiple systems [4].
Multi-rotor drones are equipped with multiple propulsion units, constituting a redundant system, regarded as a k-out-of-n system. Consequently, determining the propulsion system’s reliability necessitates prior analysis of its reliability objectives—specifically, solving for the optimal k-value. Table 1 compiles methodologies from existing literature, contrasting diverse k-value selection criteria and their corresponding reliability targets.
The existing literature on DRONE reliability objectives neglects critical flight attitudes such as roll, pitch, and yaw during normal operation. Reliability targets derived solely from moment differences, symmetry constraints, and center of gravity balance may inadequately represent the full flight envelope. To address this gap, we develop a dynamic model grounded in controllability analysis, considering the drone’s different flight attitude.
Chamseddine [9] et al. based on Kalman’s classical controllability theory, did the assessment of controllability involves the rank test of the controllability matrix. However, as was noted in their study, the classical theory stipulates that the origin must be an interior point of the reachable control constraints set, which is not always the case when the rotor fails. Brammer [10] et al. presented a sufficient and necessary condition for the controllability of linear autonomous systems with positive constraints, which can be used to analyze the controllability of a multi-rotor system. Du [11] et al. discussed the optimal design problem of multi-rotor drone based on controllability, and a complete multi-rotor system model was derived considering drone dynamics for different mission requirements. Ghosh et al. [12] considered the significance of controllability for different mission requirements, and performed a reliability analysis of a quadrotor drone with different configurations based on Markov’s method. This analysis demonstrated that the reliability of a multi-rotor drone is contingent not only on its components, but also on its mission and payload.
For system reliability studies considering FDEP, separate FDEP gates are incorporated within the dynamic fault tree to characterize its dynamic property [13]. Zhang et al. [14] presented the k-out-of-n system reliability assessments with FDEP often neglect analysis of flexible component support relations, causing inaccuracies. They proposed a novel PTVDDBN–HDFS method integrating a Parameter Time-Varying Discrete Dynamic Bayesian Network (PTVDDBN) with a Hungarian algorithm enhanced by Depth-First Search (DFS). Boudali and Dugan [15] proposed a novel reliability modeling and analysis framework based on Bayesian Networks (BN). The capability of this framework was verified by defining the discrete-time BN reliability form and converting the DFT with FDEP gates to a BN model. Liu et al. [16] presented traditional Markov methods for FDEP with imperfect coverage, which are inefficient. Based on the total probability theorem and divide-and-conquer, it decouples FDEP and imperfect coverage effects from system combination. The method is efficient, accurate, handled any failure distribution, and overcomes Markov limitations.
The proliferation of drone applications necessitates increased rotor configurations and larger-scale propulsion systems. In fault tree-based safety and reliability analysis [1], system scalability inversely impacts computational efficiency, potentially causing combinatorial explosion. This inefficiency stems from the Boolean logic foundation of fault trees: expanding system size exponentially increases Boolean operator complexity and computational demands. The Boolean satisfiability problem (SAT) [17] determines whether there exists a model for a given Boolean formula. Although the problem has proved to be NP-complete [18], modern SAT solvers can handle large problems with tens of thousands of variables, such as bounded model checking [19], planning [20], and sampling [21].
At the same time, part of the research is based on the MCSs (Minimum Cut Sets) of the complex event fault tree for simplified processing. Luo et al. [22] presented a new method for computing MCSs based on SAT, namely SATMCS. Specifically, given a fault tree, they iteratively search for a cut set based on the conflict-driven clause learning framework. By exploiting local propagation graph, which characterizes the partial failure propagation based on the cut set, we provide efficient algorithms for extracting an MCS. Jacob et al. [23] developed the direct evaluation method to analyze the large systems with FTA (Fault Tree Analysis). The aforementioned goal has been achieved by a thorough search of independence in the fault tree and making use of hash tables and dynamic memory. Moreover, our solution is applicable to any standard fault tree, regardless of the number of children per gate.
When voting gates are present in the fault tree, the system still faces space explosion problems due to the complexity of the selection logic. Xiang et al. [24] proposed a set of reduction rules to simplify the voting gates without direct expanding. They also proposed a concept of minimal cut vote (MCV) denoting a k/n gate, in which the MCSs of fault trees can be evaluated and weeded more efficiently, and the result can be represented in a more compact form. Wang [25] proposed a new decomposition algorithm based on an expanded combination formula which can decompose the voting gates more quickly while the space and time complexity is lower than the traditional expansion was proposed. The above literature does not take into account how the system’s reliability is resolved when the voters are present concurrently with complex failure events. The literature is summarized in Table 2.
Based on the above literature analysis, Section 2 is based on the controllability analysis, considering the different attitude of drone flight, to accurately determine the value of k. Section 3 introduces function dependence nodes, explores the effect of FDEP on system reliability, and constructs the system reliability model based on the adder model while considering complex failure events and voting gates, and solves the space explosion problem by reconfiguring the Bayesian network. Section 4 takes the propulsion system of a 16 (2 × 8) coaxial rotor drone as an example to verify the accuracy and practicality of the proposed reliability algorithm.

2. Multi-Rotor Drone Controllability Modeling

To satisfy stringent airworthiness certification requirements for multi-rotor drones, the reliability assessment necessitates a highly conservative approach. The drone’s propulsion system functions as a k-out-of-n system. While industry practices typically select the k-value based on factors like take-off weight and symmetry axis configurations [5], this approach proves inadequate to meet the overly conservative reliability demands encountered during research and development. To overcome this limitation, we develop precise drone dynamics and control models through controllability analysis. This analysis explicitly considers the drone’s controllability in roll, yaw, pitch, and other axes, thereby enabling the precise determination of the k-value for the k-out-of-n propulsion system.

2.1. Drone Control Modeling

As illustrated in Figure 1, there exists a wide variety of multi-rotor drones, characterized by differing rotor counts and configurations. It is evident that there are discrepancies in configuration and performance between the various configurations. However, these configurations can all be modeled by the general form of Equation (1) [26].
x ˙ = A x + B F G
With:
x = [ h ϕ θ ψ v h p q r ] T 8 F = [ T L M N ] T 4 G = [ m a g 0 0 0 ] T 4 A = 0 4 × 4 I 4 0 0 8 × 8 B = 0 J f 1 8 × 4 J f = diag m a , J x , J y , J z .
h, ϕ, θ, Ψ—the altitude, the roll angle, the pitch angle, the yaw angle of the drone.
vh—the vertical speed of the drone.
p, q, r—the roll angular velocity, the pitch angular velocity, the yaw angular velocity of the drone.
T—the thrust generated by the rotor blades of the drone.
L, M, N—the three-axis moments of the drone.
ma—the mass of the drone.
Jx, Jy, Jz—the moment of inertia of the drone.
There are four control inputs to the multi-rotor drone: total thrust, T, and three-axis moments, L, M, and N. The four control inputs are generated by the motor thrust and counter-torque moments, respectively [27].
(1)
Lift generated by rotor
In accordance with the principle of rotor aerodynamics, it is generally accepted that the lift generated by the rotor is proportional to the square of its rotational speed. The proportionality coefficient k1 is defined as the lift coefficient, Ωm is the rotational speed of the mth rotor. Any drone configuration in Figure 1 can be modeled similarly below, we use coaxial 2 × 8 rotors as an example here. Therefore, the projection of the lift generated by 16 rotors in the fuselage coordinate system can be expressed as follows:
F m = k 1 Ω m 2 , m = 1 , 2 , , 16 .
For a 16-rotor drone, the total thrust generated by the propulsion system equals the sum of the individual propeller thrusts. Propeller thrust is defined as the force perpendicular to the propeller plane. These combined forces provide lift, translational thrust, and generate moments enabling airframe pitch and roll maneuvers. The total thrust T is expressed as follows:
T = m = 1 16 F m = k 1 Ω 1 2 + Ω 2 2 + Ω 3 2 + Ω 4 2 + Ω 5 2 + Ω 6 2 + Ω 7 2 + Ω 8 2 + Ω 9 2 + Ω 10 2 + Ω 11 2 + Ω 12 2 + Ω 13 2 + Ω 14 2 + Ω 15 2 + Ω 16 2 .
(2)
Moments generated by rotor
The projection of the moment generated by each rotor lift on each airframe coordinate system can be expressed as:
H 1 m = L m × F m , i = 1 , 2 , , 16 .
Lm denotes the coordinates of the rotor center on the fuselage coordinate system, and r denotes as the distance of the rotor center relative to the barycenter of the drone; the rotor layout of the 16-rotor drone is shown in Figure 2. Consequently, the lift moment produced by the rotor can be expressed as follows:
H 1 = M 1 x M 1 y M 1 z = r k 1 m = 1 16 Ω 1 2 × s i n θ m r k 1 m = 1 16 Ω 1 2 × s i n θ m 0 .
(3)
Antitorque moment generated by the rotor
The rotation of the rotor also creates an antitorque moment with a magnitude proportional to the square of the rotor rotational speed. The resultant moment of all antitorques provides the airframe with a yawing moment of rotation in the plane of the propeller [28]. The scale coefficient k2 is called the drag coefficient. Within the airframe’s coordinate system, the counter-torque moment generated by the 16 rotors is expressed as follows:
H 2 m = 0 0 k 2 Ω n 2 , m = 1 , 4 , 5 , 8 , 9 , 12 , 13 , 16 H 2 m = 0 0 k 2 Ω n 2 , m = 2 , 3 , 6 , 7 , 10 , 11 , 14 , 15 .
Therefore, the resultant moment of the rotor acting in the fuselage coordinate system is expressed as follows:
H = L M N = H 1 + i = 1 16 H 2 m .
The control efficiency model of the co-axial 16-rotor drone can be derived from Equations (3) and (7) and expressed as follows:
T L M N = k 1 k 1 k 1 k 1 r k 1 s i n θ 1 r k 1 s i n θ 2 r k 1 s i n θ 15 r k 1 s i n θ 16 r k 1 c o s θ 1 r k 1 c o s θ 2 r k 1 c o s θ 15 r k 1 c o s θ 16 k 2 k 2 k 2 k 2 Ω 1 2 Ω 2 2 Ω 16 2 .
The 4 × 16 matrix in Equation (8) is the control efficiency matrix Bf.
B f = k 1 n 1 k 1 n 1 k 1 n 1 k 1 n 1 r n 1 k 1 s i n θ 1 r n 1 k 1 s i n θ 2 r n 1 k 1 s i n θ 15 r n 1 k 1 s i n θ 16 r n 1 k 1 c o s θ 1 r n 1 k 1 c o s θ 2 r n 1 k 1 c o s θ 15 r n 1 k 1 c o s θ 16 k 2 n 1 k 2 n 1 k 2 n 1 k 2 n 1 = b 1 b 2 b 16 T
The bm denotes the contribution factor of the mth rotor to the total thrust or torque, and the parameter nm is used to characterize the failure of the rotor. When the mth rotor fails, nm = 0.
Equation (1) has the following two constraints, with F = [0,Ω2m] as the set of speeds that can be output:
Ω = { F | F = B f f , f F } U = { u | u = F G , F Ω } .
The classical controllability theory of linear systems typically assumes that the origin is an interior point in the set of control constraints U. In such cases, the full rank of the rows of the matrix C (A,B) is a sufficient condition for controllability. However, in the event of rotor failure, the origin may not be attributable to the set of control constraints U. Other additional conditions are therefore required to prove the controllability of the system (1).

2.2. Controllability Analysis of a Multi-Rotor Drone

In this section, the controllability of the system (1) is studied based on the positive controllability theory. The application of the positive controllability theorem to Equation (1) necessitates the satisfaction of two conditions. Firstly, C (A,B) must be row-full rank. Secondly, for all of u in the control constraints U, there exists no real eigenvector v in AT satisfying vTBu ≤ 0.
However, in practice, it is not feasible to verify all of u in the control constraints U individually. For this reason, an equivalent formulation is proposed and defined as the available control authority index (ACAI) [29], which is formulated as follows:
ρ X , Ω m i n X F : X Ω , F Ω m i n X F : X Ω C , F Ω .
The assessment of capability is achieved through the calculation of the Available Control Authority Index (ρ) for each failure combination, thereby determining the drone’s capacity to remain operational within the specific failure combination.
In contrast to the classical Kalman controllability analysis with the rank tests, the ACAI is derived from a linearized dynamic model of the drone in a hovering scenario. The four control channels are as follows: altitude, roll, pitch, and yaw. The set of control constraints centered on X is defined as the largest closed sphere in four-dimensional space, ρ is the distance measured from X to δΩ, which is essentially the radius of the largest closed sphere in the reachable control set, X represents the form of moment that can be provided by some combination of failures, as mentioned in Equation (10). Ω is the set of reachable controls, with boundaries defined as δΩ, and Ωc is the complementary set of Ω in which the drone is no longer able to control. As the value of ρ increases, the ability of the drone to control the four channels is greater, and a system is defined as being controllable if and only if ρ ≥ 0; this also indicates that the system is able to maintain stability of the system by varying the rotor’s rotation speed.

3. Reliability Modeling Considering FDEP

Voting systems exhibit functional redundancy due to their multi-component architecture. This complexity leads to FDEP relationships between distinct component types, represented by FDEP gates in dynamic fault tree models [30]. FDEP describes scenario where System F becomes unavailable upon failure of triggering System T, despite no intrinsic failure within System F itself. When incorporating System T directly into System F’s intermediate events during fault tree modeling, the failure probability of System F becomes overestimated [31]. Such overestimation compromises the reliability of fault tree solutions for system design optimization. Consequently, exploring alternative reliability modeling methods for FDEP systems becomes essential. We propose Bayesian Networks (BN) as a rigorous solution.

3.1. BN Modeling

A Bayesian network (BN) consists of nodes {X1, …, Xn} and directed arcs between them. Each node Xi is a random variable. If there is an arc from node Xi to node Xj, then node Xi is the parent node of node Xj and node Xj is the child node of node Xi. A directed arc describes the conditional probability transformation relationship between nodes and is represented by a conditional probability table (CPT) [32].
Pa(Xi) the set of parent nodes of Xi, Pr[Xi| Pa(Xi)] is conditional probability given the set of its parent nodes of Xi [33]. In this paper, the node state is defined as a discrete quantity, indicating that the node is in a working or failed state. The joint probability of its non-empty parent node is denoted as:
P r X i , P a X i = P r X i P a X i × P r P a X i .
Following the extraction of the joint probability as outlined in Equation (12), the subsequent formula is employed to calculate the marginal probability of the child nodes:
P r X i = P a X i P r X i , P a X i .
In Bayesian Networks (BN), directed arcs between nodes are quantified through conditional probability functions, typically structured as conditional probability table (CPT). As a static modeling framework, BN is restricted to assessing system reliability at discrete time points. To characterize the temporal evolution of component behaviors, the model extends to Dynamic Bayesian Networks (DBN), enabling analysis of dynamic failure dependencies over continuous time horizons.
We present a k-out-of-n system with FDEP, consisting of a trigger component and a functional component. Denoted Ti and Fi, respectively, the components are in binary states, where 1 indicates a working state and 0 indicates a failed state. The failure probability of each component studied in this paper is exponential. The state transfer probability Pi of the components is therefore shown in Equation (14).
p i = 1 e λ i Δ t
λi is the failure rate of the component and Δt is the fundamental time interval.
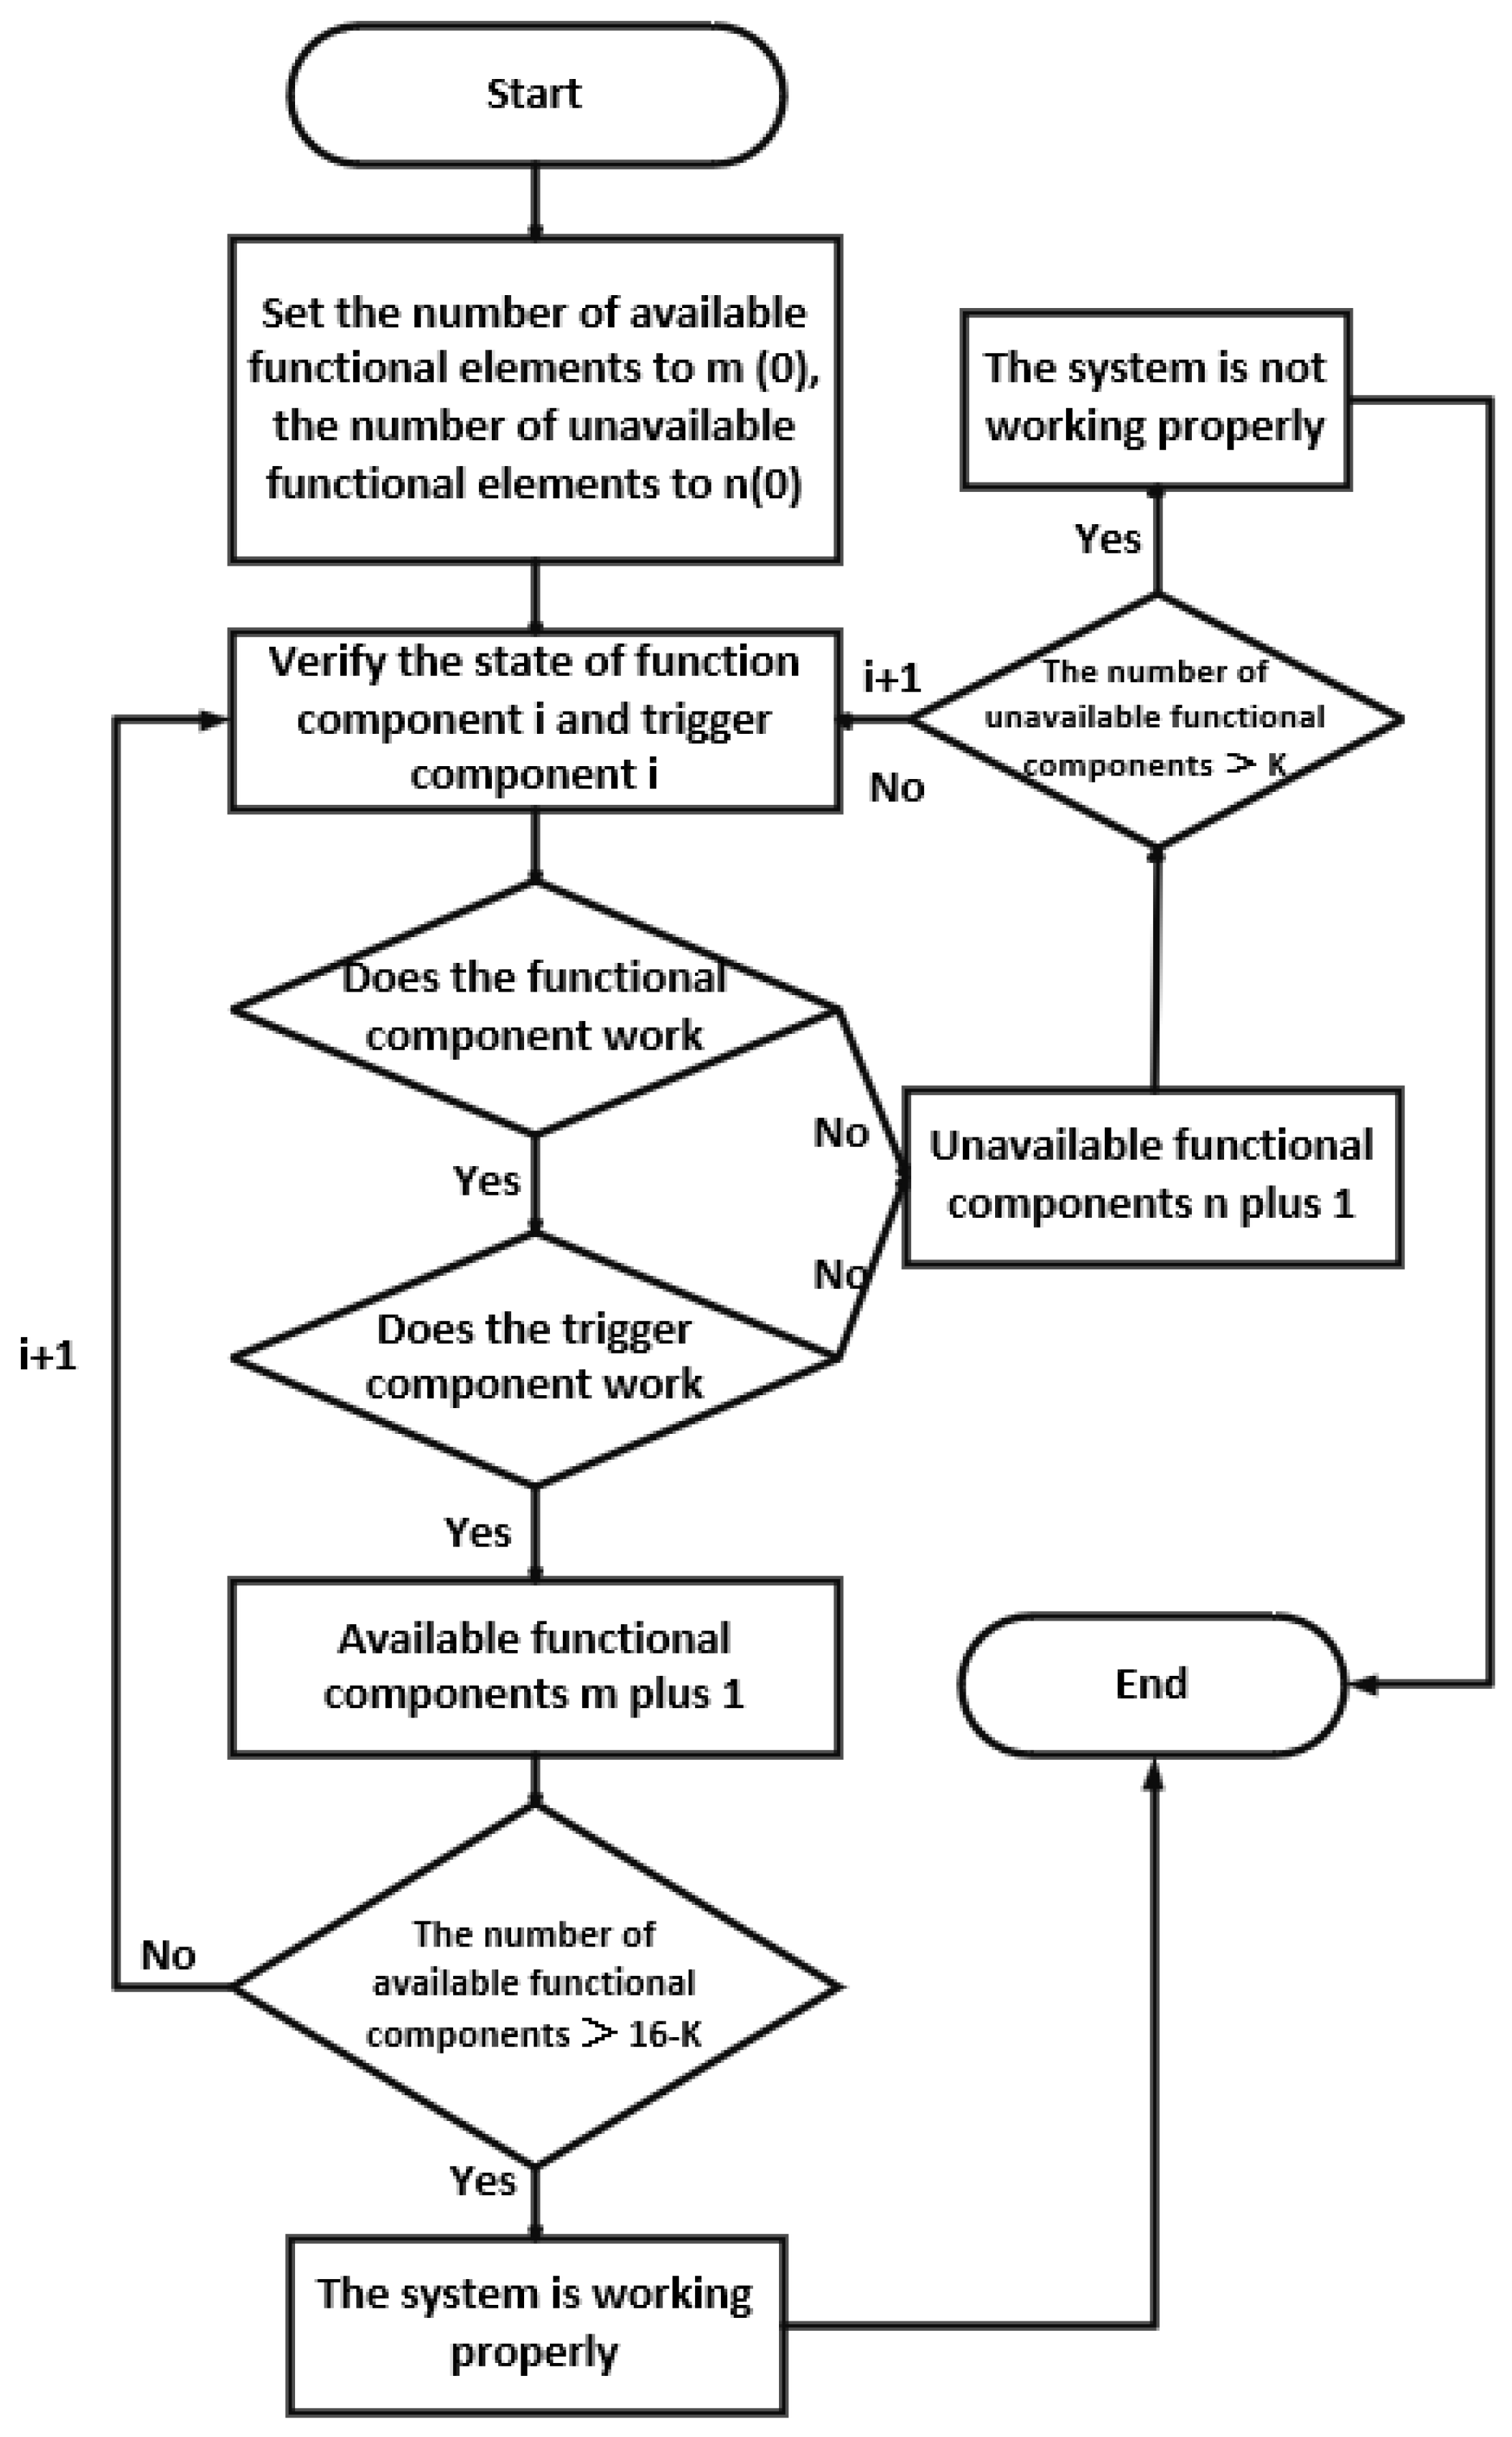
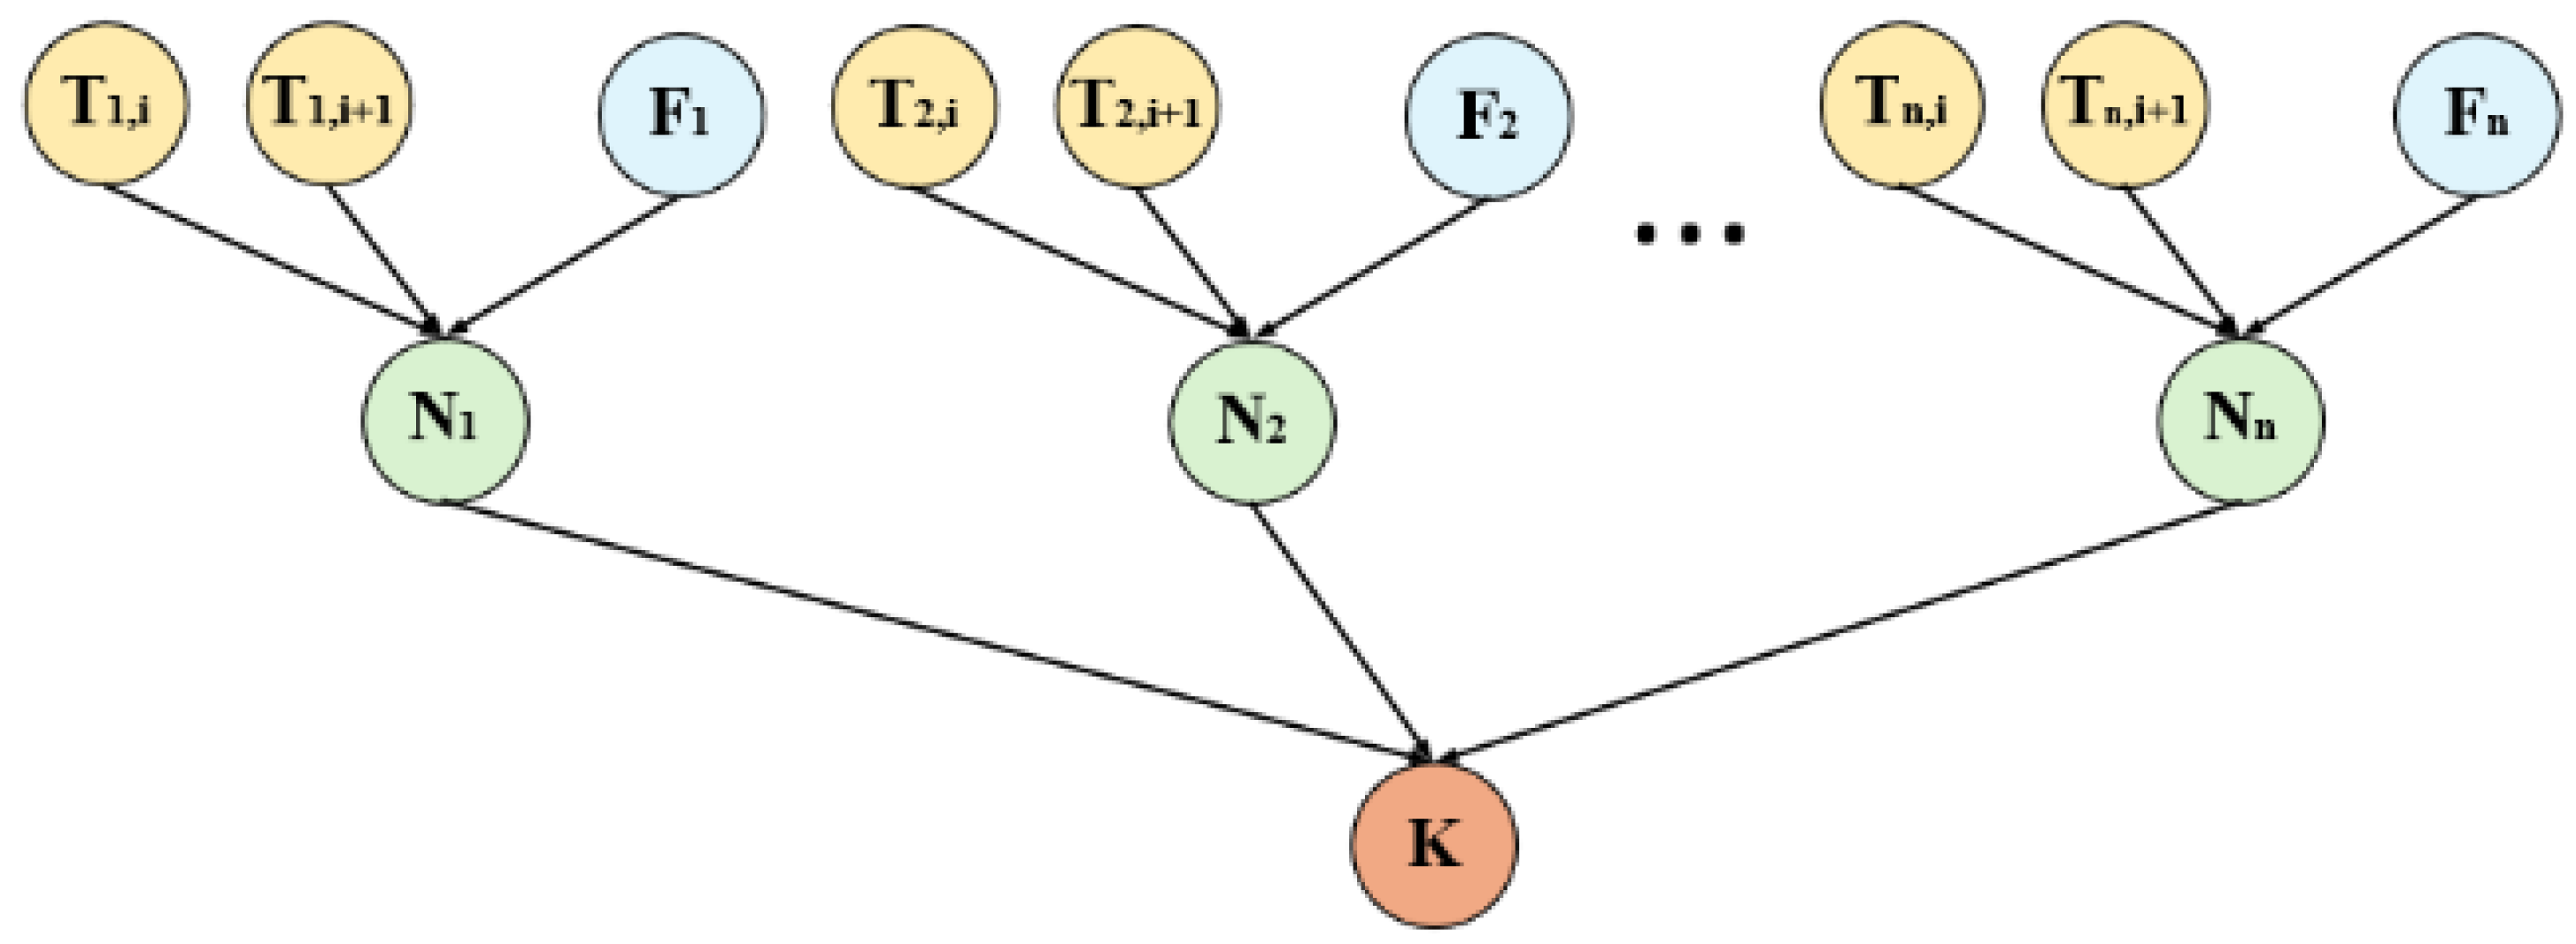
When accounting for FDEP, the availability of component Fi depends not only on its intrinsic state but also on the status of its triggering component Ti, as depicted in Figure 3. Consequently, k-out-of-n systems exhibiting FDEP characteristics cannot establish the triggering component as a direct fault tree bottom event for the functional component. Such conventional modeling neglects the dynamic failure propagation mechanism between triggering and functional components.

3.2. Dynamic BN Modeling with FDEP

In a DBN model, time is divided into successive time instants, treating a static BN at a particular time as a time slice. Each time slice characterizes the state of units, sub-systems, and systems at a particular time instant.
The node Xi extends to Xi(t), and the DBN model can be decomposed into two BN slices (B(t), B(t + 1)). With t = 0, B(0) is a priori network, representing the probability distribution of the initial state of the system. The probability from B(t) to B(t + 1). Simulates the transition of the unit’s state over time [34].
To consider the impact of FDEP on the reliability of propulsion systems, the triggering component and the functional component are used as parent nodes. Instead of being the bottom event of the electric propulsion unit, affecting the normal operation of the electric propulsion unit through AND-OR logic, this will lead to an overestimation of the failure probability of the electric propulsion unit. If we consider the triggering component as the parent node in BN, it can ensure the independence of the electric propulsion unit, as the triggering component affects the operation of the electric propulsion unit through conditional probability as shown in Equation (12) with Pa(N1) = {T1, F1, F2}, and we can obtain Pr(N1) through Equation (13) as illustrated in Figure 4. The “1” in Figure 4 represents a dynamic update process of the BN.
With the basic time interval Δt, since the failure probability is the exponential distribution, the transition relationship between the trigger component nodes within the slice is expressed as follows:
p T i = P r { T i t = 1 | T i t 1 = 1 } = e λ i T Δ t = e λ i T P r { T i t = 0 | T i t 1 = 1 } = 1 e λ i T Δ t = 1 e λ i T P r { T i t = 0 | T i t 1 = 0 } = 1 P r { T i t = 1 | T i t 1 = 0 } = 0 .
The transition relationship between the functional components nodes within the slice is expressed as follows:
p F i = P r { F i t = 1 | F i t 1 = 1 } = e λ i F Δ t = e λ i F P r { F i t = 0 | F i t 1 = 1 } = 1 e λ i F Δ t = 1 e λ i F P r { F i t = 0 | F i t 1 = 0 } = 1 P r { F i t = 1 | F i t 1 = 0 } = 0 .
λiT, λiF are the failure probabilities of the trigger component and the functional component, respectively.

3.3. BN Reconstruction Based on Adder Modeling

It is evident that the BN possesses the capacity for reasoning about probabilities and the computation of posterior probabilities. However, convergent BN structures, such as the BN in Figure 5, cannot be analyzed due to the increased number of parent nodes and the presence of voting gates [35].
The converged BN structure has a CPT size that grows exponentially with the number of parent nodes, but the problem of exponential growth of CPT can be solved by realizing inference through causal independence between nodes.
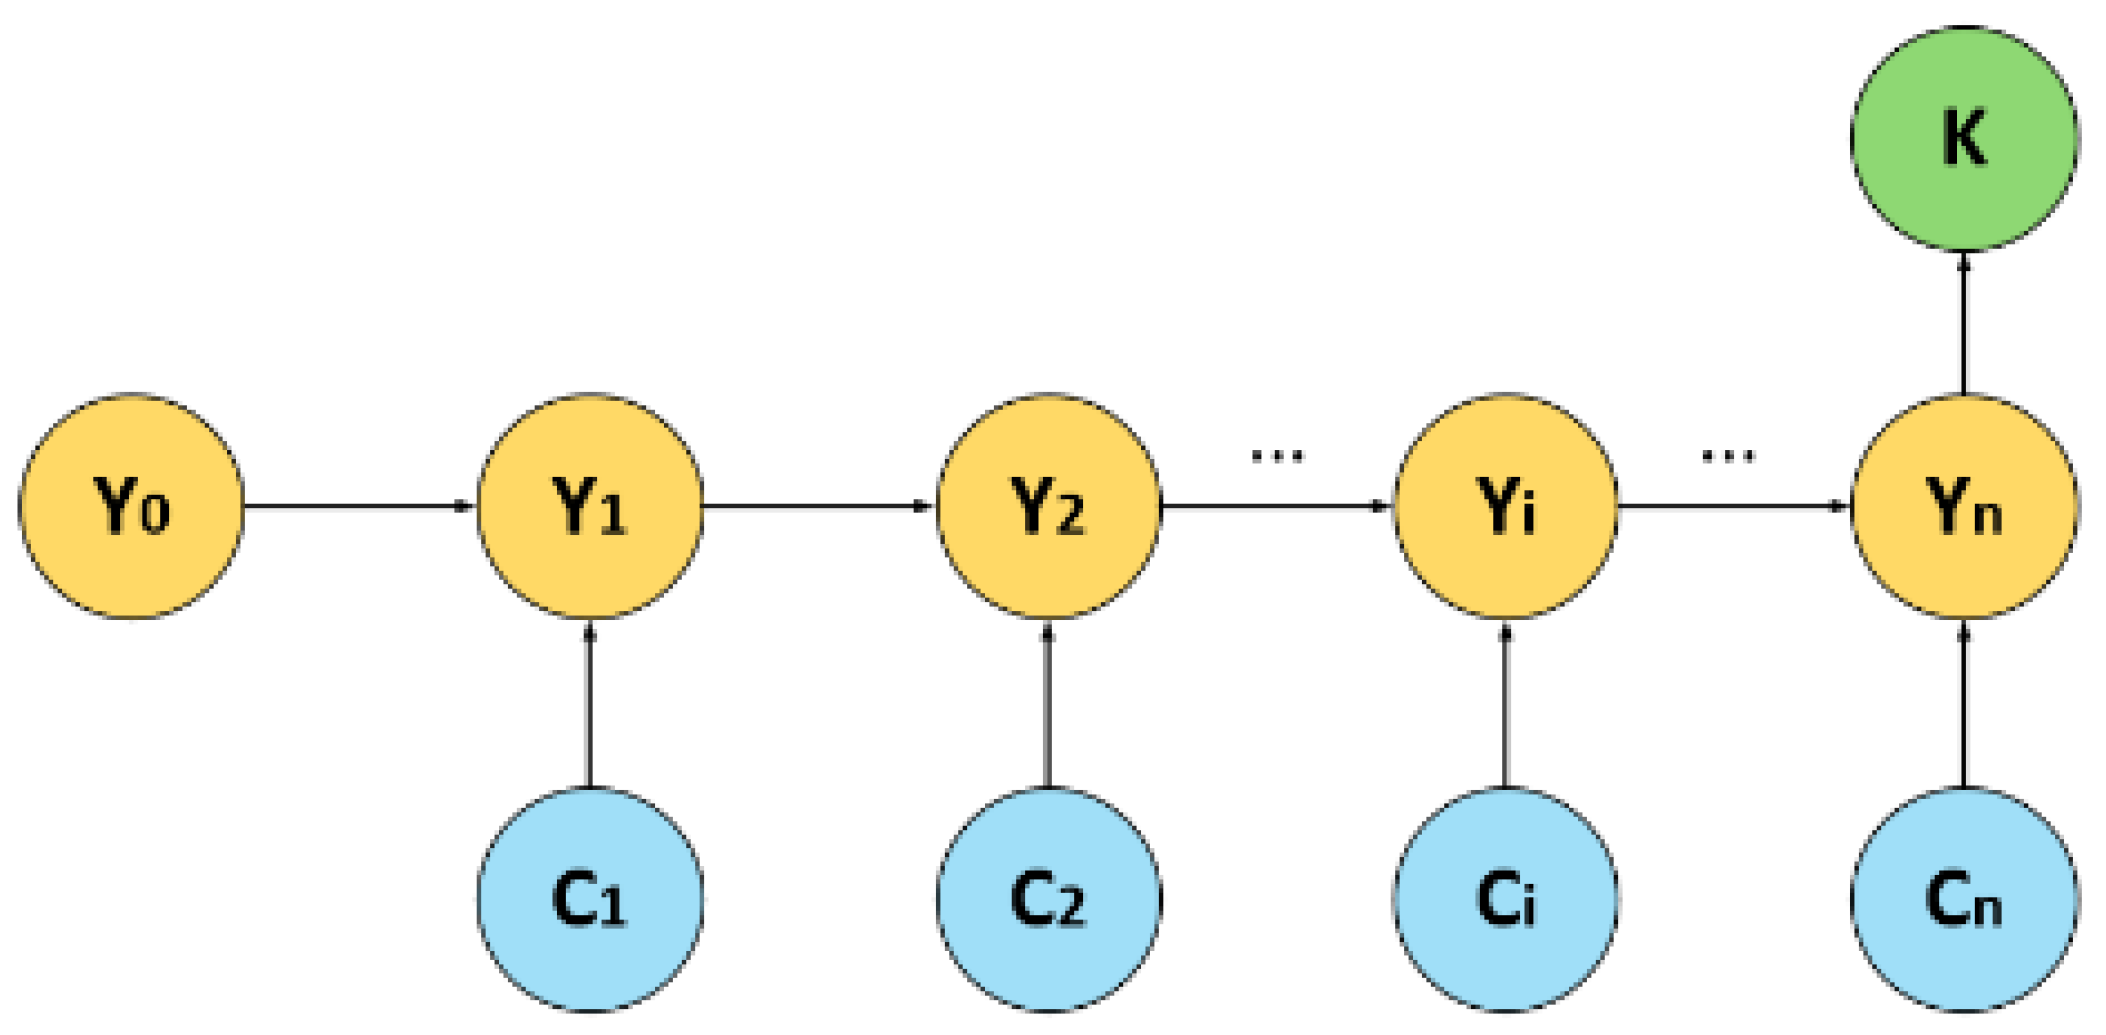
To solve the problem of exponential growth of CPT, the temporal model of noise adder based on Heckerman [36] is used to realize the reconstruction of BN structure. The noise adder is defined as follows: in the convergent BN structure as in Figure 5, there are n binary random variables [C1Cn] with states 1 (system normal operation) and 0 (system failure), which affect the random variable, where denotes a counter with fixed domain [0, n]. The counter is given a 1 if the state of Ci is true. The model simulates the causal effect of variables C1 through Cn on variable k through the overall effect of the contributing variable Ei on the combined parent node with domain [0, i]. Heckerman defines the CPT of the contributing variable as follows:
P E i = k + 1 | E i 1 = k , C i = t r u e = 1 P E i = k | E i 1 = k , C i = f a l s e = 1 i 1 , n .
A voting gate can be represented by a convergent BN structure [37], where the convergent node is K, a binary random variable, denoting the availability of the system with at least k components available. The following equation shows the probabilistic model of voting gate based on BN:
P K = t r u e | c 1 , , c n = 1 i = 1 n t c i k 0 o t h e r s .
The t(x) is an indicator function that takes the value of 1 if and only if it is true, and 0 in other cases.
According to the full probability formula of BN in Equation (13), the marginal probability of K = true is obtained as follows:
P K = t r u e = c 1 , , c n P ( K = t r u e | c 1 , , c n ) P c 1 P c n .
However, when the probability of Equation (18) is 1, the summation value of t(ci) exhibits many possibilities, and only one CPT cannot completely describe its probability model, so variable intermediate variables H are needed to replace the state of summation value of t(ci). The probability model is split, and the CPT logic of the variables H is as follows:
P ( H = h | c 1 , , c n ) = 1 i = 1 n t c i = h 0 o t h e r s .
Since H is a random variable affected by the state of the parent node, so its marginal probability distribution is as follows:
P H = h = c 1 + + c n = h P H = h | c 1 , , c n × P C 1 = c 1 × × P C n = c n .
Since it is necessary to model the probability of a voting gate, the probabilistic relationship between K and N is modeled as follows:
P K = t r u e = h 0 , n P ( K = t r u e | H = h ) × c 1 + + c n = h P H = h | c 1 , , c n × P c 1 P c n A
Equation (22) demonstrates that the challenge of exponential growth in the Conditional Probability Table (CPT) size has been transferred to variable H. Consequently, the voting gate selection logic can be reformulated as the adder structure in Figure 6, while Equation (22)’s probabilistic model becomes mathematically equivalent to Heckerman’s adder model.
A = P Y 0 = 0 × y 1 y n = h i 1 , n P ( Y i = y i | Y i 1 = y i 1 , C i = c i ) ,
where the set of conditional probability equations is
P ( Y i = 0 | Y i 1 = y i 1 , C i = 0 ) = 1 P ( Y i > 0 | Y i 1 = y i 1 , C i = 0 ) = 0 P ( Y i = y i 1 + 1 | Y i 1 = y i 1 , C i = 1 ) = 1 P ( Y i y i 1 + 1 | Y i 1 = y i 1 , C i = 1 ) = 0 P ( Y i = h | Y i 1 = k , C i = c i ) = 1 P Y i < h | Y i 1 = k , C i = c i = 0 .
The value space of Yi in CPT is {0, 1, …, h}, and its value condition is
y i = 0 c i = 0 , y i 1 < h h c i = 0 , y i 1 = h y i 1 + 1 c i = 1 , y i 1 < h h c i = 1 , y i 1 = h .
The contributing variable Ei in the adder has n states and conditionally dependents on the Ei−1 variable, which has n − 1 states, so its CPT scales O(n2), while the number of contributing variables in the adder is n. Thus, the overall space complexity of the probabilistic k-out-of-n model is O(n3). The space complexity is reduced from exponential to polynomial by reconfiguring the BN through the adder, so that the problem of CPT explosion of the voting gate due to the high number of parent nodes can be ignored and the subsequent computation can be completed.

3.4. Multi-Rotor Drone Reliability Assessment Framework

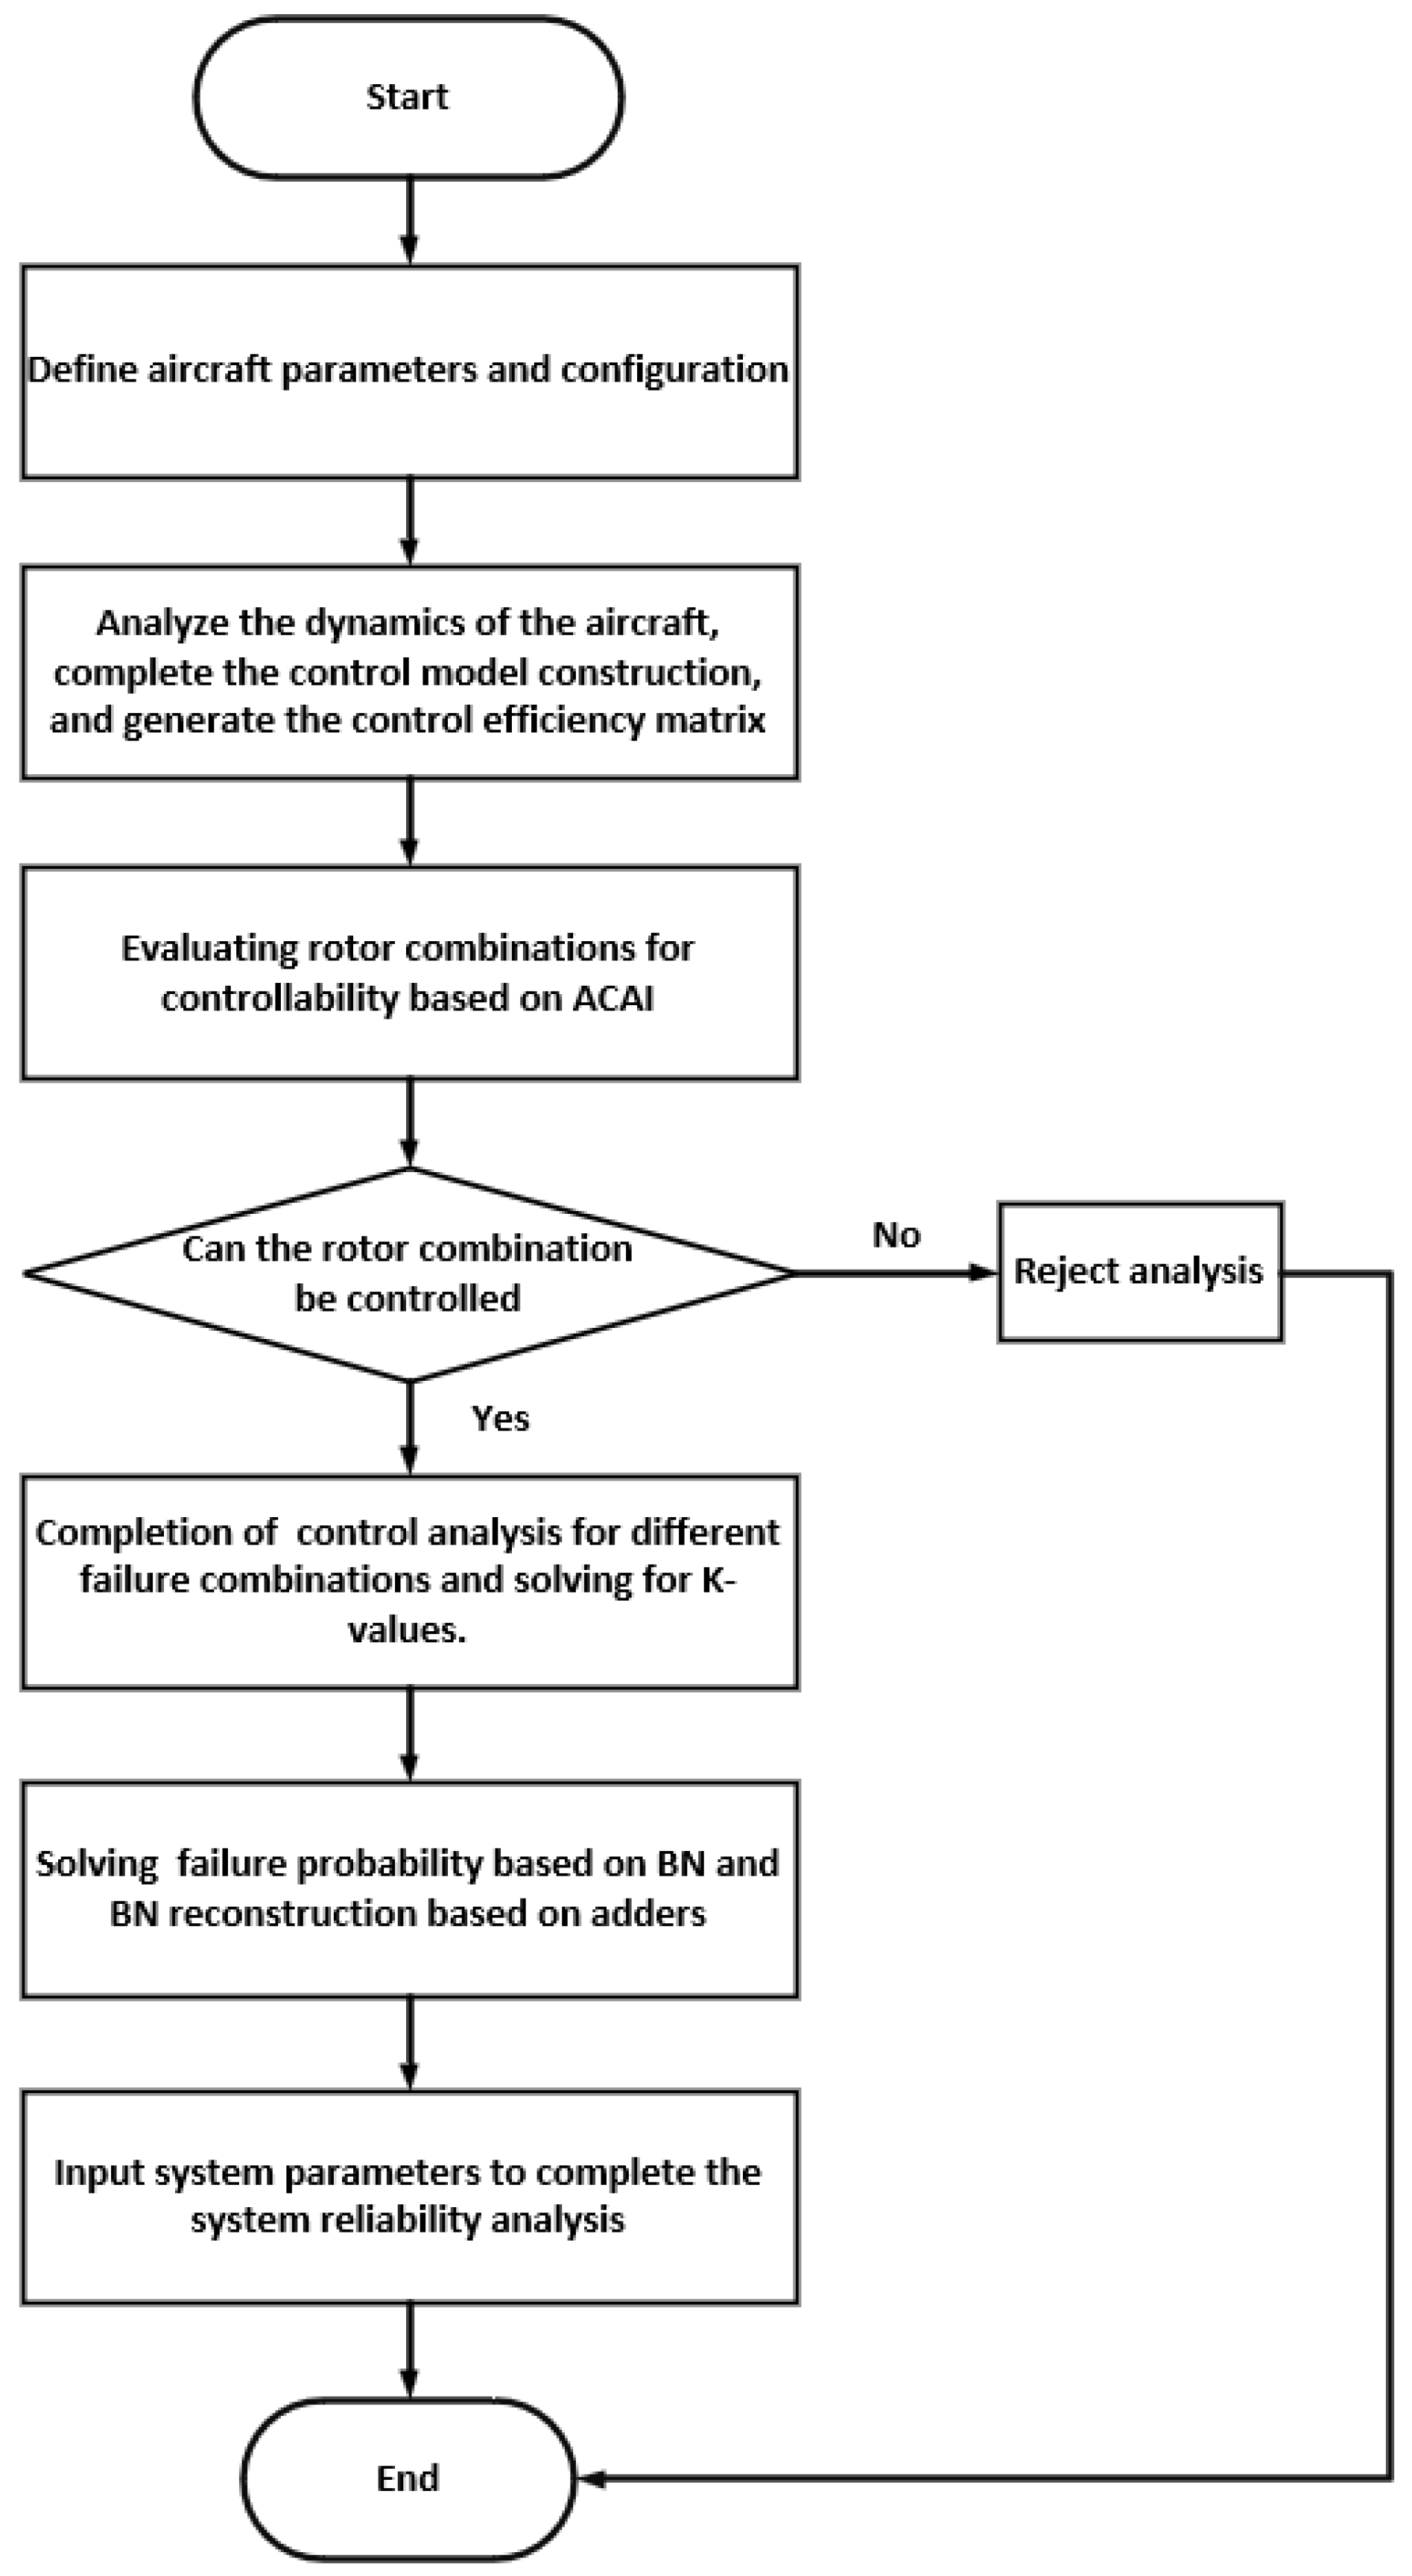
When some multi-rotor drone propulsion units fail, the remaining thrust units may be unable to generate sufficient thrust and torque for translational and rotational control, potentially leading to loss of controllability. Thus, a controllability analysis must evaluate residual thrust/torque to determine system reliability. During drone design, propulsion system components are typically diversified to prevent common-cause failures [38] and accommodate k-value constraints. This heterogeneity yields distinct failure rates per thrust unit, necessitating explicit analysis of time-dependent system reliability. This study employs Bayesian Network (BN) modeling to address this reliability analysis. The framework in Figure 7 formalizes the reliability assessment workflow for multi-rotor drone propulsion systems, with the decision logic applicable to arbitrary drone configurations.

4. Case Study Analysis

Figure 8 illustrates the power unit configuration for a 16-rotor drone as an engineering prototype. The propulsion system consists of 16 power units arranged in a 2 × 8 co-axial circular layout (Figure 2). Each power unit exhibits functional dependencies with its power battery and communication module. This k-out-of-n system requires careful k-value selection during reliability analysis. To address computational explosion in the voting gate, we implement the adder principle, while incorporating trigger units within the Bayesian Network (BN) structure to model functional dependency impacts on system reliability.

4.1. Determination of k-Value in k-Out-of-n System

In the rotor configuration of Figure 2, the gray rotor indicates counterclockwise rotation, and the white rotor indicates clockwise rotation. Table 3 shows the basic physical parameters of the drone. In order to study the propulsion system reliability, it is necessary to firstly analyze the propulsion system’s different failure state controllability degree, and complete the selection of k-value.
Based on the geometrical distribution of the rotor blades with Equations (8) and (9) the 16 rotors drone configuration bf matrix can be obtained.
b f = 1 1 1 1 1 1 1 1 1 1 1 1 1 1 1 1 0 0 2 2 2 2 1 1 2 2 2 2 0 0 2 2 2 2 1 1 2 2 2 2 1 1 2 2 2 2 0 0 2 2 2 2 1 1 2 2 2 2 0 0 2 2 2 2 1 1 1 1 1 1 1 1 1 1 1 1 1 1 1 1
The controllability efficiency matrix Bf is calculated from the following Equation (27) with bf:
M = d i a g k 1 r × k 1 r × k 1 k 2 B f = M × b f .
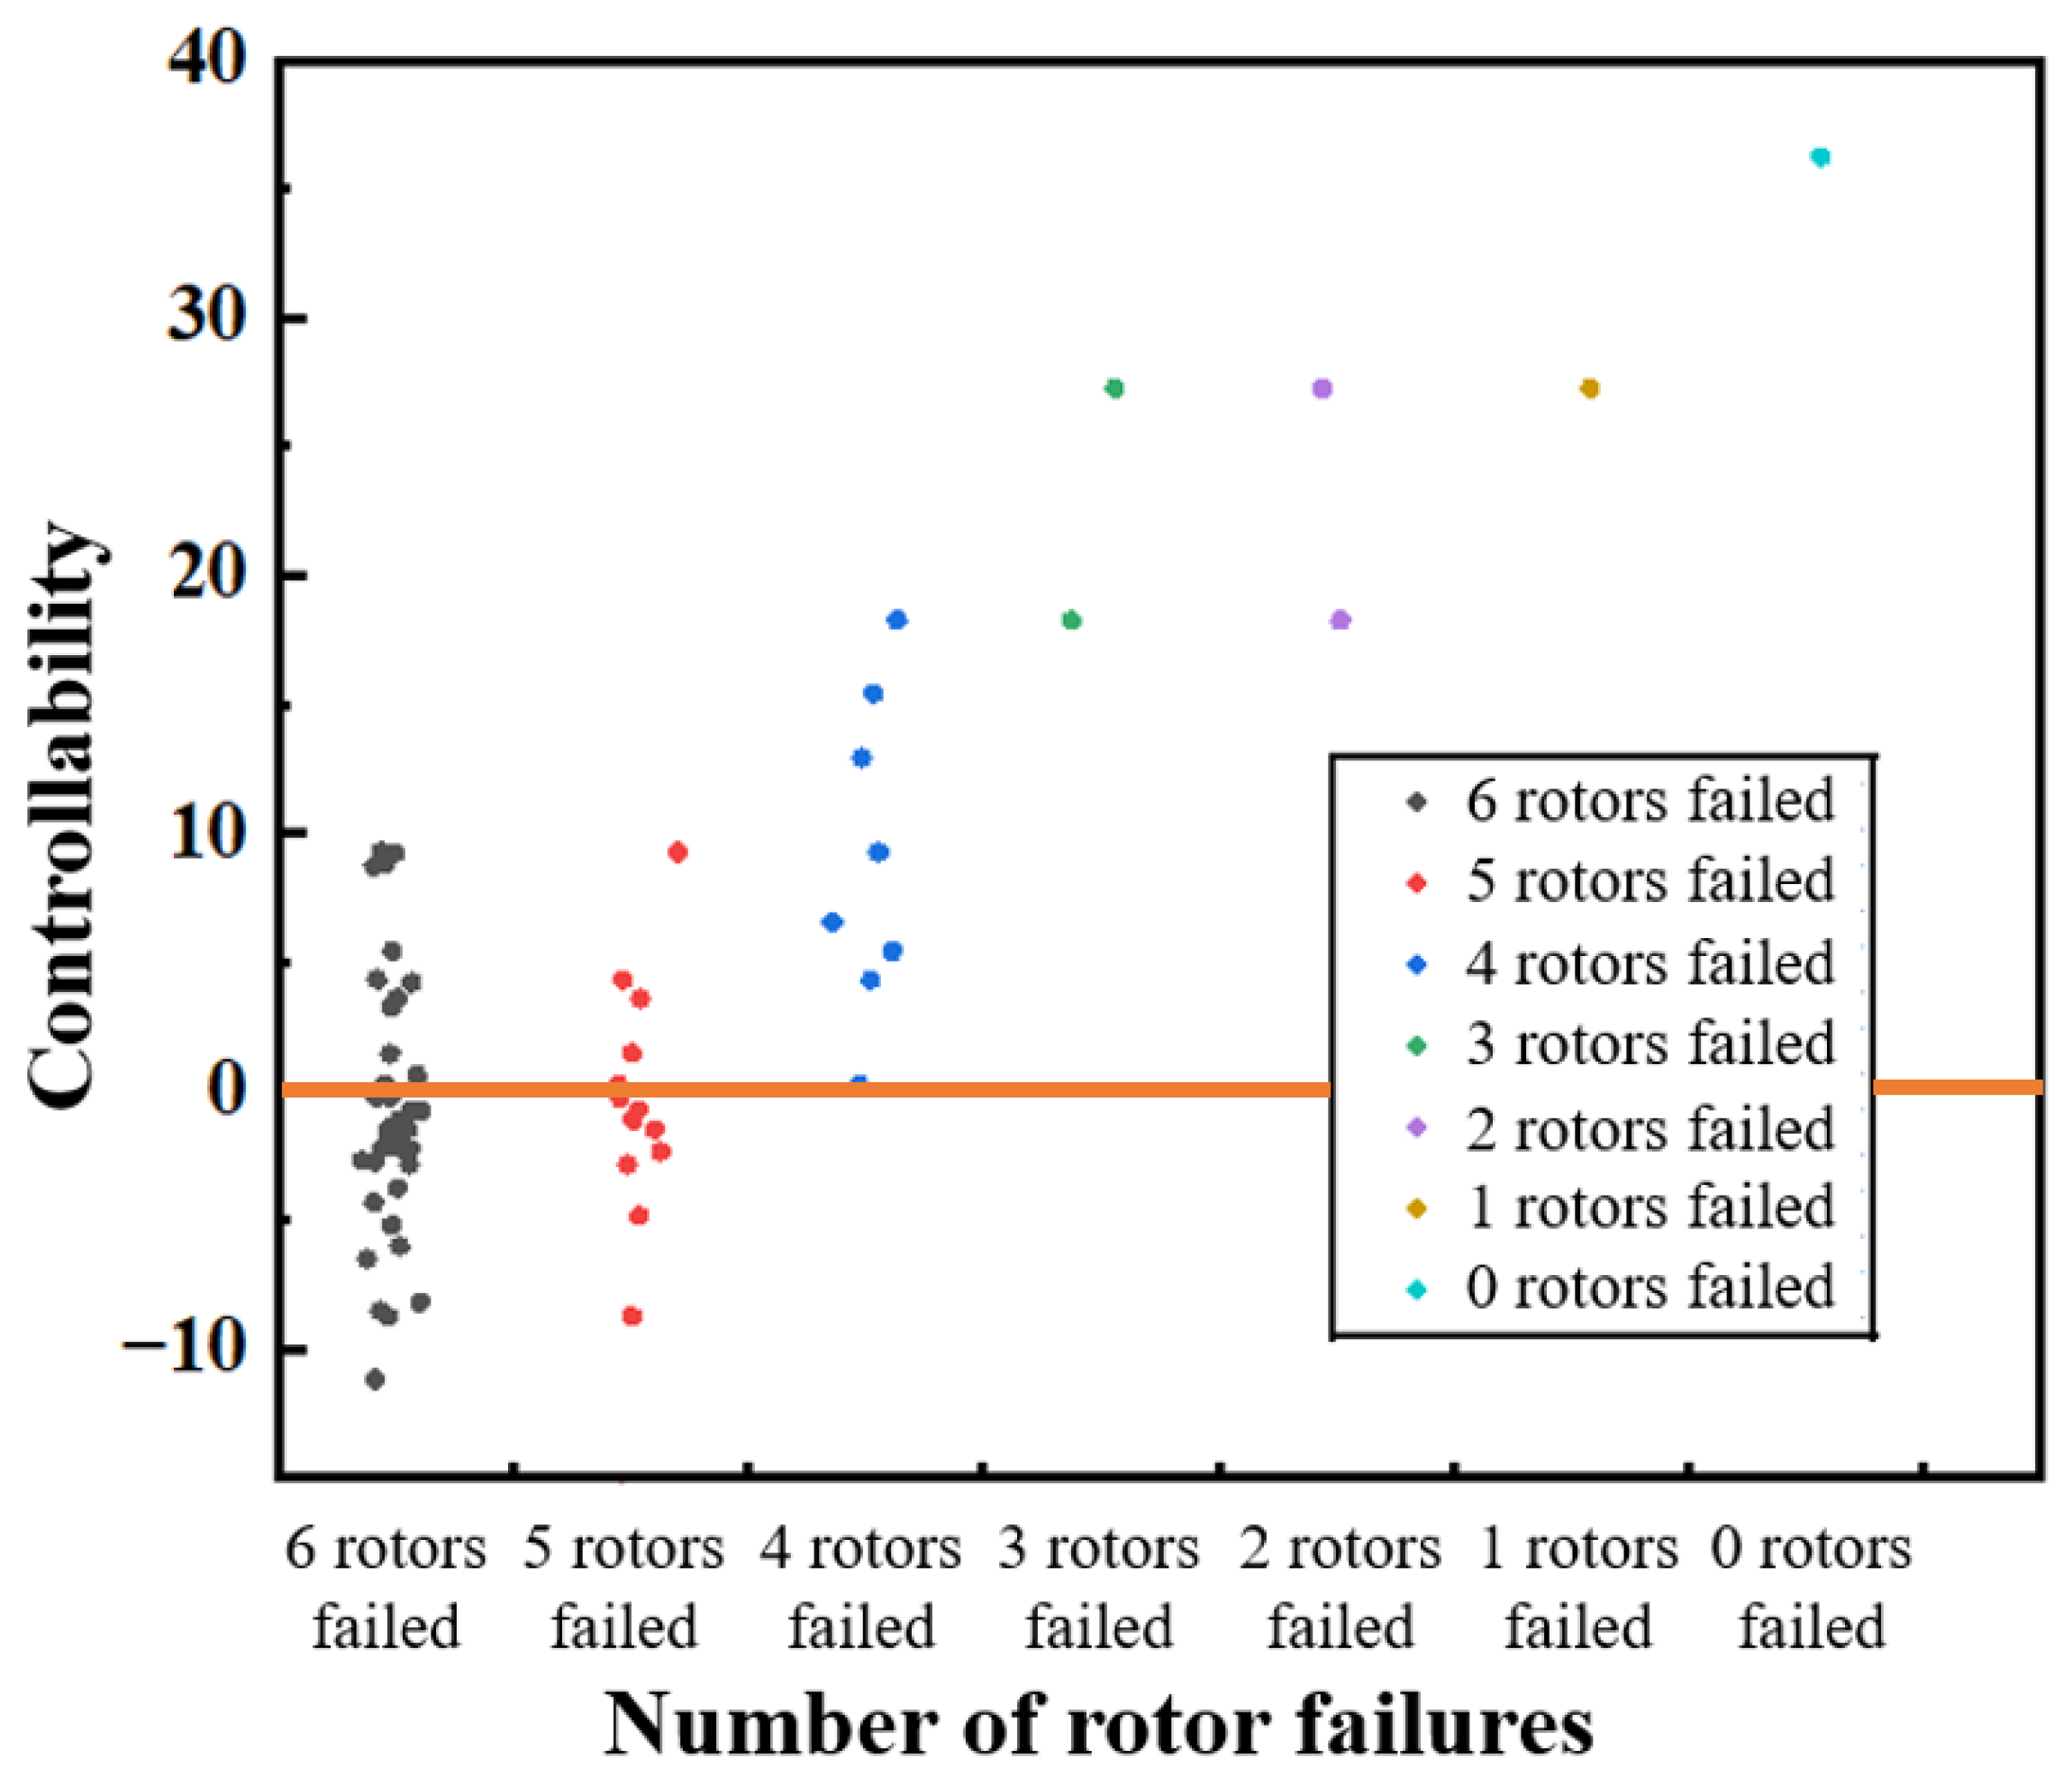
Using the ACAI parameters and determination criteria from Section 1, we calculate the controllability degree of propulsion systems under various failure combinations (Figure 9). Controllable states appear above the horizontal threshold line, while uncontrollable states fall below. Analysis shows that with five rotor failures, the propulsion system becomes uncontrollable (controllability degree < 0), which may lead to the drone not being able to carry out a normal landing or, possibly, a crash. To ensure strict operational safety, the k-value is conservatively set to 4. This 4-out-of-16 system configuration guarantees normal operation with up to 4 rotor failures. To mitigate common cause failures [38], we implement component diversification by selecting four distinct propulsion unit types. This strategy maintains system controllability even if all units of one type fail simultaneously.

4.2. Propulsion System BN Model

When using BN for reliability analysis of the system, the dynamic fault tree model of the system is first mapped to the BN model, and due to the characteristics of FDEP, we need fault tree modeling of different systems, and the fault tree model 1 with “More than 4 propulsion units failed” as the top event is shown in Figure 10a, the fault tree model 2 with “Loss of bus communication” as the top event is shown in Figure 10b, and the fault tree model 3 with “Battery pack loss of power” as the top event is shown in Figure 10c [39].
The propulsion unit comprises propellers, motors, and motor controllers. Failure of any component renders the propulsion unit inoperative. When more than four propulsion units fail, the drone becomes uncontrollable due to propulsion system failure. To enable quantitative reliability assessment, failure probabilities for three fault tree basic events were derived from GJB/Z299C-2006 [40], Electronic Parts Reliability Data [41], and engineering practice (Table 4, Table 5 and Table 6). With FAA “AC 25.1309-1B” guidelines [42], failure rates for “average probability per flight hour” calculations must represent mature constant failure rates: excluding infant mortality and wear-out phases of the bathtub curve. Consequently, our analysis exclusively considers the random failure period, justifying the use of exponential distributions for all component failure rates below.
During the drone design process, in order to prevent single-point failure and common cause failure leading to catastrophic events, four different types of motors are selected to provide power among the 16 propulsion units. Based on the discriminative logic in Figure 3, Ni need to be added to the BN model to represent the available propulsion units. Based on the modeling logic in Figure 4. T denotes the power battery or communication unit, K denotes the propulsion unit, which means that up to 4 rotors fail out of 16 rotors, showing the reliability of the system. The BN model of the propulsion system of drone is shown in Figure 11.
The time slice length is needed in the modeling of dynamic BN, assuming that the average flight time of the multi-rotor drone is 1 h. So we set the interval to 1 h, with Δt = 1, based on the modeling in Section 3.2, to obtain the system conversion probability, dynamizing the BN based on the transformation relationship in Figure 4.
After completing the establishment of CPT based on the fault tree logic, the priori probability of the parent node can be solved, as shown in Table 7. Due to the number of intermediate nodes is 16, when solving the a posteriori probability of its children node K, the size of CPT is 216, which will lead to space explosion, computational load, and other problems that cannot be effectively solved. In order to solve the CPT space explosion, we use the adder model for Ni and K.

4.3. Reliability and Safety Analysis

4.3.1. Multi-Rotor Drone Safety Analysis

Leveraging the computational framework established in Section 2, the top event failure probability is computed via the adder model. This approach exploits causal independence between input events to reduce the Conditional Probability Table (CPT) spatial complexity from exponential to polynomial order for large-scale k-out-of-n systems. Our calculated failure probability for the top event is 1.407 × 10⁻⁷. Per drone airworthiness requirements, the catastrophic failure conditions require both qualitative and quantitative assessment. For operations in sparsely populated areas, the quantitative safety objective is 1 × 10⁻⁶ per flight hour. The computed result (1.407 × 10⁻⁷ < 1 × 10⁻⁶) satisfies this safety threshold, thereby meeting airworthiness certification requirements.

4.3.2. Analysis of FDEP’s Impact on Reliability

Figure 12 shows the results of the cumulative probability calculation of the system states. Under the modeling of the adder, the failures of 16 rotors are simplified into 17 system states, state0 indicates 0 rotor working and state1 indicates 1 rotor working. As the number of rotor failures increases, the system degrades and its probability of being in a good state gradually decreases, while the probability of being in a poor state increase.
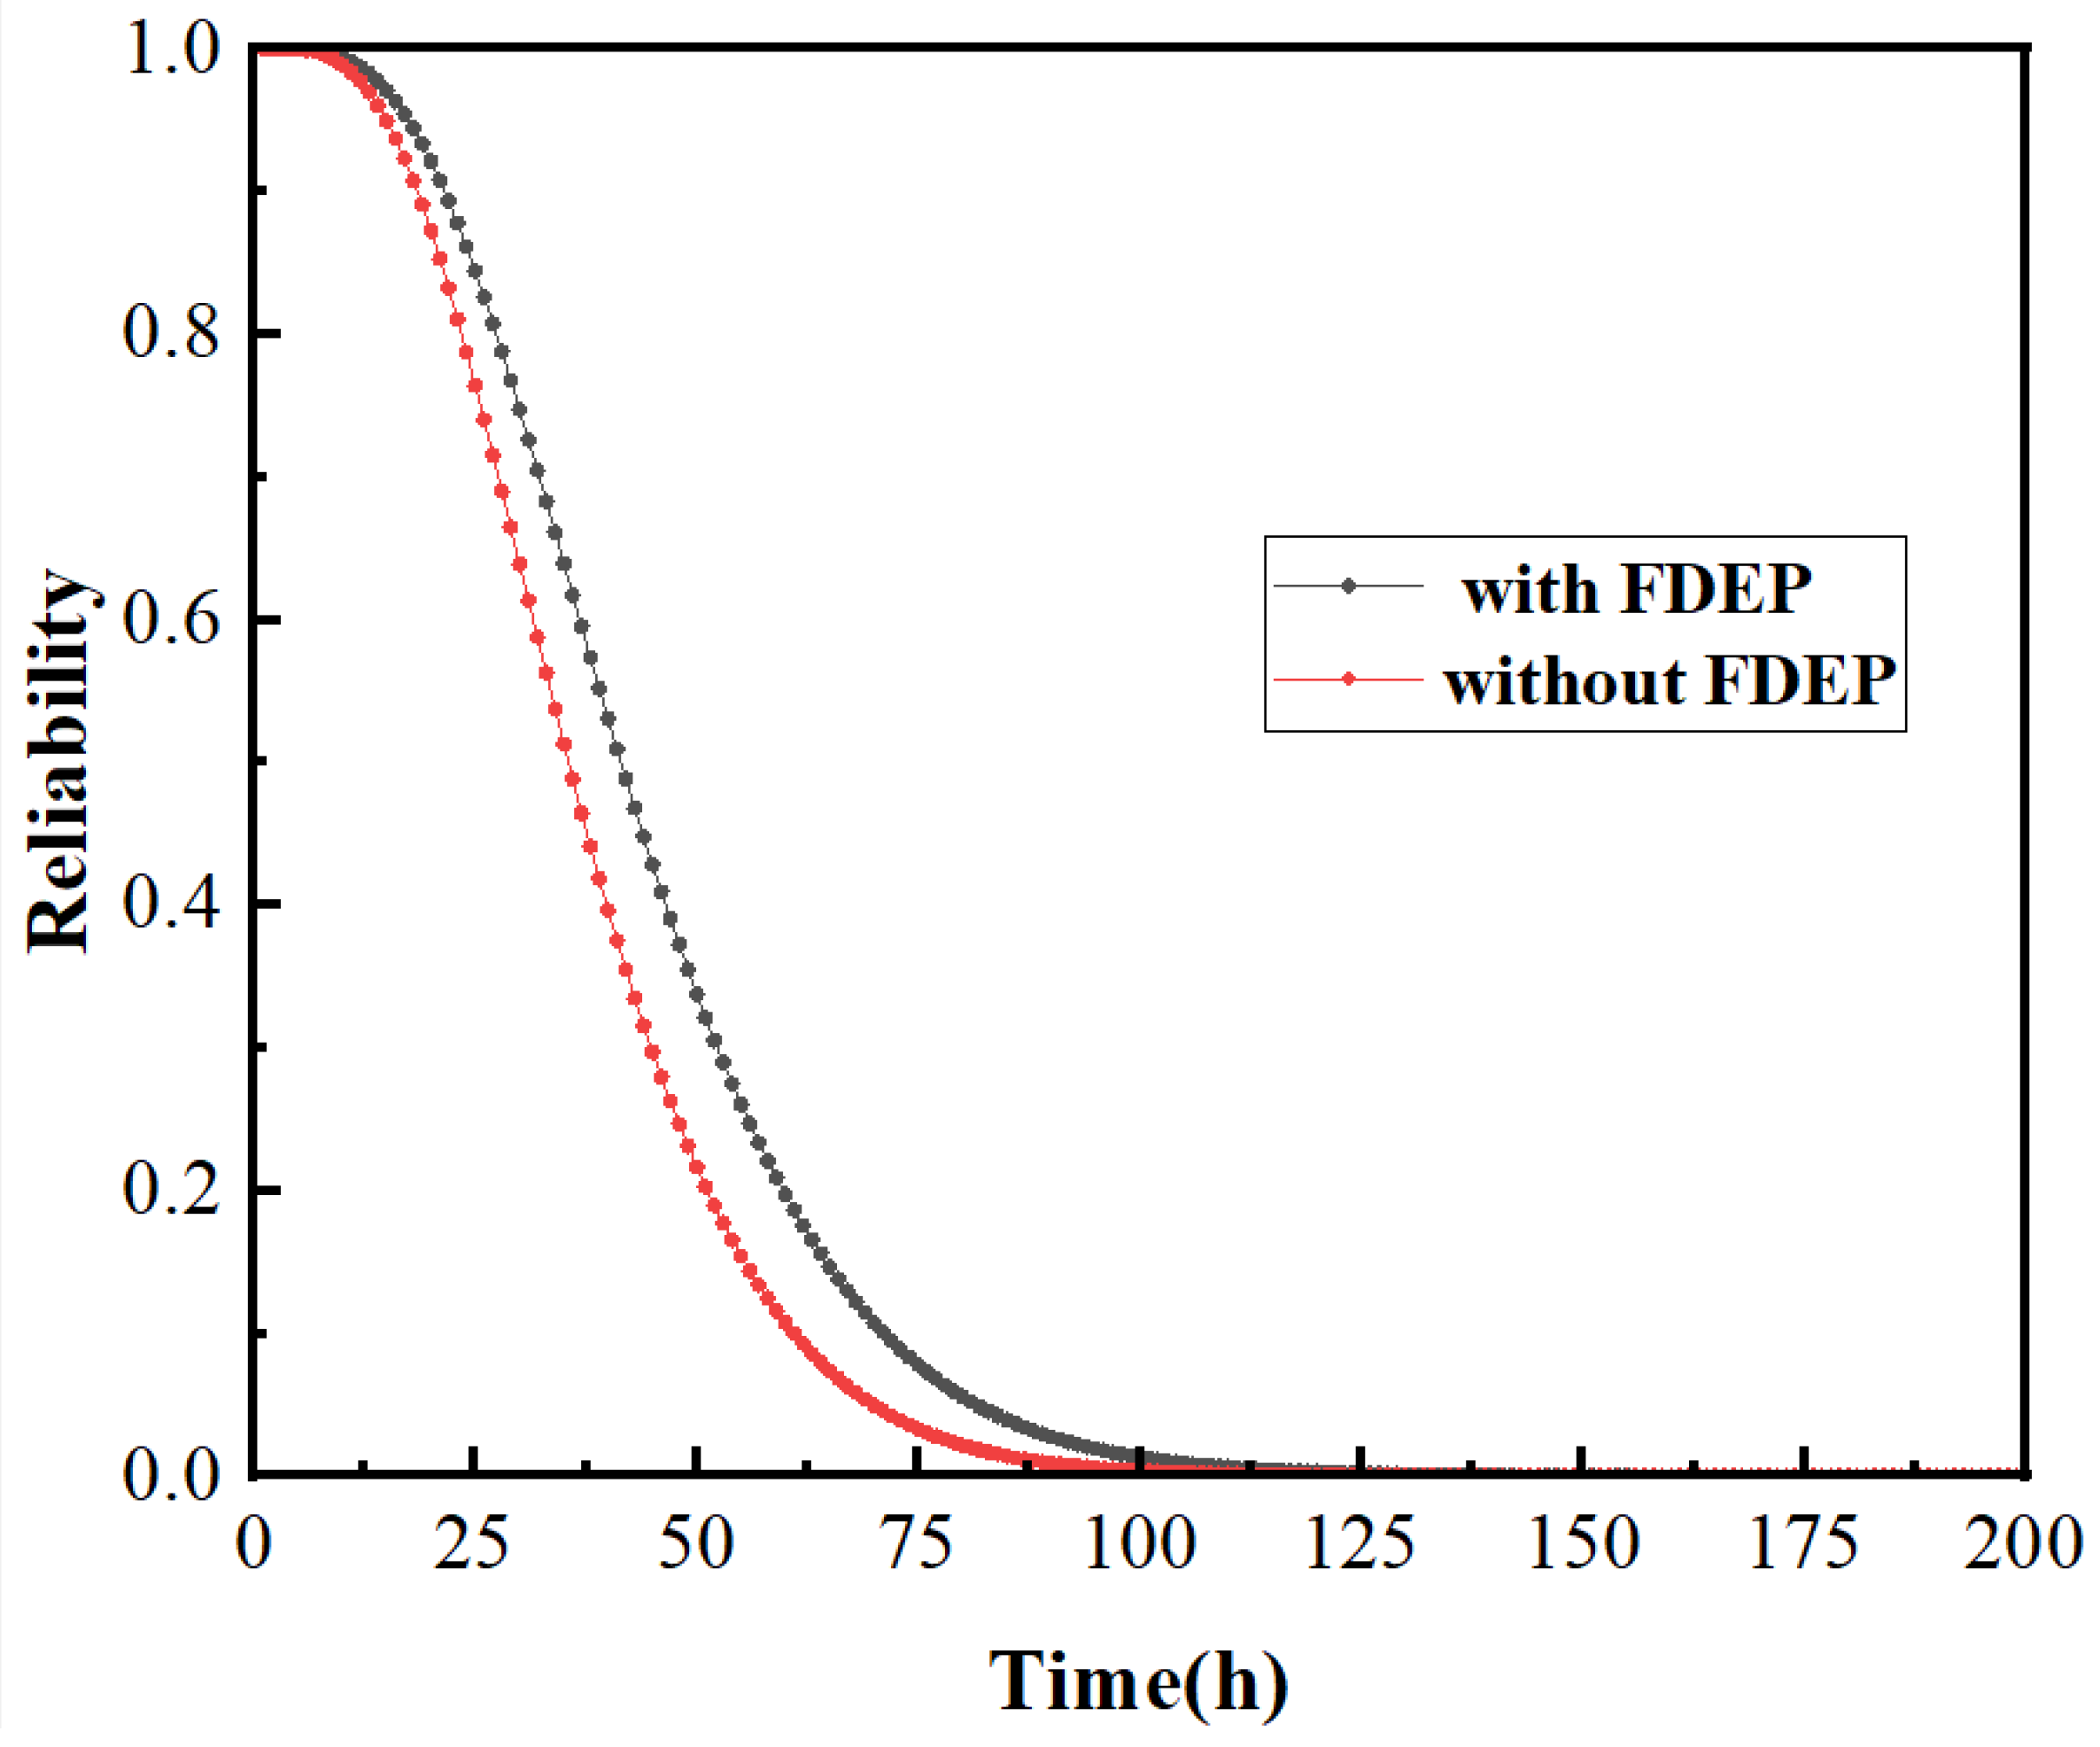
To further investigate the effect of FDEP on the reliability of the system, the reliability curve of the system is plotted as shown in Figure 13.
Figure 13 shows the results of changes in system reliability over time, based on the reliability curve, the time at which its curve inflection point occurs helps operators determine an appropriate maintenance schedule, the accelerated degradation of system reliability after 40 h when considering the effects of FDEP, and the requirement for major repairs or unit replacements after 40 h of drone operation to ensure high system reliability. When FDEP is not considered, system reliability is underestimated if the trigger component is treated as a series parallel system of functional components, but the trigger a component is designed only to provide auxiliary functions, affecting functional components in the form of conditional probabilities as an independent variable in the computing logic of the adder model, rather than directly affecting functional components as a series parallel system in the fault tree, resulting in the reliability of functional components being underestimated.

4.3.3. Motor Importance Analysis

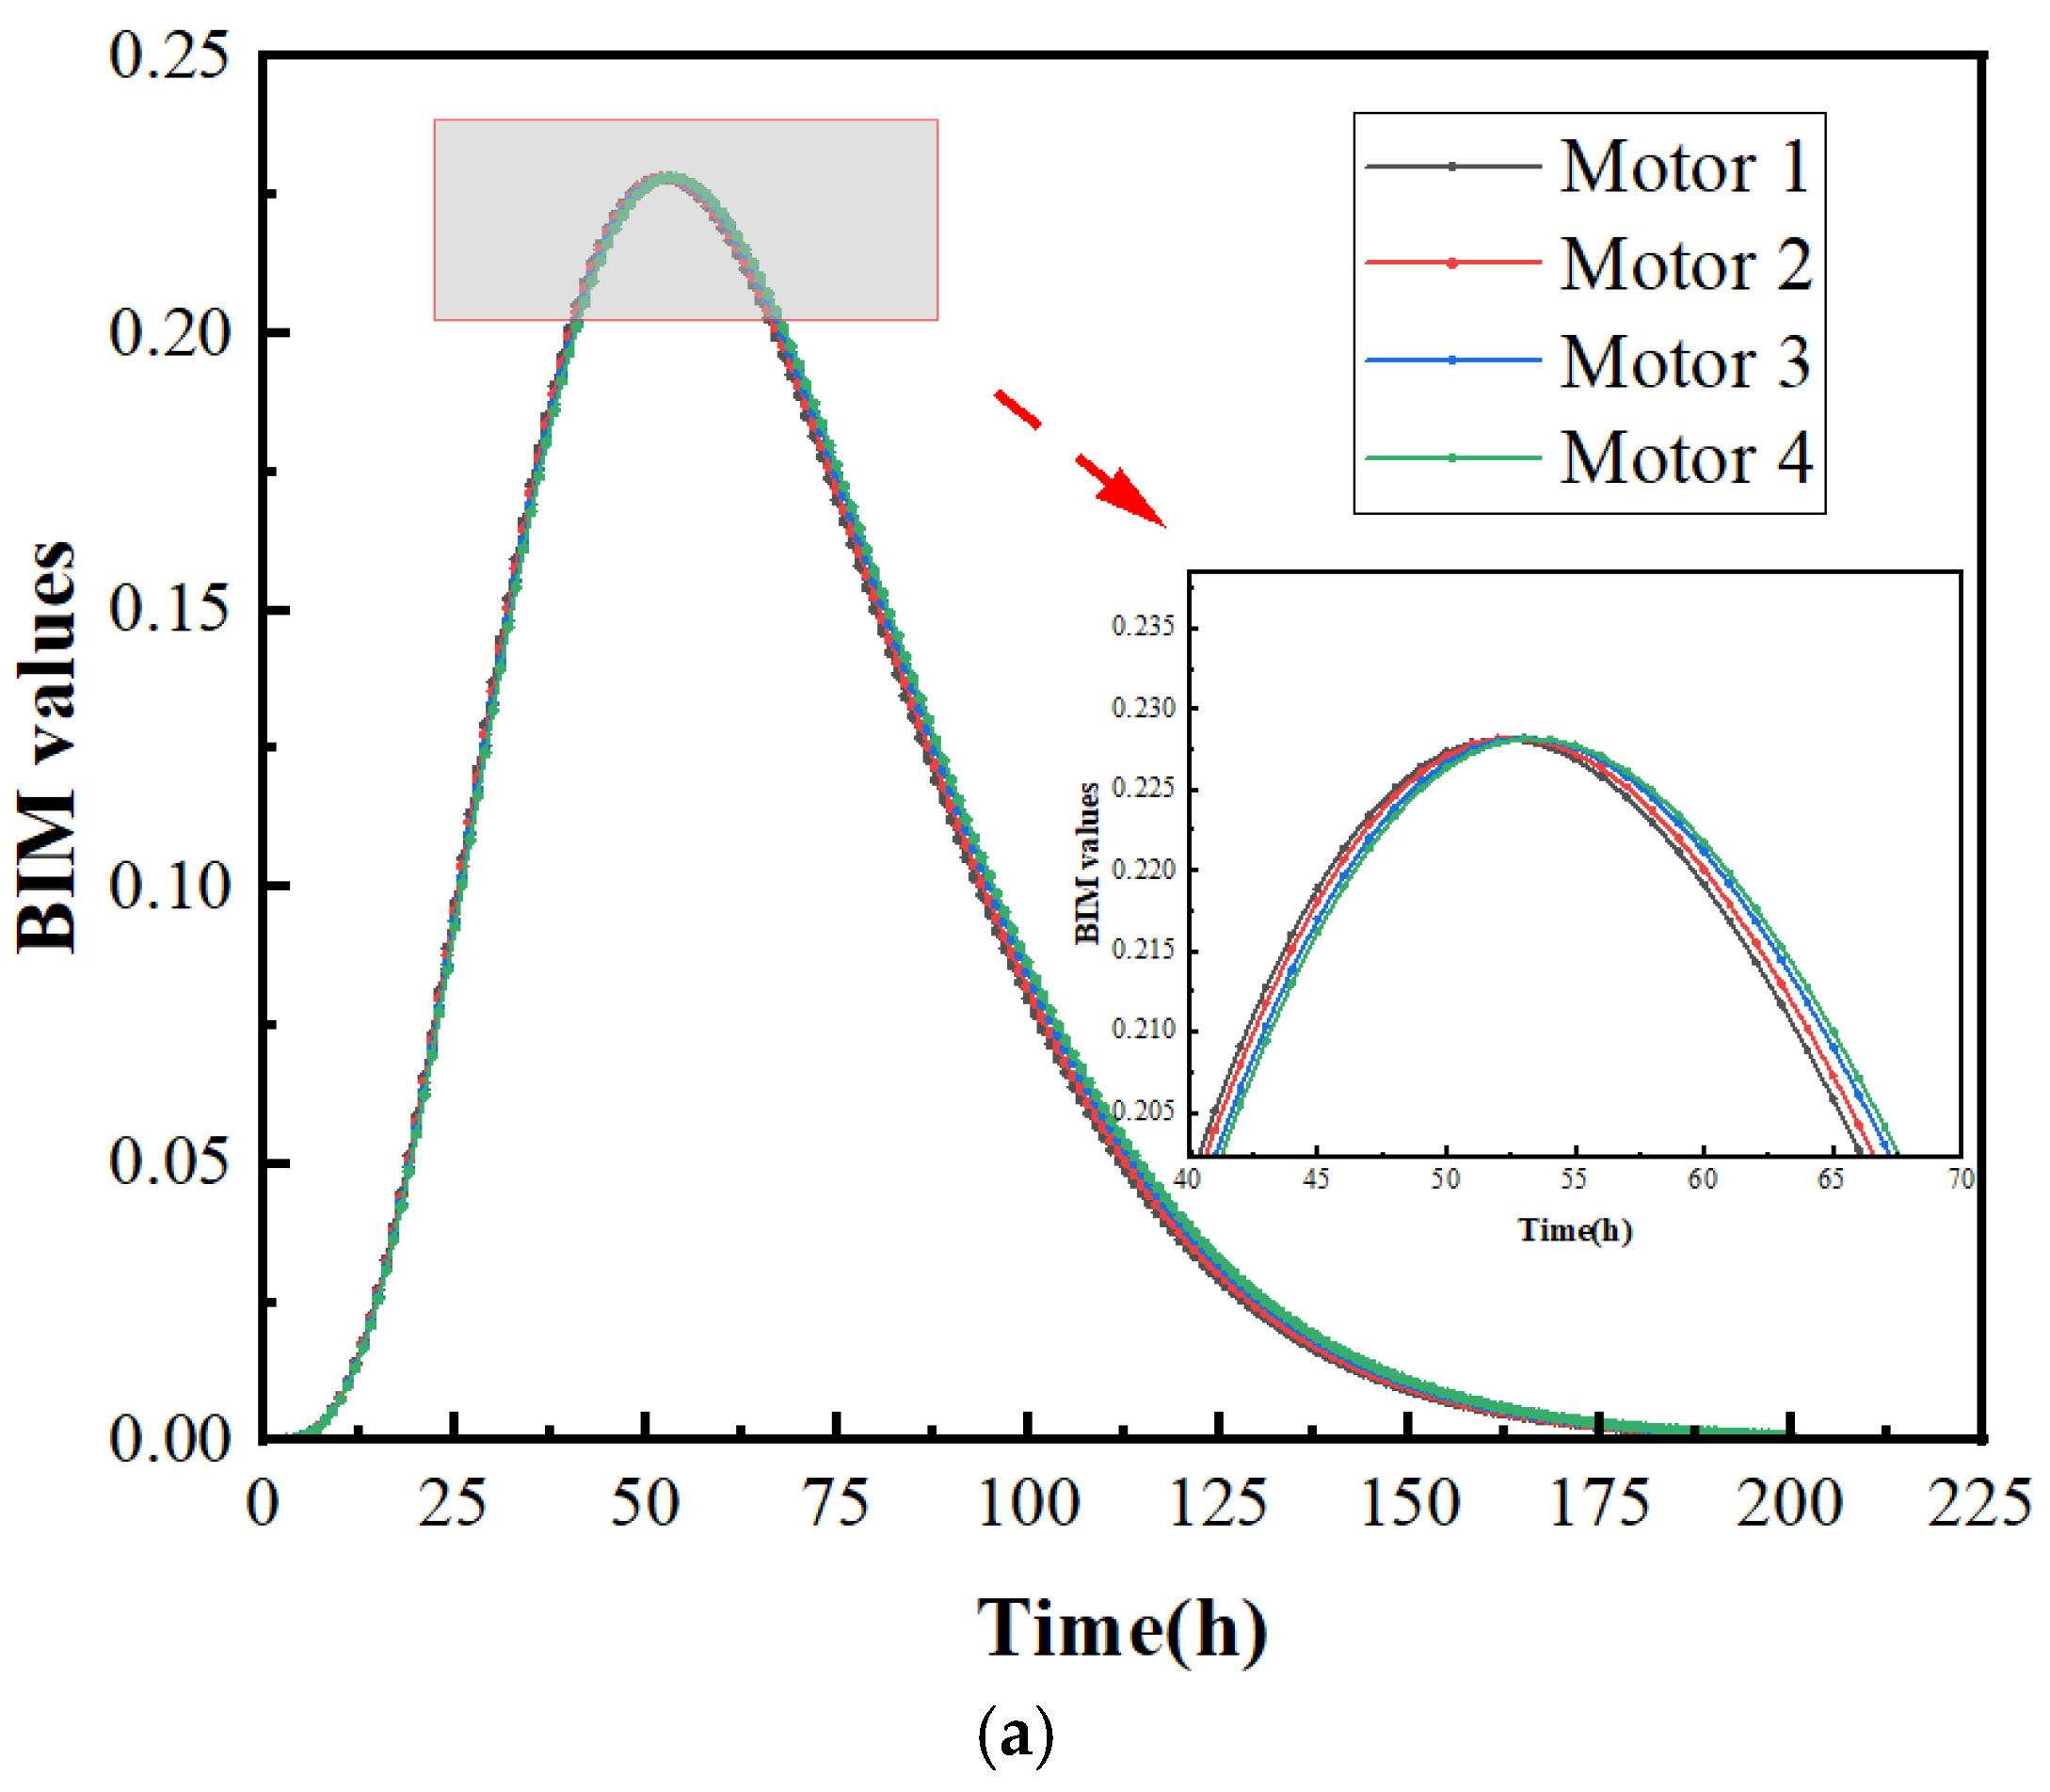
Analyzing component-to-system reliability relationships requires criticality assessment via Birnbaum importance metrics [43]. This quantifies individual motor reliability contributions to overall system reliability, enabling maintenance teams to prioritize high-impact components. The inflection point in the importance curve further serves as a proactive maintenance scheduling trigger for system dynamic changes.
Importance analysis is performed for the ith motor (Fi(t)), its importance is calculated as shown in Equation (28), and the results are shown in Figure 14:
I F i B t = P r { K t = 1 | F i t = 1 } P r { K t = 1 | F i t = 0 } .
Combined with Table 7, it can be seen from Figure 14a that Class 4 motor have the highest reliability and their importance has been kept high in the early stage of system operation. After the inflection point, the importance of Class 1 motors, which have the lowest reliability, accounts for a higher percentage, due to the fact that the system relies on the high reliability motors to maintain redundancy in the early stage of system operation. However, as the low reliability motors gradually fail, the remaining low reliability motors become the weak part of the system reliability, and their impact (importance) increases, so that an inflection point occurs.
This phenomenon reflects the dynamic characteristics of bottleneck transfer in the redundant system. The inflection point corresponds to a time of 52.5 h in Figure 14a without considering functional dependence, while the inflection point corresponds to a time of 37.5 h in Figure 14b, indicating that the functional dependence characteristics have a significant impact on the dynamic changes in the propulsion system. The inflection point of the importance curve can guide the dynamic adjustment of the maintenance strategy, and the maintenance resources should be allocated to the high-reliability motors with greater importance in the early operation period, and when the operation time is close to the inflection point, the maintenance resources need to be allocated to the low-reliability motors with lower importance, so as to avoid the rapid degradation of the system reliability after the inflection point, and to ensure the high reliability of the system.

5. Conclusions

The expanding operational scope of drones necessitates increased rotor configurations, which introduces computational complexity explosion in propulsion system reliability analysis. Simultaneously, determining the maximum tolerable rotor failures becomes essential for defining reliability objectives. Crucially, propulsion system functionality depends on power and communication systems, creating inherent functional dependencies. This paper addresses these challenges through the following:
(1)
A reliability analysis method of propulsion system based on controllability is proposed for these problems, the k-value is scientifically selected. We complete its control model construction by modeling the dynamics of the airframe and conservatively seeking the k-value by taking into account the controllability analysis of the drone in the case of roll, yaw, pitch, and so on.
(2)
Due to the selection logic brought by the voting gate, the fault tree, plain BN cannot be analyzed. Through adder modeling, the BN structure is reconstructed to reduce the space complexity from exponential to polynomial, so as to solve the problem of CPT explosion brought by a large number of parent nodes.
(3)
The system reliability considering FDEP was calculated. By comparative analysis, we find that the system reliability would be underestimated if the trigger component is used as a series parallel system of function components. At the same time, the importance of different motors is analyzed, and the curve inflection point can guide the dynamic adjustment of maintenance strategy.
Our methodology establishes reliable objectives for drone propulsion systems grounded in control theory principles, applicable across diverse drone configurations. We resolve computational complexity explosion from excessive rotors, eliminating rotor count constraints in reliability analysis. The resultant reliability and criticality curves enable dynamic maintenance scheduling to sustain system reliability. Crucially, functional dependence analysis demonstrates that propulsion system reliability can only be accurately quantified through independent system evaluation, otherwise, reliability would be artificially underestimated.

Author Contributions

Investigation, N.X.; Resources, N.X.; Methodology, X.Q.; Software, B.L.; Validation, N.X., X.C. and X.Q.; Data curation, B.L.; Writing—original draft preparation, X.Q.; Writing—review and editing, X.Q. and N.X.; Supervision, X.C. All authors have read and agreed to the published version of the manuscript.

Funding

This research received no external funding.

Data Availability Statement

Data are contained within the article and references. For further inquiries, please contact the corresponding authors.

Conflicts of Interest

The authors declare no conflict of interest.

Nomenclature

Abbreviations
FDEPFunctional Dependence
BNBayesian Network
DBNDynamic Bayesian Network
PTVDDBNParameter Time-Varying Discrete Dynamic Bayesian Network
DFSDepth-First Search
ACAIAvailable Control Authority Index
CPTConditional Probability Table
PDUPower Distribution Unit
MCSsMinimum Cut Sets
FTAFault Tree Analysis
SATSatisfiability problem
MCVMinimal Cut Vote
Latin Variables
HAltitude
ϕRoll angle
ΘPitch angle
ΨYaw angle
vhVertical speed
pRoll angular velocity
qPitch angular velocity
rYaw angular velocity
TThrust generated by rotor blades
L, M, NThree-axis moments of drone
maMass of drone
Jx, Jy, JzMoment of inertia
FmProjection of lift generated by mth rotor
ΩmRotational speed of mth rotor
k1Lift coefficient
k2Drag coefficient
rRotor distance from center of fuselage
LmCoordinates of rotor center on fuselage coordinate system
M1x, M1y, M1zThree-axis lift moment
H2mCollection of antitorque
BfControl efficiency matrix
bmContribution factor of mth rotor
δΩBoundaries of Ω
ΩcComplementary set of Ω
ρAvailable Control Authority Index (ACAI)
Pa(Xi)Set of parent nodes of Xi
Tiith trigger component
Fiith functional component
Piith component state transfer probability
λiFailure rate of ith component
t(x)Indicator function
NiIntermediate variables for logical judgments in Bayesian networks
ΔtTime interval
IBFi(t)Birnbaum importance of Fi

References

  1. Xing, L.; Johnson, B.W. Reliability theory and practice for unmanned aerial vehicles. IEEE Internet Things J. 2022, 10, 3548–3566. [Google Scholar] [CrossRef]
  2. Watkins, S.; Burry, J.; Mohamed, A.; Marino, M.; Prudden, S.; Fisher, A.; Kloet, N.; Jakobi, T.; Clothier, R. Ten questions concerning the use of drones in urban environments. Build. Environ. 2020, 167, 106458. [Google Scholar] [CrossRef]
  3. Amici, C.; Ceresoli, F.; Pasetti, M.; Saponi, M.; Tiboni, M.; Zanoni, S. Review of propulsion system design strategies for unmanned aerial vehicles. Appl. Sci. 2021, 11, 5209. [Google Scholar] [CrossRef]
  4. Xing, L.D.; Levitin, G.; Wang, C.N. Functional Dependence. In Dynamic System Reliability: Modeling and Analysis of Dynamic and Dependent Behaviors; Wiley: Hoboken, NJ, USA, 2019; pp. 61–82. [Google Scholar] [CrossRef]
  5. Hua, D.; Elsayed, E.A. Reliability estimation of k-out-of-n pairs: G balanced systems with spatially distributed units. IEEE Trans. Reliab. 2016, 65, 886–900. [Google Scholar] [CrossRef]
  6. Endharta, A.J.; Yun, W.Y.; Ko, Y.M. Reliability evaluation of circular k-out-of-n: G balanced systems through minimal path sets. Reliab. Eng. Syst. Saf. 2018, 180, 226–236. [Google Scholar] [CrossRef]
  7. Guo, J.; Elsayed, E.A. Reliability of balanced multi-level unmanned aerial vehicles. Comput. Oper. Res. 2019, 106, 1–13. [Google Scholar] [CrossRef]
  8. Cho, Y.; Baik, S.M.; Ko, Y.M. Reliability Improvement of Circular k-out-of-n: G Balanced Systems through Center of Gravity. IEEE Access 2023, 11, 91407–91422. [Google Scholar] [CrossRef]
  9. Chamseddine, A.; Sadeghzadeh, I.; Zhang, Y.; Theilliol, D.; Khelassi, A. Control allocation for a modified quadrotor helicopter based on reliability analysis. In Proceedings of the Infotech@Aerospace, Garden Grove, CA, USA, 19–21 June 2012. [Google Scholar] [CrossRef]
  10. Brammer, R.F. Controllability in linear autonomous systems with positive controllers. SIAM J. Control. 1972, 10, 339–353. [Google Scholar] [CrossRef]
  11. Du, G.-X.; Quan, Q. Optimization of multicopter propulsion system based on degree of controllability. J. Aircr. 2019, 56, 2062–2069. [Google Scholar] [CrossRef]
  12. Ghosh, S.; Siddhardha, K. Mission Specific Quadrotor Reliability Analysis Framework. In Proceedings of the 2021 International Conference on Electrical, Computer, Communications and Mechatronics Engineering (ICECCME), Mauritius, 7–8 October 2021; IEEE: New York, NY, USA, 2021; pp. 1–6. [Google Scholar] [CrossRef]
  13. Yu, X.; Chen, Y.; Kang, R. Failure mechanism behavior and reliability of non-repairable system with functional dependence. In Proceedings of the International Conference System Reliability and Safety, Milan, Italy, 20–22 December 2017; IEEE: New York, NY, USA, 2017. [Google Scholar] [CrossRef]
  14. Zheng, Y.-X.; Zhang, B.; Liu, Y. Reliability Assessment of Reconfigurable k-out-of-n Systems with Functional Dependency. IEEE Trans. Reliab. 2024. [Google Scholar] [CrossRef]
  15. Boudali, H.; Dugan, J.B. A discrete-time Bayesian network reliability modeling and analysis framework. Reliab. Eng. Syst. Saf. 2005, 87, 337–349. [Google Scholar] [CrossRef]
  16. Xing, L.; Morrissette, B.A.; Dugan, J.B. Efficient analysis of imperfect coverage systems with functional dependence. In Proceedings of the 2010 Proceedings-Annual Reliability and Maintainability Symposium (RAMS), San Jose, CA, USA, 25–28 January 2010; IEEE: New York, NY, USA, 2010; pp. 1–6. [Google Scholar] [CrossRef]
  17. Biere, A.; Heule, M.; Van Maaren, H.; Walsh, T. (Eds.) Handbook of Satisfiability; IOS Press: Amsterdam, The Netherlands, 2009; Volume 185. [Google Scholar]
  18. Castellini, C.; Giunchiglia, E.; Tacchella, A. SAT-based planning in complex domains: Concurrency, constraints and nondeterminism. Artif. Intell. 2003, 147, 85–117. [Google Scholar] [CrossRef]
  19. Clarke, E.; Kroening, D.; Sharygina, N.; Yorav, K. Predicate abstraction of ANSI-C programs using SAT. Form. Methods Syst. Des. 2004, 25, 105–127. [Google Scholar] [CrossRef]
  20. Eén, N.; Sörensson, N. An Extensible SAT-Solver. In International Conference on Theory and Applications of Satisfiability Testing; Springer: Berlin/Heidelberg, Germany, 2003. [Google Scholar] [CrossRef]
  21. Zhao, Y.; O’Leary, J. Solving Large Fault Trees with Importance Sampling and Tree Search. In Proceedings of the 2024 Annual Reliability and Maintainability Symposium (RAMS), Albuquerque, NM, USA, 22–25 January 2024; IEEE: New York, NY, USA, 2024. [Google Scholar] [CrossRef]
  22. Luo, W.; Wei, O.; Wan, H. SATMCS: An Efficient SAT-Based Algorithm and Its Improvements for Computing Minimal Cut Sets. IEEE Trans. Reliab. 2020, 70, 575–589. [Google Scholar] [CrossRef]
  23. Cortés, J.; Di Martino, D.; Duran, D.; López, J.; Pons-Prats, J.; Sánchez, J. Development and implementation of a direct evaluation solution for fault tree analyses competing with traditional minimal cut sets methods. IEEE Trans. Reliab. 2022, 72, 248–257. [Google Scholar] [CrossRef]
  24. Xiang, J.; Yanoo, K.; Maeno, Y.; Tadano, K.; Machida, F.; Kobayashi, A.; Osaki, T. Efficient analysis of fault trees with voting gates. In Proceedings of the 2011 22nd International Symposium on Software Reliability Engineering, Hiroshima, Japan, 29 November–2 December 2011; IEEE: New York, NY, USA, 2011. [Google Scholar] [CrossRef]
  25. Wang, J.; Chen, S.; Wang, F.; Hu, L. A new decomposition algorithm for complex voting gates processing in qualitative fault tree analysis. Proc. Inst. Mech. Eng. Part O J. Risk Reliab. 2015, 229, 568–575. [Google Scholar] [CrossRef]
  26. Ducard, G.J.J.; Hua, M.-D. Discussion and practical aspects on control allocation for a multi-rotor helicopter. Int. Arch. Photogramm. Remote Sens. Spat. Inf. Sci. 2012, 38, 95–100. [Google Scholar] [CrossRef]
  27. Yang, Y.; Zhang, S.; Deng, J. Dynamics Modeling and Flight Control of a Dual-rotor Tail-sitter DRONE. In Proceedings of the 2023 35th Chinese Control and Decision Conference (CCDC), Yichang, China, 20–23 May 2023; IEEE: New York, NY, USA, 2023; pp. 2751–2756. [Google Scholar] [CrossRef]
  28. Huang, X.; Liu, G.; Liu, Y. Collision Detection and Recovery Control of Drones Using Onboard Inertial Measurement Unit. Drones 2025, 9, 380. [Google Scholar] [CrossRef]
  29. Quan, Q.; Cui, G.; Du, G.-X. Controllable probability and optimization of multicopters. Aerosp. Sci. Technol. 2021, 119, 107162. [Google Scholar] [CrossRef]
  30. Xing, L.; Zhao, G.; Wang, Y.; Mandava, L. Competing failure analysis in IoT systems with cascading functional dependence. In Proceedings of the 2018 Annual Reliability and Maintainability Symposium (RAMS), Reno, NV, USA, 22–25 January 2018; IEEE: New York, NY, USA, 2018; pp. 1–6. [Google Scholar] [CrossRef]
  31. Myers, A.F. k-out-of-n: G System Reliability With Imperfect Fault Coverage. IEEE Trans. Reliab. 2007, 56, 464–473. [Google Scholar] [CrossRef]
  32. Sun, J.; Gao, H.; Qi, F.; Wu, H.; Gao, K.; Hu, W. Reliability Modeling and Evaluation of Wireless Communication System Based on FTA. In Proceedings of the 2022 4th International Conference on Communications, Information System and Computer Engineering (CISCE), Shenzhen, China, 24–26 June 2022; IEEE: New York, NY, USA, 2022; pp. 134–137. [Google Scholar] [CrossRef]
  33. Langseth, H.; Portinale, L. Bayesian networks in reliability. Reliab. Eng. Syst. Saf. 2007, 92, 92–108. [Google Scholar] [CrossRef]
  34. Gong, Z.; Sun, X.; Li, H.; Jiang, Y. Reliability Assessment of AIS Base Stations System on Dynamic Bayesian Network. In Proceedings of the 2024 6th International Conference on Civil Aviation Safety and Information Technology (ICCASIT), Hangzhou, China, 23–25 October 2024; IEEE: New York, NY, USA, 2024; pp. 762–766. [Google Scholar] [CrossRef]
  35. Ye, T.; Liu, L.; Pang, H.; Zhou, Z. Bayesian Networks based approach to enhance GO methodology for reliability modeling of multi-state consecutive-k-out-of-n: F system. Reliab. Eng. Syst. Saf. 2023, 229, 108828. [Google Scholar] [CrossRef]
  36. Heckerman, D. Causal independence for knowledge acquisition and inference. Uncertain. Artif. Intell. 1993, 122–127. [Google Scholar] [CrossRef]
  37. Bobbio, A.; Portinale, L.; Minichino, M.; Ciancamerla, E. Improving the analysis of dependable systems by mapping fault trees into Bayesian networks. Reliab. Eng. Syst. Saf. 2001, 71, 249–260. [Google Scholar] [CrossRef]
  38. Xiao, P.; Deng, R.; Nie, J. A Reliability Analysis Method for Common Cause Failure Based on Extended Dynamic Fault Tree. In Proceedings of the 2023 3rd International Conference on Electronic Information Engineering and Computer Science (EIECS), Changchun, China, 22–24 September 2023; IEEE: New York, NY, USA, 2023; pp. 514–520. [Google Scholar] [CrossRef]
  39. Li, S.; Gu, C.; Xu, M.; Li, J.; Zhao, P.; Cheng, S. Optimal power system design and energy management for more electric aircrafts. J. Power Sources 2021, 512, 230473. [Google Scholar] [CrossRef]
  40. GJB/Z 299C-2006; Electronic Equipment Reliability Prediction Manual. Data Center of the Fifth Institute of Electronics, Ministry of Information Industry: Beijing, China, 2007.
  41. Kim, K.O.; Yang, Y.; Zuo, M.J. A new reliability allocation weight for reducing the occurrence of severe failure effects. Reliab. Eng. Syst. Saf. 2013, 117, 81–88. [Google Scholar] [CrossRef]
  42. AC 25.1309-1B; System Design and Analysis. Federal Aviation Administration: Washington, DC, USA, 2024. Available online: https://www.faa.gov/regulations_policies/advisory_circulars/index.cfm/go/document.information/documentID/1043037 (accessed on 29 July 2025).
  43. Zhu, X.; Kuo, W. Importance measures in reliability and mathematical programming. Ann. Oper. Res. 2014, 212, 241–267. [Google Scholar] [CrossRef]
Figure 1. Multi-rotor drone with different configurations.
Drones 09 00572 g001
Figure 2. Coaxial 16 (2 × 8) rotors drone model.
Drones 09 00572 g002
Figure 3. Flow chart for the operation of k-out-of--n system considering FDEP.
Drones 09 00572 g003
Figure 4. DBN Modeling Process (represent the triggering component under the FDEP gate of the fault tree as a parent node in the BN).
Drones 09 00572 g004
Figure 5. The converged BN structure.
Drones 09 00572 g005
Figure 6. The simple adder model in BN.
Drones 09 00572 g006
Figure 7. Reliability calculation flowchart of drone’s propulsion system based on controllability detection.
Drones 09 00572 g007
Figure 8. Electrical connection diagram of power unit for the drone.
Drones 09 00572 g008
Figure 9. Scatter plot of controllability for different numbers of failed rotors.
Drones 09 00572 g009
Figure 10. Fault tree model of functional components and triggering components. (a) Electric Propulsion Systems Fault Tree. (b) Communication Unit Fault Tree. (c) Power Unit Fault Tree.
Drones 09 00572 g010
Figure 11. The BN model of propulsion system of drone considering FDEP.
Drones 09 00572 g011
Figure 12. The cumulative probability of different failure states in adder modeling.
Drones 09 00572 g012
Figure 13. Electric propulsion system reliability curve.
Drones 09 00572 g013
Figure 14. Four types of motor importance change curves. (a) Motor Importance Curve without Considering FDEP. (b) Motor Importance Curve without Considering FDEP.
Drones 09 00572 g014aDrones 09 00572 g014b
Table 1. Comparison of reliability target selection for drone propulsion system.
ReferenceApproachAttitude
2016, Hua et al. [5]Reliability target selection based on the concept of moment differenceHover
2018, Endharta et al. [6]Reliability targets selection based on system contribution ratioHover
2019, Guo et al. [7]Reliability targets selection based on symmetry judgment criteriaAscend or Descend
2023, Cho et al. [8]Reliability targets selection based on the balance condition of the center of gravityHover
Table 2. Comparison of reliability calculations for complex systems with voting gate.
ReferenceWhether the Failure Event Is Complex and the ApproachWhether the Voting Door Exists and the Approach
2021, Luo et al. [5]Yes, proposed a new MCS calculation method based on iterative search cut to extract MCS and complete reliability calculationNo
2021, Jacob et al. [5]Yes, proposed DE method to reduce the number of recursive calls through deep search, completing reliability calculationsNo
2011, Xiang et al. [5]NoYes, proposed a method to simplify the voting gate but not deploy it directly
2015, Wang et al. [5]NoYes, proposed a mathematical method of replacing voting logic with AND OR logic
Table 3. Basic Physical Parameters of Drone.
ParametersDescriptionValue
m (kg)Mass160 kg
Fmax (N)Maximum thrust of propulsion unit150 N
r (m)Rotor distance from the center of the fuselage0.5 m
k1 (N/rpm2)Propeller thrust coefficient8.5 × 105
k2 (N/rpm2)Propeller drag coefficient1.06 × 104
Table 4. Electric propulsion system bottom event and failure rate.
Serial NumberFailure EventFailure Rate λ/h
X1Blade damage3.15 × 10−6
X2Loose or broken rotor connector5.97 × 10−6
X3Spindle failure6.63 × 10−5
X4Transmission failure6.65 × 10−4
X5Insulation failure7.41 × 10−4
X6Winding Failure1.66 × 10−5
X7Electrical faults inside the motor6.75 × 10−4
X8Broken rotor bar or bearing6.95 × 10−4
X9Cooling loss9.05 × 10−4
X10Thermal runaway7.76 × 10−5
X11Transformer failure9.91 × 10−5
X12Broken solder joints on circuit boards8.58 × 10−6
X13Driver circuit power element failure9.27 × 10−4
X14Optocoupler Failure9.32 × 10−5
X15Hall Current Sensor Failure8.21 × 10−6
X16Logic Gate Chip Failure7.79 × 10−4
X17Diode failure8.12 × 10−6
X18Broken or loose signal cable9.15 × 10−5
Table 5. Power battery bottom event and failure rate.
Serial NumberFailure EventFailure Rate λ/h
Y1Power Battery Management Unit malfunction causing contactor disconnection4.58 × 10−3
Y2Power Battery contactor control model connector failure7.15 × 10−4
Y3Power Battery Contactor Failure4.28 × 10−4
Y4Abnormal melting of power battery fuse7.16 × 10−5
Y5Loss of protection in case of short circuit of equipment connected to PDU1 (Power Distribution Unit)7.22 × 10⁻⁵
Y6No power output from PDU16.09 × 10−5
Y7Abnormal disconnection of the PDU1 fuse of the power battery management unit8.04 × 10−6
Y8Loss of protection in case of short circuit of equipment connected to PDU27.22 × 10−5
Y9No power output from PDU16.09 × 10−5
Y10Abnormal disconnection of the PDU1 fuse of the power battery management unit8.04 × 10−6
Y10Power Battery Management Unit malfunction causing contactor disconnection4.58 × 10−3
Table 6. Communication unit bottom event and failure rate.
Serial NumberFailure EventFailure Rate λ/h
Z1Main CAN communication bus termination resistor failure8.94 × 10−5
Z2Short in main CAN communication bus harness7.33 × 10−5
Z3Main CAN communication bus output connector failure9.21 × 10−4
Z4Motor control unit main CAN communication failure3.21 × 10−3
Z5Backup CAN communication bus termination resistor failure8.94 × 10−5
Z6Backup CAN Communication Bus Harness Short Circuit7.33 × 10−5
Z7Backup CAN communication bus output connector failure9.21 × 10−4
Z8Motor control unit backup CAN communication failure3.21 × 10−3
Table 7. Reliability of each component.
MotorPropulsion Unit 1Propulsion Unit 2Propulsion Unit 3Propulsion Unit 4Power BatteryCommunication Unit
Reliability (1 h)0.99510.99450.99370.99320.99810.9997
Disclaimer/Publisher’s Note: The statements, opinions and data contained in all publications are solely those of the individual author(s) and contributor(s) and not of MDPI and/or the editor(s). MDPI and/or the editor(s) disclaim responsibility for any injury to people or property resulting from any ideas, methods, instructions or products referred to in the content.