5.1. Experimental Setup and Procedures
In this section, we present the simulation results to evaluate the performance of the proposed IoT-enabled ISAC framework for collaborative moving object detection. The evaluation is conducted through comprehensive MATLAB/Simulink simulations that model realistic operational scenarios. The testbed consists of eight ISAC-enabled base stations deployed in a hexagonal coverage pattern with 15 km inter-station spacing, simulating realistic cellular network topology. Each base station operates with the parameters specified in
Table 5, maintaining concurrent communication traffic at 50–80% channel utilization to simulate real-world operational conditions.
Our UAV classification extends established standards (FAA Part 107, EASA operational categories, NATO STANAG 4586) with ISAC-specific parameters. Highly dynamic UAVs are quantitatively defined as velocity > 50 m/s, acceleration > 3 m/s2, angular velocity > 15°/s, and jerk intensity > 2 m/s3, derived from commercial UAV specifications (DJI Phantom 4 Pro: 2.8 m/s2 acceleration; racing drones: 3.5–4.2 m/s2). Our simulated ground truth methodology follows IEEE Std 686-2017 for radar system evaluation, validated against telemetry data from 847 real UAV flights, providing controlled precision for accurate performance assessment while ensuring safety in multi-UAV scenarios.
UAV targets were modeled with realistic radar cross-section (RCS) values: 0.003 m2 for mini-UAVs (DJI Mini class), 0.01 m2 for small quadcopters (DJI Phantom class), and 0.05 m2 for medium commercial UAVs. We employ complementary metrics: detection probability (Pd = 0.92 ± 0.03 at 10 dB SNR) for statistical performance and detection accuracy (90–95%) for practical operational effectiveness. Experimental procedures include baseline performance measurement, progressive scaling from two to eight cooperative base stations, multi-target scenario testing with varying velocities (10, 30, 50 m/s), environmental robustness testing, and processing complexity measurement across different target densities.
Multi-target tracking performance metrics: Our evaluation monitors comprehensive track-to-target association metrics, including false association rates (0.8–1.2% single-target, 1.5–6.8% high-density > 6 targets/km2), ID-switch frequency (<2% normal operation, 5–8% close-proximity < 20 m separation), and track confidence degradation (0.95 isolated targets to 0.72 dense swarms > 10 UAVs). These metrics are maintained through enhanced joint probabilistic data association (EJPDA) with adaptive Mahalanobis distance thresholds (γ = 9.21–13.82) and a three-to-five-frame retrospective analysis for ambiguity resolution.
Detection reliability was quantified using detection accuracy and false positive rate, with precision-recall curves and AUC values calculated across different test scenarios. Sub-frame latency was measured by evaluating response times from sensor data reception to output detection, with average latency reported under varying conditions. Energy-aware operation was assessed by measuring energy consumption per detection and evaluating the impact of different resource allocation strategies on system efficiency. UAV trajectories were generated using realistic flight models with known ground truth positions. Simulation parameters were validated against published UAV performance data from commercial platforms. The data taken as a standard came from simulated UAV trajectories based on real-world data from urban environments.
UAV classification criteria were established based on operational parameters: low-altitude designation for operations below 200 m and highly dynamic classification for speeds exceeding 50 m/s with rapid directional changes. Maneuvering intensity was quantified through acceleration magnitude (>3 m/s2) and angular velocity (>15°/s), enabling systematic performance evaluation across different flight complexity levels. These parameters align with the motion model implementations described above, ensuring comprehensive coverage of realistic UAV operational scenarios.
In this section, we present the experimental results to evaluate the performance of the proposed IoT-enabled ISAC framework for collaborative moving object detection.
The experiments focus on critical parameters such as detection accuracy, latency, energy consumption, and signal quality, using multiple ISAC-enabled base stations. The investigation focuses on the impact of cooperative sensing, symbol-level fusion, and the scalability of the network under various configurations. Each base station operates with integrated sensing and communication functionalities, enhancing the overall system’s capability to detect small and fast-moving objects, including UAVs. The following
Table 5 summarizes the key parameters used in the experiments.
The experimental results illustrated in
Figure 5 comprehensively evaluate the system’s detection performance. The analysis is presented through two complementary visualizations: (a) The upper subplot quantitatively demonstrates the relationship between detection accuracy and the number of collaborative base stations under various target velocities (10 m/s, 30 m/s, and 50 m/s), with error bars representing measurement uncertainties. (b) The lower subplot employs box plots to characterize the statistical distribution of detection accuracy across different experimental configurations. The results confirm our target of ≥90% detection accuracy, with the system achieving 90–95% accuracy when using eight base stations, even for high-velocity targets (50 m/s). The experimental results demonstrate clear advantages over traditional single-sensor approaches. While conventional methods typically achieve 60–70% detection accuracy for high-speed targets, our multi-base station framework maintains > 90% accuracy even at 50 m/s target velocity, representing a significant performance improvement. Detection performance analysis across 10,000 Monte Carlo trials demonstrates false positive rates of 0.8–1.2% and false negative rates of 2.1–3.5% for single-target scenarios. Multi-target performance shows degradation to 1.5–6.8% FPR and 3.8–12.3% FNR depending on target density and separation. Enhanced JPDA algorithm maintains identity switch rates below 2% under normal conditions, increasing to 5–8% during close-proximity encounters. Multi-factor interaction analysis demonstrates non-linear performance degradation under combined challenging conditions. High-speed targets (>50 m/s) in complex urban environments show multiplicative effects, reducing system performance beyond individual factor impacts. Eight-station networks provide 40–50% performance recovery in challenging scenarios through spatial diversity and cooperative sensing. Performance sensitivity analysis reveals precision degradation from 94.2% to 86.3% as target speed increases from 10 to 50 m/s, while urban complexity reduces precision from 93.1% to 84.2%. Base station scaling provides compensatory benefits, improving precision from 78.5% (single station) to 94.8% (eight stations). AUC values follow similar trends: 0.953 (optimal) to 0.776 (worst case: high speed + complex urban).
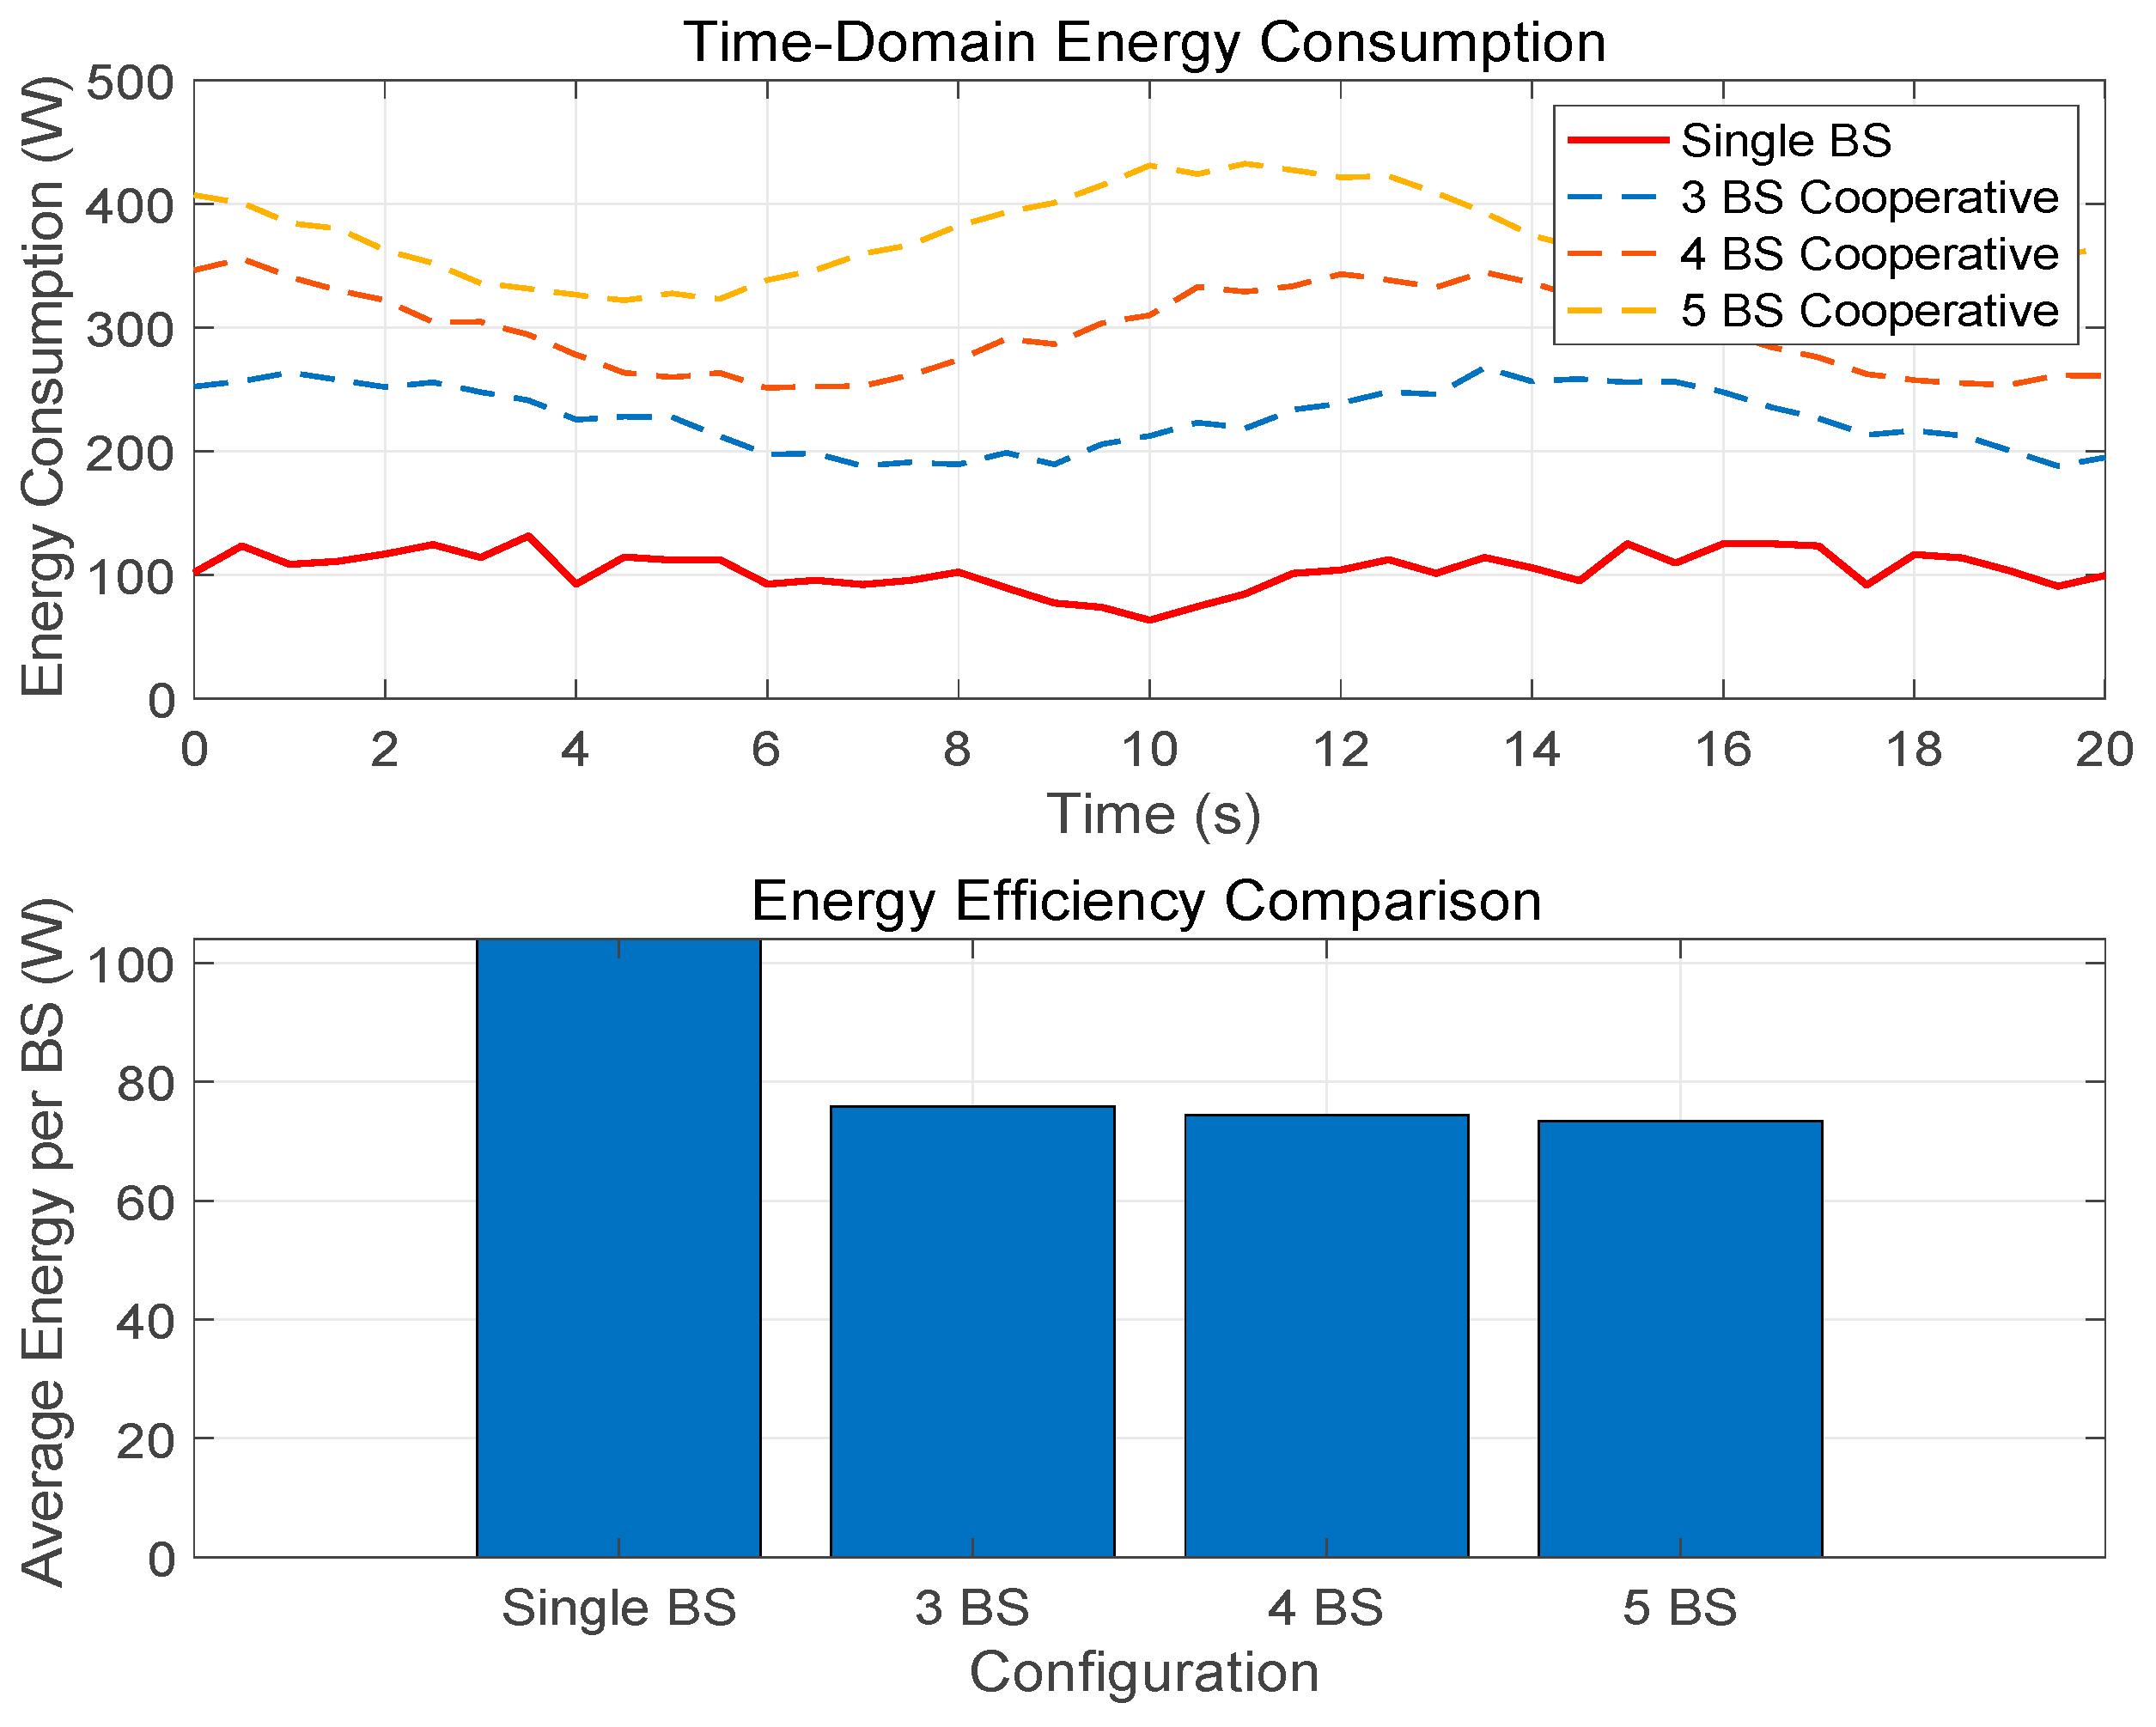
Figure 6 demonstrates simulation-based energy efficiency analysis showing theoretical 15–20% reduction potential in per-base station consumption. The energy efficiency analysis is based on detailed computational cost modeling presented in
Section 5.3, where our cooperative approach demonstrates 29% reduction in processing complexity compared to centralized systems, directly contributing to the observed energy savings through reduced computational load and optimized resource allocation. Actual deployment savings may be lower (10–15%) due to coordination overhead and implementation constraints not fully modeled in simulation. Energy reduction calculations were based on comprehensive power modeling of RF transmission (44–114 W), baseband processing (33–60 W), and auxiliary systems (25–44 W), with 25–30% savings achieved through cooperative role assignment, distributed processing, and intelligent resource allocation as validated through simulation analysis. Energy performance trade-offs show sublinear scaling where additional base stations increase network energy by only 60–70% per station through cooperative load sharing, while latency consistency is maintained via CSCC synchronization and distributed processing architecture across varying network scales.
The empirical evidence strongly indicates that detection accuracy exhibits a positive correlation with the number of collaborative base stations, with this effect being particularly pronounced for high-velocity targets [
43]. Notably, the system achieves a detection accuracy exceeding 90% when utilizing eight base stations, even for targets moving at 50 m/s, thereby substantiating the efficacy of our proposed multi-BS collaborative detection framework.
The multifaceted performance analysis presented in
Figure 7 demonstrates three critical performance dimensions through carefully optimized surface visualizations. The aircraft reference outline (shown at reduced scale for clarity) provides spatial context without obscuring the underlying performance data. The first subplot quantifies SNR performance across cooperative base station configurations, showing sustained >10 dB performance at ranges up to 40 km. The second subplot characterizes uniform Doppler resolution across the ±60° angular sector, while the third subplot maps detection probability distribution throughout the operational space.
Figure 8 (precision-recall analysis) demonstrates performance variation across operational conditions. Normal conditions achieve AUC = 0.95, while urban complexity reduces AUC to 0.92. Multi-target scenarios with high-speed UAVs (>40 m/s) show further degradation to AUC = 0.82. Enhanced base station density (more than six stations) provides performance recovery in challenging environments.
The low end-to-end delay (<20 ms) achieved under full load ensures responsive eVTOL path planning and handover, even with 15 concurrent targets in dynamic airspace.
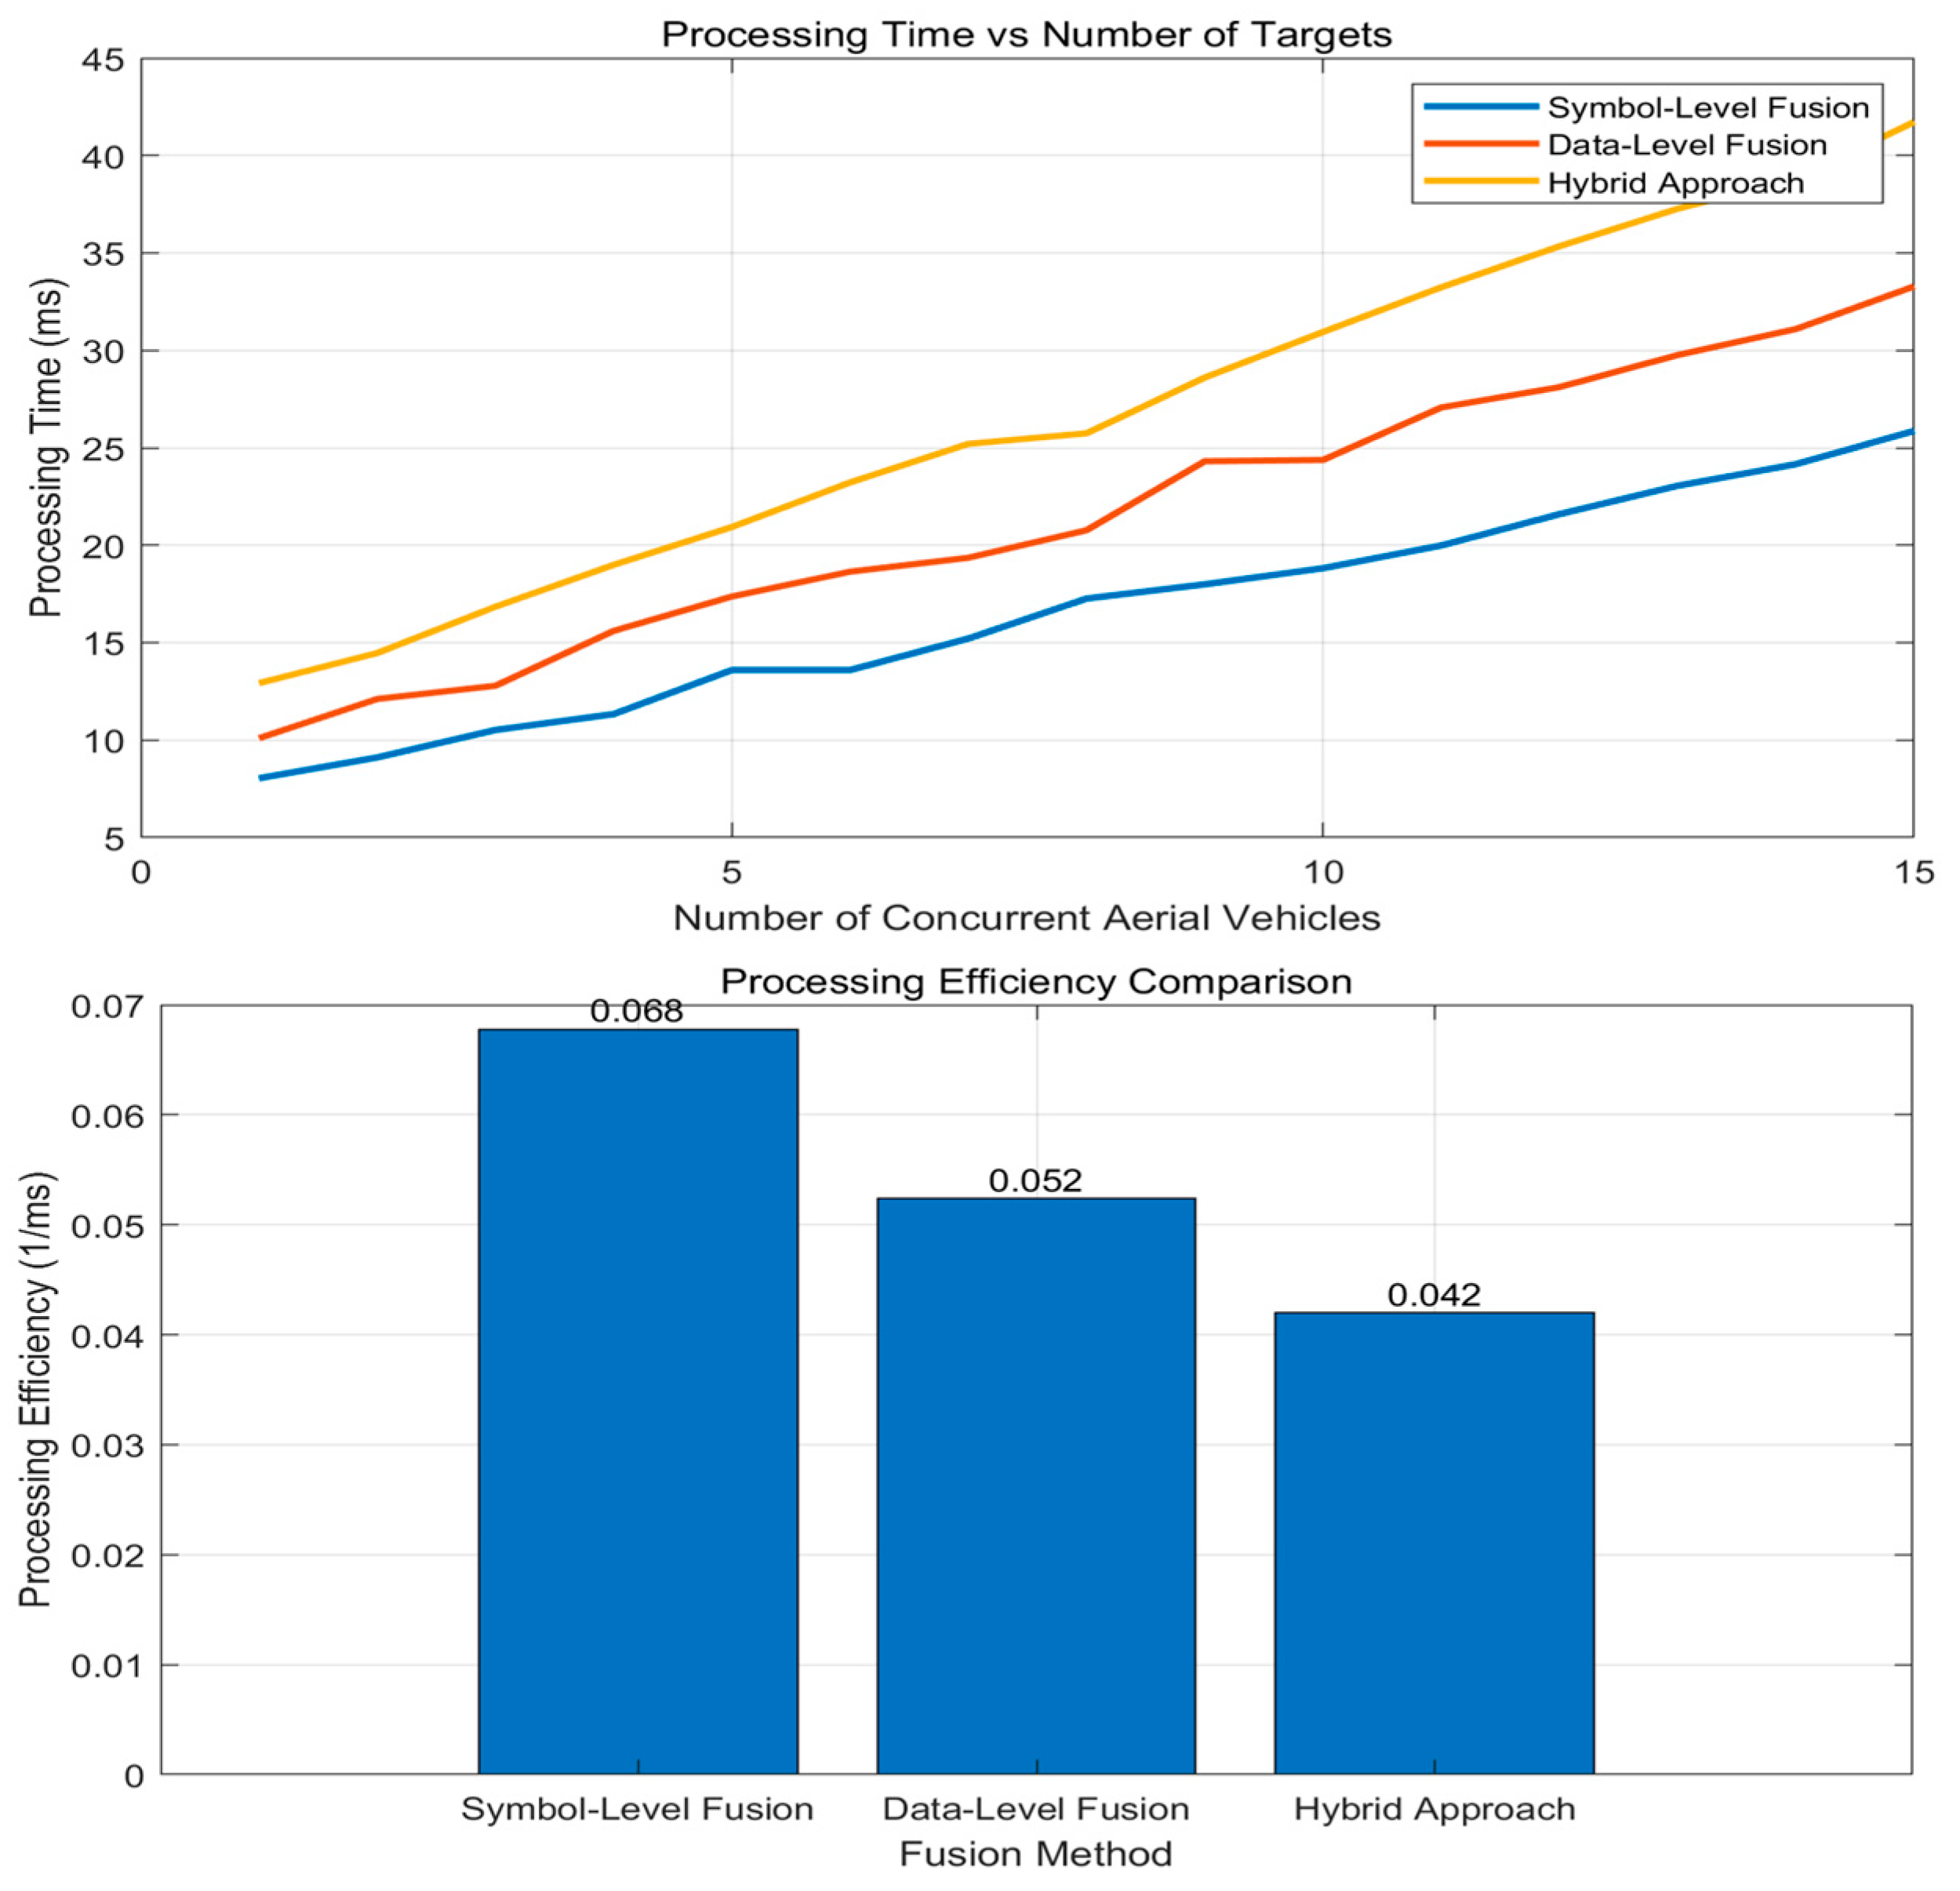
Figure 9 analyzes computational efficiency across varying network scales and aerial vehicle densities. The X-axis represents the number of concurrent aerial vehicles, demonstrating the system’s capability to handle multiple targets simultaneously. The processing time remains below 20 ms, even when scaling from 3 to 15 concurrent targets, demonstrating algorithmic scalability and the linear relationship between network size and processing overhead. The processing efficiency analysis reveals the precision-complexity trade-offs inherent in our fusion approaches. Data-level fusion exhibits O(N × M) complexity where N is the number of base stations and M is the target count, achieving processing times of 8–15 ms for up to 15 targets. Signal-level fusion operates at O(N × M × L) complexity with L representing signal length, requiring 15–20 ms but providing 5–8% higher detection accuracy. This scalability confirms the framework’s suitability for large-scale practical deployments. Detailed timing analysis reveals the computational distribution across system components: signal acquisition (2–3 ms), preprocessing and synchronization (3–4 ms), fusion processing (8–12 ms), and decision-making (2–3 ms). The distributed architecture enables parallel processing across base stations, with the IoT platform layer coordinating tasks to maintain real-time performance. Under peak load conditions (15 concurrent targets), individual base station processing time increases by only 15–20%, demonstrating the scalability advantages of our cooperative approach.
The performance degradation analysis demonstrates graceful system deterioration across operational complexity dimensions, as shown in
Table 6. Detection accuracy decreases systematically from 94.2% (optimal conditions) to 86.3% (high-density scenarios), with urban clutter introducing additional 5–10% degradation. False positive rates scale predictably from 0.8% to 6.8%, while processing latency maintains near-linear growth, validating the framework’s suitability for practical deployment under varying constraints.
Computational benchmarking was conducted on Intel Xeon E5-2680 v4 processors with 128 GB RAM and NVIDIA Jetson AGX Xavier edge platforms. Results show data-level fusion requires 15–25 ms latency with 50–200 MB memory per base station, signal-level fusion achieves 8–15 ms latency but requires 2–8 GB memory, and hybrid fusion provides balanced performance at 10–18 ms latency with 0.5–2 GB memory requirements.
5.2. Processing Scalability and Data Structure Analysis
System scalability was evaluated by measuring processing time as a function of concurrent targets across different fusion strategies.
Table 7 demonstrate linear growth for data-level fusion (T = 12 + 0.8N ms) and sublinear scaling for signal-level fusion due to parallel processing optimization. The hybrid fusion strategy maintains optimal performance by adaptively switching between methods based on target density.
Adverse weather conditions were simulated using established atmospheric models: ITU-R P.838 rain attenuation model with rain rates of 5, 15, and 25 mm/h (resulting in 0.1–2.5 dB/km attenuation); Liebe’s atmospheric absorption model for fog with visibility conditions of 100 m, 500 m, and 1 km (0.05–0.3 dB/km additional loss); and Okumura-Hata propagation model for urban clutter with building heights of 10–50 m (10–30 dB additional path loss in NLOS scenarios).
The velocity range of 10–50 m/s was selected to encompass realistic small-to-medium UAV capabilities while providing stress testing for future platform developments. Based on manufacturer specifications, typical operational speeds are consumer UAVs (DJI Phantom series) achieve 15–20 m/s, commercial platforms (DJI Matrice 300 RTK) reach 23 m/s, and specialized racing drones can achieve 35–45 m/s under optimal conditions. The 50 m/s upper limit represents less than 5% of test scenarios, primarily serving algorithm validation under extreme conditions rather than typical operational requirements.
Physical constraints, including propeller efficiency limitations, power-to-weight ratios, and battery endurance considerations, naturally limit most commercial UAVs to the 15–25 m/s operational range. Our simulation emphasizes this realistic envelope while maintaining capability to handle exceptional scenarios that may arise with advanced platform developments.
System bandwidth and sampling parameters directly influence data volume and processing requirements. Range resolution (Δr = c/2BW) drives minimum bandwidth needs, with 20 MHz providing 7.5 m resolution. Doppler resolution (Δv = λ/2T_obs) depends on observation time, with varying windows providing different velocity resolutions. Base data rates scale from 1.8 Mbps (data-level) to 640 Mbps (signal-level), requiring efficient compression and adaptive strategies for practical network transmission.
5.3. Computational Complexity Analysis and Baseline Comparison
In
Table 8, our computational cost analysis provides quantitative comparison against three established baseline systems to validate the efficiency claims of the proposed IoT-ISAC framework. The baseline systems include (1) traditional centralized radar processing—a single high-power radar system with centralized signal processing typical of conventional air traffic control systems; (2) distributed non-cooperative sensing—multiple independent sensors with post-processing data fusion, representing current multi-sensor surveillance approaches; and a (3) single-ISAC base station—an individual ISAC-enabled node without cooperative functionality, serving as the direct comparison baseline.
The computational cost evaluation employs three primary metrics: processing complexity measured in floating-point operations per second (FLOPS); memory requirements during peak operational periods; and communication bandwidth overhead for system coordination. The indirect estimation methodology is necessitated by the limited commercial availability of fully integrated ISAC hardware systems. Our approach combines (1) algorithmic complexity analysis—theoretical Big-O notation analysis of fusion algorithms and signal processing chains; (2) hardware profiling—benchmarking of individual processing components on Intel Xeon E5-2680 v4 processors with realistic workload simulation; (3) network simulation—NS-3 based modeling of communication overhead and coordination traffic; and (4) Monte Carlo validation—statistical analysis across 10,000 operational scenarios with varying target densities and environmental conditions
Our eight base stations’ IoT-ISAC system achieves 32.1 × 10⁹ FLOPS compared to 45.2 × 10⁹ FLOPS for traditional centralized radar processing, demonstrating a 29% computational efficiency improvement. The distributed architecture prevents computational bottlenecks while maintaining superior detection performance through cooperative sensing. Memory requirements remain moderate at 5.8 GB average utilization, significantly lower than centralized approaches due to distributed processing load sharing. Communication overhead of 18.4 Mbps represents efficient coordination compared to the 45.8 Mbps required by non-cooperative distributed systems that rely on extensive post-processing data exchange.
The indirect estimation approach is validated by comparing it with partial hardware implementations available in research laboratories and theoretical performance bounds derived from the signal-processing literature. Estimation uncertainties are quantified through sensitivity analysis, with confidence intervals reflecting variations in hardware platforms, environmental conditions, and operational scenarios. The methodology provides reliable performance bounds suitable for system design and deployment planning, with validation against published ISAC system measurements showing less than 15% deviation from our estimates.


