Abstract
With the increasingly widespread application of unmanned aerial vehicle (UAV) systems in disaster monitoring, urban management, logistics transportation, and reconnaissance, efficient dynamic task allocation has become a key issue in improving task execution efficiency. To address the challenges posed by dynamic changes in task objectives and resource constraints that traditional task allocation methods struggle with in complex environments, this paper proposes a multi-objective particle swarm optimization algorithm, DCMPSO, for UAV dynamic reconnaissance task allocation. First, the framework of DCMPSO is constructed, dividing the optimization of dynamic problems into three parts: environment change detection, environment change response, and actual optimization, with the designed strategy of range prediction strategy based on centroid translation. Then, simulation experiments are conducted to verify the effectiveness of the algorithm mechanisms through ablation experiments and to demonstrate the superiority of DCMPSO in convergence and distribution compared to DNSGA-II and SGEA through comparative experiments. Finally, a multi-UAV dynamic task allocation model is established and optimized, proving that DCMPSO can correctly solve the UAV dynamic multi-objective allocation problem and effectively find its optimal solution, providing an effective solution for practical applications.
1. Introduction
With the continuous development of information technology, unmanned aerial vehicle (UAV) systems have been widely applied in various complex scenarios, such as remote monitoring [1,2], target recognition [3], data collection [4,5], and urban logistics [6,7]. To improve the task execution efficiency of multiple UAVs in complex and dynamic scenarios, efficient scheduling has become one of the important research directions in intelligent systems and UAV collaborative technology [8].
One strategy to solve the UAV task allocation problem is to regard the task allocation process of the UAV system as a dynamic decision-making process of a multi-agent system, such as the Deep Reinforcement Learning method [9]. In this approach, the UAV system possesses the capability to autonomously perceive the environment and respond accordingly. Jingyi Guo et al. [10] modeled the policy function using Graph Neural Networks and Attention Mechanisms, successfully solving the problem of multi-UAV cooperative multi-target task allocation. Peng Pengfei et al. [11] proposed an Evolutionary Reinforcement Learning algorithm based on Deep Q, which effectively addressed the uncertainty in the task allocation optimal solution space. Bo Zhang et al. [12] employed an improved MAPPO algorithm to optimize the search and rescue routes of multiple UAVs in disaster-stricken environments, significantly reducing UAV energy consumption and enhancing rescue efficiency. Le Han et al. [13] optimized DQN using the particle swarm optimization (PSO) algorithm, generating smoother and more efficient paths for UAVs. Although Deep Reinforcement Learning methods show certain advantages in complex, dynamic, and uncertain scenarios, their high performance also comes with demands such as improving training convergence speed and reducing control difficulty.
The dynamic task allocation problem for UAVs can be regarded as a typical combinatorial optimization problem [14]. Metaheuristic algorithms can usually obtain approximate or high-quality solutions more quickly within a limited time and with lower computational complexity. Therefore, metaheuristic algorithms can be considered ideal methods for solving multi-objective task allocation problems. Cong Rui et al. [15] proposed an improved TS-NSGA-II based on a Genetic Algorithm (GA), which provides an effective solution for UAVs to perform cooperative detection tasks in complex environments with multiple constraints. Chen, Xin et al. [16] used the Ant Colony Algorithm and Greedy Algorithm to solve the task allocation and path planning problems in multi-UAV route planning, respectively, obtaining optimal solutions. Jingling Wang et al. [17] proposed a Novel Discrete Non-Dominated Sorting Algorithm to solve the delivery task allocation problem. Zexian Huang et al. [18] enhanced the optimization capability of multi-UAV cooperative path planning algorithms by using an improved Grey Wolf Optimization algorithm. Gang Huang et al. [19] successfully realized the minimization of UAV flight distance and obstacle avoidance functions in UAV trajectory planning using the proposed TSCEA Two-Stage Cooperative Co-Evolution Multi-Objective Evolutionary Algorithm. Senlin Liu et al. [20] employed an improved Multi-Objective Grey Wolf Optimization algorithm to optimize a heterogeneous multi-UAV cooperative multi-task allocation model, demonstrating the proposed algorithm’s high convergence and diversity in addressing this problem. Pei Zhu et al. [21] integrated MP–GWO and NSGA-II algorithms to optimize the multi-objective firefighting task allocation and path planning of multiple UAVs in dynamic forest fire environments. The above literature reviews fully illustrate the flexibility and simplicity of optimization algorithms in solving various task allocation problems.
Dynamic multi-objective task allocation problems impose high requirements on optimization algorithms, including rapid responsiveness to environmental changes, the ability to continuously approximate the time-varying Pareto front, and the capability to escape local optima. PSO, with its fast convergence speed, strong local search capability, simple principles, few parameters, and high compatibility, is undoubtedly an excellent choice for solving dynamic multi-objective task allocation problems. For instance, Ming Yan et al. [22] demonstrated the strong anti-interference capability and high efficiency of the improved GA-PSO algorithm in solving dynamic multi-UAV task allocation problems in marine environments. Gao, Yang et al. [23] improved the convergence and distribution of the traditional MOPSO algorithm based on a Monte Carlo Resampling method, achieving excellent performance in multi-UAV task allocation scenarios. Xiaolong Zheng et al. [24] developed an Evolutionary Multi-tasking Optimization algorithm based on the classical PSO algorithm, providing a good solution for Multi-Task Optimization (MTO) problems. Jian-feng Wang et al. [25] proposed an improved Multi-Objective Quantum-Behavior Particle Swarm Optimization algorithm, which successfully optimized a complex four-objective task allocation model for heterogeneous UAVs. Gurwinder Singh et al. [26] combined the PSO and AOQPIO algorithms to develop an optimization approach capable of effectively addressing UAV task allocation and path planning under dynamic wind conditions, significantly improving the convergence speed of the algorithm for this dynamic problem. Shuyue Liu et al. [27] modeled how UAV swarms acting as temporary mobile base stations can simultaneously ensure coverage and communication quality, and used Tent-PSO for path planning, significantly enhancing the performance of the solution set. Ary Shared Rosas-Carrillo et al. [28] proposed a PSO algorithm with adaptive inertia weight, successfully optimizing UAV reconnaissance task allocation during volcanic eruptions. Yu Chen et al. [29] used an improved PSO algorithm to plan tourist routes in scenic areas based on point cloud data collected by UAVs. Ying Zeng [30] proposed an improved MOPSO algorithm to optimize a UAV Cooperative Air Combat Route Planning model, demonstrating the algorithm’s convergence, diversity, and robustness.
Although the particle swarm optimization algorithm is susceptible to issues such as being trapped in local optima and uneven distribution of the solution set when solving dynamic multi-objective task allocation problems, its simple structure, few parameters, and strong scalability give it significant potential for improvement in such scenarios. To address these challenges, this paper proposes a dynamic multi-objective particle swarm optimization algorithm based on centroid-moving prediction strategy (DCMPSO). The algorithm introduces a range prediction mechanism based on the historical movement of the solution set’s centroid, thereby enhancing adaptability to dynamic environments. In terms of population updating, DCMPSO integrates a GA-based crossover and mutation strategy, as well as a novel multi-population cooperative velocity and position update mechanism. Additionally, a dynamic parameter adjustment strategy is designed to handle environmental changes. For external archive maintenance, a Euclidean distance-based projection pruning mechanism is introduced, which enhances solution diversity and robustness while maintaining convergence, thus improving the distribution quality of the solution set. In terms of modeling, this paper adopts a unique encoding and decoding approach to construct a multi-objective task allocation model for dynamic unmanned aerial vehicle scenarios. Algorithmic validation is conducted based on this model, and the results demonstrate that DCMPSO exhibits excellent adaptability and robustness in solving dynamic multi-objective task allocation problems involving multiple UAVs.
The structure of this paper is organized as follows: Section 1 introduces the research background and reviews related literature; Section 2 elaborates on the structure and innovative mechanisms of the proposed DCMPSO algorithm; Section 3 conducts ablation and comparative experiments to verify the algorithm’s effectiveness; Section 4 constructs a realistic multi-UAV dynamic task allocation scenario and applies DCMPSO to solve it; Section 5 provides a summary and discussion of the study.
2. Dynamic Multi-Objective Particle Swarm Optimization Algorithm Based on Centroid-Shift Range Prediction
This chapter introduces the proposed DCMPSO algorithm. Section 2.1 presents the concept and principles of PSO. Section 2.2 describes the environment change detection mechanism. Section 2.3 designs the environment change response mechanism. Section 2.4 focuses on the design of the actual optimization process. Finally, Section 2.5 presents the overall structure of the algorithm.
2.1. Particle Swarm Optimization Algorithm
The particle swarm optimization algorithm is a typical swarm intelligence optimization algorithm proposed by Kennedy and Eberhart in 1995, inspired by the foraging behavior of bird flocks. Based on this idea, PSO simulates a group of “particles” moving through the solution space to search for the optimal solution. Each particle represents a potential solution and has two key attributes: position and velocity, corresponding to the solution and its search direction. During the iterative process, each particle updates its state based on its own experience (i.e., the best position it has found, known as pBest) and the experience of the swarm (i.e., the best position found by any particle in the population, known as gBest). By leveraging swarm intelligence, the particles collectively converge toward the global optimal position, thereby identifying the best solution.
2.2. Environmental Change Detection
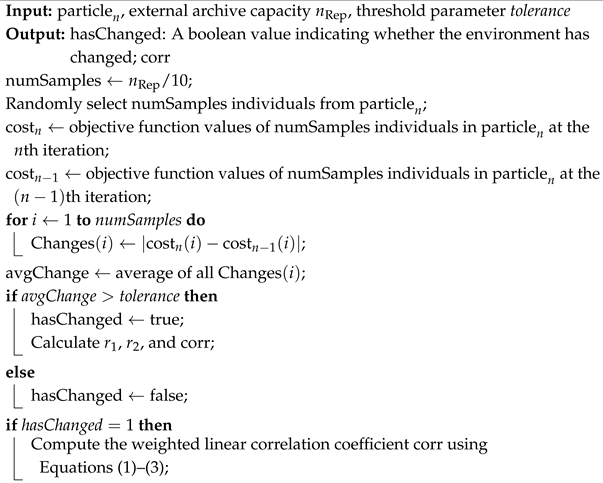
The purpose of environmental change detection is to accurately identify the time points of environmental changes in discrete dynamic environments, thereby providing guidance for subsequent response mechanisms. The algorithm determines whether the environment has changed at generation n by comparing the objective function values of the population in the objective space between generation and generation n.
Unlike other environmental change detection mechanisms, DCMPSO introduces the calculation of the environmental correlation coefficient between two consecutive environments once a change is detected. Specifically, it employs the Pearson correlation coefficient, denoted as corr, which ranges from −1 to 1. The coefficient is calculated as a weighted value of two correlation components and , as defined in Equation (1).
where denotes the correlation coefficient of the objective function values of the current population between the i-th and -th discrete sub-environments, whose calculation is given in Equation (2). represents the correlation coefficient of the algorithm frontiers in the decision space between the -th and i-th sub-environments, calculated as shown in Equation (3). and are the weighting coefficients of the two correlation coefficients, respectively.
where and represent the function values of the m-th objective for the k-th individual in the final generation of the population under the i-th and -th sub-environments, respectively. and denote the average function values of the m-th objective over all individuals in the population under the i-th and -th discrete sub-environments, respectively. n represents the number of individuals used to compute the linear correlation coefficient, and M denotes the number of objectives.
where and represent the values of the k-th individual in the final generation of the population on the d-th dimension in the decision space under the -th and i-th sub-environments, respectively. and denote the average values of the d-th dimension across all individuals in the population within the decision space under the -th and i-th sub-environments, respectively. n denotes the number of individuals used to compute the linear correlation coefficient, and M is the number of objectives. When , there is no historical environment available for reference, so the weight coefficient in the first sub-environment during the algorithm’s execution is set to 1, i.e., .
The weighted correlation coefficient corr is used to assess the predictability of the true Pareto front (the set of all optimal solutions in the objective space that are not simultaneously dominated by any other solutions, forming a curve or surface known as the true Pareto front) in the -th sub-environment by comprehensively comparing the linear correlation of the objective space between the i-th and -th sub-environments and the linear correlation of the decision space between the -th and i-th sub-environments.
Algorithm 1 presents the pseudocode of the environment change detection mechanism.
| Algorithm 1: Pseudocode of the environment change detection mechanism |
 |
2.3. Environment Change Response Mechanism Based on Centroid Shift Prediction
After an environmental change, it is necessary to perturb the population to prevent it from falling into local optima. However, simple random reinitialization of the population tends to slow down the convergence speed of the algorithm and exhibits poor robustness. To enhance the algorithm’s performance in dynamic environments, this section proposes a range prediction strategy based on centroid shift to respond to environmental changes. In addition, the exponential weighted moving average method [31] is adopted to predict the number of iterations for which the next sub-environment will persist, serving as a guide for the dynamic adjustment of parameters during the optimization process.
2.3.1. Range Prediction Strategy Based on Centroid Shift
By employing the range prediction strategy based on centroid shift designed in this work, the possible location range of the true Pareto front in the decision space of the next sub-environment can be predicted. The population in the current environment is then initialized within this range with a certain degree of randomness, which can accelerate the optimization speed of the population under the new environment and enhance the robustness of the algorithm, thereby adapting to rapidly changing dynamic environments. Figure 1 illustrates the schematic diagram of the proposed range prediction strategy based on centroid shift.
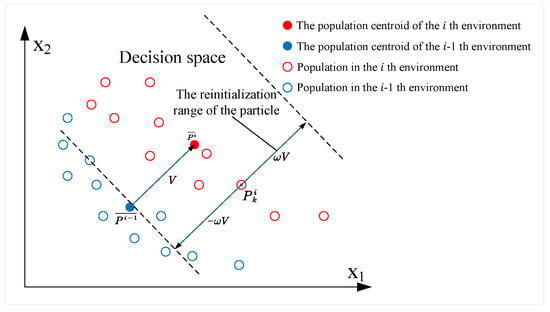
Figure 1.
Schematic diagram of the range prediction strategy based on centroid shift.
When an environmental change occurs, i.e., , a translation vector is generated based on the centroid position in the decision space of the -th discrete sub-environment and the centroid position of the i-th sub-environment according to Equation (4):
Using the positions of the current generation’s population individuals in the decision space as reference points, a range with a width of times the length of vector is generated. Each individual in the current generation is reinitialized within a range centered at itself, defined by the vector interval , producing new population individual positions in the new environment. Subsequently, the positions of these newly generated individuals in the decision space are checked, and any particles violating the constraints are restricted to the boundaries of the decision space. Equation (5) gives the calculation formula for the positions of the newly generated individuals in the decision space.
where and represent the position vectors of the k-th individual in the population at generations and j in the decision space, respectively; rand is a random number in the interval ; and N denotes the total number of individuals in the population. The value of changes according to the environmental linear correlation coefficient corr. When , it indicates a strong linear correlation in both the decision space and objective space between the current sub-environment and its two adjacent sub-environments, reflecting good predictability. In this case, a smaller is used for precise prediction. When , the linear correlation is weaker and the predictability is moderate. Therefore, a larger is used to expand the prediction range and prevent premature convergence to local optima. When corr falls outside the range , the true Pareto front in the next sub-environment is difficult to predict, and the algorithm adopts a random initialization method to generate new population individuals to cope with the environmental change.
2.3.2. Exponential Weighted Moving Average Method for Predicting Sub-Environment Iteration Count
The prediction mechanism based on the exponential weighted moving average (EWMA) method is used to estimate the duration of iterations for each discrete sub-environment. During the algorithm’s execution, if an environmental change is detected, the duration of the current sub-environment, i.e., the i-th discrete sub-environment, is recorded. Based on the durations of historical sub-environments , the EWMA method [31] is employed to predict . Equation (6) presents the formula for calculating using EWMA.
where is the smoothing factor that controls the influence of historical data on the prediction results. Equation (7) shows the recursive expansion of Equation (6):
As shown by its recursive expansion, when , the weight decays slowly, enabling the prediction mechanism to quickly respond to the latest changes. This setting is suitable for rapidly changing data. In contrast, when , the weight decays quickly, placing more emphasis on older historical environments. In this case, the prediction curve becomes smoother, which is more appropriate for regularly changing data with small variation amplitudes. The value of can be adjusted according to the nature of the problem.
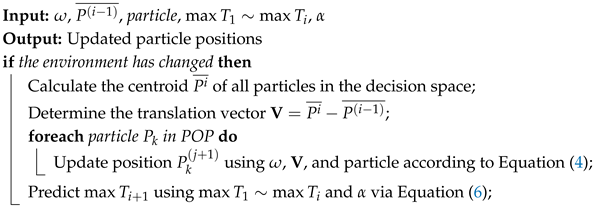
Algorithm 2 presents the pseudocode for the environmental change response component.
| Algorithm 2: Centroid-translation-based range prediction |
 |
2.4. The Actual Optimization Component of the Algorithm
The actual optimization component is responsible for the optimization process of DCMPSO within a single discrete sub-environment. In this section, a hybrid population update strategy combining GA-based crossover and mutation with PSO-based velocity and position update is proposed as the updating mechanism during the population’s iterative process in the decision space. A dynamic adjustment scheme for certain parameters during population updating is designed to balance the convergence and diversity of the algorithm. Finally, an external archive maintenance method based on Euclidean distance projection pruning is developed.
2.4.1. GA-Based Crossover and Mutation Update Strategy
The single velocity and position update strategy in MOPSO often leads to excessive convergence, causing the population to easily fall into local optima. In contrast, the crossover and mutation update strategies in the GA enhance population diversity and distribution, and improve the exploration capability in the solution space. Therefore, this study introduces a GA-based population update strategy that incorporates two-point crossover and polynomial mutation to enhance population distribution and facilitate better exploration of the solution space.
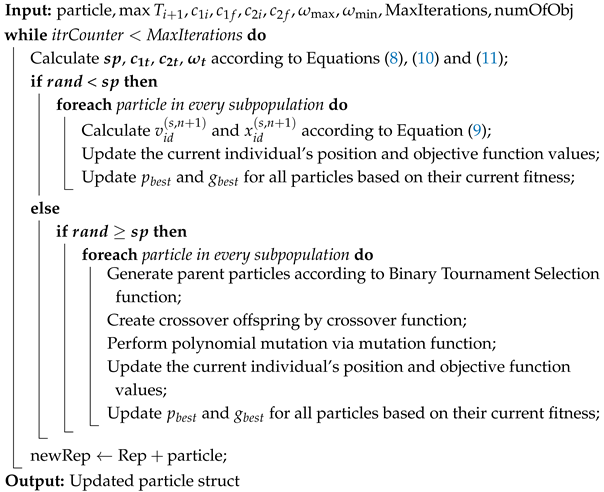
When a population update operation is required during the algorithm’s iteration process, a selection pressure is introduced, and a random number rand is generated within the range . Equation (8) determines the update strategy for the current generation by comparing the values of and .
where the random number is less than the selection pressure , the current generation’s population updates their positions in the decision space using GA’s two-point crossover and polynomial mutation methods. Otherwise, the population updates are performed using PSO’s velocity and position update strategy.
To enable the actual optimization component to better explore the solution space, accelerate population convergence, and enhance population diversity, we design a dynamic variation scheme for the selection pressure within a single sub-environment. Equation (9) describes the dynamic variation of in the -th sub-environment:
where and denote the maximum and minimum values of the selection pressure, respectively; t is the iteration counter of the algorithm within the -th sub-environment; and is the predicted number of iterations the -th sub-environment will last. Equations (8) and (9) show that the algorithm applies GA’s crossover and mutation-based population updates more frequently in the early stage of a single sub-environment to enhance exploration of the solution space, while in the later stage, it favors PSO’s velocity and position update strategy to accelerate convergence.
Figure 2 illustrates the schematic diagram of the two-point crossover operation. First, two parent individuals, parent 1 and parent 2, with relatively better fitness values are selected from the population using binary tournament selection. Two crossover points are then randomly chosen on their position vectors in the decision space. The gene segments between these two points are exchanged to generate two offspring individuals, child 1 and child 2.
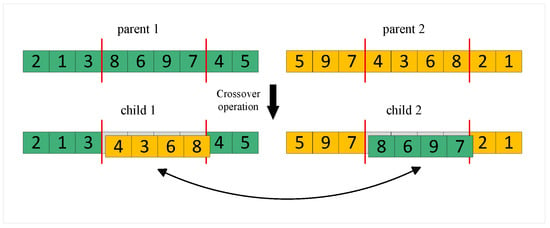
Figure 2.
Schematic diagram of two-point crossover.
The generated offspring have a certain probability of undergoing polynomial mutation. For the mutated offspring, each decision variable dimension is perturbed with a mutation probability , causing local variations near the original value. This perturbation follows a polynomial probability distribution with distribution index , which controls the magnitude of the mutation. After mutation, the offspring are projected back into the feasible decision space to ensure that all variables remain within the predefined boundary constraints.
2.4.2. Multiple Population Update Strategies of Particle Swarm Optimization
When > , the algorithm updates the population individuals using the velocity and position update strategy of particle swarm optimization (PSO). In traditional PSO, there is only a single population during iteration, which means there is only one global best solution guiding the update. When this global best solution becomes trapped in a local optimum, other individuals in the population tend to follow and get trapped as well. To address this, this study designs a multi-swarm velocity and position update strategy, as illustrated in Figure 3.
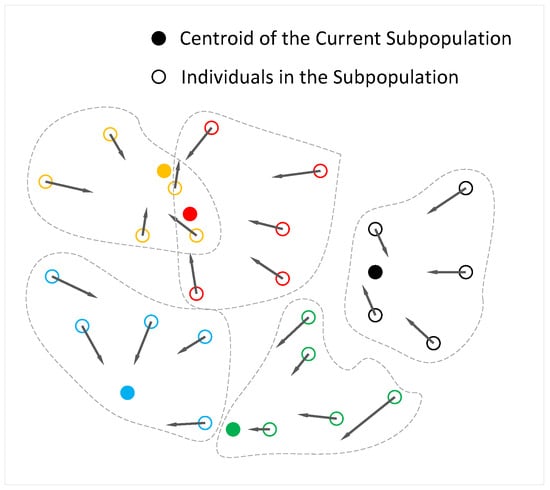
Figure 3.
Schematic diagram of the multi-swarm velocity and position update.
According to Figure 3, the algorithm uniformly divides the population into multiple subpopulations. Particles of the same color indicate that they belong to the same subpopulation, and solid particles indicate the best solutions within their respective subpopulations. Each subpopulation possesses its own local best solution, which guides the updates of individuals within that subpopulation. Multiple local best solutions help prevent all particles from being guided by a single global best solution and thus avoid premature convergence to local optima. This approach increases the population’s distribution and diversity without compromising the convergence ability of the algorithm. Equation (10) shows the velocity and position update formula:
where denotes the global best solution of the s-th subpopulation at generation n, and denotes the historical best solution of the i-th individual within the s-th subpopulation at generation n. The coefficients , , and represent the learning factors and inertia weight that dynamically vary with the iteration number within a single sub-environment. Their dynamic variation in the -th sub-environment is described by Equations (11) and (12).
where denotes the predicted number of iterations the -th sub-environment will last; and represent the initial values of the learning factors and , respectively; and denote their final values; and t is the iteration counter within the current sub-environment. Equation (10) indicates that, in the early stage of each sub-environment, the algorithm uses a larger individual learning factor and a smaller social learning factor , relying more on the particle’s own experience to explore the solution space more broadly. In the later stage, a smaller and larger are used to depend more on the guidance of the local best solution within each subpopulation, accelerating convergence toward the algorithm’s Pareto front.
where , , and denote the adaptive inertia weight, the maximum inertia weight, and the minimum inertia weight, respectively. The term represents the fitness value of the current individual, which is the normalized average of all objective function values across its dimensions. The terms and denote the minimum and maximum fitness values within the current population, respectively. As shown in Equation (12), the inertia weight adopts an adaptive variation strategy independent of the environmental change cycle. It varies adaptively according to the convergence status of the current particle: if the particle shows good convergence, the inertia weight decreases to promote exploitation; if convergence is poor, the inertia weight increases to encourage further exploration of the search space for better solutions.
2.4.3. External Archive Maintenance
The solutions stored in the external archive serve as the final representation of the solution set, where both convergence and diversity of the solutions are crucial. Therefore, the proposed DCMPSO implements a Euclidean distance–based projection pruning method to update and maintain the external archive, Rep. This method helps to improve the distribution of the solution set in the objective space. Taking the two-dimensional objective space as an example (see Figure 4), the method calculates the pairwise Euclidean distances among all individuals in the critical layer, identifies the two individuals with the greatest Euclidean distance, and connects them with a line segment. This segment is then divided into equal parts, producing k endpoints, where k is the number of particles still needed to fill the new external archive. All other individuals in the critical layer are projected onto this line segment, and those whose projections are closest to each endpoint are retained in the external archive Rep, thus completing the maintenance of the external archive.
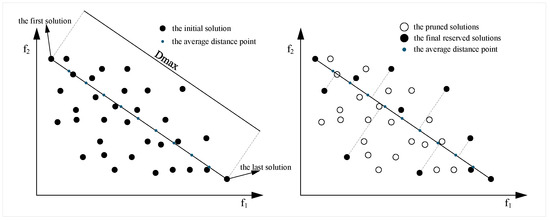
Figure 4.
Schematic diagram of external archive maintenance based on Euclidean distance.
The Euclidean distance-based projection pruning method has advantages over the crowding distance-based external archive maintenance approach in low-dimensional objective spaces. Therefore, the proposed DCMPSO algorithm adopts the crowding distance method to maintain the external archive when the number of objectives satisfies , and uses the Euclidean distance-based projection pruning method when .
Algorithm 3 presents the pseudocode of the actual optimization process in DCMPSO.
| Algorithm 3: Population individual update |
 |
2.5. Algorithm Structure
As shown in Figure 5, the structure of the proposed algorithm is divided into three main components: the environmental change detection, the environmental change response, and the actual optimization process. This chapter first presents the mechanism for environmental change detection, which includes detecting environmental changes and calculating the weighted linear correlation coefficient. The algorithm determines whether an environmental change has occurred by monitoring whether the objective function values of the same population differ across two consecutive generations. Once a change is detected, it computes the weighted linear correlation coefficient between two adjacent environments to assess the predictability of the environmental change.
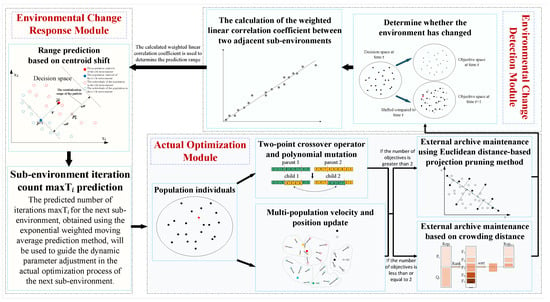
Figure 5.
Structure diagram of the DCMPSO algorithm.
The environmental change response module includes a centroid-shift-based range prediction strategy and an exponentially weighted moving average-based iteration prediction method. The centroid-shift-based prediction strategy estimates the potential location of the true Pareto front in the upcoming environment by utilizing the centroid shift vector of the population’s front and the corresponding weighted correlation coefficient in previous environments. The population is then reinitialized within the predicted range to respond to environmental changes. Meanwhile, the EWMA-based prediction method estimates the number of iterations that the next sub-environment will last based on the observed duration of past sub-environments. This prediction is used to guide dynamic parameter adjustments in the actual optimization process.
The actual optimization component involves the design of population update strategies, dynamic parameter adjustment, and external archive maintenance. In terms of population update, the algorithm divides the population into multiple subpopulations to reduce the likelihood of premature convergence caused by velocity–position update mechanisms in standard PSO. It further integrates the crossover and mutation strategies of the GA with the velocity–position updates from PSO. Additionally, adaptive mechanisms are designed for certain parameters to balance convergence and diversity in dynamic environments. For external archive maintenance, a novel Euclidean distance-based projection truncation method is proposed for bi-objective optimization problems to maintain the diversity and quality of archived solutions.
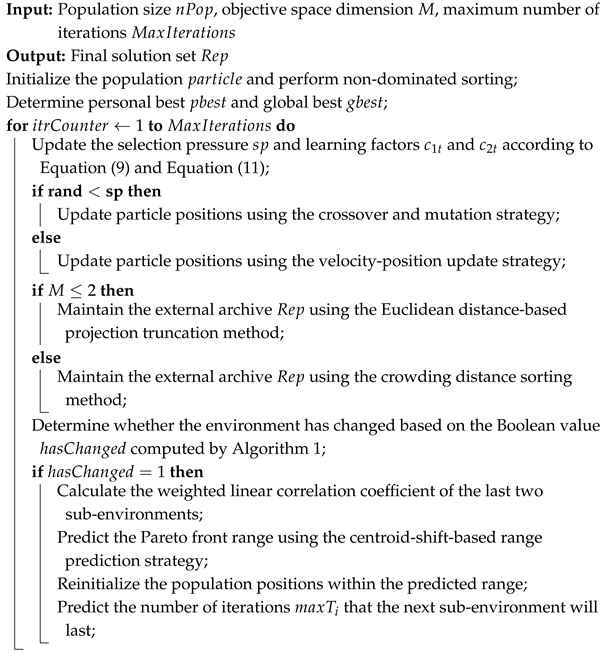
Algorithm 4 is the pseudocode of the complete algorithm.
| Algorithm 4: Pseudocode of the complete algorithm |
 |
3. Ablation and Comparative Experiments
3.1. Experimental Setup
3.1.1. Performance Metrics
To evaluate the overall performance of the algorithm across various test problems, this study employs the Inverted Generational Distance (IGD) [32] and Hypervolume (HV) [33] metrics to assess the quality of the solutions obtained by each algorithm. These two metrics are used to evaluate the performance of the solution set obtained by the algorithm in a single iteration and are classified as static evaluation metrics.
The IGD metric is used to measure the proximity and distribution quality between the approximate Pareto front obtained by an algorithm and the true Pareto optimal front, i.e., the convergence and diversity of the algorithm’s solution set. A smaller IGD value indicates that the algorithm’s front is closer to the true front and better distributed. Equation (13) presents the formula for calculating the IGD metric for a set of solutions .
where P is a proper representation of the true Pareto front, denotes the minimum distance between point and any point in the obtained solution set , and represents the number of sampled points on the true Pareto front P.
The Hypervolume (HV) metric can indirectly reflect the coverage of the algorithm’s Pareto front in the objective space. A larger HV value indicates that the solution set is more widely distributed and closer to the true Pareto front in the objective space, suggesting better convergence and diversity of the algorithm. Equation (14) presents the formula for computing the HV metric.
where represents the algorithm’s obtained front, m is the dimensionality of the objective space, and denotes the reference point. The refers to the mathematical concept of “volume measure,” which corresponds to “area” in two dimensions, “volume” in three dimensions, and “hypervolume” in m dimensions.
Since the individual IGD and HV metrics can only evaluate the quality of solution sets at a single time point, they are considered static performance metrics and cannot reflect other aspects of algorithm performance in dynamic environments. Therefore, based on the IGD and HV values, this paper extends two dynamic performance metrics, MIGD and MHV, to assess algorithm behavior over time. Additionally, the concepts of time-averaged IGD and time-averaged HV are also introduced. The MIGD and MHV represent the average IGD and HV values of the final obtained Pareto fronts in each discrete sub-environment, respectively, reflecting the quality of the solution set achieved within a limited number of iterations in each sub-environment. In contrast, the time-averaged IGD and time-averaged HV are obtained by averaging the IGD and HV values across all generations, indicating the overall performance of the algorithm throughout the entire optimization process.
3.1.2. Parameter Settings
Both the ablation studies and comparative experiments use the FDA and dMOP benchmark test suites to validate the performance of the proposed DCMPSO algorithm. The dMOP test functions are a class of benchmark problems designed to evaluate the adaptability and robustness of dynamic multi-objective optimization algorithms. Their objectives or constraints change over time to simulate real-world dynamic optimization scenarios. The FDA test functions are among the earliest standard test suites for dynamic multi-objective optimization. By incorporating time-dependent factors, they create various patterns of environmental changes to assess an algorithm’s responsiveness and stability in dynamic environments. For all eight test functions—FDA1 through FDA5 and dMOP1 through dMOP3—the maximum number of function evaluations (maxFE) is set to 100,000, the environment change frequency (taut) is fixed at 100, and the total number of environmental changes (nt) is 10. During the execution of each algorithm on these test functions, the population size N is set to 100, and the capacity of the external archive Rep is also set to 100. Table 1 summarizes the settings for the number of objectives M, the number of decision variables D, and the environment change step size step for the eight test functions (FDA1–5 and dMOP1–3).

Table 1.
Parameter settings of test functions.
In the ablation study, based on the DCMPSO algorithm framework, the variant DCMPSO-nC refers to the algorithm without the centroid-translation-based range prediction strategy, while DCMPSO-nGC refers to the algorithm that incorporates neither the centroid-translation-based range prediction strategy nor the GA-based crossover and mutation mechanism. The parameter settings for the three algorithms—DCMPSO, DCMPSO-nC, and DCMPSO-nGC—are as follows:
A subset of parameters was empirically tuned through multiple rounds of experimentation to determine appropriate values: smoothing factor ; weights for calculating the weighted correlation coefficient corr were set to ; inertia weight , ; learning factors , ; and selection pressure , . Based on existing research and a review of relevant literature, the remaining parameters were set using widely accepted standard values: crossover probability , mutation probability , and polynomial mutation distribution index .
In the comparative experiments, the DNSGA-II and SGEA algorithms were selected as benchmarks against DCMPSO. For DNSGA-II, the parameter indicates that it responds to environmental changes using mutation-based reinitialization. The parameter settings for DNSGA-II and SGEA, based on existing studies, are shown in Table 2.

Table 2.
Parameter settings of DNSGA-II and SGEA.
3.2. Ablation Experiment
Based on the IGD and HV results obtained by running the three algorithms—DCMPSO, DCMPSO-nC, and DCMPSO-nGC—on the FDA and dMOP benchmark test suites, we plotted the fluctuation trends of the IGD and HV indicators, as shown in Figure 6 and Figure 7, respectively. Specifically, subfigures (a) through (h) in Figure 6 respectively illustrate the IGD performance trends of the three algorithms—DCMPSO, DCMPSO-nC, and DCMPSO-nGC—on eight test problems (i.e., dMOP1–3 and FDA1–5), while subfigures (a) through (h) in Figure 7 show the HV performance trends of the same algorithms on the same set of test problems. Each subfigure contains three curves representing the mean performance over 30 independent runs, along with the corresponding standard deviation bands, for the three algorithms on each test function.
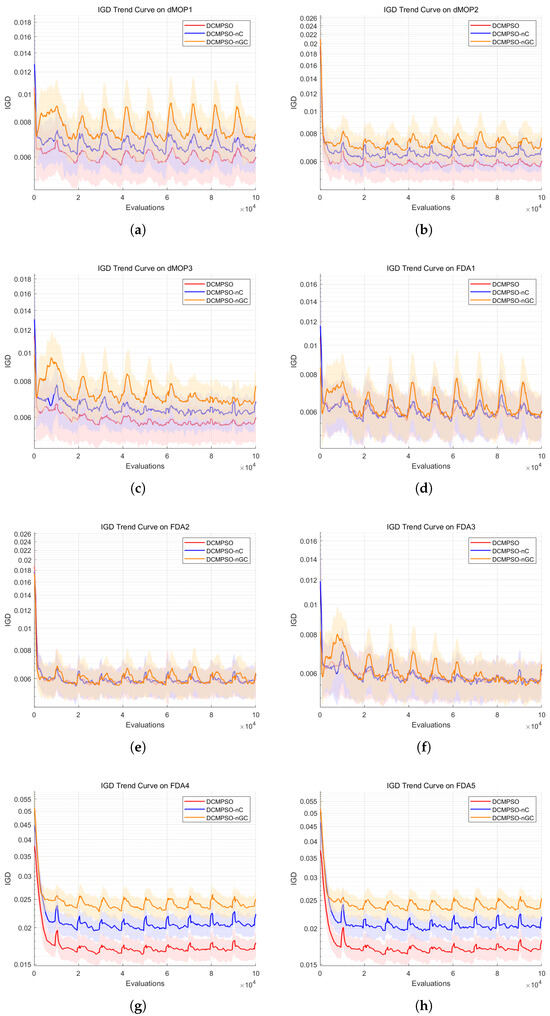
Figure 6.
The fluctuation trend charts of the IGD metric for DCMPSO, DCMPSO-nC, and DCMPSO-nGC on each test function in the ablation study. (a) IGD curves on dMOP1, (b) IGD curves on dMOP2, (c) IGD curves on dMOP3, (d) IGD curves on FDA1, (e) IGD curves on FDA2, (f) IGD curves on FDA3, (g) IGD curves on FDA4, (h) IGD curves on FDA5.
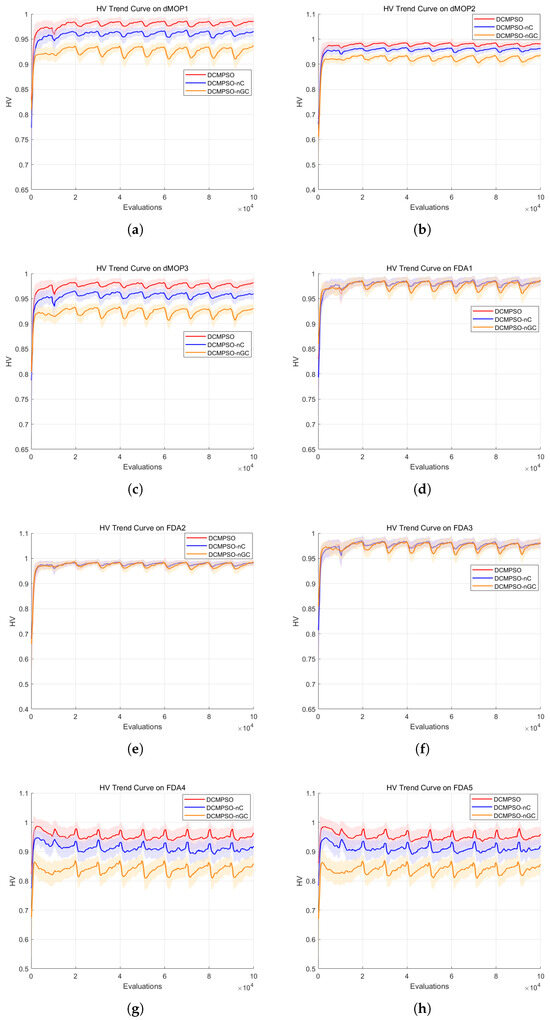
Figure 7.
The fluctuation trend charts of the HV metric for DCMPSO, DCMPSO-nC, and DCMPSO-nGC on each test function in the ablation study. (a) HV curves on dMOP1, (b) HV curves on dMOP2, (c) HV curves on dMOP3, (d) HV curves on FDA1, (e) HV curves on FDA2, (f) HV curves on FDA3, (g) HV curves on FDA4, (h) HV curves on FDA5.
Based on the information presented in the figure, it can be observed that in terms of the IGD and HV metrics, there are no significant performance differences among the algorithms for the relatively simple test functions FDA1 to FDA3. However, for the other test problems, DCMPSO significantly outperforms both DCMPSO-nC and DCMPSO-nGC in terms of IGD and HV values, especially on the more complex functions FDA4 and FDA5. Furthermore, the metric fluctuations at each environmental change point are smaller for DCMPSO compared to DCMPSO-nC and DCMPSO-nGC, and DCMPSO also converges more rapidly to the optimal values under the new environments. Additionally, DCMPSO-nC exhibits better HV performance than DCMPSO-nGC.
For the FDA4 and FDA5 test functions, the IGD performance and HV metric of DCMPSO improved by approximately 17% compared to DCMPSO-nC, and by around 34% compared to DCMPSO-nGC. This demonstrates that, in complex dynamic optimization problems, the range prediction strategy based on centroid translation effectively accelerates the algorithm’s response to environmental changes, while the GA-based crossover and mutation update strategy significantly enhances the distribution of the solution set. For the dMOP1–3 test functions, the IGD metric of DCMPSO shows improvements of about 5% and 11% compared to DCMPSO-nC and DCMPSO-nGC, respectively, indicating that these two mechanisms also contribute to performance enhancement under simpler dynamic environments. These results support the conclusion that the centroid-translation-based prediction mechanism effectively estimates the possible location range of the true Pareto front under a new environment, thus addressing the issue of slow convergence commonly found in traditional particle swarm optimization algorithms in dynamic settings. Moreover, DCMPSO-nC, enhanced with the GA-based crossover and mutation strategy, effectively improves the diversity and distribution of the solution set.
3.3. Comparative Experiments
In this experiment, two commonly used dynamic multi-objective optimization algorithms, DNSGA-II and SGEA, are selected as benchmark algorithms for comparison with DCMPSO. All three algorithms are independently executed 30 times on the FDA and dMOP benchmark functions to obtain the IGD and HV metric values. A statistical analysis is then conducted to compare the experimental results and verify the superiority of the proposed DCMPSO algorithm.
3.3.1. The Image of the Algorithmic Front and the True Front of DCMPSO
According to Figure 8, subfigures (a) through (h) respectively illustrate the obtained fronts of the DCMPSO algorithm and the corresponding true Pareto fronts on the FDA1–5 and dMOP1–3 test problems.
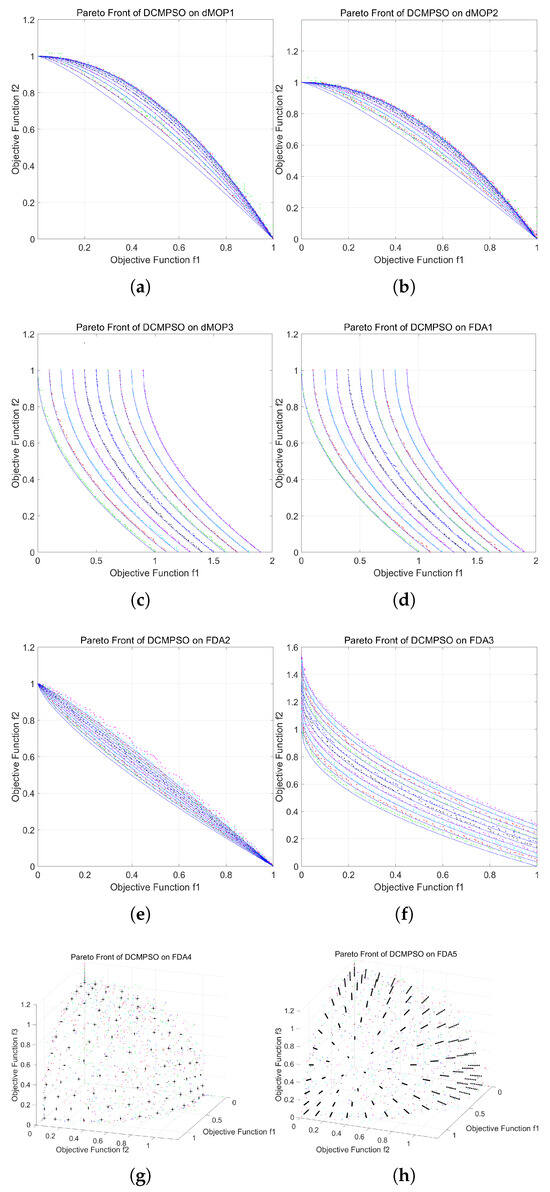
Figure 8.
Comparison between the approximated Pareto fronts obtained by DCMPSO and the true Pareto fronts on each test function. (a) Comparison of the Pareto fronts in dMOP1, (b) Comparison of the Pareto fronts in dMOP2, (c) Comparison of the Pareto fronts in dMOP3, (d) Comparison of the Pareto fronts in FDA1, (e) Comparison of the Pareto fronts in FDA2, (f) Comparison of the Pareto fronts in FDA3, (g) Comparison of the Pareto fronts in FDA4, (h) Comparison of the Pareto fronts in FDA5.
In Figure 8a–f, the blue solid lines represent the true Pareto fronts of the current test function under different sub-environments, while the scattered points in various colors indicate the approximate Pareto fronts obtained by the algorithm in the corresponding sub-environments. In Figure 8g,h, the black points represent the true Pareto front of the current test function across all sub-environments, and the colored points still denote the approximate Pareto fronts obtained by the algorithm in each corresponding sub-environment. The use of different colors allows for a clear distinction between the solution sets at different generations and the true front, facilitating the observation of the algorithm’s tracking ability in dynamic environments. For the FDA1 and dMOP3 test functions, the true Pareto front does not change with the environment over time. To facilitate visual distinction between the algorithm’s front in each generation and the true Pareto front, we applied an offset to the plotted fronts for each generation in the figures corresponding to FDA1 and dMOP3. As illustrated in the figures, the approximation fronts generated by DCMPSO are able to closely fit the true Pareto curves or surfaces across the various test functions, effectively identifying the optimal solutions in the decision space under each sub-environment.
3.3.2. Statistical Comparison of Experimental Results
As shown in Figure 9, subfigures (a) to (h) illustrate the IGD fluctuation trends of the three algorithms—DCMPSO, SGEA, and DNSGA-II—on the dMOP1–3 and FDA1–5 test functions, respectively. Figure 10 presents the fluctuation trends of the HV metric. In the figures, the curves and shaded regions represent the mean performance and standard deviation bands obtained from 30 independent runs of each algorithm. Table A1 and Table A2 in Appendix A summarize the statistical results of the All-time IGD Average and MIGD metrics, respectively, based on 30 independent runs of DCMPSO, SGEA, and DNSGA-II on the FDA and dMOP test suites. Table A3 and Table A4 in Appendix A report the corresponding statistics for the All-time HV Average and MHV metrics. Appendix A provides additional analysis based on these four tables to further validate the experimental conclusions.
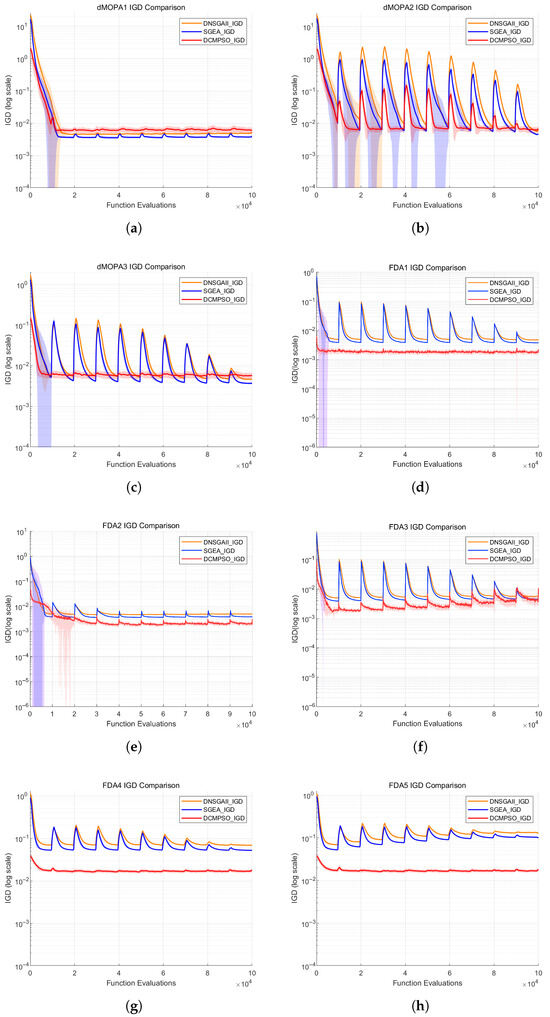
Figure 9.
IGD metric fluctuation curves of DCMPSO, DNSGA-II, and SGEA on each test function in the comparative experiment. (a) IGD curves on dMOP1, (b) IGD curves on dMOP2, (c) IGD curves on dMOP3, (d) IGD curves on FDA1, (e) IGD curves on FDA2, (f) IGD curves on FDA3, (g) IGD curves on FDA4, (h) IGD curves on FDA5.
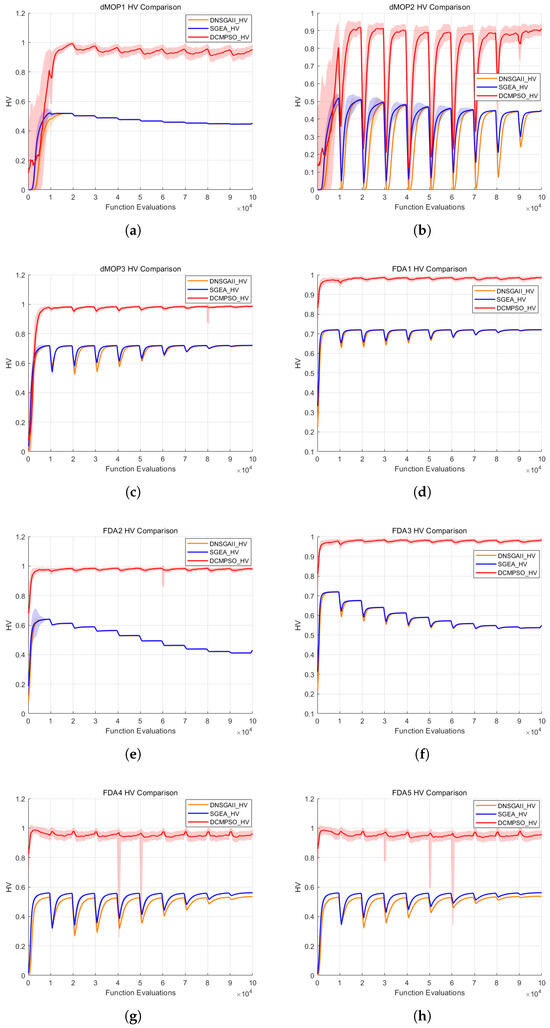
Figure 10.
HV metric fluctuation curves of DCMPSO, DNSGA-II, and SGEA on each test function in the comparative experiment. (a) HV curves on dMOP1, (b) HV curves on dMOP2, (c) HV curves on dMOP3, (d) HV curves on FDA1, (e) HV curves on FDA2, (f) HV curves on FDA3, (g) HV curves on FDA4, (h) HV curves on FDA5.
According to Figure 9, the IGD values of DCMPSO exhibit minimal fluctuation following environmental changes and are able to rapidly reach extreme values. Moreover, DCMPSO consistently outperforms DNSGA-II and SGEA in terms of IGD across most of the evolutionary process, with a notably narrow standard deviation band. This advantage is particularly pronounced in the more complex test functions FDA4 and FDA5.
Statistical analysis shows that, on the FDA benchmark functions, the All-time IGD Average of DCMPSO improves by at least approximately 50.6% compared to the baseline algorithms. On the dMOP benchmark functions, the improvement reaches at least 50% as well. For the MIGD metric, DCMPSO achieves at least an approximate 36.5% improvement over the other algorithms on FDA1–3, and an improvement of at least about 68.5% on the more challenging FDA4 and FDA5 functions. These results demonstrate that DCMPSO is capable of accurately predicting and rapidly responding to dynamic changes in the environment, showing significantly better adaptability than DNSGA-II and SGEA. Compared to these two algorithms, DCMPSO exhibits superior convergence and diversity on most test functions, as well as better robustness.
According to Figure 10, the HV values of DCMPSO exhibit significantly smaller fluctuations in response to environmental changes on most test functions compared to DNSGA-II and SGEA, and are able to rapidly reach optimal values in new environments. During the optimization process, DCMPSO consistently outperforms the two baseline algorithms in terms of HV, with a relatively narrow standard deviation band.
Statistical analysis reveals that the All-time HV Average values achieved by DCMPSO show improvements ranging from 37.8% to 90% over those of DNSGA-II and SGEA. Regarding the MHV metric, DCMPSO achieves improvements of approximately 36.9% to 71.8% compared to the two baseline algorithms. These results indicate that the solution set obtained by DCMPSO exhibits clearly superior diversity and distribution performance, as well as better robustness throughout the optimization process. Furthermore, DCMPSO demonstrates the ability to more accurately and quickly locate the optimal solutions under dynamically changing environments.
In summary, the ablation and comparative experiments support the conclusion that the range prediction strategy based on centroid shift in DCMPSO is capable, in most cases, of effectively estimating the region of the true Pareto front in new environments. This enhances the algorithm’s robustness and accelerates convergence. Meanwhile, the GA-based crossover and mutation population update strategy improves the population’s ability to explore the solution space, thereby indirectly increasing the diversity and distribution quality of the obtained solutions. Compared to widely used algorithms such as DNSGA-II and SGEA, DCMPSO achieves a better balance between convergence and diversity, resulting in a significant improvement in overall algorithmic performance.
4. Validation in a Dynamic Multi-Objective Task Allocation Scenario for UAVs
To further validate the optimization capability and practical value of the DCMPSO algorithm, a dynamic task allocation system model involving multiple UAVs and multiple target regions is first constructed in this study, and the model is then optimized using DCMPSO.
4.1. Task Allocation Model Construction
4.1.1. Model Framework
Assume there are homogeneous unmanned aerial vehicles (UAVs), denoted as , all initially located at the same position awaiting task assignment. A total of reconnaissance tasks need to be executed. Each UAV returns to its initial location only after completing all of its assigned tasks.
4.1.2. Encoding Method
The encoding scheme in the model uses binary encoding. Accordingly, the dimension of the decision variable vector dim is . In the decision matrix with values in , each row corresponds to a UAV and each column corresponds to a reconnaissance task. The Boolean value at each matrix position indicates whether the corresponding UAV performs the corresponding reconnaissance task. However, during the algorithm execution, the elements of the decision variable vector are encoded as real numbers within the range . These real-valued encodings require a decoding operation to convert them into the binary encoding used by the model for objective function evaluation. Taking an example with five UAVs and three tasks, Figure 11 illustrates the decoding process.
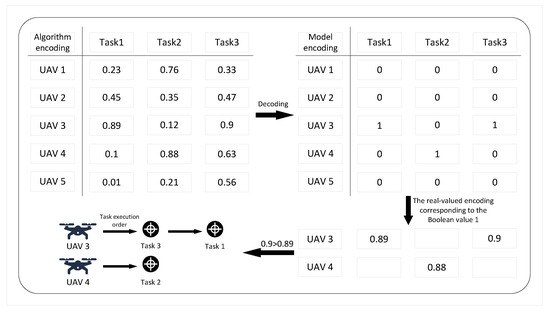
Figure 11.
Illustration of the encoding and decoding operations for UAV task allocation.
Assume there are homogeneous unmanned aerial vehicles (UAVs), denoted as , all initially located at the same position awaiting task assignment. A total of reconnaissance tasks need to be executed. Each UAV returns to its initial location only after completing all of its assigned tasks. The system model includes the following parameter settings: is a Boolean variable in the decision space of the model function, indicating whether UAV i is assigned to perform task j; represents the coordinate information of reconnaissance task j; and denotes the initial coordinate of UAV i.
4.1.3. Objective Function
Some reconnaissance tasks require a high level of stealth. For example, during forest investigations, it is essential to avoid disturbing the natural habitat of wildlife, so each UAV’s flight path should not be excessively long. In addition, reducing the maximum flight distance of a single UAV decreases the amount of energy it needs to carry, which indirectly reduces its maximum payload and supports lightweight UAV design. Therefore, the first objective of the model is to minimize the maximum flight distance of any single UAV. The calculation of the first objective function is shown in Equation (15).
assuming that after decoding the decision variable vector, the task execution sequence for the i-th UAV is given by , where k denotes the total number of tasks assigned to UAV i, and represents the index of the l-th task executed by this UAV. The coordinate of the reconnaissance task is denoted by , and O denotes the initial position of the UAV. The total flight path of the UAV is denoted as , which serves as the function value of this objective.
The flight of UAVs generates flight paths. Since multiple UAVs perform reconnaissance tasks, it is insufficient to consider only the maximum flight distance of a single UAV; the total flight distance of all UAVs must also be constrained. Therefore, the second objective is to minimize the total flight distance D of all UAVs. Equation (16) presents the formula for calculating the total flight distance of all UAVs.
In summary, the model consists of two optimization objectives, making it a bi-objective optimization problem.
4.1.4. Constraint Function
In practical applications, a reconnaissance task is not allowed to be executed repeatedly by multiple UAVs. Therefore, the first constraint ensures that each reconnaissance task is assigned to only one UAV. Additionally, all task objectives must be completed; the second constraint requires that each reconnaissance task is executed by at least one UAV, meaning that each task is performed by exactly one UAV. Both of these constraints can be enforced through the aforementioned encoding and decoding schemes.
Given that the problem is set with five UAVs performing 20 reconnaissance tasks, to ensure execution efficiency, each UAV must be assigned at least one task. This constraint is implemented by introducing a penalty term. Equation (17) defines the number of tasks assigned to UAV i:
If , indicating that UAV has not been assigned any task, a penalty value of is added to the objective function value for all objectives.
4.2. Simulation Experiment
4.2.1. Dynamic Task Target Points
Since the locations of reconnaissance targets in practical scenarios are not necessarily fixed and some reconnaissance points may migrate over time, it is essential for reconnaissance UAVs to rapidly adjust their routes and generate new optimal paths to perform surveillance. In terms of the model, this means that at regular intervals, the positions of certain task points within the task model will change, requiring the algorithm to find a new route within a limited time. The flight start and end points of the five UAVs are set by default at coordinate , and the initial coordinates of the 20 tasks are listed in Table 3.

Table 3.
Table of initial coordinates for 20 target points in the task allocation problem.
Based on this, we assume that task target 5 moves northeast at a constant speed within the coordinate area; task targets 8 and 15 move eastward at a constant speed; task target 14 moves southward at a constant speed; and task target 7 moves southeast at a constant speed. Using the number of iterations as the time parameter, the velocities of task targets 8 and 15 are km/generation, those of targets 5 and 7 are km/generation, and the velocity of target 14 is km/generation.
4.2.2. Simulation Results
In this subsection, the previously described task allocation model involving five UAVs and twenty dynamically changing reconnaissance target points is used as the experimental scenario to validate the effectiveness of the DCMPSO algorithm. The DCMPSO algorithm updates the task location coordinates at regular intervals and generates a new UAV route planning map each time, resulting in a total of six route planning instances.
Figure 12 illustrates the fluctuation curves of the two objective function values with respect to the number of iterations. Subfigure (a) shows the variation in the maximum flight distance of a single UAV, while subfigure (b) depicts the variation in the total flight distance of all UAVs. As shown in Figure 12, both objective function values rapidly converge to low and stable levels as the algorithm iterates. Only slight fluctuations are observed around specific generations where task targets undergo dynamic changes, after which convergence quickly resumes. These results indicate that DCMPSO is capable of rapidly re-optimizing after environmental changes, efficiently adapting to dynamic conditions, and maintaining the stability of the overall solution. This characteristic demonstrates the practical value of DCMPSO for dynamic multi-objective UAV reconnaissance task allocation problems, particularly in dynamic environments that require frequent responses to sudden or emergent tasks, where it exhibits strong robustness and applicability.
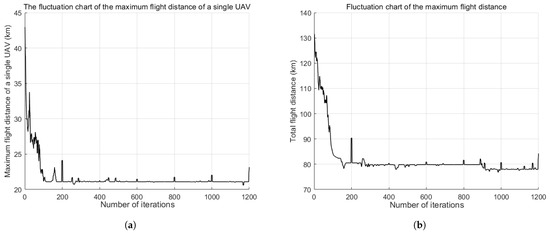
Figure 12.
Illustration of objective function value fluctuations with iterations. (a) The convergence curve of the first objective value “the maximum flight distance of a single UAV” over iterations, (b) The convergence curve of the second objective value “the total flight distance of all UAVs” over iterations.
Figure 13 presents the visualization of the optimization results of DCMPSO for the dynamic multi-objective UAV task allocation model. Subfigures (a) to (f) illustrate the planned flight paths of UAVs in six different sub-environments, showing the task allocation schemes generated by DCMPSO for the five UAVs. In each subfigure, the colored polyline represents the flight path of a UAV, and the numbered nodes along the path indicate the reconnaissance target points assigned to that UAV. The X-axis and Y-axis represent the spatial coordinates of the task region, with units in kilometers (km).
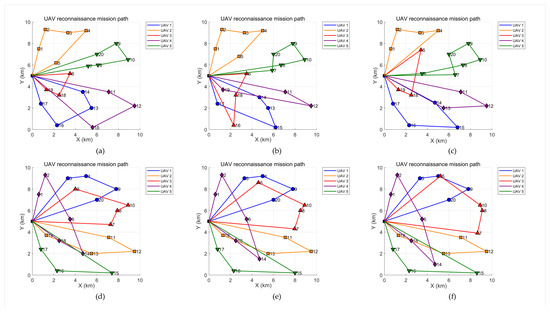
Figure 13.
Illustration of route planning for multiple UAVs among dynamic task targets. (a) The final planning result in sub-environment 1, (b) The final planning result in sub-environment 2, (c) The final planning result in sub-environment 3, (d) The final planning result in sub-environment 4, (e) The final planning result in sub-environment 5, (f) The final planning result in sub-environment 6.
As shown in Figure 13, in multiple dynamic environments, the algorithm is generally able to generate reasonable reconnaissance paths for each UAV while effectively avoiding task assignment conflicts. Moreover, the task load and flight distance are relatively balanced across all UAVs. Although in certain subfigures, some UAVs exhibit more winding or unevenly distributed paths—indicating instances of local optima—these cases are quickly corrected in subsequent iterations, demonstrating DCMPSO’s strong capability to escape local optima.
In summary, the DCMPSO algorithm demonstrates rapid adaptability to sudden environmental changes and stable path reconstruction performance in practical applications, effectively avoiding entrapment in local optima. This clearly highlights the robustness and flexibility of DCMPSO in dynamic multi-task scheduling problems. It not only delivers high-quality path planning in most sub-environments but also promptly adjusts routes in response to significant changes in task targets, thereby enabling the discovery of new global optima. These characteristics indicate promising potential for real-world engineering applications.
5. Conclusions and Discussion
This paper proposes a dynamic multi-objective particle swarm optimization algorithm, DCMPSO, based on centroid shift prediction, in response to the limitations of traditional particle swarm optimization (PSO) algorithms in solving dynamic multi-objective task allocation problems for UAVs. The DCMPSO framework comprises three main components: environmental change detection, environmental change response, and actual optimization. The centroid shift prediction mechanism designed for the detection and response modules addresses the issues of premature convergence, poor robustness, and slow convergence typically encountered by PSO in dynamic environments. In the actual optimization phase, the GA-based crossover and mutation update strategy, combined with dynamic parameter adjustment, effectively balances convergence and diversity within each sub-environment, reducing the likelihood of local optima and significantly enhancing the overall algorithmic performance.
We conducted systematic ablation and comparative experiments. The ablation study demonstrates that the centroid-based range prediction strategy improves performance by approximately 17% on complex benchmark functions, while the GA-based crossover and mutation strategy yields an additional improvement of about 17% in similarly challenging problems. The comparative experiments show that DCMPSO outperforms two conventional algorithms, DNSGA-II and SGEA, with improvements in convergence and diversity ranging from approximately 37% to 70%. Subsequently, we applied DCMPSO to optimize a dynamic multi-objective task allocation model for multiple UAVs. The resulting solutions clearly demonstrate the robustness and flexibility of DCMPSO in real-world applications. In conclusion, the experimental results fully indicate that DCMPSO achieves superior convergence and diversity in dynamic multi-objective optimization problems and holds strong engineering potential in UAV task allocation under dynamic conditions.
Future research on this topic may focus on several aspects: First, in the environmental change response phase, nonlinear modeling techniques based on deep learning—such as Deep Neural Networks (DNNs) or Recurrent Neural Networks (RNNs)—could be introduced to achieve more accurate predictions of the true Pareto front. In terms of the task allocation scenario, more realistic three-dimensional geographic environment models could be constructed, and additional dynamic environmental factors—such as moving obstacles and variations in wind speed or direction—could be incorporated to enhance the model’s applicability to real-world contexts, enabling it to be applied to a wider range of real-world scenarios, such as post-disaster reconnaissance in natural disaster areas and wildlife protection reconnaissance tasks. Moreover, due to DCMPSO’s strong solution diversity and distribution capabilities, it could play a greater role in multimodal optimization problems, such as generating multiple feasible approximate solutions for UAV task allocation.
Supplementary Materials
The following supporting information can be downloaded at: https://www.mdpi.com/article/10.3390/drones9080556/s1.
Author Contributions
Conceptualization, S.W. and P.Q.; Investigation, P.Q., Q.Y., Z.X., and Q.S.; Methodology, S.W. and P.Q.; Software, P.Q., Q.Y., and Z.X.; Validation, P.Q., Q.Y., Z.X., and Q.S.; Formal analysis, P.Q. and Q.Y.; Resources, S.W.; Data curation, P.Q.; Writing—original draft preparation, S.W. and P.Q.; Writing—review and editing, S.W. and P.Q.; Visualization, P.Q. and Z.X.; Supervision, S.W.; Project administration, S.W.; Funding acquisition, S.W. All authors have read and agreed to the published version of the manuscript.
Funding
This research was supported by the Fundamental Research Funds for the Central Universities (grant number 2024JCCXJD02).
Data Availability Statement
The original contributions presented in this study are included in the article/Supplementary Materials. Further inquiries can be directed to the corresponding author(s).
DURC Statement
Current research is limited to the field of multi-objective task allocation and path optimization in multi-UAV systems, which is beneficial for intelligent reconnaissance, urban logistics delivery, and post-disaster emergency rescue scenarios that require cooperative operations of drone swarms, and does not pose a threat to public health or national security. Authors acknowledge the dual-use potential of the research involving autonomous decision-making, task allocation, and path planning technologies in multi-UAV systems and confirm that all necessary precautions have been taken to prevent potential misuse. As an ethical responsibility, authors strictly adhere to relevant national and international laws about DURC. Authors advocate for responsible deployment, ethical considerations, regulatory compliance, and transparent reporting to mitigate misuse risks and foster beneficial outcomes.
Conflicts of Interest
The authors declare no conflicts of interest.
Abbreviations
The following abbreviations are used in this manuscript:
| UAV | Unmanned Aerial Vehicle |
| DCMPSO | Dynamic Multi-Objective Particle Swarm Optimization Algorithm Based on |
| Centroid Shift Prediction | |
| EWMA | Exponentially Weighted Moving Average-based Prediction Mechanism |
| DNSGA-II | Dynamic Non-dominated Sorting Genetic Algorithm II |
| SGEA | Steady-State and Generational Evolutionary Algorithm |
| GA | Genetic Algorithm |
| PSO | Particle Swarm Optimization |
| DCMPSO-nC | DCMPSO Without the Centroid Shift-Based Range Prediction Strategy |
| DCMPSO-nGC | DCMPSO Without Crossover-Mutation Updating and Centroid Shift-Based |
| Range Prediction Strategies |
Appendix A
Table A1, Table A2, Table A3 and Table A4 present the statistical results of 20 independent runs of DCMPSO, SGEA, and DNSGA-II on the FDA and dMOP benchmark test suites. Specifically, Table A1 reports the All-time IGD Averages, Table A2 provides the MIGD values, Table A3 lists the All-time HV Averages, and Table A4 contains the MHV metrics. We apply the Wilcoxon rank-sum test to calculate the significance probability (p-value) and evaluate the statistical significance of the differences between the performance of DCMPSO and that of DNSGA-II and SGEA across the 20 independent runs. The symbols (+/=/−) respectively indicate that, based on a significance level of 0.05, the performance of DCMPSO is statistically better than, equivalent to, or worse than that of the compared algorithm. The bolded values in each row denote the best performance among the three algorithms for the corresponding metric.

Table A1.
Summary table of All-time IGD Averages.
Table A1.
Summary table of All-time IGD Averages.
| Test Problem | Statistics | DCMPSO | DNSGAII | SGEA |
|---|---|---|---|---|
| FDA1 | mean | |||
| std | ||||
| p-value | – | |||
| FDA2 | mean | |||
| std | ||||
| p-value | – | |||
| FDA3 | mean | |||
| std | ||||
| p-value | – | |||
| FDA4 | mean | |||
| std | ||||
| p-value | – | |||
| FDA5 | mean | |||
| std | ||||
| p-value | – | |||
| dMOP1 | mean | |||
| std | ||||
| p-value | – | |||
| dMOP2 | mean | |||
| std | ||||
| p-value | – | |||
| dMOP3 | mean | |||
| std | ||||
| p-value | – | |||
| +/=/− | – | 8/0/0 | 8/0/0 | |
According to Table A1, the All-time IGD Average values achieved by DCMPSO are significantly better than those of DNSGA-II and SGEA, particularly on the complex dynamic test problems FDA4 and FDA5. Furthermore, the sample standard deviations of DCMPSO under this metric are substantially smaller than those of the two comparison algorithms. These results indirectly indicate that DCMPSO exhibits superior convergence and robustness in the global optimization process compared to DNSGA-II and SGEA.

Table A2.
Summary table of MIGD index.
Table A2.
Summary table of MIGD index.
| Test Problem | Statistics | DCMPSO | DNSGAII | SGEA |
|---|---|---|---|---|
| FDA1 | MIGD | |||
| std | ||||
| p-value | – | |||
| FDA2 | MIGD | |||
| std | ||||
| p-value | – | |||
| FDA3 | MIGD | |||
| std | ||||
| p-value | – | |||
| FDA4 | MIGD | |||
| std | ||||
| p-value | – | |||
| FDA5 | MIGD | |||
| std | ||||
| p-value | – | |||
| dMOP1 | MIGD | |||
| std | ||||
| p-value | – | |||
| dMOP2 | MIGD | |||
| std | ||||
| p-value | – | |||
| dMOP3 | MIGD | |||
| std | ||||
| p-value | – | |||
| +/=/− | – | |||
According to Table A2, the MIGD values of DCMPSO are significantly lower than those of DNSGA-II and SGEA, particularly on the complex benchmark problems FDA4 and FDA5 within the FDA series. Although its performance on the dMOP test problems is slightly inferior to that of SGEA, DCMPSO exhibits smaller sample standard deviations in dMOP1 and dMOP2. These results indicate that, in most cases, DCMPSO is capable of producing higher-quality optimal solutions for each sub-environment within a limited number of iterations, outperforming the two comparison algorithms.
According to Table A3, the All-time HV Average values of DCMPSO are significantly higher than those of DNSGA-II and SGEA across all test problems, although the corresponding standard deviations are relatively larger. This indicates that throughout the entire optimization process, the solution set obtained by DCMPSO demonstrates considerably better diversity than those of the two comparison algorithms and remains much closer to the true Pareto front during the entire process.
Table A4 shows that the MHV values achieved by DCMPSO are significantly higher than those of DNSGA-II and SGEA across all test problems. This indicates that within a limited number of iterations, the final solution sets obtained by DCMPSO in each sub-environment demonstrate substantially better distribution and diversity than those of the two comparison algorithms. These results suggest that DCMPSO exhibits superior rapid response capability and stronger convergence performance in complex dynamic environments.

Table A3.
Summary table of All-time HV Averages.
Table A3.
Summary table of All-time HV Averages.
| Test Problem | Statistics | DCMPSO | DNSGAII | SGEA |
|---|---|---|---|---|
| FDA1 | mean | |||
| std | ||||
| p-value | – | |||
| FDA2 | mean | |||
| std | ||||
| p-value | – | |||
| FDA3 | mean | |||
| std | ||||
| p-value | – | |||
| FDA4 | mean | |||
| std | ||||
| p-value | – | |||
| FDA5 | mean | |||
| std | ||||
| p-value | – | |||
| dMOP1 | mean | |||
| std | ||||
| p-value | – | |||
| dMOP2 | mean | |||
| std | ||||
| p-value | – | |||
| dMOP3 | mean | |||
| std | ||||
| p-value | – | |||
| +/=/− | – | |||

Table A4.
Summary table of MHV index.
Table A4.
Summary table of MHV index.
| Test Problem | Statistics | DCMPSO | DNSGAII | SGEA |
|---|---|---|---|---|
| FDA1 | MHV | |||
| std | ||||
| p-value | – | |||
| FDA2 | MHV | |||
| std | ||||
| p-value | – | |||
| FDA3 | MHV | |||
| std | ||||
| p-value | – | |||
| FDA4 | MHV | |||
| std | ||||
| p-value | – | |||
| FDA5 | MHV | |||
| std | ||||
| p-value | – | |||
| dMOP1 | MHV | |||
| std | ||||
| p-value | – | |||
| dMOP2 | MHV | |||
| std | ||||
| p-value | – | |||
| dMOP3 | MHV | |||
| std | ||||
| p-value | – | |||
| +/=/− | – | |||
References
- Noguchi, T.; Komiya, Y. Persistent Cooperative Monitoring System of Disaster Areas Using UAV Networks. In Proceedings of the 2019 IEEE SmartWorld, Ubiquitous Intelligence & Computing, Advanced & Trusted Computing, Scalable Computing & Communications, Cloud & Big Data Computing, Internet of People and Smart City Innovation (SmartWorld/SCALCOM/UIC/ATC/CBDCom/IOP/SCI), Leicester, UK, 19–23 August 2019; pp. 1595–1600. [Google Scholar] [CrossRef]
- Koeneke, R.; Babiceanu, R.F.; Seker, R. Target Area Surveillance Optimization with Swarms of Autonomous Micro Aerial Vehicles. In Proceedings of the 2019 IEEE International Systems Conference (SysCon), Orlando, FL, USA, 8–11 April 2019; pp. 1–6. [Google Scholar] [CrossRef]
- Wan, W.; Lin, Y.; Chen, M.; Xu, P.; Li, X.; Shang, B. Reliability Assessment of Target Recognition Task Based on Unmanned Aerial Vehicle Simulation System. In Proceedings of the 2024 7th International Conference on Advanced Algorithms and Control Engineering (ICAACE), Shanghai, China, 1–3 March 2024; pp. 1389–1392. [Google Scholar] [CrossRef]
- He, J.; Pan, X.; Zhang, X. Unmanned Aerial Vehicles Data Gathering Scheme Based on Sparse Sampling. IEEE Commun. Lett. 2024, 28, 1969–1973. [Google Scholar] [CrossRef]
- Li, X.; Tan, J.; Liu, A.; Vijayakumar, P.; Kumar, N.; Alazab, M. A Novel UAV-Enabled Data Collection Scheme for Intelligent Transportation System Through UAV Speed Control. IEEE Trans. Intell. Transp. Syst. 2021, 22, 2100–2110. [Google Scholar] [CrossRef]
- Li, B.; Zhang, H.; Zhang, L.; Feng, D.; Fei, Y. Research on Path Planning and Evaluation Method of Urban Logistics UAV. In Proceedings of the 2021 3rd International Academic Exchange Conference on Science and Technology Innovation (IAECST), Guangzhou, China, 10–12 December 2021; pp. 1465–1470. [Google Scholar] [CrossRef]
- Zheng, Y.; Li, Y.; Cheng, J.; Li, C.; Hu, S. Two-Stage Hierarchical 4D Low-Risk Trajectory Planning for Urban Air Logistics. Drones 2025, 9, 267. [Google Scholar] [CrossRef]
- Zhou, H.; Su, Q.; Fu, W.; Xu, C.; Zheng, M.; Yang, J. A Summary of the Development of Cooperative and Intelligent Technology for Multi-UAV Systems. In Proceedings of the 2019 IEEE International Conference on Unmanned Systems and Artificial Intelligence (ICUSAI), Xi’an, China, 22–24 November 2019; pp. 80–84. [Google Scholar] [CrossRef]
- Arulkumaran, K.; Deisenroth, M.P.; Brundage, M.; Bharath, A.A. Deep Reinforcement Learning: A Brief Survey. IEEE Signal Process. Mag. 2017, 34, 26–38. [Google Scholar] [CrossRef]
- Guo, J.; Li, S.; Wu, G.; Li, A.; Guo, Y. Multi-UAV Cooperative Multi-objective Task Allocation Based on Deep Reinforcement Learning. In Proceedings of the Advances in Guidance, Navigation and Control, Changsha, China, 9–11 August 2024; Yan, L., Duan, H., Deng, Y., Eds.; Springer: Singapore, 2025; pp. 341–352. [Google Scholar]
- Peng, P.; Gong, X.; Zheng, Y. Multi-UAVs task allocation method based on MPSO-SA-DQN. Meas. Control 2025, 58, 963–978. [Google Scholar] [CrossRef]
- Zhang, B.; Yang, K. Multi-UAV Searching Trajectory Optimization Algorithm based on Deep Reinforcement Learning. In Proceedings of the 2023 IEEE 23rd International Conference on Communication Technology (ICCT), Wuxi, China, 20–22 October 2023; pp. 640–644. [Google Scholar] [CrossRef]
- Han, L.; Zhang, H.; An, N. A Continuous Space Path Planning Method for Unmanned Aerial Vehicle Based on Particle Swarm Optimization-Enhanced Deep Q-Network. Drones 2025, 9, 122. [Google Scholar] [CrossRef]
- Verma, S.; Pant, M.; Snasel, V. A Comprehensive Review on NSGA-II for Multi-Objective Combinatorial Optimization Problems. IEEE Access 2021, 9, 57757–57791. [Google Scholar] [CrossRef]
- Cong, R.; Qi, J.; Wu, C.; Wang, M.; Guo, J. Multi-UAVs Cooperative Detection Based on Improved NSGA-II Algorithm. In Proceedings of the 2020 39th Chinese Control Conference (CCC), Shenyang, China , 27–29 July 2020; pp. 1524–1529. [Google Scholar] [CrossRef]
- Chen, X.; Xu, R.; Zhao, J. Multi-Objective Route Planning for UAV. In Proceedings of the 2017 4th International Conference on Information Science and Control Engineering (ICISCE), Changsha, China, 21–23 July 2017; pp. 1023–1027. [Google Scholar] [CrossRef]
- Wang, J.; He, C.; Ouyang, H. Multi-UAVs delivery task decision based on Quint-Domain Interactive Multi-Objective Evolutionary Algorithm. In Proceedings of the 2024 7th International Symposium on Autonomous Systems (ISAS), Chongqing, China, 7–9 May 2024; pp. 1–6. [Google Scholar] [CrossRef]
- Huang, Z.; Jiang, H.; Wu, J.; Liu, D.; Dong, C.; Ping, X. Multi-UAV Cooperative Path Planning via Improved Grey Wolf Optimization Algorithm. In Proceedings of the 2024 IEEE International Conference on Unmanned Systems (ICUS), Nanjing, China, 18–20 October 2024; pp. 890–895. [Google Scholar] [CrossRef]
- Huang, G.; Hu, M.; Yang, X.; Wang, Y.; Lin, P. A Two-Stage Co-Evolution Multi-Objective Evolutionary Algorithm for UAV Trajectory Planning. Appl. Sci. 2024, 14, 6516. [Google Scholar] [CrossRef]
- Liu, S.; Luo, R.; Wen, L.; Zhen, Z.; He, J.; Li, Y. Heterogeneous Multi-UAV Task Allocation Based on Improved Multi-Objective Grey Wolf Optimization Algorithm. In Proceedings of the 2024 IEEE International Conference on Unmanned Systems (ICUS), Nanjing, China, 18–20 October 2024; pp. 701–706. [Google Scholar] [CrossRef]
- Zhu, P.; Jiang, S.; Zhang, J.; Xu, Z.; Sun, Z.; Shao, Q. Multi-Target Firefighting Task Planning Strategy for Multiple UAVs Under Dynamic Forest Fire Environment. Fire 2025, 8, 61. [Google Scholar] [CrossRef]
- Yan, M.; Yuan, H.; Xu, J.; Yu, Y.; Jin, L. Task allocation and route planning of multiple UAVs in a marine environment based on an improved particle swarm optimization algorithm. EURASIP J. Adv. Signal Process. 2021, 2021, 94. [Google Scholar] [CrossRef]
- Gao, Y.; Zhang, Y.; Zhu, S.; Sun, Y. Multi-UAV Task Allocation Based on Improved Algorithm of Multi-objective Particle Swarm Optimization. In Proceedings of the 2018 International Conference on Cyber-Enabled Distributed Computing and Knowledge Discovery (CyberC), Zhengzhou, China, 18–20 October 2018; pp. 443–4437. [Google Scholar] [CrossRef]
- Zheng, X.; Qin, A.K.; Gong, M.; Zhou, D. Self-Regulated Evolutionary Multitask Optimization. IEEE Trans. Evol. Comput. 2020, 24, 16–28. [Google Scholar] [CrossRef]
- Wang, J.f.; Jia, G.w.; Lin, J.c.; Hou, Z.x. Cooperative task allocation for heterogeneous multi-UAV using multi-objective optimization algorithm. J. Cent. South Univ. 2020, 27, 432–448. [Google Scholar] [CrossRef]
- Singh, G.; Walia, R.; Lodhi, R.K. A Hybrid PSO-AOQPIO Approach for Efficient Wind-Affected UAV Task Allocation and Path Optimization. In Proceedings of the 2024 IEEE 16th International Conference on Computational Intelligence and Communication Networks (CICN), Indore, India, 22–23 December 2024; pp. 1–6. [Google Scholar] [CrossRef]
- Liu, S.; Zhou, W.; Qin, M.; Peng, X. Tent–PSO-Based Unmanned Aerial Vehicle Path Planning for Cooperative Relay Networks in Dynamic User Environments. Sensors 2025, 25, 2005. [Google Scholar] [CrossRef] [PubMed]
- Rosas-Carrillo, A.S.; Solís-Santomé, A.; Silva-Sánchez, C.; Camacho-Nieto, O. UAV Path Planning Using an Adaptive Strategy for the Particle Swarm Optimization Algorithm. Drones 2025, 9, 170. [Google Scholar] [CrossRef]
- Chen, Y.; Zhong, H.; Yu, J. Analysis of Regional Spatial Characteristics and Optimization of Tourism Routes Based on Point Cloud Data from Unmanned Aerial Vehicles. ISPRS Int. J. Geo-Inf. 2025, 14, 145. [Google Scholar] [CrossRef]
- Ying, Z. Research on UAV Cooperative Air Combat Route Planning Based on Multi-objective Particle Swarm Optimization. In Proceedings of the 2023 International Conference on Electronics and Devices, Computational Science (ICEDCS), Marseille, France, 22–24 September 2023; pp. 316–321. [Google Scholar] [CrossRef]
- Roberts, S.W. Control Chart Tests Based on Geometric Moving Averages. Technometrics 1959, 1, 239–250. [Google Scholar] [CrossRef]
- MOEA Testing and Analysis. In Evolutionary Algorithms for Solving Multi-Objective Problems: Second Edition; Springer: Boston, MA, USA, 2007; pp. 233–282. [CrossRef]
- Zitzler, E.; Thiele, L. Multiobjective optimization using evolutionary algorithms—A comparative case study. In Proceedings of the Parallel Problem Solving from Nature—PPSN V; Eiben, A.E., Bäck, T., Schoenauer, M., Schwefel, H.P., Eds.; Springer: Berlin/Heidelberg, Germany, 1998; pp. 292–301. [Google Scholar]
Disclaimer/Publisher’s Note: The statements, opinions and data contained in all publications are solely those of the individual author(s) and contributor(s) and not of MDPI and/or the editor(s). MDPI and/or the editor(s) disclaim responsibility for any injury to people or property resulting from any ideas, methods, instructions or products referred to in the content. |
© 2025 by the authors. Licensee MDPI, Basel, Switzerland. This article is an open access article distributed under the terms and conditions of the Creative Commons Attribution (CC BY) license (https://creativecommons.org/licenses/by/4.0/).