1. Introduction
Municipal Solid Waste (MSW) is defined as left-over food, organic and recyclable materials from households and light commercial activities in urban, peri-urban and rural environments within a municipality [
1]. This includes paper, plastics, organic material, glass, textiles and metal. According to the Global Waste Management Outlook (2024), 38% of Municipal Solid Waste (MSW) is uncontrolled, i.e., dumped in the environment or openly burned [
2]. As the human population increases exponentially, the generation of MSW has followed a similar path [
3]. According to current research, 2.1 billion tonnes of MSW was generated in 2020, and this number is expected to grow to 3.8 billion tonnes by 2050 [
2]. Of the 2.1 billion tonnes of MSW generated, 810 million tonnes was uncontrolled. Research predicts this number will double by 2050 if waste management practices remain the same [
2]. Therefore, approximately 50% of all MSW generated will be uncontrolled. This is a significant challenge for waste managers, such as municipalities, urban planners, recyclers or buy-back centres, as uncontrolled waste is caused by unknown and unpredictable waste streams. This negatively contributes to climate change, marine pollution and human health risks. Therefore, the need to identify these waste streams more effectively and identify the frequency could reduce the amount of uncontrolled waste in the environment.
In 2020, the global cost of solid waste management, including collection, recycling, energy recovery and disposal, was USD 252 billion [
2]. However, this figure did not include the indirect costs associated with uncontrolled waste. One analysis conducted by the United Nations Environment Programme [
2] estimated that this cost amounted to USD 243 billion per year. Therefore, 38% of the waste generated globally (uncontrolled waste) has an environmental cost similar to the cost of managing all waste generated globally.
This highlights three major aspects of waste management. Firstly, there is a high cost of managing waste. It requires an infrastructure-rich country, which makes it unaffordable for most municipalities in developing nations [
4]. Secondly, the cost of identifying and categorising uncontrolled waste is high due to the high manual labour cost, operational cost and the multiple stages from collection to sorting [
5]. Thirdly, once waste is categorised, determining the correct waste management strategy is a challenge, as the infrastructure in an area might be limited or unknown. Hence, there is a need to valorise the waste as soon as the waste stream is identified. Research conducted by Zhang, et al. [
4], Gutsa, et al. [
6] highlights the need to develop innovative solutions to identify, categorise and valorise waste streams for waste managers in small-scale environments at the source.
Remote-sensing technologies, such as drone technology, offer a non-intrusive, time-effective and cost-effective method for fault management and inspections of infrastructure, the tracking of criminals during security operations, and surveying and monitoring the health of crops [
7,
8,
9]. Research also shows that the use of drone technology for surveying/monitoring has grown significantly due to its low cost, easy operation and customisable approach [
7]. Drones can be flown with different flight parameters and fitted with various remote-sensing equipment, such as Light Detection and Ranging (LiDaR) and Multispectral cameras, based on the operation. In terms of surveying operations, drones allow end-users to map small localised regions in a shorter period of time, compared to conventional methods. This data can then be exported into a 3D point cloud, 3D textured map or 2D orthomosaic, which can be analysed in terms of the objectives of the operation. The operations’ simplicity ensures investigators’ safety during fieldwork and allows end-users flexibility to revisit and analyse the data further [
10]. With these drone benefits being used in other fields of research, it shows the potential impact that they could have in disrupting the waste management research field. In terms of waste management, current research shows the use of drones in tracking wastewater treatment and waste quality and providing a continuous feed of information on landfills through the generation of 3D/2D images for point cloud, textured maps or orthomosaics [
7,
11]. This research highlights the ability of drones to effectively identify and analyse waste stream data to make data-driven decisions about an operation/environment, specifically in waste management applications.
Recent technological developments in Artificial Intelligence (AI) for object detection have shown significant results when capturing and analysing imagery data for various applications [
1,
10,
12,
13]. Deep learning techniques, a branch of Artificial Intelligence, incorporate interconnected neural networks. These tools can produce hierarchies of characteristics, usually trained with a supervised learning method. These techniques are developed from Convolution Neural Network (CNN) models, using hidden layers, subsampling layers and fully connected layers [
14]. Regarding Artificial Intelligence for object detection and categorisation, deep learning techniques built with a single-/multi-stage approach have become popular research areas in recent years as they are powerful visual tools. In recent years, research has demonstrated the benefits of this technology in capturing and analysing imagery data, as it has significant learning capabilities and decision-making applications in various industries [
12]. Since waste can be a complex visual object to identify and detect, as it can be contaminated and appear in heterogeneous areas, the use of deep learning techniques could assist in the identification and categorisation of waste.
Traditional imagery data relies on using Red, Green and Blue (RGB) imagery to analyse real-world scenarios. When RGB imagery systems are applied to real-world scenes, they face challenges related to image noise, background clutter, low-resolution and light variability [
15]. However, the use of thermal imagery has a strong anti-interference ability, which helps distinguish objects in imagery data that face those challenges. The challenge with thermal imagery is that it has a low resolution and signal-to-noise ratio, which makes it difficult for thermal imagery to detect features and objects. Therefore, an innovative solution has been proposed to fuse the RGB imagery with more spectrums of light, such as thermal and Infrared imagery. This technique is known as Multispectral imagery. Multispectral imagery used in object detection can improve the perceptibility, reliability and robustness of the object detection by fusing images in different modalities to achieve complementary features. This allows images to store more data per pixel and provides more precision in identifying and categorising objects. These benefits have been seen in research in other fields, such as cancer detection, crop health analysis and military applications [
16]. Since waste can be a complex visual object to identify and detect, as it can be contaminated and appear in heterogeneous areas, the use of Multispectral imagery could assist in the identification and categorisation of waste.
With the advancements in the three technologies highlighted above, these could all be integrated and contribute to the field of research in waste management. Therefore, the aim of this study is to identify the state of research on AI-powered drone technology in identifying and categorising waste. These solutions include integrating advanced imagery sensors with Artificial Intelligence and deep learning networks. Due to the success of this research in other fields of study, they are promising tools to be used in solving waste management challenges.
The aims of the systematic literature review and meta-analysis are to
Understand the state of research in waste identification and categorisation using a drone imagery system for waste management.
Identify key challenges, trends and emerging research in waste identification and categorisation using a drone imagery system for waste management.
Determine future research through the design and development of an AI-powered drone imagery system using industry-recognised performance metrics for waste identification and categorisation.
The review will guide the research to the design and development of an AI-powered drone imagery system to identify, categorise and valorise waste in waste streams. The impact of the research is to transform waste management practices globally by providing a scalable and technologically advanced solution. This solution would assist waste managers in identifying waste streams in densely populated areas or rural/peri-urban areas. Once identified, the waste will be categorised, and the best waste management strategy based on available infrastructure will be determined. This would include a valorisation process by integrating the waste data in a waste determination strategy model, such as the WROSE model (South Africa), WARM (USA and North America), EASETECH or GAINS (Europe).
The goal is to reduce the total waste management cost of MSW by reducing operational and impact costs while increasing recycling gain. This is important as the research conducted by Polasi [
17] highlights the financial constraints of effective waste management in developing countries, such as South Africa. This, coupled with a lack of capacity and limited availability of waste infrastructure, impairs the ability of the waste managers to implement sound and sustainable waste management. It also leads to the activation of the circular economy [
18].
In order to effectively perform that review, one needs to examine, evaluate and discuss the four main sections of this project. This includes (1) Waste Management (WM), (2) drone technology in WM, (3) deep learning techniques in WM and (4) imagery technology in WM. This will be explored in the subsequent section of this journal article.
2. Literature Review
This section explores the main features of waste management in relation to the use of AI-powered drones, imagery technology and deep learning techniques. These technological advancements are promising remote-sensing tools for improved waste identification, classification, and valorisation for global waste management systems.
2.1. Waste Management
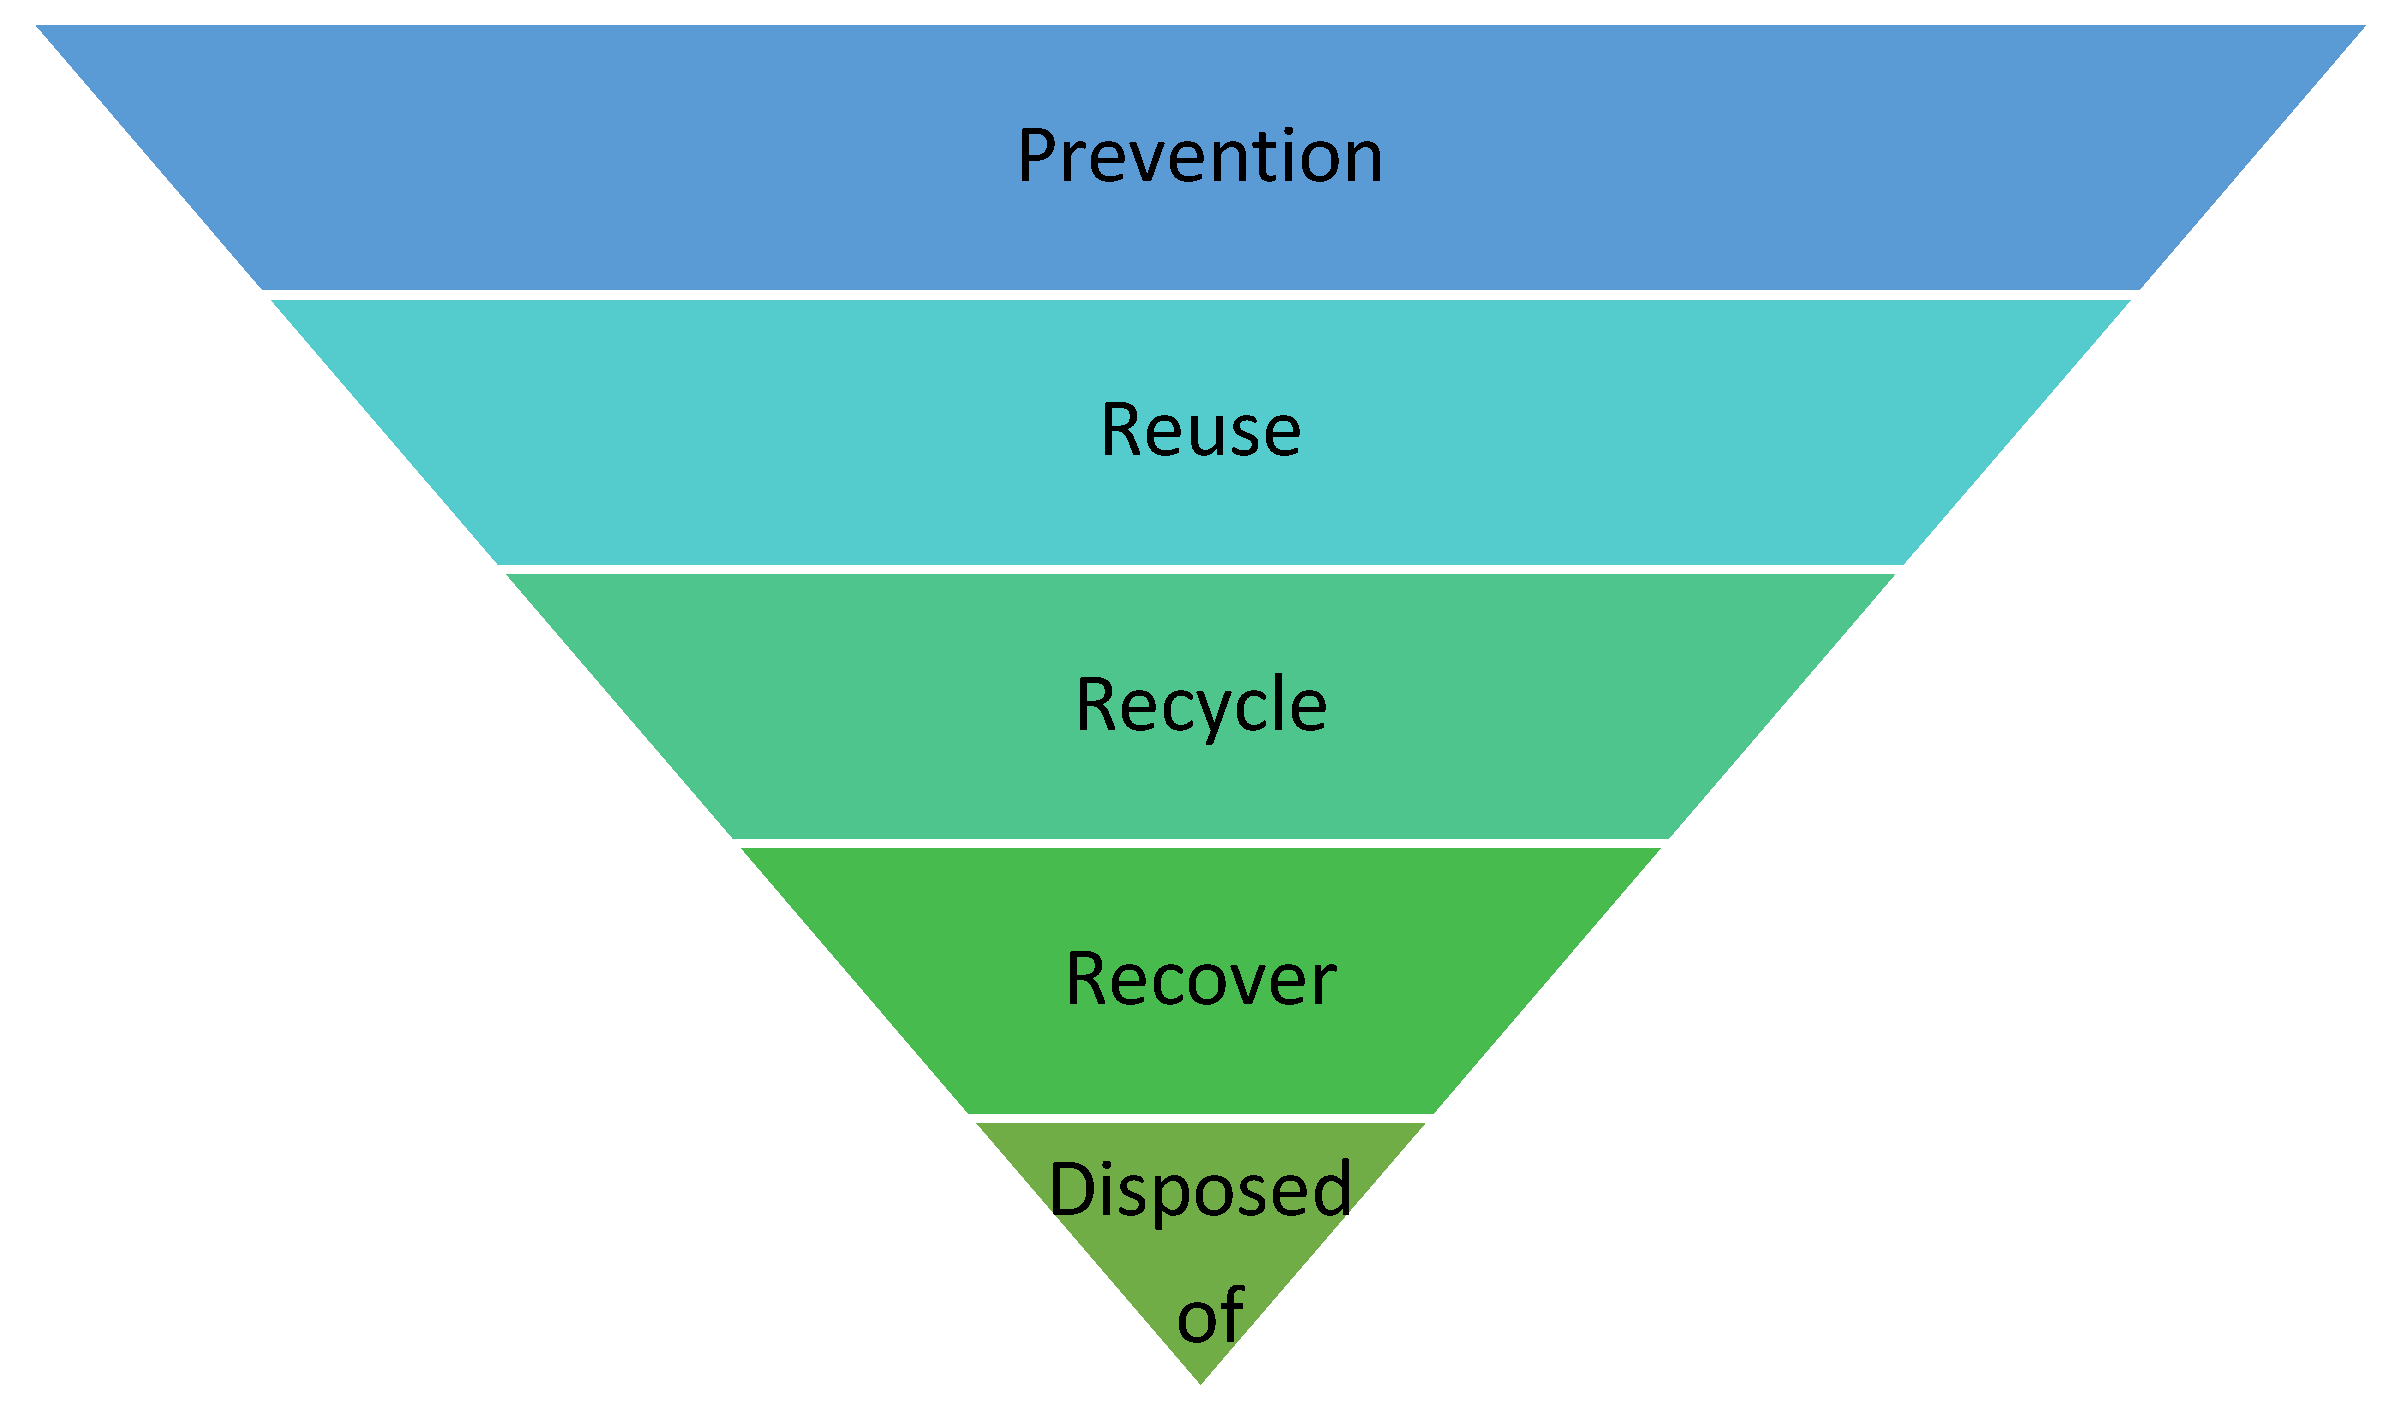
Waste management is the process of handling waste throughout its life cycle. Sustainable waste management is based on the hierarchy approach (see
Figure 1 below) that prioritises strategies and actions aimed at waste avoidance, minimisation, reduction from final disposal into landfill, recycling and recovery. If waste cannot be prevented, it should then either be (1) reused, (2) recycled, (3) recovered or (4) disposed of. While waste disposal is part of the waste management hierarchy, it should be seen as a last resort. This research will focus on the recovered category of waste management.
The level of waste around the world has become a crucial environmental threat. This is evident as waste appears in our water, marine life, urban/rural areas and air systems [
12]. This is caused by the lack of or limited waste infrastructure to deal with waste or the lack of waste stream identification. Waste managers in developing countries lack the infrastructure or capacity to deal with the waste as they experience exponentially increasing urbanisation. In contrast, waste managers in developed countries have densely populated areas, which pose a challenge for managing waste. According to research, 2.1 billion tonnes of MSW are generated globally, with 810 million tonnes uncontrolled and 1.2 billion tonnes controlled [
2].
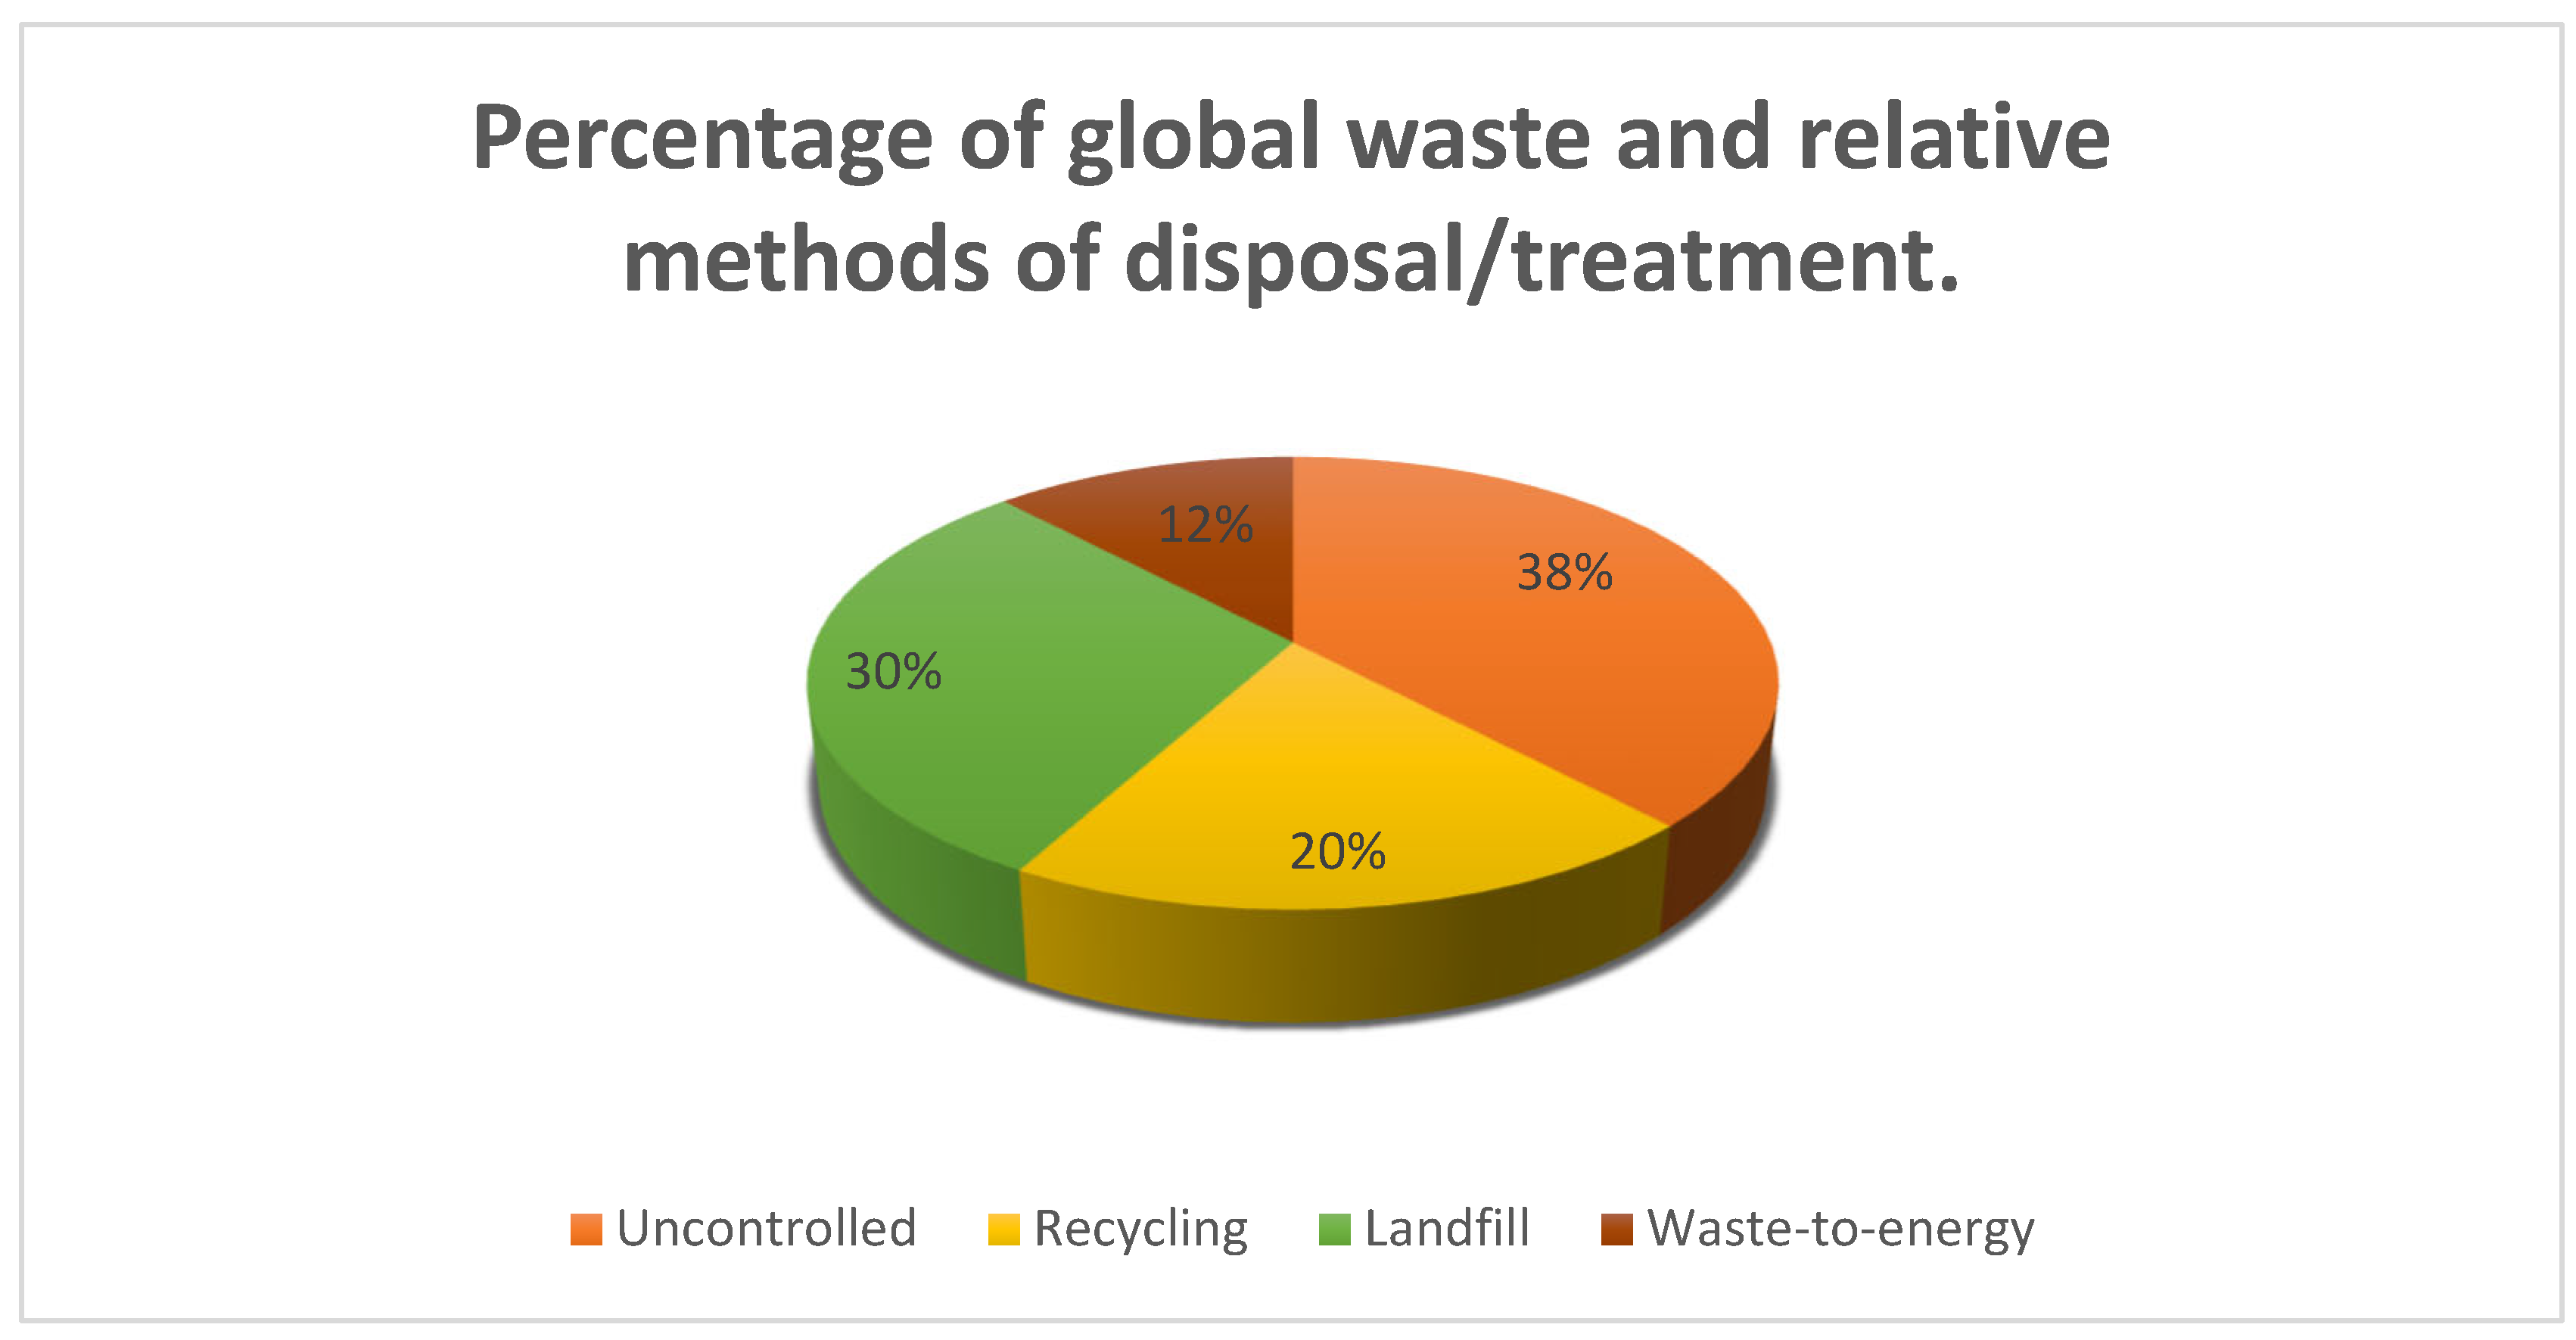
Figure 2 below shows the percentage of global waste and the relative methods of disposal/treatment.
This highlights the major issue of waste management, specifically MSW, as only 20% of waste is recycled, and more than half is either dumped in a landfill or uncontrolled. In developing nations, such as Central America, Sub-Saharan Africa and Central and South Asia, more than half of the MSW generated in 2020 was uncontrolled [
2]. One of the biggest contributors to uncontrolled waste is illegal dumping. Waste managers, such as the municipality, are responsible for cleaning it up, but this comes at a significant cost. Research conducted by Abel [
20] showed that the cleansing of illegal dumping costs up to 30 times more than normal waste management disposal methods. This additional cost is made up of sourcing an additional team of humans and vehicles to identify, collect, sort, valorise and transport the waste. The waste might need further sorting at a waste recovery facility due to the limited capacity of humans to categorise the waste at the source before it is sent for recycling, incineration or landfilling. This shows that the waste management process, especially when dealing with uncontrolled MSW, is costly and labour-intensive. Innovative solutions to this problem are required to improve the operational feasibility of waste management and reduce its environmental impact.
The Global Waste Management Outlook report outlines various recommendations on how to combat the significantly negative impact of MSW [
2]. One of the main recommendations highlights that municipalities should adopt more inclusive and innovative approaches to make waste management affordable.
An MSW research study suggests that low recycling/recovery rates are due to high inefficiencies, a lack of know-how, overreliance on manual labour and a high-cost recycling process [
21]. Recycling is a crucial part of waste management as it can generate money. Therefore, if recyclers could tackle the recycling of waste more effectively and efficiently, it could reduce the substantial cost of other waste management operations. Researchers suggest that waste identification, categorisation and valorisation at the source could increase recovery rates and material quality [
22]. Research conducted by Alaghemandi [
23] shows that mechanical innovations like advanced identification and categorisation techniques for waste that are integrated with advanced imagery and machine learning create effective and economically viable solutions. This research shows that in a controlled environment, these technological tools can be used to improve the waste management process.
Current drone technology research is used to survey land areas that can identify uncontrolled MSW waste hotspots, like illegal dumping sites [
6]. With the integration of advanced imagery and machine learning algorithms built into drone technology, research suggests that this system can also identify waste streams and categorise the waste [
24]. The following subchapter will focus on drone technology in waste management, waste identification and categorisation research.
2.2. Drone Technology in Waste Management
Research using drone technology in waste management has increased in recent years. This is due to technological advancements that have been made in terms of flight time, application, flexibility and low cost [
10]. These advances have made the use of drone technology a more adaptable, data-driven and robust system. Drone technology is being researched and deployed in various industries, such as energy management, security surveillance, crop management, military operations and land surveys [
6,
7,
8,
9,
10,
24]. These industries have experienced the significant benefits that this technology has provided.
Currently, waste managers can use drones to track waste streams in rivers and monitor waste compaction at landfills by conducting 3D/4D photogrammetry [
25,
26]. The drones supply a continuous feed of waste quantity and volumetric data on landfills and generate waste analysis. Therefore, if drone technology were integrated with Artificial Intelligence and image technology, it could produce 2D/3D photogrammetry data of waste through waste stream identification, localisation and waste categorisation. Waste collectors, such as buy-back centres and recyclers, could valorise the waste by integrating that waste data into a waste determination strategy model, such as the WROSE model (South Africa), WARM (USA and North America), EASETECH or GAINS (Europe).
This is all possible since drones can capture Multispectral aerial imagery to analyse/classify waste streams and waste. This data-capturing process can be performed more efficiently than through field work using manual labour. Therefore, it can lower costs, and the operation can be conducted in a shorter period of time. One drone operator and one drone system, compared to multiple waste operators, can conduct waste accumulation analysis more quickly and efficiently while ensuring the health and safety of the operators. Therefore, remote-sensing drone technology can streamline the process of waste management by reducing the cost of human resources, increasing efficiency and productivity. Therefore, one needs to identify and analyse the research associated with drone technology and waste management, specifically those that are integrated with artificial intelligence and image technology.
Research was conducted in waste identification and categorisation by Zhou, et al. [
27], who developed a drone system that utilised deep learning techniques and image technology, such as anchor object detector and SWDet (solid waste detection). It captured and analysed 998 long-distance aerial images of waste. The drone system that was proposed in this study outperformed four other object detection methods based on You-Only-Look-Once (YOLO) architectures. A custom-built waste dataset by the researcher, known as SWAD, was used for training and validation. The proposed drone system achieved a 75.05% F1 score and 77.58% mean average precision (mAP) score. This dataset was also run on YOLOv5n and YOLOv5m, and the SWDet was outperformed by 2–5% on the same metrics.
Research was conducted by Mehadjbia and Slaoui-Hasnaoui [
12] for developing an intelligent drone waste detection system to detect two different classes of waste. The object detection task included landfills, using high-altitude imagery, and on-ground waste, using low-altitude imagery. They collected imagery data from two sets of data: (1) 988 images of landfills from the SWAD dataset and (2) 772 images of ground waste from the VAVVaste dataset. These datasets were used to train the waste detection system based on a modified You-Only-Look-Once (YOLOv8n) architecture. The intelligent drone waste detection system was tested with sample images and compared against previous studies, which used YOLOv5, YOLOv4 and YOLOv3 architectures in the same drone system. The results showed an overall improvement of (1) 3% in precision, (2) 18% in mAP@50 and (3) 2% in recall. These results showed a significant improvement in the system’s performance metrics.
Research was conducted by Samsudeen, et al. [
10] for the development of an intelligent drone surveillance and waste detection system, which included monitoring, geolocation and mapping, notifications and alert system, waste data integration and analysis. They used online data sources to collect low-altitude images for their datasets to train and validate the model. The model was a modified YOLOv8 architecture with a CSPDarkNet53 backbone and a PANET neck. The results were compared against previous studies, which used Ensemble 1-YOLOv5n,s,m and Ensemble 2-YOLOv5s,m,I architectures in the same drone system. The results showed an average overall improvement of (1) 9% in precision, (2) 5% in accuracy and (3) 4% in recall. The researchers highlighted the importance of a large dataset to improve the system’s performance. The challenge that the study faced was the detection of mesoplastics.
Liu [
28] developed a real-time classification and detection of domestic waste streams using drone imagery on a modified YOLOv5 and embedded system. The modified YOLOv5 network had three improvements: (1) structural architecture, (2) DBCAM feature fusion and (3) DBDCM classification and a bounding box module. The results were compared against previous studies that used YOLOv3 and YOLOv4 architectures in the same system. The results showed the performance of the model with an average confidence of the detection frame reaching 0.75, a mean average precision of 0.93 and a detection time of 0.21. Regarding efficiency, the G-YOLOv5s achieved the lowest LT (loading time) and the second lowest ART (average time). The model loading time for G-YOLOv5s was just 2.01 s; the ART was only 0.21 s. Therefore, the proposed G-YOLOv5s outperforms other models in terms of accuracy and efficiency, making it a more practical and effective solution for waste classification. The researchers concluded that it was robust and suitable for practical application in garbage classification scenarios.
The research above highlights the use of drone technology capturing aerial imagery data and integrating machine learning techniques to identify, categorise and localise the waste in an area. This is known as waste analysis. Waste analysis using aerial imagery is more complex since MSW can vary in shape, size and colour. The introduction of machine learning, specifically deep learning, in waste analysis has the potential to make waste analysis more efficient in terms of time and cost. This will be explored in the following subchapter.
2.3. Deep Learning Techniques
Artificial Intelligence (AI) has become a fundamental tool that is transforming many industries in the world. It can replicate human intelligence, analyse patterns in data, and enhance the decision-making process supported by large amounts of data. Research conducted by Hafeez, et al. [
29] shows the effectiveness of mapping and monitoring marine nuclear pollution. It highlighted the recent developments in remote-sensing technologies and how remote sensing can be used as an effective tool. Machine learning, a subset of Artificial Intelligence, is the foundational building block for machines to learn and make decisions through processing large amounts of data. Deep learning, which is a subset of machine learning, uses multilayered neural networks to replicate the complex decision-making power of the human brain [
30]. It can be used for both supervised and unsupervised learning. Each deep learning technique differs by its architecture. This can include having many layers, such as convolutional layers, pooling layers, and fully connected layers, leading to a higher complexity level [
31]. The number of layers and type of neural network used in deep learning are chosen, and the training process is used to optimise it for a specific application.
Currently, there are several popular types of machine learning architectures that have been used for imagery analysis: (1) a Support Vector Machine (SVM) and (2) a Random Forest. SVMs are a type of supervised deep neural network primarily used for classification and regression tasks. A probability method is used to determine an object’s classification, which looks for the best decision boundary between classes. SVMs do this by relying on preprocessed data and relevant features that have been manually extracted. When analysing complex data, such as images, SVMs use a technique called Histogram of Oriented Gradients (HOG). Random Forest is a machine learning algorithm that is also used for classification and regression tasks using decision trees. It is a hierarchical model, where each tree is trained on random subsets of data to learn features. The output of the Random Forest algorithm is a prediction.
A popular type of deep learning architecture that has been used for imagery analysis is a Convolutional Neural Network (CNN). CNNs are a type of deep neural network primarily used for image processing and pattern recognition. They are composed of multiple layers, such as convolution layers, pooling layers and fully connected layers. These neural networks learn spatial hierarchies of features by applying convolution layers on an input image. Each layer extracts more complex features, starting from edges and developing into shapes, textures and objects.
In terms of CNN architectures, research shows the following two common types of identification and classification algorithms used: (1) a single-stage detector, such as You Only Look Once (YOLO), and (2) a dual-stage detector, such as Region-based Convolution Neural Networks (R-CNN). YOLO detectors take an input image and divide the image into grids. They run each grid cell in one pass through the network to predict the boundary boxes and probability of features/objects in the image. The YOLO architecture combines the identification and classification tasks of the object into one operation, which makes it ideal for real-time applications. ‘Real-time’ refers to the capability of waste identification and the categorisation system to process image data of waste streams within milliseconds. The R-CNN uses a similar approach but separates it into two steps: region proposal identification and classification. An input image is divided into regions, where features are extracted from each region using a CNN. The identified regions of interest (ROIs) of the features will be classified as a specific object, and a bounding box will be placed around them.
According to Arbeláez-Estrada, et al. [
21], a systematic literature review (SLR) was conducted to identify the physical enablers, datasets and machine learning algorithms for waste identification and categorisation. This included identifying effective machine learning algorithms used for identifying waste, as well as their model architecture and feature extractor. The most common architectures are custom-built for their application. This would include a foundation structure from the deep learning architectures mentioned above, with customised feature extractors or structures. The second most common architecture type is YOLO. The research showed that YOLOs have achieved high success in image recognition tasks, surpassing other machine learning techniques based on several benchmarks. This is due to YOLO’s ability to learn spatial features and patterns in images using layers of hierarchical architecture. It can perform convolution operations and extract features at different levels of abstraction [
32].
According to Rashida, et al. [
1], the study focused on three deep learning architectures for waste classification: (1) a CNN, (2) a Random Forest and (3) an SVM. The research showed that the CNN architecture outperforms the others, with a mean accuracy of 90%. The study highlighted the significant developments made to CNN architectures, with a large focus on the Faster R-CNN architecture. This architecture differs from RCNN as the Region Proposal Network (RPN) and classification operation are combined. Faster R-CNN was used to develop the waste classification system, with the hyperparameters being (1) a learning rate of −0.0002, (2) an epoch of 50 and (3) a loss convergence of <0.5. The results of the system showed (1) a precision of 95.82%, (2) a recall of 90.1%, (3) an average time of detection of 0.119 s and (4) an overall accuracy of 91.2%. The challenges faced by the research were that the transparency of glass and plastics would lead to the model mistakenly classifying them as belonging to the same class. This was evident in the confusion matrix diagram generated from the results. The researchers recommended that a more robust training set be developed with various backgrounds, and field images should contain more background objects.
According to Tiwari and Dubey [
13], the research focused on developing an image system and deep learning algorithm to improve the detection of MSW for waste management Strategy determination. This study aimed to determine the most suitable deep learning architecture for the data analysis of the waste. The research highlights that while the Faster-RCNN architecture can significantly increase the inference speed on the whole task, the Faster-RCNN model does not provide satisfactory results in real-time applications. Since the research aimed to use this system in a real-time environment, the YOLO architecture was chosen. The dataset for the training and validation of the model consisted of 17,700 images, which included data from the Trash Annotation in Context (TACO) dataset and random Google images of trash items. The results show that the model achieves a mAP score of 78% when testing on all classes across different Intersection of Union (IoU) scores. This is compared to a Faster-RCNN model with the same dataset. An improvement of 17% in the mAP score was achieved.
Research from Rehman and Deriche [
16] developed an advanced deep learning system to improve the segregation of plastic waste. The deep learning architecture aimed to identify and classify plastic waste material using a custom-built deep learning architecture known as Detectron2. Detectron2 had a YOLO foundation, which included Feature Pyramid Networks (FPNs), Region Proposal Networks (RPNs), Region of Interest (RoI) Align/Pooling, Anchor-based Object Detection, Mask R-CNN, and Non-Maximum Suppression (NMS) algorithms. This approach was tested against YOLOv5, YOLOv7 and YOLOv8 algorithms. The experimental results showed a mean average precision (mAP) of 89.54%, which outperformed traditional YOLO models. The researchers noted that the algorithm exhibited exceptional performance, with an mAP50 score of 0.995. Furthermore, the algorithm was a robust object detection for both segmentation and classification in addressing plastic waste management challenges.
One commonality with all deep learning architectures is that they require a dataset from which to learn and validate. Datasets are described as a collection of specific data. According to Arbeláez-Estrada, et al. [
21], image-based technologies are the most common type of sensor used for waste classification. Therefore, imagery data is the data type for this research. This will be explored in the next part of this chapter.
2.4. Image Technology
Deep learning can use imagery data to identify and categorise objects. This operation can be achieved through the training and testing datasets, which are large amounts of image data focused on a specific topic. Image data can be captured in three forms: (1) Red–Green–Blue (RGB) data, (2) Multispectral data and (3) Hyperspectral data. RGB data consists of composite layers of the Red, Green and Blue light spectrum. Traditionally, object detection has been conducted using RGB imagery, but recent advancements in computational power and large data architectures have changed that.
The use of multiple spectrums of light leads to Multispectral or Hyperspectral image data for more efficient identification and categorisation [
21]. According to the literature, Multispectral or Hyperspectral imaging can be used to extract features of objects that cannot be processed using visible light imaging. In terms of Hyperspectral, it is a technique that contains several large dimensions of data with hundreds of light spectra. It analyses an array of light spectrums within the light striking each pixel. When combined with RGB imagery, through a process known as pixel fusion, it can provide richer information about the objects in the image. Researchers conducted a study to classify the quality and size of bananas using an RGB and Hyperspectral imagery system [
33]. The results of the research showed that a multi-input model, which was a combination of RGB and HIS data, resulted in an average improvement of 28% for precision, 33% for recall, 32% for F1 score and 14% for accuracy. However, it was noted that processing Hyperspectral data requires large amounts of computational resources, which can prove uneconomical and inefficient.
Multispectral image data focuses on a collection of image layers, each with its particular wavelength band. This expands from the traditional RGB image data of three layers but does not cover the wide spectrum of wavelength bands of HSI. This can include (1) Red band (R), (2) Green band (G), (3) Blue band (B), (4) Red-edge band (RE) and (5) Near-Infrared band (NIR). Research conducted by Iordache, et al. [
34] focused on using drone technology equipped with Multispectral cameras for the identification and classification of land and water waste. Multispectral image data was captured for nine classes. This included plastic, wood, oxidised metal, cement, painted surfaces, water, trees, soil and grass. This data analysed the heterogeneity, in terms of both spectral shape and spectral amplitude, of the distinct classes. The different colours of the spectral signatures correspond to the colour coding of each material. The results showed that the classification accuracy of plastic litter achieves a 0.88 score from both test and validation data. The distinction between different materials and plastic litter during the classification process was also high. While the Multispectral data can cause confusion between classes, it is important that it is combined with the RGB data. This research highlighted that identification and classification tasks should be designed separately for land and water waste, as operation metrics are different. The benefit of Multispectral data is that it is less computationally expensive than HIS data and can provide significant improvements in the classification process.
The research conducted in Refs. [
33,
34,
35,
36] concluded that combining Multispectral or Hyperspectral imagery with RGB imagery to analyse multiple spectrums of light for an object produces more accurate identification and categorisations. However, as more data is gathered, it becomes more important to integrate diverse data sources and perform in-depth analysis to extract meaningful insights and drive informed decision-making. This can be enhanced by integrating Artificial Intelligence. A trade-off exists where one needs to balance the amount of data collected with the computational resources required to process and analyse it.
3. Methodology
The aim of this study is to review the state of research in drone technology for waste management applications. There is a growing trend to develop innovative, efficient and environmentally sustainable solutions in this field of research. These solutions integrate advanced technologies, such as Artificial Intelligence (AI), image technology and deep learning algorithms, for waste stream/waste identification and categorisation. These advancements have emerged as promising tools to enhance waste management processes, as indicated in the literature review above.
Therefore, a systematic literature review and meta-analysis were conducted, which involved a thorough search of the most relevant drone technology, integrated with image technology and deep learning architecture, for waste stream/waste identification and categorisation. The studies discovered during this review were used to synthesise, analyse, and draw conclusions about the state of the research, particularly for waste management. This study reviewed both qualitative and quantitative studies. It included a quantitative content analysis, which is a valid technique for studying scientific documents [
37], as well as a qualitative synthesis analysis.
The objectives were elaborated on in the introduction section of this article. To ensure that the study was conducted effectively, we employed a PRISMA flow diagram [
38,
39]. The PRISMA flow diagram summarises our study selection process. Initially, we identified relevant studies from predefined academic databases using specified search eligibility criteria. The study underwent a two-stage screening process: (1) stage one involved reviewing titles and abstracts to exclude irrelevant articles based on defined eligibility criteria, and (2) stage two consisted of full-text screening to ensure that selected articles fully aligned with the research objectives and provided the quantitative/qualitative data. The flow diagram illustrates the number of articles included and excluded at each step, concluding with the final number of studies selected for detailed synthesis analysis in our systematic review and meta-analysis. This will be further explained in this section of the paper. The goal of this research was to guide the design and development of a waste identification, categorisation and valorisation system using AI-powered drone technology with image-sensing and deep learning techniques in waste management.
3.1. Eligibility Criteria
The study intended to understand the state of research in drone technology, integrated with image technology and deep learning architecture, for waste stream/waste identification and categorisation. Based on the research, the study will be able to understand the efficiency of different drone technologies, image technologies, deep learning techniques, and the performance of these integrated systems. It will guide the design and development of a waste identification, categorisation and valorisation system using drone technology for waste management. Therefore, the following criteria were chosen based on
- (1)
Accredited academic research papers (conference papers or journal articles) published within the last five years (January 2019–June 2024) from organisations or publishing houses. This was to ensure that relevant academic research and information was collected from trusted and recognised sources. The pace of AI research significantly increased in 2019 due to popularity, advancements and innovation [
40].
- (2)
All English studies were considered due to the constraints of the researcher/reviewer.
- (3)
Studies that produced qualitative/quantitative data analysis and synthesis from a physical system. This allowed the researcher to analyse the raw performance data and conclude on the efficiency of the study. This was fundamental to ensure that the data synthesis could be conducted.
3.2. Information Source and Search Strategy
The databases chosen for this research were the (1) Institute of Electrical and Electronics Engineers (IEEE) Xplore and (2) Multidisciplinary Digital Publishing Institute (MDPI). These databases were selected as they extensively cover the development and application of engineering, computer science and technology research topics. The research articles found within these databases came from published, accredited journals, book chapters or conference proceedings. This meant that they were internationally recognised and blind peer-reviewed by experts in their respective fields.
To search for research articles, the database required the following parameters:
Date of search: 25 August 2024 (IEEE Xplore and MDPI)
Terms/Keywords: Drone OR Unmanned Aerial Vehicle OR UAV AND Waste Management AND Deep Learning. (OR, AND—Boolean operators)
Publication year: from January 2019 to June 2024 (as explained in
Section 3.1)
Type of publication: research articles (conference papers or journal articles) and book chapters (books).
The search strategy was peer-reviewed by an external reviewer of the study. The peer review involved proofreading and checking the search parameters, subject heading, Boolean operators, syntax, filters and spelling. This was conducted to validate the structure of the search strategy. It was noted that the external reviewer did not make use of the PRESS checklist.
Once the search strategy was completed, the researcher began with a pilot test to ensure that the inclusion and exclusion criteria were applied correctly. The researcher and the external reviewer were provided with a sample set from each database. They were required to examine the research papers’ titles, abstracts and in-text content. They were both given the same sample set to work with. Once they evaluated the sample set, any inconsistencies were discussed until a consensus was reached. In this study, no inconsistencies were identified.
3.3. Study Selection Process
The researcher was given the task of selecting the study selection process. This selection process was divided into two stages. The flow diagram in
Figure 3 below outlines both phases. It shows the questions that the researcher asked themselves when conducting each phase. These questions build on each other to ensure that each stage achieves its objective.
Stage 1 involved the researcher independently screening and reviewing the research papers’ titles and abstracts. If the researcher was unsure, he referred it to the external reviewer for comment. The comments were reviewed by the researcher, and they were discussed until an agreement was reached. This applied to all situations when the external reviewer was involved. At the end of the process, the remaining papers were disregarded. Stage 2 involved the researcher independently screening and reviewing the full-text articles of the research papers. If the researcher was unsure, he referred it to the external reviewer for comment. At the end of the process, the remaining papers were disregarded.
After the screening process, all eligible academic documents were collated and prepared for data collection. The researcher and the reviewer worked in the field of mechanical engineering within a similar research area.
3.4. Data Collection Process and Data Points
The researcher developed a data extraction form. This was used to extract data from the eligible studies. This involved identifying, analysing, synthesising evidence and drawing conclusions from the academic papers. The data extraction form required the following information:
General Information (study ID and year)
Study Character (study focus)
Methodology (technology used)
Results (performance analysis of qualitative/quantitative data)
Outcome (key findings and statistical analysis)
Reviewer Information (Extracted by date and completion details)—it was ignored as one reviewer conducted the research over a period of 6 months.
Since there was only one researcher, no data was compared. The external reviewer was provided with a sample of the research articles as well as the data-extracted forms completed by the reviewer for verification and validation of the information extracted. This process was conducted within a period of two months, from 17 August 2024 to 16 October 2024. Due to the resources available, there was only one researcher and one external reviewer.
In order to synthesise results for the study, certain data outcomes were required. These outcomes needed to be compatible with each outcome domain in each study that was reviewed. Therefore, the four data outcomes that were chosen were
Since the mean average precision metric depended on Intersection of Union (IOU) thresholds, each study’s precision metric and IOU threshold were noted. The findings were reported as future research directions/possibilities if a research paper presented qualitative data. It was assumed that all quantitative studies delivered their theoretical/experimental results. If quantitative studies were conducted with no results presented, it was assumed that the results were acceptable/successful based on the studies’ conclusions.
3.5. Risk of Bias (ROB) Assessment
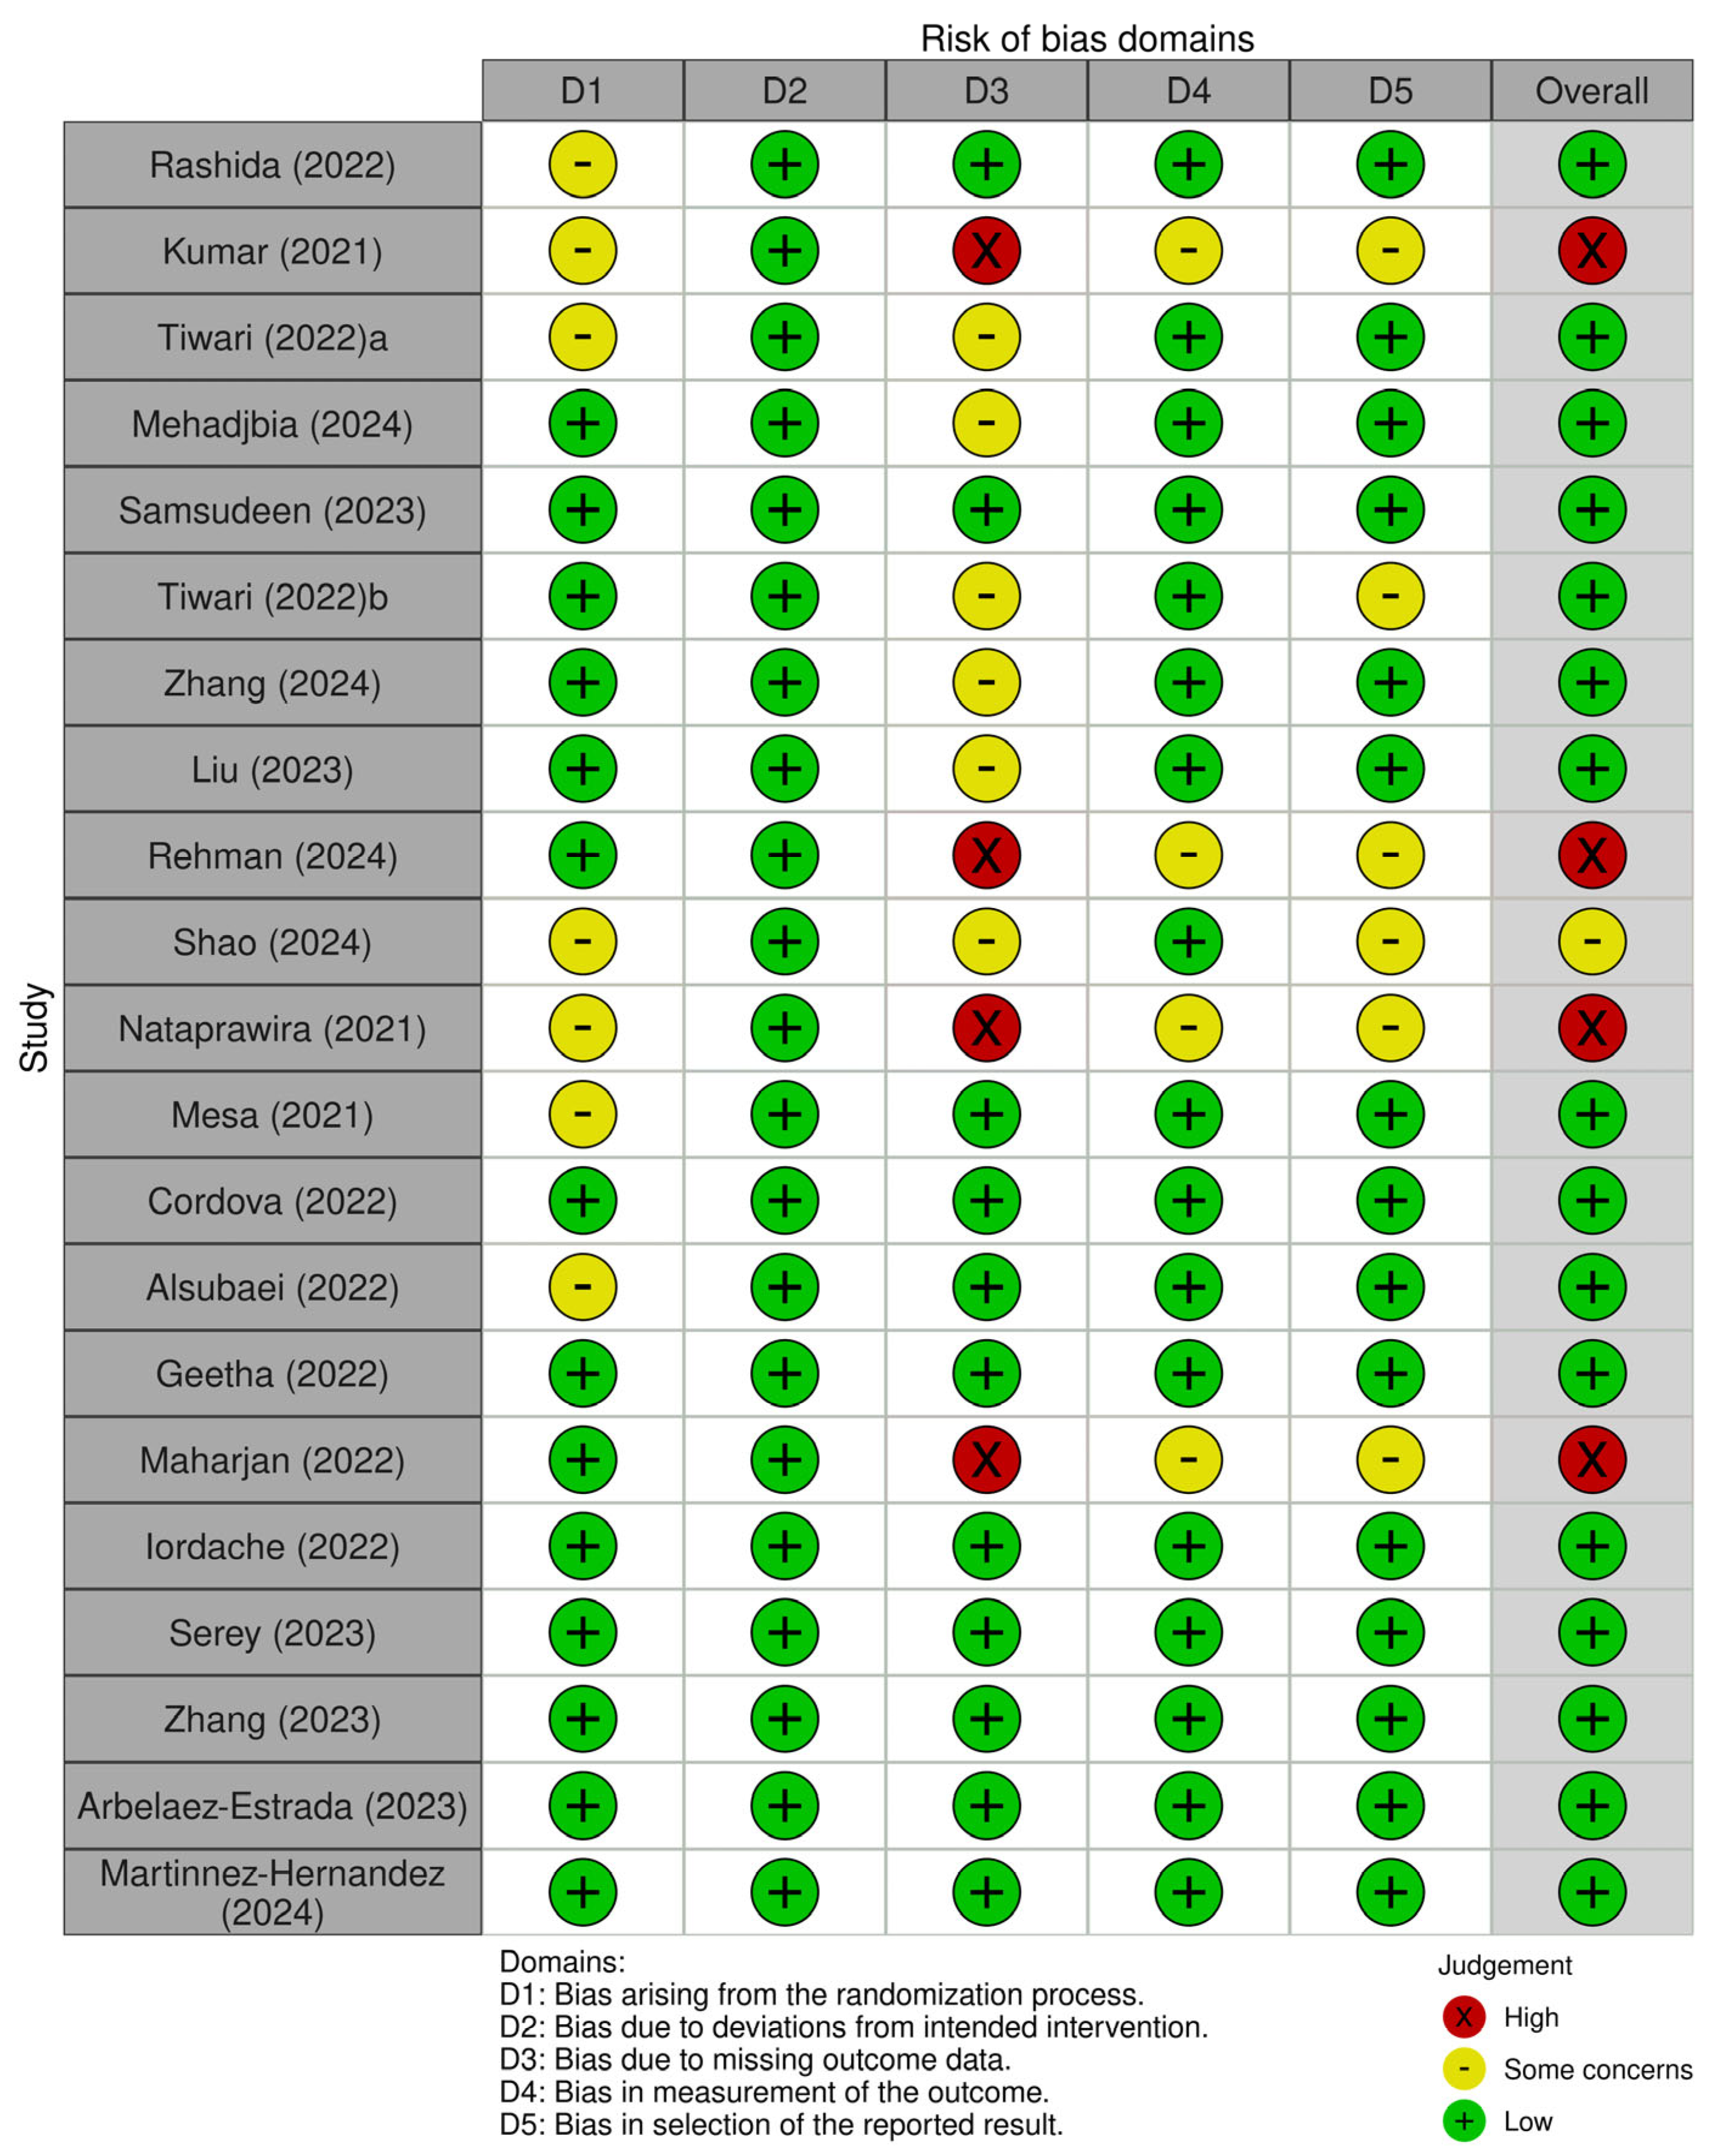
When conducting a systematic literature review and meta-analysis, a risk of bias assessment was required to ensure that the studies’ findings are both credible and reliable. Therefore, a Risk of Bias Assessment Tool for Systematic Reviews (ROBIS) was used. It focused on identifying the potential biases that could arise during the review process. This included the search strategy, study selection and data extraction. The tool was used to address five specific domains: (1) bias arising from study eligibility criteria; (2) bias due to deviations from intended interventions; (3) bias due to missing outcome data; (4) bias in the measurement of the outcome; (5) bias in the selection of the reported result.
The reviewing researcher independently applied this tool to each study. The researcher applied a “Low”, “Medium” or “High” ROB judgement with a supporting justification. The record of their assessment and justification for each ROB for each study was captured. If the researcher was unsure, he referred it to the external reviewer for comment. The researcher reviewed the comments, and they were discussed until an agreement was reached. The results of this assessment are displayed in a table and bar chart in the results section of the article. The table uses a ‘traffic light’ plot for the domain-level judgement for each individual result. It is a visual representation of the researchers’ ROB assessment of each domain for each study. The bar chart plots the distribution of risk-of-bias judgements within each bias domain for all the studies. Following the guidelines given by ROV 2.0 [
41], we used an overall summary ‘Risk of Bias’ judgement for a specific outcome. The overall outcome for each study was determined by the highest ROB level in any of the domains that were assessed. More information regarding the ROB Assessment can be found in the results section of this article.
3.6. Effect Measure
We analysed the performance of each study by the system’s effectiveness in identifying and categorising waste through image technology. The effect measures used to evaluate performance included recall, precision, accuracy and F1 score (as explained in the
Section 3.4). Recall measures the system’s ability to correctly identify all relevant waste categories continuously, while precision assesses the proportion of correctly identified waste instances among all detections. Accuracy provides an overall measure of correctly classified instances across all categories, and the F1 score, as a harmonic mean of precision and recall, balances the trade-off between these two metrics.
Since precision and recall measure complementary aspects of model performance and waste categorisation involves diverse and sometimes imbalanced classes (plastics, metals, organics, etc.), the F1 score is useful for a fair performance evaluation. Accuracy alone can mask class imbalance issues, which can lead to exaggerated performance metrics if a dominant waste type is accurately classified. Therefore, precision, recall, and F1 scores were prioritised to accurately reflect performance involving varied waste streams and classes.
By aggregating and comparing these effect measures across studies, this analysis aims to provide insights into the most effective approaches, highlight methodological strengths and weaknesses and identify potential gaps for further research in AI-powered drone-based waste classification systems.
3.7. Synthesis Method
To ensure that the effect measures were correctly analysed and synthesised, we categorised the studies into two dimensions: (1) qualitative studies and (2) quantitative studies. Since the focus was to analyse the performance of each study by the system’s effectiveness in identifying and categorising waste through image technology, a quantitative synthesis was chosen. The studies needed to have calculated a minimum of two performance metrics: (1) precision and (2) recall. This was sufficient as it would provide a method for integrating and interpreting findings from various studies to draw a comprehensive conclusion on the state of research.
The research extracted four performance metrics from all the studies. These performance metrics were the effect measures mentioned in the previous section. While all four were tabulated and recorded, importance was placed on the F1 scores of each study. This was because it could account for class imbalances due to the accuracy metric, and it was a trade-off between precision and recall. It allowed for a fair comparison across studies without leading to a bias towards datasets where accuracy alone appeared inflated. If a study did not have a calculated F1 score, a manual calculation using the study’s precision and recall was used.
To synthesise results for the study, a random-effects meta-analysis was chosen, and the results were displayed on a forest plot. This method ensured that the variability in each study was accounted for by using the weighted aggregation approach due to sample size and by calculating the confidence intervals for the reliability of the results. The forest plot was utilised to easily represent the F1 scores of each study, to summarise a study’s performance in comparison to all the studies and to indicate study heterogeneity. This was conducted by
- (1)
Extracting the F1 scores and sample size of each study
- (2)
Calculating the weighted mean F1 scores
- (3)
Plotting a Forest plot
- (4)
Conducting a Heterogeneity Analysis using I2 statistics and Q-tests.
All of this data was input into a Python (version 3.13) code to run the calculation and analysis. The heterogeneity analysis, using I2 statistics and Q-tests, was used to determine the consistency and significance of each study for the meta-analysis. The goal was to achieve a , as it suggests low/moderate heterogeneity, which shows that the study is more consistent in its findings.
For studies that only presented qualitative results, they were excluded from the synthesis analysis. Qualitative studies were unable to present results that related to the effect measure, so they could not be included in the synthesis analyses. However, their methodology and contributions are still presented and discussed in qualitative terms.
4. Results
The results section of this article will present the key findings from the literature identified through the meta-analysis and literature review (as explained in the
Section 3 above).
4.1. Results of Study Selection and Study Characteristics
During the study selection process, we identified 182 studies, which included journal articles, conference proceedings and book chapters, in the two database (IEEE and MDPI) searches. No studies were excluded due to (1) duplications, (2) ineligibility due to automation tools, or (3) any other reason. This resulted in 182 studies needing to be screened through their abstracts and titles. After screening through all abstracts and titles, 159 were excluded. The reasons for exclusion were based on
Lack of drone and image technology in waste management.
Lack of waste identification or categorisation technology.
Lack of qualitative/quantitative results in the research.
The list of reasons for exclusion also shows the order of priority given when evaluating the studies. The remaining studies were submitted for retrieval and assessed for eligibility. Five were removed through the eligibility process due to
Lack of waste identification or categorisation technology.
Lack of drone technology use in waste management.
Lack of qualitative/quantitative results in the research.
Eighteen full-text journals or conferences were prepared for synthesis. Three studies that were not part of the data search were identified through citations. They were passed through the same process as the database studies, and the three of them remained. Therefore, 21 studies were prepared for the review and synthesis. The flow diagram of the workflow is shown in
Figure 4 below.
The outcome of the above review left 21 full-text journals and conferences. These studies were reviewed, and the characteristics of each study were documented and presented in
Table 1 below. The characteristics were reported to ensure that the studies were applicable for the meta-analysis. The characteristics were
General Information (study ID and year)
Study Character (study focus)
Methodology (deep learning and Image technology used)
Results (precision, recall, accuracy, F1 score and sample size data)
The characteristics were chosen specifically as they represented the aims and objectives of the study. The methodology characteristic identified the core technology (deep learning and image technology) that was used in the research, while the results showed the most effective and ready-to-market system based on performance metrics. The performance metrics were chosen as data points based on research presented in the previous chapter.
4.2. Risk of Bias in Studies
We used the ROBIS tool, as mentioned in the methodology of this article, to assess the risk of bias for each study included in the systematic review and meta-analysis. The researcher independently applied the tool to each study and the risk of bias for each domain, as “Low”, “Medium” or “High”, with a justification. All ROB assessments are summarised in
Figure 5 and
Figure 6 below. In terms of overall risk of bias, the majority of the studies showed some concern of risk (12/21), while there were four high risks of bias. A summary is provided below regarding each individual component of the risk of bias assessment in the “Traffic Light Plot”.
In terms of the risk of bias for study eligibility criteria, the researcher noted that keywords in the research questions were extracted from the search criteria. This was aligned with the study’s objectives to ensure that an in-depth understanding and knowledge were gained on the specific topic area. Therefore, the search criteria were specific to the research conducted on the study. Restrictions on the study were implemented and are mentioned in the methodology section of this research. In terms of the bias due to deviation from the intended methodology, the research ensured that exploratory research was conducted on various machine learning techniques and imagery technology methods for waste identification and categorisation in the studies. This was performed to ensure that bias was not given to a specific machine-learning technique.
The research analysed the bias due to missing outcome data to ensure that the missing data did not distort the study’s validity and lead to misleading conclusions. If recall or precision was missing in the data, the study was deemed to have “some concern”, and if both recall and precision were missing, the study was deemed to have a “high concern”. This was used as both are required to determine the F1 score of the developed system. The F1 score is a critical performance metric when determining the effectiveness of a system. To ensure that the data was consistent in measuring the outcomes and that errors were minimal, the research analysed the bias in the measurement of the outcome. If the research had both the F1 score and accuracy measured to determine the outcome of the study, it was seen to have a “low” risk of bias. If a study concluded the outcome on only one of those metrics, it was deemed to have “some concern” about the risk of bias. A “high” risk of bias was deemed if a study concluded its findings with no use of those metrics (F1 score and accuracy).
To ensure that there was no distorted representation of the study’s true results, the research analysed the bias in the selection of the reported results. This occurs when authors or researchers selectively report the findings that are favourable to their conclusion. This can mislead readers and prevent unfavourable findings. If the research derived and explicitly explained multiple forms of performance metrics but only calculated a few in the results section of the research, this represented “some concern”. The number difference between derived performance metrics and reported performance metrics determined whether it was ‘some concern’ (difference of 1) or whether it was ‘high concern’ (difference of 2–4). The overall risk of bias assessment was determined by the highest risk of bias that was identified out of the five domains for each study, as each domain was seen as equal.
4.3. Results of Synthesis
Out of 21 studies, 10 were directly compared to each other based on their F1 scores and a pooled F1 score. F1 scores were chosen as the performance parameter as they considered class imbalances, as certain studies used different waste categories, and some waste categories may have had more training and validation data than others in the building and testing phase of the waste identification and classification system. Accuracy can be a misleading performance parameter because if there were imbalanced datasets, the model would achieve a higher accuracy by predominantly identifying the majority class in the dataset compared to the minority classes. As mentioned in the previous sections, the F1 score is the mean of precision and recall. This would ensure that the scores did not favour precision over recall, and vice versa. Since waste identification and categorisation involve diverse and sometimes imbalanced classes (plastics, metals, organics, etc.), the F1 score is useful for a fair performance evaluation.
A pooled F1 score was calculated using two techniques based on either a fixed-effects model or a random-effects model. A fixed-effects model is used when the studies are highly similar, an individual effect of the study can be identified and analysed as the reason for similarity, and a low heterogeneity score for the meta-analysis (i.e., ). A random-effects model is used when the goal is too generalised across various conditions, the individual effects of the study are random and a high heterogeneity score for the meta-analysis (i.e., ). In order to determine which technique to use, the equations and justification are presented later in this chapter.
If the study did not present the F1 score in their results, a calculated F1 score based on the precision and recall values recorded by each study was conducted. If neither precision nor recall values were presented, the study was omitted from the analysis. The calculation for the F1 score based on the precision and recall values are
Once the researcher had the F1 scores for the 10 studies, the researcher needed to determine if a random-effects pooled F1 score or a fixed-effects pooled F1 score was appropriate for synthesis analysis. To determine this, the researchers started with the analysis. Firstly, the weighted mean F1 score (also known as the fixed-effects pooled F1 score) was calculated using sample sizes as weights.
where
is the F1 score of each study, and
is the sample size of each study. Once we had calculated the weighted mean F1 score, the researcher computed the Cochran Heterogeneity (Q) metric and the
metric for heterogeneity by
If
was greater than the degrees of freedom (
; where k is the number of studies, it suggested significant heterogeneity. With the Cochran Heterogeneity parameter, the research could estimate the between-study variance using the DerSimonian–Laird method:
If
, we set the
to avoid negative values. We included the weights in the
calculation. With the calculated between-study variance, the research could calculate the random-effects pooled F1 score. Firstly, it needed the random-effects weights by
Then, the random-effects pooled F1 score was calculated by
Finally, we computed the confidence intervals for each F1 score (including fixed and random).
The tabulated results presented in
Table 2 highlight four important findings from this meta-analysis and literature review.
A high heterogeneity score ( and ). This indicated that the variability in the F1 scores of the studies was due to true differences, rather than random errors. It also highlights that multiple factors affected the F1 score rather than a single overarching one. Based on the quantitative analysis of the studies that were examined, the reason for the high heterogeneity was due to different machine learning/deep learning models (YOLO, Random Forest and FLNN), various waste categories, different imagery analysis (RGB, Multispectral or Hyperspectral) and sample sizes.
The random-effects model was more appropriate than the fixed-effect model due to the large between-study variance ().
Therefore, the random-effects pooled F1 Score () was relatively high, which suggests that waste categorisation systems using drone technology performed well across the studies that were analysed.
The wider confidence interval for the random-effects pooled F1 Score (95% CI: 0.837–0.882) shows that there was increased uncertainty due to study differences. This further supports the large between-study variance score.
Based on the random-effects pooled F1 Score () and the confidence intervals, there were no studies that overlapped the confidence intervals. This supports the conclusion above that
The reason for these conclusions can be the methodological differences between the studies. This includes
Seven out of the ten studies exclusively used RGB data to identify and categorise waste/waste streams in the dataset. The three remaining studies used a combination of RGB, Hyperspectral data and Multispectral data. Since Hyperspectral and Multispectral data are relatively new image techniques used for object identification and categorisation, this could explain the results.
Eight of the studies used deep learning classification algorithms (CNN, YOLO), while the remaining two studies used traditional machine learning classification algorithms.
Nine studies used different types of waste categories to identify categories, with no norm established on categorising municipal solid waste, i.e., what are the standard groups of waste that you would find when analysing municipal solid waste? One study looked at banana grading but presented extremely valuable insight into the analysis of organic waste using aerial footage.
All studies had different datasets and sample sizes.
All studies had different capture height distances when identifying and categorising, i.e., no standardised norm.
5. Discussion
This systematic review and meta-analysis examined the application of drone technology integrated with image technology and deep learning for waste stream/waste identification and categorisation. The study initially identified 182 studies that are related to this area of research by conducting a search strategy using the IEEE and MDPI databases. Through the meta-analysis process and with the use of the PRISMA 2020 protocol, this research synthesised findings from 10 research articles, assessing waste identification and categorisation techniques using drone-based Hyperspectral/Multispectral/RGB imagery integrated with machine learning/deep learning models.
Based on the results of the quantitative synthesis analysis, the key findings indicate that deep learning models such as YOLO and Faster R-CNN significantly improve waste detection accuracy compared to traditional machine learning methods. The reviewed studies also highlighted that Multispectral imaging, when combined with RGB imagery, enhances waste classification accuracy by overcoming limitations such as background clutter, light variability and object distinction. This included research conducted by Mehadjbia and Slaoui-Hasnaoui [
12] that an integrated YOLOv8-based waste detection system using RGB and Multispectral data achieved higher performance metrics compared to single-sensor approaches. Similarly, Shao, et al. [
15] introduced MOD-YOLO, an advanced object detection model utilising a dual-stream transformer architecture that improved identification and classification performance with Multispectral data fusion. Furthermore, Mesa and Chiang [
33] demonstrated that combining RGB and Hyperspectral imaging in a multi-input deep learning model led to a significant improvement in classification accuracy, reinforcing the importance of integrated imaging approaches.
Based on the qualitative analysis, over 50% of the original articles were identified and categorised as waste utilising CNN models. Furthermore, 80% of the quantitative synthesised research represented CNN models. The quantitative synthesis analysis revealed a random-effects pooled F1 score of 0.859, highlighting the effectiveness of CNN models used in AI-powered drone technology with image technology and deep learning for waste identification and categorisation operations. However, a high heterogeneity score (I2 = 97.64%) was observed, suggesting variability across studies. The key factors contributing to heterogeneity included (1) differences in waste categorisation methodologies, with no standardised classification scheme in terms of classification technology, (2) variability in image data acquisition, including differences in flight altitude, lighting conditions, and sensor types and (3) inconsistent use of performance metrics, where some studies reported only precision or recall or F1 scores. The variability in performance metrics due to differences in sample sizes, waste categories, and operational parameters suggests that future research should explore AI-powered drone system designs that maintain effectiveness across varied operational contexts.
The practical implication of this heterogeneity is that while individual studies show promising results, one must be cautious when generalising findings across broad contexts. The variability in performance, driven by factors mentioned previously, highlights a critical need for standardised approaches. This heterogeneity also suggests that waste identification and categorisation systems must be tailored to their specific operational environments and input data types. For waste managers, policymakers and industry stakeholders, it highlights the importance of comprehensive pilot studies and validation before real-world scalability and deployment. To address these issues, potential future research should establish standardised datasets and evaluation protocols to ensure comparability across studies.
Therefore, the findings from the qualitative and quantitative research show that while this type of research is in the infancy stage of waste management, it shows the potential significant impact it could have on waste management. The design and development of AI-powered drone systems integrated with deep learning architectures, such as YOLO-Transformer architectures, and Multispectral imaging sensors are a promising direction for future potential waste identification and categorisation.
The risk of bias assessment conducted using the ROBIS tool highlighted four high risks of bias in studies due to the five specific domains of bias. These specific domains of bias included (1) bias due to missing outcome data—Tiwari and Dubey [
13] lacked performance metrics, which limited the calculation of the F1 score. This introduces uncertainty, making it difficult to assess the effectiveness and generalisability of their results. (2) Bias in the measurement of the outcome—Maharjan, et al. [
35] reported only one or two performance metrics without adequate justification, increasing the risk of bias in their measurement outcomes and potentially inflating the reliability of their findings. (3) Bias due to selective reporting of results—Córdova, et al. [
46] only selected performance metrics (precision and recall) that were reported, while other potentially relevant metrics were omitted without clear justification. This selective reporting can create a misleading impression of system performance, especially if omitted metrics reveal performance limitations. These examples show how specific biases can influence the interpretation and reliability of meta-analytic results.
The findings of this review have practical implications for waste managers, particularly in developing regions, such as South Africa, where illegal dumping and landfill overreliance remain significant challenges. Research presented shows that implementing AI-powered drone systems with integrated deep learning and image technology could (1) reduce waste management operational costs by identifying the source, (2) reduce the reliance on advanced and costly waste infrastructure, (3) minimise manual waste sorting and monitoring efforts and (4) enhance environmental sustainability by facilitating rapid waste identification, categorisation and recycling interventions.
While the study makes significant contributions, this study has several limitations: (1) the systematic review included only peer-reviewed journal articles and conference proceedings from IEEE and MDPI, potentially omitting relevant studies from other databases, such as Science Direct and Springer Link; (2) the meta-analysis may favour studies with positive results, as underperforming models are less likely to be published; (3) the findings may not be fully applicable to all waste management contexts, especially in regions where UAV regulations differ significantly; (4) due to the high heterogeneity score, the researcher could made a broad statement without conclusively acknowledging all the factors that affected the study performance.
In order to grow the research in this field of study, future research should focus on (1) designing and developing hybrid deep learning models that integrate image technology for waste stream/waste identification and categorisation, (2) integrating a valorisation process that can determine the best waste management strategy model, such as the WROSE model (South Africa), WARM (USA and North America), EASETECH or GAINS (Europe) and (3) testing real-time processing solutions to deploy drone-based waste detection systems in small-scale environments.
6. Conclusions
This systematic review and meta-analysis confirm that AI-powered drone technology, integrated with image technology and deep learning architecture, presents a viable solution for waste management. The findings demonstrate that integrated models, such as the YOLO-Transformer model, significantly enhance waste identification and classification accuracy when using Multispectral imagery.
The use of Multispectral imaging, as highlighted in research by Mehadjbia and Slaoui-Hasnaoui [
12], Shao, et al. [
15], offers a significant advancement in waste detection systems. These studies emphasise that fusing Multispectral data improves object detection, waste classification and waste strategy determination. Moreover, research by Mesa and Chiang [
33], Iordache, et al. [
34] support the conclusion that integrated deep learning architectures, such as the YOLO-Transformer model, can significantly enhance system performance.
The successful deployment of an AI-powered drone-based waste monitoring system can significantly assist waste managers, such as municipalities, urban planners and recyclers/buy back centres, by identifying waste streams/waste, categorising the associated waste and valorising it. Therefore, waste streams can be more effectively identified in terms of quantity, volume and frequency. This can reduce illegal dumping, improve waste recovery rates and enhance environmental sustainability. Future potential research should focus on the design and development of AI-powered drone systems integrated with deep learning architectures, such as YOLO-Transformer architectures, and Multispectral imaging sensors for waste stream/waste identification, categorisation and valorisation for small-scale environments.
By leveraging technological advancements in drone technology, deep learning architecture and Multispectral imaging, policymakers and researchers can drive forward intelligent waste management solutions, ultimately contributing to a cleaner and more sustainable environment.


