Article

Fast Detection of Plants in Soybean Fields Using UAVs, YOLOv8x Framework, and Image Segmentation

1
Institute of Automation and Information Technologies, Satbayev University (KazNRTU), Almaty 050013, Kazakhstan
2
Management and Business Department, Transport and Telecommunication Institute, Lauvas iela 2, LV-1003 Riga, Latvia
3
LLP Kazakh Research Institute of Agriculture and Plant Growing, Almaty 040909, Kazakhstan
4
International Radio Astronomy Centre, Ventspils University of Applied Sciences, LV-3601 Ventspils, Latvia
5
Department of Natural Science and Computer Technologies, ISMA University of Applied Sciences, LV-1019 Riga, Latvia
*
Author to whom correspondence should be addressed.
Drones 2025, 9(8), 547; https://doi.org/10.3390/drones9080547 (registering DOI)
Submission received: 18 June 2025 / Revised: 22 July 2025 / Accepted: 23 July 2025 / Published: 1 August 2025

Abstract

The accuracy of classification and localization of plants on images obtained from the board of an unmanned aerial vehicle (UAV) is of great importance when implementing precision farming technologies. It allows for the effective application of variable rate technologies, which not only saves chemicals but also reduces the environmental load on cultivated fields. Machine learning algorithms are widely used for plant classification. Research on the application of the YOLO algorithm is conducted for simultaneous identification, localization, and classification of plants. However, the quality of the algorithm significantly depends on the training set. The aim of this study is not only the detection of a cultivated plant (soybean) but also weeds growing in the field. The dataset developed in the course of the research allows for solving this issue by detecting not only soybean but also seven weed species common in the fields of Kazakhstan. The article describes an approach to the preparation of a training set of images for soybean fields using preliminary thresholding and bound box (Bbox) segmentation of marked images, which allows for improving the quality of plant classification and localization. The conducted research and computational experiments determined that Bbox segmentation shows the best results. The quality of classification and localization with the application of Bbox segmentation significantly increased (f1 score increased from 0.64 to 0.959, mAP50 from 0.72 to 0.979); for a cultivated plant (soybean), the best classification results known to date were achieved with the application of YOLOv8x on images obtained from the UAV, with an f1 score = 0.984. At the same time, the plant detection rate increased by 13 times compared to the model proposed earlier in the literature.

1. Introduction

The introduction of precision farming technologies is one of the most important ways to overcome the food crisis associated with the rapid growth of the world’s population [1]. The processes of precision farming assume precise impact on crops and cultivated fields in order to increase yields and reduce costs. An important goal is to diminish the influence of interfering factors that limit the growth of useful plants. A number of factors hinder the successful growth of plants: pests, lack or excess of fertilizers, soil conditions, moisture lack or excess, soil salinity, weeds, etc. [2]. Reliable identification of these factors is, of course, possible by visual inspection of the field by an agronomist; however, the large areas of fields prevent the widespread use of manual labor in the monitoring process. The obvious way to improve the situation is the use of automatic means. Nowadays, UAVs represent such means, and they are widely used in various areas of aerial monitoring [3], including monitoring of precision agriculture. To carry out such monitoring, it is necessary to select an appropriate field and flight altitude and take into account the limitations related to weather, battery charge, etc. For example, if you need to obtain an image of individual plants, you need to set the flight altitude to 3–10 m; taking into account the flight time on one battery charge, the monitoring area will be about 1 hectare. To calculate the spectral indices, the flight altitude can be much higher (50 m or more), and accordingly, the area of the field that can be flown around will be up to a hundred hectares. Nevertheless, the processing of the acquired data and images is quite complex, multi-purpose, and one of the most promising tasks attracting great attention from the scientific community [4]. The collected data bear the attributes of so-called big data [3] and practically cannot be processed manually in the operational mode. Although, when using the images obtained from low-flying UAVs equipped with high-resolution cameras, such as those listed in [5], there is a possibility of automatic recognition and classification of objects in the fields, but the specific ways of realization of this process are not so simple. One of the similar tasks is the task of classification and localization of images of cultivated plants and weeds on the received images (detection task). The solution to this problem allows for more accurate forecasting of future yields and application of variable rate technology (VRT) [6], which not only reduces costs but also increases yields. To solve this problem, there are widely used machine learning methods and, above all, frameworks, including convolutional neural networks (CNNs); for example, AlexNet [7], ResNet [8,9], VGG [10], GoogLeNet [11], U-Net, MobileNets, and DenseNet [12]. Such studies demonstrate good results when the quality of classification reaches 90 percent or more. For example, in [7], the task of classifying plant images in the fields sown with soybean was considered. The original RGB images acquired by a UAV from a height of 4 m (resolution 4000 × 3000 pixels) were first segmented using the SLIC super-pixel method and then manually segmented into four classes: soil, soybean, grass, and broadleaf. For each segment, the following features were computed: Gray-Level Co-occurrence Matrix (GLCM), Histogram of Oriented Gradients (HOG), Local Binary Patterns (LBPs), and color distributions in RGB, HSV, and CIELab color spaces. The obtained features were used to train CNNs based on the CaffeNet architecture. The quality of the classification claimed by the authors was 99%. The average processing time of one image was 1.14 s. However, in practice, it is required to solve detection problems, in other words, to localize a plant (to determine its location) and to classify it at the same time. The most advanced framework of this type is YOLO (You Only Look Once) [13,14,15], which is able to solve the problem of object detection in one pass of the signal through the network. In other words, a trained and optimized network can process several dozen high-resolution frames per second. For successful operation of such a model, it is only necessary to train it on an appropriate set of annotated images. Apparently, such extremely attractive properties of the model have catalyzed the growth of its applications for plant detection in fields [16,17]. One of such applications was the task of processing images acquired in soybean fields [15]. Soybean is a plant that contains a large amount of protein, has many useful properties, and is a leader among legumes, significantly surpassing others (beans, peas, chickpeas, etc.) in terms of production. For these reasons, much attention is paid to the optimization of its production on the basis of precision farming technologies. A number of works consider the application of the YOLO algorithm for the detection of cultivated plants and weeds in soybean fields. For example, the task of weed segmentation in a soybean field with an average accuracy of 98% is solved mainly with the use of ground machines [18]. In the work of Sunil et al. [17], the results of applying YOLO to images collected by a ground robot for several crops, including soybeans, are presented. The accuracy values vary from 80.8% to 98% depending on the crop, field, and environmental conditions. However, when using UAV-acquired images, the classification accuracy achieved so far is much lower. Tetila et al. [19] consider the problem of binary identification (soybeans or weeds) using the YOLOv5s6 model and UAVs. The achieved accuracy is 0.93 using a much lighter version of the software. Approximately the same result of soybean classification was obtained in the study [20].
In this paper, we consider the possibility of using a dataset in which only part of the plant images are labeled. Despite this limitation, due to the pre-segmentation, we obtained significantly better soybean classification results with YOLO than in the above-mentioned papers. The goal of this article is to describe a general approach that can be used to build plant detection models using partially segmented image sets and the YOLOv8x framework.
The main contributions of this paper are as follows:
  • A new dataset for soybean fields was developed; it includes annotated images of not only soybeans but also seven common weed species found in agricultural fields in Central Asia.
  • A method for preprocessing the training data using Bbox segmentation is proposed; it significantly improves the accuracy of classification and localization. The application of the proposed approach led to a significant improvement in the model performance: f1 score increased from 0.64 to 0.959 and mAP@0.5 increased from 0.72 to 0.979.
  • The highest classification accuracy to date was achieved using the YOLOv8x algorithm and UAV images (f1 score = 0.984) for the soybean recognition task.
  • The proposed model significantly outperformed previously described approaches in terms of detection speed, providing a 13-fold increase in speed compared to the results presented in the literature previously. The trained model processes one image in 20.9 milliseconds and can provide detection in a video stream at a rate of 47 frames per second. That is, plant detection is possible in real time.
The article is arranged as follows:
  • The second section describes the materials and methods in detail, including the procedures for data collection, image labeling, and object detection.
  • The third section presents the results of the experiments conducted using the proposed approach.
  • The fourth section analyzes and discusses the results, focusing on their comparative evaluation and interpretation.
  • The conclusion summarizes the results of the study and identifies possible directions for future research.

2. Materials and Methods

The irrigated agricultural field where the survey was conducted is located near the city of Almaty (southeastern Kazakhstan) in the village of Almalybak and belongs to the Kazakh Research Institute of Agriculture and Crop Production (KazRIACP). Figure 1 shows the location of the field. The coordinates of the field are as follows: 43.226108, 76.700016. The area is 1 hectare. The soil cover of the field is represented by foothill light chestnut soils. They are formed on loess-like loams and have a clearly expressed fertile profile. A characteristic feature of light chestnut soils is their high carbonate content. According to the mechanical composition, it belongs to medium loams. The content of coarse dust is 40–45%, physical clay is about 40%, and silt particles decrease along the profile from 13.82 to 8.62%. Almost all mechanical elements are in the aggregate state. The sum of macroaggregates reaches 80–90%, which is typical for loess-like rocks. The soils of the site are characterized by deep groundwater, as well as weak mineralization.
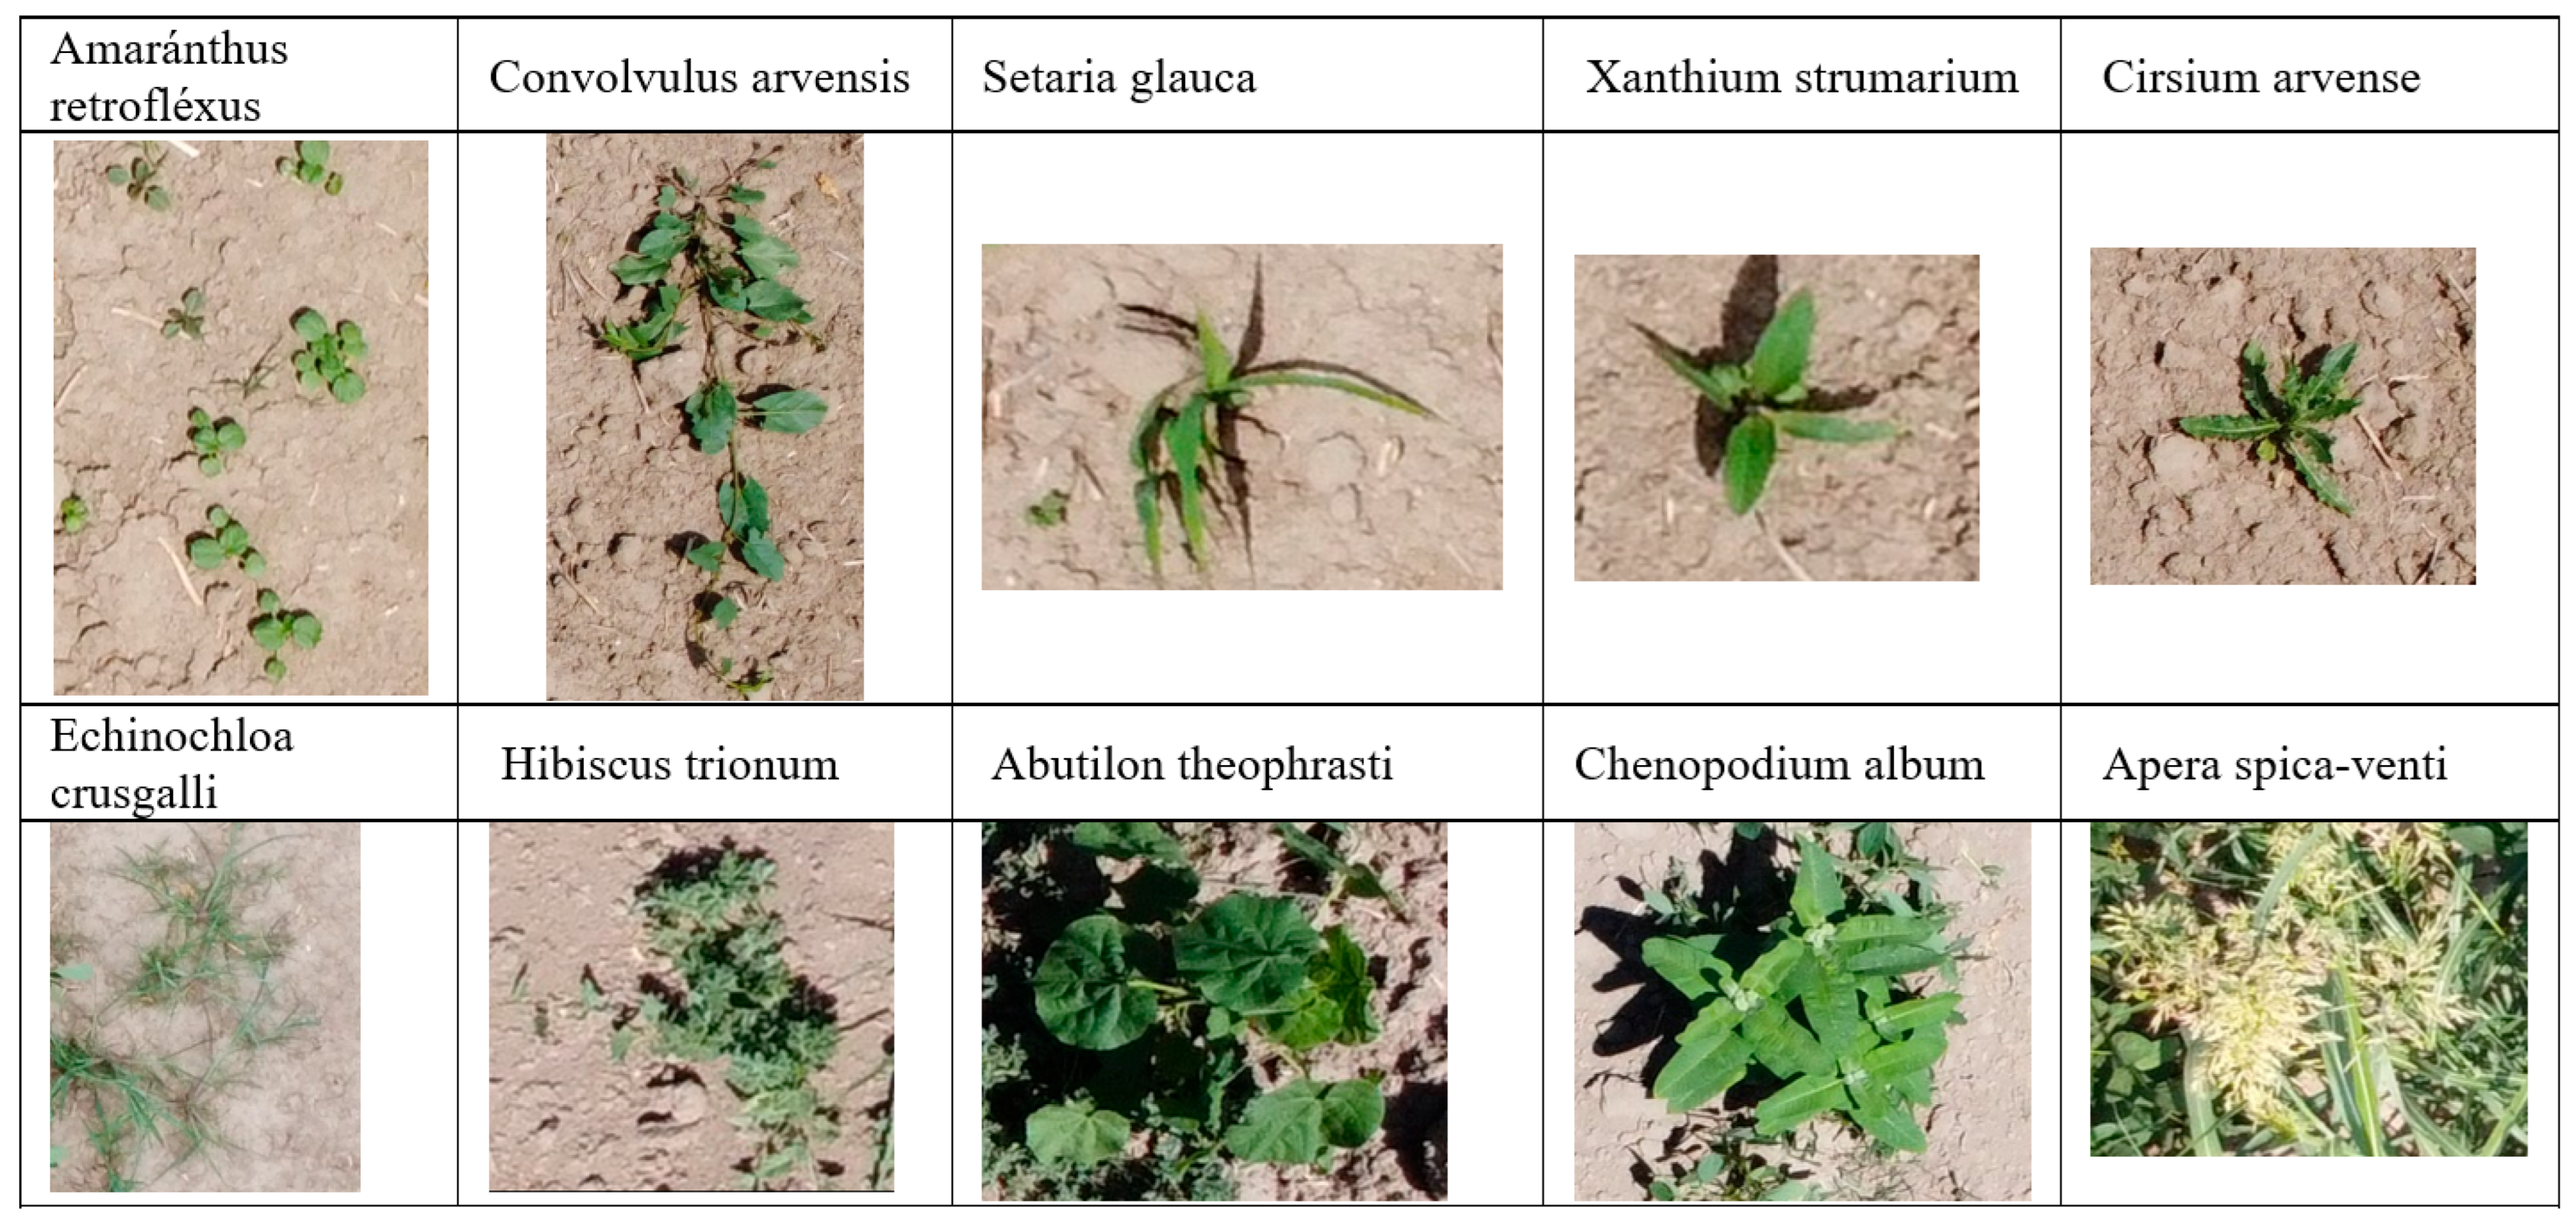
The research process consisted of collecting images of the field during the first phase of soybean development (21 days after planting) (see Appendix A for a list of soybean development phases in practice). The field was photographed using a UAV equipped with a 4K resolution RGB camera. UAV specifications are presented in Appendix B. A total of 376 high-resolution images of the field were acquired. Then, the images of soybean and weed plants were manually marked up in YOLO format [21]. At the preliminary stage, a list and appearance of weeds that may occur in soybean fields of southern Kazakhstan were compiled (see Figure 2).
Images were marked using the publicly available data annotation platform named CVAT service (Computer vision annotation tool) [22]. The obtained labeled images were supplied to the input of the pre-trained YOLOv8x model for its additional training. The main stages of the study are shown in Figure 3.
There is a description of the stages listed in Figure 3 in more detail.
  • Field images were obtained during the routine experimental overflights of soybean fields. The overflights were conducted using a commercially available DJI Mavic Mini 2 UAV (SZ DJI Technology Co., Ltd., Shenzhen, China) equipped with an RGB camera with 4K pixel resolution (CMOS 1/2.3″, Effective Pixels: 12 MP, FOV: 83°, resolution 4000 × 2250) at an altitude of 4 to 10 m (see Figure 4a).
  • Image labeling was performed using CVAT; therefore, most plant images were boxed and annotated with one of 10 weed and soybean classes (see Figure 4b).
    The set of acquired marked images was divided in an 80/20 proportion into training (300 images) and test images (76 images).
  • Segmentation. The essence of the segmentation process is to remove the background along with unlabeled objects in each image. Two approaches were used for this purpose.
    3.1.
    The first approach implemented in the experiment 1 provided threshold segmentation of plant images using the plantcv library [23]. In the process of threshold segmentation, each pixel of the image is compared with a given brightness threshold selected during the preliminary experiments in the range from 0 to 255. The best result is obtained at the threshold equal to 144. The brightness of pixels with a value lower than the threshold is set to 0. Pixels with a brightness higher than the threshold are not changed (see Figure 5a).
    3.2.
    The second segmentation option (experiment 2 or Bbox segmentation) involved removing all unlabeled plant and background images outside the bounding box (Bbox) (see Figure 5b).
  • YOLOv8x retraining and evaluation of the results. The YOLOv8x framework, which has 70–80 million trainable parameters [24], was used in the experiments. The YOLOv8x model was pre-trained on the COCO (Common Objects in Context) dataset containing objects of 80 classes ranging from persons and cars to toothbrushes [25,26]. For each dataset, the same set of images was used to test and evaluate the results obtained, but the retraining was performed independently on three datasets: dataset for experiment 1 (threshold segmentation), dataset for experiment 2 (Bbox segmentation), and original dataset without segmentation. To improve the generalization ability of the model and its qualitative indicators, the training dataset was extended by applying the image augmentation library [27]. A total of 1000 augmented images were added and used for training in experiments 1 and 2. The augmentation parameters are described in Appendix C.
Since the applied YOLOv8x framework performs not only plant classification but also plant localization, the metrics of classification quality and localization quality were used to estimate the obtained detection results (see Table 1).
Computational experiments were performed on a computer equipped with a 12th Gen Intel (R) Core (TM) i9–12900K processor and 125 GB RAM in the environment of a Ubuntu 20.04.6 LTS operating system (kernel 5.15.0–134-generic). The program system is developed in Python 3.9 using the following libraries: pandas v2.3.0, numpy v2.3.1, scikit-learn v1.7.0, torch v2.7.1, ultralytics v8.3.161, opencv-python v4.11.0.86, plantcv v4.8, imgaug v0.4.0, loguru v0.7.3, pyyaml v6.0.2, and wandb v0.21.0.

3. Results

The preliminary steps associated with data preparation resulted in the creation of class-imbalanced datasets 0, 1, and 2 containing images of several tens of thousands of plants and beds (see Table 2). The images of useful plants (soybeans) are most fully represented, while the images of individual weeds contain from tens to hundreds of images. The original dataset (0) contains a small number (about 10%) of unlabeled plant images. Some weed species (Echinochloa crusgalli, Chenopodium album, Apera spica-venti), which are found in the fields of southern Kazakhstan, are absent in the created datasets.
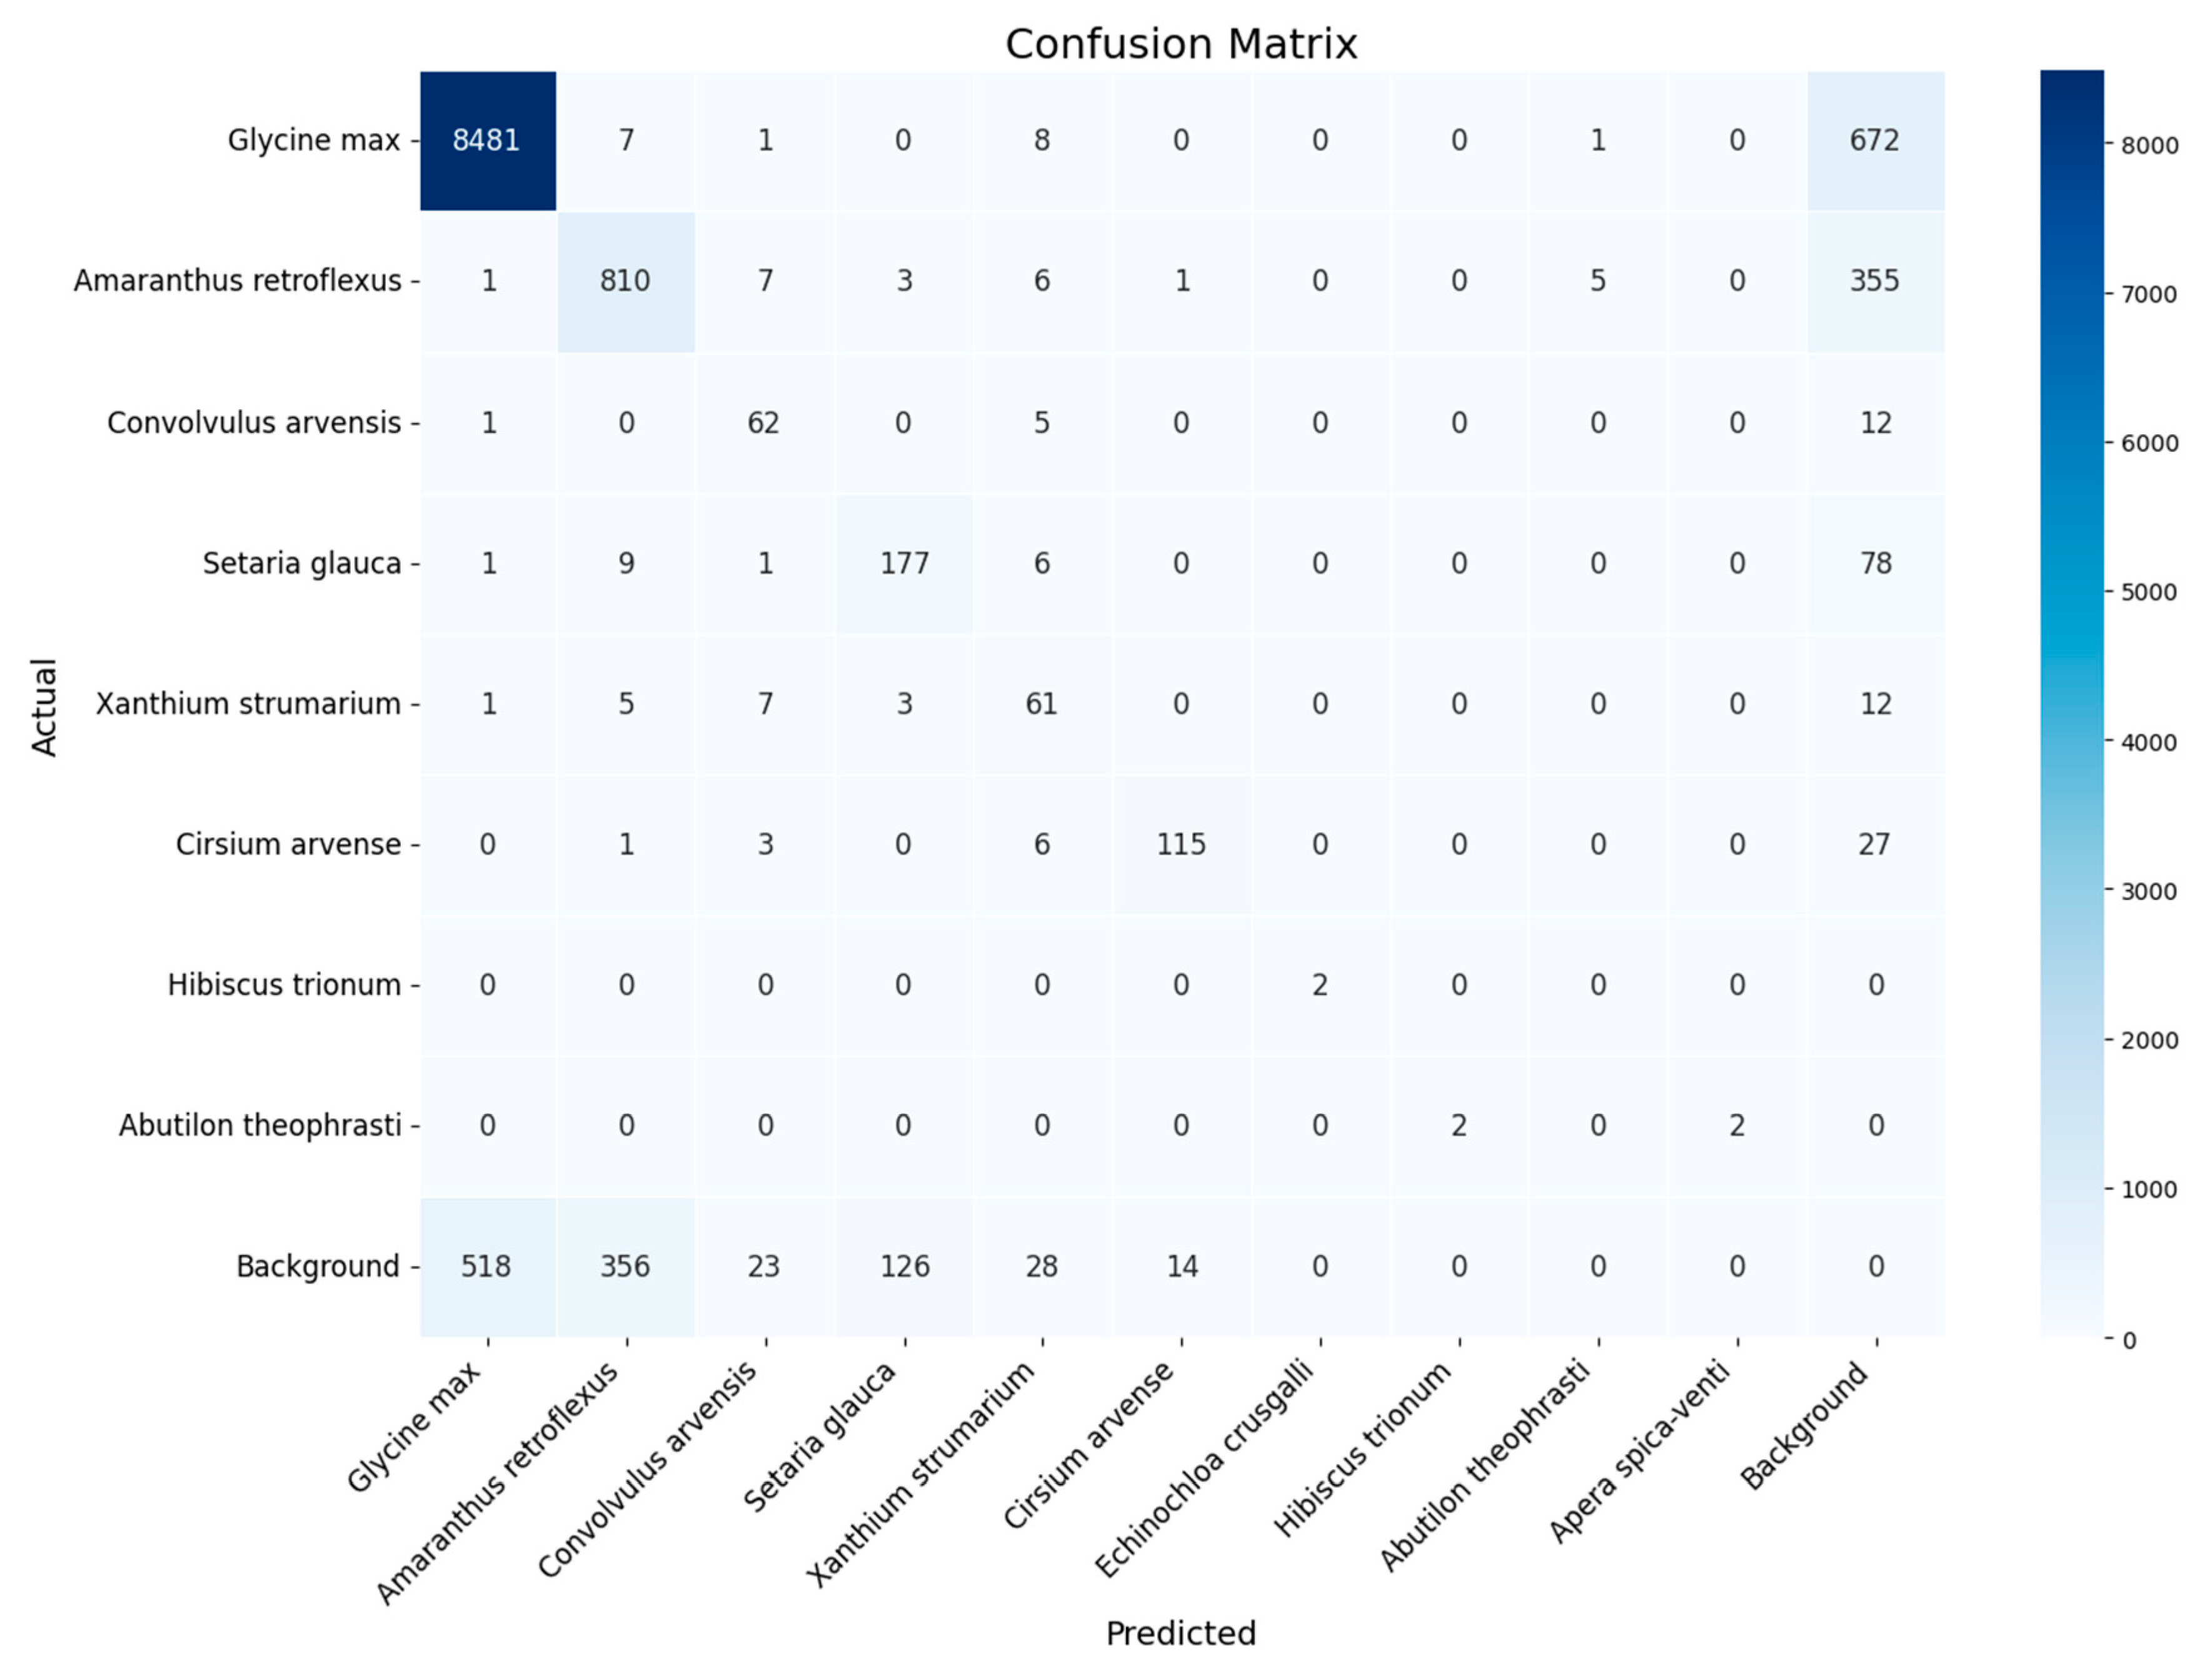
The mentioned weed classes (7,10,11), which are not represented in the test set, as well as class 0, were not used in the model validation. Therefore, the calculation of detection quality indicators was performed without taking them into account. Since the datasets are not balanced, in other words, the number of plants of different species differs significantly, confusion matrices were visualized to compare the results obtained during the computational experiments. Figure 6 shows the confusion matrix obtained during the experiments with the original (unsegmented) set of images.
Numbers on the diagonal mean the number of correctly classified plants of the corresponding species. Numbers outside the main diagonal mean the number of errors of the first and second kind (FP is above the diagonal, FN is below the main diagonal). It is not difficult to calculate the f1 score for soybeans. It amounts to 0.933.
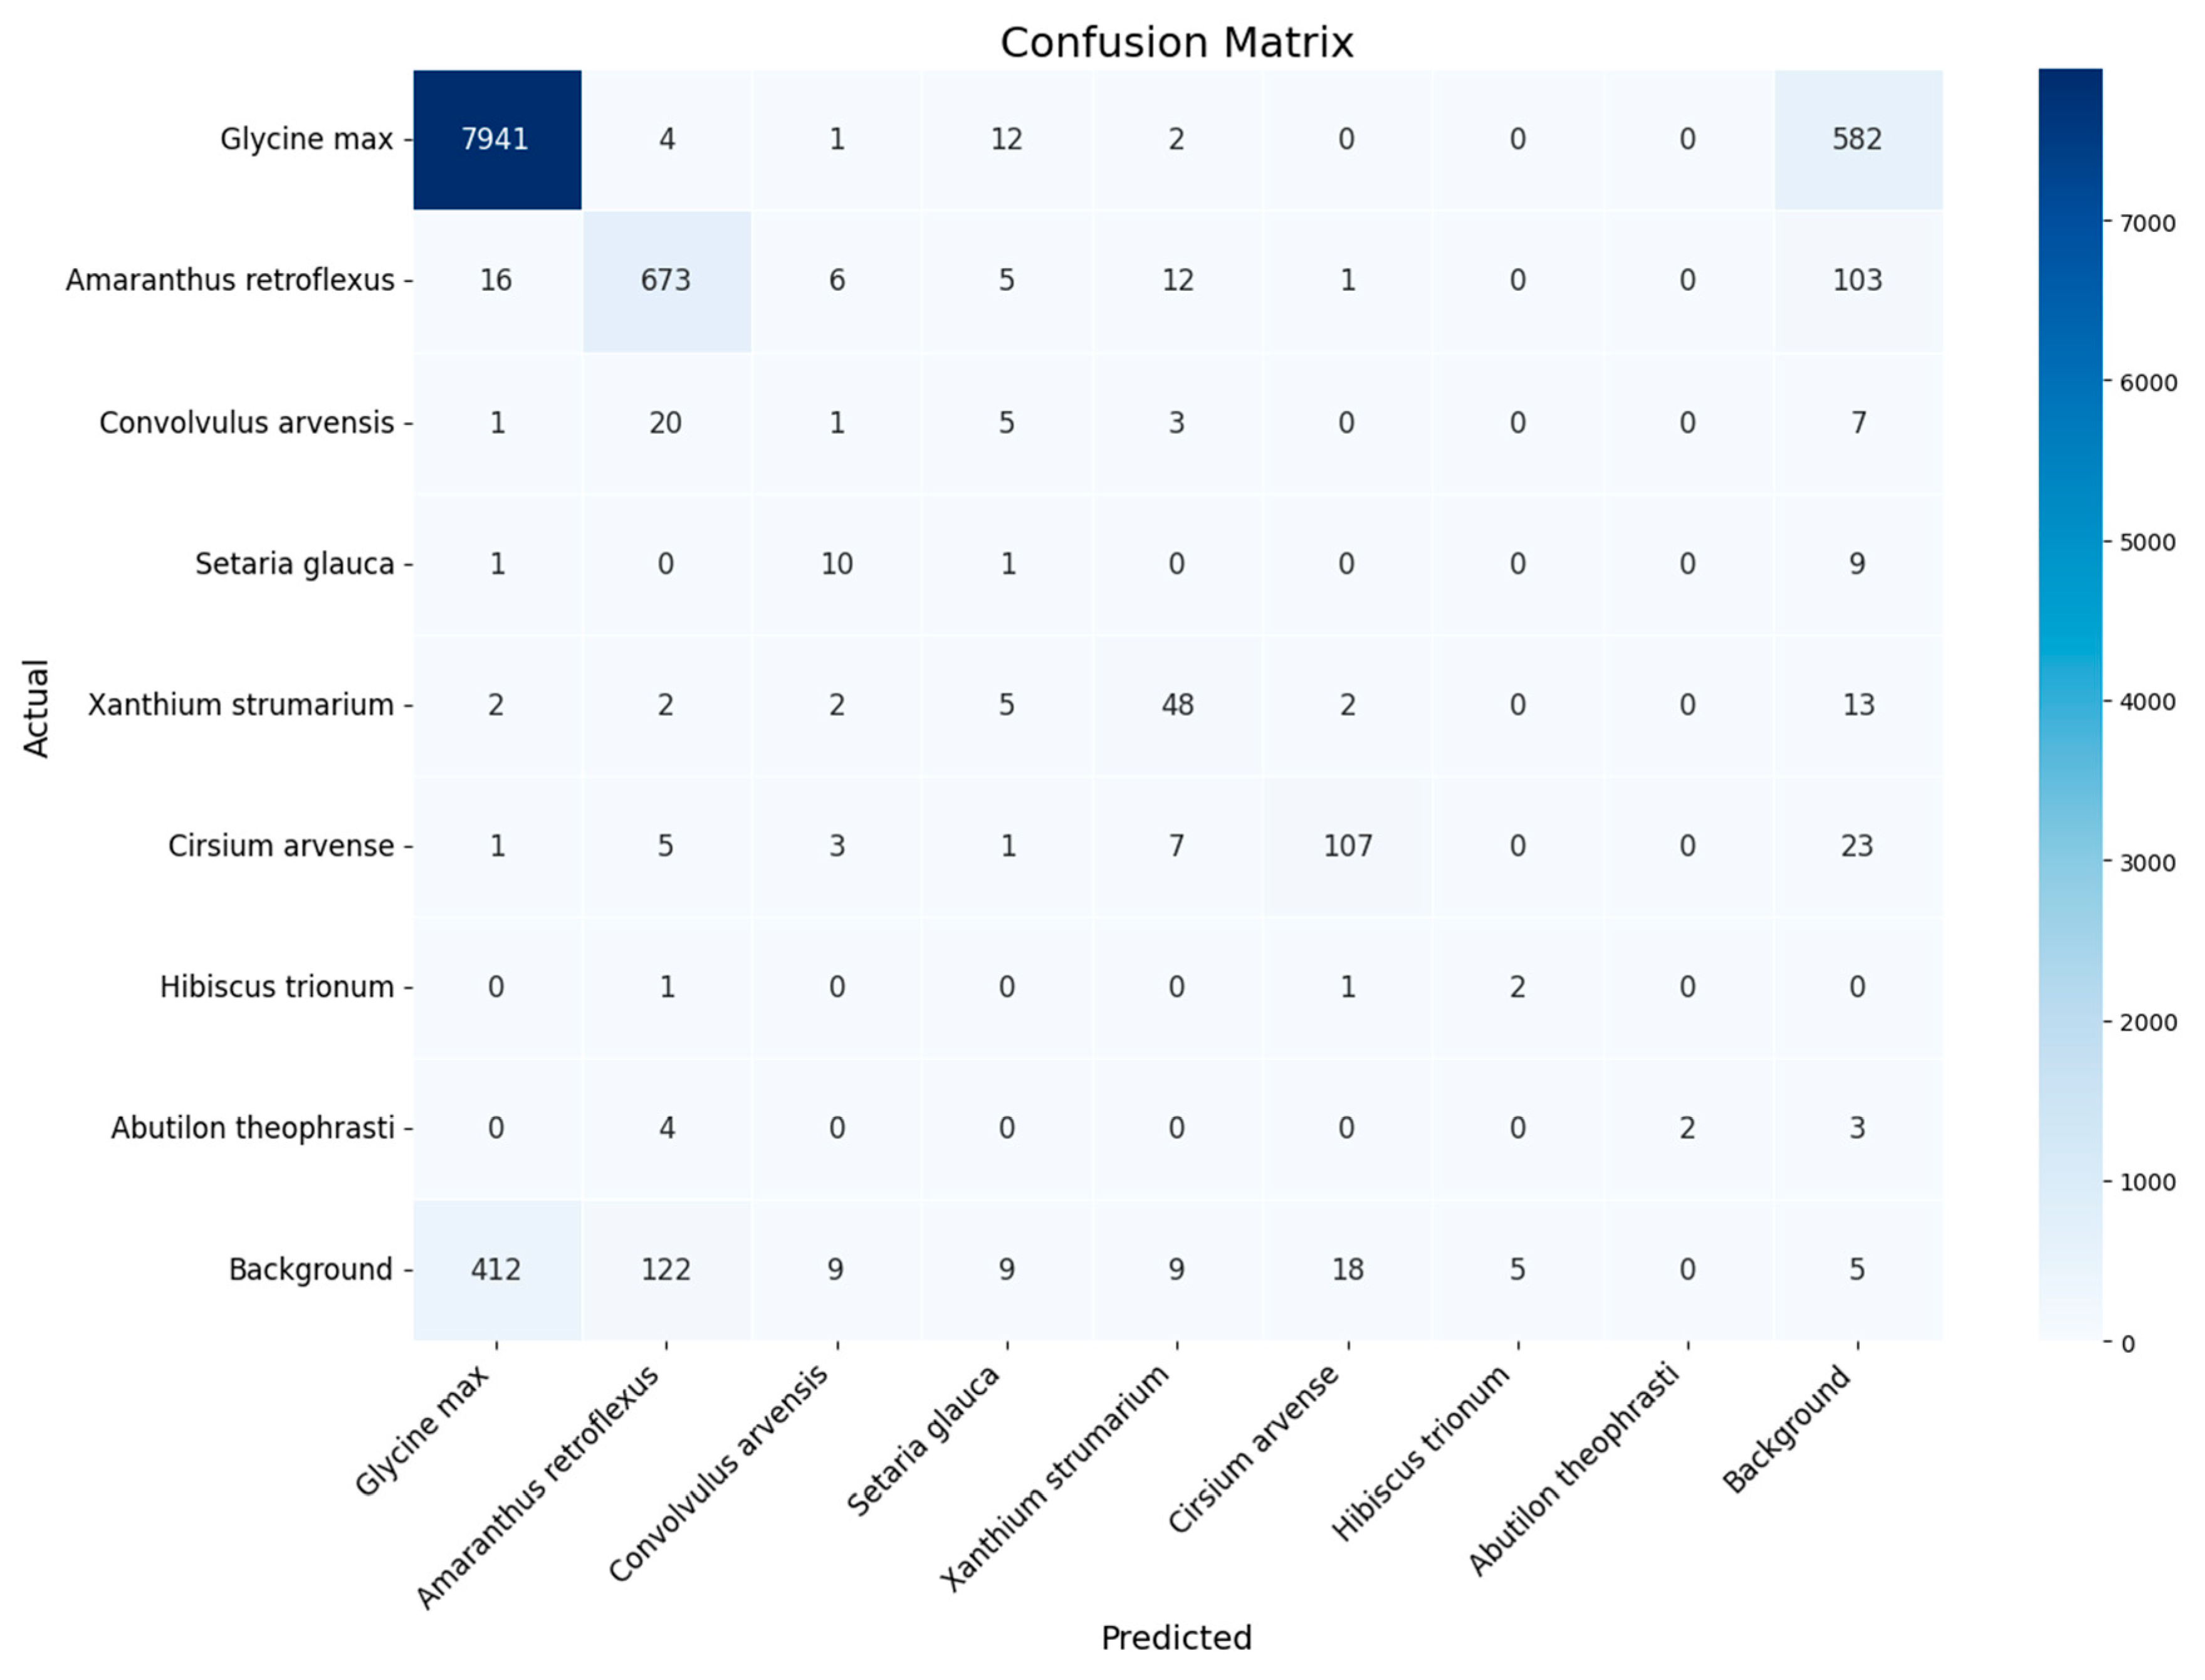
Figure 7 shows a similar confusion matrix obtained in experiment 1 (threshold segmentation).
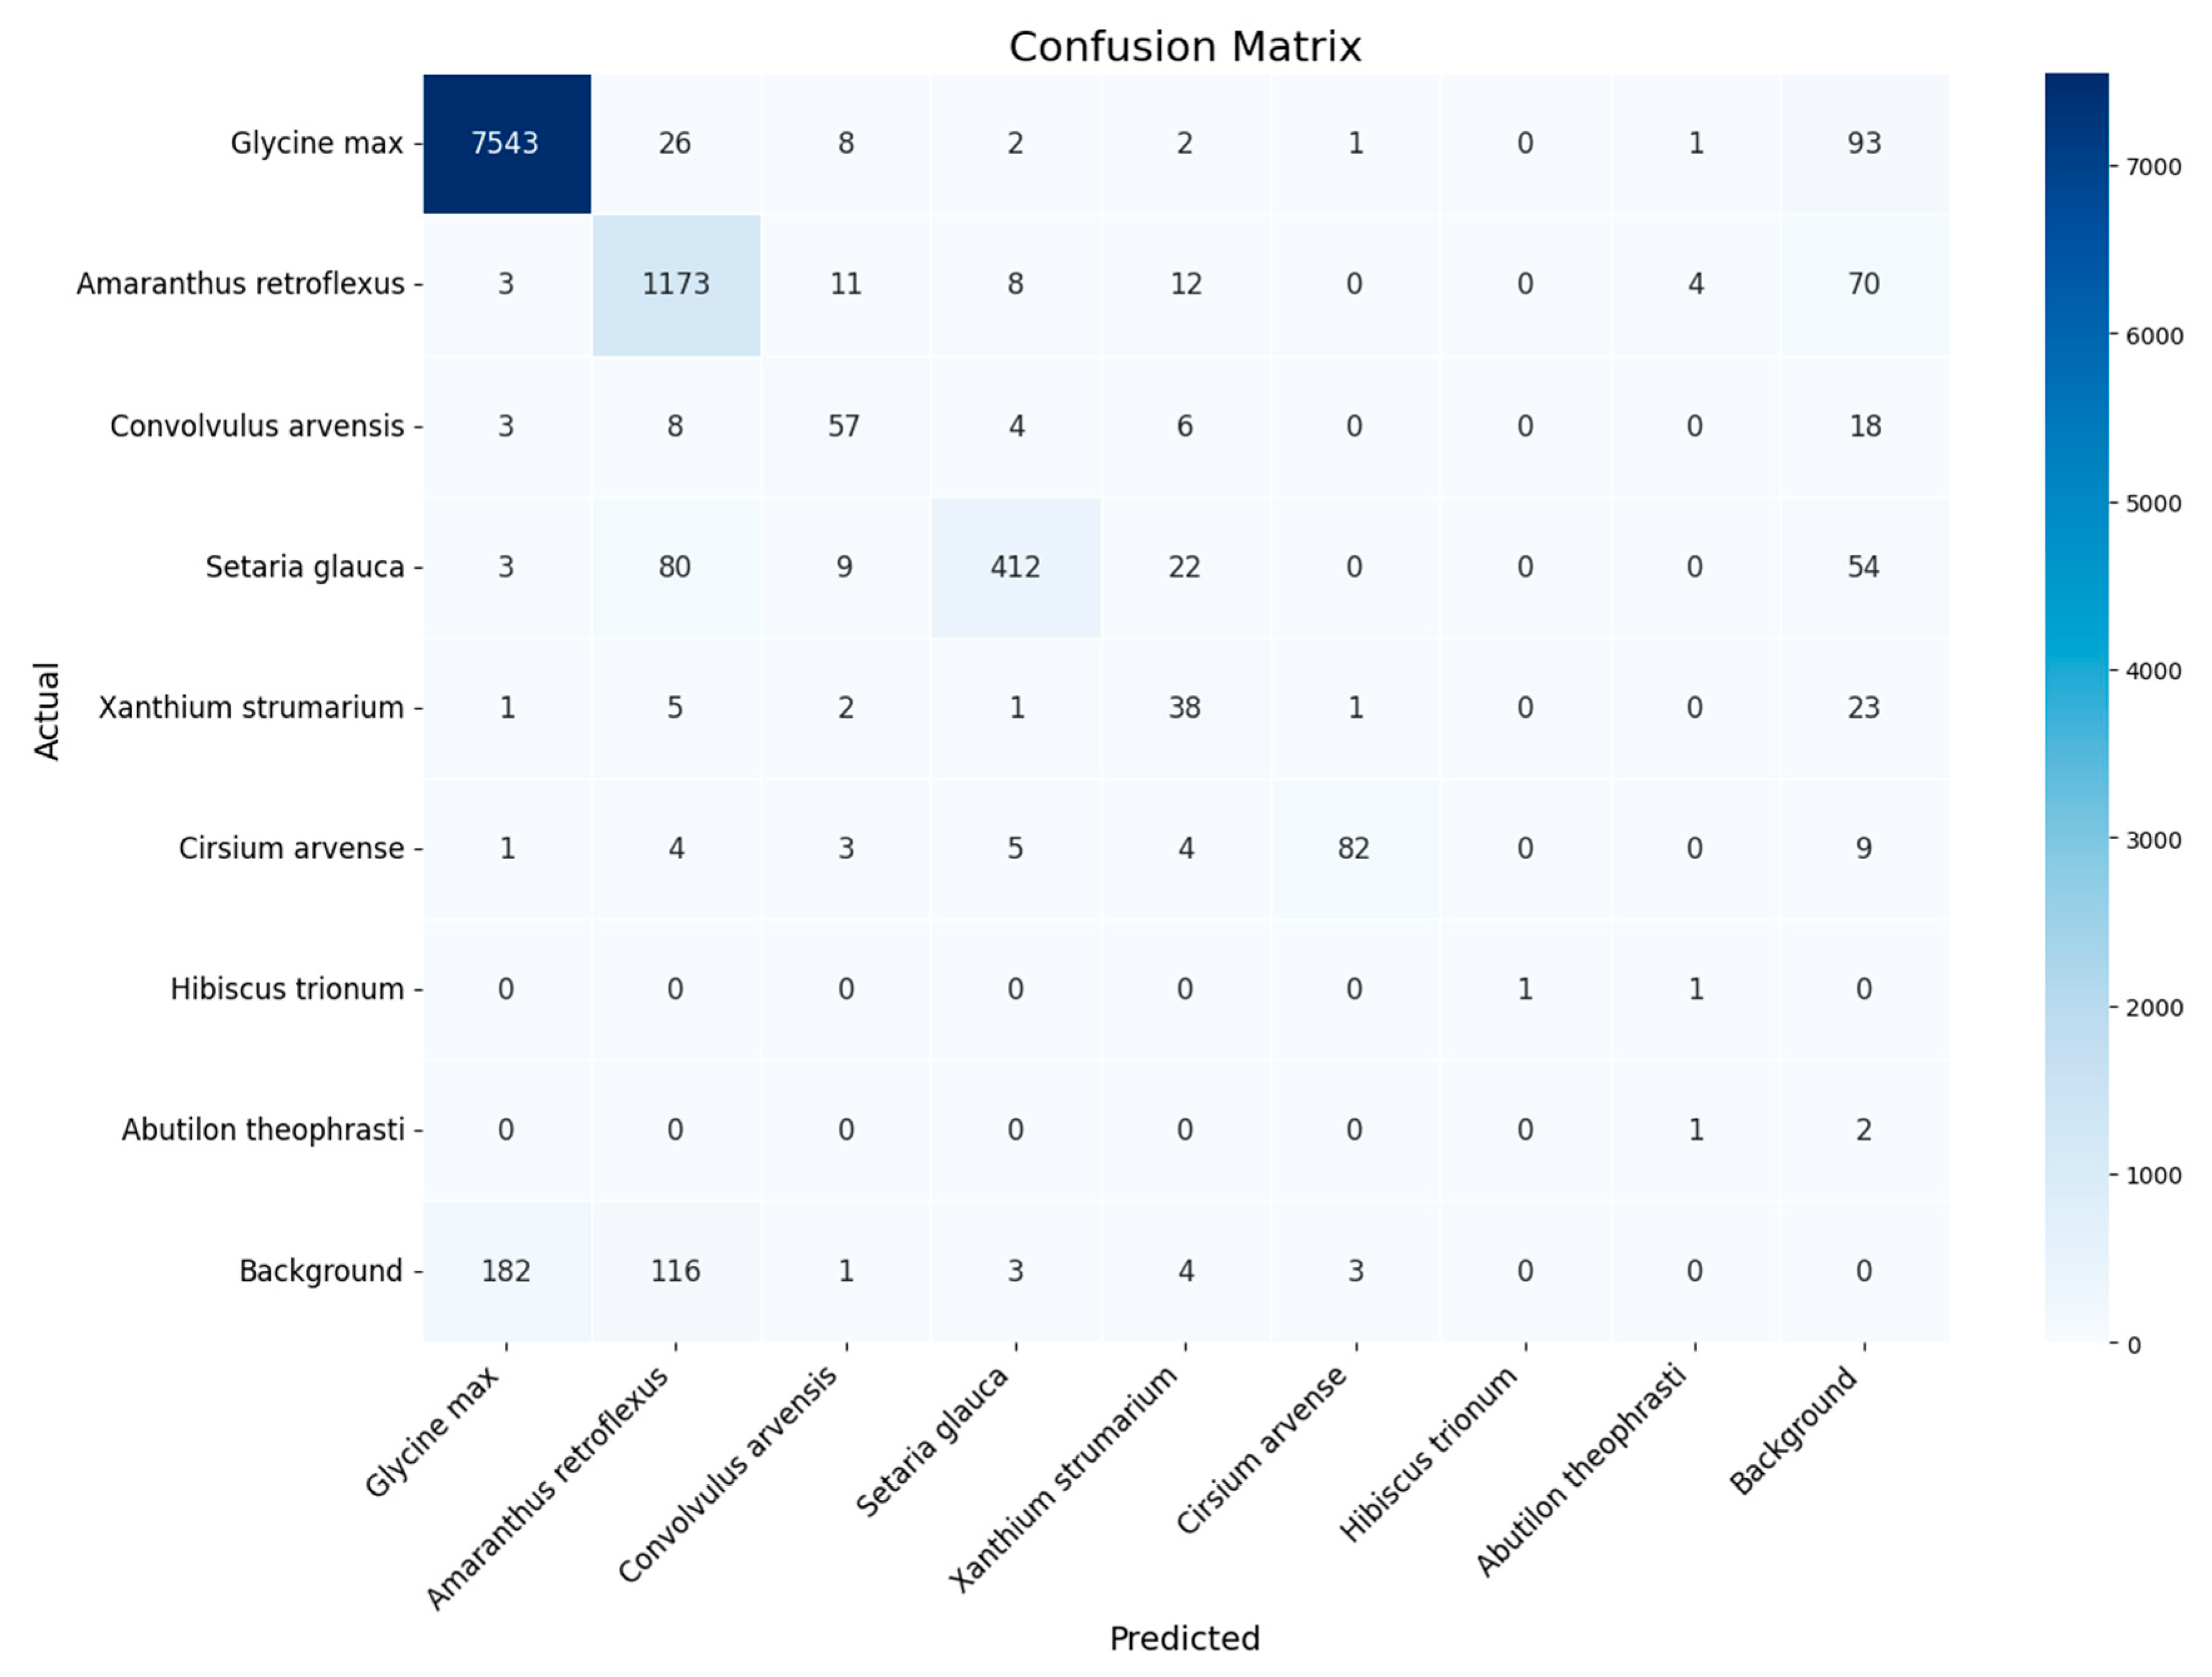
Figure 8 shows the confusion matrix obtained in experiment 2 (Bbox segmentation).
The classification quality of cultivated plants became significantly higher (f1 score = 0.979). To verify these assumptions and to assess better the quality of the applied model, a cross-validation (k = 10) of detection models was performed. The f1 score values for all significant classes are given in Appendix D. The averaged results of detection quality for all plant species and separately for soybeans are given in Table 3.
The speed of image processing using the YOLOv8x framework in the process of classification and localization of plants was 0.085 sec.
To assess the impact of weather-related distortions, additional experiments were performed using the model under the conditions of fog. White fog of varying intensities was superimposed on the field image. The opacity of the superimposed white layer varied from 0 (original image, completely transparent layer) to 10 (completely opaque white layer) with a step of 0.1. Figure 9 shows the field images with different opacity levels.
Depending on the layer opacity, the classification model showed the following results (Table 4).
Image set and programming code can be downloaded at https://drive.google.com/drive/folders/1ObZjrP5eW3zO0bZLeIrNd347nKUlgowU (accessed on 22 July 2025) (see Data Availability Statement).

4. Discussion

Plant detection in fields is an important application of machine learning methods. In particular, it is used to detect plant diseases, crops and weeds [16,30]. The accuracy of crop classification varies from 90% to 98% depending on the model and shooting conditions. The used technologies include the following: RGB, multispectral and hyperspectral cameras and deep learning models: CNN, Vision Transformers, GAN, Vision-Language Models [30]. One of the deep learning models used is YOLOv5; the use of it allowed us to obtain the classification quality in soybean fields from 0.91 [31,32] to 0.93 (f1-score) and the localization accuracy mAP50-95 = 0.48 [33]. In this paper, the experiments were performed with the use of the YOLOv8x model and some dataset preprocessing techniques.
The results obtained in experiment 1 (original dataset) show a quality that roughly corresponds to that reported in the literature (f1 score = 0.93 [20,33]). The result is achieved by careful labeling of the image sets. Nevertheless, it can be improved by applying segmentation techniques. The application of threshold segmentation improved the result for a cultivated plant (f1 score = 0.939), which is already slightly higher than the results achieved previously using YOLO frameworks on UAV images. However, the application of Bbox segmentation allowed us to significantly improve this result as well. The detection quality of Bbox segmentation (experiment 2) is significantly higher compared to both the original dataset and threshold segmentation (experiment 1). The localization quality (mAP50–95 = 0.936) also increased significantly, which allows for more confident identification of the plant location in the field [33]. For soybeans, the classification quality (f1 score = 0.984) is actually close to the maximum known in the literature (f1 score = 0.99) [7].
However, in contrast to the above-mentioned work [7], the classification speed is about 13 times higher (measurements were performed on a computer of the same configuration); in addition, at the same time and with the same speed, the localization of plants is performed, which is important for the subsequent planning of agrotechnical measures.
The experiments show that plant detection by the previously trained network is performed in 20.9 milliseconds (0.1 ms preprocess, 8.7 ms inference, 12.1 ms postprocess). The model can perform detection at a speed of 47.85 frames per second. Therefore, semi-automatic detection of soybeans is possible on large arable fields in real time.
Note that the classification quality of weeds, such as Abutilon theophrasti and Xanthium strumarium, decreased. Part of the results obtained can be explained by the fact that, firstly, the number of weed plants of all species is small, and secondly, Abutilon theophrasti is a very small weed at this growth phase.
It should also be noted that some images are recognized worse than others. Ten photos sorted in order of improving F1 score micro-quality are given in Appendix E. The photos containing a large background area and a small number of plants are recognized to be significantly worse. Fog imitation also has a significant effect on the classification quality (Table 4). A sharp deterioration in the quality of the model is observed, first, in the presence of even a relatively small haze (0.1) and then with an increase in opacity above 0.7. These patterns can serve as a subject for further research aimed at increasing the robustness of the method. Perhaps some image processing techniques that improve image quality will be useful [34,35].
The developed dataset allowed training a model to detect soybean plants from a UAV at early stages of development. In practical application, this allows for making predictions of possible yields and assessing the weediness of field plots. Despite the good results achieved during the research process, there are some limitations that will need to be addressed during the next phases of the study as follows:
  • The datasets are not balanced and contain many images of cultivated plants and much fewer weeds. As a result, the quality of weed classification is significantly inferior to the quality of useful plant detection.
    All experiments were performed only during the first stage of soybean growth, when plants are well identified and there is little overlap. Expanding the dataset with field images at later stages of soybean growth will increase the practical applicability of the dataset and the corresponding detection method.
  • The photographs of the fields were taken from a low altitude, which on the one hand improves the quality of the images and on the other hand significantly increases the required duration of the UAV flight.

5. Conclusions

The computer vision methods, especially those related to detection, localization, and classification of objects, help in weed control procedures in specific areas of the field. They allow for the implementation of variable rate herbicide application practices within a field. However, the major challenge in developing a weed detection and crop plant counting system is the need for a properly annotated database to distinguish between weeds and crops in the field. This paper utilizes a set of annotated crop images in a soybean field developed by the authors, containing more than 370 highly detailed images annotated for the application of YOLO frameworks. The total number of labeled plants in the images is close to fifty thousand. At the first stage of experiments, we achieved the results generally comparable to those described in the published literature. Further experiments using Bbox segmentation allowed for substantial improvement of these results. A high result of soybean detection on the images obtained from UAVs was achieved.
The developed method of data preparation and training allowed us to surpass the results described earlier [20] (f1 score = 0.93) and to achieve the results obtained using machine vision systems installed on ground robots (f1 score = 0.98). In other words, our proposed and implemented methodology of preprocessing the training set of images allowed us to achieve better results of soybean detection with the help of UAVs and YOLOv8x framework than those known from the literature. The YOLOv8x model used was pre-trained on COCO data images, which do not contain specific images of cultivated plants and weeds. Increasing the set of labeled images can improve the classification and localization of not only useful plants but also all weed classes. The issue of plant detection at subsequent stages of development also remains open. Therefore, in future studies, we plan to
  • Improve the balance of classes in the datasets by increasing the number of weed plant images.
  • Analyze the possibilities of plant detection at the next phases of soybean development.
  • Analyze the dependence of detection quality on the UAV flight altitude and shooting conditions.
  • Increase the set of annotated images by surveying fields in different regions of the country.
  • Apply the described approach to the detection of other cultivated plants growing in Kazakhstan.

Author Contributions

Conceptualization, R.I.M. and V.S.; methodology, R.I.M. and Y.K.; software, V.S.; validation, Y.P., Y.K., V.G. and A.S.; investigation, R.I.M., V.S., L.T. and F.A.; resources, R.I.M., L.T., V.G. and A.O.; data curation, A.S., L.T. and A.O.; writing—original draft preparation, R.I.M., V.S. and Y.P.; writing—review and editing, Y.P., Y.K. and A.S.; visualization, R.I.M., V.S. and F.A.; supervision, R.I.M.; project administration, A.S.; funding acquisition, R.I.M. and V.G. All authors have read and agreed to the published version of the manuscript.

Funding

This research was funded by the Committee of Science of the Ministry of Science and Higher Education of the Republic of Kazakhstan under grants BR24992908 “Support system for agricultural crop production optimization via remote monitoring and artificial intelligence methods (Agroscope)” and BR28713375 “Multipurpose Robotic UAV Platform for Remote Monitoring (AeroScope)”.

Data Availability Statement

Dataset and programming code can be downloaded at https://drive.google.com/drive/folders/1ObZjrP5eW3zO0bZLeIrNd347nKUlgowU (accessed 22 July 2025). Programming code can be downloaded at https://drive.google.com/file/d/12QUGE6c2ZZBCWGwsu4FUvco0dw4cS6d5/view?usp=drive_link (accessed 22 July 2025).

Conflicts of Interest

The authors declare no conflicts of interest.

Appendix A. Abbreviated List of the Main Phases of Soybean Development

Table A1. An abbreviated list of the main phases of soybean development.
No.Name of the Growth Stage Timing
1SeedlingsThe end of the first and beginning of the second week after sowing
2True trifoliate leaf, or trefoil3–4 weeks
32–5 trefoils5 weeks to 10 weeks
4Branching11 weeks
5Flowering12 weeks to 16 weeks
6Formation of beans13–14 weeks to 17–18 weeks
7Seed filling17 weeks to 20 weeks
8Ripening21 weeks to 23 weeks

Appendix B. Drone DJI Mavic Mini 2 Specifications

Table A2. DJI Mavic Mini 2 drone specifications [36].
ParameterMeaning
Takeoff weight<249 g
Diagonal size (without propellers)213 mm
Maximum altitude gain rate5 m/s (S mode); 3 m/s (N mode); 2 m/s (C mode)
Maximum descent rate3.5 m/s (S mode); 3 m/s (P mode); 1.5 m/s (C mode)
Maximum flight speed16 m/s (S mode); 10 m/s (N mode); 6 m/s (C mode)
Maximum tilt angle40° (S mode); 25° (N mode); 25° (C mode) (up to 40° in strong wind)
Maximum angular velocity130°/s (S mode); 60°/s (N mode); 30°/s (C mode) (can be set to 250°/s in the DJI Fly app)
Maximum flight altitude2000–4000 m
Maximum wind speed8.5–10.5 m/s (up to Beaufort 5)
Maximum flight time31 min (at 4.7 m/s in calm weather)
Range of operating temperatures0° to 40 °C
Positioning accuracy in the vertical plane±0.1 m (visual positioning), ±0.5 m (satellite positioning)
Positioning accuracy in the horizontal plane±0.3 m (visual positioning), ±1.5 m (satellite positioning)
Operating frequency2.4–2.4835 GHz
The reconnaissance drone camera specifications are shown in Table A3.
Table A3. DJI Mavic Mini 2 reconnaissance drone camera specifications [37].
ParameterMeaning
Effective number of pixels12 MP
Sensor typeCMOS, 1/2.3″ size
LensField of view: 83°, equivalent to 24 mm (35 mm format); aperture: f/2.8; focus: 1 m to infinity
Shutter speedElectronic shutter, speed: 4–1/8000 sec
ISOVideo: 100–3200 (auto), 100–3200 (manual); photo: 100–3200 (auto), 100–3200 (manual)
Image size4:3: 4000 × 3000; 16:9: 4000 × 2250
Supported file systemsFAT32 (up to 32 GB); exFAT (over 32 GB)
Maximum video bitrate100 Mbps
Supported file formatsPhoto: JPEG/DNG (RAW); video: MP4 (H.264/MPEG-4 AVC)
Supported memory cardsUHS-I Speed Class 3 or higher
Video resolution4K: 3840 × 2160@24/25/30fps;
2.7K: 2720 × 1530 for 24/25/30/48/50/60 fps;
FHD: 1920 × 1080 for 24/25/30/48/50/60 fps.

Appendix C. Image Augmentation Parameters

  • Scaling—slight increase or decrease in the image within the range from 90% to 110%. This helps the model become resistant to changes in the size of objects.
  • Horizontal reflection (Fliplr)—with a 50% probability, the image is mirrored horizontally.
  • Vertical reflection (Flipud)—with a 50% probability, the image is mirrored vertically.
  • Rotate—random rotation of the image within the range from −15 to + 15 degrees. This imitates camera tilts or imperfect shooting.
  • Gaussian blur—adds blur with varying intensity (from none to moderate). Increases the model’s resistance to fuzzy or blurry images.
  • Change brightness/contrast (multiply)—multiplies pixels by a random value from 0.8 to 1.2. Increases the model’s resistance to random changes in lighting conditions.

Appendix D. Classification Quality for Each Class Across All Experiments

Table A4. F1 score of each class for all experiments.
Class Original Dataset (0)Threshold Segmentation (1)Bbox Segmentation and k-Fold Cross-Validation, k = 10) (2)
Glycine max0.9330.9390.984
Amaranthus retroflexus0.6380.8170.942
Convolvulus arvensis0.2400.0290.960
Setaria glauca0.7410.0340.972
Xanthium strumarium0.3970.6190.896
Cirsium arvense0.7770.7750.964
Hibiscus trionum0.0000.3640.582
Abutilon theophrasti0.0000.3640.682
Macro F10.3410.4390.873
Micro F10.8070.8580.959

Appendix E. Classification Errors

Table A5. Top 10 poorly classified photos.
No.FilenameF1 Score MicroImage of Fields. On the Right Is Expert Marking; on the Left Is the Result of Automatic Detection.
1DJI_0497.jpg0.6Drones 09 00547 i001
2DJI_0489.jpg0.791Drones 09 00547 i002
3DJI_0502.jpg0.8Drones 09 00547 i003
4DJI_0214.jpg0.804Drones 09 00547 i004
5 DJI_0316.jpg0.813Drones 09 00547 i005
6DJI_0367.jpg0.827Drones 09 00547 i006
7DJI_0490.jpg0.831Drones 09 00547 i007
8DJI_0182.jpg0.834Drones 09 00547 i008
9DJI_0370.jpg0.836Drones 09 00547 i009
10DJI_0232.jpg0.836Drones 09 00547 i010

References

  1. Dwivedi, A. Precision Agriculture; Parmar Publishers & Distributors: Pune, India, 2017; Volume 5, pp. 83–105. [Google Scholar]
  2. Kashyap, B.; Kumar, R. Sensing Methodologies in Agriculture for Soil Moisture and Nutrient Monitoring. IEEE Access 2021, 9, 14095–14121. [Google Scholar] [CrossRef]
  3. Mukhamediev, R.I.; Symagulov, A.; Kuchin, Y.; Zaitseva, E.; Bekbotayeva, A.; Yakunin, K.; Assanov, I.; Levashenko, V.; Popova, Y.; Akzhalova, A.; et al. Review of Some Applications of Unmanned Aerial Vehicles Technology in the Resource-Rich Country. Appl. Sci. 2021, 11, 10171. [Google Scholar] [CrossRef]
  4. Albrekht, V.; Mukhamediev, R.I.; Popova, Y.; Muhamedijeva, E.; Botaibekov, A. Top2Vec Topic Modeling to Analyze the Dynamics of Publication Activity Related to Environmental Monitoring Using Unmanned Aerial Vehicles. Publications 2025, 13, 15. [Google Scholar] [CrossRef]
  5. Oxenenko, A.; Yerimbetova, A.; Kuanaev, A.; Mukhamediyev, R.; Kuchin, Y. Technical means of remote monitoring using unmanned aerial platforms. Phys. Math. Ser. 2024, 3, 152–173. (In Russian) [Google Scholar] [CrossRef]
  6. Masi, M.; Di Pasquale, J.; Vecchio, Y.; Capitanio, F. Precision Farming: Barriers of Variable Rate Technology Adoption in Italy. Land 2023, 12, 1084. [Google Scholar] [CrossRef]
  7. Ferreira, A.; Freitas, D.; Silva, G.; Pistori, H.; Folhes, M. Weed Detection in Soybean Crops Using ConvNets. Comput. Electron. Agric. 2017, 143, 314–324. [Google Scholar] [CrossRef]
  8. Peteinatos, G.; Reichel, P.; Karouta, J.; Andújar, D.; Gerhards, R. Weed Identification in Maize, Sunflower, and Potatoes with the Aid of Convolutional Neural Networks. Remote Sens. 2020, 12, 4185. [Google Scholar] [CrossRef]
  9. Asad, M.; Bais, A. Weed Detection in Canola Fields Using Maximum Likelihood Classification and Deep Convolutional Neural Network. Inf. Process. Agric. 2020, 7, 535–545. [Google Scholar] [CrossRef]
  10. Quan, L.; Feng, H.; Lv, Y.; Wang, Q.; Zhang, C.; Liu, J.; Yuan, Z. Maize Seedling Detection under Different Growth Stages and Complex Field Environments Based on an Improved Faster R–CNN. Biosyst. Eng. 2019, 184, 1–23. [Google Scholar] [CrossRef]
  11. Suh, H.; IJsselmuiden, J.; Hofstee, J.; van Henten, E. Transfer Learning for the Classification of Sugar Beet and Volunteer Potato under Field Conditions. Biosyst. Eng. 2018, 174, 50–65. [Google Scholar] [CrossRef]
  12. Chechliński, Ł.; Siemiątkowska, B.; Majewski, M. A System for Weeds and Crops Identification—Reaching over 10 FPS on Raspberry Pi with the Usage of MobileNets, DenseNet and Custom Modifications. Sensors 2019, 19, 3787. [Google Scholar] [CrossRef]
  13. Umar, M.; Altaf, S.; Ahmad, S.; Mahmoud, H.; Mohamed, A.S.N.; Ayub, R. Precision Agriculture Through Deep Learning: Tomato Plant Multiple Diseases Recognition with CNN and Improved YOLOv7. IEEE Access 2024, 12, 49167–49183. [Google Scholar] [CrossRef]
  14. Osman, Y.; Dennis, R.; Elgazzar, K. Yield Estimation and Visualization Solution for Precision Agriculture. Sensors 2021, 21, 6657. [Google Scholar] [CrossRef] [PubMed]
  15. Symagulov, A.; Kuchin, Y.; Yakunin, K.; Murzakhmetov, S.; Yelis, M.; Oxenenko, A.; Assanov, I.; Bastaubayeva, S.; Tabynbaeva, L.; Rabčan, J.; et al. Recognition of Soybean Crops and Weeds with YOLO v4 and UAV. In Proceedings of the International Conference on Internet and Modern Society, St. Petersburg, Russia, 23–25 June 2022; Springer Nature: Cham, Switzerland, 2022; pp. 3–14. [Google Scholar]
  16. Dang, F.; Chen, D.; Lu, Y.; Li, Z. YOLOWeeds: A Novel Benchmark of YOLO Object Detectors for Multi-Class Weed Detection in Cotton Production Systems. Comput. Electron. Agric. 2023, 205, 107655. [Google Scholar] [CrossRef]
  17. Sunil, G.C.; Upadhyay, A.; Zhang, Y.; Howatt, K.; Peters, T.; Ostlie, M.; Aderholdt, W.; Sun, X. Field-Based Multispecies Weed and Crop Detection Using Ground Robots and Advanced YOLO Models: A Data and Model-Centric Approach. Smart Agric. Technol. 2024, 9, 100538. [Google Scholar]
  18. Kavitha, S.; Gangambika, G.; Padmini, K.; Supriya, H.S.; Rallapalli, S.; Sowmya, K. Automatic Weed Detection Using CCOA Based YOLO Network in Soybean Field. In Proceedings of the 2024 Second International Conference on Data Science and Information System (ICDSIS), Hassan, India, 17–18 May 2024; IEEE: New York, NY, USA, 2024; pp. 1–8. [Google Scholar]
  19. Tetila, E.C.; Moro, B.L.; Astolfi, G.; da Costa, A.B.; Amorim, W.P.; de Souza Belete, N.A.; Pistori, H.; Barbedo, J.G.A. Real-Time Detection of Weeds by Species in Soybean Using UAV Images. Crop Prot. 2024, 184, 106846. [Google Scholar] [CrossRef]
  20. Li, J.; Zhang, W.; Zhou, H.; Yu, C.; Li, Q. Weed Detection in Soybean Fields Using Improved YOLOv7 and Evaluating Herbicide Reduction Efficacy. Front. Plant Sci. 2024, 14, 1284338. [Google Scholar] [CrossRef]
  21. YOLOv8 Label Format: A Step-by-Step Guide. Available online: https://yolov8.org/yolov8-label-format/ (accessed on 9 April 2025).
  22. CVAT. Available online: https://www.cvat.ai/ (accessed on 9 April 2025).
  23. PlantCV: Plant Computer Vision. Available online: https://plantcv.org/ (accessed on 9 April 2025).
  24. Explanation of All of YOLO Series Part 11. Available online: https://zenn.dev/yuto_mo/articles/14a87a0db17dfa (accessed on 9 April 2025).
  25. COCO Dataset. Available online: https://docs.ultralytics.com/ru/datasets/detect/coco/ (accessed on 9 April 2025).
  26. coco.yaml File. Available online: https://github.com/ultralytics/ultralytics/blob/main/ultralytics/cfg/datasets/coco.yaml (accessed on 9 April 2025).
  27. imgaug Documentation. Available online: https://imgaug.readthedocs.io/en/latest/ (accessed on 9 April 2025).
  28. Mukhamediyev, R.; Amirgaliyev, E. Introduction to Machine Learning; Litres: Almaty, Kazakhstan, 2022; ISBN 978-601-08-1177-5. (In Russian) [Google Scholar]
  29. YOLO Performance Metrics. Available online: https://docs.ultralytics.com/ru/guides/yolo-performance-metrics/#object-detection-metrics (accessed on 9 April 2025).
  30. Bouguettaya, A.; Zarzour, H.; Kechida, A.; Taberkit, A.M. A survey on deep learning-based identification of plant and crop diseases from UAV-based aerial images. Clust. Comput. 2023, 26, 1297–1317. [Google Scholar] [CrossRef]
  31. Zhang, H.; Wang, B.; Tang, Z.; Xue, J.; Chen, R.; Kan, H.; Lu, S.; Feng, L.; He, Y.; Yi, S. A rapid field crop data collection method for complexity cropping patterns using UAV and YOLOv3. Front. Earth Sci. 2024, 18, 242–255. [Google Scholar] [CrossRef]
  32. Nnadozie, E.C.; Casaseca-de-la-Higuera, P.; Iloanusi, O.; Ani, O.; Alberola-López, C. Simplifying YOLOv5 for deployment in a real crop monitoring setting. Multimed. Tools Appl. 2024, 83, 50197–50223. [Google Scholar] [CrossRef]
  33. Sonawane, S.; Patil, N.N. Performance Evaluation of Modified YOLOv5 Object Detectors for Crop-Weed Classification and Detection in Agriculture Images. SN Comput. Sci. 2025, 6, 126. [Google Scholar] [CrossRef]
  34. Pikun, W.; Ling, W.; Jiangxin, Q.; Jiashuai, D. Unmanned aerial vehicles object detection based on image haze removal under sea fog conditions. IET Image Process. 2022, 16, 2709–2721. [Google Scholar] [CrossRef]
  35. Liu, Y.; Wang, X.; Hu, E.; Wang, A.; Shiri, B.; Lin, W. VNDHR: Variational single nighttime image Dehazing for enhancing visibility in intelligent transportation systems via hybrid regularization. IEEE Trans. Intell. Transp. Syst. 2025, 26, 10189–10203. [Google Scholar] [CrossRef]
  36. Consumer Drones Comparison. Available online: https://www.dji.com/products/comparison-consumer-drones?from=store-product-page-comparison (accessed on 9 April 2025).
  37. Support for DJI Mini 2. Available online: https://www.dji.com/global/support/product/mini-2 (accessed on 9 April 2025).
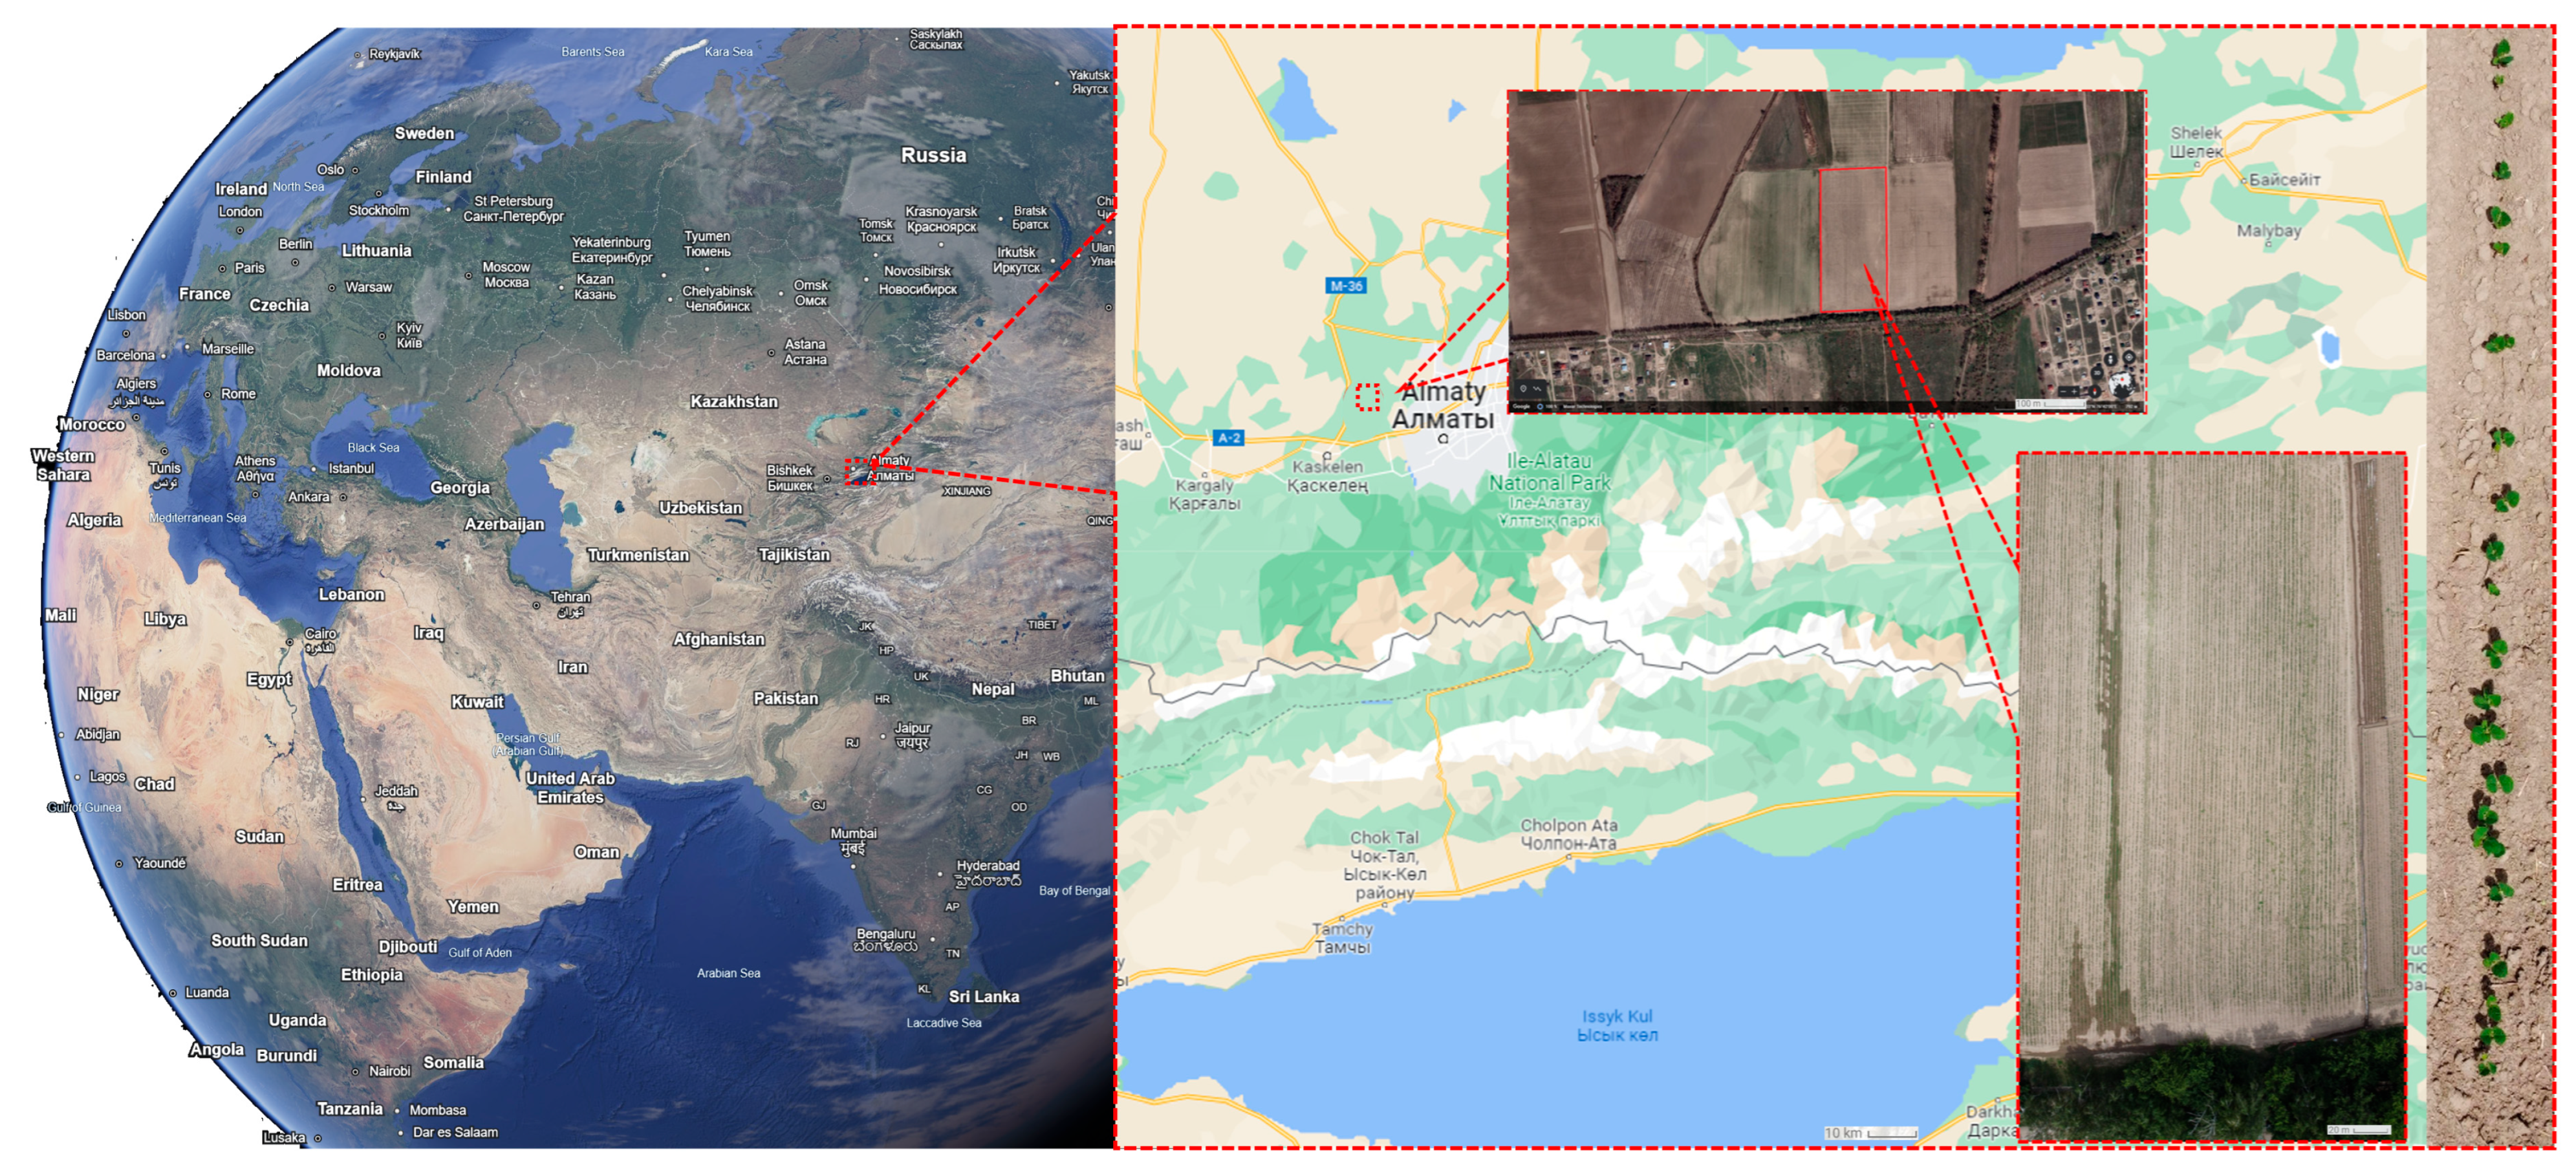
Figure 1. Soybean field in Almalybak village (southeastern Kazakhstan), Almaty district. Bottom right photo of the field from a height of 100 m. On the right edge, there is a photo of individual soybean plants in the first phase of development at a height of 5 m.
Drones 09 00547 g001
Figure 2. Weeds frequently growing in the fields of southern Kazakhstan.
Drones 09 00547 g002
Figure 3. Methodological design of the study.
Drones 09 00547 g003
Figure 4. (a) Image of a soybean field. (b) Annotated image of the field.
Drones 09 00547 g004
Figure 5. (a) Experiment 1. Threshold segmentation using the plantcv library at threshold level 144. (b) Experiment 2. Bbox segmentation. All background outside the Bbox is removed.
Drones 09 00547 g005
Figure 6. Confusion matrix for the original dataset.
Drones 09 00547 g006
Figure 7. Confusion matrix for experiment 1 (threshold segmentation).
Drones 09 00547 g007
Figure 8. Confusion matrix for experiment 2 (Bbox segmentation).
Drones 09 00547 g008
Figure 9. Field images with a white layer overlaid with opacities of 0.3 (left) and 0.7 (right).
Drones 09 00547 g009
Table 1. Metrics for assessing the quality of plant detection.
Metric FormulaExplanation
Classification Indicators [28]
Precision P   =   T P T P   +   F P
where true positive (TP) and true negative (TN) are cases of correct operation of the classifier. Accordingly, false negatives (FNs) and false positives (FPs) are cases of misclassification.
Proportion of true positive predictions among all predicted positive cases.
Recall R = T P T P + F N Proportion of true positive predictions among all actual positive cases.
F1 score
(a harmonic mean)
F 1 s c o r e = 2     P     R P + R A harmonic mean between accuracy and recall.
Localization Indicators
IoU I o U = I n t e r s e c t i o n   a r e a J o i n t   a r e a A measure that quantifies the overlap between the predicted bounding box (usually a rectangle—Bbox) and the true bounding box. It plays an important role in assessing the accuracy of object localization [29].
A P A P = 0 1   P ( R ) d R
where P(R) is accuracy versus recall function.
Average accuracy for one class, calculated as the area under the precision–recall curve.
mAP50 m A P 0.5 = 1 N i = 1 N   A P i 0.5
where
N is the total number of classes and
A P i 0.5 is the mean value of precision (AP) for class i at IoU = 0.5.
The mean value of accuracy across all classes, used to estimate the overall performance of the model.
mAP50–95 m A P 0.50 : 0.95 = 1 N i = 1 N   1 10 j = 0 9   A P i 0.5 + 0.05 j
where
N is the total number of classes and
A P i ( 0.5 + 0.05 j )   is   the   mean   value   of   precision   ( AP )   for   class   i   at   IoU   =   0.5 + 0.05 j .
j is an index taking values from 0 to 9, corresponding to IoU thresholds of 0.5, 0.55, 0.6, …, 0.95.
Mean accuracy averaged over multiple IoU thresholds from 0.5 to 0.95 in steps of 0.05.
Table 2. Characteristics of the original dataset and the datasets prepared in the course of experiments 1 (threshold segmentation) and 2 (Bbox segmentation).
Class Name Decoding of the claSS Name012
0: BedBed245800
1: Glycine maxSoybean42,28241,36842,282
2: Amaranthus retroflexusCommon wheatgrass615538406155
3: Convolvulus arvensisField creeper385304385
4: Setaria glaucaBristle broom18971491897
5: Xanthium strumariumCommon dunnitch513439513
6: Cirsium arvensePink thistle532516532
7: Echinochloa crusgalliChicken millet000
8: Hibiscus trionumHibiscus trifoliate151515
9: Abutilon theophrastiTheophrastus canatum272727
10: Chenopodium albumWhite marmoset000
11: Apera spica-ventiCommon broom, field broom000
Note. 0 is an original dataset without segmentation; 1 is a dataset for experiment 1 (threshold segmentation); 2 is a dataset for experiment 2 (Bbox segmentation).
Table 3. Results of computational experiments for soybean and weed detection.
Training DatasetmAP50mAP50–95RecallPrecisionF1 Score Micro F1 Score MacroF1 Score Glycine Max
Original dataset0.720.30.5990.6770.63560.3410.933
Experiment 1 (threshold segmentation)0.650.3480.6390.7490.68960.4390.939
Experiment 2 (Bbox segmentation and k-fold cross-validation, k = 10)0.9790.9360.9410.9630.9590.8730.984
Note. The best results are highlighted in bold.
Table 4. Results of computational experiments for different opacity levels.
Opacity LevelF1 Score Micro
00.959
0.10.85
0.20.852
0.30.853
0.40.828
0.50.841
0.60.805
0.70.78
0.80.635
0.90.272
Disclaimer/Publisher’s Note: The statements, opinions and data contained in all publications are solely those of the individual author(s) and contributor(s) and not of MDPI and/or the editor(s). MDPI and/or the editor(s) disclaim responsibility for any injury to people or property resulting from any ideas, methods, instructions or products referred to in the content.