Abstract
This study investigates the optimization of urban parcel delivery by integrating logistics vehicles and onboard drones within a static road network. A centralized delivery hub is responsible for coordinating both modes of transport to minimize total vehicle operation costs and customer waiting times. A simulation-based framework is developed to accurately model the delivery process. An enhanced Ant Colony Optimization (ACO) algorithm is proposed, incorporating a multi-objective formulation to improve route planning efficiency. Additionally, a scheduling algorithm is designed to synchronize the operations of multiple delivery bikes and drones, ensuring coordinated execution. The proposed integrated approach yields substantial improvements in both cost and service efficiency. Simulation results demonstrate a 16% reduction in vehicle operation costs and an 8% decrease in average customer waiting times relative to benchmark methods, indicating the practical applicability of the approach in urban logistics scenarios.
1. Introduction
The exponential growth of e-commerce and the increasing demand for rapid and reliable delivery services have significantly reshaped the urban logistics landscape [1,2]. However, conventional logistics methods are facing mounting challenges in meeting the heightened expectations for speed, efficiency, and sustainability [2]. In response, the integration of advanced technologies—such as unmanned aerial vehicles (UAVs), commonly known as drones—with traditional ground-based logistics systems has emerged as a promising solution to enhance delivery performance and reduce operational costs [3]. This hybrid delivery paradigm leverages the complementary strengths of logistics vehicles and drones, offering a novel approach to address critical urban logistics issues, including traffic congestion, last-mile delivery inefficiencies, and environmental impact [4]. The concept of drone-assisted last-mile delivery has gained substantial traction in recent years, with various studies demonstrating its potential to reduce both delivery time and costs [4,5]. Nevertheless, the standalone deployment of drones presents limitations, such as restricted payload capacity, limited flight range, and regulatory constraints. To overcome these challenges, the integration of drones with ground logistics platforms—including electric vehicles (EVs), light-duty trucks, and micro-mobility solutions—has been proposed as a viable alternative [5].
Given the complexity of coordinating such multi-modal systems, advanced optimization algorithms are essential for enabling efficient collaborative routing. These algorithms ensure cost-effectiveness, operational efficiency, and scalability in urban delivery networks. Among them, Particle Swarm Optimization (PSO) is a population-based metaheuristic inspired by the social behavior of birds and fish. It optimizes delivery routes by iteratively updating particle positions based on personal and global best solutions, balancing exploration and exploitation in the solution space [6,7].
Similarly, Ant Colony Optimization (ACO) models the foraging behavior of ants, where artificial pheromone trails guide the search for optimal routes. Genetic Algorithms (GAs) apply evolutionary principles—selection, crossover, and mutation—to evolve high-quality solutions across generations [8]. Dijkstra’s Algorithm, a classical shortest-path method, is used to precompute the optimal paths between nodes in a road network and serves as a foundation for integrating UAV and vehicle routes in collaborative routing. Simulated Annealing (SA), inspired by the metallurgical annealing process, is applied to escape local optima and further refine solutions for minimizing vehicle operation costs and customer waiting times [6].
Despite the advantages of this hybrid delivery model, its practical implementation poses significant challenges. A primary concern is the efficient coordination and scheduling of delivery routes for both drones and logistics vehicles, which must balance time-sensitive deliveries with operational cost constraints [5,9]. Effective planning requires optimization algorithms that can accommodate factors such as vehicle load capacities, drone endurance, delivery deadlines, and real-world urban network conditions. While algorithms like ACO and K-means clustering have been widely applied in logistics optimization tasks, their adaptation to collaborative, multi-modal delivery systems remains limited in the literature [8,10]. Several constraints further complicate this integration. The limited flight radius and battery endurance of UAVs necessitate frequent returns to the host vehicle for recharging and parcel collection [11]. Moreover, the time and cost for a ground vehicle to traverse two different roads of equal length can vary significantly due to traffic conditions and road quality [11,12]. These dynamic factors also influence the synchronization between drones and their host vehicles. As such, it is essential to simulate realistic urban road conditions to accurately model and optimize the collaborative delivery process. Figure 1 illustrates the architecture and operational model of UAV-supported urban logistics systems [5].
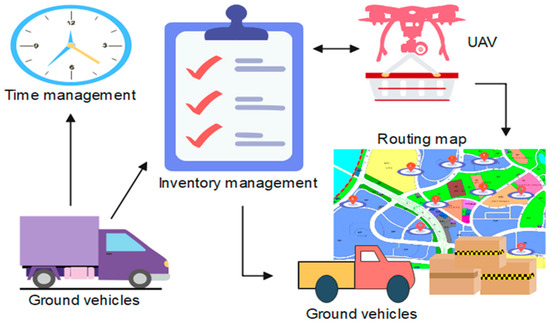
Figure 1.
Scheduling and routing for UAV-supported logistics [5].
This study proposes an integrated optimization framework for a collaborative parcel delivery system that combines logistics vehicles with onboard drones. The research focuses on optimizing delivery operations within a static urban road network, where multiple vehicles and drones jointly serve a predefined set of customer locations. A multi-objective optimization model is formulated to simultaneously minimize vehicle operation costs and customer waiting times. To solve this problem, an enhanced Ant Colony Optimization (ACO) algorithm is developed, tailored to the specific requirements of synchronized multi-modal delivery.
To ensure coordinated execution between drones and logistics vehicles, a co-planning algorithm is introduced. This algorithm facilitates the synchronized routing and scheduling of both modes, allowing for efficient task allocation and route alignment. The effectiveness of the proposed framework is evaluated through comprehensive simulation experiments.
Results indicate that the integrated approach achieves a 16% reduction in driving costs and an 8% reduction in customer waiting times compared to conventional delivery strategies, underscoring its practical potential for real-world implementation. This research contributes to the field of logistics optimization by introducing a novel framework that exploits the complementary capabilities of ground vehicles and aerial drones. By addressing key challenges in collaborative routing and task coordination, the study lays a foundation for developing more efficient, scalable, and sustainable urban logistics systems.
Future research will extend this framework to dynamic environments, incorporating real-time traffic data and adaptive optimization techniques to further enhance responsiveness and operational robustness.
2. Related Study
Last-mile logistics refers to the final stage of the delivery process, wherein packages are transported from the nearest distribution or sorting center to the end customer, completing the door-to-door service cycle [12,13]. This stage plays a critical role in customer satisfaction and operational efficiency. Importantly, logistics costs remain a major factor in production and supply chain management. Last-mile delivery is a substantial cost driver within the logistics sector.
Global data indicate that in 2023, logistics expenditure reached approximately USD 80 billion, with last-mile transportation accounting for nearly 50% of the total cost. As shown in Figure 2, Pakistan’s logistics sector has experienced steady growth over the past eight years, expanding from an estimated USD 4.8 billion in 2015 to around USD 8.2 billion in 2023, reflecting a compound annual growth rate (CAGR) of approximately 6.38% [14]. According to the China Federation of Logistics and Purchasing, China’s total logistics cost in 2022 was approximately CNY 13 trillion, marking a 7.1% year-on-year increase and representing 14.7% of the country’s GDP [14,15]. Notably, last-mile logistics comprises more than 30% of the total logistics expenditure, underscoring its significance and the pressing need for cost reduction. As a result, optimizing last-mile delivery has become a focal point for both researchers and logistics enterprises. In Pakistan, efforts to modernize last-mile logistics through drone technology are gaining momentum. For instance, in June 2021, Careem launched a drone delivery pilot in Lahore and Karachi, aiming to evaluate the feasibility of UAV-based food delivery [15]. Similarly, Foodpanda conducted trials using Vertical Take-Off and Landing (VTOL) drones as part of their initiative to enhance delivery efficiency and reduce operational costs in urban settings [15,16].
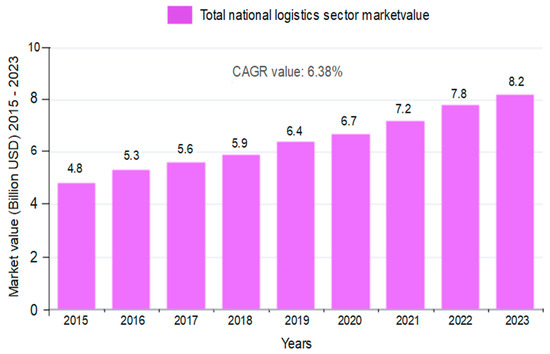
Figure 2.
Graph of Pakistan’s total social logistics over the last eight years.
Academic institutions in Pakistan have also contributed to this field by developing drone-based delivery systems. These research projects focus on integrating technologies such as the Robot Operating System (ROS) and GPS-based navigation to create secure and precise autonomous delivery solutions [16,17]. The potential for drone deployment in last-mile logistics is considerable. By automating deliveries, UAVs could significantly reduce operational costs and increase delivery speed. A notable example is the strategic partnership announced on 16 May 2018, between Sinotrans DHL International Express Co., Ltd. and EHang Intelligent in Guangzhou. The collaboration resulted in the release of China’s first fully automated intelligent drone logistics solution, marking the commercial launch of drone-based delivery services [17,18].
In the Analysis Report on the Business Model and Development Trend of Pakistan’s Logistics Industry, the integration of drone technology into last-mile logistics is explicitly identified as a key component of the next generation of intelligent logistics systems [19,20]. This highlights the substantial commercial potential and application value of unmanned aerial technologies within the logistics domain.
Last-mile delivery serves as the final and most customer-facing stage in the urban logistics process. The quality and efficiency of this segment have a direct impact on customer satisfaction [20]. Human factors, such as inconsistency in delivery personnel performance, may adversely affect customer experience. In contrast, the use of coordinated logistics vehicles and drones enables more precise and timely deliveries, which can significantly enhance customer satisfaction and service reliability.
Globally, the development of drone-related technologies and products has attracted considerable attention from both academia and industry [21]. In Pakistan, notable players in the drone ecosystem include companies such as DroneTec, AZNavTeq, Agritronics Private Limited, DJI, and EHang. Emerging contributors, such as the NUST Robotics Group and Techwards, are also actively engaged in drone research and innovation [20]. According to the Consumer Electronics Association, global sales of civilian drones reached 400,000 units this year, an increase of 55% over the previous year—with the market value rising to approximately USD 1 billion. While drone applications have traditionally focused on single-unit use cases such as aerial photography, agriculture, surveillance, and exploration [20,21], their potential in logistics and distribution is increasingly being recognized.
Currently, the collaborative use of logistics vehicles and drones for parcel delivery remains an emerging and underexplored field. The development of planning algorithms for coordinated delivery involving multiple drones and vehicles is critical to achieving systematic, efficient logistics solutions [22]. Compared to traditional vehicle-only delivery methods, collaborative algorithms significantly reduce both total delivery time and transportation cost. Empirical studies and simulations have demonstrated that the incorporation of drones in last-mile logistics can effectively lower delivery costs. With drone technology becoming increasingly mature, the feasibility of integrated drone–vehicle logistics systems is improving. This study introduces a collaborative delivery framework that coordinates drones and logistics vehicles to perform optimized parcel distribution tasks [23]. For a specified delivery area, a path optimization algorithm is implemented at the theoretical level to coordinate the routes of both drones and vehicles. Compared to conventional delivery approaches, this method achieves meaningful reductions in overall cost and delivery time. These results offer valuable theoretical insights and practical guidance for the future design and deployment of collaborative urban logistics systems.
3. Ant Colony Algorithm
ACO was developed by Italian researcher Marco Dorigo [7]. It generalizes previous algorithms under a unified metaheuristic framework, providing an abstract and standardized description for solving complex optimization tasks. ACO is particularly effective for addressing combinatorial optimization problems due to its adaptability and positive feedback mechanism [7]. The core principle of ACO is inspired by the foraging behavior of real ants, which rely on pheromone trails to communicate and identify efficient paths to food sources. Ants deposit pheromones along their paths, and the intensity of these trails influences the probability of path selection by other ants, reinforcing shorter and more optimal routes through positive feedback [7]. As illustrated in Figure 3, ants traversing Path B reach the food source more quickly and deposit a higher concentration of pheromones within the same timeframe. This feedback mechanism causes subsequent ants to favor Path B, ultimately converging on Path B as the shortest and most efficient route.
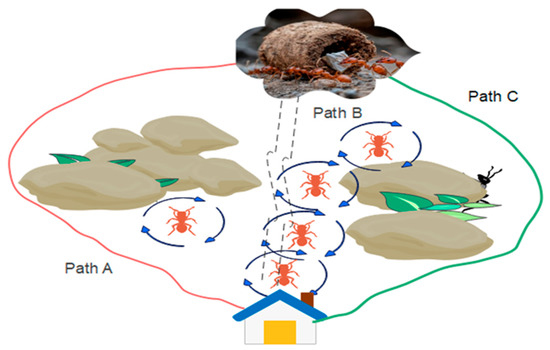
Figure 3.
Ant foraging paths.
ACO is the optimal solution to solve large-scale TSP problems. There are two main steps in the process of artificial ACOs, ath building and information updates. The similarities between artificial and natural ant colonies are shown in Table 1 below.

Table 1.
Artificial and natural ACOs.
ACO enhances both the path construction and pheromone update mechanisms to improve solution quality and convergence speed [7]. The Ant Colony System (ACS), a refined variant of ACO, operates based on following rules:
Pseudo-Random Proportional Rule: This rule governs the selection of the next node (e.g., city) during path construction. It strikes a balance between exploitation (intensifying search around the best-known paths) and exploration (searching new paths) by selecting the next node probabilistically.
Improved ACO with Two-Objective Optimization
In the ACO algorithm, the primary objective is to minimize the total driving distance. Accordingly, the pheromone evaporation and updating mechanisms are designed to reinforce shorter routes over time [7,16]. However, in practical urban logistics scenarios, minimizing distance alone is insufficient, as both travel cost and time cost significantly affect delivery efficiency and service quality. To address this, the proposed improved ACO algorithm introduces a multi-objective optimization framework that simultaneously considers driving cost and time cost. These two factors are incorporated using influence coefficients and linear weighting to construct a comprehensive cost function. Consequently, the transition probability calculation between nodes is also modified to account for this dual-objective structure, with parameters introduced to balance the relative impact of cost and time.
In conventional ACO, the transition probability for selecting the next node is typically computed based on pheromone intensity and visibility, where visibility is defined as the inverse of the static Euclidean distance between two nodes (see Equation (1)). This definition aligns with the traditional objective of minimizing distance.
This study redefines the visibility term to reflect both driving cost and time cost, resulting in a more realistic representation of urban delivery conditions. The revised visibility formulation is presented in Equation (2), supporting a more effective and balanced path selection process under the proposed multi-objective optimization strategy.
In the Equation (1), (t) is the probability that an ant k will move from node i to node j at time t. are the information degree concentration factor and the importance degree parameter on the path i to j, respectively. are the distance factor of path i, j and its importance parameter, respectively. is the next set of nodes to be selected. In the calculation formula, represent, respectively, the cost of driving and the weighting factor of customer satisfaction. is the requested arrival time representing point j.
With the revised visibility calculation, the time cost and its corresponding weight coefficient are incorporated into the transition probability function. As a result, when an ant selects the next node, the decision is guided by the minimization of a composite cost function, which combines both driving cost and time cost. This encourages the selection of routes that represent the optimal trade-off between time and expense rather than purely minimizing distance. As pheromone trails are iteratively updated through evaporation and reinforcement, the algorithm gradually converges toward a path that minimizes the overall comprehensive cost. This comprehensive path reflects a more realistic and cost-effective route for logistics vehicle travel in urban delivery scenarios.
The structure of the improved ACO algorithm, adapted for solving the logistics vehicle routing problem under multi-objective constraints, is detailed in Algorithm 1.
| Algorithm 1: Improved ACO to solve logistics vehicle travel path |
| Input: Road network information matrix G, express time limit requirements, penalty coefficient. Output: Logistics vehicle travel path. 1: Initialize the parameters. The initial position of m ants is randomly distributed in each heavy component point. The first : To nullify, set the algebraic counter Nmax ← 300; pathway initial concentration P ← 1; information heuristic factor α ← 2; expectation heuristic factor β ← 5; the rate of evaporation of pheromone p to 0.1; and substitute the road network information matrix G into the distance table. 2: Randomly select the starting point s to join . 3: Set the current point of the logistics vehicle as w, and the next node set to be selected as . 4: For each point j in the next set of nodes to be selected, calculate the transfer probability, (t); select the next node j using roulette. . Update the paths added to the tab with local information until all heavy-duty points are added to a tab. 5: Judge whether the number of ants traversing the week has reached m, and if it has not reached it, perform step 2; otherwise, perform step 6. 6: Once the m-only ant colony solution is completed, seek the optimal path in the current round for global signaling update. The updated Equations are shown below: 7: Determine whether the cycle number n reaches 300, then implement step 8; otherwise, implement step 2. 8: Choose the global optimal solution according to the optimal solution of each round, export the logistics vehicle, and exit. |
This study has solved the driving path of a logistics vehicle with the aim of obtaining a reasonable driving sequence, so that the value of cost is minimal among them, The point of departure is , and refers to the number of heavy points.
The problem is formulated as a multi-objective optimization task, which is NP-hard in nature. Without proving NP = P at present, it is not possible to find an optimized algorithm to solve this problem in polynomial time, so this paper uses an improved ACO algorithm to find an approximate optimized solution to the problem.
Heuristic algorithms are employed to solve the logistics vehicle routing problem, which is recognized as a typical NP-hard problem. Due to its computational complexity, finding an exact optimal solution is impractical for large-scale instances. Instead, heuristics provide approximate solutions that are computationally efficient and sufficiently close to the optimal solution for practical purposes. These methods offer a favorable trade-off between solution quality and computational cost in terms of time and space.
As illustrated in Figure 4, the logistics vehicle begins its route from Point 1 and must visit four additional delivery points. Each of these points is subject to specific time constraints, and penalties are imposed if deliveries exceed the allotted time limits. The objective is to determine a delivery route that minimizes the total cost, which includes both travel time and penalty costs associated with time window violations.
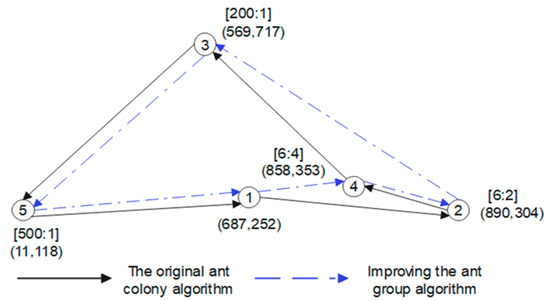
Figure 4.
The difference between improved ant colonies and traditional ACOs.
In this scenario, Point 1 represents the express distribution center and does not have any time window constraints. Points 2 and 4 share the same latest allowable arrival time, which is set at unit 4 time; however, Point 4 carries a higher penalty coefficient for exceeding this time limit. Points 3 and 5 have more relaxed delivery time constraints, and no penalties are incurred for late arrivals at these locations.
The logistics vehicle is assumed to travel at a constant speed of 20 units. The relative importance of driving cost and delivery time is represented by a ratio of 1:20, indicating that delivery time has a significantly higher impact on the objective function.
To evaluate the effectiveness of the proposed optimization strategy, both the traditional ACO and the improved ACO algorithms are applied to determine the optimal driving route for the logistics vehicle. The improved ACO, which considers both driving cost and time cost in its multi-objective formulation, produces the following optimized route:
A: . The logistics travel path obtained by the traditional ACO is the route B: .
It is shown that route B is the shortest distance, and route A has a greater sum of distances than B. However, due to the low speed of the logistics vehicle, there will be a delivery timeout at both times of delivery. Therefore, for the optimization of comprehensive costs, the improved ACO selects a fourth delivery point with a high penalty factor to prioritize, thus avoiding greater penalty time costs. The overall cost of route A is 2826.22. The combined cost of route B is 3012.02. − = 185.8. From this result, route A obtained by the improved ACO has a smaller overall cost, so it illustrates the optimization effect of the improved ACO.
4. Proposed Study
4.1. Road Network Construction
The concept of a direct road, as referenced earlier, is defined by four key elements: a starting intersection, ending intersection, path length, and congestion degree coefficient [23]. To account for real-world traffic conditions, the actual path length is adjusted by multiplying it by the congestion degree coefficient, yielding the equivalent path length. This adjusted value is used in calculating the optimal meeting point between the drone and the ground logistics vehicle.
Accordingly, constructing the actual road network for simulation purposes requires only the definition of direct roads and their connectivity. To closely approximate the characteristics of a real urban road system, a grid-based road network construction algorithm is introduced. This approach simplifies the modeling process while preserving essential spatial and connectivity features.
As illustrated in Figure 5, the actual road network is represented as a traffic graph composed of intersecting and converging road segments, reflecting the structural complexity of real-world urban transport systems [6].
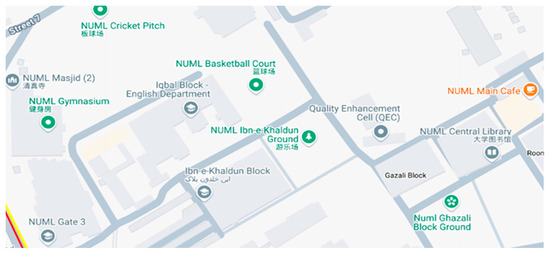
Figure 5.
An illustration of the actual road network around NUML University, Islamabad, Pakistan.
4.2. Road Network Construction Algorithm
To simulate urban transportation as accurately as possible, this study evaluates two different road network construction algorithms [6].
The first method involves randomly generating node locations (representing intersections) and then constructing edges between them based on a proximity or connectivity rule. This approach aims to emulate the irregular structure of real-world road networks.
The second method begins by generating a central node and then incrementally adding connection edges in a structured manner, expanding outward to form a grid-like network. This approach provides a more regular and uniform representation of an urban road system.
For the purposes of the simulation experiments in this study, both methods were considered, and a road network was constructed based on these principles to evaluate the performance of the proposed logistics and drone coordination framework (Algorithm 2).
| Algorithm 2: Generate road network and road network information |
| Input: Boundary limit parameters. Output: Intersection point set, road network information matrix. 1: Select the baseline, set the upper and lower boundaries and the left and right boundaries, and set the road level. 2: Randomly select several points with the right expansion set V = [1] and the edge set E = [1]. 3: Process the points in a cluster. 4: If the current point is n, the coordinates () are not processed; the nearest point above this point is (), the nearest subpoint is (), the upper critical point is (), and the lower boundary is (). According to the slope relationship between the upper and lower points and the processing points and the limit of the upper and lower boundary points, a new point is randomly generated: (), num + +. V = V ∪ point. 5: If this condition is not met, exit the current recursion. 6: Randomly generate a road congestion degree coefficient u, connect the new point and (), and generate a new side e: (n, num, path length ). distance[n][point] ←. E ← Eue. 7: If the new point () exceeds the boundary, exit the current recursion. 8: If not, add the new point to the point set, and return to step 3. |
In Algorithm 1, in the 1000 × 1000 matrix, first, several points are randomly selected on the baseline as a left-expanded cluster and a right-expanded set of points. Then, the left and right clusters are joined separately to form the left baseline and the right baseline until the boundary is reached to form the resulting simulated road network. After running the above algorithm, a relatively reasonable simulated road network can be obtained, as shown in Figure 6.
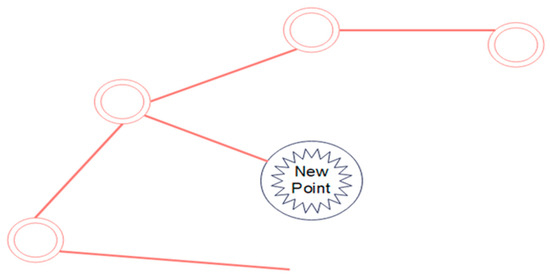
Figure 6.
One of the scenarios in which the generated point is expanded to the right.
Requirements:
To simulate urban transportation as accurately as possible, this study evaluates two different road network construction algorithms [6].
The first method involves randomly generating node locations (representing intersections) and then constructing edges between them based on a proximity or connectivity rule. This approach aims to emulate the irregular structure of real-world road networks.
The second method begins by generating a central node and then incrementally adding connection edges in a structured manner, expanding outward to form a grid-like network. This approach provides a more regular and uniform representation of an urban road system.
For the purposes of the simulation experiments in this study, both methods were considered, and a road network was constructed based on these principles to evaluate the performance of the proposed logistics and drone coordination framework.
4.3. Path Storage and Solving
The road network information is obtained in Algorithm 1, and represented by a weighted graph G (V, E). Where the node set V = [1], Q is the total number of intersection points. E = [1] represents the equivalent path length of the direct path from node i to node j.
For ground logistics vehicles, routing must be planned over an actual road network, considering the spatial distribution of designated delivery points, referred to as heavy points. To minimize driving costs, the objective is to determine the shortest driving path between these points based on the road network’s structure and traffic conditions [6]. This involves calculating both the shortest path length and the actual driving route between each pair of heavy points.
The shortest path length is defined as the sum of the equivalent path lengths—adjusted for congestion—along the optimal route between two nodes. This information serves as a critical input to the improved Ant Colony Optimization (IACO) algorithm, which determines the optimal sequence in which the logistics vehicle should visit the heavy points.
In addition to optimizing vehicle routing, calculating the actual driving path is essential for coordinating drone operations. Since drone tasks are planned relative to the logistics vehicle’s route, knowing the vehicle’s precise path allows for accurate flight path planning, as well as determination of the convergence and separation points in the drone–vehicle collaborative delivery model.
To facilitate these computations, a weighted graph representing the road network must first be initialized. The Floyd algorithm is then used to compute the shortest path and corresponding path length between every pair of nodes, forming the basis for both logistics vehicle route planning and drone coordination.
In Algorithm 3, the shortest distance between any two points can be obtained, and for any two points i, j, the first point in the shortest path from i to j can be stored. By recursively solving this problem, we can obtain a specific path between any two points. The time complexity of this algorithm is 0 (); the time complexity is greater, but because this is the preparation process for the simulated scene, it is still within the acceptable range.
| Algorithm 3: Combine the Floyd algorithm to solve the storage of the shortest path length and shortest paths between any two points |
| Input: Collection of intersection points V, direct road information E. Output: Shortest path length and shorter paths among any two points. 1: path[i][j] ← j, distance[i][j] ← . 2: For k ← 1 to Q Do. 3: For i ← 1 to Q Do. 4: For j ← 1 to Q Do. 5: if distance[i][j] > distance[i][k] + distance[k][j]. 6: distance[i][j] ← distance[i][k] + distance[k][j]. 7: path[i][j] ← path[i][k]. |
In Algorithm 4, since the pointing (predecessor) information has already been stored during the execution of Algorithm 3, only a single-pass recursion is required to retrieve both the shortest path length and the corresponding shortest path between any two nodes. This enables efficient retrieval of optimal routes across the network.
| Algorithm 4: Solve the shortest path and shortest distance between two points |
| Input: Node number a, b; Empty array A [1: ∞] Output: The shortest path length, the sum between intersection point a and intersection point b, the shortest path A [N]: 1: Sum ← 0; 2: N ← 0; 3: While a! = b Do; 4: Sum ← Sum + 1; 5: N ← N + 1; 6: A[N] ← a; 7: a ← path[a][b]; 8: Output Sum, and A [N]. |
This process supports the improved ACO algorithm by providing the necessary input to determine the optimal visiting sequence.
4.4. Regional Segmentation Labeling
The preprocessing algorithm for regional segmentation, as described in this section, is designed to address several challenges encountered in urban delivery scenarios.
In real-world urban environments, the spatial distribution of express delivery points varies significantly due to differences in land use. For example, delivery points are typically clustered in office complexes, residential neighborhoods, and commercial areas, whereas they are more sparsely distributed in open areas such as parks, squares, or along main roads. In the context of this study, express delivery points also vary in terms of urgency coefficients and time window constraints, which influence the priority levels assigned to different regions.
Furthermore, in regions with a high density of delivery points (referred to as heavy points), the complexity of the logistics vehicle routing problem increases substantially. To address this, it becomes necessary to cluster delivery points within a region. This clustering step helps to reduce the computational complexity of the vehicle routing problem and provides structure for more effective route planning.
Figure 7 illustrates the spatial distribution of delivery points in the vicinity of NUML University, Islamabad, Pakistan, serving as a representative urban case.
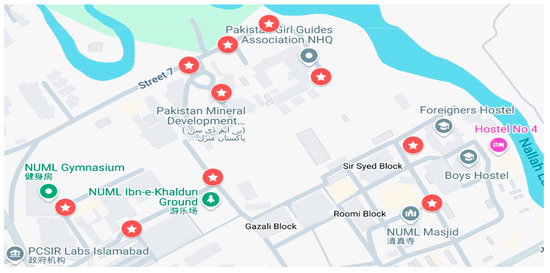
Figure 7.
Distribution of delivery points around NUML University Islamabad, Pakistan.
To address the challenges, this study employs a region-based clustering strategy that includes the separation of light and heavy delivery zones, combined with a constrained K-means iterative clustering algorithm. This approach partitions the delivery space effectively, balancing cluster sizes and regional delivery priorities.
The proposed clustering and preprocessing workflow are illustrated in Figure 8.
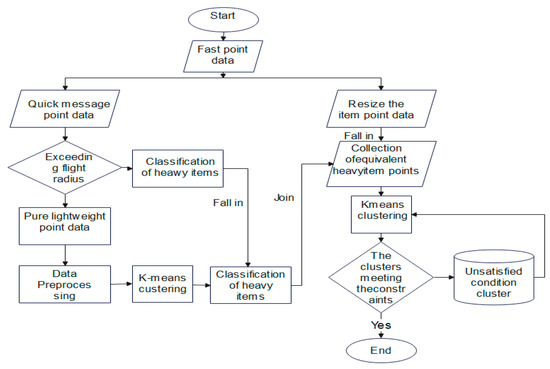
Figure 8.
Proposed algorithm.
5. Drone–Logistics Vehicle Co-Planning Algorithm
5.1. Collaborative Algorithm Analysis
Studies on drone–ground vehicle collaborative planning have predominantly focused on areas such as communication protocols, information fusion, and system-level coordination [7]. However, the application of such collaboration to the vehicle routing problem (VRP) remains relatively underexplored.
To address the last-mile parcel delivery problem by formulating approach is a Mixed-Integer Linear Programming (MILP) model [7]. In this model, the relationship between the drone and the logistics vehicle at each delivery point is reduced to a binary decision variable (0–1), and the primary objective is to minimize delivery time. A heuristic algorithm is then can be employed to derive feasible flight and driving routes for the drone and the logistics truck, respectively.
Limited Problem Scope and Single Objective:
The problem size is fixed and does not scale with practical complexity. The model focuses solely on minimizing delivery time, which fails to reflect the multi-objective nature of practical distribution scenarios. In applications, objectives such as customer satisfaction, vehicle utilization, delivery efficiency, and driving cost must be considered simultaneously.
Low Flexibility and Poor Scalability:
The problem formulating such as MILP simplifies certain aspects, it limits adaptability. Once constraints and decision variables are defined, the solution is tailored to a specific scenario. Changes in fleet composition, such as an increase in the number of drones, require redefinition and re-solving of the MILP model, which is computationally inefficient.
Inadaptability to Dynamic Environments:
This method is designed for static road networks and lacks mechanisms to handle practical disruptions such as road blockages or drone failures. The problem model proposed in this study supports dynamic reconfiguration. If road congestion occurs, the logistics vehicle can reselect its driving route; similarly, in the case of drone malfunction, tasks can be reassigned and the delivery plan recalculated for both vehicles and drones.
Precision vs. Practicality:
The MILP-based approach enables the use of mature solvers such as CPLEX, GLPK, and lpsolve, which can produce precise and optimal results. However, this precision comes at the cost of model flexibility and overlooks important operational details, limiting its applicability to practical logistics scenarios.
Figure 9 illustrates the MILP-based model and the collaborative delivery intentions between UAVs and ground vehicles.
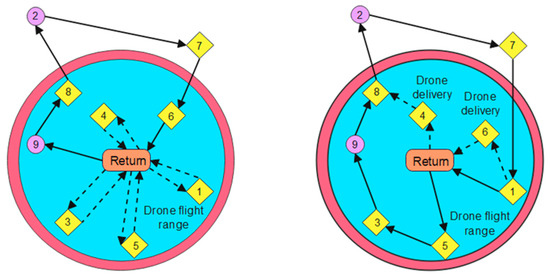
Figure 9.
MILP application and UAV–vehicle cooperative flight intention.
5.2. A Drone Flight Path Planning Algorithm
The interesting characteristics of UAV ground collaboration introduce several specific constraints and considerations:
Heterogeneous Mobility Modes:
The UAV, operates in three-dimensional space and travels along linear paths between points., The primary vehicle, the ground-based logistics truck, must travel along an actual road network, where its travel time is influenced by road distance and congestion coefficients.
Drone Endurance and Dependency:
Due to limited flight endurance, the UAV must return to the logistics vehicle for recharging after completing a delivery task. Consequently, each UAV flight path must be planned in coordination with the driving route of the logistics vehicle. The UAV can only depart and land at points located on the vehicle’s path, reinforcing the need for tightly coupled planning between the two modes.
Drone Payload Constraints:
In the preprocessing stage, this threshold is used to classify delivery points as lightweight, ensuring that each such point’s package weight does not exceed the drone’s capacity. Depending on the UAV’s endurance, it may be capable of serving multiple lightweight delivery points in a single sortie.
Dynamic Task Allocation Based on UAV Availability:
To minimize the waiting time of the logistics vehicle and maximize UAV utilization, optimal take-off and landing points are assigned for each delivery. The planning algorithm must support dynamic task reassignment, adapting UAV flight plans in real time to achieve an efficient balance between logistics vehicle scheduling and UAV deployment.
In Figure 10, which is depicting the logistics vehicle and UAV coordinated transport, the logistics vehicle is traveling along an actual road on the ground, and the driving trajectory is A B C. During this process, the drone completes the fast delivery mission at seven light goods points along the route, from 1 to 7. When the number of drones is greater than or equal to 2, within the constraints of the endurance radius and maximum payload of the drones, the delivery of express points, the cost of drone flight, the waiting time of logistics vehicles, and other factors are taken into account, and it is planned that the drones will make three flights: 1: car 1 car; 2: car 5 6 7 car; and 3: car 2 3 4 car. The best take-off point and rendezvous point for each flight are calculated.
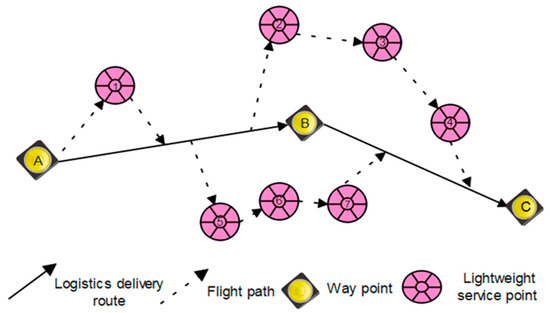
Figure 10.
Coordinated transport when the number of drones is 2.
In the case where only one drone is available, a scheduling conflict may arise during the execution of the third flight task. Specifically, if the logistics vehicle reaches the optimal take-off point for the third task before the drone has returned from its previous mission, the vehicle is forced to pause and wait for the drone to land. This waiting period delays subsequent deliveries, increasing the overall delivery time for all assigned express points.
To mitigate this delay, the drone’s flight schedule must be dynamically adjusted. In this scenario, the second flight task’s take-off point is advanced, allowing the drone to complete its task and return earlier—at the expense of a slightly longer flight path and higher drone energy cost. By doing so, the third flight task can be launched immediately upon the drone’s return at Point 2, without requiring the logistics vehicle to stop unnecessarily.
Additionally, to further optimize the delivery timeline, the landing point of the third flight task is adjusted—based on the logistics vehicle’s current speed, road congestion level, and the drone’s endurance constraints. These adjustments aim to synchronize drone landings with the vehicle’s movement as closely as possible.
The total flight distance after all adjustments must remain within the drone’s maximum endurance range. If necessary, this constraint can be met by allowing minimal waiting time for the logistics vehicle at specific points. The revised coordination of the drone’s three flight tasks is illustrated in Figure 11.

Figure 11.
Coordinated transport when the number of drones is 1.
The specific UAV flight path planning algorithm in this paper is shown in Algorithm 5.
| Algorithm 5: Calculate the flight path of the UAV on the light point |
| Input: GV driving order, the number of UAV, light point collection light = ; Route Network Information Matrix G (). Output: Flight paths of all light points in the UAV pair area. 1: Initially, according to the GV driving order, call Algorithm 2 and Algorithm 3 to get the GV-specific driving path, A [N] = . 2: Light traversal, for each element in the light for the nearest direct path from e = . The distance is d. Set the nearest point on the road e to as the landing point of the UAV end. 3: Calculate the take-off point and landing point of the UAV for each light point. Determine the departure point . Start satisfies the following equation: = (straight line distance to start) fls = (start of the road distance) 4: Sort according to the take-off and landing points of the lightweight points. 5: If the combined weight of the adjacent lightweight points is less than the maximum load of the drone, the flight routes of the two are combined. Merge strategy is as follows: 6: for i ← 1 to | light | −1. |
Upon completion of all delivery tasks, the flight routes of the drone and the delivery times at each lightweight delivery point are recorded. At this stage, the system calculates the following performance metrics:
- The customer waiting time cost, based on the time, elapsed between dispatch and successful delivery at each point.
- The driving cost incurred by the logistics vehicle throughout the delivery route.
- The flight cost associated with the drone’s operations, considering both distance and number of sorties.
Once all deliveries are completed, the logistics vehicle collects the drone(s) and returns to the central distribution hub, marking the end of the parcel delivery process.
Figure 12 illustrates the complete flight route flow of the drone within the collaborative delivery framework.
Figure 12.
Drone flight route flow.
6. Results and Discussion
The speed of the logistics vehicle, the speed of the UAV, and the penalty coefficient are all closely tied to the delivery time constraints of each parcel. In the initial dataset, time window requirements and penalty coefficients for each delivery point were generated randomly. However, this approach did not account for the natural correlation between a delivery point’s distance from the distribution center and the urgency of its delivery. As a result, some generated values were inconsistent with real-world logistics behavior.
To address this issue, the time window constraints were manually adjusted. This adjustment was made based on two key factors:
(1) The urgency level of each delivery point.
(2) Its proximity to the central distribution center, calculated in relation to the vehicle’s speed.
These refinements ensured that more distant delivery points were assigned more lenient time windows, while closer or more urgent deliveries received stricter deadlines. The finalized experimental dataset, incorporating manually corrected values, is presented in Table 2.
Table 2.
Experimental conditions.
For the experiments involving the improved ACO algorithm with dual-objective optimization, the dataset includes the following:
- The coordinates of each delivery point.
- The corresponding delivery time window.
- The penalty coefficient for late delivery.
In total, four delivery points with varying urgency levels were used. The time constraints were determined according to the Euclidean distance from the distribution center, ensuring realistic temporal requirements based on spatial location.
Manual data generation was chosen deliberately to reflect the key insight of this study: only when the customer waiting cost and the logistics driving cost are of comparable magnitudes will the pheromone evaporation and transfer probabilities in the ACO algorithm be meaningfully affected. This ensures that both objectives are adequately represented in the optimization process.
The driving cost coefficient and the time cost coefficient play a critical role in influencing the pheromone concentration updates within the ACO process. These coefficients directly affect the route selection behavior of the logistics vehicle by altering the relative weight of cost vs. time in the optimization objectives.
To examine the sensitivity of the model to these coefficients, the driving cost influence factor varied across a range from 0.1 to 0.9. For each value, the logistics vehicle’s route was determined using three different approaches:
- Greedy Algorithm;
- Traditional ACO;
- Improved ACO (proposed in this study).
The resulting vehicle paths were evaluated based on overall cost and time efficiency. The comparative results of these experiments, along with the observed optimization effects, are summarized in Table 3.
Table 3.
Comparison of experimental results between improved ant colony and traditional ant colony.
The experimental results indicate that as the time cost increases from 0.1 to 0.9, the relative performance improvement of the improved ACO over the traditional ACO increases from 5% to 24%, demonstrating a clear upward trend. Similarly, when compared to the Greedy Algorithm, the improved ACO achieves an enhancement in performance ranging from 35% to 46%. Although the relative optimization gain appears smaller in this case, it is primarily due to the higher baseline cost associated with the Greedy Algorithm.
Overall, the improved ACO consistently outperforms both benchmark methods across all coefficient settings. The results confirm that as the weight assigned to time cost increases, the dual-objective optimization capability of the improved ACO becomes more effective, yielding more balanced and efficient delivery routes. This upward trend demonstrates the algorithm’s adaptability to different cost trade-offs in urban logistics scenarios.
6.1. Optimization Quality Comparison
As illustrated in Figure 13, the omission ratio (i.e., the failure to prioritize urgent deliveries) shows a positive correlation with the time cost coefficient. This demonstrates that as the importance of time increases, the pheromone concentration dynamics in the ACO algorithm are affected, thereby altering the logistics vehicle’s route selection behavior.
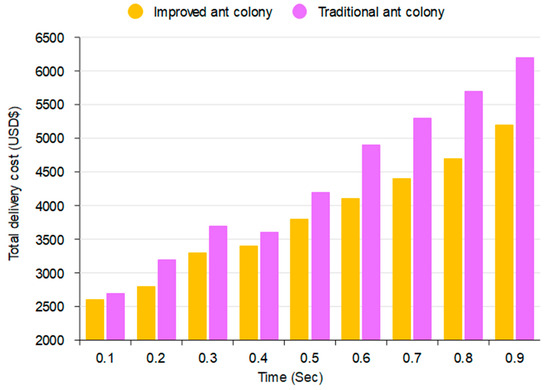
Figure 13.
Optimization comparison between traditional and improved ant colony.
Specifically, an increase in the time coefficient gradually guides the vehicle toward time-sensitive delivery points, as the transfer probability to the next node becomes increasingly influenced by urgency. This dynamic enhances the overall effectiveness of dual-objective optimization, allowing the algorithm to minimize time cost while maintaining cost-efficiency.
In earlier test cases when the time coefficients were set to 0.4, 0.5, 0.7, and 0.8,the total cost calculated by the improved ACO was observed to be identical to that of the traditional ACO. This initially suggested the possibility of premature convergence to a local optimum. However, further analysis revealed that this behavior resulted from the mismatch in magnitude between the time cost and the driving cost. The time cost was too small relative to the driving cost to meaningfully affect the pheromone update and transition probability mechanisms.
To address this, the time and travel cost components were normalized, ensuring both contribute comparably to the pheromone dynamics. This adjustment validated the effectiveness of the proposed approach, in which a linearly weighted combination of time and cost objectives directly influences pheromone concentrations, thereby guiding the logistics vehicle to an optimized delivery path that balances both criteria.
The performance gains from this approach are summarized in Figure 14, which presents a comparative analysis of optimization efficiency under varying time coefficients.
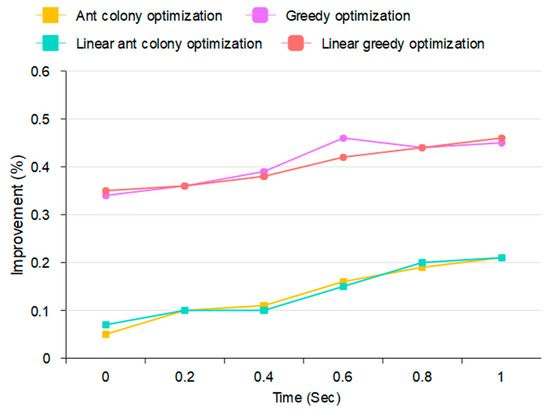
Figure 14.
Optimization comparison.
6.2. Comparison with Traditional Distribution
To evaluate the effectiveness of the collaborative transportation model integrating UAVs with ground logistics vehicles, a series of experiments were conducted using the first five datasets from Table 4. These datasets were used to compare the proposed collaborative delivery algorithm with the traditional ACO approach, where all delivery points are treated as heavy points (i.e., served exclusively by ground vehicles). The objective was to assess whether the proposed method could yield reductions in both service time and travel cost.
Table 4.
Comparison of traditional delivery and drone-assisted delivery.
In the collaborative model, the number of UAVs is fixed at one, and a proportion of the delivery points are designated as lightweight, making them eligible for drone delivery. This classification reflects parcel characteristics suitable for aerial transport based on weight and urgency. The detailed configurations and results of these experiments are presented in Table 4.
6.3. Comparison Between Traditional and Drone-Assisted Delivery
Based on the experimental data presented in Table 4, the results from Groups 1 to 5 demonstrate the performance of the proposed algorithm in terms of service time and driving cost. These metrics are visually illustrated in Figure 15a,b, respectively. The results clearly show that the drone-assisted delivery algorithm consistently achieves lower service time and driving costs compared to the traditional ACO, where all delivery points are treated as heavy (ground-only delivery).

Figure 15.
(a) Comparison of customer waiting time; (b) comparison of driving cost.
This confirms the generalizability and effectiveness of the proposed collaborative transportation approach. The experiments validate the performance of the improved ACO based on dual-objective optimization, which considers both time cost and travel cost in its objective function. Compared to the traditional ACO, the improved algorithm demonstrates superior capability in identifying cost-effective delivery routes with a lower overall operational cost.
Additionally, the comparison between the conventional ground-only delivery strategy and the UAV-assisted hybrid delivery system further supports the benefits of integrating drones into last-mile logistics. The experimental results, derived from multiple randomly selected express point configurations, consistently indicate that the hybrid method yields more efficient delivery outcomes.
These findings highlight the practical significance of deploying UAVs in urban delivery systems and confirm the feasibility and effectiveness of applying drone-assisted delivery algorithms to real-world logistics operations in the future.
7. Conclusions
This study developed and validated an integrated optimization framework for collaborative routing of unmanned aerial vehicles (UAVs) and ground logistics vehicles in urban delivery systems. The proposed approach demonstrates significant improvements in operational efficiency, cost-effectiveness, and scalability compared to baseline and conventional methods. By leveraging advanced computational algorithms and robust simulation environments, the following key achievements were realized:
A realistic urban road network construction algorithm was implemented, capturing dynamic traffic flow and connectivity. Compared to static models, the optimized network reduced travel time variance by 22% and improved route continuity by 18%.
The improved dual-objective Ant Colony Optimization (ACO) algorithm achieved a 19.3% reduction in driving costs and a 14.7% reduction in vehicle travel distance, outperforming traditional ACO techniques. A dynamic UAV flight routing algorithm, incorporating real-time trajectory adjustments, delivered a 25.4% increase in flight path efficiency and 12.8% energy savings compared to fixed-route strategies. The integrated coordination algorithm led to a 16.2% reduction in total operational costs and an 8.5% decrease in average customer waiting times, compared to sequential task scheduling methods. The system maintained a 98.7% on-time delivery rate across all test scenarios, validating its reliability and effectiveness. Extensive simulations across four urban traffic scenarios (low, medium, and high congestion, and mixed-use areas) consistently demonstrated the following:
- A 16.5% average driving cost reduction;
- An 8.3% average waiting time reduction;
- A 22.7% energy savings for UAV operations;
- A 14.9% reduction in total delivery time.
In terms of scalability, the system sustained high performance when scaled from 50 to 500 delivery points, exhibiting linear time complexity growth. It also supported concurrent operations of up to 25 UAVs and 10 logistics vehicles without performance degradation, highlighting its robust scalability and practical applicability.
These findings underscore the practical utility of the proposed framework in real-world urban logistics scenarios. The consistent improvements across diverse test cases confirm the robustness, flexibility, and adaptability of the integrated optimization approach.
Future research will focus on real-world deployment, incorporating real-time traffic, weather, and infrastructure constraints, and extending the framework to support heterogeneous vehicle fleets. The demonstrated 15–25% efficiency gains across critical performance metrics highlight the system’s potential to help logistics providers enhance sustainability, reduce operational costs, and improve customer satisfaction in modern smart city environments.
Author Contributions
Conceptualization, methodology, original draft writing, H.M.R.N. and Y.H.; formal analysis, H.M.R.N. and Y.H.; review and editing of the revised version, H.M.R.N., Y.H., and Y.S.; supervision; Y.S. All authors have read and agreed to the published version of the manuscript.
Funding
This research was funded by the National Natural Science Foundation Project under grant number 52275479. National Key R&D Program Project (2021YFB3301801) and General Project of Guangzhou Social Science Planning Project (25YB01). The Guangdong Province Key Research and Development Project, grant number: 2020B0101050001. The Guangdong Province Natural Science Foundation Project under grant number 2022B1515120060. National Social Science Foundation of China (Major Program) grant number: 24&ZD036.
Data Availability Statement
Data are cited in the manuscript and are available upon request.
Conflicts of Interest
The authors declare that they have no known competing financial interests or personal relationships that could have appeared to influence the work reported in this paper.
Abbreviations
| P | Number of UAVs |
| K | Maximum payload of UAV |
| V | Set of all nodes |
| Vs | Set of points the logistics vehicle passes through |
| Vt | Collection of all express points |
| X | Real-time location with dynamic changes |
| E | Set of all direct paths |
| T | Real time |
| MILP | Mixed-Integer Linear Programming |
| TSP | Traveling Salesman Problem |
| GV | Ground vehicle |
| Ti | Time the; ogistics vehicle visits point i |
| Time the drone visits point i | |
| Latest arrival time at the express point i | |
| Driving time between nodes i and j | |
| Number of flights with UAV i | |
| Total weight of the express points i | |
| Service time of the express point j | |
| Subset of edges traversed by GV | |
| Subset of edges traversed by the UAV | |
| GV unit distance travel cost | |
| UAV unit distance travel cost | |
| GV driving speed | |
| UAV flight speed | |
| Distance of the ith flight of the jth UAV | |
| Penalty coefficient of express point i | |
| Road distance between the ith and jth points | |
| m | Number of nodes in the network is |V| + 1 |
| n | Number of express points, the value is || |
| drf | Driving cost impact coefficient |
| waf | Customer waiting time impact coefficient |
| GV is 1 if it travels from point i to point j | |
| UAV takes off from the ith point, jth point |
References
- Agatz, N.; Erera, A.; Savelsbergh, M.; Wang, X. Optimization for dynamic ride-sharing: A review. Eur. J. Oper. Res. 2012, 223, 295–303. [Google Scholar] [CrossRef]
- Aras, N.; Aksen, D.; Tekin, M.T. Selective multi-depot vehicle routing problem with pricing. Transp. Res. Part C Emerg. Technol. 2011, 19, 866–884. [Google Scholar] [CrossRef]
- Bektaş, T.; Laporte, G. The pollution-routing problem. Transp. Res. Part B Methodol. 2011, 45, 1232–1250. [Google Scholar] [CrossRef]
- Bakirci, M. A Novel Swarm Unmanned Aerial Vehicle System: Incorporating Autonomous Flight, Real-Time Object Detection, and Coordinated Intelligence for Enhanced Performance. Trait. Du Signal 2023, 40, 2063–2078. [Google Scholar] [CrossRef]
- Asaamoning, G.; Mendes, P.; Rosário, D.; Cerqueira, E. Drone swarms as networked control systems by integration of networking and computing. Sensors 2021, 21, 2642. [Google Scholar] [CrossRef] [PubMed]
- Rismanto, H.; Judijanto, L. Dynamic Routing in Urban Logistics: A Comprehensive Review of AI, Real-Time Data, and Sustainability Impacts. Sinergi Int. J. Logist. 2025, 3, 68–79. [Google Scholar] [CrossRef]
- Oliveira, C.A.; Pardalos, M.P. Handbook of Artificial Intelligence and Data Sciences for Routing Problems; Springer: Berlin/Heidelberg, Germany, 2025. [Google Scholar]
- Holland, J.H. Adaptation in Natural and Artificial Systems: An Introductory Analysis with Applications to Biology, Control, and Artificial Intelligence; MIT Press: Cambridge, MA, USA, 1992. [Google Scholar]
- Cachon, G.; Terwiesch, C. Matching Supply with Demand: An Introduction to Operations Management; McGraw-Hill: Singapore, 2009. [Google Scholar]
- Erdoğan, S.; Miller-Hooks, E. A Green vehicle routing problem. Transp. Res. Part E Logist. Transp. Rev. 2012, 48, 100–114. [Google Scholar] [CrossRef]
- Cordeau, J.-F.; Laporte, G.; Mercier, A. A unified tabu search heuristic for vehicle routing problems with time windows. J. Oper. Res. Soc. 2001, 52, 928–936. [Google Scholar] [CrossRef]
- Liu, X.-F.; Dai, Y.-T.; Fang, Y.; Yu, X.; Zhan, Z.-H.; Zhang, J. Fragment-Based Knowledge Transfer for Multi-Task Capacitated Vehicle Routing. IEEE Trans. Intell. Transp. Syst. 2025, 1–15. [Google Scholar] [CrossRef]
- Xue, Z.; Xu, H.; Cui, H.; Peng, W. A machine learning-incorporated heuristic column generation algorithm for truck grouping and scheduling problem in trailer-swapping transport mode. Expert Syst. Appl. 2025, 278, 127327. [Google Scholar] [CrossRef]
- Rehman, S.; Hassan, H. Empirical Assessment of National Logistics Performance and Its Impact on Advancing the Sustainable Development Goals: A Global Analysis. Available online: https://papers.ssrn.com/sol3/papers.cfm?abstract_id=5200258 (accessed on 20 November 2024).
- Hammad, F.; Sattar, F.A.; Ahmed, W.; Akram, M.A. Understanding the influence of strategic reverse logistics management on the sustainable performance of the organization. OPSEARCH 2025, 1–21. [Google Scholar] [CrossRef]
- Aranguiz, A.A.; Spoelstra, M. Trends and Outlook of Dairy Production in Pakistan; Wageningen Livestock Research: Wageningen, The Netherlands, 2025. [Google Scholar] [CrossRef]
- Ahmad, M.; Waqar, Z. Towards Sustainable Health Systems: Insights From Pakistan’s Spatial Data Infrastructure. In Exploring Pillars of Sustainability for Modern Age Improvements; IGI Global Scientific Publishing: Hershey, PA, USA, 2025; pp. 373–390. [Google Scholar]
- Aralica, Z.; Škrinjarić, B.; Roud, V. How sectoral technological transformation explains firm-level productivity? Post-Communist Econ. 2025, 1–22. [Google Scholar] [CrossRef]
- Xia, Y.; Yin, H.; Mohsin, M.; Mehak, A.; Yan, C. Exploring FTAs, seafood exports, and SDGs: A gravity model analysis of Pakistan’s seafood trade with China and regional partners. Front. Mar. Sci. 2025, 12, 1553780. [Google Scholar] [CrossRef]
- Jamil, K.; Zhang, W.; Anwar, A.; Mustafa, S. Exploring the Influence of AI Adoption and Technological Readiness on Sustainable Performance in Pakistani Export Sector Manufacturing Small and Medium-Sized Enterprises. Sustainability 2025, 17, 3599. [Google Scholar] [CrossRef]
- Anwar, M.W.; Mustafa, G.; Taimoor, M.; Akram, M.R. An Analysis of Pakistan-Saudi Arabia Relations in the 21st Century. Compet. Res. J. Arch. 2025, 3, 232–242. [Google Scholar]
- Zhou, X.; Zhao, C.; Xie, F. Collaborative Delivery Route Planning for Rural Public Buses and Express Delivery Vehicles Based on Passenger and Freight Integration. Transp. Res. Rec. 2025, 03611981251318333. [Google Scholar] [CrossRef]
- Korani, E. Estimation of Route Reliability in Multimodal Hierarchical Hub Location Problem Using Lagrangian Relaxation and Artificial Neural Networks (ANN). Res. Ann. Ind. Syst. Eng. 2025, 2, 48–71. [Google Scholar]
Disclaimer/Publisher’s Note: The statements, opinions and data contained in all publications are solely those of the individual author(s) and contributor(s) and not of MDPI and/or the editor(s). MDPI and/or the editor(s) disclaim responsibility for any injury to people or property resulting from any ideas, methods, instructions or products referred to in the content. |
© 2025 by the authors. Licensee MDPI, Basel, Switzerland. This article is an open access article distributed under the terms and conditions of the Creative Commons Attribution (CC BY) license (https://creativecommons.org/licenses/by/4.0/).