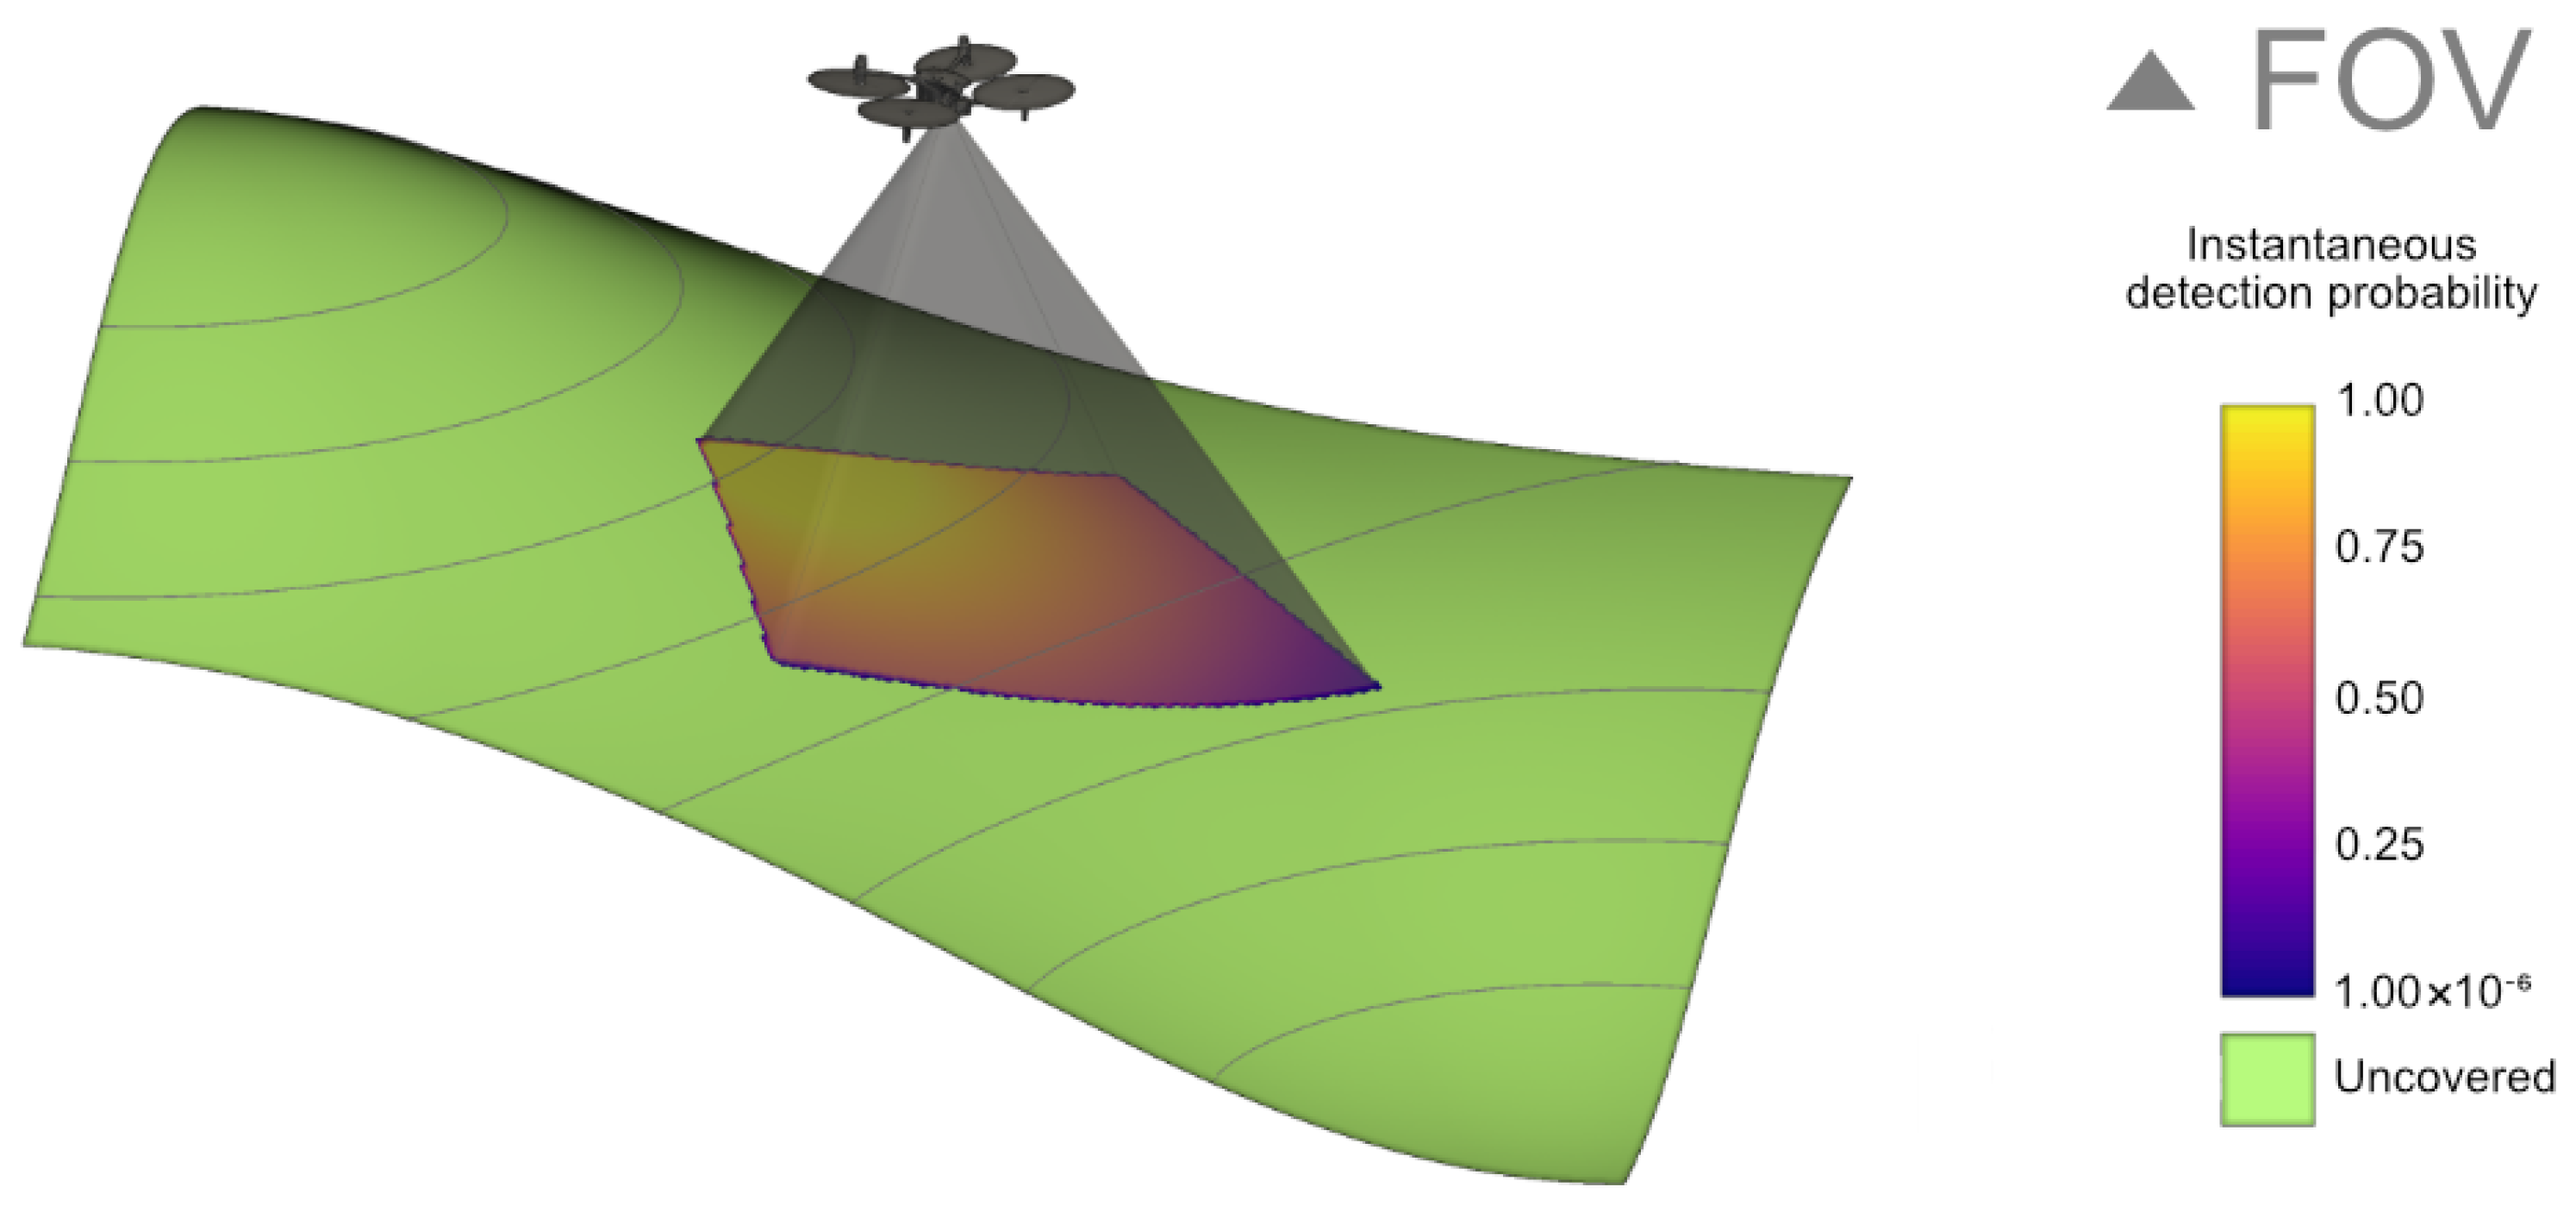
Article

Experimental Validation of UAV Search and Detection System in Real Wilderness Environment

Faculty of Engineering, University of Rijeka, Vukovarska 58, 51000 Rijeka, Croatia
*
Author to whom correspondence should be addressed.
These authors contributed equally to this work.
These authors also contributed equally to this work.
Drones 2025, 9(7), 473; https://doi.org/10.3390/drones9070473
Submission received: 28 May 2025 / Revised: 25 June 2025 / Accepted: 28 June 2025 / Published: 3 July 2025

Abstract

Search and rescue (SAR) missions require reliable search methods to locate survivors, especially in challenging environments. Introducing unmanned aerial vehicles (UAVs) can enhance the efficiency of SAR missions while simultaneously increasing the safety of everyone involved. Motivated by this, we experiment with autonomous UAV search for humans in Mediterranean karst environment. The UAVs are directed using the Heat equation-driven area coverage (HEDAC) ergodic control method based on known probability density and detection function. The sensing framework consists of a probabilistic search model, motion control system, and object detection enabling to calculate the target’s detection probability. This paper focuses on the experimental validation of the proposed sensing framework. The uniform probability density, achieved by assigning suitable tasks to 78 volunteers, ensures the even probability of finding targets. The detection model is based on the You Only Look Once (YOLO) model trained on a previously collected orthophoto image database. The experimental search is carefully planned and conducted, while recording as many parameters as possible. The thorough analysis includes the motion control system, object detection, and search validation. The assessment of the detection and search performance strongly indicates that the detection model in the UAV control algorithm is aligned with real-world results.

1. Introduction

Unmanned Aerial Vehicles (UAVs) have emerged as efficient tools in Search and Rescue (SAR) missions due to their ability to rapidly access remote, often challenging or inaccessible areas enhancing the speed of locating individuals in distress, especially in situations involving natural hazards and risks. A critical aspect of this capability is person detection from aerial imagery. However, obtaining images for research purposes for this application is a challenging task since it requires access to real-world SAR scenarios, which have the focus set on the mission instead of collecting data for research purposes and often require complete anonymity. Experiments conducted in controlled and monitored conditions can therefore serve as a valuable alternative for generating datasets and advancing research of SAR missions. Additionally, existing datasets and algorithms often fall short in addressing the unique challenges posed by SAR scenarios, especially when detecting small-sized objects, such as individuals captured from a top-down perspective [1]. Unlike typical object detection datasets, the visual representation of people in such images deviates from conventional forms, emphasizing the need for specialized datasets tailored to this task [2].
Beyond computer vision detection, effective motion control is essential for UAVs to systematically and efficiently survey target areas. Ergodic search algorithms, such as the Heat equation-driven area coverage (HEDAC) method [3] used in this study, enhance the search performance by distributing the search efforts proportional to the likelihood of locating a target showing significant efficiency in SAR missions. However, implementing such strategies in SAR mission environments introduces challenges, including obstacle avoidance, real-time communication, and coordinating multiple UAVs. This is why the robustness of the motion control system is of utmost importance. The UAV search framework [4] used in this study, utilizes the ergodic HEDAC motion control system in combination with Model Predictive Control (MPC) to efficiently search a large area while performing aerial imagery. The underlying sensing model is based on the performance of the used YOLOv8 object detection model, meaning the UAV’s motion is influenced by both the target probability density function and the detection model. As UAVs adjust their flight height while searching complex terrains, the performance of YOLOv8 varies based on the flight height impacting the ground sampling distance (GSD) [5,6]. Since existing person detection models often do not provide performance metrics across extensive flight height and GSD ranges, the existing pretrained model was additionally trained on our initial experiment data to fill this gap.
Despite recent advancements, SAR applications still face challenges in both, computer vision object detection and UAV motion control. Detection algorithms must contend with varying environmental conditions, occlusions, and the inherently low resolution of humans in aerial imagery. Meanwhile, motion control demands adaptive strategies capable of balancing efficiency and reliability in high-stakes operations. Motivated by these challenges, this experimental validation advances prior research in autonomous SAR missions by conducting an extensive field experiment involving real human participants in a natural, wilderness environment, specifically, a Mediterranean karst terrain. Unlike many simulation-based studies, our approach emphasizes the importance of field validation under realistic operational conditions. A key contribution is the creation and release of a new publicly available dataset comprising annotated aerial imagery collected during this SAR experiment, as well as flight data which can support further research in UAV-based human detection. Moreover, the motion control strategy is integrated with the YOLO detection model, ensuring that the UAV search behavior is adapted to the strengths and limitations of the underlying detection system. These contributions represent a meaningful step in SAR research with a focus on improving their practical application and effectiveness in real-world environments.
The paper is structured as follows: Section 1 presents the problem and motivation of using object detection in combination with UAV motion control. In Section 2 the related work is presented. In Section 3 the materials and methods including the motion control algorithm and the detection methodology are described as well as the experiment setup. The results are shown in Section 4. In Section 5 the presented methodology and its usage is discussed. The paper is concluded in Section 6.

2. Literature Overview

In the following section the utilization of UAVs in SAR missions is explored focusing on the ergodic motion control and other strategies for efficient search area coverage, as well as the usage of object detection models to help detect individuals in distress.

2.1. UAVs in SAR Missions

A detailed survey on the usage of UAVs in SAR missions is presented in [7] giving an overview of different types of UAVs that can be used in SAR missions, as well as different operational scenarios of the UAVs in times of disasters. The advantages that UAVs offer, such as accessing inaccessible and often dangerous areas include improved safety for human resources, cost-effective operations, and faster data collection including the ability to gather high-resolution imagery or data used for research and monitoring [8]. UAVs equipped with advanced sensors, such as cameras including thermal cameras, multispectral cameras, and light detection and ranging (LiDAR), UAVs can be used to detect human body heat, identify structural damages, and map complex terrains. This is extremely important in situations of natural hazards and risk such as avalanches [9,10,11] or earthquakes [12,13,14,15]. Additionally, UAVs are increasingly being integrated with communication systems and payload delivery mechanisms to expand their functional roles in SAR missions [16]. This can include delivering critical supplies, such as medical kits, food, and water, to individuals in inaccessible locations. UAVs can also act as airborne relay stations as detailed in [17]. This method can be used to establish communication links in areas where conventional networks are disrupted, ensuring coordination among rescue teams.
The effectiveness of UAVs in SAR missions is further enhanced by advancements in motion control and object detection technologies. These technologies play a crucial role in enabling efficient search missions while navigating complex environments and identifying targets. Motion control systems enable UAVs to maintain stability and maneuverability in challenging conditions, such as strong winds or obstructed terrains, ensuring reliable performance during missions, as well as effective path planning to search the target area effectively. Similarly, object detection algorithms allow UAVs to identify search targets, monitor hazards, and detect critical infrastructure, facilitating decision-making processes. This can be done either on-board the UAV or offline on a ground-based workstation. On-board processing enables real-time detection, providing immediate results but demanding significant computational resources, which reduces the battery life and limits the UAV’s operational duration. On the other hand, offline processing involves analyzing captured images on a dedicated workstation with mostly better computing power, allowing for faster and more efficient processing while conserving UAV battery life, thereby extending the overall search duration.

2.2. UAV Search and Ergodic Motion Control

The ability to effectively control the motion of UAVs is crucial in a variety of applications, especially in situations that depend on the control efficiency such as SAR missions. In these operations, UAVs can be deployed either independently or in coordination with ground search teams to increase the search efforts as discussed in [18]. Additionally, various search strategies have been explored to optimize UAV motion control such as the methods presented in [19] that use straight paths in combination with 90 turns to enhance the coverage in SAR scenarios. Several studies have emphasized the experimental validation of using UAVs in SAR missions. In [20] field tests in forested areas have been conducted using adaptive path planning and optical sectioning. On the other hand, in [21] the search is focusing on a communication system that can be used in snow conditions. Since the UAV search goal is the successful detection of missing individuals, in [22] a comparative study has evaluated the trade-offs between expert human detection and deep-learning-based methods for person detection in UAV imagery in the conducted experiment. Such experimental validation studies are essential to assess the real-world performance, robustness, and practical applicability of UAV based SAR systems.
Ergodic motion control has emerged as a promising solution due to its capability to efficiently guide the UAVs over a defined area. By leveraging the principles of ergodicity, this approach ensures that the spatial distribution of the UAV’s trajectory aligns with the probability distribution of the target’s presence, in particular, areas within the search domain. The benefits of using ergodic search are presented in [23] suggesting the robustness of the method in different conditions and uncertainties. This has led to multiple ergodic motion control systems being developed. Three widely recognized approaches for controlling single or multi-agent systems in ergodic exploration are HEDAC, MPC, and Spectral Multiscale Coverage (SMC).
The HEDAC method [24] is based on the heat equation used to create a potential field enabling efficient directing of either one or multiple agents. The HEDAC method was later improved by incorporating agent sensing and detection [3]. In [25], the Finite Element Method (FEM) was employed to solve the fundamental heat equation, enhancing its ability to handle irregularly shaped domains and inter-domain obstacles without increasing computational resource needs. MPC, also known as Receding Horizon Control (RHC), is employed to generate trajectories by optimizing a specific objective within defined constraints. In [26,27], the MPC approach was applied to path planning in a 3D search space for both known and unknown environments, demonstrating strong scalability in the experimental validation. SMC, introduced in [28], leverages the difference between the desired and actual trajectories to create multi-agent paths. In [29], the Neyman-Pearson lemma was incorporated into this method for a 2D coverage task, leading to the development of Multiscale Adaptive Search (MAS), which was experimentally tested with a single UAV in [30].
This study presents a comprehensive experimental validation presented in [4] using the HEDAC algorithm for coverage control and potential field generation, integrating it with MPC to enhance the motion control by optimizing flight height enabling the control strategy to improve overall system performance and flight efficiency in uneven environments.

2.3. UAV Images Object Detection

Even though recent advancements in computer vision algorithms have proven highly beneficial in many fields, especially when large datasets are available for training and testing, the availability of large annotated datasets for SAR-specific applications remains limited, hindering the development of more robust automated detection systems. Some examples of existing datasets include [2,31,32]. However, person detection from aerial images has some specific challenges such as the top-down perspective of person objects resulting in different characteristics that the object detection model should recognize. The image quality can depend on the UAV velocity, especially in SAR missions where the trade-off between the mission speed and image quality needs to be considered. Additionally, the person objects in the image are already small-scaled, but the convolutional neural network (CNN) downsampling is reducing the feature representations even more resulting in a lack of context information. These challenges could be tackled by extending the existing number of publicly available UAV image datasets enabling the models to learn from more images containing even more different image contexts.
To effectively utilize these datasets, efficient computer vision techniques are required to detect and localize objects in UAV imagery despite their small size and complex backgrounds. Object detection plays a crucial role in this process as it involves both identifying objects and determining their precise locations within an image. One of the most popular methods to solve this task is the You Only Look Once algorithm (YOLO) which is a one-stage detector dividing the image into a grid and predicting bounding boxes and their class probabilities enabling simultaneous estimation of localization and classification. The version used in this study is the YOLOv8 [33] created based on incremental improvements of the earlier YOLO versions presented in [34,35,36].
The usage of YOLO for object detection in nature environments has shown promising results in applications such as wildlife monitoring [37] and agricultural inspection [38]. The application of YOLO person detection on thermal images has also been widely researched [39,40,41,42,43,44,45]. Additionally, in [46] the tracking of people using thermal images in simulated SAR situations is shown using YOLOv5. However, detecting small objects of interest, such as people in large-scale images, is challenging due to their small scale [1].

3. Materials and Methods

3.1. UAV Motion Control and Machine Vision Detection

The successful usage of autonomous UAVs in SAR missions depends on several factors such as the implemented motion control and detection. In this section, the used methodology in terms of the probabilistic model of the search, the UAV motion control using HEDAC and MPC, and the YOLO object detection model are described.

3.1.1. Probabilistic Model of the Search

The main objective of the conducted search is to validate the search success. To achieve this, the first step is to define the UAV’s field of view (FOV) as well as the terrain model needed to determine the UAV’s sensing. Since the experiment search is conducted in the mountain area, the terrain is uneven, hence the sensing may not capture the whole FOV that would be visible on even terrain. This is why the terrain data as part of the geographic information system (GIS) needs to be introduced. The terrain data was obtained by digital elevation model (DEM) files from the Copernicus database [47]. The DEM data was integrated to provide the information needed for calculating relative heights in the motion control system, as well as the possible obstacles impacting the sensing. The relative flight height, defined as the height of the UAV above the ground, is calculated using the starting point of all flights, namely 45.2368° latitude and 14.2031° longitude, and the DEM data. This calculated height is used to enable the flight height optimization and defining the no-fly safety zone. In Figure 1 it can be seen how the terrain can impact the UAV’s FOV.
To check if an arbitrary point at the terrain surface, given by 2D horizontal planar coordinates p , can be sensed by the camera, we first need to obtain its vertical coordinate by projecting it to the terrain surface z T ( p ) and then consider it in the UAV’s local coordinate system. The UAV coordinates X and heading direction θ are utilized for transformation and obtaining R —a 3D point relative to the UAV camera:
R = cos θ sin θ 0 sin θ cos θ 0 0 0 1 X p x , p y , z T ( p ) T .
Based on if the point is in the FOV, the detection probability to detect individuals ψ is defined as:
ψ ( R ) = Γ ( | | R | | ) if R Ω F O V 0 otherwise ,
where | | R | | is the distance between the sensor and the observed point, Γ is the sensing function used to define the detection probability, and Ω F O V is the pyramidal-shaped scope of the UAV camera representing the FOV. For each point that is in the FOV, the detection probability is calculated by Γ , while points outside of the FOV have a 0 probability of detecting the targets.
During the entire duration of the flight, the coverage c is calculated as the accumulated detection probability, along the integration time τ , for all points in the domain visible from the camera’s position X ( τ ) :
c ( p , t ) = 0 t ψ ( R ( X ( τ ) , p ) ) d τ .
The probability of the undetected target presence m is initially described by the probability distribution m 0 at t = 0 . Over time, m decreases as the agents apply their sensing effects, which are characterized by the coverage c. It is calculated as follows:
m ( p , t ) = m 0 ( p ) · e c ( p , t ) .
To calculate the overall detection probability of detecting individuals in the search mission η , the undetected target probability is integrated over the domain:
η ( t ) = 1 Ω 2 D m ( p , t ) d p .
The detection probability is the key factor analyzed in this study since it is a measure of the search effectiveness.

3.1.2. UAV Motion Control

The motion control system implementation used in the main experiment, was taken from [4] and uses the HEDAC algorithm for defining the motion control in 2D space and MPC for optimizing the flight regime in 3D space adding the height as an additional control variable, as well as the UAV velocity. Although the proposed motion control framework is designed to handle multiple UAVs, all search missions were conducted as single-agent searches.
The motion control consists of three control variables set by the motion control algorithm, namely the velocity intensity ρ ( t ) , the incline angle ϕ ( t ) , and the yaw angular velocity ω ( t ) . Using the velocity intensity and the incline angle, the horizontal and vertical velocities are calculated. In addition, ω regulates the UAV direction in which the horizontal velocity acts. By this, the UAV state is defined using three coordinates, namely the x, y, and z coordinates, as well as one orientation state.
The horizontal search control is defined by the potential field u ( p , t ) of the search area. The potential field is guiding the UAV towards the areas that have the highest probability of containing undetected targets. It is calculated by solving the differential equation as follows:
α · u ( p , t ) = β · u ( p , t ) m ( p , t ) ,
where α and β are HEDAC parameters used to modify the search behavior by adjusting the smoothness and stability, and Δ is the Laplace operator. Additionally, the following condition has to be met:
u n = 0 ,
where n represents the normal outward to the search domain boundary defined by Ω 2 D . Based on the gradient of the potential field, the direction of the UAV needs to be adjusted. This is calculated for each control step steering on the current direction towards the wanted direction defined by the gradient. Additionally, the UAV’s maximum angular velocity is defined by the maximal turning velocity or equivalently the minimum turning radius.
To control the UAV’s flight height and velocity, MPC is introduced to optimize two objectives, namely maximizing the UAV velocity, while keeping the flight height as close to the height goal defined for each flight. The first constraint that needs to be satisfied for the optimization to be feasible, is the need to fly above the minimum height representing the no-fly zone set at 35 m above the terrain obtained by the terrain model. The no-fly zone height takes into account the tree height, possible uncertainties contained in the DEM data, as well as an additional safety factor to minimize the risk of any collision with possible obstacles. Additional constraints that need to be met are the minimum and maximum velocities defined by the UAV specifications, as well as the minimum and maximum accelerations.

3.1.3. Computer Vision System for Human Detection

To collect all the necessary data and to test out the motion control and vision detection systems needed for the success of the main experiment, an initial experiment with 28 participants was conducted on the mountain Učka on 7 July 2024.
The initial experiment dataset was obtained by non-optimized flights using DJI Matrice 210 and DJI M30T UAVs, where the obtained images have a resolution of 2970 × 5280 pixels for the DJI Matrice 210 and a resolution of 3000 × 4000 pixels for the DJI M30T. The initial dataset contains images in combination with the corresponding labels in the YOLOv8 format representing detected individuals. The images are stored in JPG format and include metadata such as Global Positioning System (GPS) coordinates, providing valuable context for analysis.
The Computer Vision Annotation Tool (CVAT) in a local environment was used for labeling. Three independent annotators manually labeled the original-sized images identifying individuals. After the initial labeling, two independent reviewers, who were not involved in the labeling process, reviewed the annotations for accuracy and consistency. The images were labeled in an iterative process where labels were corrected to increase the accuracy. The used label format is YOLO, specifically, it was downloaded as the YOLOv8 Detection label format available in CVAT.
The image preprocessing includes tiling the original image into smaller parts to ensure easier YOLO training and modifying the existing labels to fit the new small-sized images. The process of dividing the original UAV images into smaller tiles was performed using a custom Python 3.12.7 script. Each high-resolution image was split into 512 × 512 pixel sections, ensuring an overlap between the tiles to maintain comprehensive coverage and provide additional context for better analysis. The minimal overlap is experimentally defined as 100 px. The tiling method is shown in Figure 2. This method enables the use of smaller square image segments preferred by the YOLO algorithm training. The newly created file names were generated based on the tile’s position within the original image. This naming convention helps to ensure that each tile can be easily traced back to its location within the larger image, providing a structured approach to organizing the dataset for further processing and analysis. Lastly, the existing labels needed to be modified to fit the newly created images.
Since different cameras were used, the images were divided into GSD groups to enable the comparison between different flight height conditions. Essentially, GSD is the actual distance in the UAV image represented by 1 px defining how much detail is captured in the image. A lower GSD means that each pixel in the UAV image is representing a smaller ground area enabling the image to show more detail, while in contrast, a higher GSD is representing a bigger area, thus having less details. Using either the horizontal x i m a g e or vertical y i m a g e image size, horizontal h F O V or vertical v F O V distance of the UAV’s camera FOV, the GSD can be calculated using the relative UAV height h of each image as follows:
G S D = 100 · 2 · h · t a n h F O V 2 x i m a g e = 100 · 2 · h · t a n v F O V 2 y i m a g e .
Because the horizontal and vertical distance of the FOV are calculated from the aspect ratio and diagonal FOV, the vertical and horizontal GSD are the same. The GSD image groups enabled us to compare the model at different GSD intervals. The recall metric of the initial model for each GSD group is used for the motion control system. The distribution of images in height and GSD groups is shown in Figure 3.
This initial dataset was used to train the YOLOv8 model released in 2023 by Ultralytics. YOLOv8 is the result of incremental improvements implemented on previous versions (YOLOv5, YOLOv6, YOLOv7, …). The name YOLO comes from the simultaneous estimation of localization and classification that is done in one look of the images. It is important to note that YOLOv8 has been used only as a proof of concept, but any detection model can be integrated in the system.
The simplified scheme of the YOLOv8 architecture is shown in Figure 4 and consists of four main blocks: the input data, the backbone, the neck, and the head. The input data is the data provided to the model for training. The used images have a resolution of 512 × 512 pixels. Different augmentation methods were used to introduce new context improving the generalizability of the model. The augmentation methods included in the training process were horizontal flip, vertical flip, rotation, hue, hsv, translate, scale, mosaic, erasing, and crop fraction. Most of these methods are set as default augmentation methods. The used model is the pre-trained YOLOv8 trained on the COCO dataset. The backbone network of the neural network is used to extract the features from the images. Based on the extracted features, object classification and localization are performed. The feature extraction is done in several layers. In our research, the originally proposed custom CSPDarknet53 is used. In the neck block, the extracted features are aggregated to form new features from different layers of the backbone network. To aggregate features, the original PANet was used. The head is used for suggesting anchors bounding boxes of the detected objects, in our case persons. Additionally, the head is used to estimate the percentage of certainty for detected objects. The used model head is the one presented in the original model, namely the YOLOv8 head.
The sensing function is based on the YOLOv8 metrics, specifically the recall metric representing the percentage of correctly identified objects in relation to the total number of actual objects in the dataset reflecting the model’s effectiveness in detecting all instances of a specific class. The recall used in the main experiment was obtained from the initial experiment.
During the initial experiment the flight height was not optimized leading to more GSD groups than in the optimized autonomous flight regime used in the main experiment. The recall metric obtained by the validation on the initial dataset resulted in the recall metrics for each GSD shown in Table 1. It can be seen that the recall is generally decreasing for higher GSD intervals.

3.2. Experiment Setup

The motivation of the experiment can be divided into two main goals, namely (1) additional experimental validation of the autonomous motion control system using HEDAC and MPC and (2) creating a dataset containing people in different natural environments used in future SAR research. The experiment was conducted on the Učka mountain, Croatia on 27 October 2024. with 84 volunteers including the organizers and consists of a treasure hunt enabling the desired motion behavior of the participants.

3.2.1. Location, Environment and Equipment

Učka mountain Nature Park in Croatia presents a complex and challenging environment well-suited for the evaluation of simulated UAV-based SAR operations. The area is characterized by uneven terrain, different low vegetation, and elevation variations, making it an ideal setting for assessing the capabilities of autonomous UAV systems in locating missing persons in real-world conditions.
In this experiment, two UAVs were used: DJI Matrice 210 v2 and DJI Mavic 2 Enterprise Dual. The UAVs characteristics are shown in Table 2. The specifications show the ϕ parameter of optimization used for defining the UAV movement in relation to the horizontal plane, minimum and maximum horizontal and vertical velocity, minimum and maximum horizontal acceleration, maximum angular velocity, and the set MPC time steps. In Table 3 the camera specifications of three used cameras are presented.
The final experiment setup is shown in Table 4. Flights 1, 2, and 3 are connected and represent a single search mission, while flights 4 and 5 each represent their own search mission resulting in a total of three search missions. All five flights were operated autonomously.

3.2.2. Design and Preparation of the Experiment

To ensure an even probability of human targets within the defined search zone, 150 markers were strategically placed so that each of the three zones contains 50 markers as shown in Figure 5 simulating a uniform distribution of targets in the search domain. The specification of each zone is displayed in Table 5. The search domain is defined using the zones and consists of either one or more zones with an offset between 50 and 100 m allowing UAVs to avoid touching the boundary of the domain. The target probability distribution function was uniform for each zone. Additionally, the sum of undetected target probability throughout the entire search domain is 1. The uniform probability inside each zone is determined by the number of people searching in that zone divided by the area of that zone.
All participants were informed about the experiment setup and motivation. Each individual involved in the experiment provided signed consent to be photographed, with all data de-identified to protect personal information such as names. Additionally, each participant got an information flier containing all necessary information: a map with the path to the starting point, a map with defined zones, additional information, QR codes that led to the starting point, as well as QR codes that showed the position of the participant inside the zone. The available GPS data allowed the participants to track their location at all times during the experiment to ensure they remain in the assigned zone. Each participant had to fill in the name and surname, jacket color or multiple colors if they have taken off the jacket, the time at the starting point, start and end of the search inside the zone, and if they found markers, each marker should have been noted using the marker number as well as the time when the marker was found. The English version of the flier is shown in Figure 6.

3.3. Conducting the Experiment

Conducting field experiments requires detailed planning, coordination, and adaptability especially since real-world experiments introduce numerous challenges, including logistical constraints, regulatory requirements, and unpredictable environmental factors.
One of these challenges is the unpredictable weather making long-term planning for UAV-based SAR experiments challenging. While weather forecasts are monitored, sudden changes such as fog, wind, or rain can still occur, affecting UAV stability and visibility. Despite this uncertainty, extensive logistical work must be completed in advance, including inviting participants, coordinating with the nature park, obtaining flight and imaging permissions, and securing signed consent from all participants involved in the experiment. These preparations ensure regulatory compliance, operational feasibility, and safety. Even though the weather forecast seemed promising, the weather on the experiment day was cloudy and foggy.
Managing a relatively large number of participants also causes challenges. Some participants forgot to enter the required log data. Additionally, depending on the location inside the zones, internet connectivity issues prevented some of the participants from verifying their locations based on the GPS coordinates and maps provided in the flier, disrupting real-time decision-making leading to some individuals straying outside of their assigned zones.
Some of the images taken on 27 October 2024 during the experiment are depicted in Figure 7. Subfigures (a) and (b) display the used drones, namely Matrice 210 v2 and Mavic 2 Enterprise Dual. In (c) the home point of all flights is illustrated. Subfigure (d) captures the participants while giving them the introduction and explaining the experiment. In Subfigures (e) and (f) an example of a UAV image from the first mission is provided, as well as a tile of the image containing a person.

4. Results

The following section presents the results of the conducted experiment involving of the analysis of the UAV motion control, the performance of the computer vision-based human detection, and the validation of the search and detection process.

4.1. Analysis of UAV Motion Control

As mentioned in the experiment setup section, the area containing markers where people were expected to stay was divided into three zones. However, to capture the whole zone, the UAV flight zone was larger than the defined search zones. The flight trajectories of all flights during the three search missions are visualized in Figure 8.
The UAV flight velocity, acceleration and height of the first flight in Search mission 1 is visualized in Figure 9. It can be seen that the UAV’s velocity and acceleration are inside the constraints defined in the MPC optimization suggesting a stable flight. The flight height is following the goal height set to 55 m in a smoothed line allowing the UAV to optimize the velocity.

4.2. Computer Vision Human Detection

The images resulted in most of them having no people. The number of images and number of labels in each flight is depicted in Figure 10. The flight 3 which has generated the most images containing people meaning it has also the highest number of labels, averaging on two persons per image containing people. Following flight 3, flight 1 has the most images containing people, but flight 2 has more detected people.
The images with people were taken from the locations shown in Figure 11. Since the UAV flight zone is larger than the defined zones containing markers, the UAVs captured images of people that mistakenly went outside of the zone. It can be seen that in zones A and B if people went out of their zones, it is still near the zone border, while in zone C people went further outside. Most grouped images are taken at the UAV flight station as expected, since there were two flight operators at all times that are in the starting and ending images of each flight and many volunteers decided to visit the operators at the highest point of the area.
The number of images for each GSD interval in each Search mission is presented in Figure 12. It is important to note that this Figure shows the GSD of all taken images. However, for validation, only original sized images containing people were tiled into subparts of 512 × 512 pixels since most tiles do not contain people and would still be enough to represent images with no people.
The performance metrics for all five flights shown in Table 6 give insights into the impact of camera quality, weather conditions, and the number of images containing people. Flights 1 and 2, which had the clearest images, benefited from better camera performance and favorable weather conditions, with minimal interference from fog. As a result, these flights showed stronger precision and recall metrics compared to others. This highlights the strong dependence of mission outcomes on high-quality equipment and favorable weather conditions, emphasizing the importance of these factors in UAV-assisted search and detection tasks.
The newly obtained dataset used an optimized flight regime implementation, hence having less GSD values than in the initial dataset. However, since the data in the initial dataset was taken using only one of UAVs used in this experiment, contained less people, namely about 28, and mostly having them grouped on the same walking path, therefore containing less different image contexts than in this presented experiment dataset, the recall values are lower than in the initial dataset. The resulting recall metrics for each GSD is shown in Table 7.
The recall in each GSD interval in comparison to the initial experiment is shown in Figure 13. As mentioned earlier, since the initial experiment flights were operated manually, the flight height has not been optimized but purposely designed to gather images from a broader altitude range, leading to more GSD ranges. On the other hand, in the main experiment, the flights were operated autonomously yielding in a stable flight height. Additionally, in the initial experiment flights, two cameras were used of which only one is used in this experiment causing new context in the ML model validation. However, it can be seen that the recall generally decreases with increasing the GSD following the trend of the initial experiment.
To assess the effectiveness of domain-specific training, we wanted to compare our YOLOv8l model, which was pretrained on the COCO dataset and further fine-tuned on our initial dataset, with the standard YOLOv8l model pretrained only on COCO. UAV imagery presents unique challenges, such as varying altitudes, occlusions, and diverse perspectives that are not well-captured by general-purpose datasets like COCO. By including our dataset, which reflects the specific conditions encountered in UAV-based imagery, the model can better adapt to these challenges. The results, shown in Table 8, clearly show that the additional training significantly improved the model’s ability to detect people in these complex conditions, highlighting the importance of domain-specific datasets.
To provide a more robust statistical interpretation of the detection performance, 95% confidence intervals (CIs) were calculated for recall, precision, mAP 0.5, and mAP 0.5–0.95 using a bootstrapping approach. Specifically, we performed 200 iterations of random sampling selecting 100 image samples per iteration. This method allowed us to estimate the variability and reliability of the detection metrics under repeated sampling conditions. The resulting confidence intervals shown in Figure 14 suggest consistent performance of the detection system.

4.3. Validation of the Search and Detection

To evaluate the search model’s predicted search accomplishment based on the initial experiment recall, we have compared it to the YOLO recall obtained in the main experiment. The derived detections from the first flight of Search mission 1 have been the most representable in terms of being able to identify each individual which makes it possible to assess the search accomplishment. Therefore the Search mission 1 detections are further analyzed. In Figure 15a the YOLO detection success using the confidence score higher than 0.5 is depicted in comparison to the manually labeled recorded targets, targets that have an intersection over union (IoU) higher than 0.7 ensuring a larger overlap and a more representable detection, and the count of undetected targets over time. In Figure 15b, the simulated search accomplishment by the motion control sensing model is validated by the experiment’s detection rate. The manually labeled recorded targets are illustrated in orange, while the target detection rate is presented in green. The predicted search accomplishment and the YOLO detection rate follow the same expected trend of detecting more people through time having a similar increase in detection as the motion control sensing model’s search accomplishment.
Due to the increasing goal height and the camera resolution, it was not possible to identify each individual in the second, third, and fourth flight to assess the success in the same way. The fifth flight doesn’t have enough labels to consider the result reliable so it has been discarded for the same analysis.
To assess the relationship between the search accomplishment and the detection rate throughout the first flight of Search Mission 1, three correlation tests were conducted: Pearson correlation coefficient, Spearman rank correlation, and Kendall’s tau. The results from all three tests indicate a strong positive correlation between the two variables. The Pearson correlation coefficient yielded a value of 0.99 with a p-value of 1.05 × 10 21 , suggesting a near-linear relationship with statistical significance. Spearman’s rank correlation and Kendall’s tau, which are non-parametric measures of monotonic association, both showed perfect or near-perfect correlations with values of 1 and corresponding p-values of 0 and 1.19 × 10 13 , respectively confirming the strictly increasing trend observed in the search mission. These results indicate that as the search mission progresses over time, both the detection rate and the search accomplishment consistently increase and strongly correlate. This suggests that improvements in detection directly enhance the overall success of the search process, reinforcing the reliability and effectiveness of the proposed UAV-based framework in real-time SAR scenarios. The results of the correlation tests are summarized in Table 9.
The confusion matrices for Search missions 1 and 2 are shown in Figure 16 summarizing the performance of the detection algorithm in terms of true positives, false positives, true negatives, and false negatives. Search mission 3 contained only seven labels, hence it was discarded for further detection analysis. The results suggest that most of the manually detected labels have been predicted correctly.
To additionally test the efficiency of the used search framework, a comparison with a lawnmower search method was conducted in simulation. The lawnmower method, a commonly used coverage pattern in aerial search operations, follows a systematic back-and-forth sweeping motion over the area of interest to ensure complete coverage. While this method provides uniform coverage, it does not adapt to probabilistic information. The used framework achieved higher search accomplishment by prioritizing areas of greater information gain, demonstrating more efficient target coverage compared to the static lawnmower approach. The results of this comparison, demonstrating the efficiency of the used framework in comparison with the lawnmower method, are presented in Figure 17.

5. Discussion and Limitations

Conducting UAV experiments presents significant challenges due to the unpredictability of different experimental aspects. While the detection system demonstrates strong potential, its performance is influenced by factors such as camera quality and environmental conditions. Variations in camera resolution can affect image clarity, with higher-quality sensors yielding more reliable detections. Weather conditions, including wind and rain, may result in temporarily limiting UAV operation or challenges in the UAV motion control. On the other hand, fog causes challenges by reducing visibility impacting the detection. However, it also highlights opportunities for enhancing detection capabilities through sensor fusion or alternative imaging modalities.
The current sensing model assumes static targets, which simplifies the probabilistic search formulation but does not reflect the dynamic behavior of individuals. Incorporating target motion prediction or dynamic probability distributions could enhance the system’s responsiveness to likely human movement. Under more realistic, dynamic target distributions, the search performance may vary significantly, as areas with higher target density require more focused search effort, while sparse regions risk being overlooked. To adapt to such scenarios, the framework could be extended to incorporate dynamic probability maps that update based on environmental data, previous detections, or movement predictions. This could allow the search algorithm to prioritize regions with higher likelihoods of target presence, improving overall mission efficiency and responsiveness in complex, real-world conditions. The performance of the object detection component is influenced by background complexity. Densely textured or cluttered environments can obscure targets and reduce detection accuracy. Additionally, the shirt colors of individuals can significantly affect the visibility of targets, with low-contrast scenarios sometimes leading to missed detections. To further improve reliability, especially in cooperative SAR missions, the integration of GPS-enabled devices carried by individuals could provide supplementary data to assist in more accurate identification and localization.
Managing a considerable large number of participants presents an additional source of logistical challenges. The aforementioned weather challenges make it difficult to inform participants well in advance about the confirmed experiment date. Despite these uncertainties, the experiment was successfully carried out with 78 participants in the search and 6 staff members, even though the final date was set only five days before. Weather forecasts have consistently predicted sunny conditions with minimal chance of rain. However, on the experiment day, unexpected fog developed, followed by light rain after the experiment concluded. This has caused unpredictable low quality of the images taken in Search missions 2 and 3 where individuals cannot be identified. In addition to that, the Z30 camera used in the third flight of the Search mission 1 has shown unexpected low quality making it almost impossible to even manually detect individuals.
Additionally, in this study, one of the primary encountered difficulties was data collection, as it relied on participants completing the logs accurately. Despite clearly outlining the required information and providing instructions on how to fill out the forms, analysis of the submitted logs revealed some missing details, such as the names of two participants and the shirt color of multiple individuals. In this case, the missing names did not pose a significant issue, as they could be verified using the participant registration list. However, the shirt color has been shown as a bigger problem since even though multiple individuals have not written any shirt color, there were individuals who have changed the shirt or taken off the jacket during the experiment, but have written only one color. These issues prevent the identification (not detection) of individuals needed to obtain a first detection of each person which is comparable to the search effectiveness η calculated in the control framework. Additionally, multiple participants have reported bad signal impacting the real-time map causing issues in tracking the position inside their assigned zone.
These challenges, ranging from environmental conditions and camera variability to operational logistics, highlight considerations for real-world deployment of the proposed UAV-based SAR framework. For effective field implementation, the UAV home point must be strategically positioned to maintain line-of-sight (LOS) communication, often requiring placement on elevated terrain. Real-time detection remains a desirable goal, but current processing constraints and hardware limitations necessitate offline analysis with a typical delay of approximately 30 min. Achieving real-time detection would require more computational resources and higher-end equipment. Additionally, the accuracy of the terrain data is crucial, as the framework relies on a high-resolution DEM to navigate and map the environment effectively. The current sensing model is based on the assumption of static targets, which simplifies search planning but limits adaptability in dynamic scenarios. Incorporating dynamic probability distributions could enable the system to better account for human movement patterns and behavioral cues. Another important aspect that can be considered for implementing this in real-world SAR scenarios is the integration of multiple UAVs to improve the efficiency and coverage of SAR missions, which is supported by the used framework.
This framework can be further applied to thermal imaging systems to enhance human detection in conditions where standard RGB cameras may underperform, such as in low-light scenarios, dense vegetation, or at night. Thermal cameras detect heat signatures, making them useful for identifying human presence when visibility is limited. Integrating thermal data into the framework would require updating the detection model to accommodate different input modalities, but the modular design of the system supports such extensions, allowing future adaptations with minimal structural changes.
Moreover, while the current dataset and experimental validation focus on a Mediterranean forest environment, the framework could also be deployed in more diverse and challenging terrains such as snow-covered regions, dense forests, or sea. Additionally, the model can be expanded to enable night vision cameras to enable search during night. However, since the dataset used in this study does not currently include such conditions, this may introduce challenges in terms of detection accuracy, terrain modeling, and UAV stability. These situations may require additional sensor integration or model retraining to obtain the recall values for each GSD interval that can be used in real SAR situations using different camera types. Nonetheless, the framework provides a solid foundation for such extensions and can be adapted to support future SAR operations in different environments.
These insights provide possible future improvements and emphasize the importance of aligning technological capabilities with operational demands in real-world SAR contexts.

6. Conclusions

This study presents the simulated SAR mission experiment conducted on Učka mountain, Croatia with the goal of validating the search model, motion control system, as well as gathering additional data for future SAR research. The used motion control consists of the HEDAC algorithm creating a potential field guiding the UAV’s direction and MPC for optimizing the flight regime. The sensing model incorporates the YOLOv8 deep learning-based object detection system influencing the UAV’s motion control. The integration of these components allows for an autonomous, adaptive search behavior in a realistic mountainous environment, providing a valuable experiment validation of the proposed framework for UAV-based SAR operations.
The involved the placement of 150 markers inside three zones ensuring a uniform distribution of participants taking part in the treasure hunt for markers. Each participant was instructed to search for and collect markers, emulating realistic human movement and behavior in a SAR context. During the search, three autonomously operated single-UAV search missions were conducted, the first one comprised of three connected flights, while the other two consisted of one flight each. Data from all flights was recorded, including flight information and images created using different cameras and taken at different flight heights providing a comprehensive dataset for evaluating the search model’s effectiveness and supporting further development of UAV-assisted SAR systems.
The results suggest that the probabilistic model of the search has a predicted search accomplishment similar to the manually detected individuals, as well as the YOLO detection rate. By this, the search and motion control systems are validated and show promising results for this method to be used in SAR missions. This study can further be expanded by conducting a search exploration of a simulated SAR mission using multiple UAVs to enhance the efficiency of the search.
While this study focused on a single-agent search-and-detection system, the framework has the potential to be expanded for multi-agent operations, which could significantly enhance future SAR missions. The integration of multiple UAVs working collaboratively could improve search coverage, reduce mission time, and increase detection accuracy in complex environments. The framework used in this research is designed to support multi-agent configurations, allowing for scalable and adaptable SAR operations. Future work could explore the implementation of multi-agent systems, further advancing the effectiveness and efficiency of UAV-assisted SAR missions.

Author Contributions

Conceptualization, S.I.; methodology, S.I., S.D. and L.L.; software, S.D. and L.L.; validation, S.D. and S.I.; formal analysis, S.D.; investigation, S.D., L.L. and K.J.; resources, S.I.; data curation, S.D.; writing—original draft preparation, S.D.; writing—review and editing, S.D., S.I., L.L. and K.J.; visualization, S.D.; supervision, S.I.; project administration, S.I.; funding acquisition, S.I. All authors have read and agreed to the published version of the manuscript.

Funding

This publication is supported by the Croatian Science Foundation under the project UIP-2020-02-5090.

Institutional Review Board Statement

The study was conducted in accordance with the Declaration of Helsinki, and approved by the Ethics Committee of the Faculty of Engineering, University of Rijeka under the approval number 2170-1-43-39-25-1.

Informed Consent Statement

Informed consent was obtained from all subjects involved in the study.

Data Availability Statement

The data produced in this research is publicly available on Open Science Framework https://osf.io/kb9e7 accessed on 19 February 2025.

Conflicts of Interest

The authors declare no conflicts of interest.

Abbreviations

The following abbreviations are used in this manuscript:
UAVUnmanned autonomous vehicle
SARSearch and rescue
HEDACHeat equation-driven area coverage
YOLOYou only look once
MPCModel predictive control
GSDGround sampling distance
SMCSpectral Multiscale Coverage
LiDARLight detection and ranging
RHCReceding Horizon Control
IoUIntersection over union

References

  1. Hong, M.; Li, S.; Yang, Y.; Zhu, F.; Zhao, Q.; Lu, L. SSPNet: Scale selection pyramid network for tiny person detection from UAV images. IEEE Geosci. Remote Sens. Lett. 2021, 19, 1–5. [Google Scholar] [CrossRef]
  2. Akshatha, K.; Karunakar, A.; Shenoy, S.; Pavan, K.P.; Dhareshwar, C.V.; Johnson, D.G. Manipal-UAV person detection dataset: A step towards benchmarking dataset and algorithms for small object detection. ISPRS J. Photogramm. Remote Sens. 2023, 195, 77–89. [Google Scholar]
  3. Ivić, S. Motion control for autonomous heterogeneous multiagent area search in uncertain conditions. IEEE Trans. Cybern. 2020, 52, 3123–3135. [Google Scholar] [CrossRef] [PubMed]
  4. Lanča, L.; Jakac, K.; Ivić, S. Model predictive altitude and velocity control in ergodic potential field directed multi-UAV search. arXiv 2024, arXiv:2401.02899. [Google Scholar]
  5. Petso, T.; Jamisola, R.S.; Mpoeleng, D.; Mmereki, W. Individual animal and herd identification using custom YOLO v3 and v4 with images taken from a uav camera at different altitudes. In Proceedings of the 2021 IEEE 6th International Conference on Signal and Image Processing (ICSIP), Nanjing, China, 22–24 October 2021; pp. 33–39. [Google Scholar]
  6. Qingqing, L.; Taipalmaa, J.; Queralta, J.P.; Gia, T.N.; Gabbouj, M.; Tenhunen, H.; Raitoharju, J.; Westerlund, T. Towards active vision with UAVs in marine search and rescue: Analyzing human detection at variable altitudes. In Proceedings of the 2020 IEEE International Symposium on Safety, Security, and Rescue Robotics (SSRR), Abu Dhabi, United Arab Emirates, 4–6 November 2020; pp. 65–70. [Google Scholar]
  7. Lyu, M.; Zhao, Y.; Huang, C.; Huang, H. Unmanned aerial vehicles for search and rescue: A survey. Remote Sens. 2023, 15, 3266. [Google Scholar] [CrossRef]
  8. Giordan, D.; Manconi, A.; Remondino, F.; Nex, F. Use of unmanned aerial vehicles in monitoring application and management of natural hazards. Geomat. Nat. Hazards Risk 2017, 8, 1–4. [Google Scholar] [CrossRef]
  9. Silvagni, M.; Tonoli, A.; Zenerino, E.; Chiaberge, M. Multipurpose UAV for search and rescue operations in mountain avalanche events. Geomat. Nat. Hazards Risk 2017, 8, 18–33. [Google Scholar] [CrossRef]
  10. Bejiga, M.B.; Zeggada, A.; Nouffidj, A.; Melgani, F. A convolutional neural network approach for assisting avalanche search and rescue operations with UAV imagery. Remote Sens. 2017, 9, 100. [Google Scholar] [CrossRef]
  11. Albrigtsen, A. The Application of Unmanned Aerial Vehicles for Snow Avalanche Search and Rescue. Master’s Thesis, UiT The Arctic University of Norway, Tromsø, Norway, 2016. [Google Scholar]
  12. Qi, J.; Song, D.; Shang, H.; Wang, N.; Hua, C.; Wu, C.; Qi, X.; Han, J. Search and rescue rotary-wing uav and its application to the lushan ms 7.0 earthquake. J. Field Robot. 2016, 33, 290–321. [Google Scholar] [CrossRef]
  13. Calamoneri, T.; Corò, F.; Mancini, S. A realistic model to support rescue operations after an earthquake via UAVs. IEEE Access 2022, 10, 6109–6125. [Google Scholar] [CrossRef]
  14. Dominici, D.; Alicandro, M.; Massimi, V. UAV photogrammetry in the post-earthquake scenario: Case studies in L’Aquila. Geomat. Nat. Hazards Risk 2017, 8, 87–103. [Google Scholar] [CrossRef]
  15. Nedjati, A.; Vizvari, B.; Izbirak, G. Post-earthquake response by small UAV helicopters. Nat. Hazards 2016, 80, 1669–1688. [Google Scholar] [CrossRef]
  16. Doherty, P.; Rudol, P. A UAV search and rescue scenario with human body detection and geolocalization. In Proceedings of the Australasian Joint Conference on Artificial Intelligence, Gold Coast, Australia, 2–6 December 2007; Springer: Berlin/Heidelberg, Germany, 2007; pp. 1–13. [Google Scholar]
  17. Wu, G.; Gao, X.; Fu, X.; Wan, K.; Di, R. Mobility control of unmanned aerial vehicle as communication relay in airborne multi-user systems. Chin. J. Aeronaut. 2019, 32, 1520–1529. [Google Scholar] [CrossRef]
  18. Goodrich, M.A.; Morse, B.S.; Gerhardt, D.; Cooper, J.L.; Quigley, M.; Adams, J.A.; Humphrey, C. Supporting wilderness search and rescue using a camera-equipped mini UAV. J. Field Robot. 2008, 25, 89–110. [Google Scholar] [CrossRef]
  19. Lin, L.; Goodrich, M.A. UAV intelligent path planning for wilderness search and rescue. In Proceedings of the 2009 IEEE/RSJ International Conference on Intelligent Robots and Systems, St. Louis, MO, USA, 11–15 October 2009; pp. 709–714. [Google Scholar]
  20. Schedl, D.C.; Kurmi, I.; Bimber, O. An autonomous drone for search and rescue in forests using airborne optical sectioning. Sci. Robot. 2021, 6, eabg1188. [Google Scholar] [CrossRef]
  21. Moro, S.; Linsalata, F.; Manzoni, M.; Magarini, M.; Tebaldini, S. Exploring ISAC technology for UAV SAR imaging. In Proceedings of the ICC 2024-IEEE International Conference on Communications, Denver, CO, USA, 9–13 June 2024; pp. 1582–1587. [Google Scholar]
  22. Gotovac, S.; Zelenika, D.; Marušić, Ž.; Božić-Štulić, D. Visual-based person detection for search-and-rescue with uas: Humans vs. machine learning algorithm. Remote Sens. 2020, 12, 3295. [Google Scholar] [CrossRef]
  23. Miller, L.M.; Silverman, Y.; MacIver, M.A.; Murphey, T.D. Ergodic exploration of distributed information. IEEE Trans. Robot. 2015, 32, 36–52. [Google Scholar] [CrossRef]
  24. Ivić, S.; Crnković, B.; Mezić, I. Ergodicity-based cooperative multiagent area coverage via a potential field. IEEE Trans. Cybern. 2016, 47, 1983–1993. [Google Scholar] [CrossRef]
  25. Ivić, S.; Sikirica, A.; Crnković, B. Constrained multi-agent ergodic area surveying control based on finite element approximation of the potential field. Eng. Appl. Artif. Intell. 2022, 116, 105441. [Google Scholar] [CrossRef]
  26. Bircher, A.; Kamel, M.; Alexis, K.; Oleynikova, H.; Siegwart, R. Receding horizon path planning for 3D exploration and surface inspection. Auton. Robot. 2018, 42, 291–306. [Google Scholar] [CrossRef]
  27. Mavrommati, A.; Tzorakoleftherakis, E.; Abraham, I.; Murphey, T.D. Real-time area coverage and target localization using receding-horizon ergodic exploration. IEEE Trans. Robot. 2017, 34, 62–80. [Google Scholar] [CrossRef]
  28. Mathew, G.; Mezić, I. Metrics for ergodicity and design of ergodic dynamics for multi-agent systems. Phys. D Nonlinear Phenom. 2011, 240, 432–442. [Google Scholar] [CrossRef]
  29. Hubenko, A.; Fonoberov, V.A.; Mathew, G.; Mezic, I. Multiscale adaptive search. IEEE Trans. Syst. Man Cybern. Part B (Cybern.) 2011, 41, 1076–1087. [Google Scholar] [CrossRef] [PubMed]
  30. Mathew, G.; Kannan, S.; Surana, A.; Bajekal, S.; Chevva, K.R. Experimental implementation of spectral multiscale coverage and search algorithms for autonomous uavs. In Proceedings of the AIAA Guidance, Navigation, and Control (GNC) Conference, Boston, MA, USA, 19–22 August 2013; p. 5182. [Google Scholar]
  31. Zhu, P.; Wen, L.; Du, D.; Bian, X.; Fan, H.; Hu, Q.; Ling, H. Detection and tracking meet drones challenge. IEEE Trans. Pattern Anal. Mach. Intell. 2021, 44, 7380–7399. [Google Scholar] [CrossRef]
  32. Barekatain, M.; Martí, M.; Shih, H.F.; Murray, S.; Nakayama, K.; Matsuo, Y.; Prendinger, H. Okutama-action: An aerial view video dataset for concurrent human action detection. In Proceedings of the IEEE Conference on Computer Vision and Pattern Recognition Workshops, Honolulu, HI, USA, 21–26 July 2017; pp. 28–35. [Google Scholar]
  33. Jocher, G.; Qiu, J.; Chaurasia, A. Ultralytics YOLO. 2023. Available online: https://github.com/ultralytics/ultralytics (accessed on 1 July 2024).
  34. Jiang, P.; Ergu, D.; Liu, F.; Cai, Y.; Ma, B. A Review of Yolo algorithm developments. Procedia Comput. Sci. 2022, 199, 1066–1073. [Google Scholar] [CrossRef]
  35. Terven, J.; Córdova-Esparza, D.M.; Romero-González, J.A. A comprehensive review of yolo architectures in computer vision: From yolov1 to yolov8 and yolo-nas. Mach. Learn. Knowl. Extr. 2023, 5, 1680–1716. [Google Scholar] [CrossRef]
  36. Hussain, M. YOLO-v1 to YOLO-v8, the rise of YOLO and its complementary nature toward digital manufacturing and industrial defect detection. Machines 2023, 11, 677. [Google Scholar] [CrossRef]
  37. Gonzalez, L.F.; Montes, G.A.; Puig, E.; Johnson, S.; Mengersen, K.; Gaston, K.J. Unmanned aerial vehicles (UAVs) and artificial intelligence revolutionizing wildlife monitoring and conservation. Sensors 2016, 16, 97. [Google Scholar] [CrossRef]
  38. Messina, G.; Modica, G. Applications of UAV thermal imagery in precision agriculture: State of the art and future research outlook. Remote Sens. 2020, 12, 1491. [Google Scholar] [CrossRef]
  39. Krišto, M.; Ivasic-Kos, M.; Pobar, M. Thermal object detection in difficult weather conditions using YOLO. IEEE Access 2020, 8, 125459–125476. [Google Scholar] [CrossRef]
  40. Jiang, C.; Ren, H.; Ye, X.; Zhu, J.; Zeng, H.; Nan, Y.; Sun, M.; Ren, X.; Huo, H. Object detection from UAV thermal infrared images and videos using YOLO models. Int. J. Appl. Earth Obs. Geoinf. 2022, 112, 102912. [Google Scholar] [CrossRef]
  41. Kannadaguli, P. YOLO v4 based human detection system using aerial thermal imaging for UAV based surveillance applications. In Proceedings of the 2020 International Conference on Decision Aid Sciences and Application (DASA), Sakheer, Bahrain, 8–9 November 2020; pp. 1213–1219. [Google Scholar]
  42. Levin, E.; Zarnowski, A.; McCarty, J.; Bialas, J.; Banaszek, A.; Banaszek, S. Feasibility study of inexpensive thermal sensors and small UAS deployment for living human detection in rescue missions application scenarios. Int. Arch. Photogramm. Remote Sens. Spat. Inf. Sci. 2016, 41, 99–103. [Google Scholar] [CrossRef]
  43. Teutsch, M.; Muller, T.; Huber, M.; Beyerer, J. Low resolution person detection with a moving thermal infrared camera by hot spot classification. In Proceedings of the IEEE Conference on Computer Vision and Pattern Recognition Workshops, Columbus, OH, USA, 23–28 June 2014; pp. 209–216. [Google Scholar]
  44. Giitsidis, T.; Karakasis, E.G.; Gasteratos, A.; Sirakoulis, G.C. Human and fire detection from high altitude uav images. In Proceedings of the IEEE 2015 23rd Euromicro International Conference on Parallel, Distributed, and Network-Based Processing, Turku, Finland, 4–6 March 2015; pp. 309–315. [Google Scholar]
  45. Yeom, S. Moving people tracking and false track removing with infrared thermal imaging by a multirotor. Drones 2021, 5, 65. [Google Scholar] [CrossRef]
  46. Yeom, S. Thermal Image Tracking for Search and Rescue Missions with a Drone. Drones 2024, 8, 53. [Google Scholar] [CrossRef]
  47. Copernicus. Available online: https://www.copernicus.eu/en (accessed on 1 July 2024).
Figure 1. The FOV of a single UAV is represented by a semi-transparent pyramid. The detection probability in the UAV’s FOV is shown using a gradient that increases the detection probability for points closer to the UAV’s orthogonal view according to the sensing model, while the undetectable points are represented in green color.
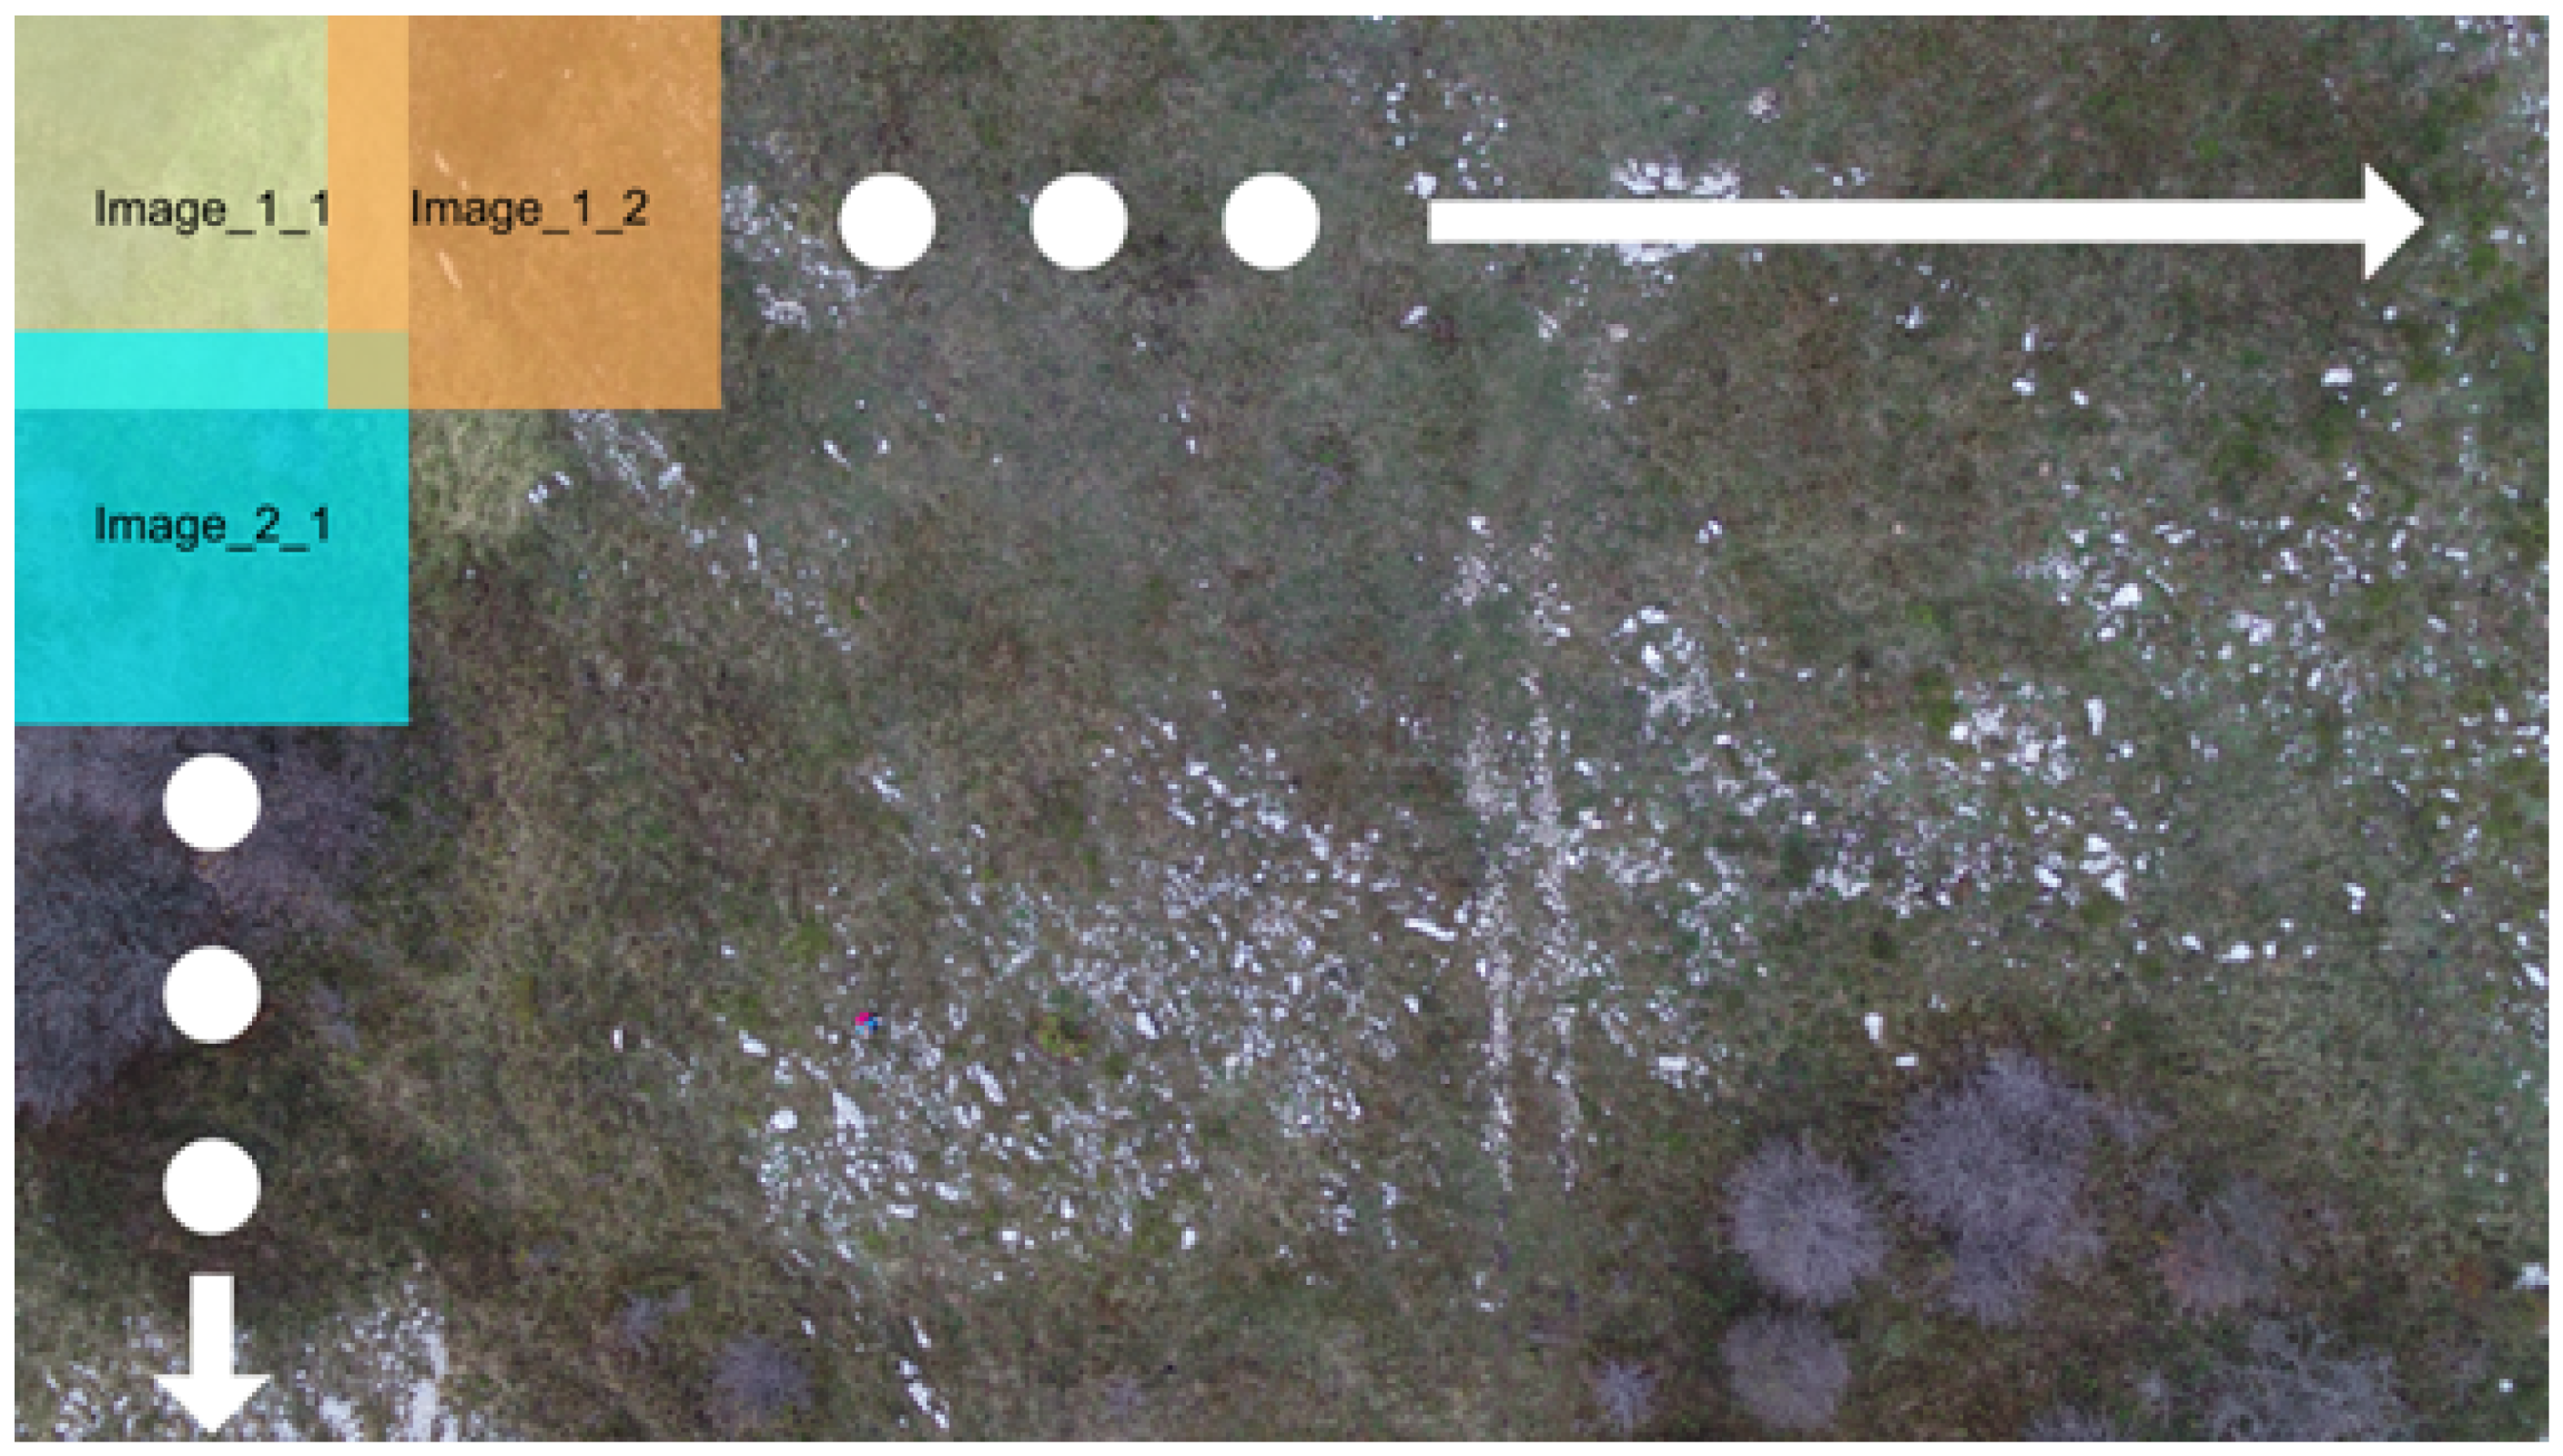
Drones 09 00473 g001
Figure 2. The tiling method used to divide original sized images into images of 512 × 512 pixels. The overlap ensures more context being available in the newly created dataset.
Drones 09 00473 g002
Figure 3. Distribution of images captured by each camera categorized by GSD. The majority of the images have a GSD ranging from 1.0 to 2.5 cm/px indicating high spatial resolution across most images. This initial distribution is directly relevant to the main experiment where the flight regime is optimized resulting in a similar distribution of having most images in the range of 1.5–3.0 cm/px.
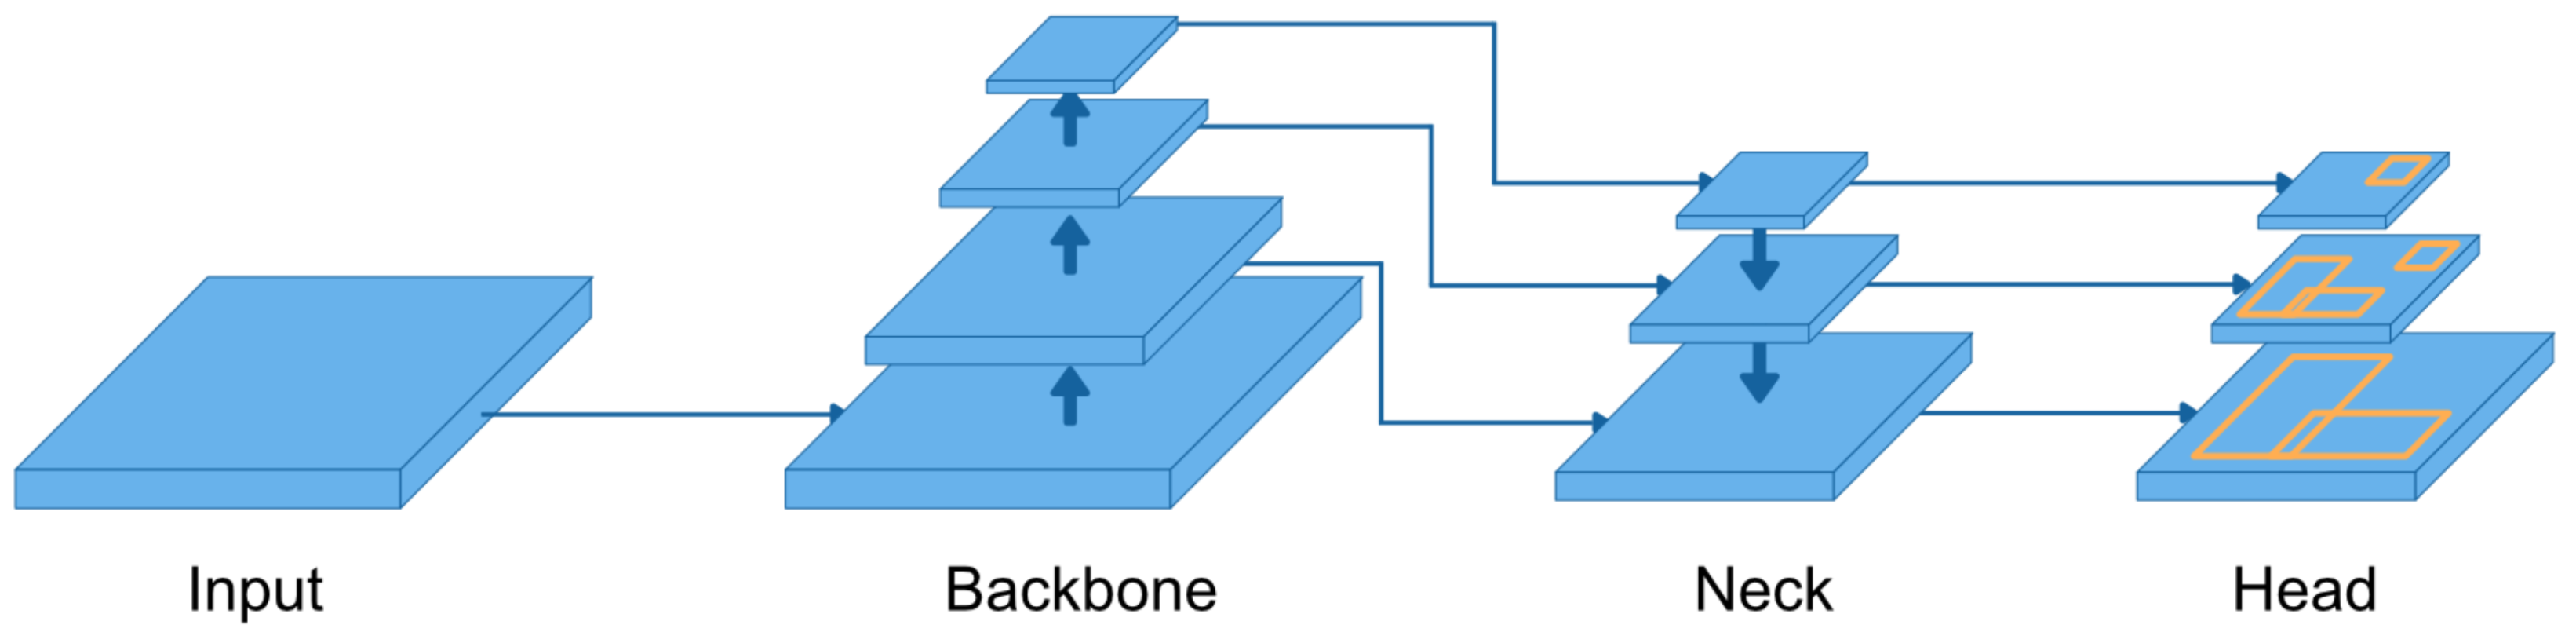
Drones 09 00473 g003
Figure 4. Simplified YOLO architecture. The input data is sent to the backbone which extracts image features by propagating it through multiple layers. The neck is enhancing the created feature maps by using different scales. The head is predicting bounding boxes.
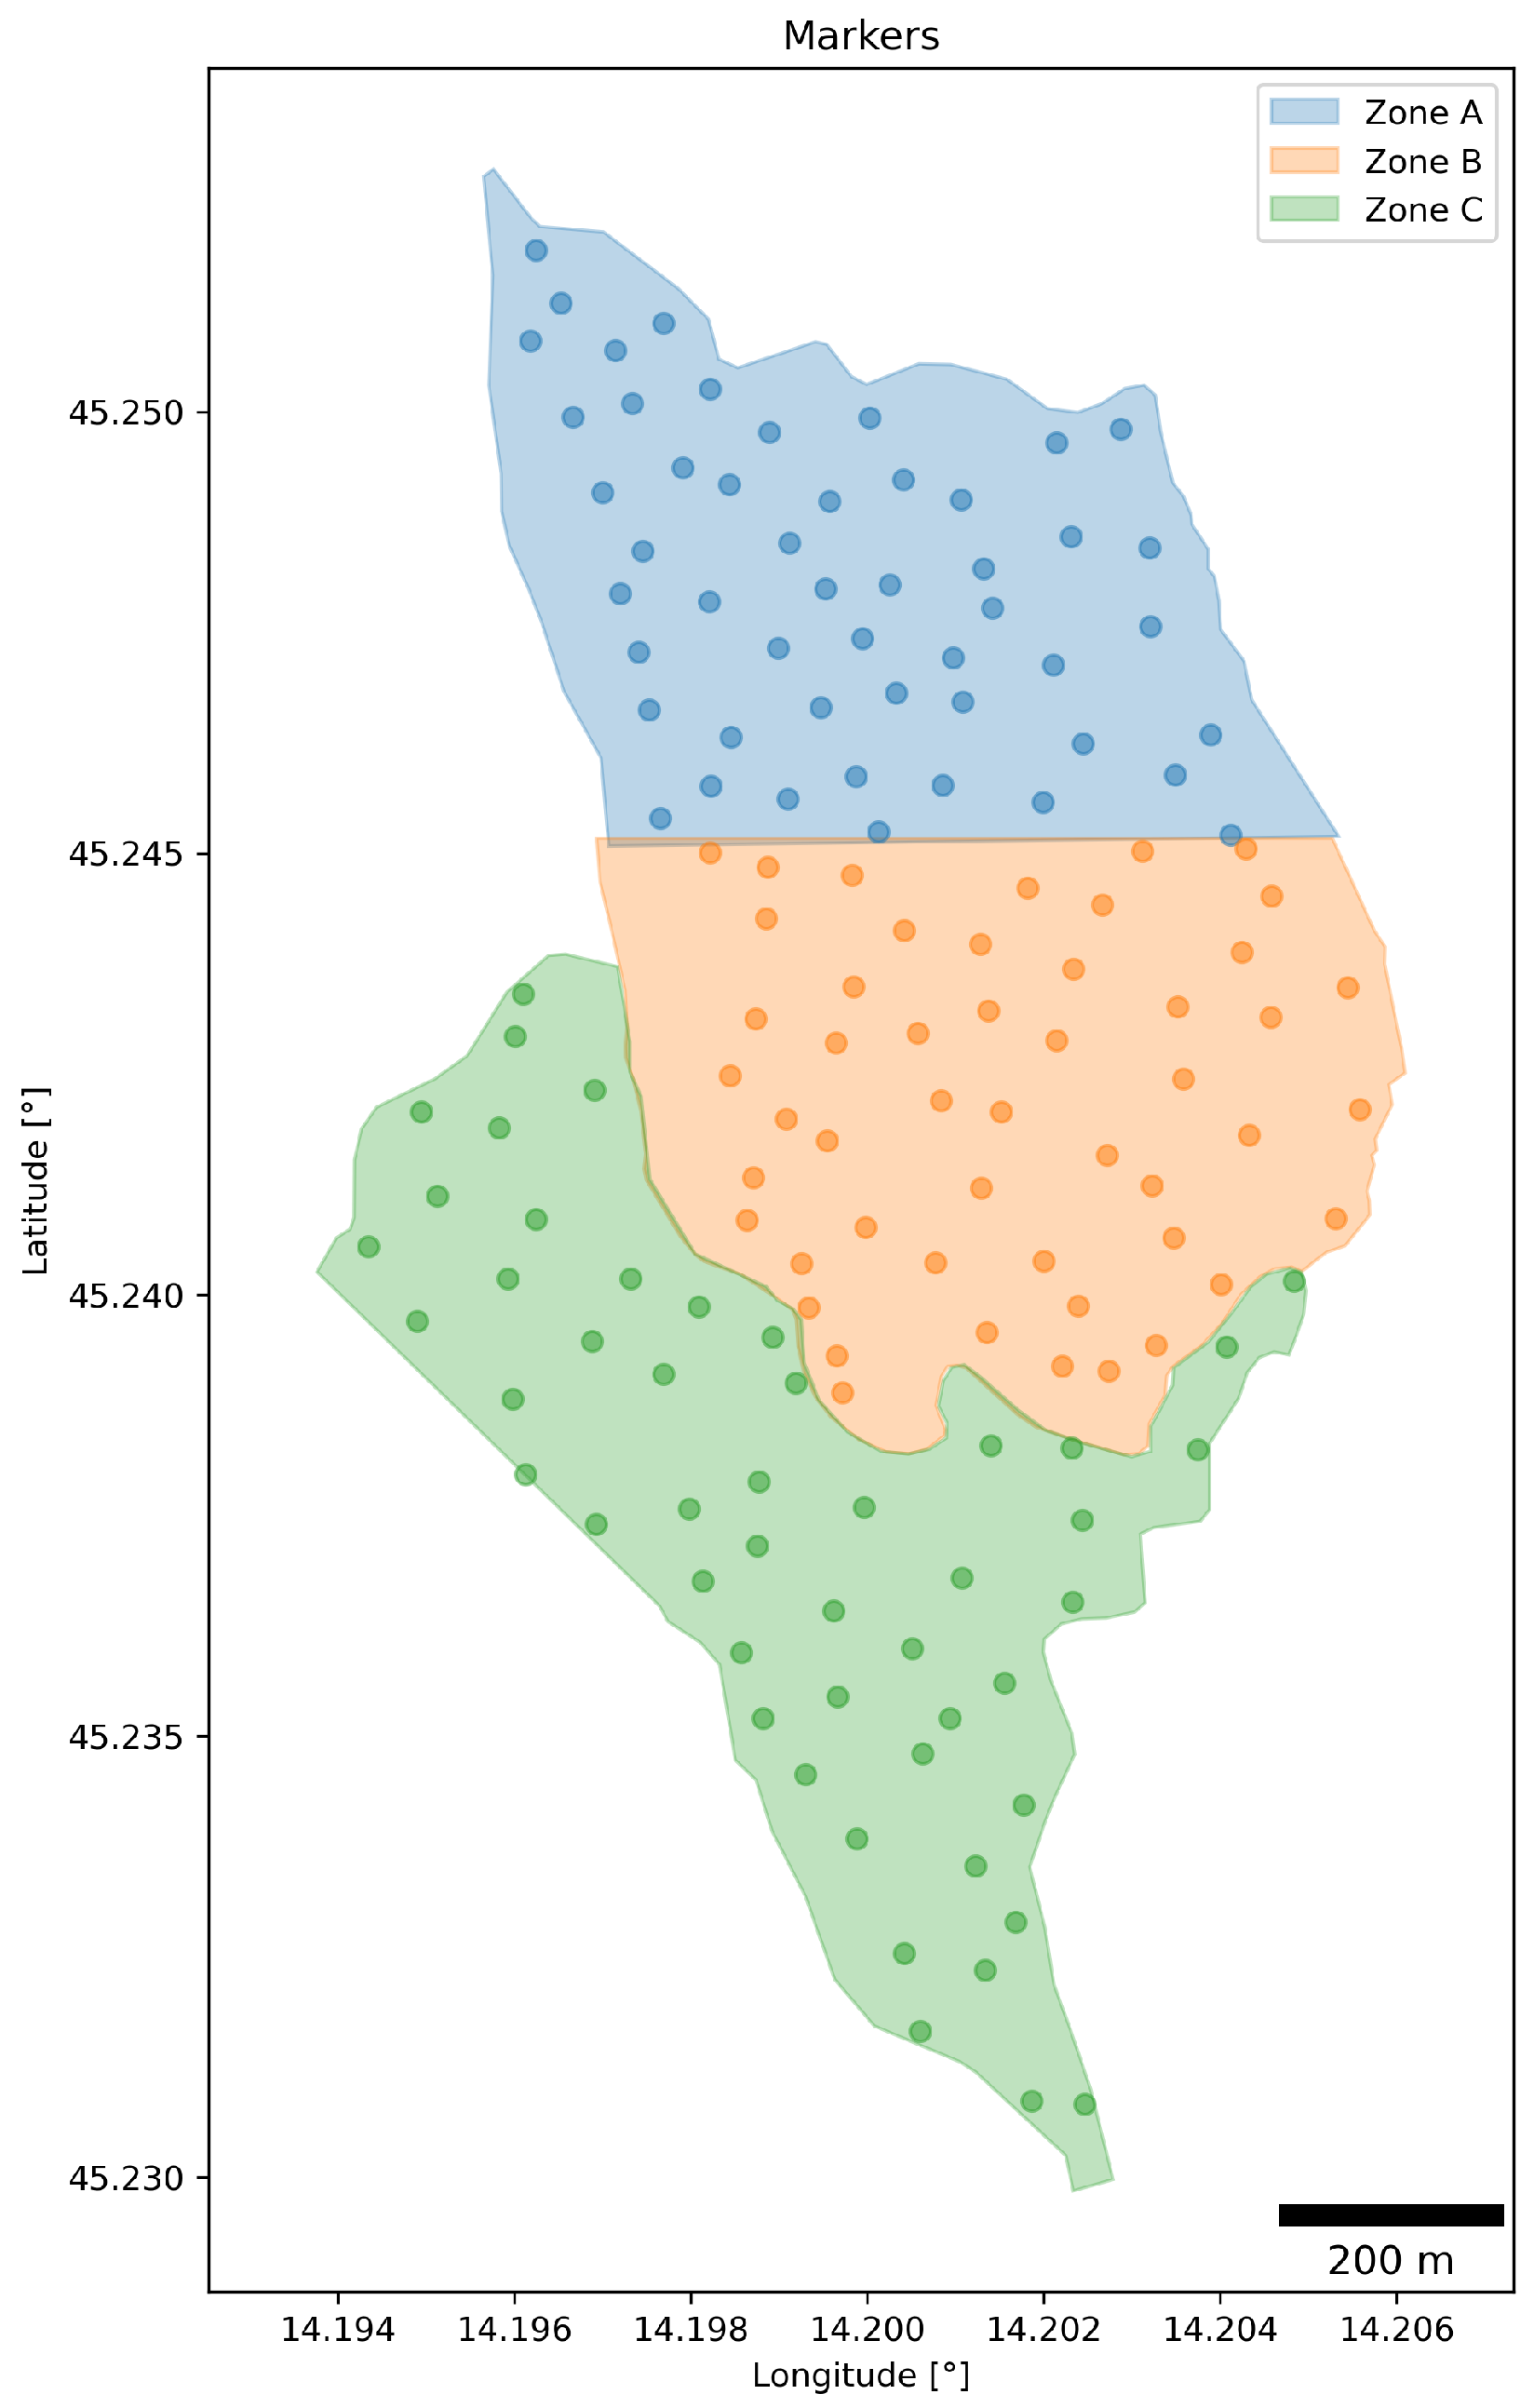
Drones 09 00473 g004
Figure 5. Three zones and their corresponding markers. Each zone contains 50 markers for the treasure hunt ensuring a uniform distribution of participants during the search experiment.
Drones 09 00473 g005
Figure 6. The information flier containing the map of the search area and zones in (a) as well as all important information for the participants and the log section in (b). The original version of the flier is in Croatian, but for the purpose of including this flier in the paper, it has been translated into English.
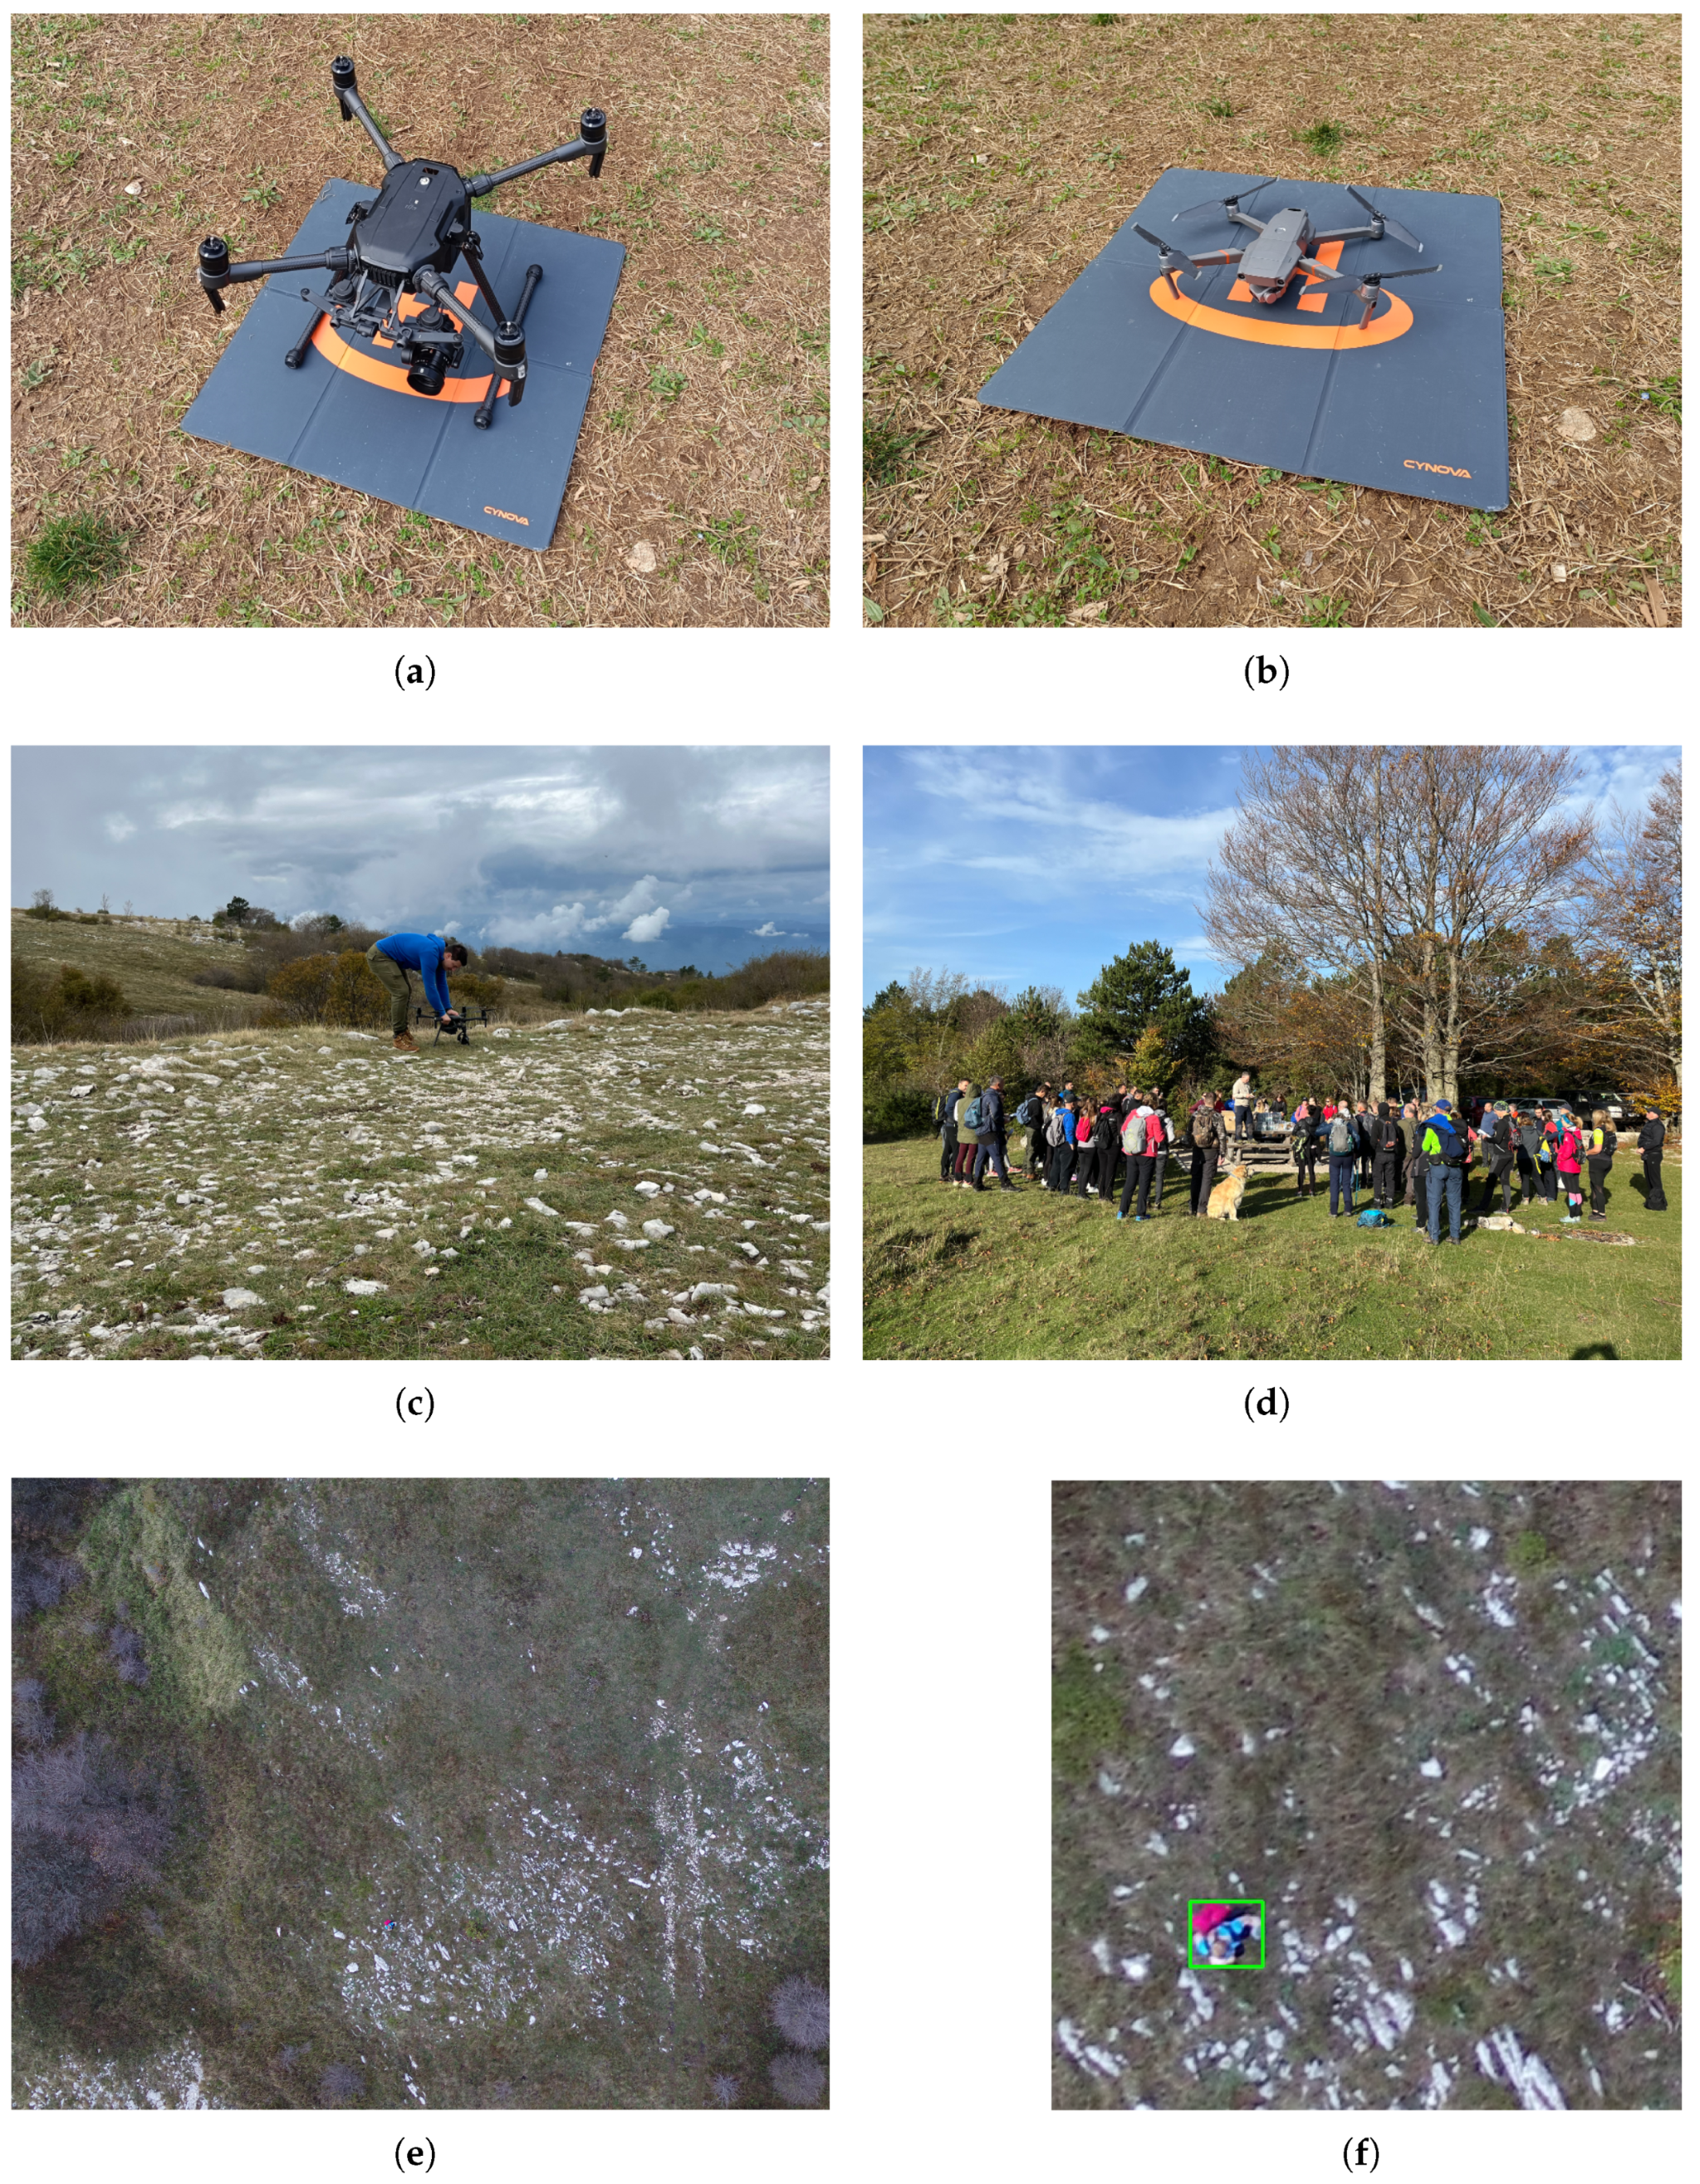
Drones 09 00473 g006
Figure 7. Scenes from conducting the experiment. Subfigure (a) shows the Matrice 210 v2 UAV and Subfigure (b) displays the Mavic 2 Enterprise Dual UAV. Subfigure (c) illustrates the preparation to begin the mission at the home point of each flight. In (d) the participants are depicted while the introduction speech has been given. Subfigure (e) shows one example of UAV images and (f) presents one tile of the image containing a detected participant.
Drones 09 00473 g007
Figure 8. All flight trajectories of all search missions. (a) visualizes the flights conducted during Search mission 1 consisting of flights 1, 2, and 3. In (b) the trajectory of Search mission 2 is displayed. (c) illustrates the flight trajectory of Search mission 3. (d) combines the trajectories of all search missions.
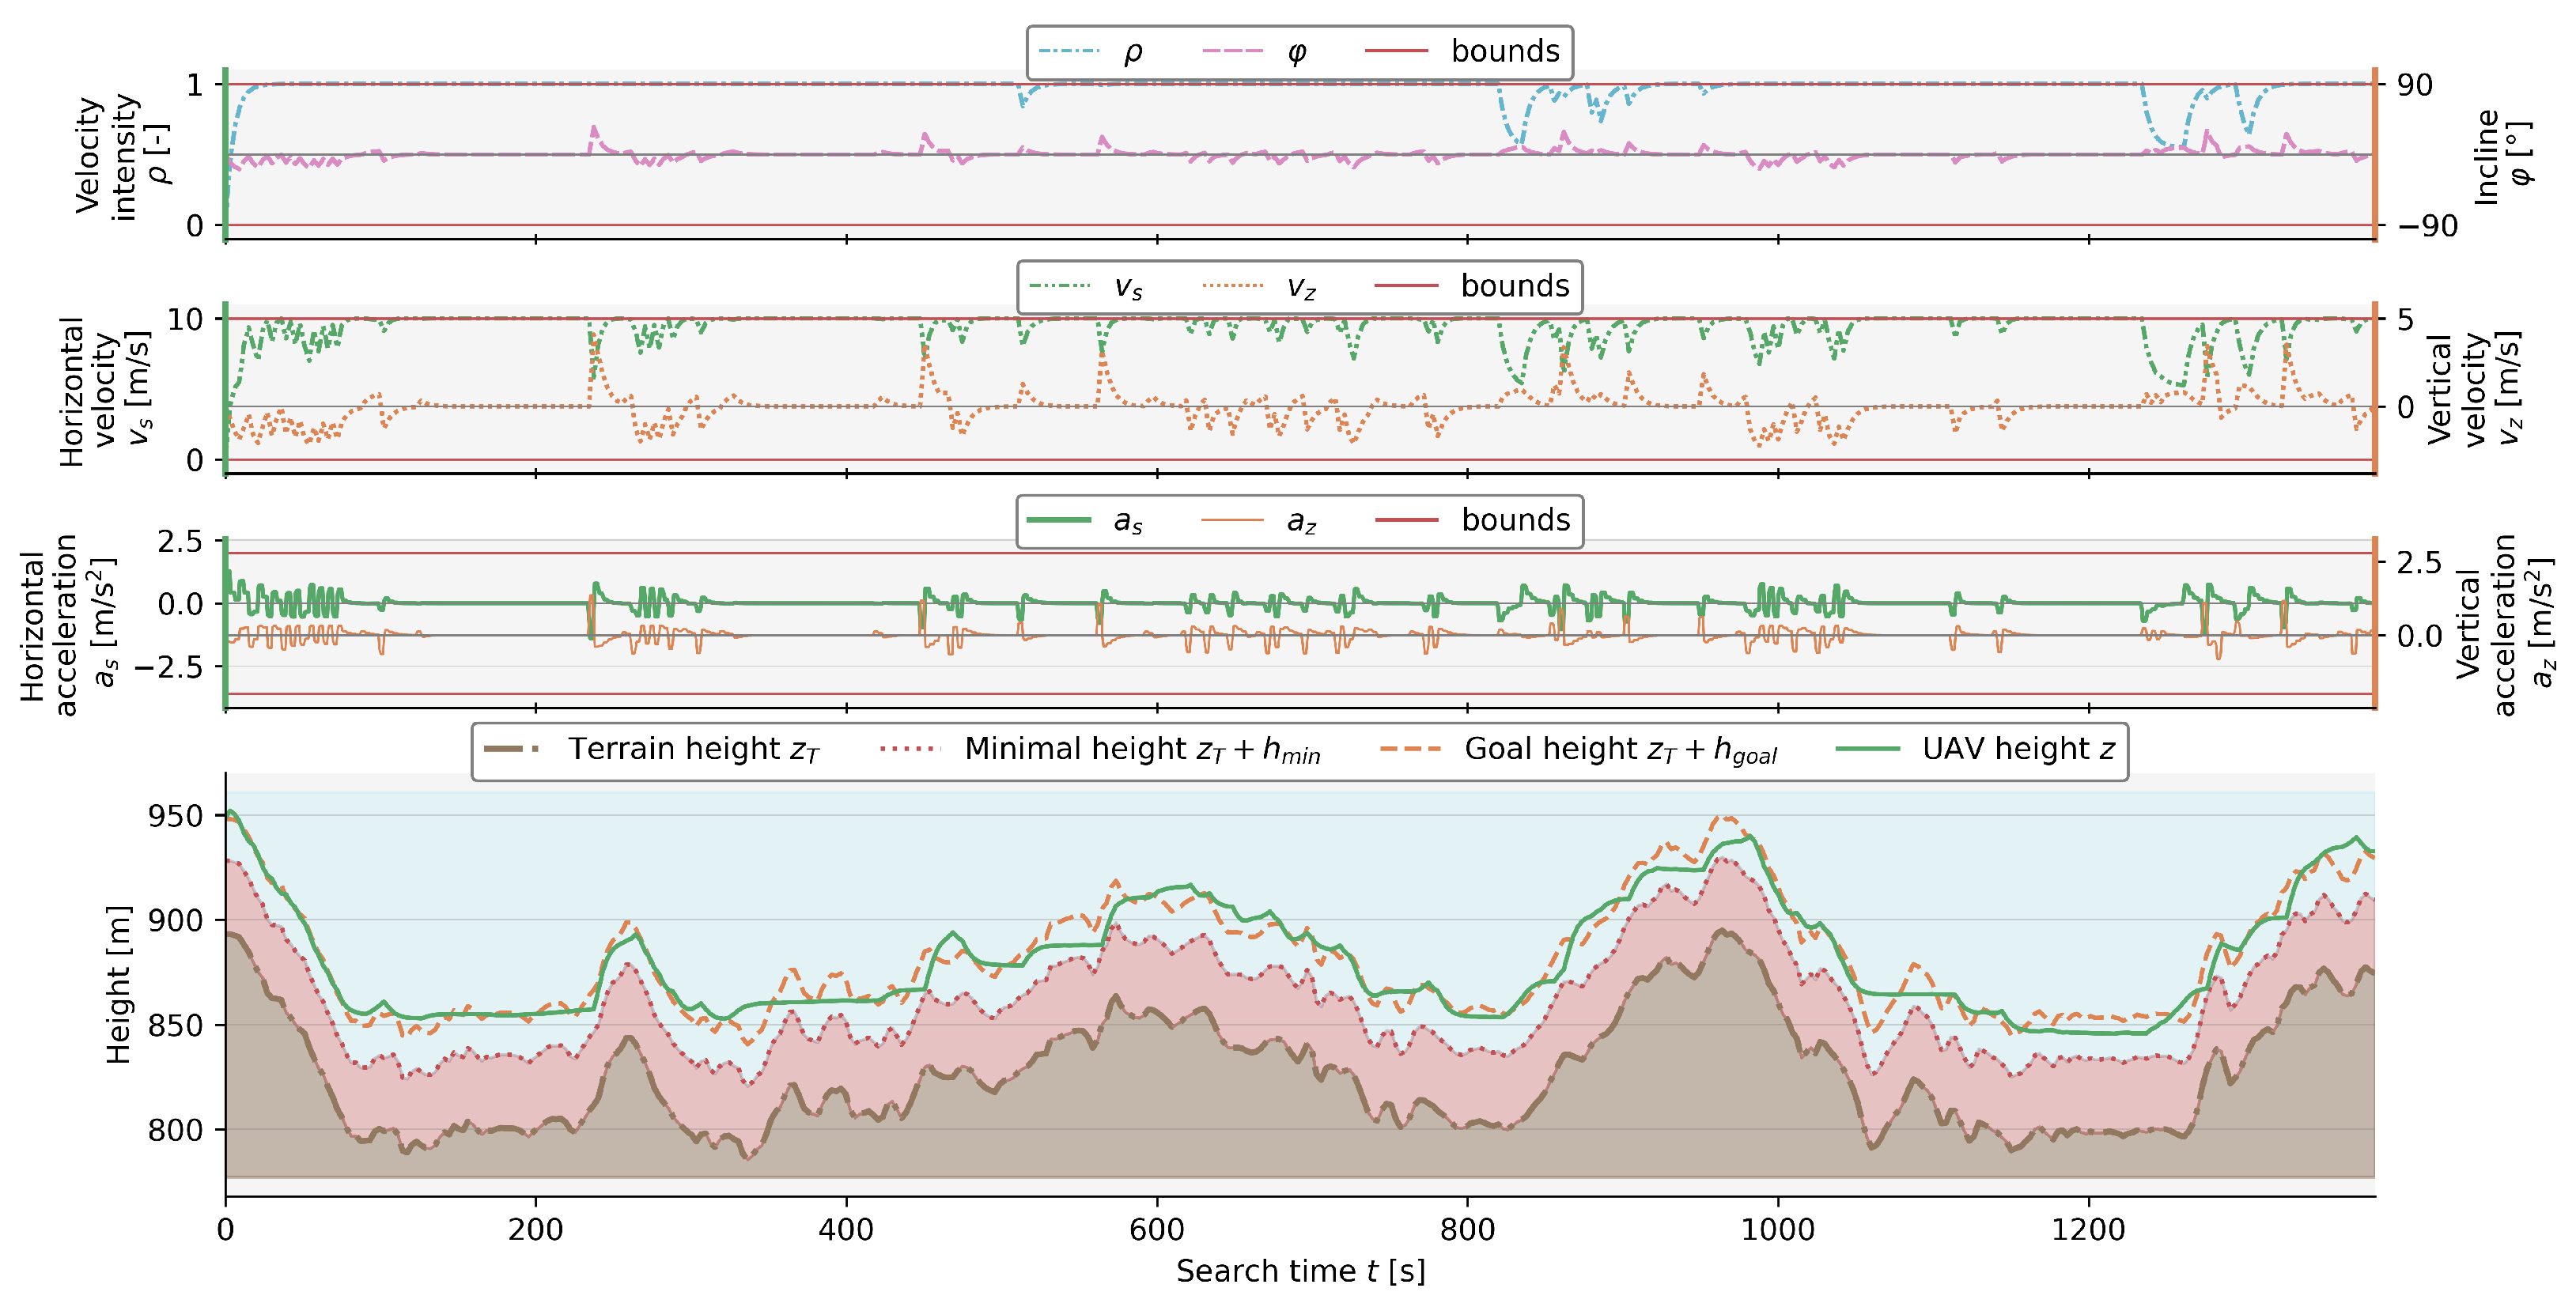
Drones 09 00473 g008
Figure 9. The first flight of Search mission 1 with a MPC horizon length of 15 s during a 1400 s flight. The UAV’s velocity and acceleration is inside the set constraints. The goal flight height is set to 55 m with the UAV maximizing the flight velocity, while minimizing the flight height resulting in a smoother line.
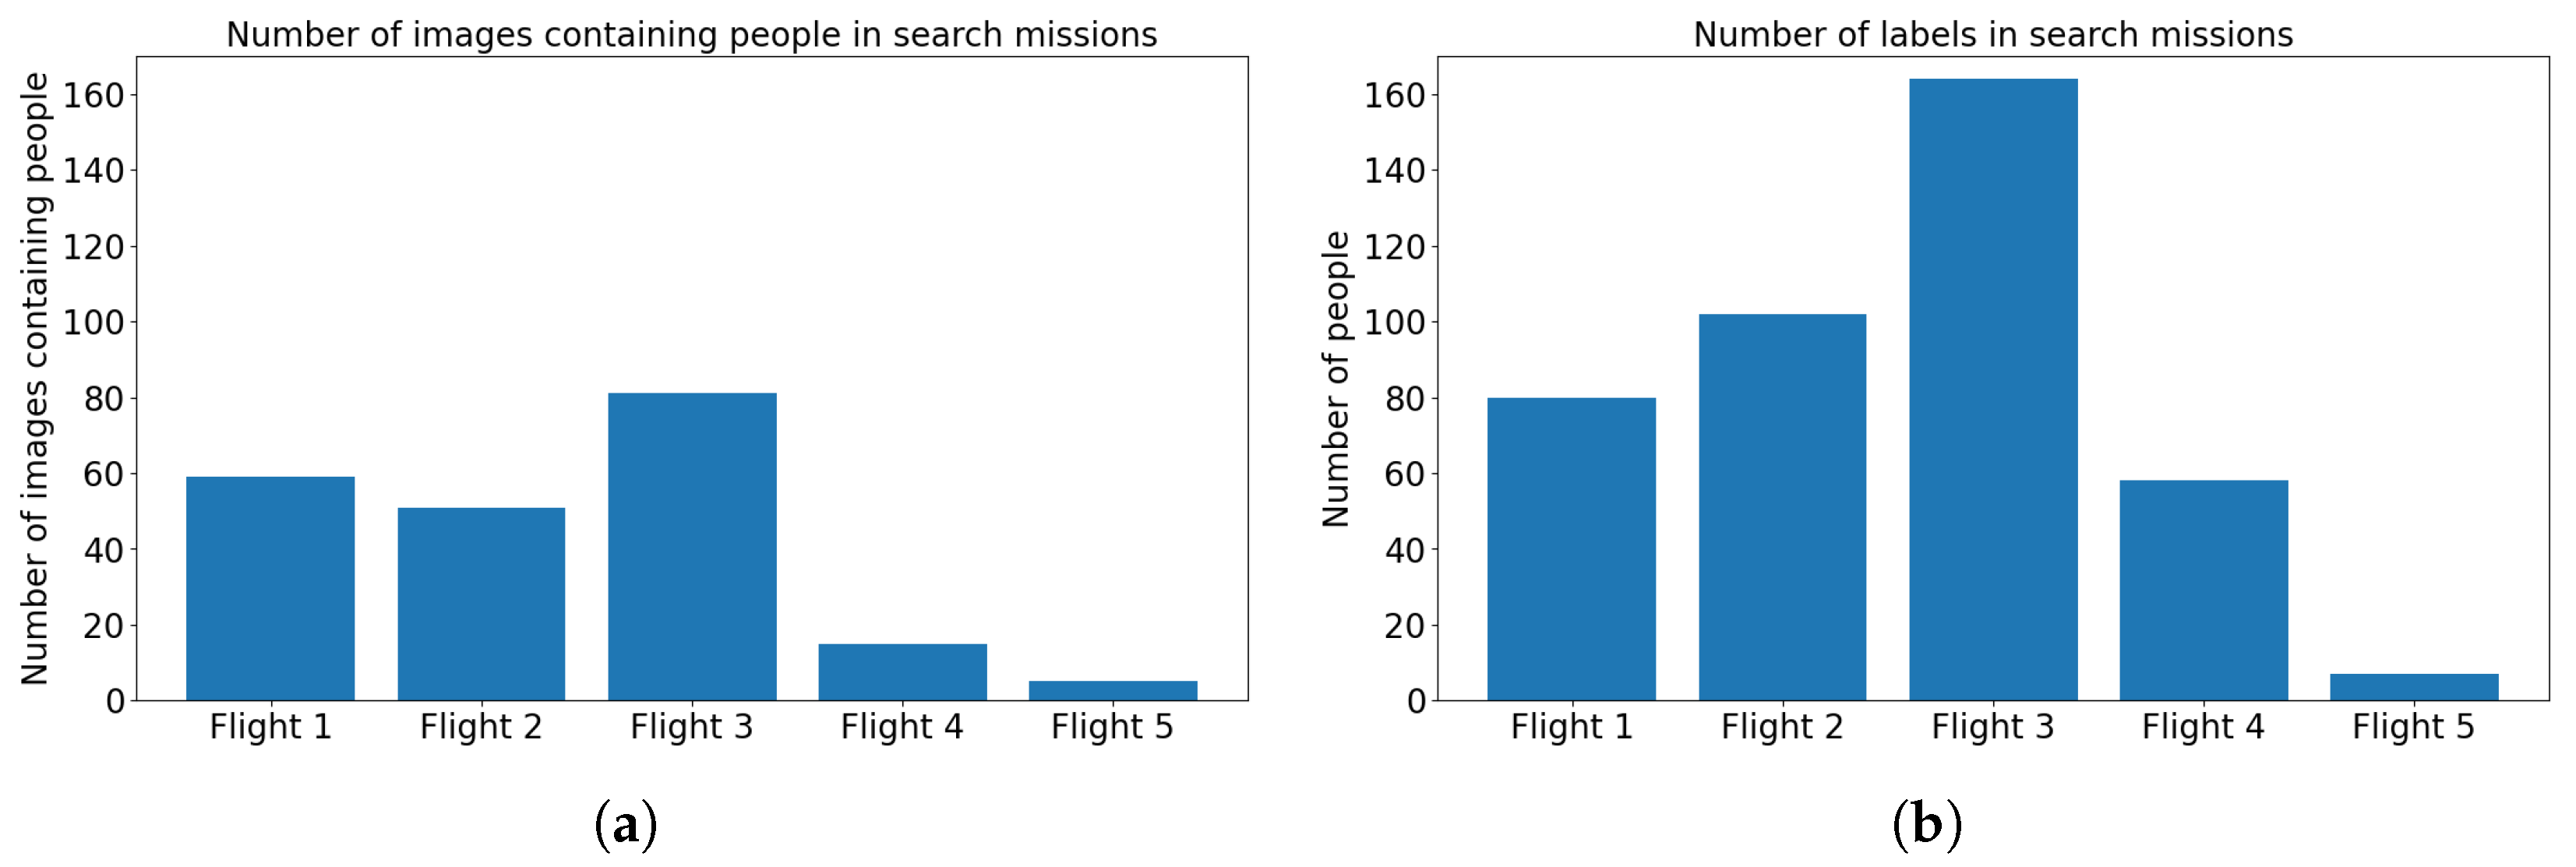
Drones 09 00473 g009
Figure 10. Number of images containing people and number of labels in each search mission. (a) represents the number of images with labels and (b) is showing the number of labels in all UAV flights. It can be seen that the Flight 3 contains most images as well as labels. Flight 1 contains more images with labels than Flight 2, but less labels. Even though Flight 5 consisted of only one zone, it has the lowest number of images containing people and labels.
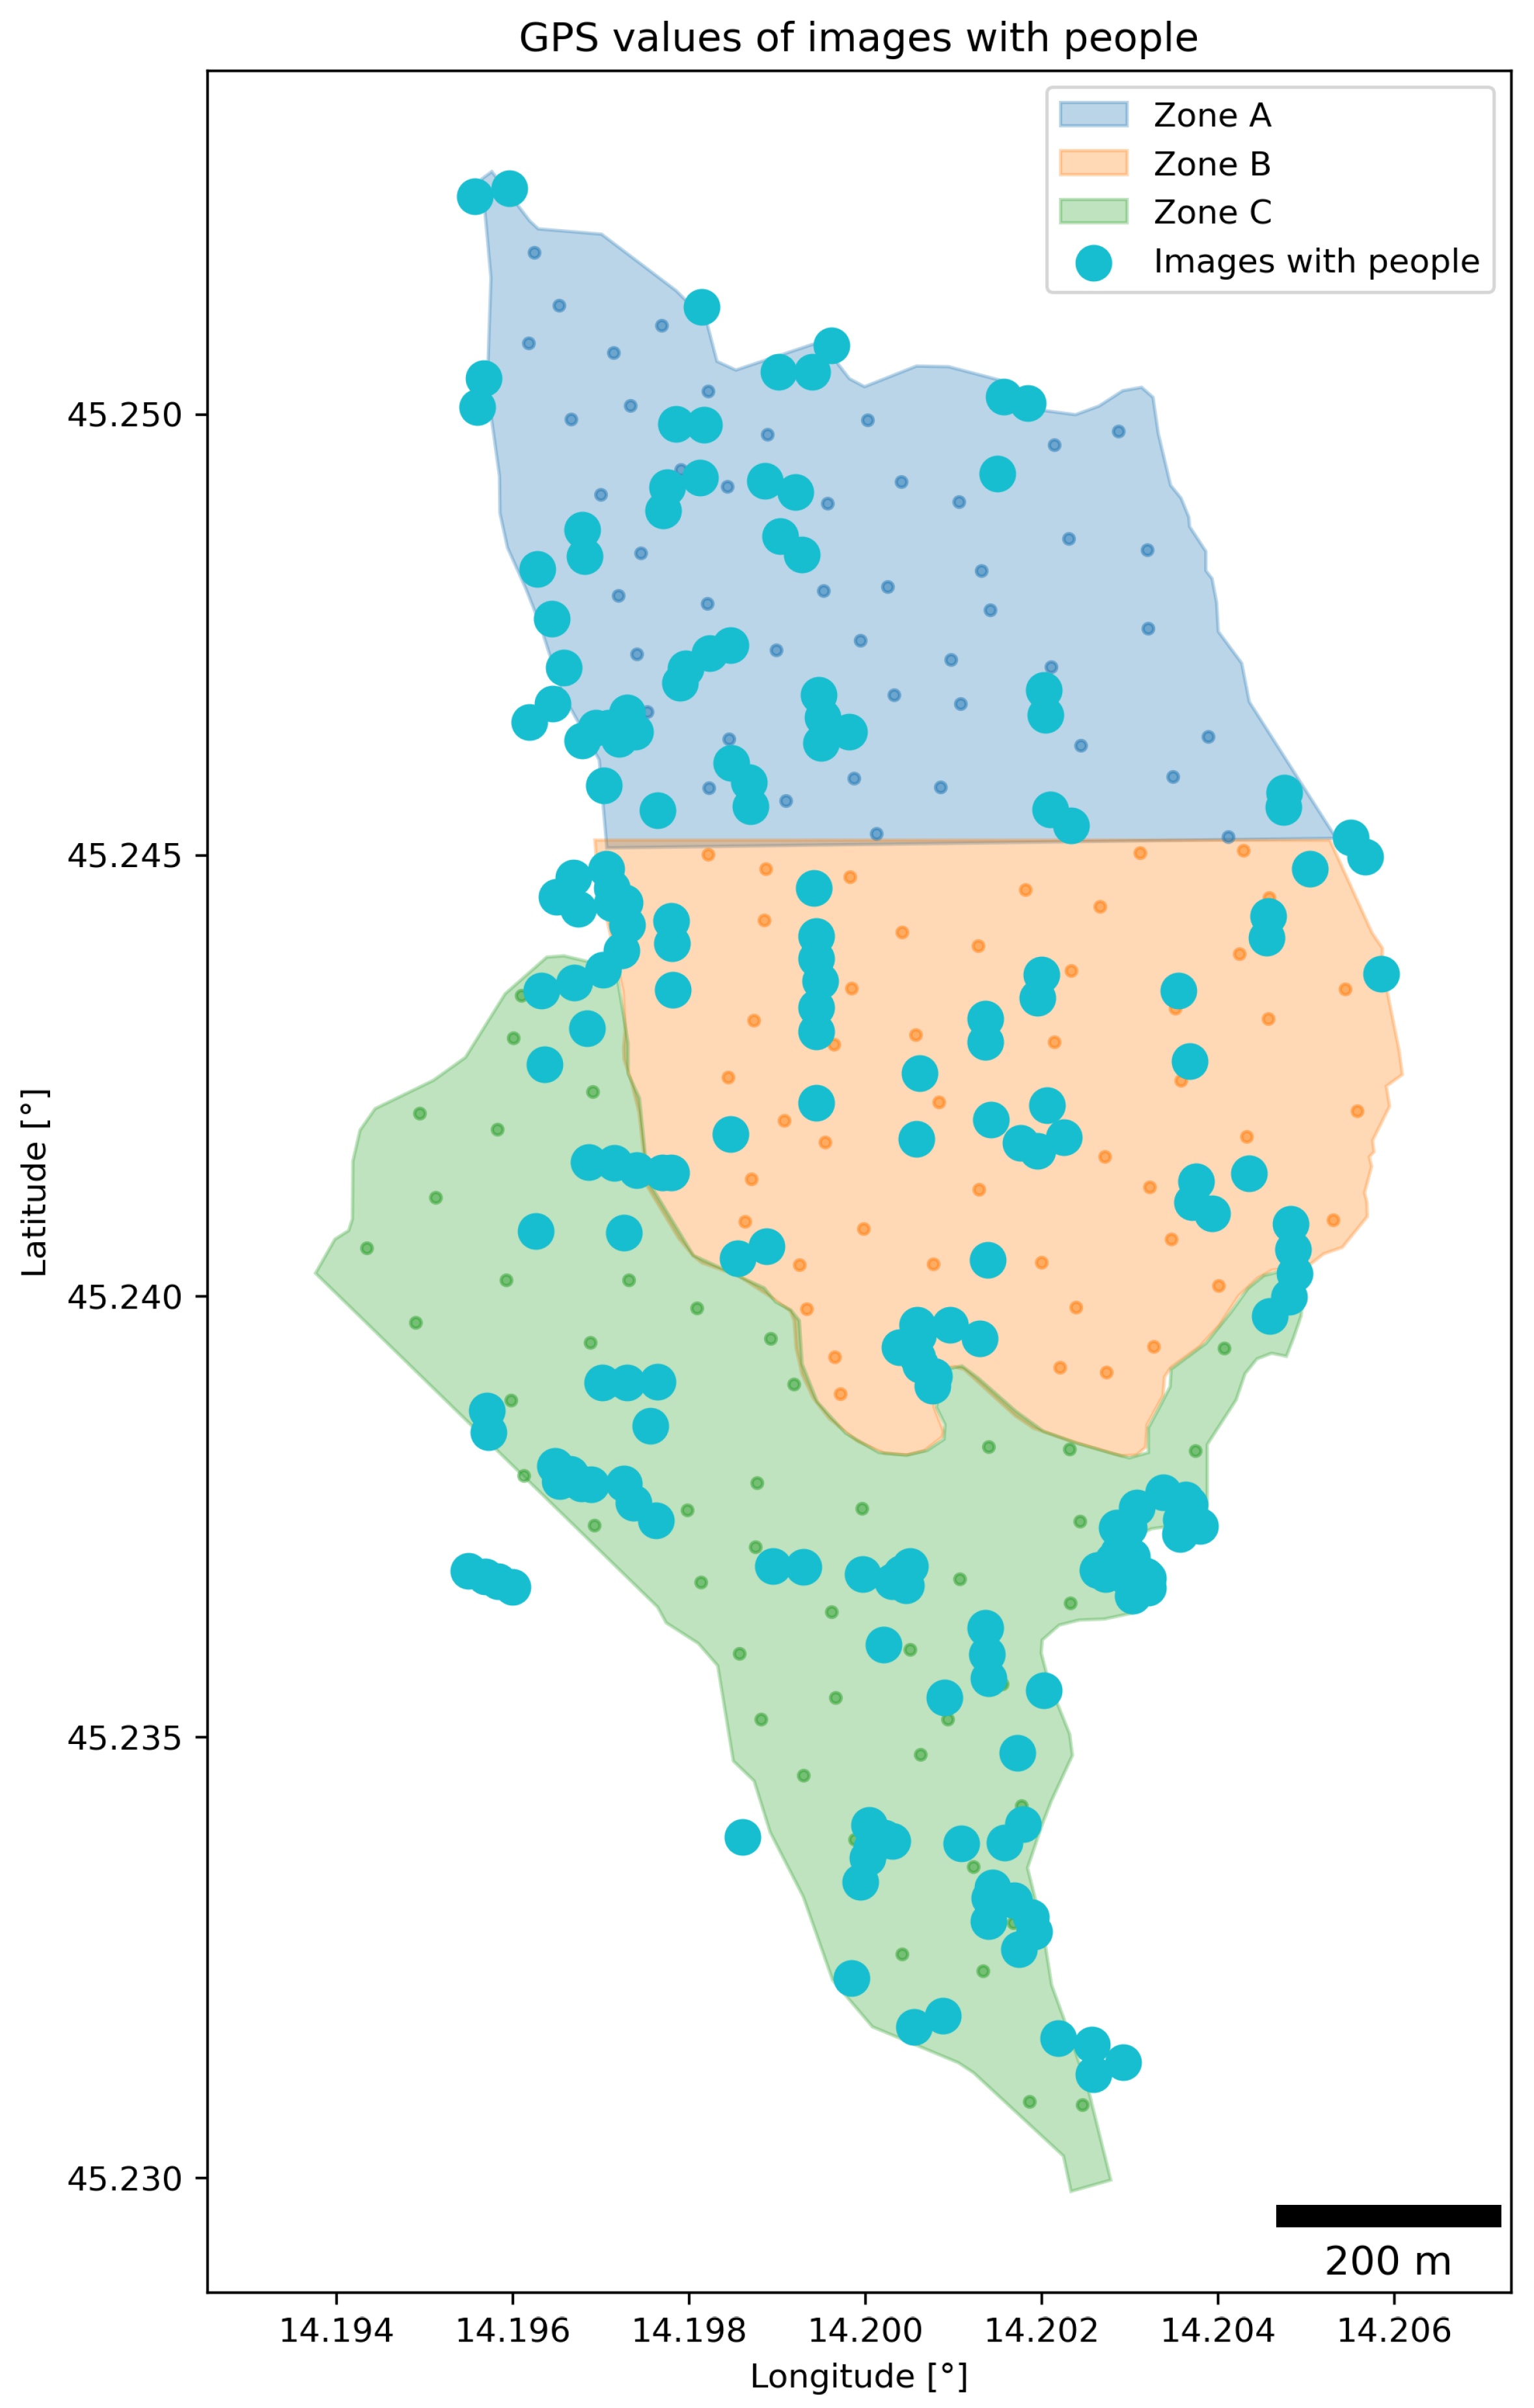
Drones 09 00473 g010
Figure 11. All images containing people and their locations. The UAV flight zone is larger than the defined zones containing markers. Most people were detected in the location of the starting point. This is expected since two UAV flight operators were in this location at all times and took images at the UAV flight start and end of each flight.
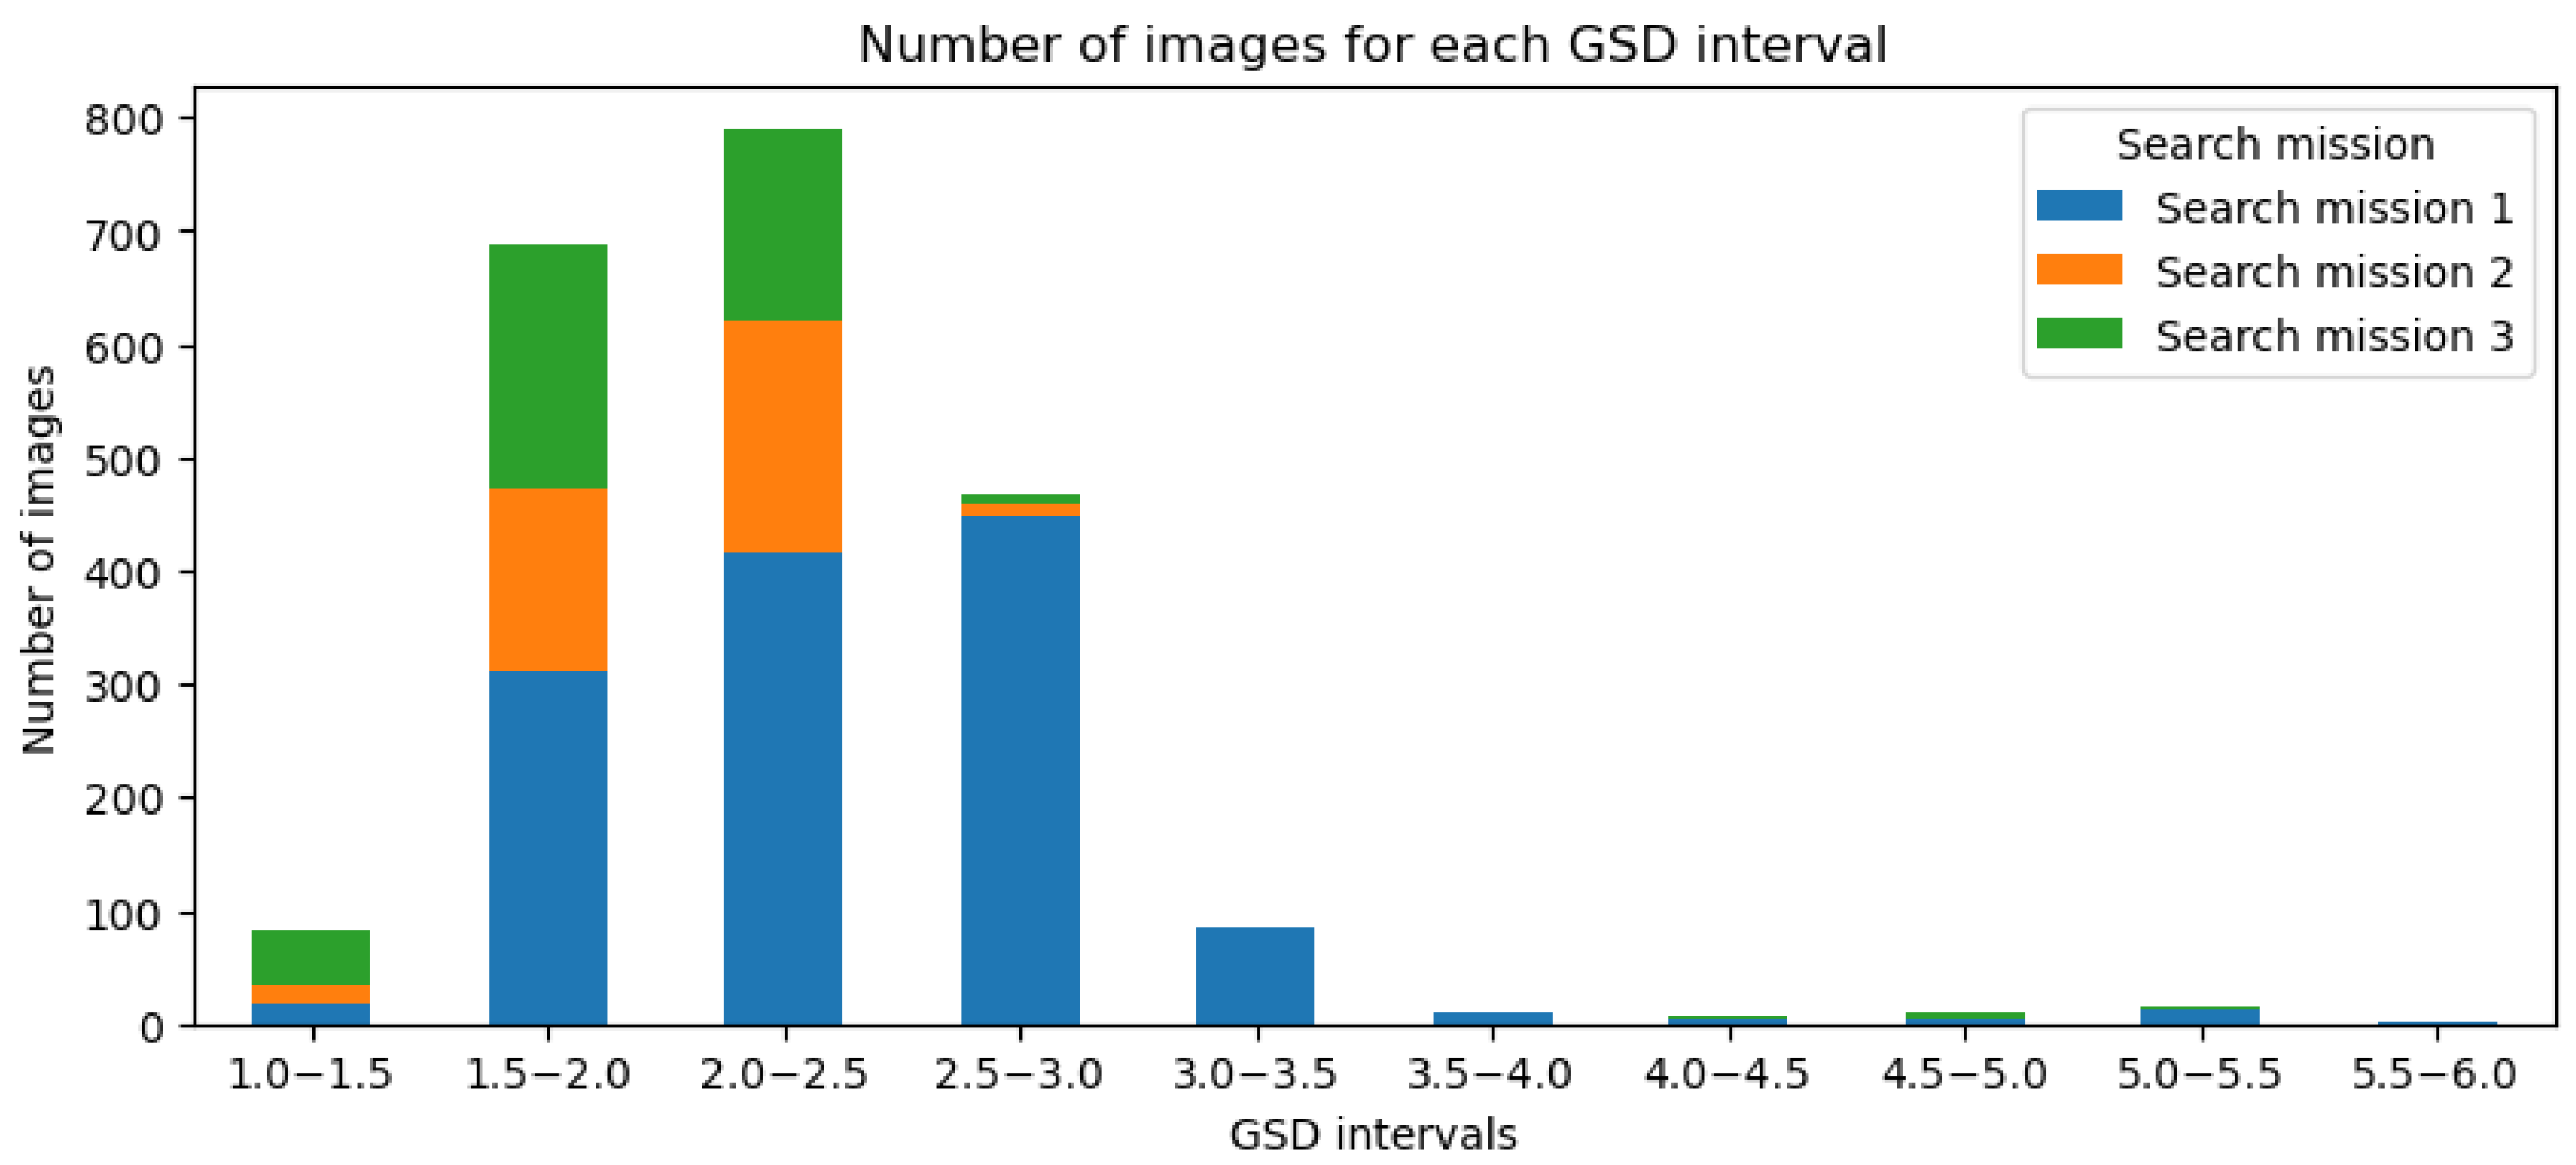
Drones 09 00473 g011
Figure 12. Number of images in each GSD interval for each Mission. Search mission 1 was the longest one and consisted of three flights generating the largest amount of images for most GSD intervals. It is important to note that this represents all images, meaning that not only images with labels are considered, but also images without them.
Drones 09 00473 g012
Figure 13. Recall of images created as tiles of images containing people. The initial experiment was operated manually with no height optimization resulting in more GSD intervals than the autonomously operated missions in the search experiment. Nevertheless, it can be seen that the missions’ recall follows the general trend of the recall declining with higher GSDs.
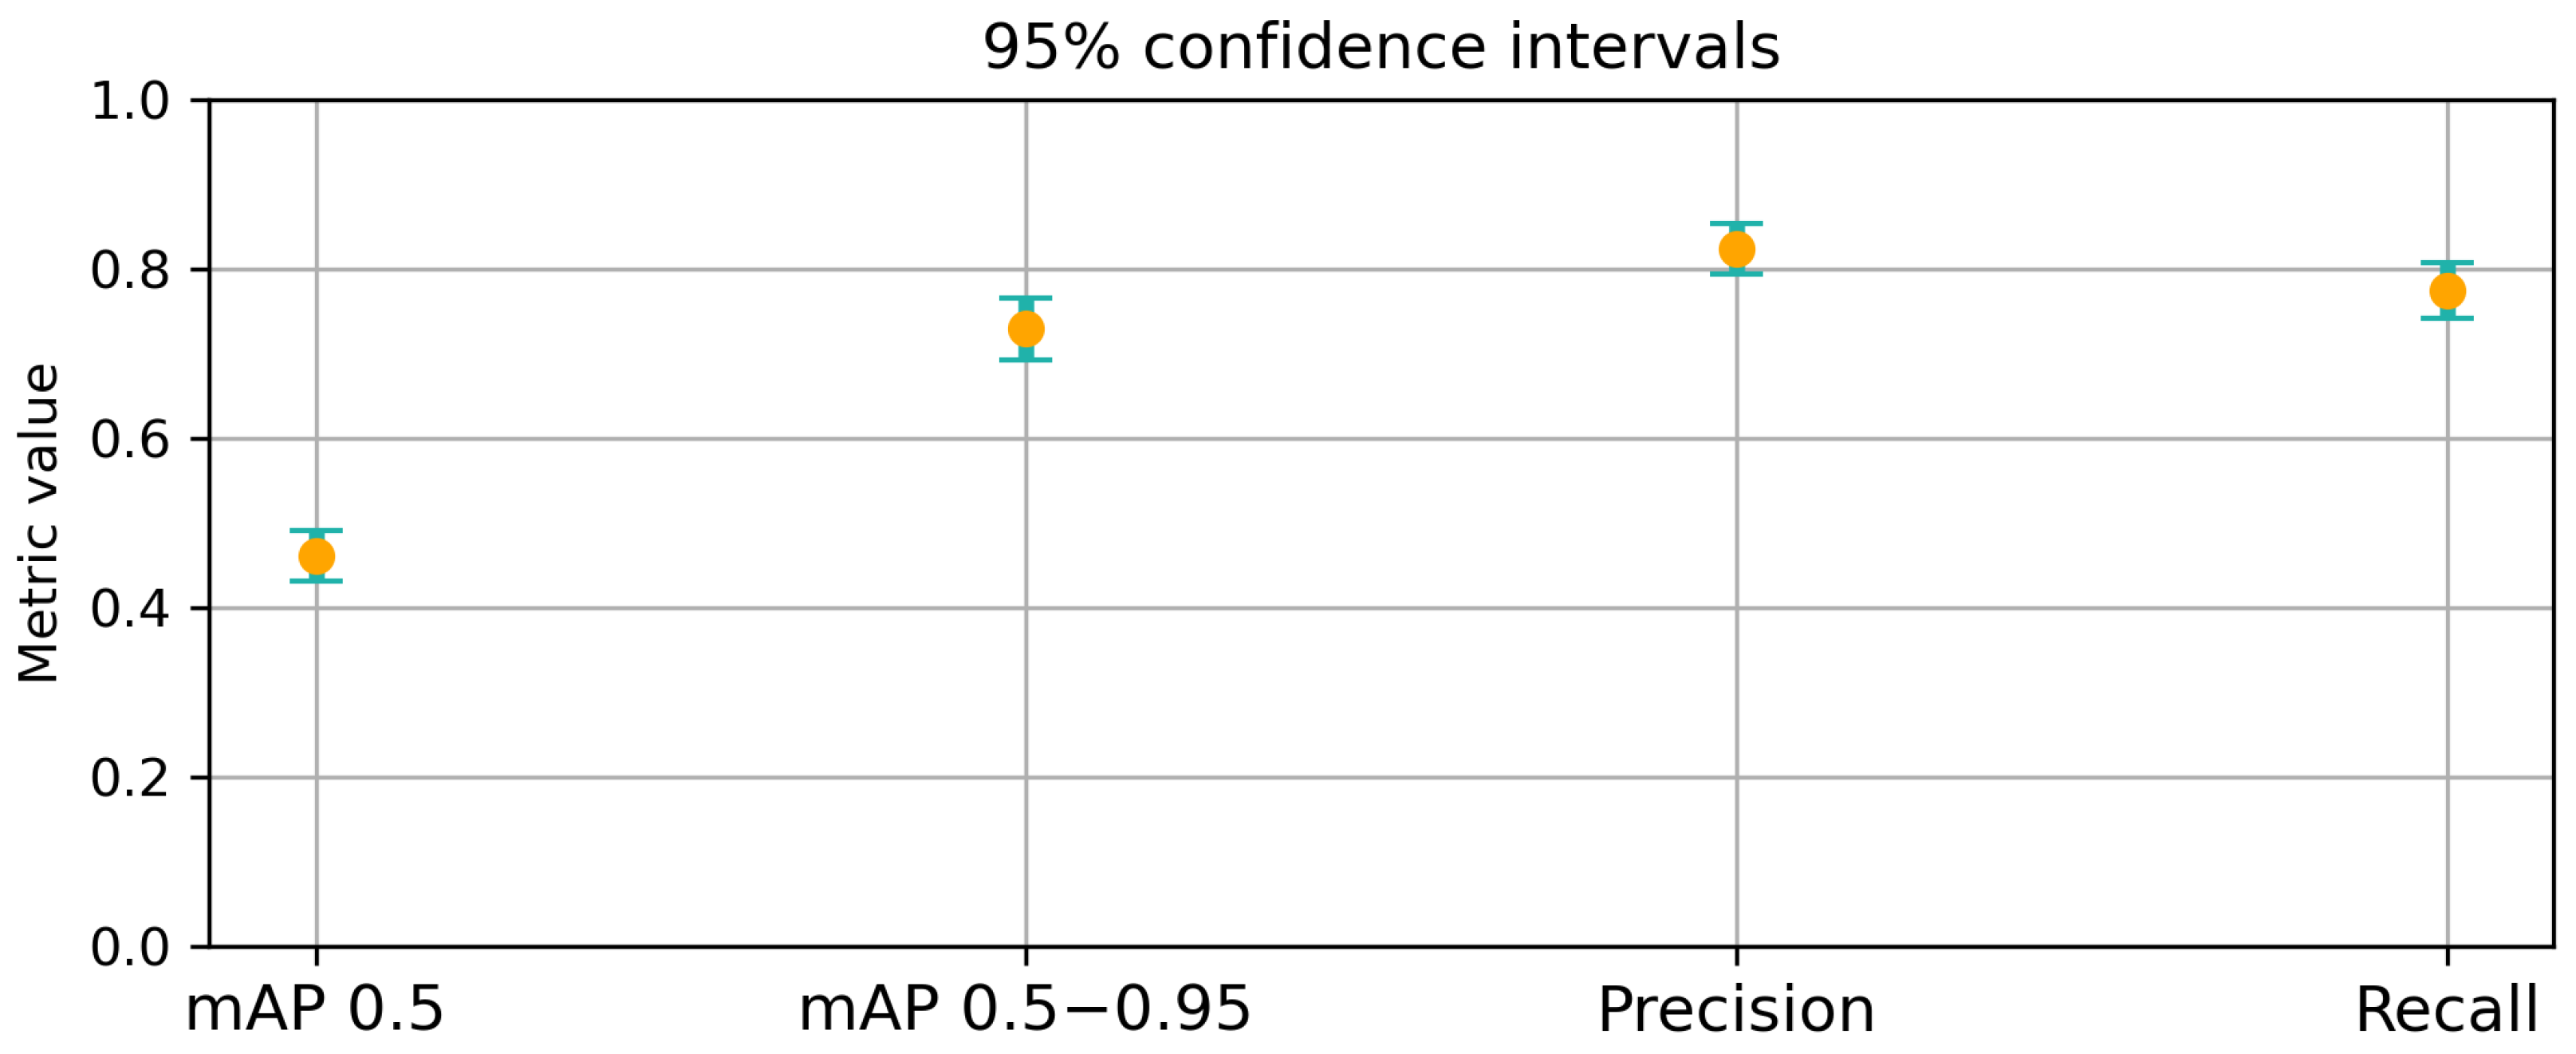
Drones 09 00473 g013
Figure 14. Bootstrapped 95% confidence intervals for detection performance metrics, including mAP 0.5, mAP 0.5–0.95, precision, and recall. To estimate the variability of the metrics, 100 images were randomly sampled from the dataset and this process was repeated 200 times. The results illustrate the variability and robustness of the detection system using repeated sampling, confirming the consistency.
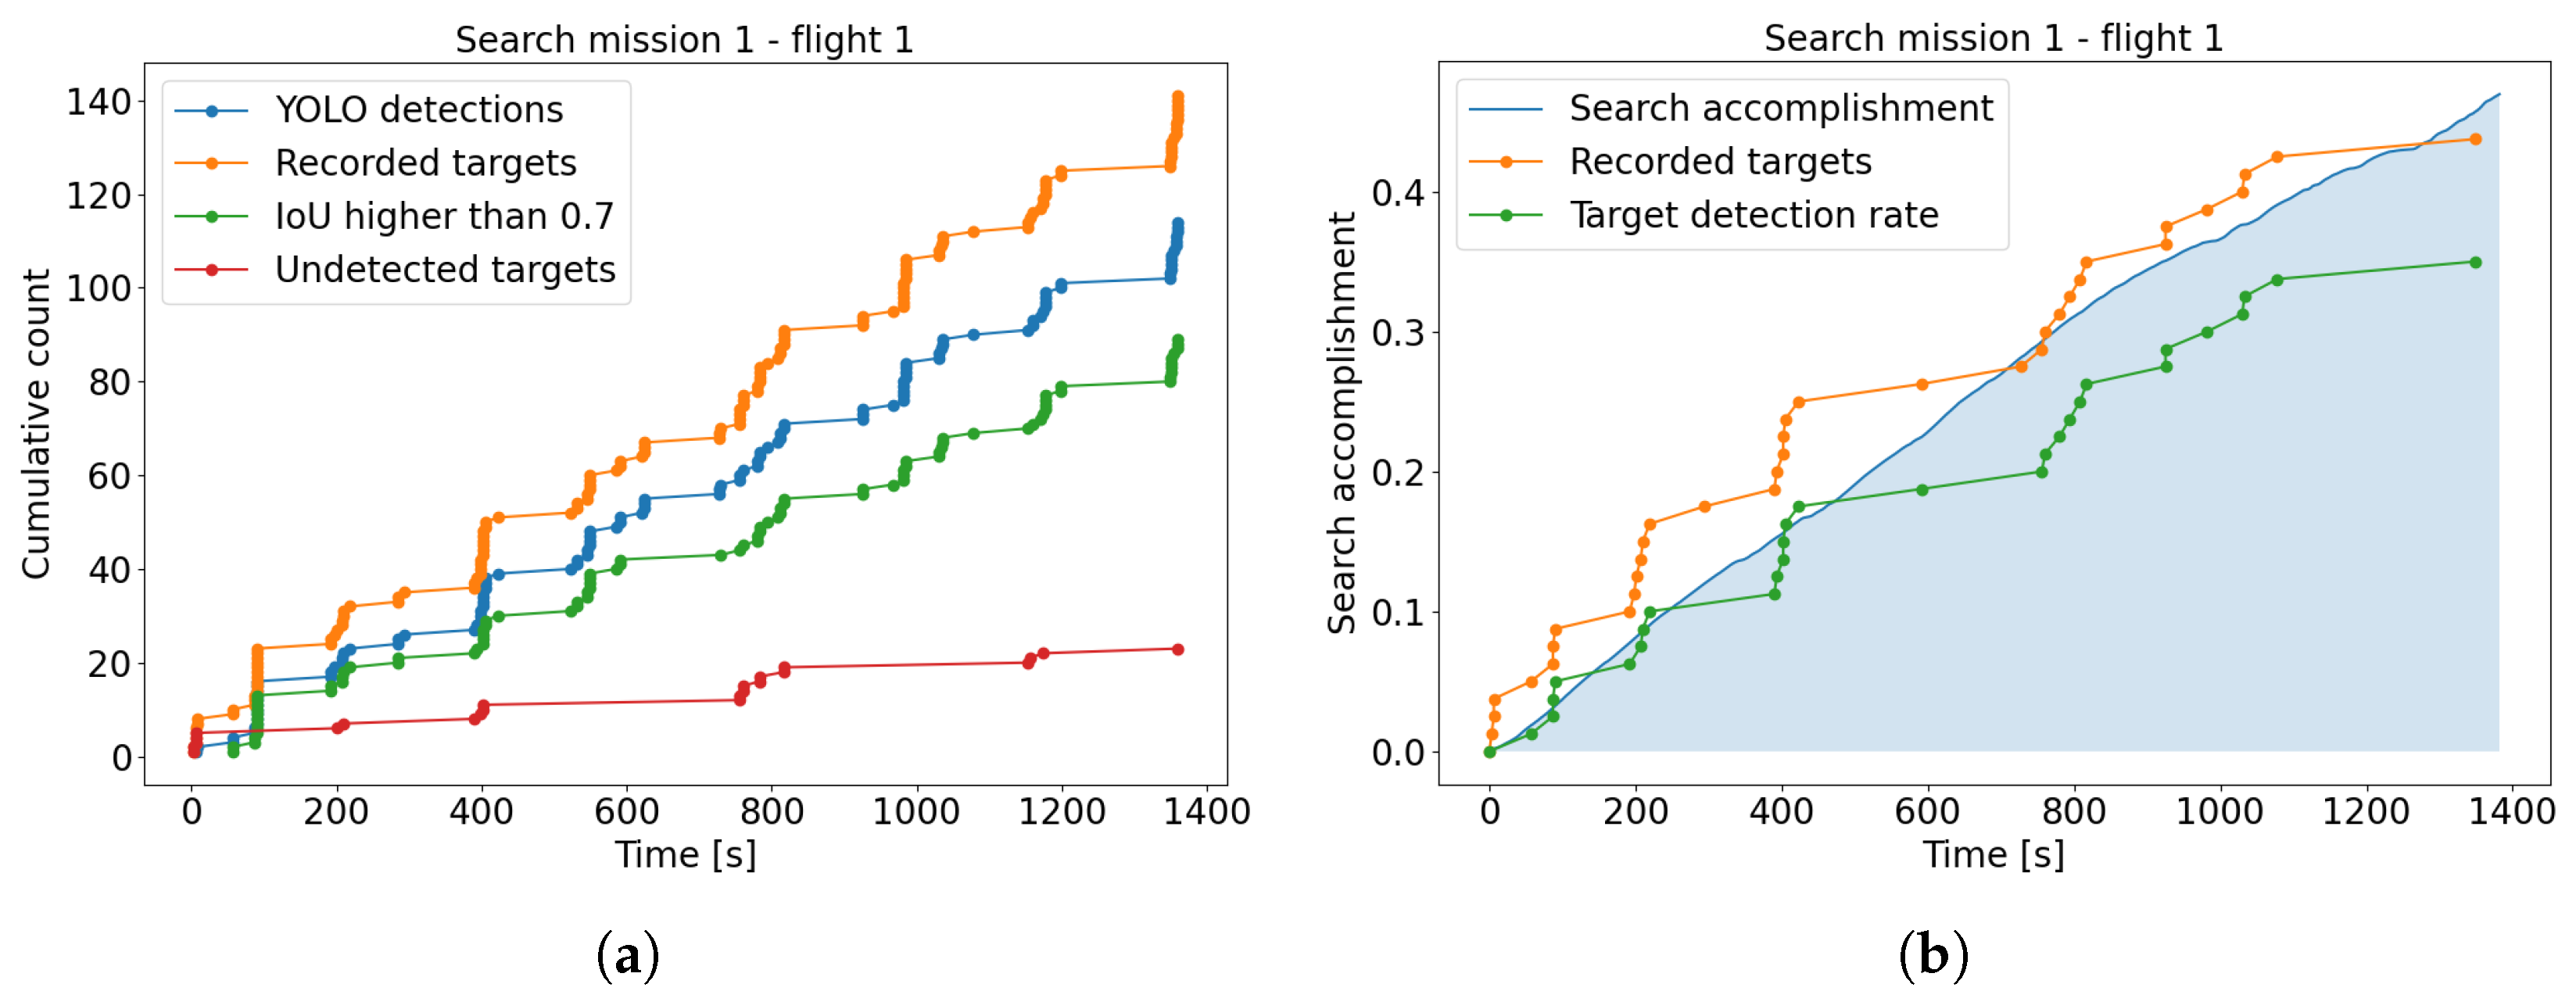
Drones 09 00473 g014
Figure 15. The detections and search accomplishment of the first flight in Search mission 1. (a) displays the recorded targets meaning the manually labeled individuals, the YOLO detections of detections with a confidence score higher than 0.5, the detections with an intersection over union (IoU) higher than 0.7 and the undetected targets. In (b) the predicted search accomplishment is shown in blue, the recorded manual identifications obtained by images taken in the experiment are illustrated in orange, while the YOLO detection rate is presented in green. The points indicate timestamps of images detecting an individual for the first time.
Drones 09 00473 g015
Figure 16. Confusion matrices for Search mission 1 in (a) and 2 in (b). Most ground truth labels have been detected, while the background area in the ground truth could only be mistakenly predicted as a person causing the maximum percentage being detected as persons. It is important to note that the Search mission 3 only contained seven labels, making the results not relevant.
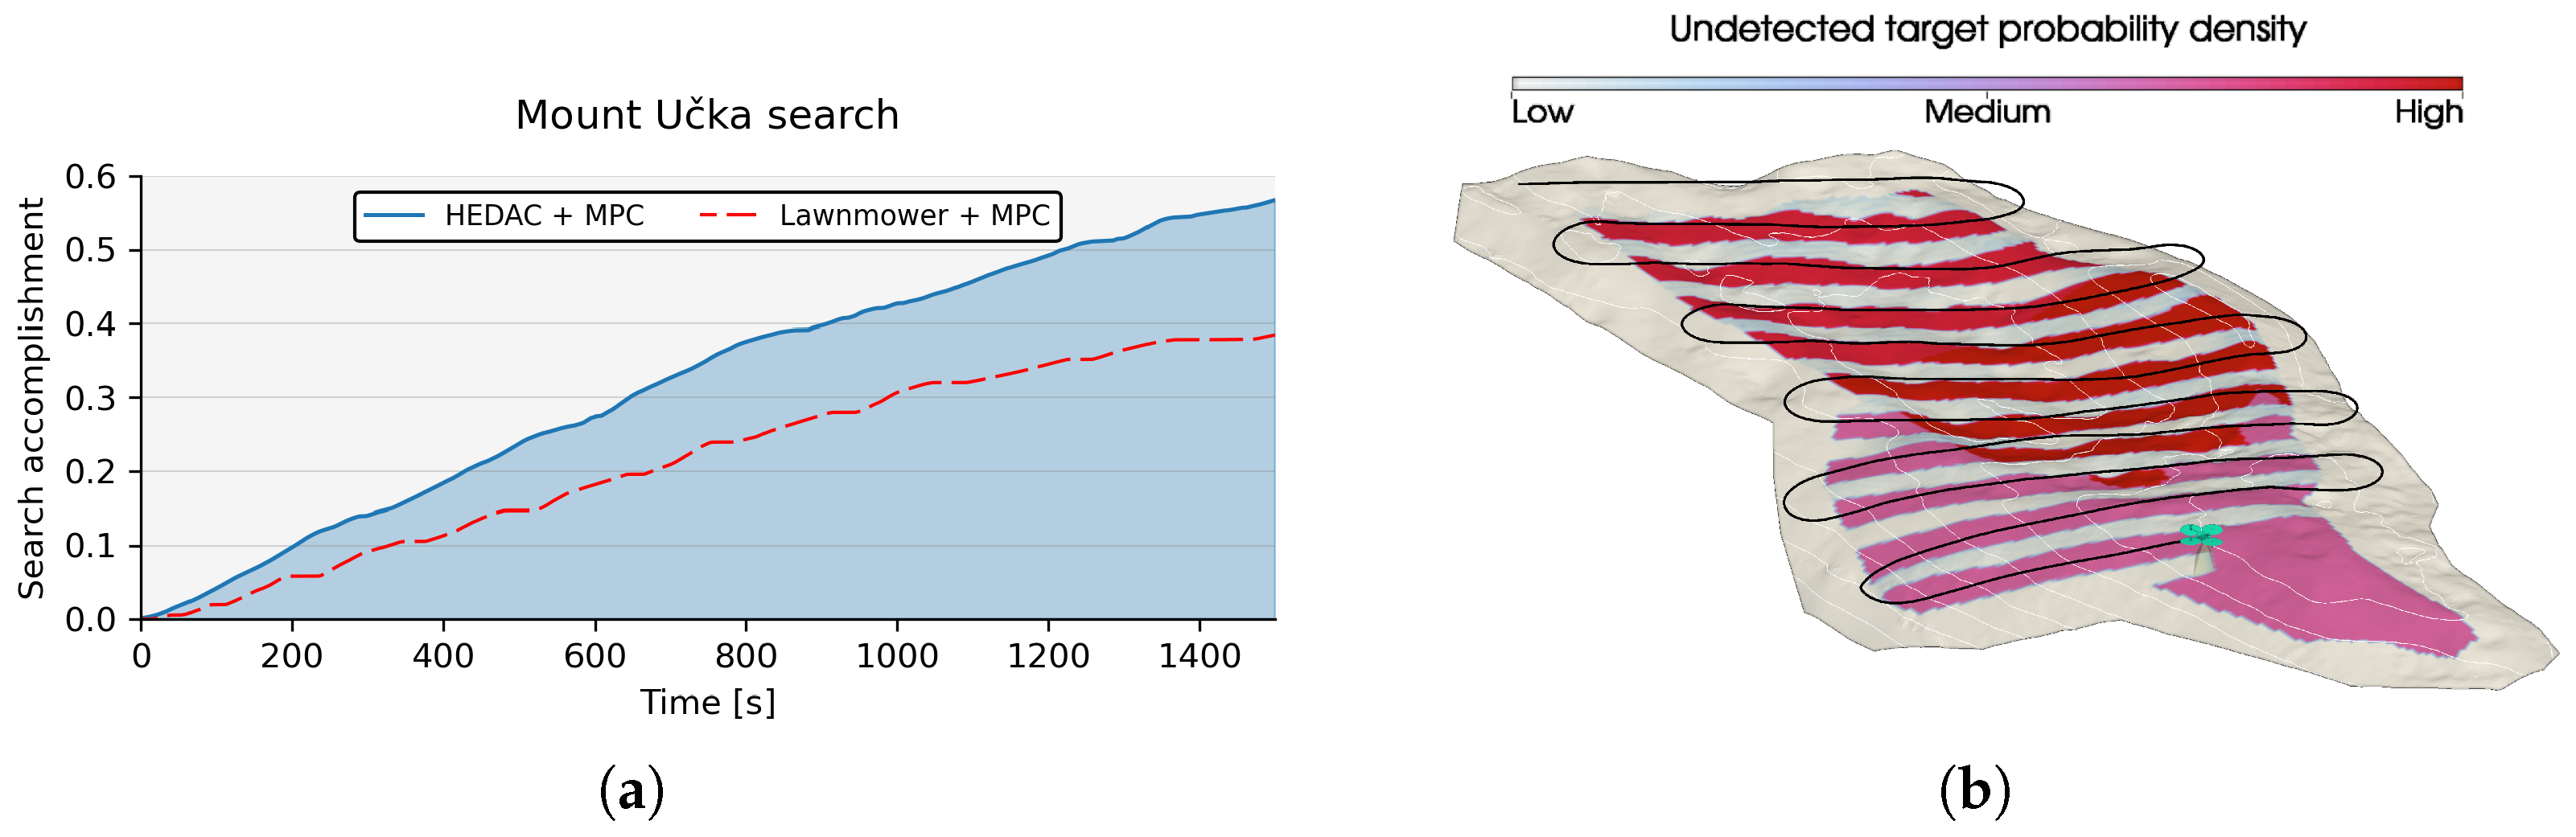
Drones 09 00473 g016
Figure 17. Comparison of the search accomplishment between the used HEDAC-MPC framework and a traditional lawnmower coverage method in simulation shown in (a). The HEDAC-MPC approach demonstrates more effective coverage by prioritizing high-probability regions based on the probabilistic model, resulting in faster and more efficient detection of targets. In (b) the simulated lawnmower trajectory is visualized.
Drones 09 00473 g017
Table 1. Recall for each GSD group in the initial experiment.
GSDRecall
0.5–1.00.95
1.0–1.50.977
1.5–2.00.956
2.0–2.50.953
2.5–3.00.897
3.0–3.50.881
3.5–4.00.781
4.0–4.50.796
4.5–5.00.719
5.0–5.50.699
5.5–6.00.621
6.0–6.50.142
Table 2. UAV specifications.
UAVFull NameUnitMatrice 210 v2Mavic 2
Enterprise Dual
ϕ m i n Minimum incline angle°−90−90
ϕ m a x Maximum incline angle°9090
v h , m i n Minimum horizontal velocitym/s00
v h , m a x Maximum horizontal velocitym/s108
v v , m i n Minimum vertical velocitym/s−3−2
v v , m a x Maximum vertical velocitym/s53
a h , m i n Minimum horizontal accelerationm/s2−3.6−3.6
a h , m a x Maximum horizontal accelerationm/s222
a v , m i n Minimum vertical accelerationm/s2−2−2
a v , m a x Maximal vertical accelerationm/s22.82.8
ω m a x Maximal angular velocity°/s12030
N ( T ) MPC horizon timesteps (duration)(s)5 (15)5 (15)
Table 3. Camera specifications.
CameraFOV c1 [°]FOV c2 [°]Resolution [px]
DJI Zenmuse X5S39.264.75280 × 2970
DJI Zenmuse Z3033.956.91920 × 1080
Mavic 2 Enterprise Dual built-in camera57.5872.54056 × 3040
Table 4. Experiment setup settings.
Flight12345
Search missionMission 1Mission 1Mission 1Mission 2Mission 3
UAVM210M210M210MavicM210
CameraX5SX5SZ30Mavic built-in cameraX5S
Min/goal altitude [m]35/5555/7535/7535/5535/55
ZoneA, B, CA, B, CA, B, CB, CA
Start time11:1511:4412:1312:4013:02
End time11:3812:0712:3512:5513:27
Table 5. Specification of each zone.
ZoneArea [m2]Num. MarkersNum. People
A432,7345025
B470,2335027
C613,7095026
Table 6. Performance metrics for all five flights, illustrating the influence of camera quality, weather conditions, and the number of images containing people on detection outcomes. Flights 1 and 2 show the best performance, reflecting clearer image quality and minimal fog interference.
 Flight 1Flight 2Flight 3Flight 4Flight 5
Precision0.820.850.420.560.68
Recall0.620.740.160.430.59
mAP 0.50.680.730.140.390.55
mAP 0.5–0.950.440.420.090.200.49
Table 7. Recall for each GSD group in all search missions.
GSDSM1SM2SM3
1.0–1.51 1
1.5–2.00.710.510.67
2.0–2.50.680.370.38
2.5–3.00.80  
3.0–3.50.37  
Table 8. Comparison of the performance between the YOLOv8l model pretrained on the COCO dataset and the YOLOv8l model additionally trained on our initial dataset. The results show a significant improvement in performance when the model is further trained on our data, highlighting the positive impact of domain-specific fine-tuning on the model’s accuracy and robustness.
  Our ModelYOLOv8l
  GSD SM1 SM2 SM3 SM1 SM2 SM3
Precision1.0–1.50.98 0.990.43 0.11
1.5–2.00.880.830.280.540.241
2.0–2.50.760.530.640.460.130.02
2.5–3.00.84  0.40  
3.0–3.50.62  0  
Recall1.0–1.51 10.50 1
1.5–2.00.710.510.670.390.710.64
2.0–2.50.680.370.380.220.510.38
2.5–3.00.80  0.17  
3.0–3.50.37  0.11  
mAP 0.51.0–1.51 10.47 0.68
1.5–2.00.770.530.280.420.380.67
2.0–2.50.690.350.380.250.230.09
2.5–3.00.81  0.21  
3.0–3.50.31  0  
mAP 0.5–0.951.0–1.50.80 0.950.40 0.67
1.5–2.00.520.230.210.290.180.44
2.0–2.50.410.190.310.170.160.08
2.5–3.00.48  0.15  
3.0–3.50.15  0  
Overall precision 0.735 ± 0.134 0.333 ± 0.189
Overall recall 0.649 ± 0.149 0.463 ± 0.169
Table 9. Results of the correlation analysis between search accomplishment and detection rate. Pearson, Spearman, and Kendall’s tau correlation coefficients all indicate a strong positive relationship, with statistically significant p-values. The perfect Spearman rank and near-perfect and Kendall’s tau suggest the strictly increasing trend observed of the search accomplishment and detection rate in the search mission confirming that improvements in detection are closely associated with an enhanced search success.
TestCorrelationp-Value
Pearson0.991.05 × 10 21
Spearman10
Kendall tau11.19 × 10 13
Disclaimer/Publisher’s Note: The statements, opinions and data contained in all publications are solely those of the individual author(s) and contributor(s) and not of MDPI and/or the editor(s). MDPI and/or the editor(s) disclaim responsibility for any injury to people or property resulting from any ideas, methods, instructions or products referred to in the content.

