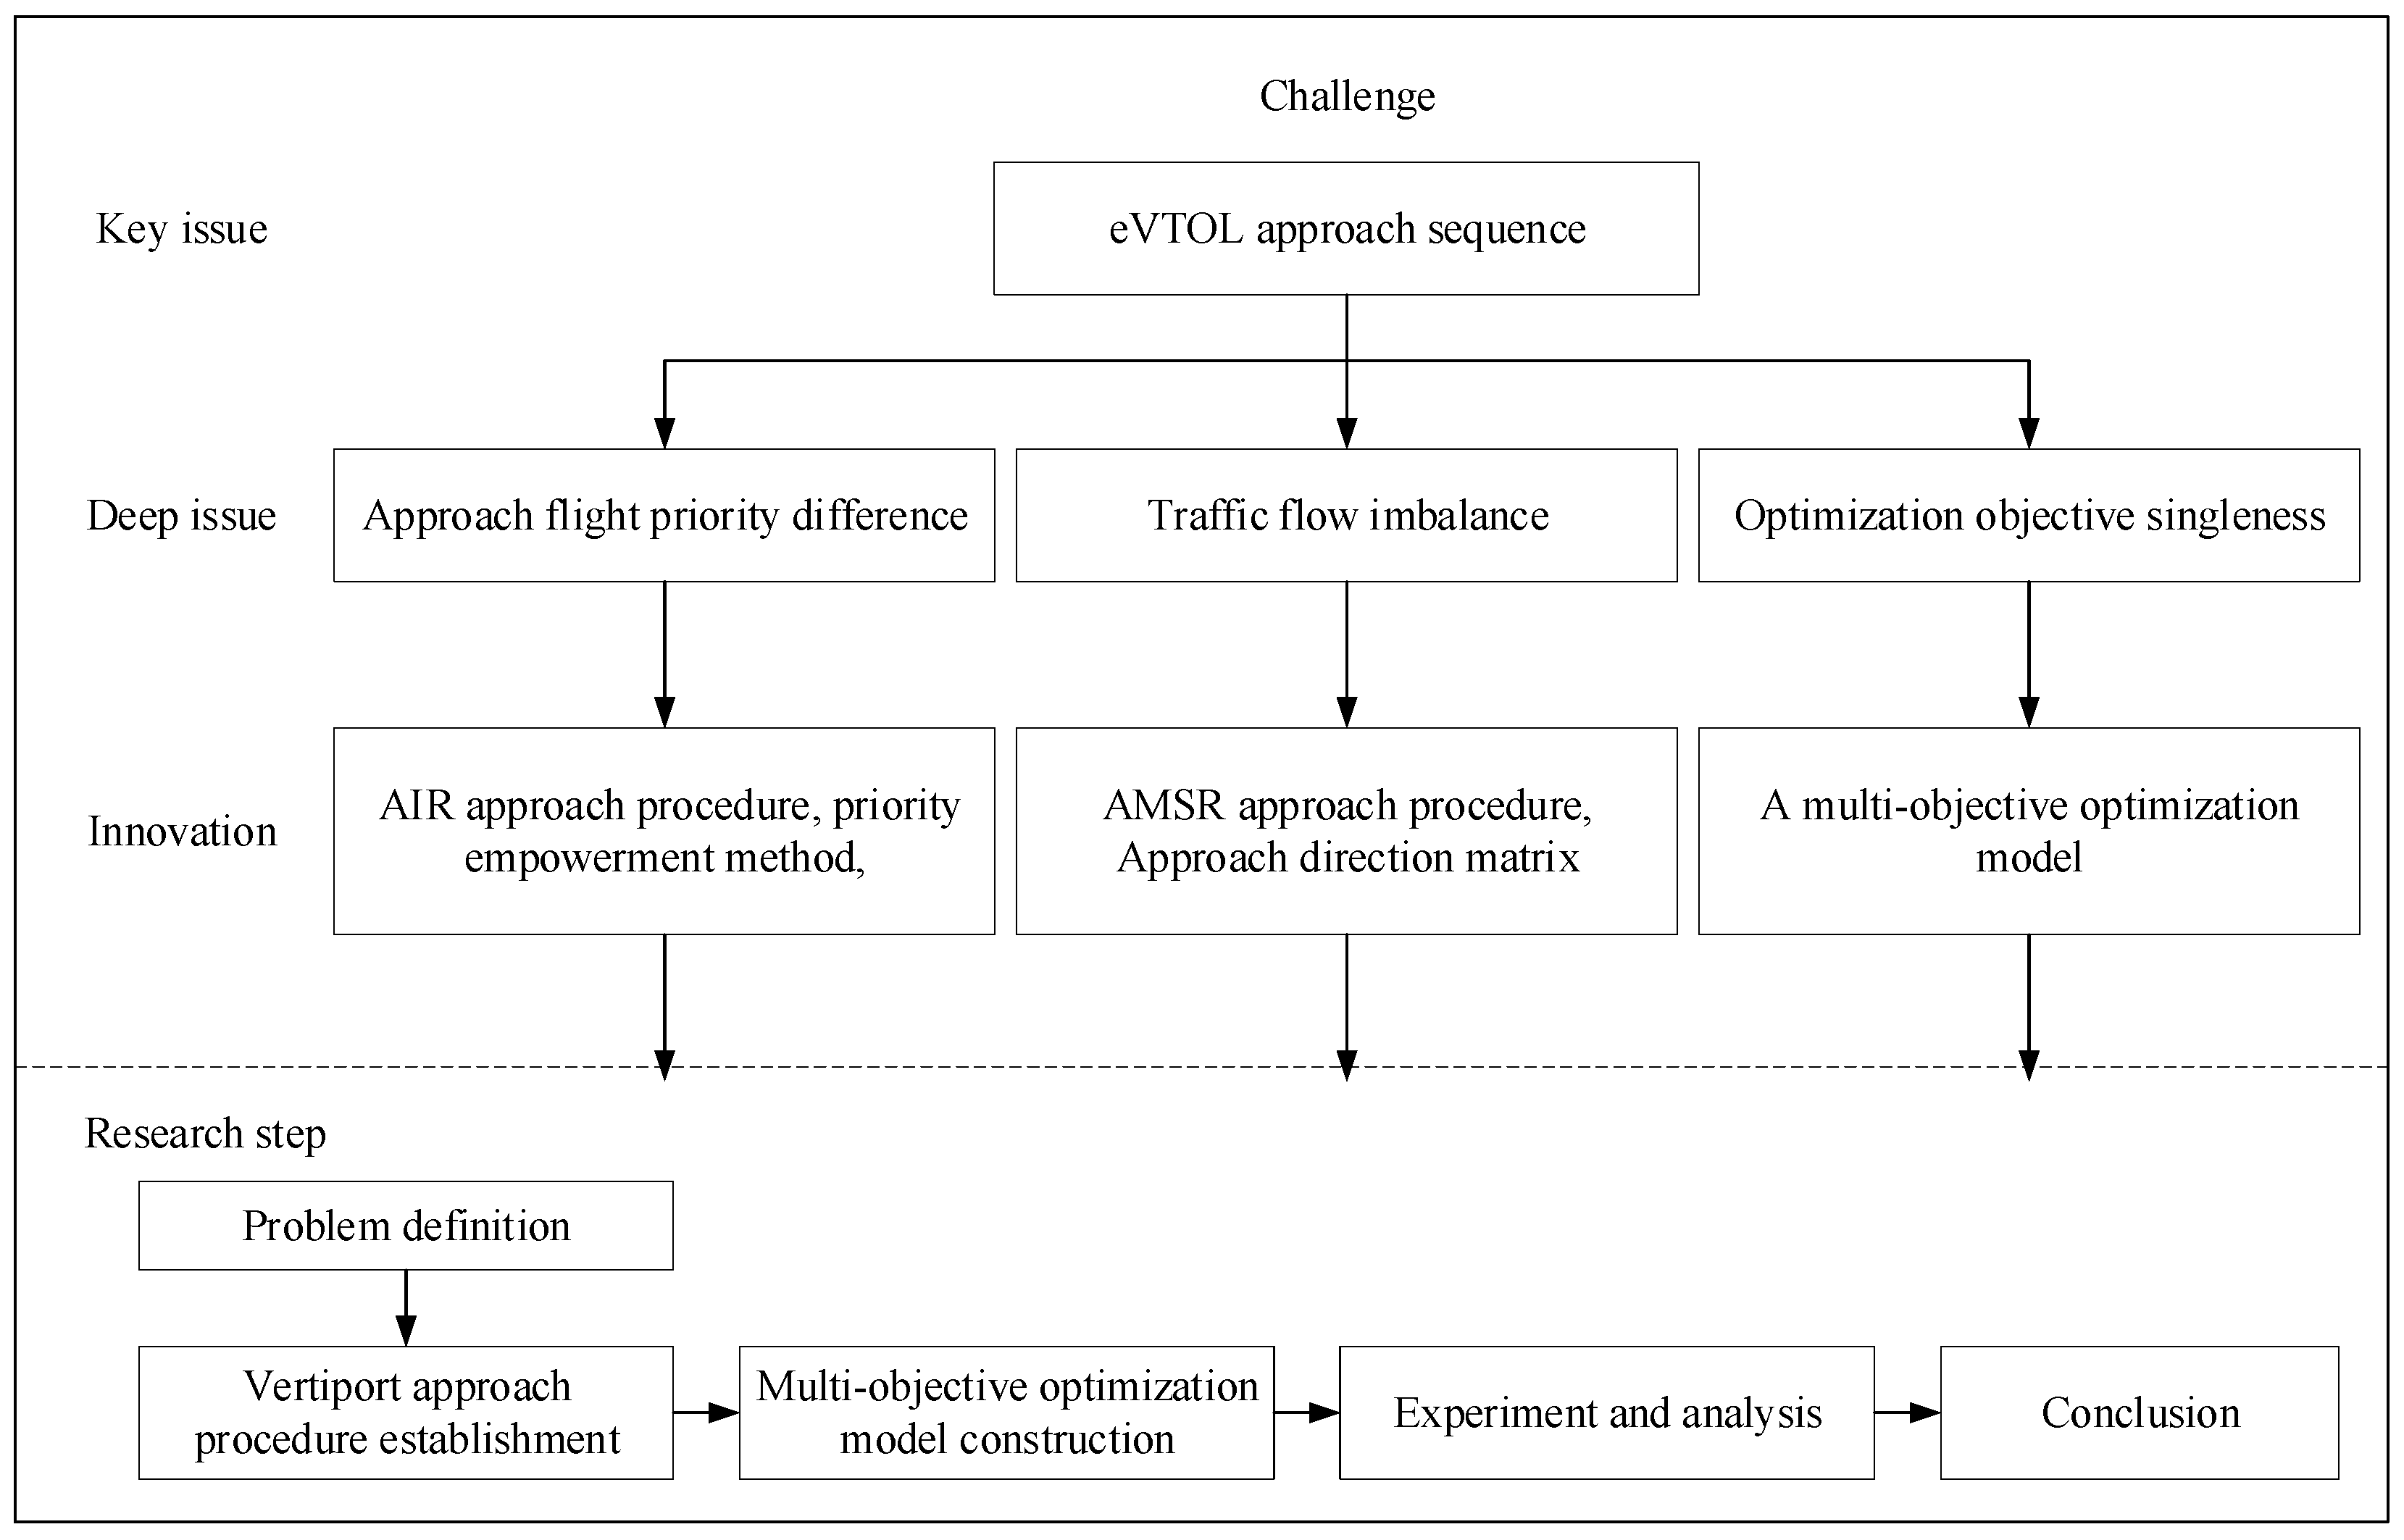
Figure 1.
Technology roadmap.
Figure 1.
Technology roadmap.
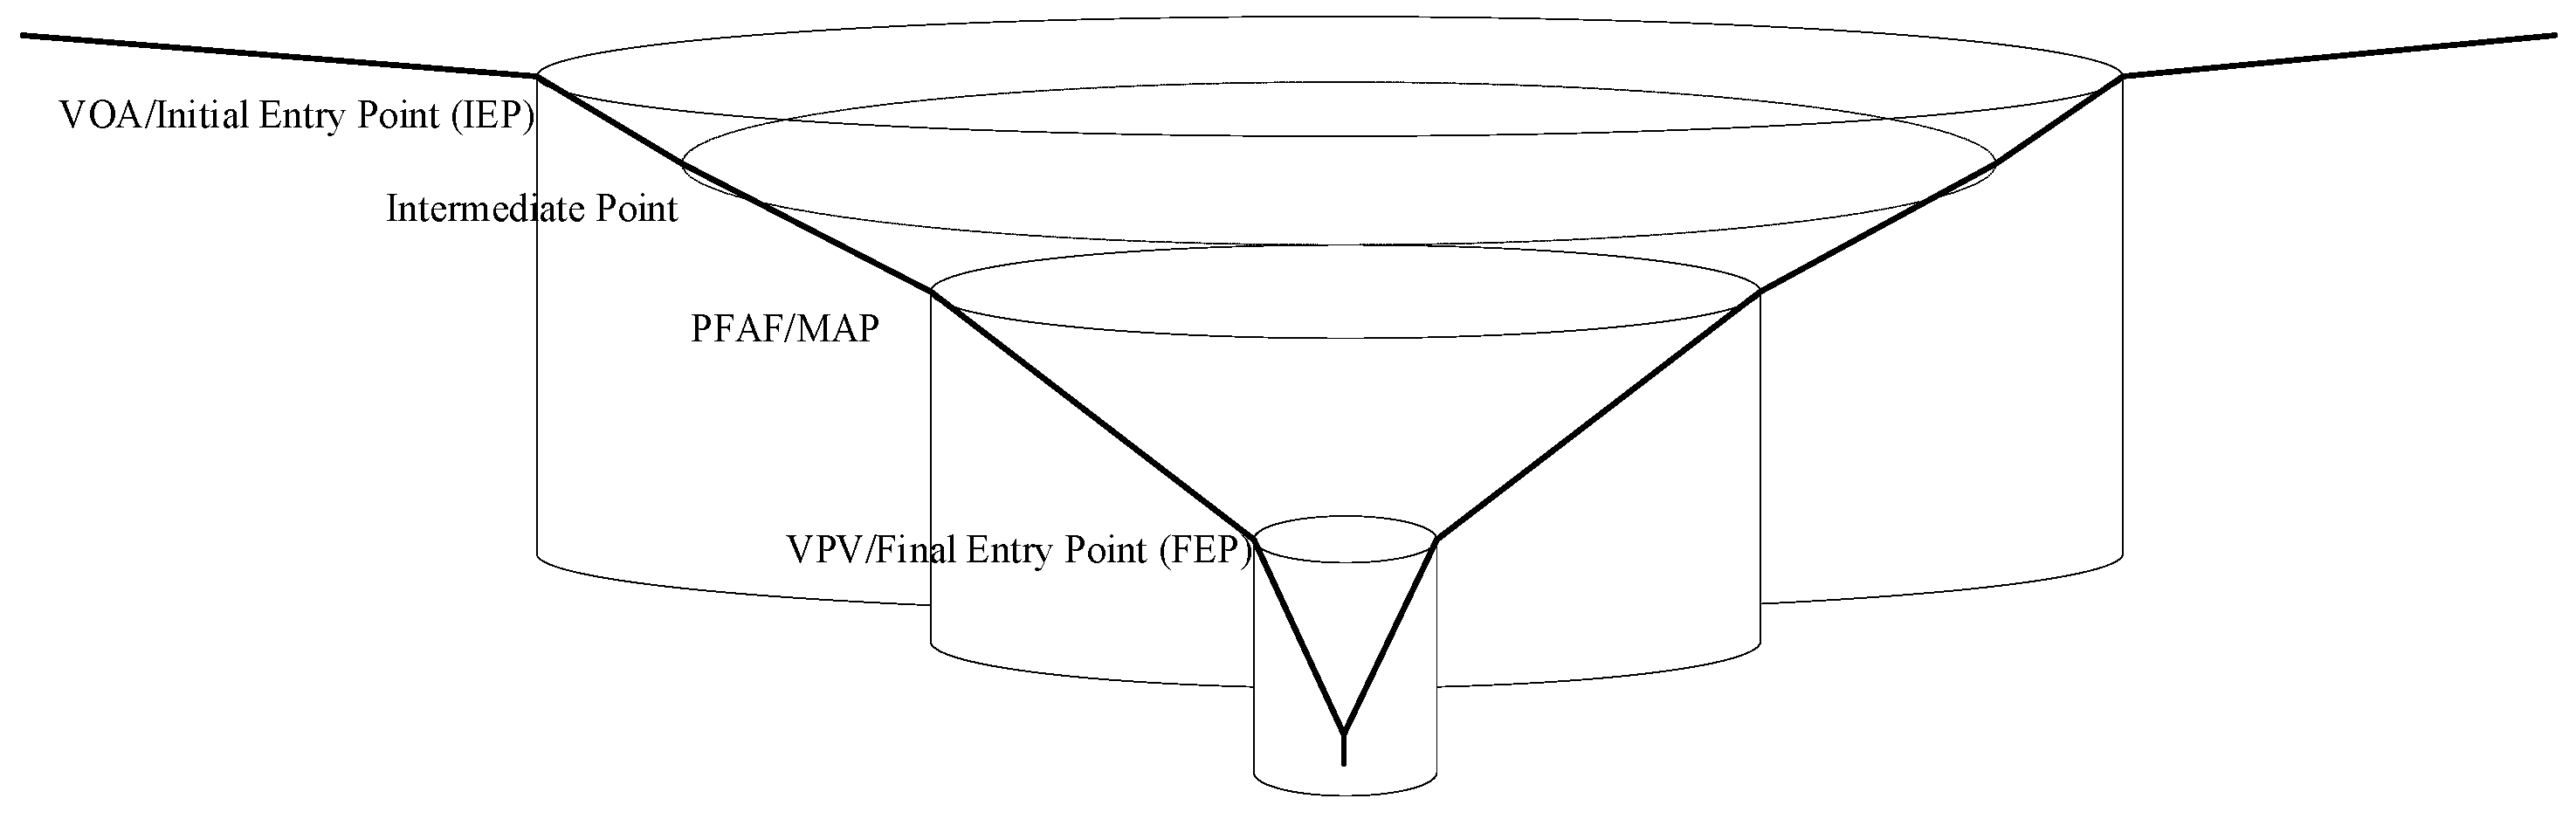
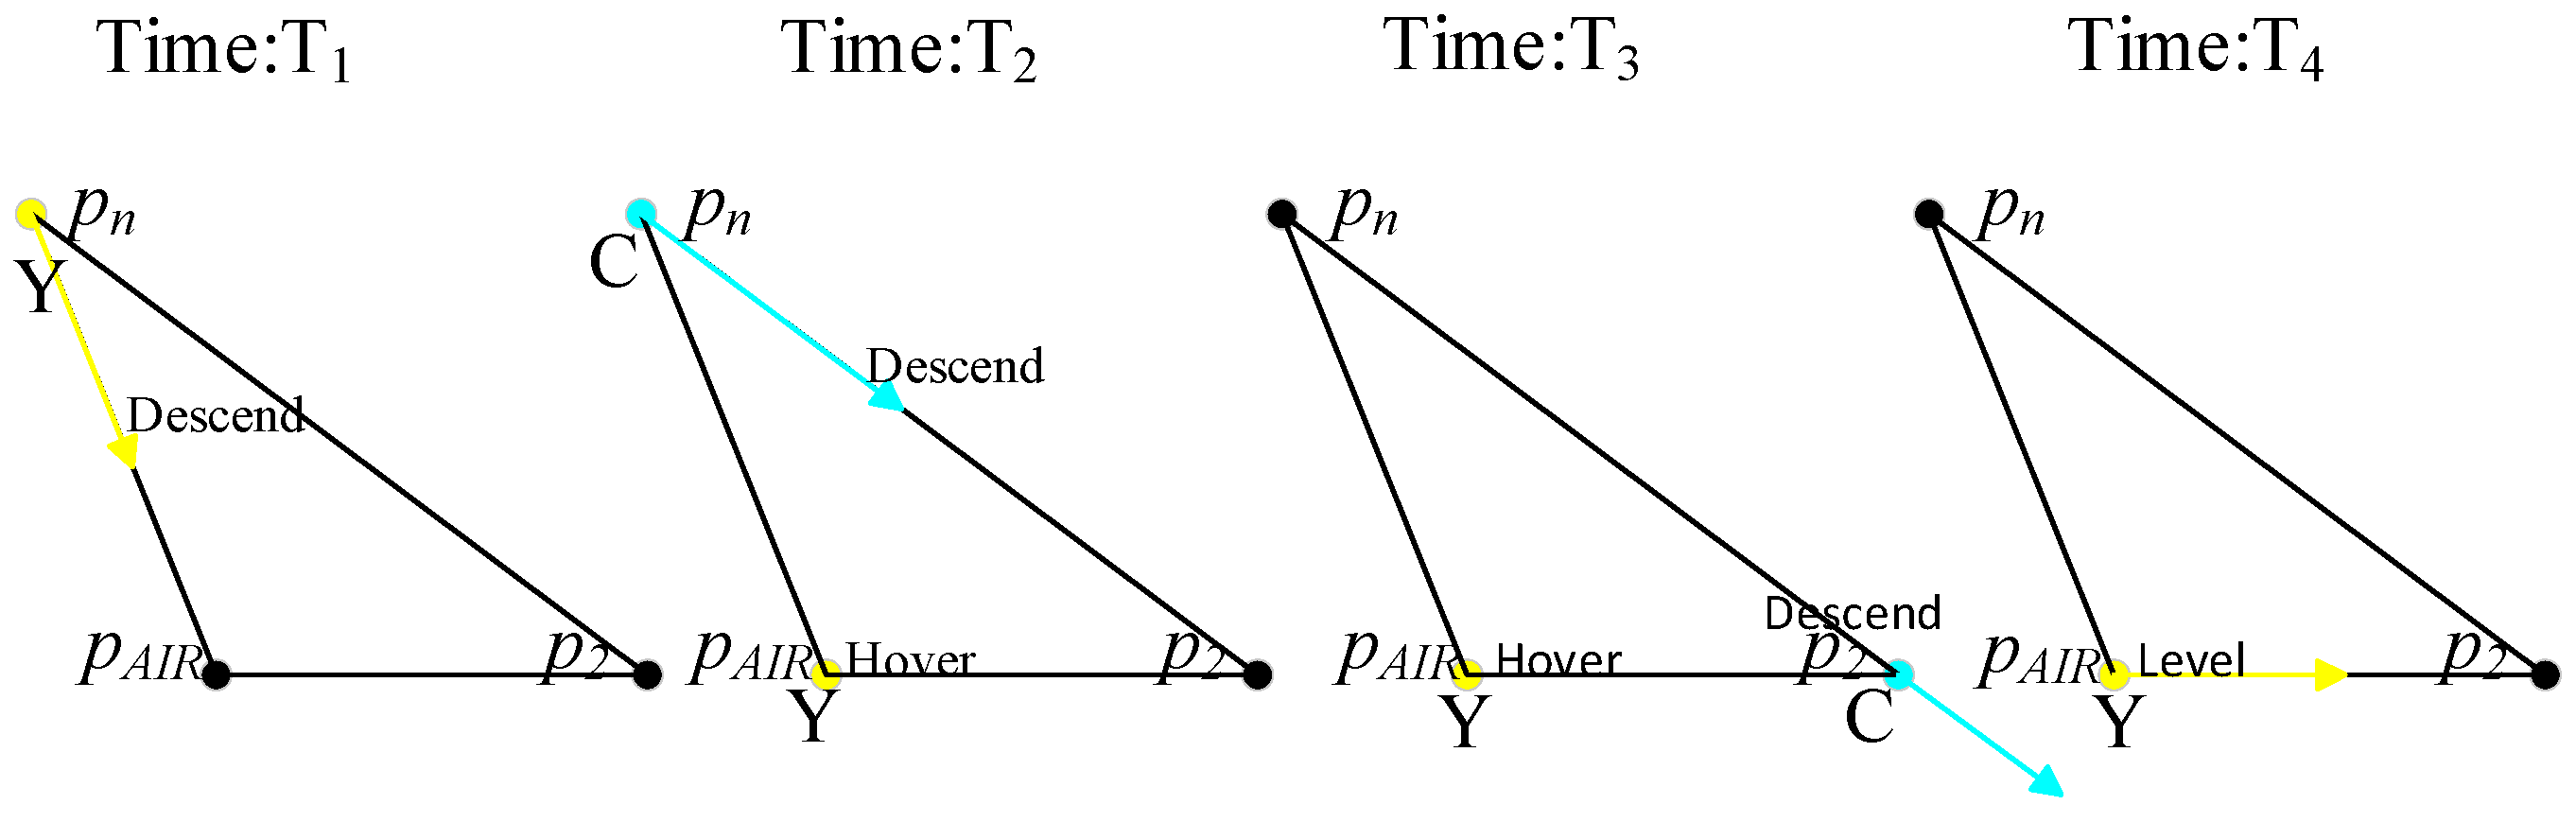
Figure 2.
Vertiport approach procedure concept.
Figure 2.
Vertiport approach procedure concept.
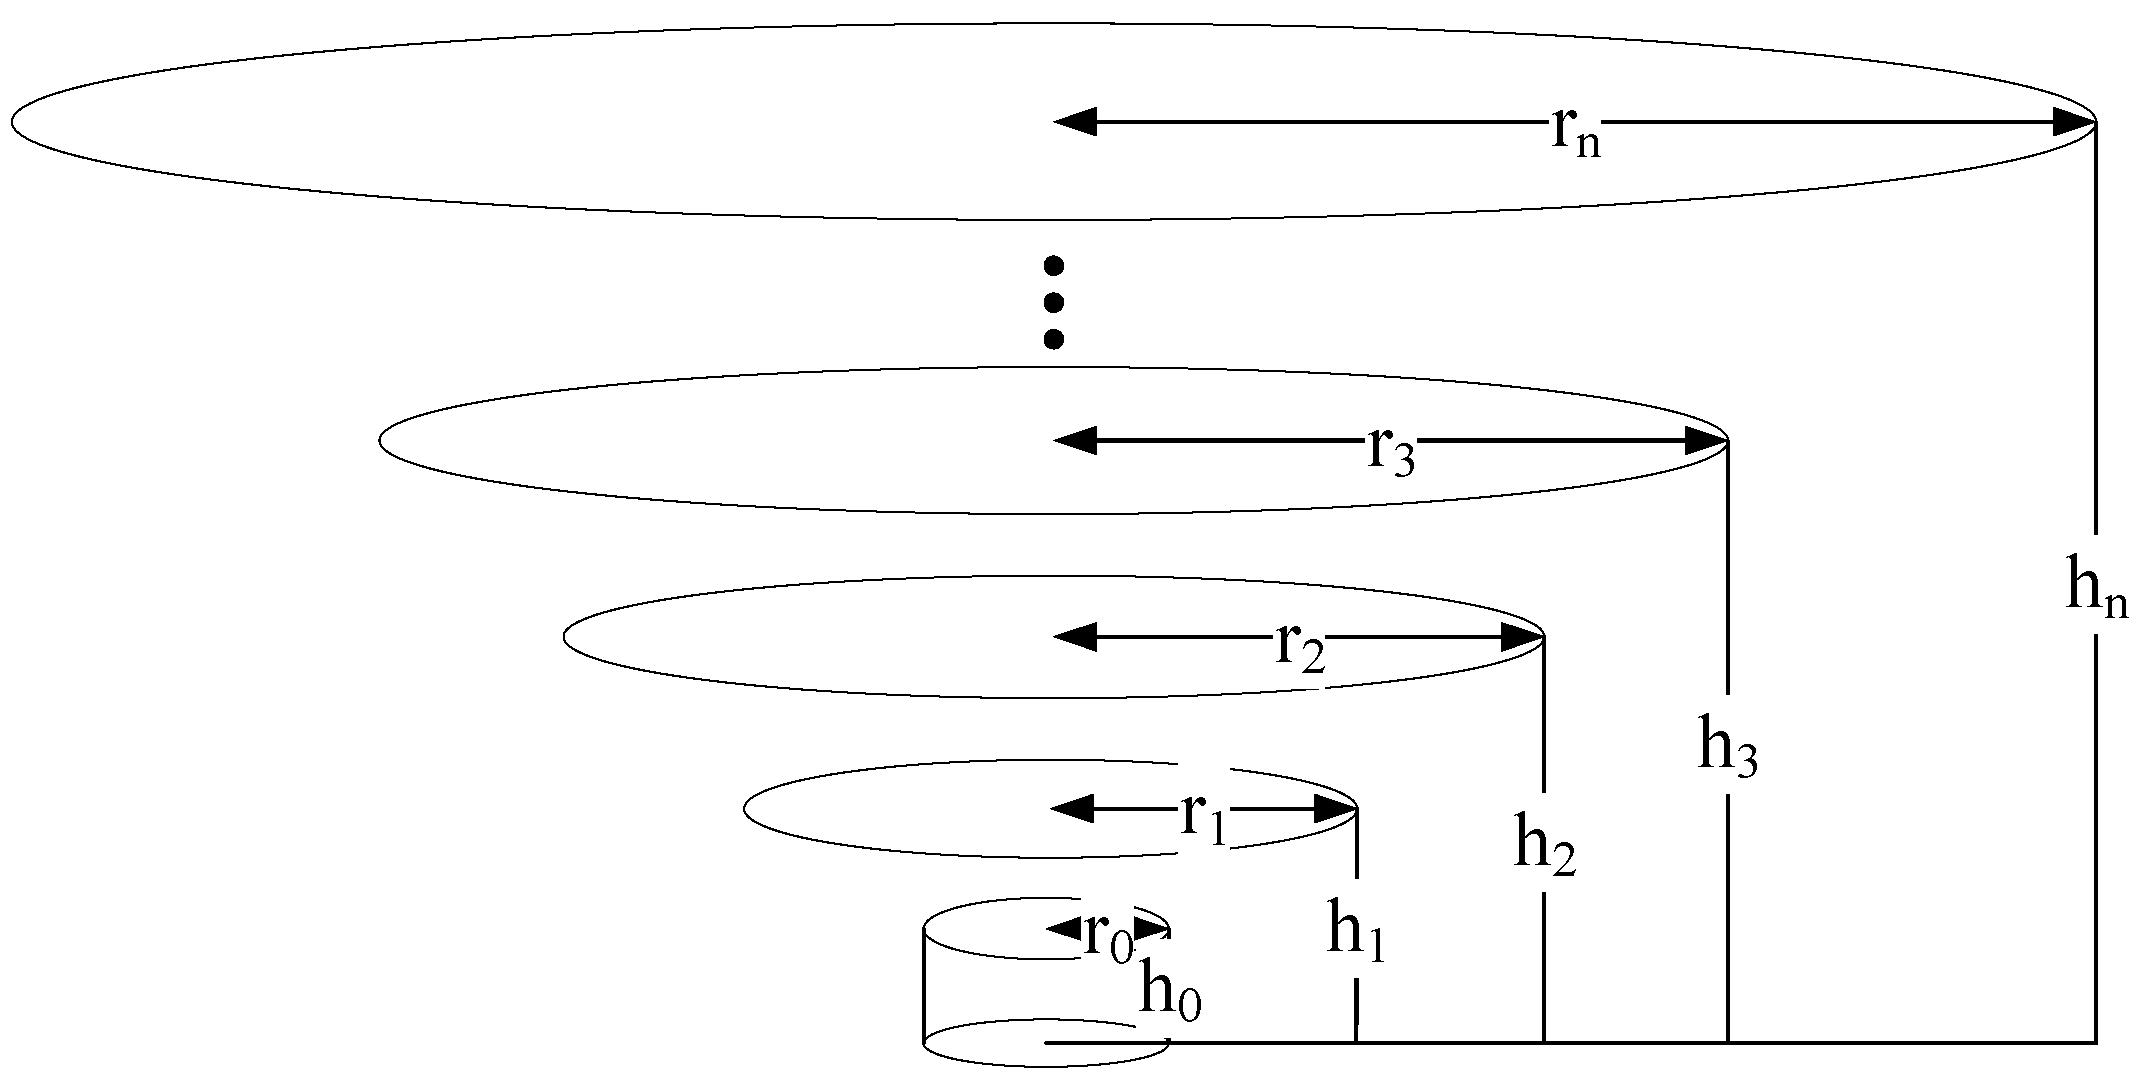
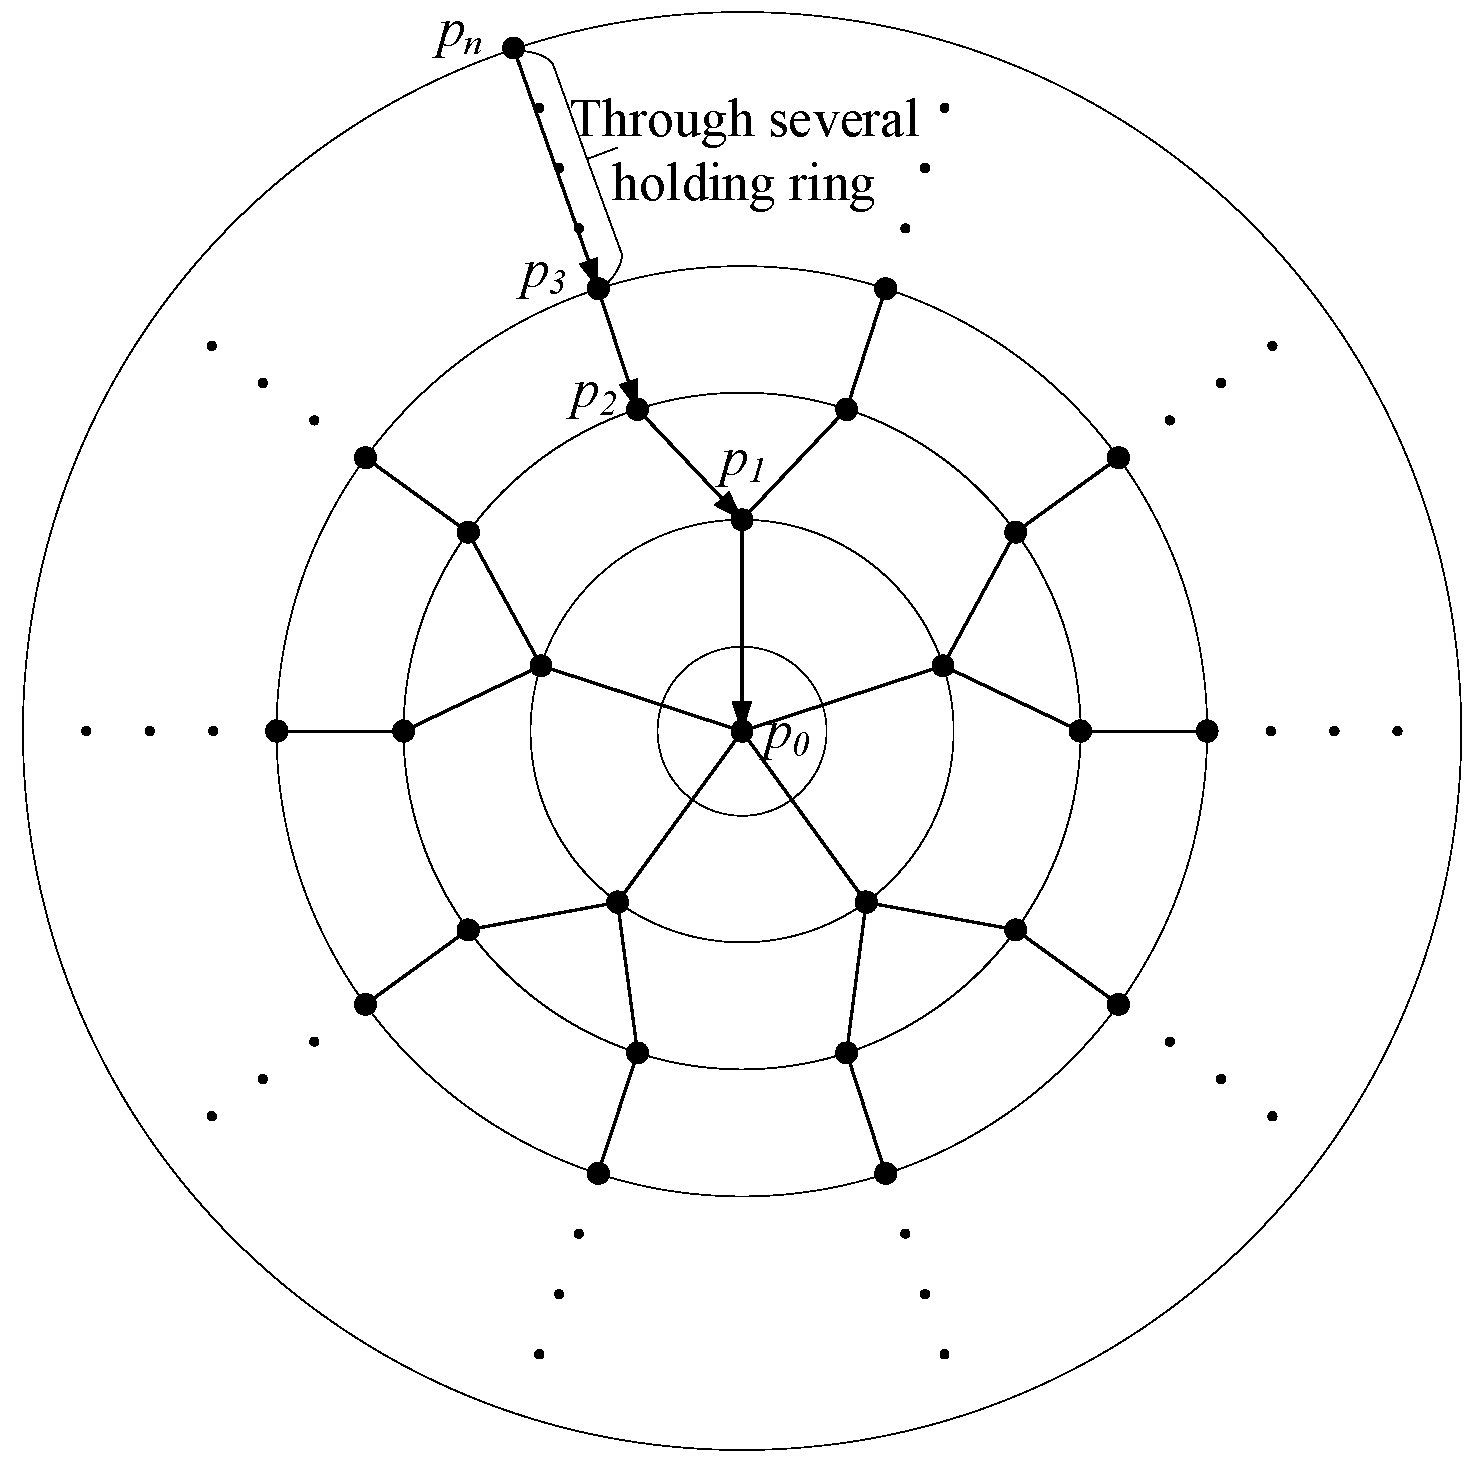
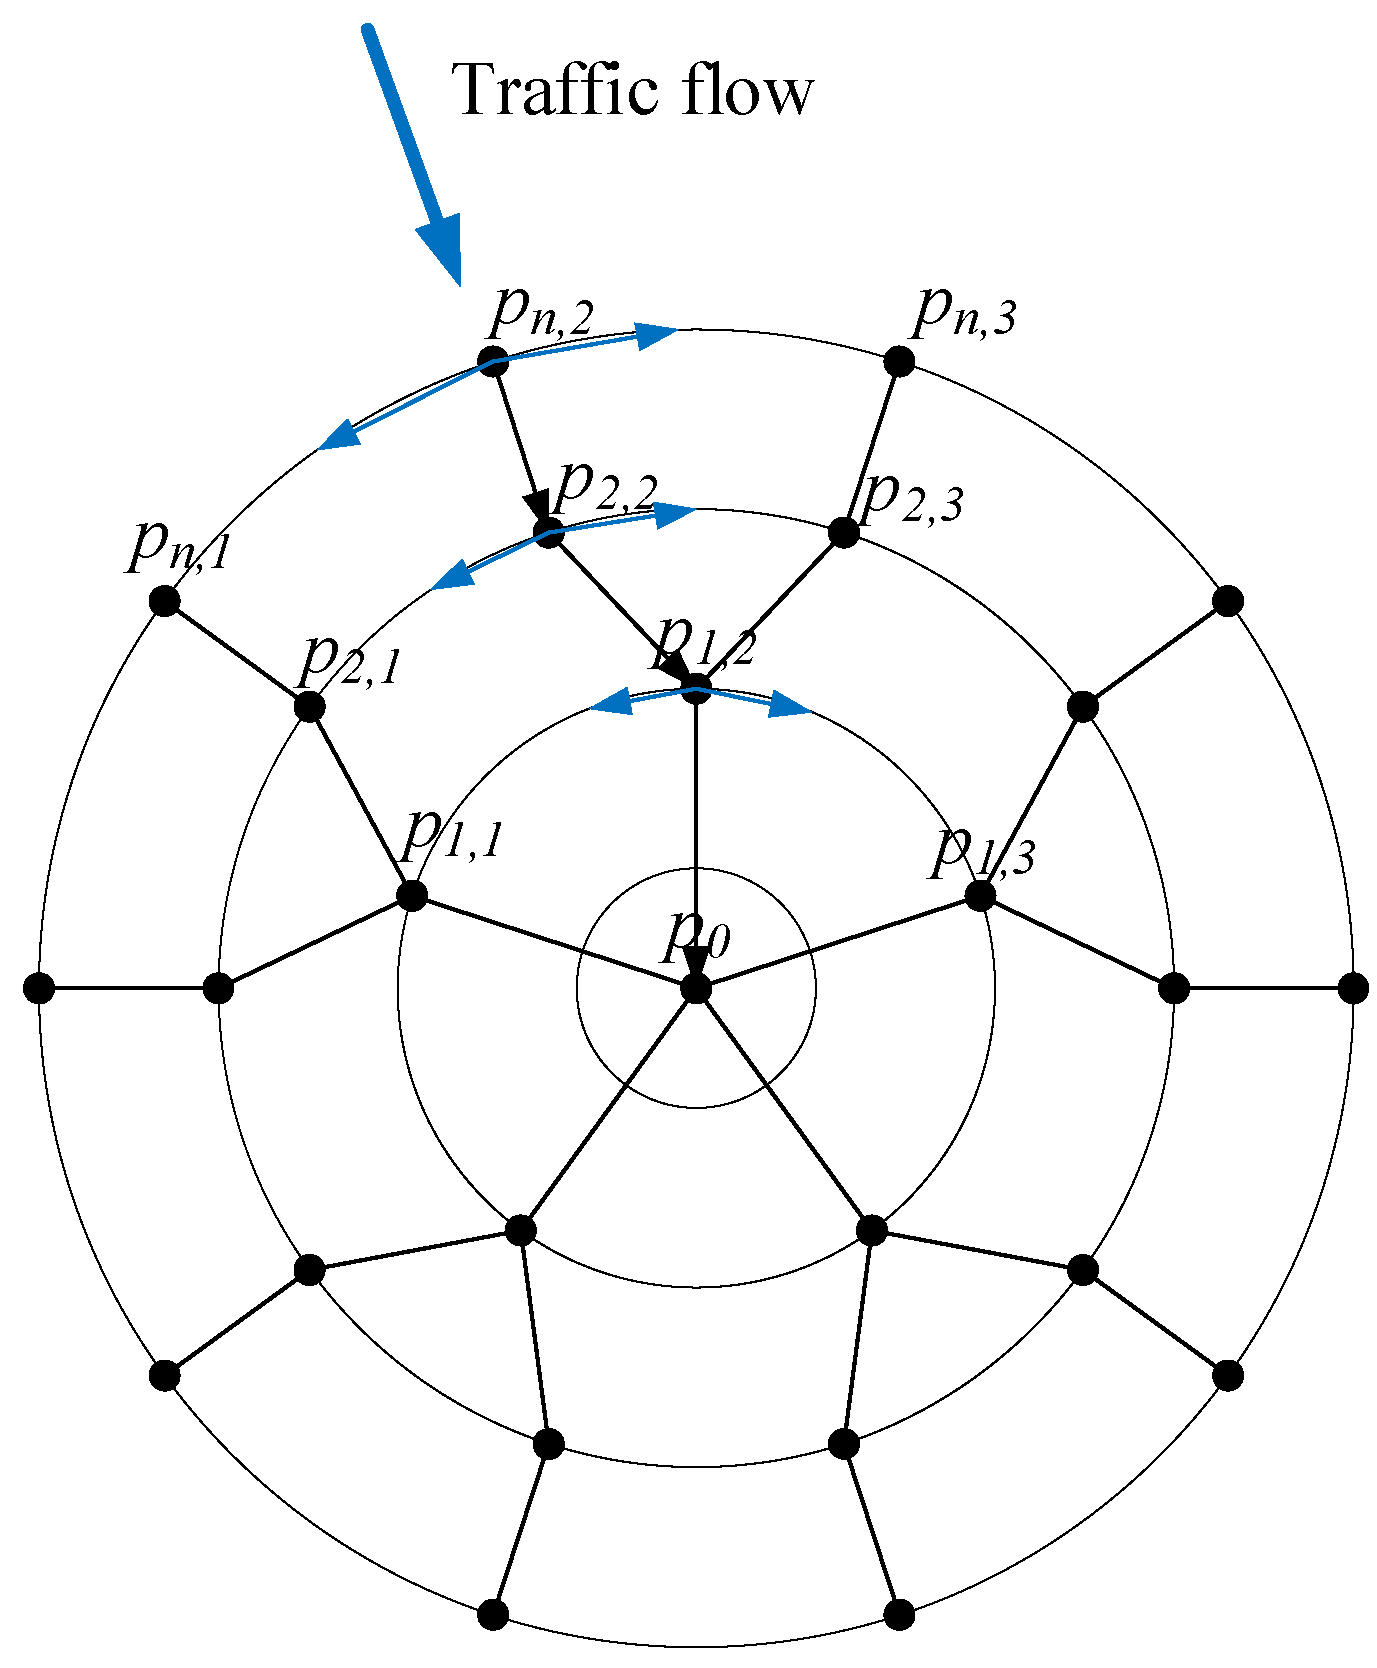
Figure 3.
Vertiport airside holding ring.
Figure 3.
Vertiport airside holding ring.
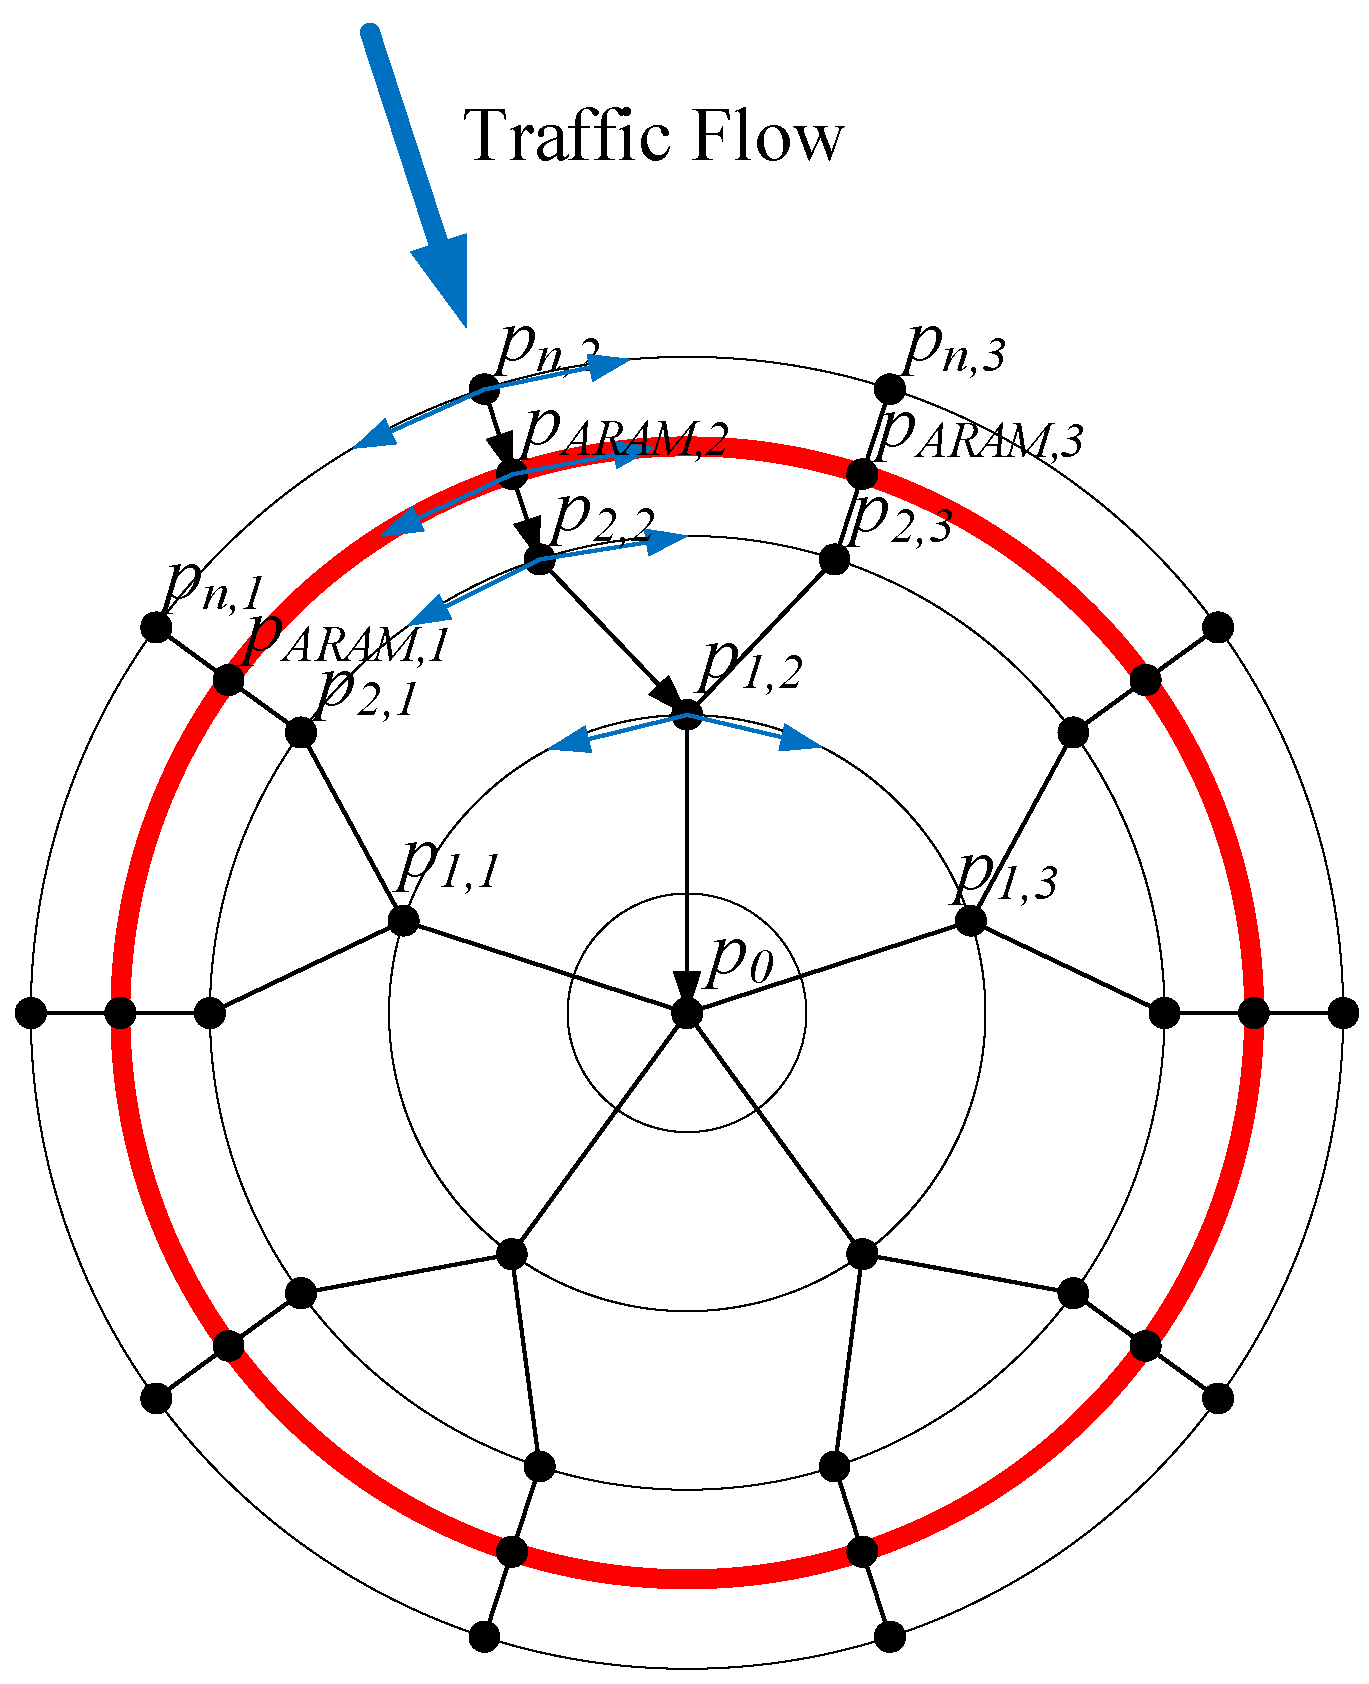
Figure 4.
Vertiport approach procedure.
Figure 4.
Vertiport approach procedure.
Figure 5.
Vertiport AIR approach procedure. (a) Top view. (b) Corresponding side view.
Figure 5.
Vertiport AIR approach procedure. (a) Top view. (b) Corresponding side view.
Figure 6.
AIR approach procedure logic.
Figure 6.
AIR approach procedure logic.
Figure 7.
Vertiport SRMA approach procedure.
Figure 7.
Vertiport SRMA approach procedure.
Figure 8.
Vertiport ARAM approach procedure.
Figure 8.
Vertiport ARAM approach procedure.
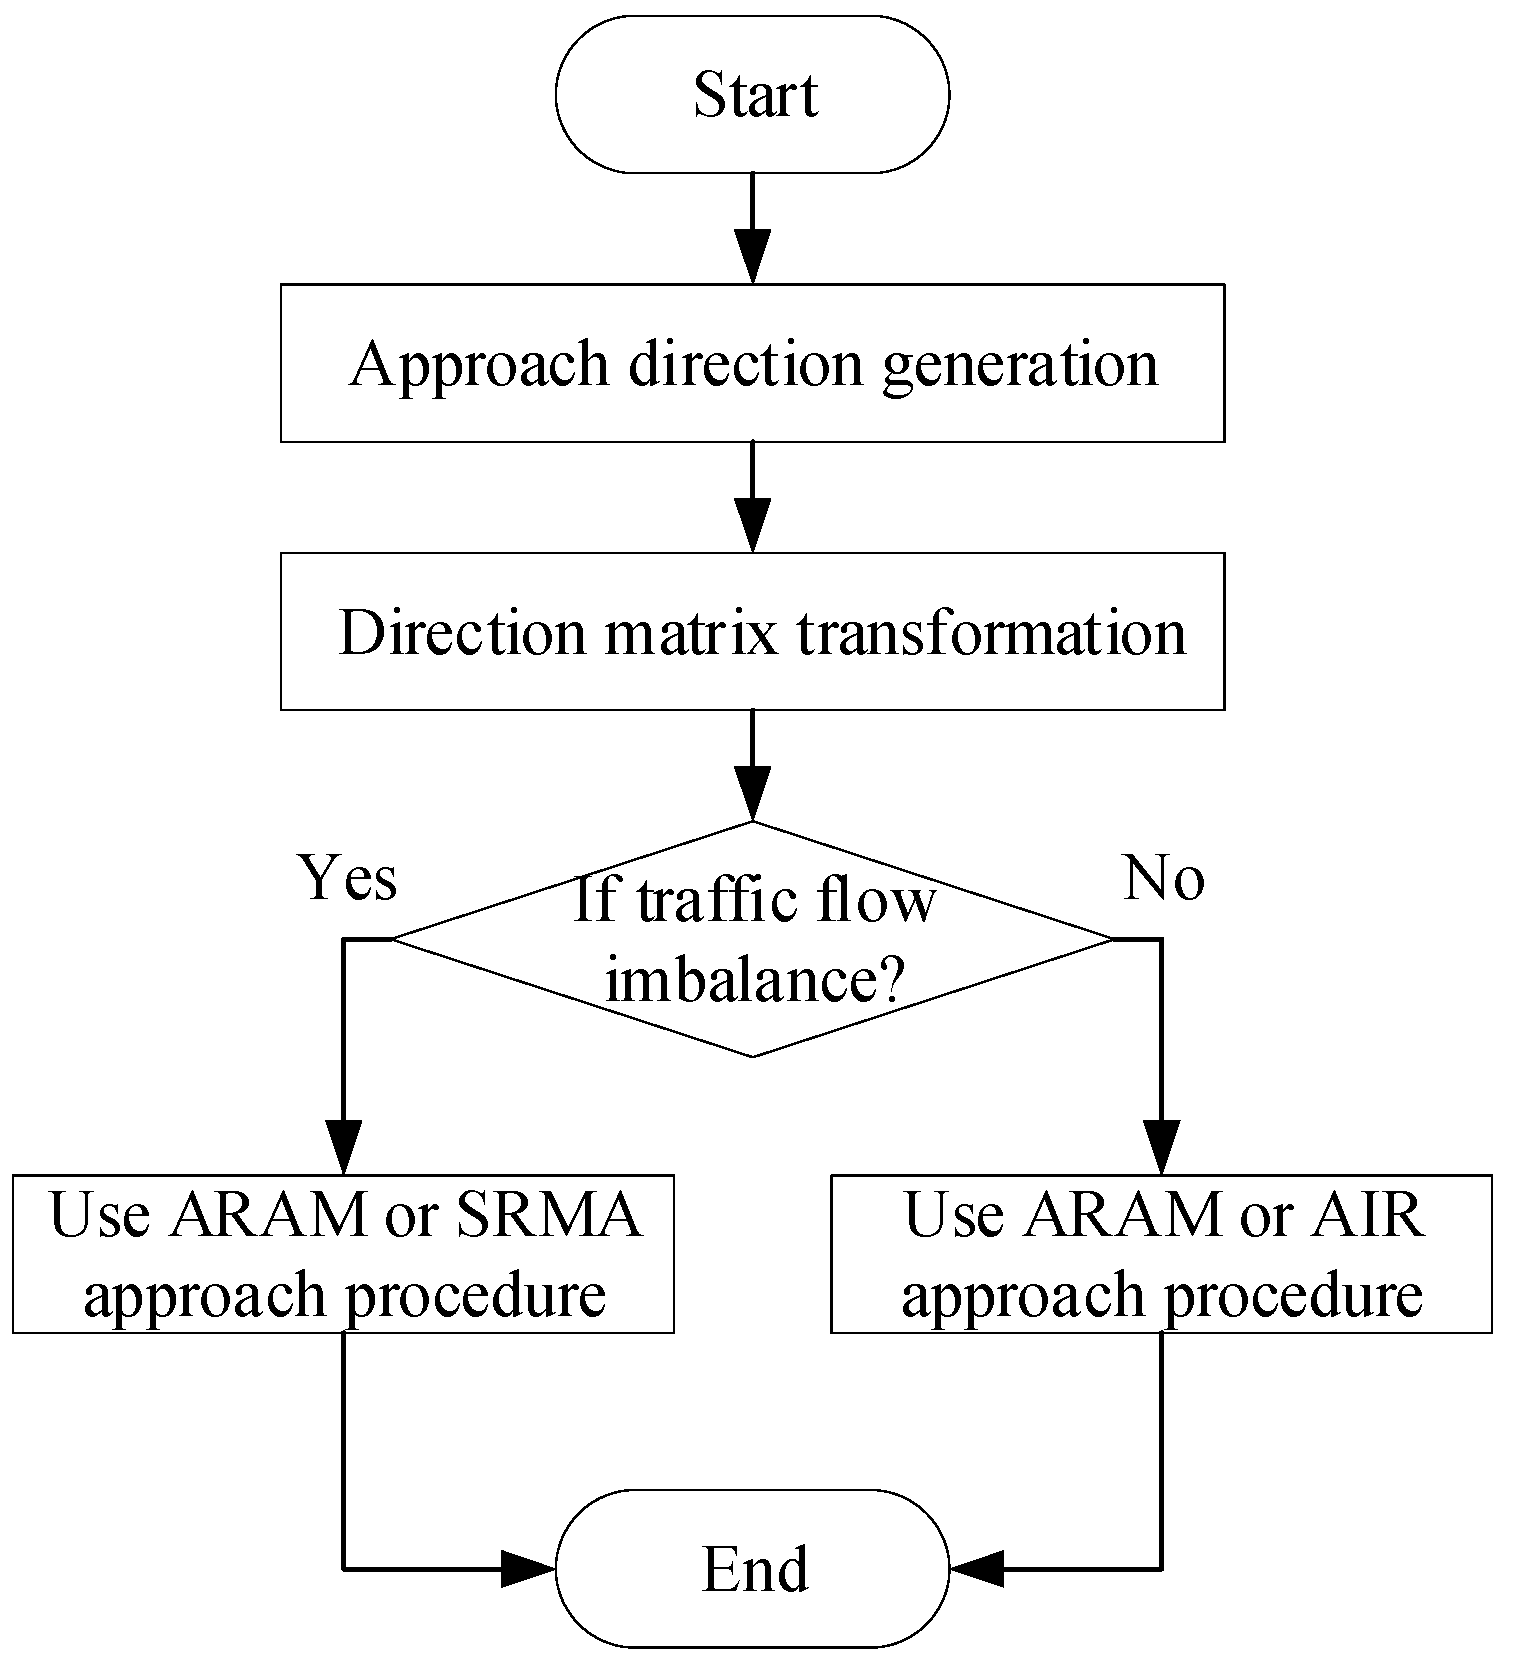
Figure 9.
Approach procedure selection flowchart.
Figure 9.
Approach procedure selection flowchart.
Figure 10.
Three dimensions of decision variables.
Figure 10.
Three dimensions of decision variables.
Figure 11.
Conflict avoidance example.
Figure 11.
Conflict avoidance example.
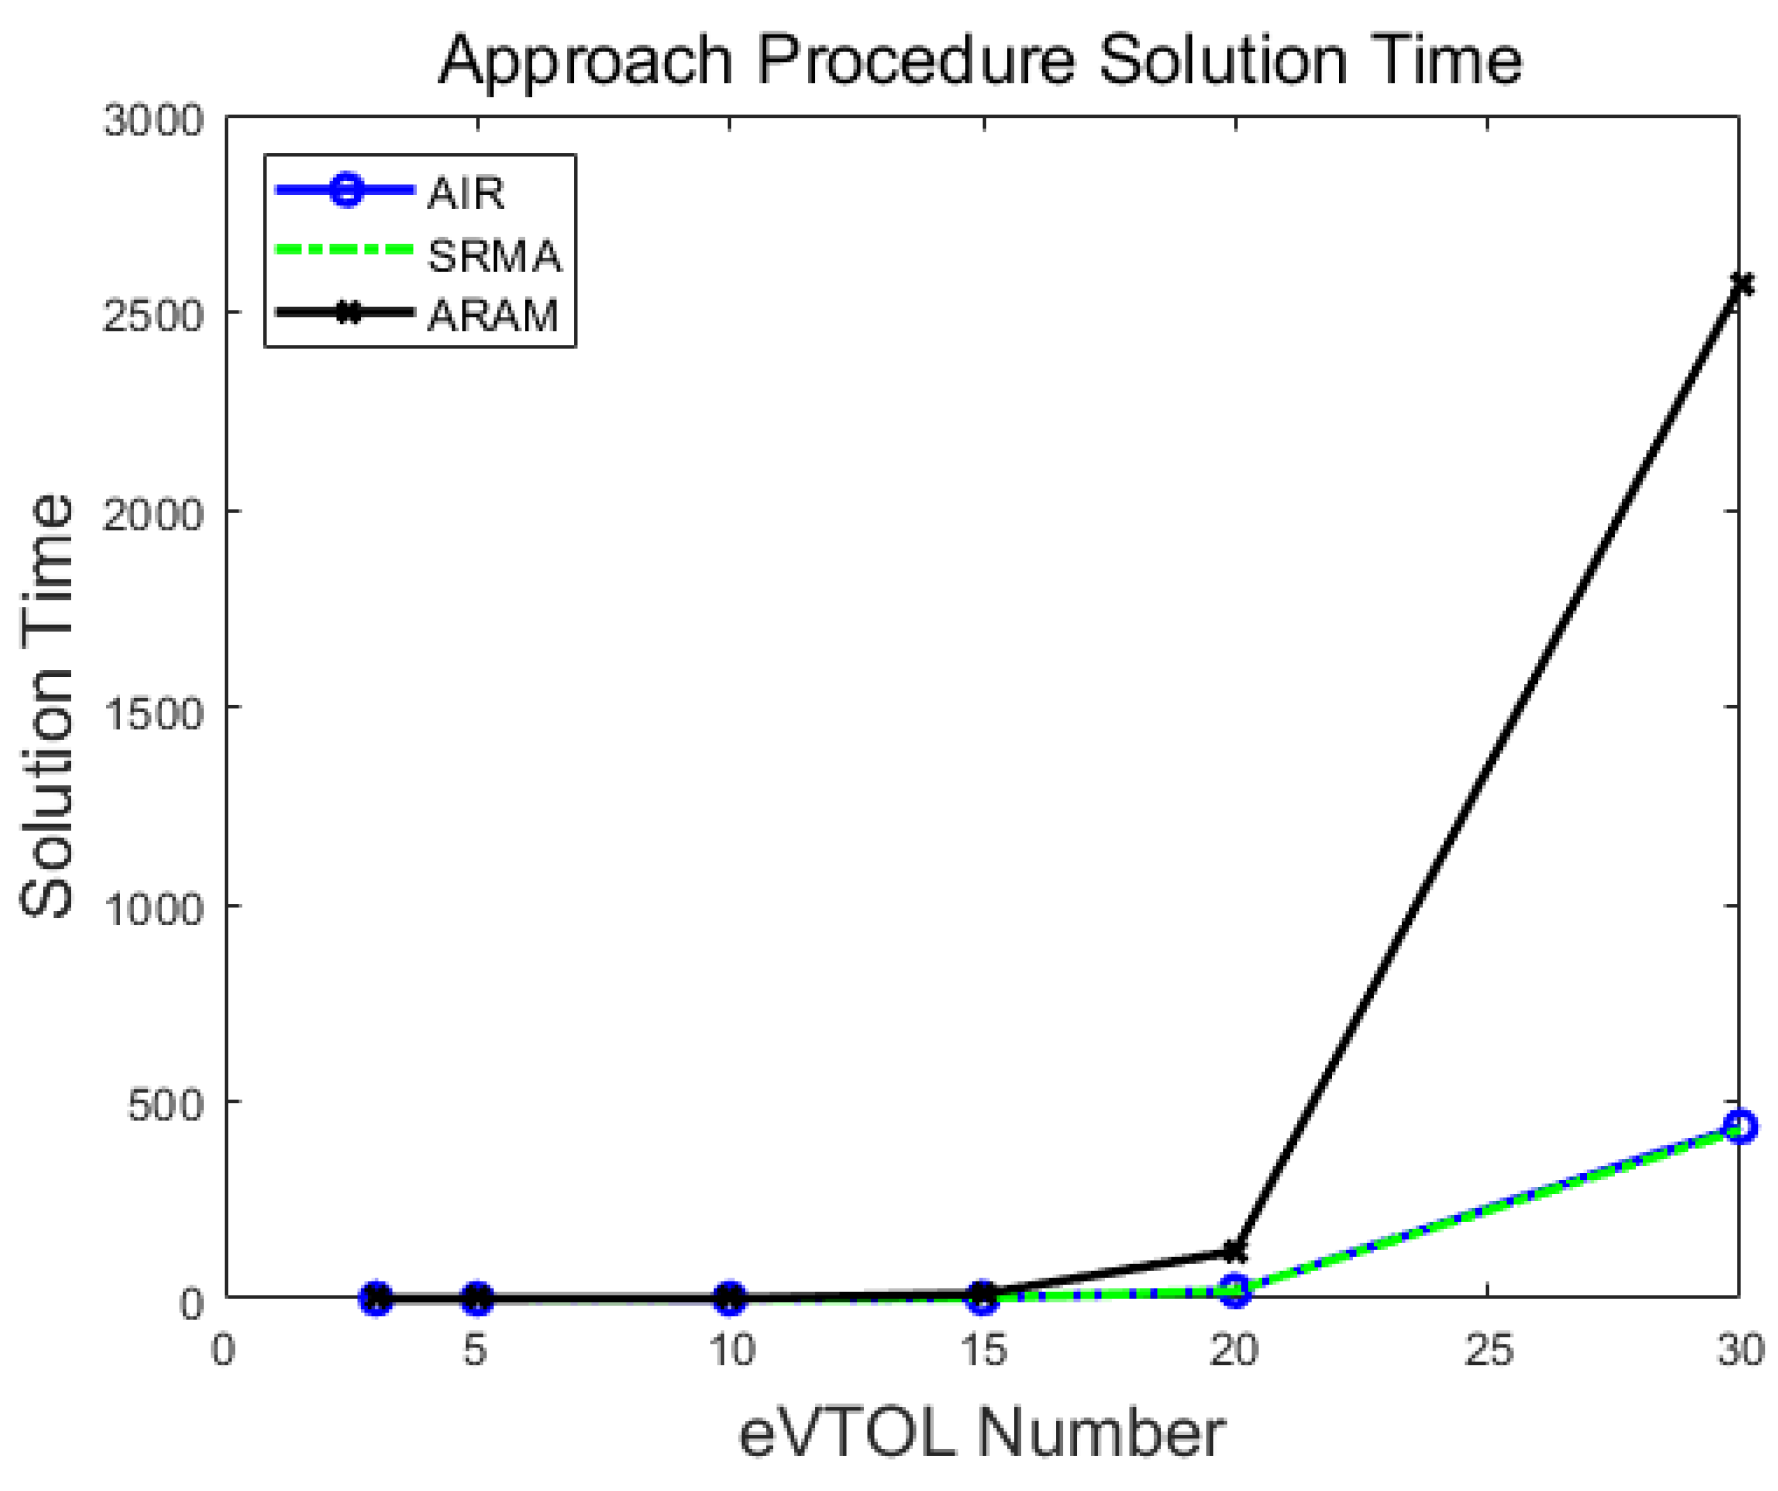
Figure 12.
Approach procedure Solution Time.
Figure 12.
Approach procedure Solution Time.
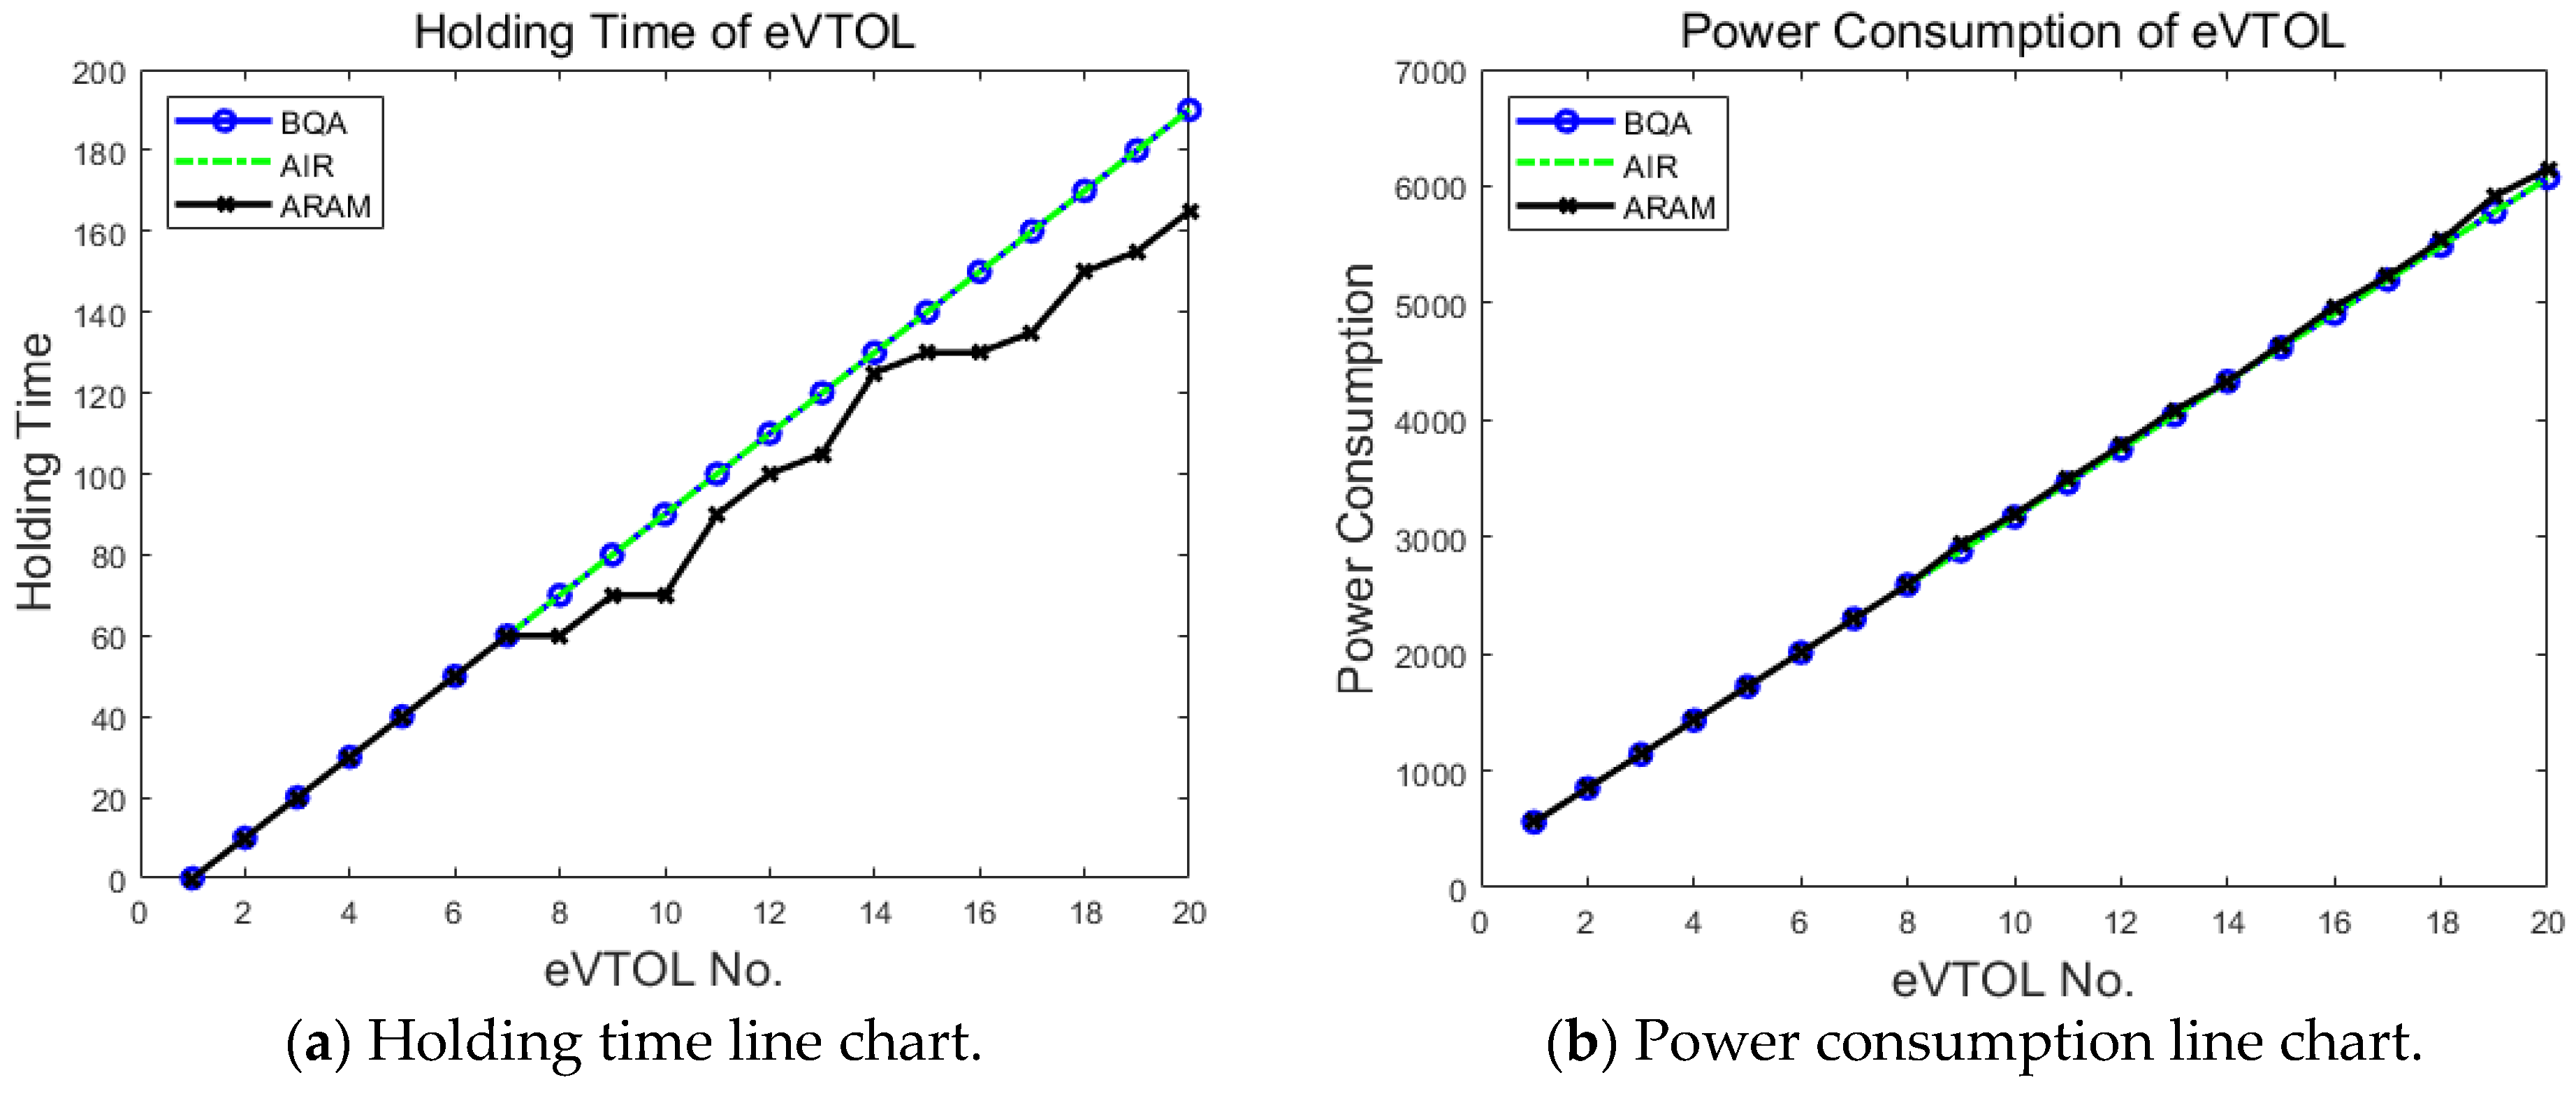
Figure 13.
Line chart in balanced traffic flow scenario.
Figure 13.
Line chart in balanced traffic flow scenario.
Figure 14.
Line chart in imbalanced traffic flow scenario.
Figure 14.
Line chart in imbalanced traffic flow scenario.
Figure 15.
Approach trajectories (BQA and AIR).
Figure 15.
Approach trajectories (BQA and AIR).
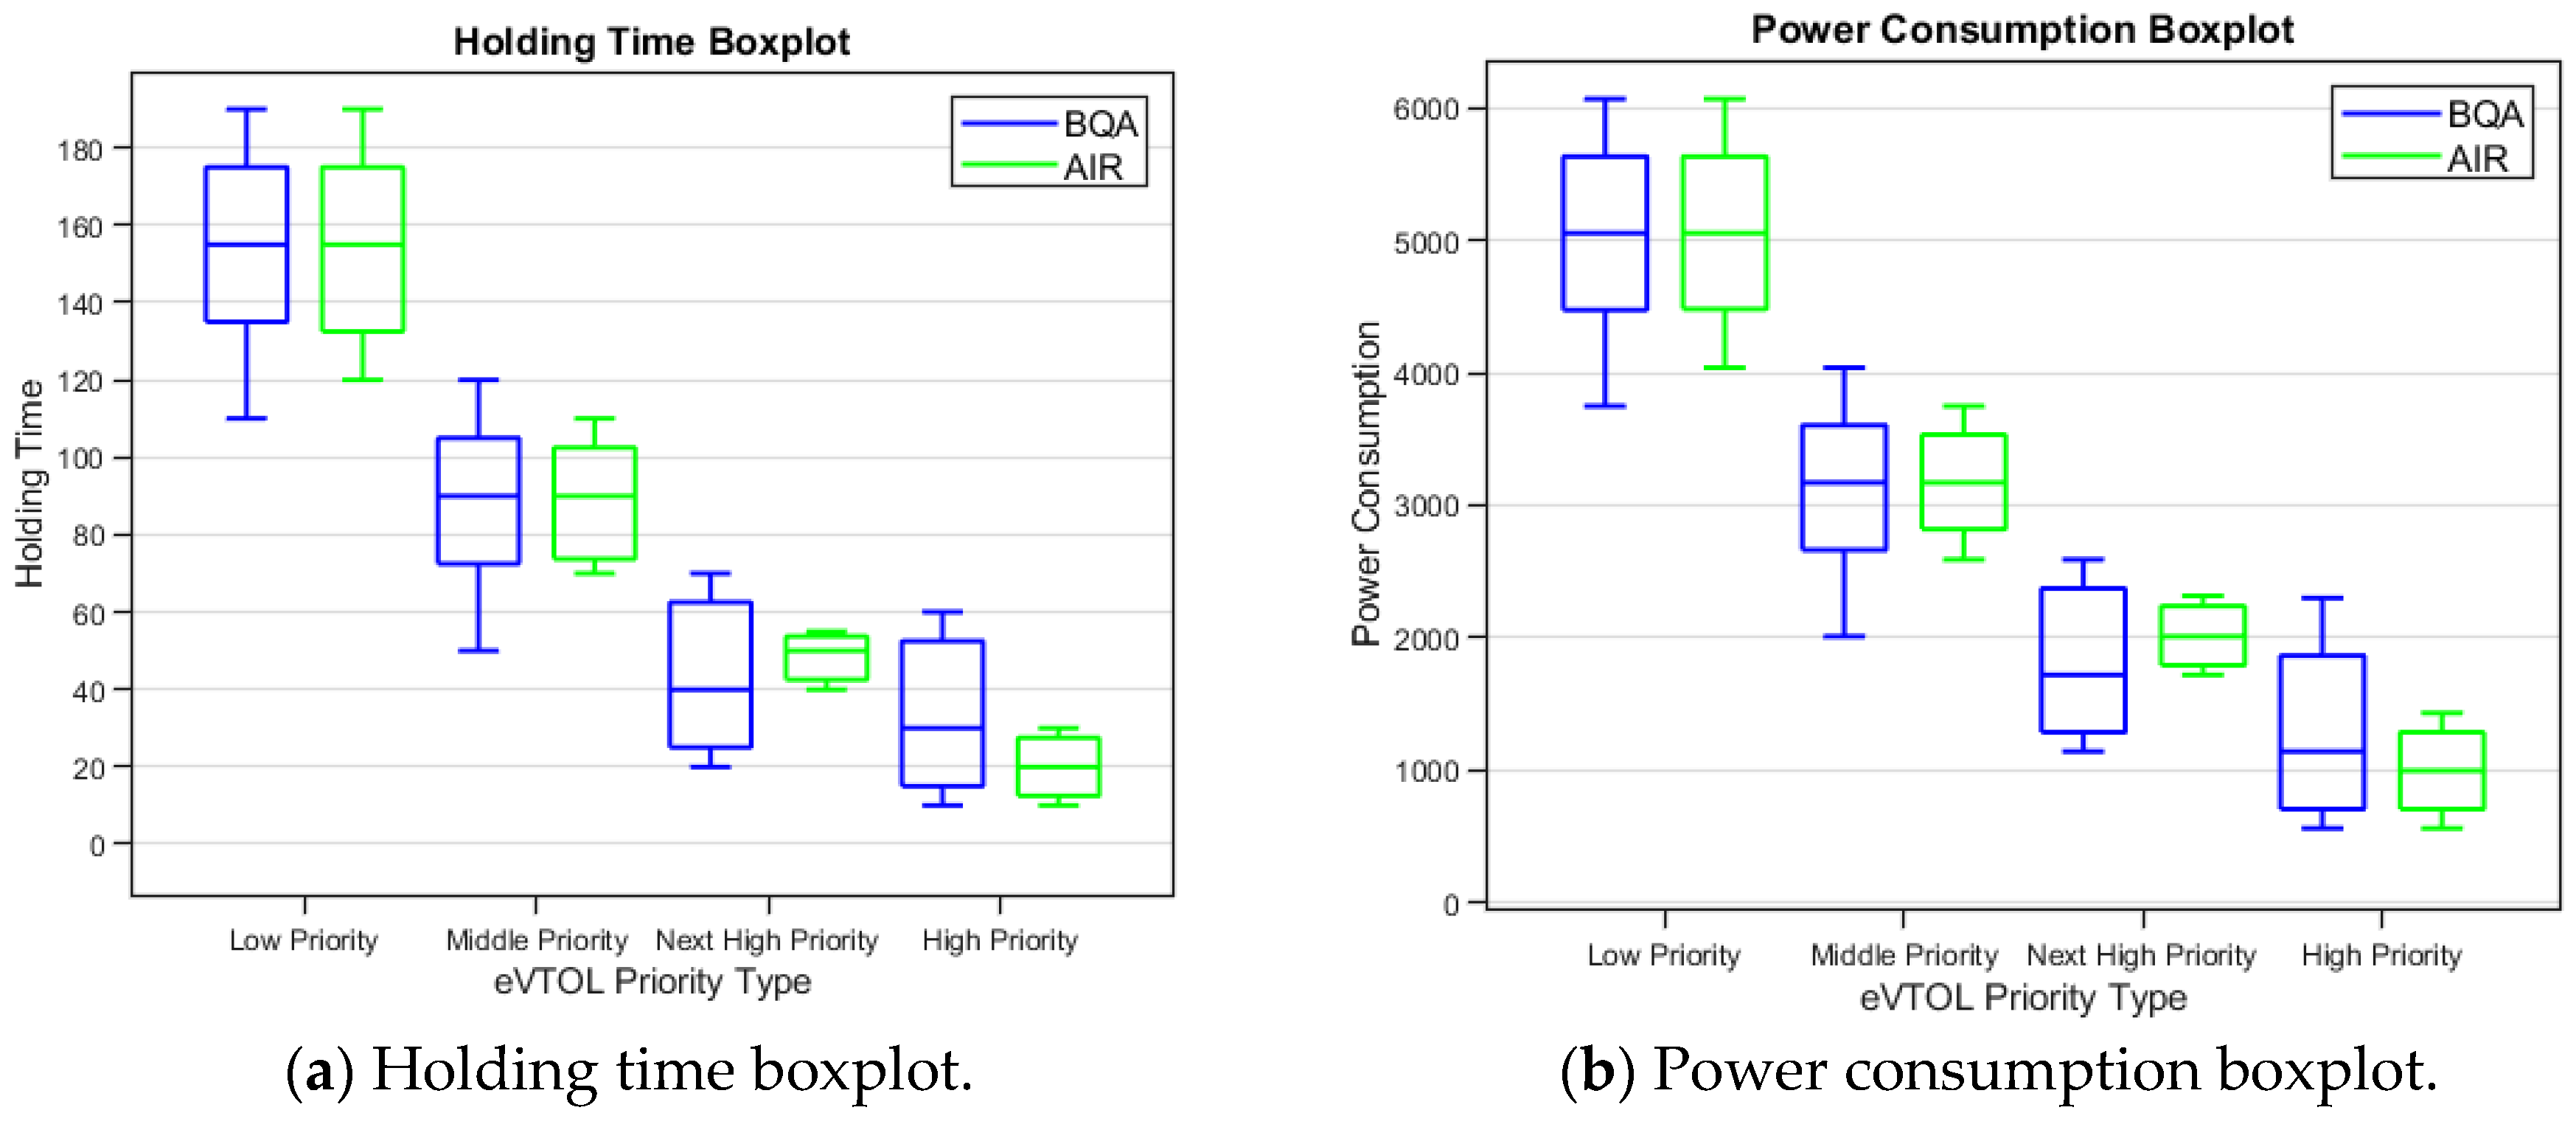
Figure 16.
Holding time and power consumption distribution boxplot (BQA and AIR).
Figure 16.
Holding time and power consumption distribution boxplot (BQA and AIR).
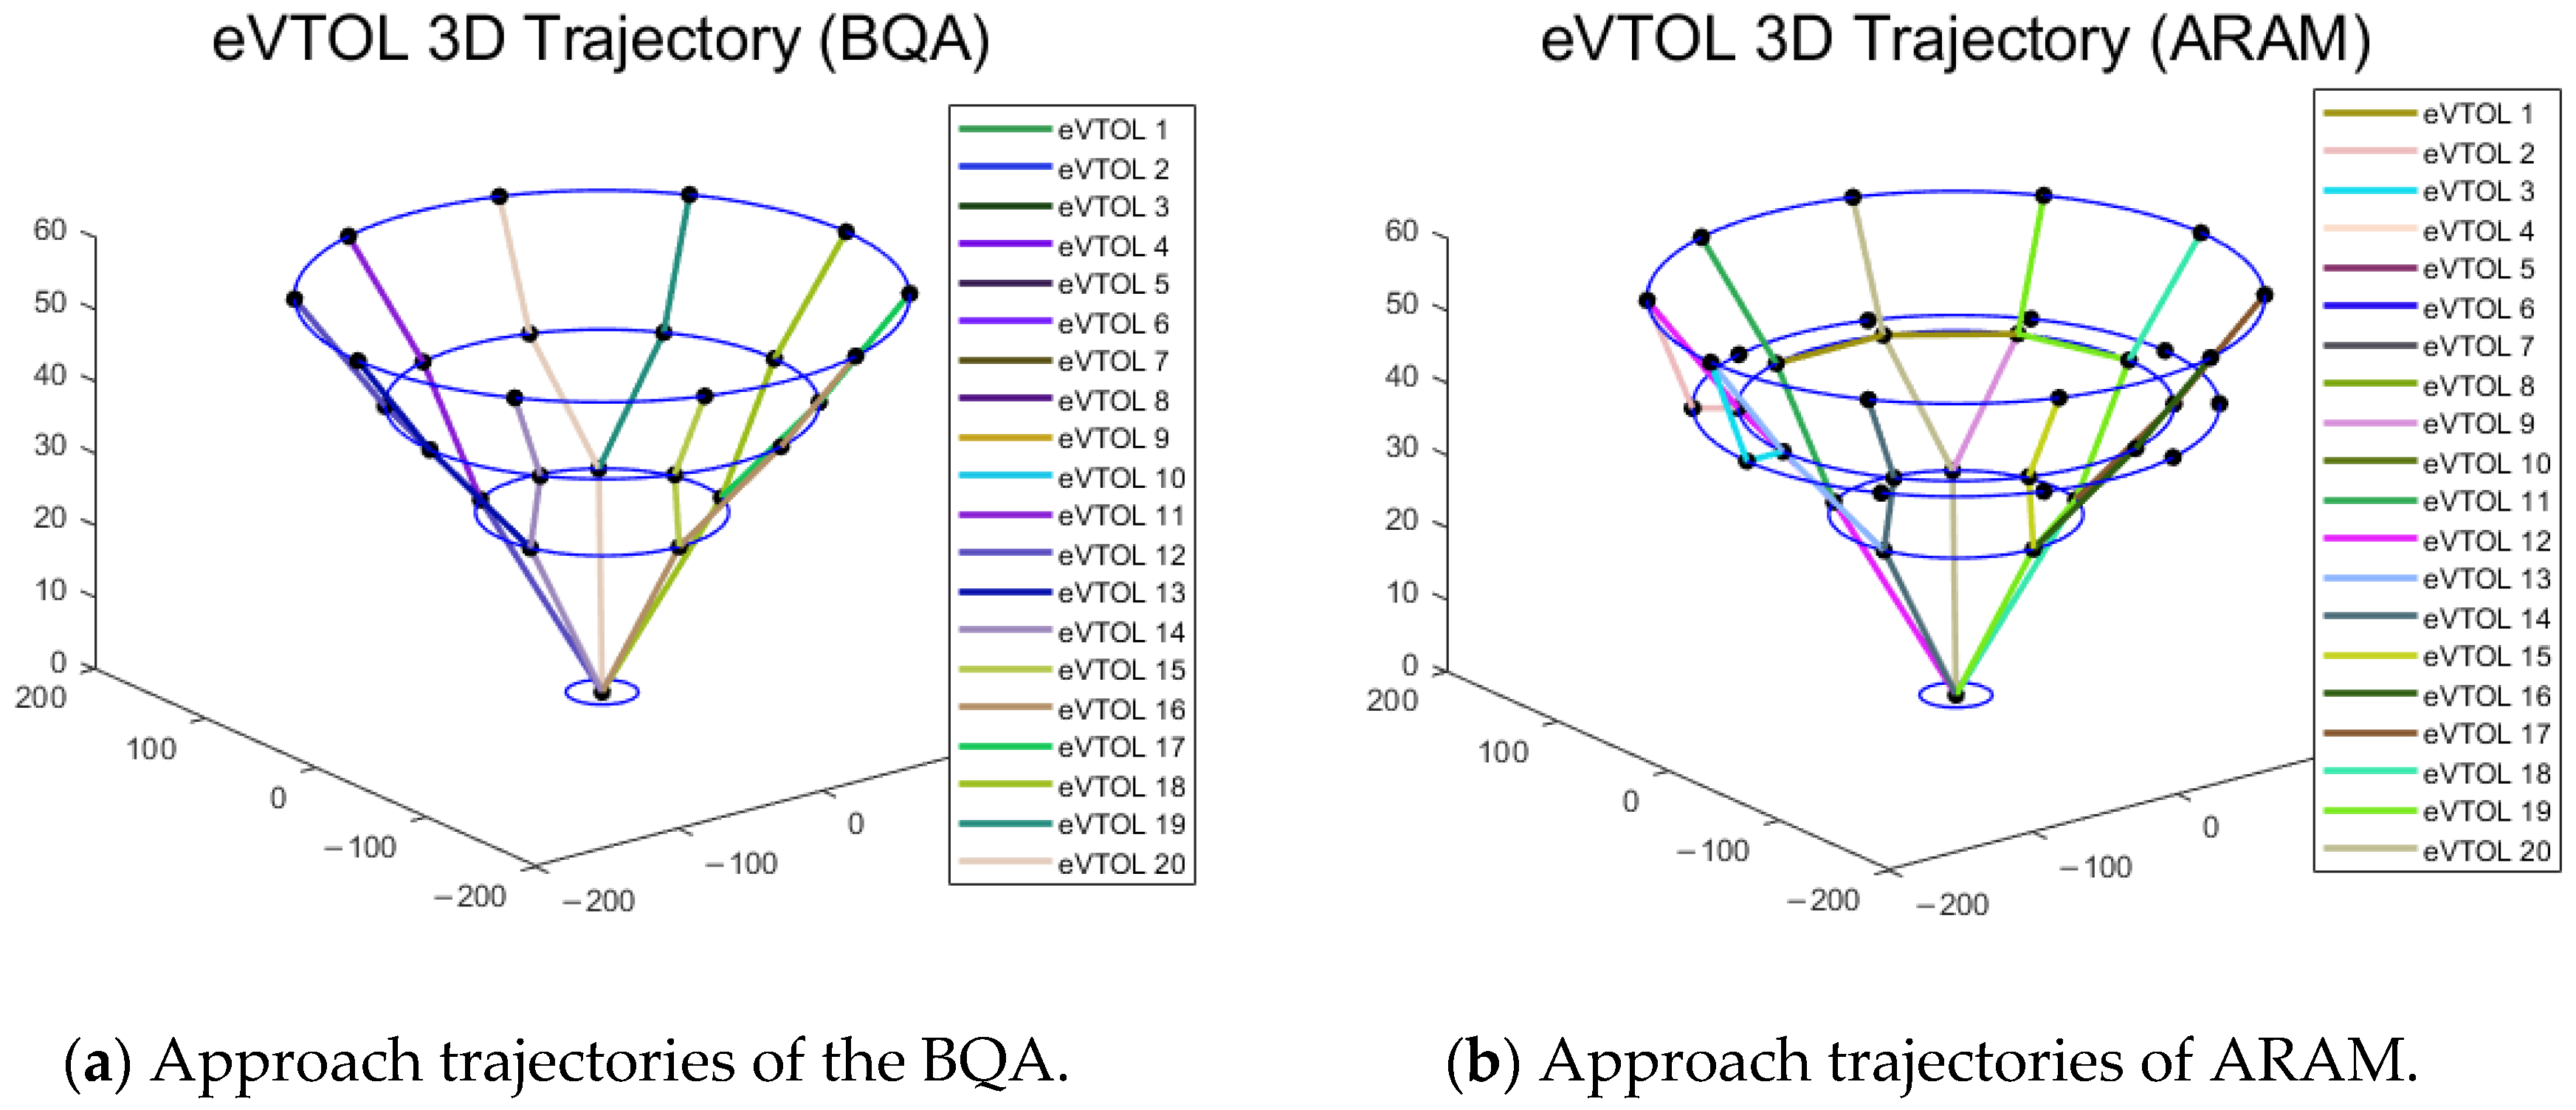
Figure 17.
Approach trajectories (BQA and SRMA).
Figure 17.
Approach trajectories (BQA and SRMA).
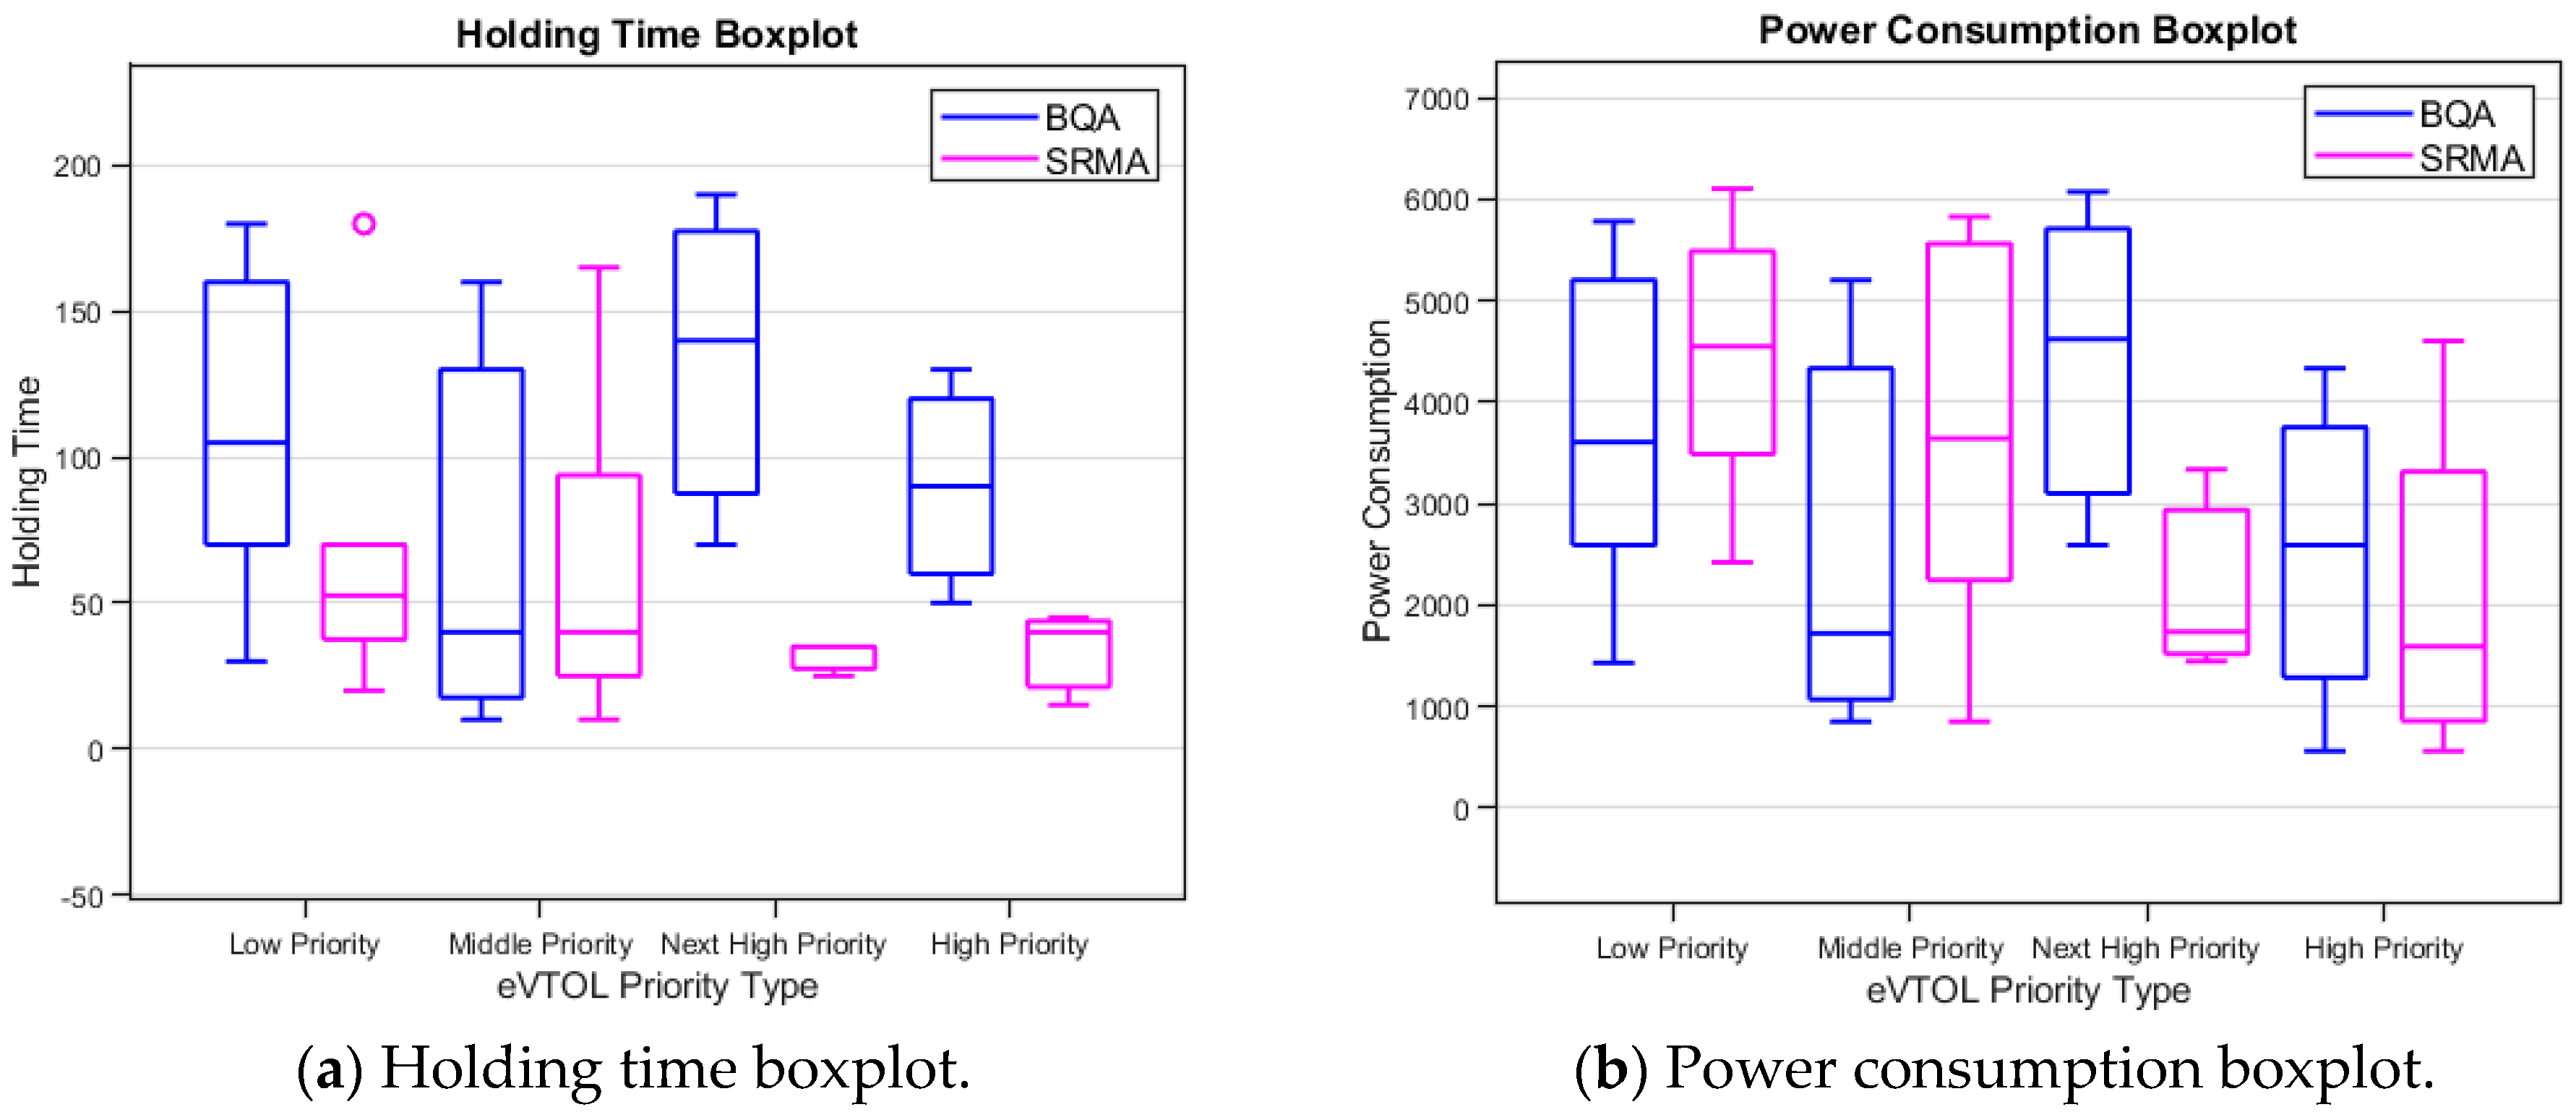
Figure 18.
Holding time and power consumption comparison boxplots (BQA and SRMA).
Figure 18.
Holding time and power consumption comparison boxplots (BQA and SRMA).
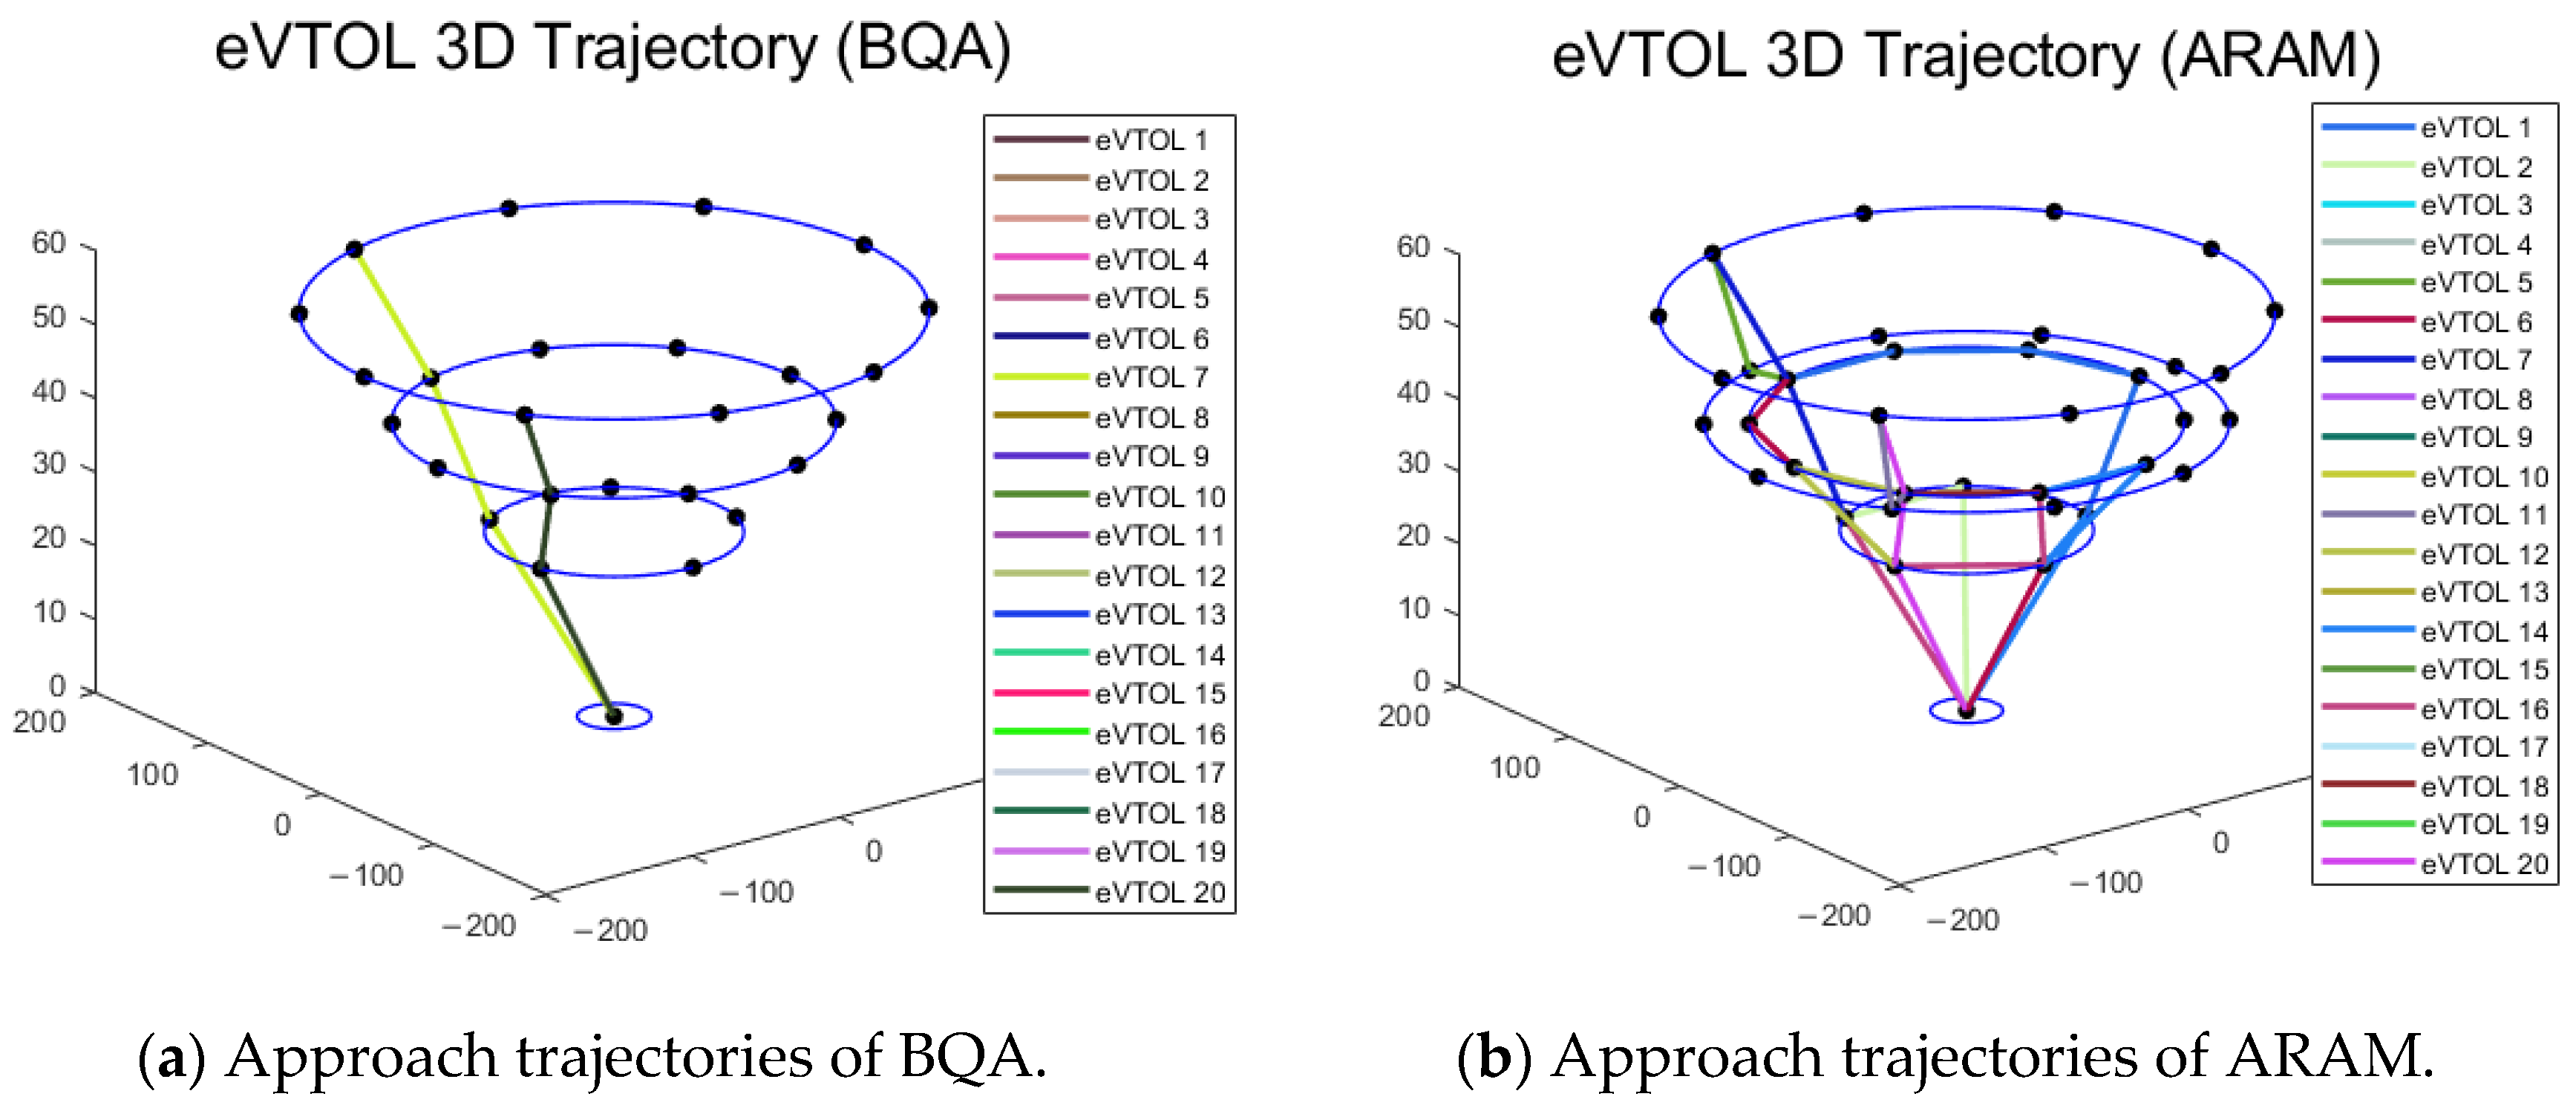
Figure 19.
Approach trajectories (balanced traffic flow).
Figure 19.
Approach trajectories (balanced traffic flow).
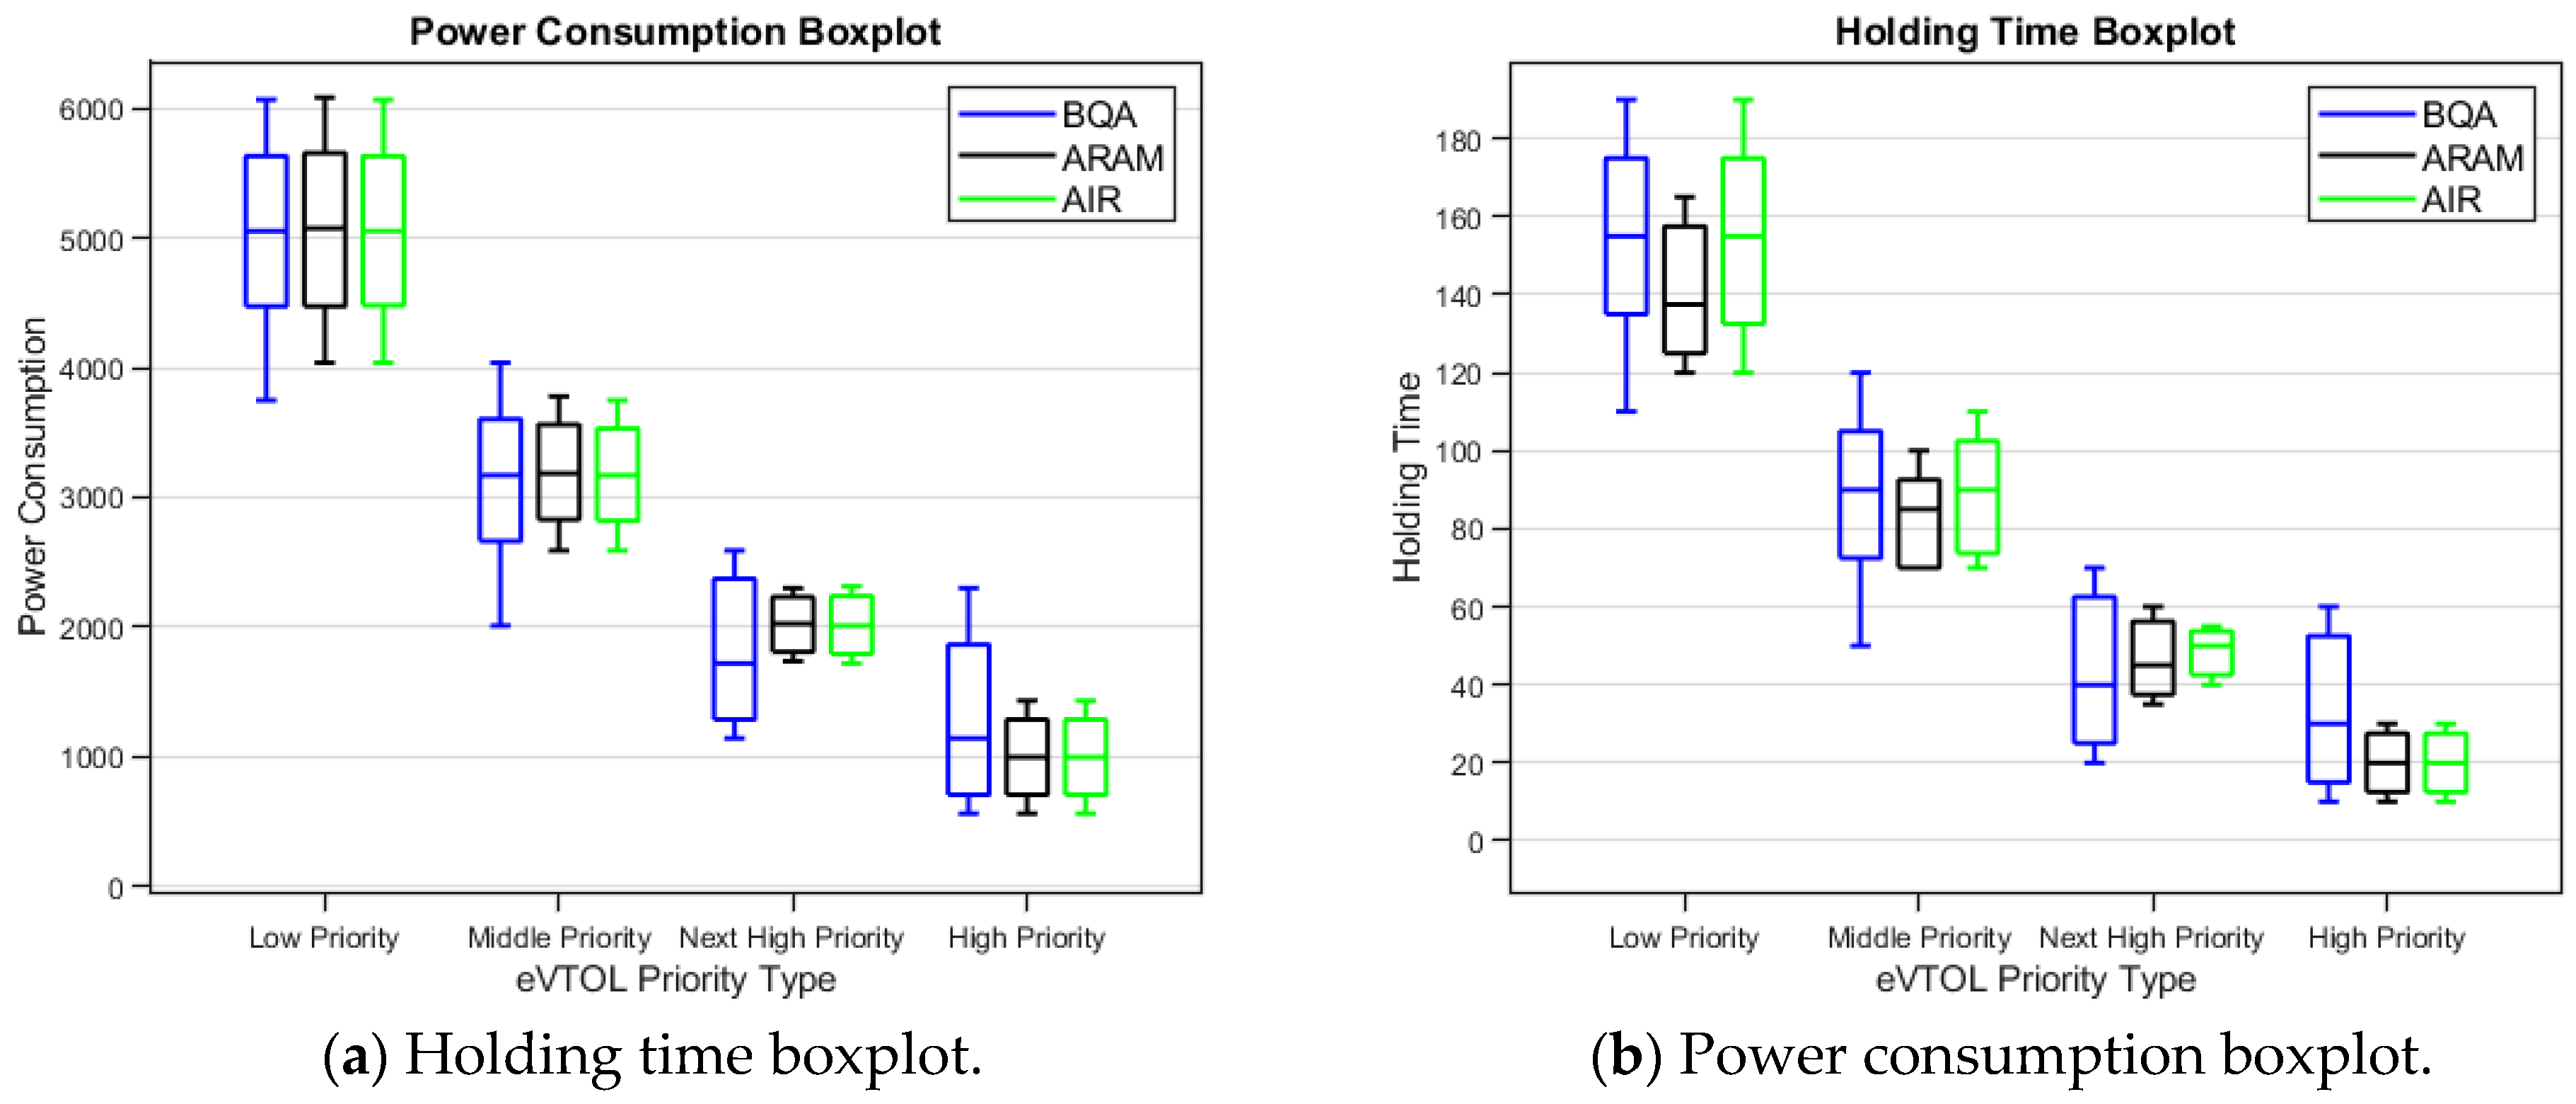
Figure 20.
Holding time and power consumption comparison boxplot (BQA, ARAM, and AIR).
Figure 20.
Holding time and power consumption comparison boxplot (BQA, ARAM, and AIR).
Figure 21.
Approach trajectories (imbalanced traffic flow).
Figure 21.
Approach trajectories (imbalanced traffic flow).
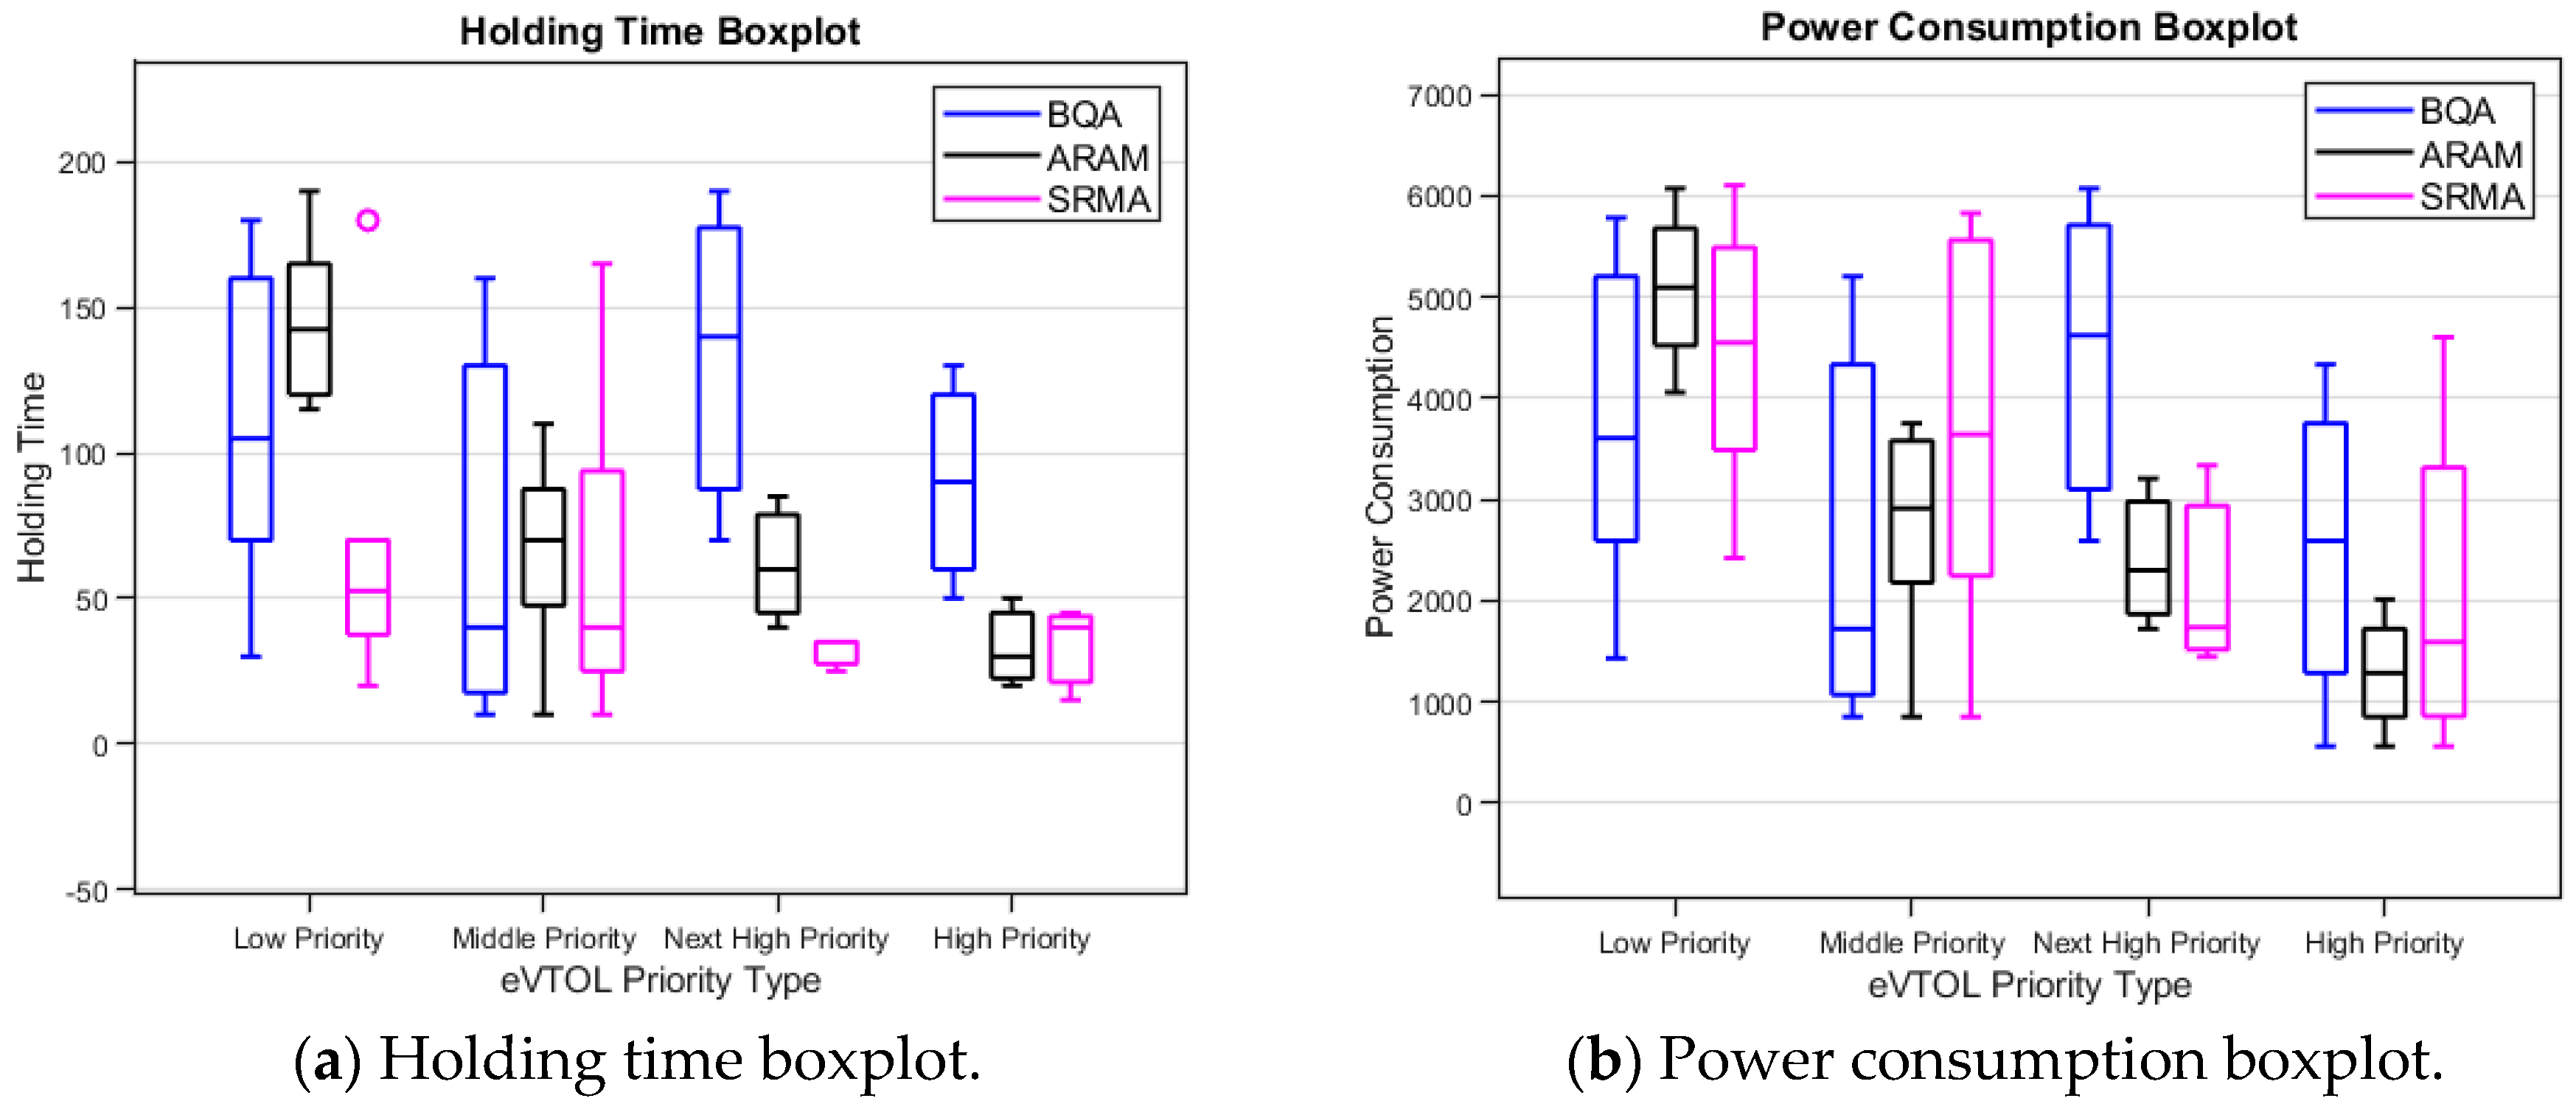
Figure 22.
Holding time and power consumption comparison boxplot (BQA, ARAM, and SRMA).
Figure 22.
Holding time and power consumption comparison boxplot (BQA, ARAM, and SRMA).
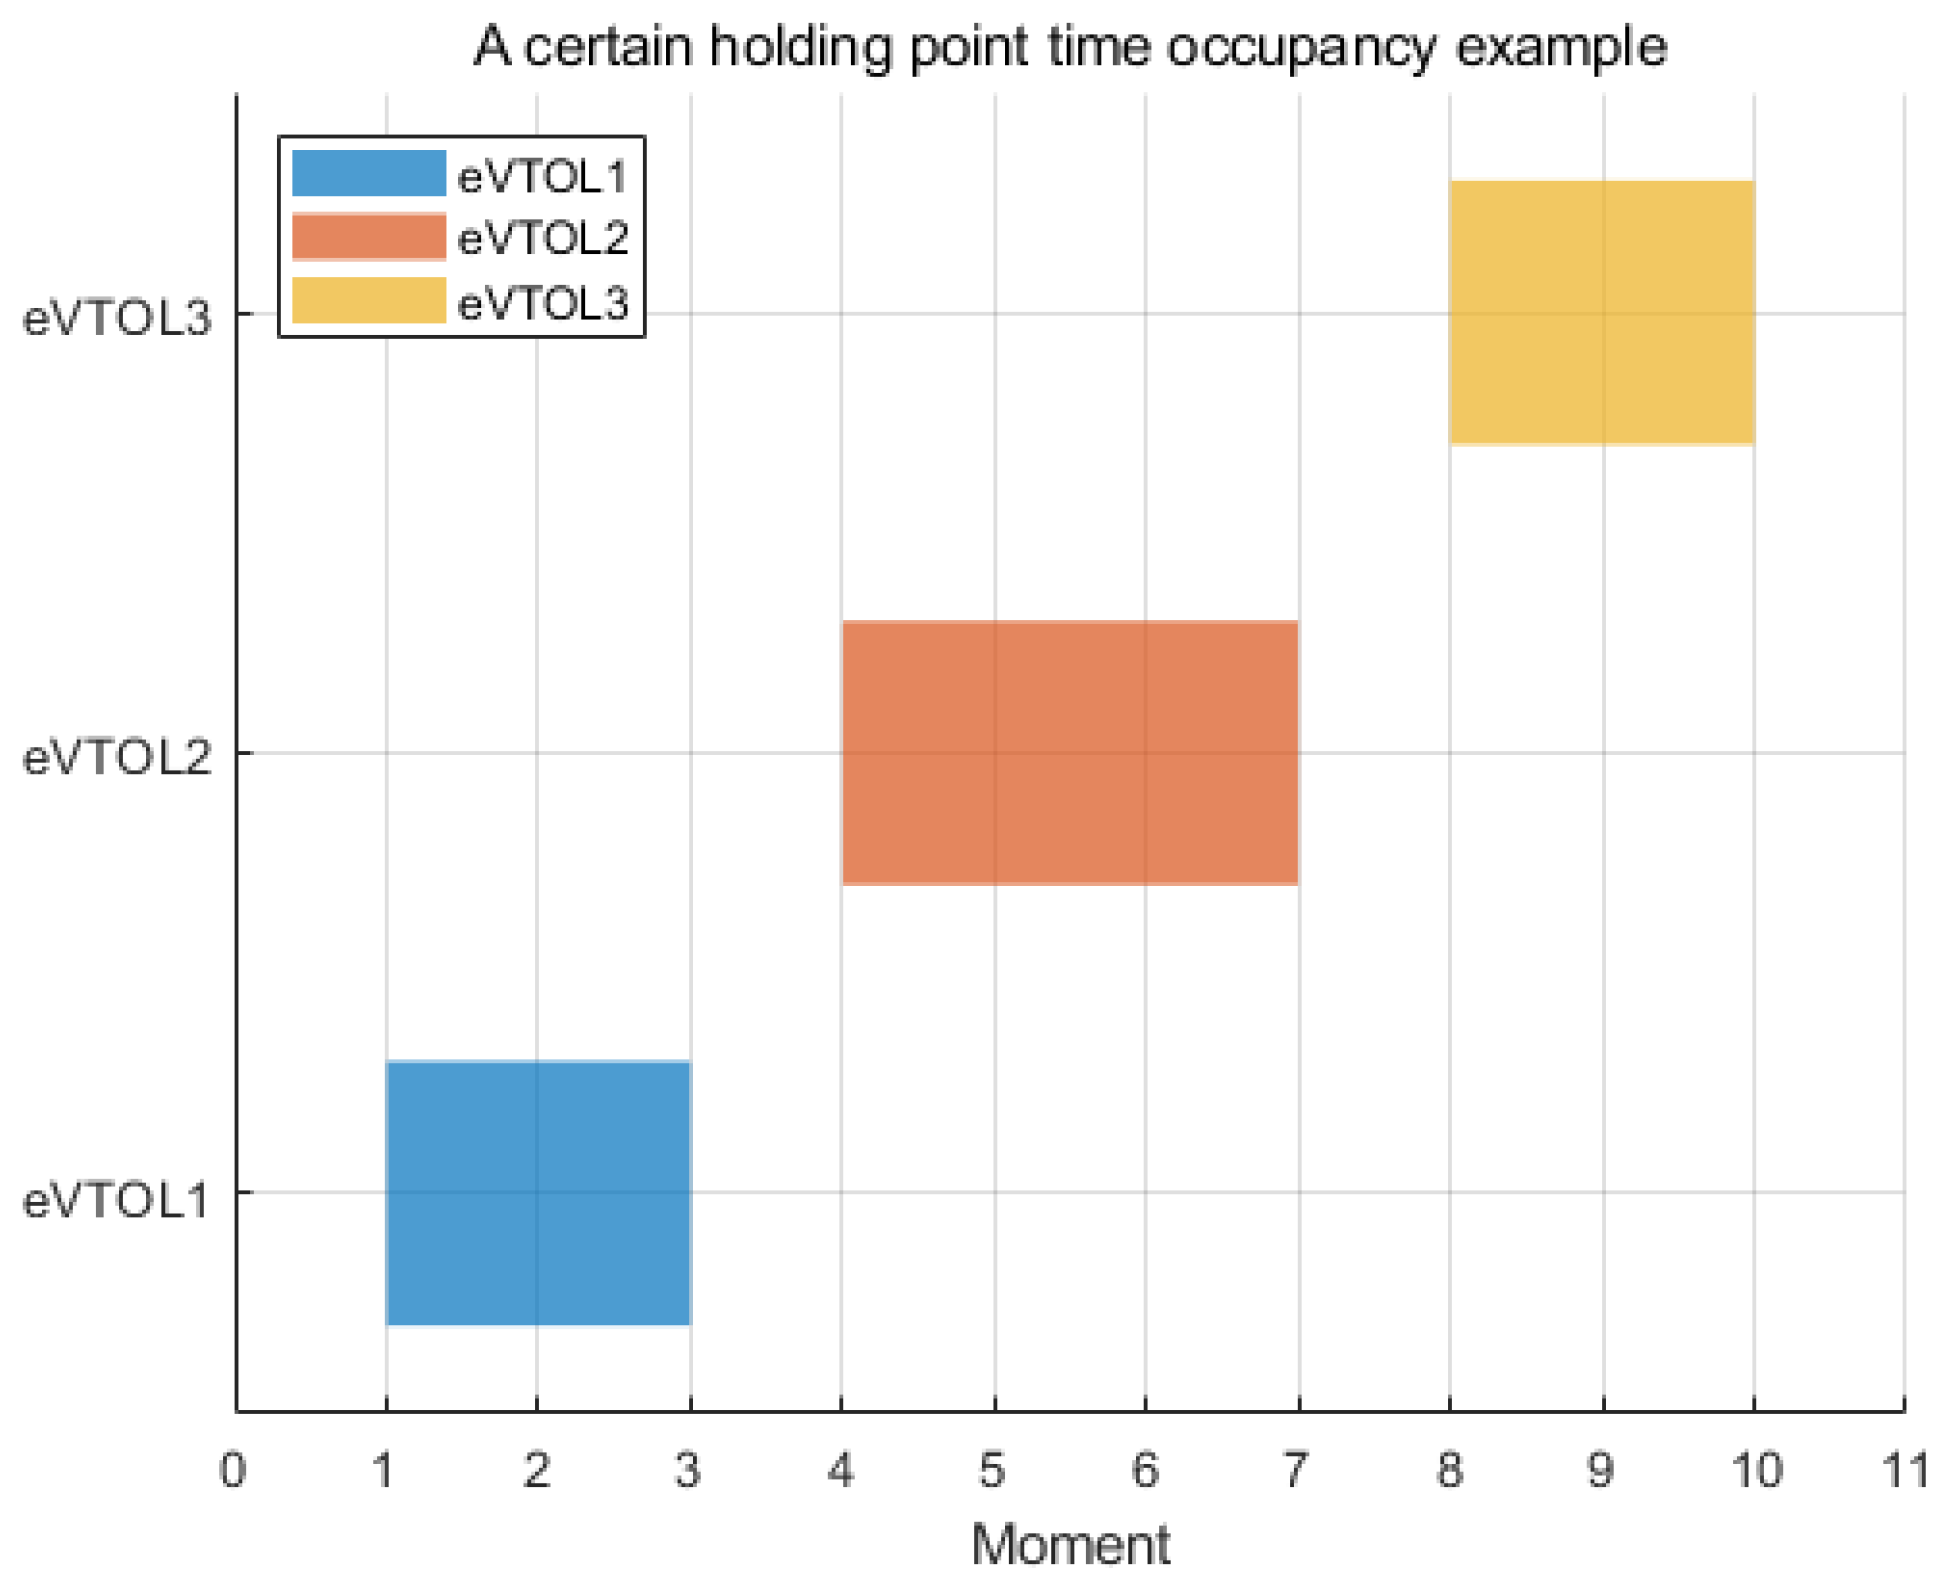
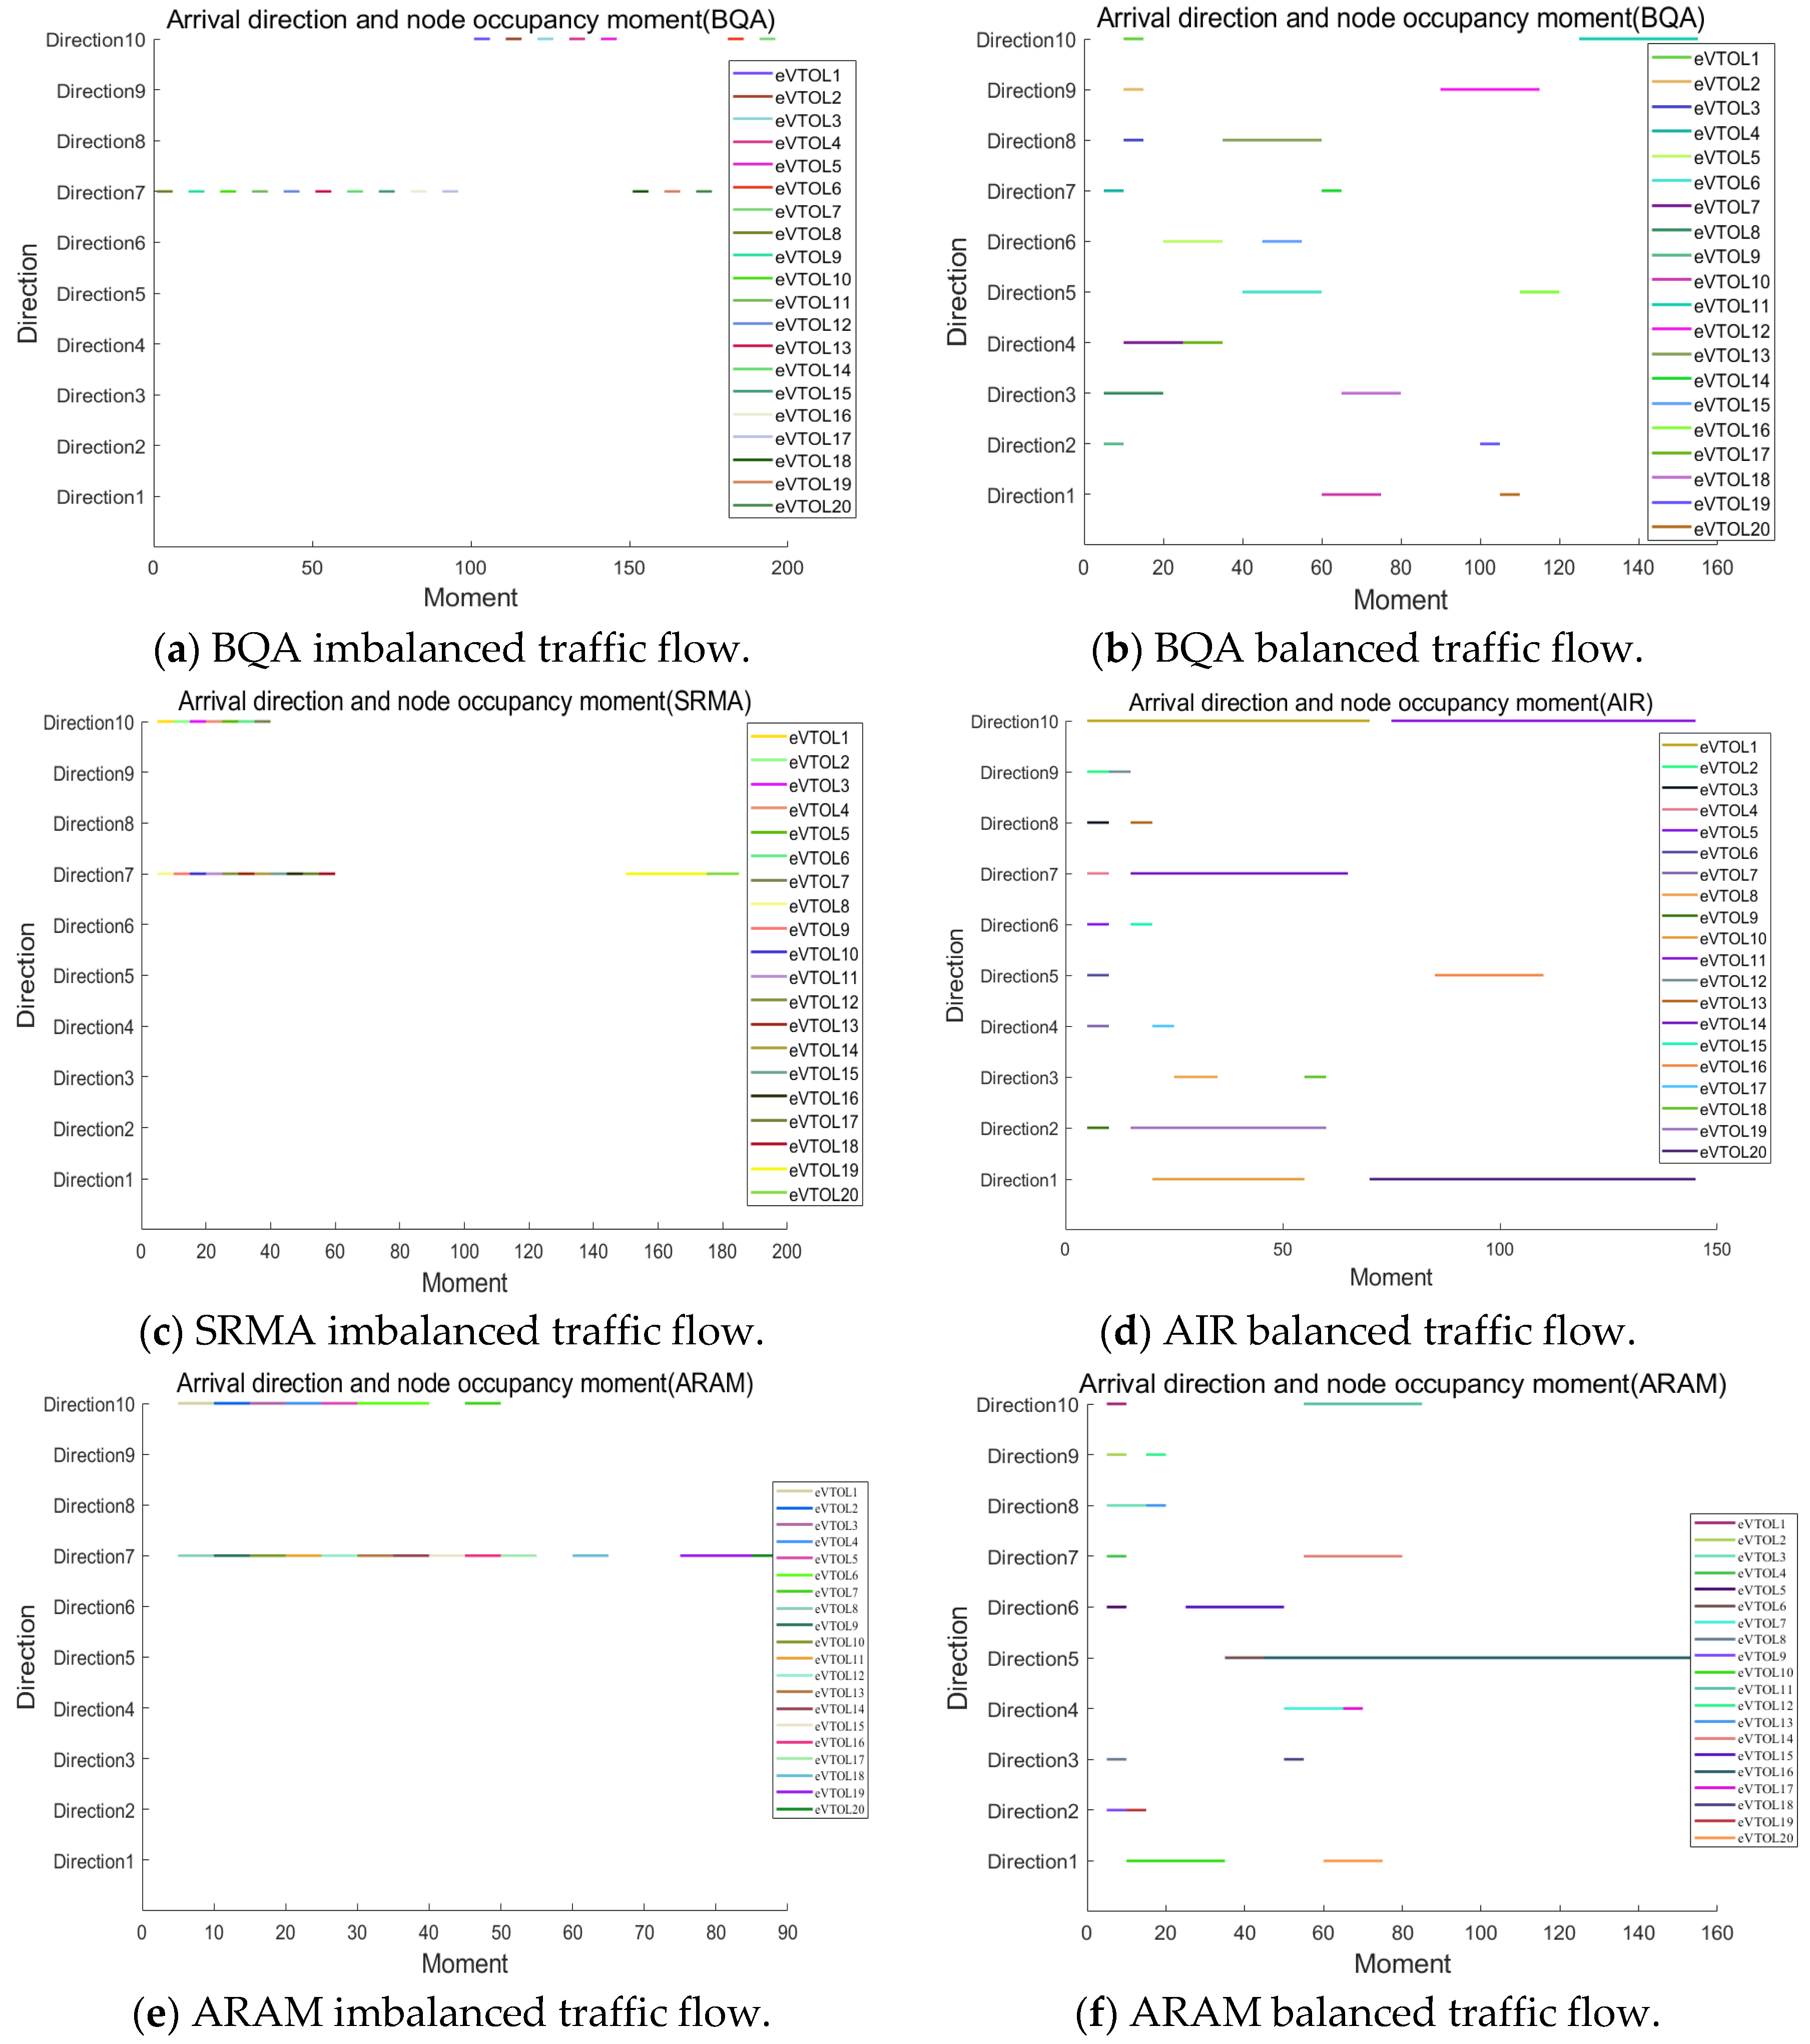
Figure 23.
Arrival direction and node occupancy moment.
Figure 23.
Arrival direction and node occupancy moment.
Table 1.
Technical comparison.
Table 1.
Technical comparison.
| Approach Procedure | Advantages | Disadvantage | Applicable Environment |
|---|
| Traditional approach procedure of civil aviation |
| VDA [10,18,19] | A changeable descent angle can reduce approach time and power consumption. | Large airspace is needed when operating on a large scale.
It is hard to sequence when operating on a large scale. | Small-scale unmanned eVTOL operation.
All types of unmanned eVTOL. |
| The ring structure and circling approach procedure |
| Circling [20,21,22] | Suitable for large-scale unmanned eVTOL approaching. | Unnecessary power consumption caused by circling. | Medium-scale unmanned eVTOL operation.
Fixed-wing unmanned eVTOL. |
| The ring structure and holding point approach procedure |
| BQA [11,12,23] | Take advantage of the hoverability of unmanned eVTOL.
Lower power consumption than circling. | Lack of resequence strategy based on unmanned eVTOL priority.
Easily affected by traffic flow direction. | Large-scale unmanned eVTOL operation.
All types of unmanned eVTOL. |
| AIR (This Paper) | Resequence strategy based on unmanned eVTOL priority. | Easily affected by traffic flow direction. | Large-scale unmanned eVTOL operation
All types of unmanned eVTOL. |
| SRMA (This Paper) | Traffic flow adjustment strategy. | This may cause higher power consumption when resequencing unmanned eVTOL. | Large-scale unmanned eVTOL operation.
All types of unmanned eVTOL. |
| ARAM (This Paper) | Resequence strategy based on unmanned eVTOL.
Traffic flow adjustment strategy. | | Large-scale unmanned eVTOL operation.
All types of unmanned eVTOL. |
Table 2.
Direction matrix example.
Table 2.
Direction matrix example.
Table 3.
Mission urgency priority loss.
Table 3.
Mission urgency priority loss.
Table 4.
Battery status priority loss.
Table 4.
Battery status priority loss.
| Category | 1 | 2 | 3 | 4 |
…
| q |
| Uk | p·ε | 2·p·ε | 3·p·ε | 4·p·ε |
…
| q·p·ε |
Table 5.
Unmanned eVTOL performance parameters.
Table 5.
Unmanned eVTOL performance parameters.
| Parameters | Autoflight Prosperity |
|---|
| m | 1800 kg |
| NR | 10 |
| DR,i | 3.14 m |
| α | 0.1 |
| β | 0.05 |
Table 6.
Unmanned eVTOL power consumption.
Table 6.
Unmanned eVTOL power consumption.
| Parameters | Power Consumption |
|---|
| Fhover | 29 kW·s |
| Flevel | 32 kW·s |
| Fdescend | 28 kW·s |
Table 7.
Parameters of approach procedure.
Table 7.
Parameters of approach procedure.
| Parameters | Values |
|---|
| n | 3 |
| r3 | 170 m |
| r2 | 120 m |
| r1 | 70 m |
| r0 | 20 |
| h3 | 55 m |
| h2 | 40 m |
| h1 | 25 m |
| h0 | 10 |
| Nd | 10 |
Table 8.
Related time parameters.
Table 8.
Related time parameters.
| Parameters | Values |
|---|
|
Δt | 5 s |
|
Δt1 | 10 s |
|
Δt2 | 5 s |
Table 9.
Objective function weight.
Table 9.
Objective function weight.
| Values | Weight |
|---|
| Ct | 0.2 |
| Cf | 0.2 |
| Cp | 0.6 |
Table 10.
Mission urgency and battery status priority loss.
Table 10.
Mission urgency and battery status priority loss.
| Parameters | Values |
|---|
| Qk | Cargo | 1 |
| Passenger | 2 |
| Uk | Remaining high power | 1 |
| Remaining low power | 2 |
Table 11.
Priority loss category.
Table 11.
Priority loss category.
| Priority Category | High Priority | Next High Priority | Middle Priority | Low Priority |
|---|
| Battery status | Low | Low | High | High |
| Cargo or passenger | Passenger | Cargo | Passenger | Cargo |
| Ck | 3 | 2.5 | 2 | 1.5 |
Table 12.
Indicator weight.
Table 12.
Indicator weight.
| Indicators | Weight |
|---|
| Co | 0.1 |
| Cpi | 0.1 |
Table 13.
Comparisons of BQA, AIR, and ARAM in a balanced traffic flow scenario without priority.
Table 13.
Comparisons of BQA, AIR, and ARAM in a balanced traffic flow scenario without priority.
| Approach Procedure | | |
|---|
| BQA | 3315 kW·s | 95 s |
| AIR | 3315 kW·s | 95 s |
| ARAM | 3342.8 kW·s | 84.75 s |
Table 14.
Comparisons of BQA, SRMA, and ARAM in an imbalanced traffic flow scenario without priority.
Table 14.
Comparisons of BQA, SRMA, and ARAM in an imbalanced traffic flow scenario without priority.
| Approach Procedure | | |
|---|
| BQA | 3315 kW·s | 95 s |
| SRMA | 3328.5 kW·s | 90.5 s |
| ARAM | 3323.3 kW·s | 92.5 s |
Table 15.
Comparison of indexes between BQA and AIR.
Table 15.
Comparison of indexes between BQA and AIR.
| Approach Procedure | Ftotal (Score) | (Score) | Lp (Score) | OT (Score) | P (Score) | Score |
|---|
| BQA | 66,300 kW·s (+1) | 95 s (+0) | 876 (+0) | 210 s (+0) | 0.5 (+0) | 0.2 |
| AIR | 66,345 kW·s (+0) | 94.25s (+1) | 869 (+1) | 210 s (+0) | 0.5 (+0) | 0.8 |
Table 16.
Comparison of between BQA and AIR with different priorities.
Table 16.
Comparison of between BQA and AIR with different priorities.
| Approach Procedure | Low Priority | Middle Priority | Next High Priority | High Priority |
|---|
| BQA | 5018.8 kW·s | 3112 kW·s | 1816.7 kW·s | 1285 kW·s |
| AIR | 5056.9 kW·s | 3173 kW·s | 2015 kW·s | 995 kW·s |
Table 17.
Comparison of between BQA and AIR with different priorities.
Table 17.
Comparison of between BQA and AIR with different priorities.
| Approach Procedure | Low Priority | Middle Priority | Next High Priority | High Priority |
|---|
| BQA | 153.75 s | 88 s | 43.3 s | 25 s |
| AIR | 154.375 s | 89 s | 48.3 s | 15 s |
Table 18.
Comparison of indexes between BQA and SRMA.
Table 18.
Comparison of indexes between BQA and SRMA.
| Approach Procedure | Ftotal (Score) | (Score) | Lp (Score) | OT (Score) | P (Score) | Score |
|---|
| BQA | 66,300 kW·s (+1) | 95 s (+0) | 972 (+0) | 210 s (+0) | 0.55 (+0) | 0.2 |
| SRMA | 68,910 kW·s (+0) | 51.5 s (+1) | 920 (+1) | 210 s (+0) | 0.1 (+1) | 0.9 |
Table 19.
Comparison of between BQA and SRMA with different priorities.
Table 19.
Comparison of between BQA and SRMA with different priorities.
| Approach Procedure | Low Priority | Next High Priority | High Priority |
|---|
| BQA | 3750 kW·s | 4426.7 kW·s | 2517.5 kW·s |
| SRMA | 4445 kW·s | 2171.7 kW·s | 2085 kW·s |
Table 20.
Comparison of between BQA and SRMA with different priorities.
Table 20.
Comparison of between BQA and SRMA with different priorities.
| Approach Procedure | Low Priority | Middle Priority | Next High Priority | High Priority |
|---|
| BQA | 110 s | 70 s | 133.3 s | 67.5 s |
| SRMA | 65 s | 63 s | 31.7 s | 25 s |
Table 21.
Comparison of indexes between BQA, ARAM, and AIR.
Table 21.
Comparison of indexes between BQA, ARAM, and AIR.
| Approach Procedure | Ftotal (Score) | (Score) | Lp (Score) | OT (Score) | P (Score) | Score |
|---|
| BQA | 66,300 kW·s (+2) | 95 s (+0) | 876 (+0) | 210 s (+0) | 0.5 (+0) | 0.4 |
| ARAM | 66,540 kW·s (+0) | 87 s (+2) | 869 (+1) | 210 s (+0) | 0.45 (+1) | 1.1 |
| AIR | 66,345 kW·s (+1) | 94.25 (+1) | 869 (+1) | 210 s (+0) | 0.5 (+0) | 1.0 |
Table 22.
Comparison of between BQA, ARAM, and AIR.
Table 22.
Comparison of between BQA, ARAM, and AIR.
| Approach Procedure | Low Priority | Middle Priority | Next High Priority | High Priority |
|---|
| BQA | 5018.8 kW·s | 3112 kW·s | 1816.7 kW·s | 1285 kW·s |
| ARAM | 5068.1 kW·s | 3191 kW·s | 2020 kW·s | 995 kW·s |
| AIR | 5056.9 kW·s | 3173 kW·s | 2015 kW·s | 995 kW·s |
Table 23.
Comparison of between BQA, ARAM, and AIR.
Table 23.
Comparison of between BQA, ARAM, and AIR.
| Approach Procedure | Low Priority | Middle Priority | Next High Priority | High Priority |
| BQA | 153.75 s | 88 s | 43.3 s | 25 s |
| ARAM | 140.625 s | 83 s | 46.67 s | 15 s |
| AIR | 154.375 s | 89 s | 48.3 s | 15 s |
Table 24.
Comparison of indexes between BQA, ARAM, and SRMA.
Table 24.
Comparison of indexes between BQA, ARAM, and SRMA.
| Approach Procedure | Ftotal(Score) | HT(Score) | Lp(Score) | OT(Score) | P(Score) | Score |
| BQA | 66,300 kW·s (+2) | 95 s (+0) | 972 (+0) | 210 s (+1) | 0.6 (+0) | 0.5 |
| ARAM | 66,715 kW·s (+1) | 88.75 s (+1) | 881 (+2) | 210 s (+0) | 0.55 (+1) | 1.7 |
| SRMA | 68,910 kW·s (+0) | 51.5 s (+2) | 920 (+1) | 210 s (+1) | 0.1 (+2) | 1.3 |
Table 25.
Comparison of between BQA, ARAM, and SRMA.
Table 25.
Comparison of between BQA, ARAM, and SRMA.
| Approach Procedure | Low Priority | Middle Priority | Next High Priority | High Priority |
| BQA | 3750 kW·s | 2590 kW·s | 4426.7 kW·s | 2517.5 kW·s |
| ARAM | 5087.5 kW·s | 2730 kW·s | 2408.3 kW·s | 1285 kW·s |
| ARMA | 4445 kW·s | 3699 kW·s | 2171.7 kW·s | 2085 kW·s |
Table 26.
Comparison of between BQA, ARAM, and SRMA.
Table 26.
Comparison of between BQA, ARAM, and SRMA.
| Approach Procedure | Low Priority | Middle Priority | Next High Priority | High Priority |
|---|
| BQA | 110 s | 70 s | 133.3 s | 67.5 s |
| ARAM | 145 s | 66 s | 61.7 s | 25 s |
| SRMA | 65 s | 63 s | 31.7 s | 25 s |


