Article

Research on the UAV Sound Recognition Method Based on Frequency Band Feature Extraction

by
Jilong Zhong
1,2,
Aigen Fan
3,
Kuangang Fan
1,2,*,
Wenjie Pan
1,2 and
Lu Zeng
1
1
School of Electrical Engineering and Automation, Jiangxi University of Science and Technology, Ganzhou 341000, China
2
Jiangxi Province Key Laboratory of Multidimensional Intelligent Perception and Control, Ganzhou 341000, China
3
Shenzhen Institute of Radio Testing & Tech, Shenzhen 100041, China
*
Author to whom correspondence should be addressed.
Drones 2025, 9(5), 351; https://doi.org/10.3390/drones9050351
Submission received: 13 April 2025 / Revised: 1 May 2025 / Accepted: 3 May 2025 / Published: 5 May 2025

Abstract

:
The unmanned aerial vehicle (UAV) industry is developing rapidly, and the application of UAVs is becoming increasingly widespread. Due to the lowering of the threshold for using UAVs, the random flight of UAVs poses safety hazards. In response to the safety risks associated with the unauthorized operation of UAVs, research on anti-UAV technology has become imperative. This study proposes an improved sound feature extraction method that utilizes the frequency distribution features of UAV sounds. By analyzing the spectrogram of UAV sounds, it was found that the classic Mel Frequency Cepstral Coefficients (MFCC) feature extraction method does not match the frequency bands of UAV sounds. Based on the MFCC feature extraction algorithm framework, an improved frequency band feature extraction method was proposed. This method replaces the Mel filter in the classic algorithm with a piecewise linear function with the frequency band weight as the slope, which can effectively suppress the influence of low- and high-frequency noise and fully focus on the different frequency band feature data of UAV sounds. In this study, the actual flight sounds of UAVs were collected, and the sound feature matrix of UAVs was extracted using the frequency band feature extraction method. The sound features were classified and recognized using a Convolutional Neural Network (CNN). The experimental results show that the frequency band feature extraction method has a better recognition effect compared to the classic MFCC feature extraction method.

1. Introduction

With the continuous maturation of key technologies such as automatic control and communication systems in the UAV industry, its development has accelerated significantly. UAVs have found extensive applications across multiple domains, including remote sensing mapping, environmental monitoring, and logistics transportation, and the sector holds promising prospects for market expansion.
Many surveys suggest that the proliferation of consumer-grade UAV products presents dual challenges [1,2]. On one hand, non-professionals without specialized training can easily acquire and operate UAVs. Lacking safety awareness and legal knowledge, they may unintentionally engage in de facto illegal flight operations, creating substantial security risks. On the other hand, malicious actors can readily obtain, utilize, or even modify UAVs for unlawful activities. Notable examples include cross-border smuggling via UAVs, deploying UAV-mounted high-resolution cameras to surveil military vessels, and disrupting airport operations through unauthorized UAV flights that interfere with aircraft takeoffs and landings.
Facing the security challenges posed by UAV “illegal flights”, the demand for UAV regulation continues to grow. In response, the Chinese government has recently implemented multiple UAV regulatory policies and laws. Developing intelligent and efficient counter-UAV technologies has become imperative [3].
UAV recognition technologies primarily include radar detection [4], radio frequency signal [5,6], control signal recognition [7,8], video/image recognition [9], infrared imaging [10], remote sensing image [11], and acoustic recognition, with some researchers achieving UAV detection through multi-sensor data fusion techniques [12]. This article focuses on acoustic identification technology. Existing research on UAV sound recognition algorithms involves two aspects: acoustic feature extraction algorithms, and audio feature classification and recognition models [13].
In current UAV sound processing research, four acoustic feature extraction algorithms are commonly used: MFCC, Gammatone Frequency Cepstral Coefficients (GFCC), Linear Predictive Cepstral Coefficients (LPCC), and Short-Time Fourier Transform (STFT). The first three algorithms adopt nonlinear frequency perception features of human auditory systems in their filter bank frequency band distributions, typically applied in speech recognition, while STFT features describe full-band spectral components of sound signals over time but the overall data volume is huge. Many scholars have contributed to the study of different methods. Anwar et al. used MFCC and LPCC features with a multi-kernel Support Vector Machine (SVM) for sound classification [14]. Jiao et al. fused MFCC and STFT features for UAV flight posture recognition via an ADS-CNN model [15]. Lee et al. used a sensor fusion approach combining visual, radar, and acoustic data with polynomial logistic regression-CNN integration [16], Liu et al. investigated UAV sound propagation characteristics using low-frequency acoustic sensors and sparse Mayer filters with deep residual networks [17]. Li et al. used a neural network architecture incorporating global-local attention mechanisms for raw audio processing [18]. Uddin et al. proposed an efficient un-supervise machine learning approach of independent component analysis (ICA) to detect UAVs in a practical scenario [19]. Wang et al. proposed an acoustic UAV detection method based on blind source separation (BSS) framework to solve the UAV sound detection problem with multi-source interference [20].
Most existing studies focus on short-range UAV audio data for detection and model identification, predominantly through complex modifications of deep neural networks. In this research, we recorded the UAV audio data of medium-distance flight in the environment of normal level noise as the dataset. We studied the limitations of the traditional MFCC method on the frequency distribution. The mel-filter bank was innovatively replaced with a frequency band filter bank. The comparative experiments verified that the proposed method has advantages in the recognition of UAV sounds. A CNN with a small model was used for feature recognition, which has low requirements for computing power and can be deployed on more devices.

2. Method and Model Establishment

In order to achieve the UAV sound recognition, it is necessary to model and analyze the sounds and recognition methods. This chapter mainly describes a modeling study on the theories and methods utilized in the research. Firstly, we studied the propagation and collection of sound by modeling and analysis, and the data form for collection and the parameters used for collection are clarified. Secondly, by analyzing the classical MFCC feature extraction model, we discovered the mismatch between the classical method and the UAV sound frequency band. We also propose the frequency band feature extraction method. Finally, through CNN model analysis, we establish a two-dimensional (2-D) CNN recognition model to recognize the 2-D features of UAVs.

2.1. Sound Field Model of UAV Sound Signal

The acoustic signals of UAVs are typically generated by friction between their motors, propellers, and air. As the motor drives the propeller to rotate at a relatively fixed frequency, the directly produced signal is the fundamental frequency signal. Nonlinear vibrations of the propeller combined with aerodynamic effects generate harmonic signals at integer multiples of the fundamental frequency. Thus, UAV acoustic signals are a superposition of the fundamental frequency signal and harmonic signals.
In a complex practical environment, the sound signal of the UAV propagates in space simultaneously with various other sound source signals. Assume that the source sound signal is s i ( t ) , where i represents the serial number of different sound sources, and environmental noise can also be regarded as the source sound signal. s i ( t ) is a continuous analog signal. The source sound signal reaches different sound sensors after intensity attenuation through different paths and different distances in space. Let x i ( t ) be the acoustic analog signal received at the microphone. Then it can be expressed as Equation (1).
x i ( t ) = j a j ( i ) s j ( t )
where a j ( i ) denotes the equivalent attenuation weight of the j-th source signal arriving at the i-th microphone. This model can be simplified using the matrix Equation (2).
X ( t ) = A S ( t )
where matrix A consists of the attenuation weights, S = [ s 1 , s 2 , , s n ] T , and X = x 1 , x 2 , , x m T . In practice, microphones introduce minor Gaussian white noise due to their electrical characteristics and output discrete digital signals:
X ( k ) = X ( t ) t = k + X n o i s e
According to the Nyquist sampling theorem, to prevent aliasing-induced distortion, the sampling frequency f s must satisfy
f s 2 f m a x
Here, f m a x represents the maximum frequency of UAV sounds. Smaller propellers generate higher fundamental frequencies and harmonic components, with typical small UAVs having maximum harmonic frequencies below 16 kHz. Consequently, the minimum required sampling frequency is 32 kHz. In our experiments, a 48 kHz sampling rate was adopted. Exceeding the Nyquist frequency provides denser sampling points, reducing reconstruction errors by better approximating the original analog signal.

2.2. Frequency Band Feature Extraction Method of UAV Sound

The frequency band feature extraction methods of UAV mainly include sound signal pre-processing, framing, and windowing, as well as Fourier transform, frequency domain conversion, frequency domain filter bank processing, and cepstral domain conversion. The feature vectors of consecutive frames are combined with 2-D sound features. The overall process of the feature extraction method is shown in Figure 1.

2.2.1. Pre-Processing of Sound Signal

Typically, UAV sounds propagating through air experience distance dependent energy attenuation, with different frequency components decaying unevenly. High-frequency components attenuate more severely over distance compared to low-frequency components. To better compensate for high-frequency attenuation losses, pre-emphasis (Equation (5)) is applied. It is worth noting that we do not use a microphone array, so x ( n ) = X ( k ) , k = n .
y ( n ) = x ( n ) a x ( n 1 )
where x represents the original input sound signal, y denotes the pre-emphasized signal, and a is the pre-emphasis coefficient, usually a = 0.97 .

2.2.2. Short Time Fourier Transform of Sound Signal

Continuous audio signals are long signals with inconsistent sampling lengths and large data volumes. A common approach involves framing-dividing long-duration signals into shorter segments for short-term analysis, typically implemented through the STFT. It is generally believed that the sound signal is non-stationary, but it can be considered stable in a short period of time. Therefore, the sound can be divided into several short-time signals by frame operation. This article set the frame length to 25 ms and the frame shift to 10 m so that there is a smooth transition between frames.
After the signal is divided into frames, it is necessary to further window the frame signal, The window function can smoothly process the edge of the frame, reduce the discontinuity between frames, and avoid spectrum leakage. In this paper, the Hamming window is used to window the frame signal, which can effectively suppress the sidelobe frequency of spectrum leakage with slightly lower frequency resolution. The formula for the Hamming window is Equation (6).
w ( n ) = 0.54 0.46 cos 2 π n N 1 , n = 0 , 1 , 2 , , N 1
Here, N denotes the window length in samples, and n represents the sample index. After framing and windowing, each frame undergoes Fourier transformation to convert time-domain signals to frequency-domain representations using Equation (7).
x s t f t ( k ) = n = 0 N 1 x ( n ) · e j 2 π N k n , k = 0 , 1 , 2 , , N 1
Here, x ( n ) = w ( n ) · y ( n ) denotes the windowed short-term signal, k is the frequency domain sampling point, j is the imaginary unit, and x s t f t ( k ) is the output of the Fourier transform for a single-frame signal. Combining the frame sequence, x s t f t ( k , t ) is the STFT of signal y ( n ) .

2.2.3. Frequency Band Feature Extraction Algorithm

Frequency band feature extraction is an improved method derived from MFCC for UAV acoustic applications. When using MFCC for feature extraction, the Mel filter bank employs a nonlinear distribution of center frequencies, densely spaced at lower frequencies and sparsely at higher frequencies. Because the Mel scale is designed to simulate the nonlinear perception of sound by the human ear, it is more sensitive to the perception of human voice, and the frequency of human voice is generally 65–1100 Hz.
Under a sampling frequency of 48 kHz , the Mel filter bank exhibits the highest density below 1000 Hz, a moderate density between 1000 Hz and 2000 Hz , and a sparse distribution above 2000 Hz . However, experimental analysis reveals that UAV acoustic signatures span a broader frequency range, with harmonic components extending from a fundamental frequency of approximately 200 Hz up to 6000 Hz , and even reaching 12,000 Hz for smaller propellers.
The core components of the Mel filter bank include the center frequency distribution of the filter bank and the filter functions. The nonlinear function governing the center frequency distribution is the Mel scale transformation function: Equation (8).
f m e l = 2595 log 10 1 + f h z 700
Here f h z is the Hertz scale frequency, and f m e l is the Mel scale frequency.
The center frequencies of the filter bank are computed by uniformly distributing the required number of filters on the Mel scale and subsequently converting these points back to the Hertz scale via the inverse transformation. The mathematical formula is expressed as Equation (9).
f m e l f c n = n N + 1 f m e l f L + f m e l f H
where f L and f H define the frequency range, N is the number of filters, and f c represents the center frequency function of the filter bank.
Based on analysis of UAV frequency distributions and Mel filter bank characteristics, a critical improvement to the feature extraction algorithm lies in replacing the speech-optimized Mel filter bank with a filter bank better suited for UAV acoustic bands.
First, we define a piecewise linear function as Equation (10).
f u f b ( x ) = w 0 ( x x 0 ) + f 0 , x 0 x x 1 w 1 ( x x 1 ) + f 1 , x 1 < x x 2 w 2 ( x x 2 ) + f 2 , x 2 < x x 3 w 3 ( x x 3 ) + f 3 , x 3 < x x 4 w 4 ( x x 4 ) + f 4 , x 4 < x x 5
where x i represents the frequency points of each frequency band, and the slope of each linear part w i represents the filter density weight of the frequency segment where the function is located. The restriction formula must be met to maintain the continuity and reversibility of the function.
f 0 = 0 f i = f u f b ( x i ) , i = 1 , 2 , 3 , 4 w i 0 , i = 0 , 1 , 2 , 3 , 4
According to frequency band distribution of UAV sounds, minimal slope weights are applied in frequency bands below the motor’s fundamental frequency to further suppress low-frequency noise. In frequency bands above the fundamental frequency, distinct slope weights are assigned according to UAV sound spectral density. Similarly, in frequency bands exceeding the maximum harmonic frequency, reduced slopes are implemented to attenuate high-frequency noise. The specific slope weights and corresponding frequency band partitions are detailed in Table 1.
Finally, the piecewise function undergoes normalization to ensure data consistency, where the original slopes explicitly reflect density weighting. Using the normalized frequency transformation function, uniformly spaced frequency points are generated on the transformed scale and then converted back to Hertz scale frequencies using the inverse function to determine the center frequencies of the filter bank. The calculation formula for the center frequency is Equation (12).
f u f b f c n = n N + 1 f u f b f L + f u f b f H
where f L and f H define the frequency range, N is the number of filters, and f c denotes the center frequency function of the filter bank.
After calculating the center frequency of the filter bank, the equal-high frequency band filter bank is obtained using Equation (13).
H n ( k ) = 0 k < f ( n 1 ) k f ( n 1 ) f ( n ) f ( n 1 ) f ( n 1 ) k < f ( n ) 1 k = f ( n ) f ( n + 1 ) k f ( n + 1 ) f ( n ) f ( n ) < k f ( n + 1 ) 0 k > f ( n + 1 )
where n represents the filter number, k represents the frequency point, and f ( n ) represents the above center frequency.

2.2.4. Cepstral Domain Analysis

After processing through the filter bank, the output signals exhibit high inter-band correlations due to the filter features, necessitating conversion from the frequency domain to the cepstral domain. First, the filter bank outputs are transformed into logarithmic energy spectra using Equation (14).
S ( n ) = ln k = 0 N 1 | x s t f t ( k , t ) | 2 H n ( k ) , 0 n M
where x s t f t ( k , t ) is the STFT output signal, H n ( k ) denotes the filter bank, M is the number of filters, and n is the index of the filters.
The logarithmic energy spectrum S ( n ) is then transformed by a discrete cosine transform to convert the signal from the frequency domain to the cepstral domain. The expression of the discrete cosine transform is Equation (15).
C k = 2 N · n = 0 N 1 S n cos ( n + 1 2 ) ( k + 1 2 ) π N , 0 < k < L + 1
Here, k indexes the cepstral coefficients, L specifies the feature dimension, and C ( k ) forms a feature vector for each short-term frame.
The sample size of each frame of the original signal after frame splitting is the same, and the feature vector with the feature number of 40 is obtained after the feature extraction algorithm. The feature vector corresponding to 301 consecutive frames is obtained by framing and feature extraction of the UAV sound for 3 s. All frames within 3 s are combined into a 2-D feature matrix of 301 × 40. The UAV sound features with time dimension are formed.

2.3. Convolutional Neural Network for Feature Recognition of UAV Sound

In this article, the CNN is used to identify and classify the sound features of UAVs.
CNN is a deep learning model and a multilayer perceptron analogous to artificial neural networks. The model training samples consist of various sound features with correctly labeled data tags. After completion of model training, hyperparameter tuning, and evaluation, the optimized acoustic model can be deployed for feature classification, recognition, and prediction. Typical CNN generally has four basic layers: a convolutional layer, an excitation layer, a pooling layer, and a fully connected layer.
The convolutional layer employs convolution kernels to operate as 2-D signal filters. In CNNs, the convolution kernels are not predefined but instead optimized through backpropagation during training. The mathematical expression for 2-D discrete convolution is Equation (16).
[ f g ] ( x , y ) = n = + m = + f ( m , n ) g ( x m , y n )
where the image data is abstracted as a 2-D discrete function f, and the kernel as g.
The mathematical formulation of a CNN convolutional layer is Equation (17).
Y ( i , j , L ) = n = 1 K h m = 1 K w G ( m , n , L ) X p ( i 1 ) S x + 1 + m , ( j 1 ) S y + 1 + n , L
Here, X p represents the padded input data. S x and S y denote the convolution strides along the x and y axes, respectively. L accounts for additional dimensions (e.g., channels), while K h and K w specify the height and width of the convolution kernel.
In CNN, the output dimensions can be calculated based on the input feature map size, kernel dimensions, padding amount, and stride values. The precise computational formulas are Equation (18).
H o = ( H p K h + 2 P ) / S x + 1 W o = ( W p K w + 2 P ) / S y + 1
where H o and W o represent the height and width of the output dimensions, H p and W p are the height and width of the input, K h and K w are the kernel dimensions, P is the padding size, and S x and S y are the strides along the x and y axes.
The activation layer employs the ReLU function to introduce nonlinear mappings, enabling the network to learn and represent complex data patterns. This prevents multiple linear layers from collapsing into an equivalent single-layer system, which would severely limit model capability. Thus, an activation layer typically follows each convolutional layer. The ReLU function used in this study is defined as Equation (19).
f ( x ) = max ( 0 , x )
ReLU is currently the most widely adopted activation function, essentially a max operation that is non-differentiable across its entire domain. It addresses the vanishing gradient problem in the positive interval and excels in computational efficiency.
For a given activation layer with function f ( x ) , the output is computed as Equation (20).
Y a c t ( i , j , L ) = f ( Y ( i , j , L ) )
where Y represents the convolutional layer output, and Y a c t denotes the activated output.
Regarding the pooling layer, given an input feature map, pooling operations partition it into sub-regions and apply aggregation (e.g., maximum or average values) to each sub-region. This process can be conceptualized as sliding a window over the input feature map, where the window selects either the maximum or average value within its coverage to generate a new feature map. Pooling significantly reduces spatial dimensions, thereby decreasing computational load, improving efficiency, and mitigating overfitting. The mathematical formulation for max pooling is Equation (21).
Y p o o l ( i , j , L ) = max i P s n = ( i 1 ) P s + 1 max j P s m = ( j 1 ) P s + 1 X ( m , n , L )
A fully connected layer converts the 2-D data from convolutional and pooling operations into one-dimensional data through fully connected mappings using weighted connections, akin to traditional neural network architectures. After flattening the data into a 1D vector via a flatten layer, it serves as input to subsequent hidden layers, ultimately producing the desired output. The mathematical formulation of this traditional neuron connection is Equation (22).
Y l ( k ) = i w k ( i ) X ( i ) + b k ( i ) Y a c t ( k ) = f Y l ( k )
where w k and b k are the weight vector and bias vector for the k-th neuron in the current layer, Y l represents the linear output, f ( x ) denotes the activation function, and Y a c t is the activated output.
f ( x ) = e x i i e x i
This article builds a CNN model to classify and recognition UAV sound features. The network hierarchy of the model is shown in Table 2.

3. Experiment and Analysis

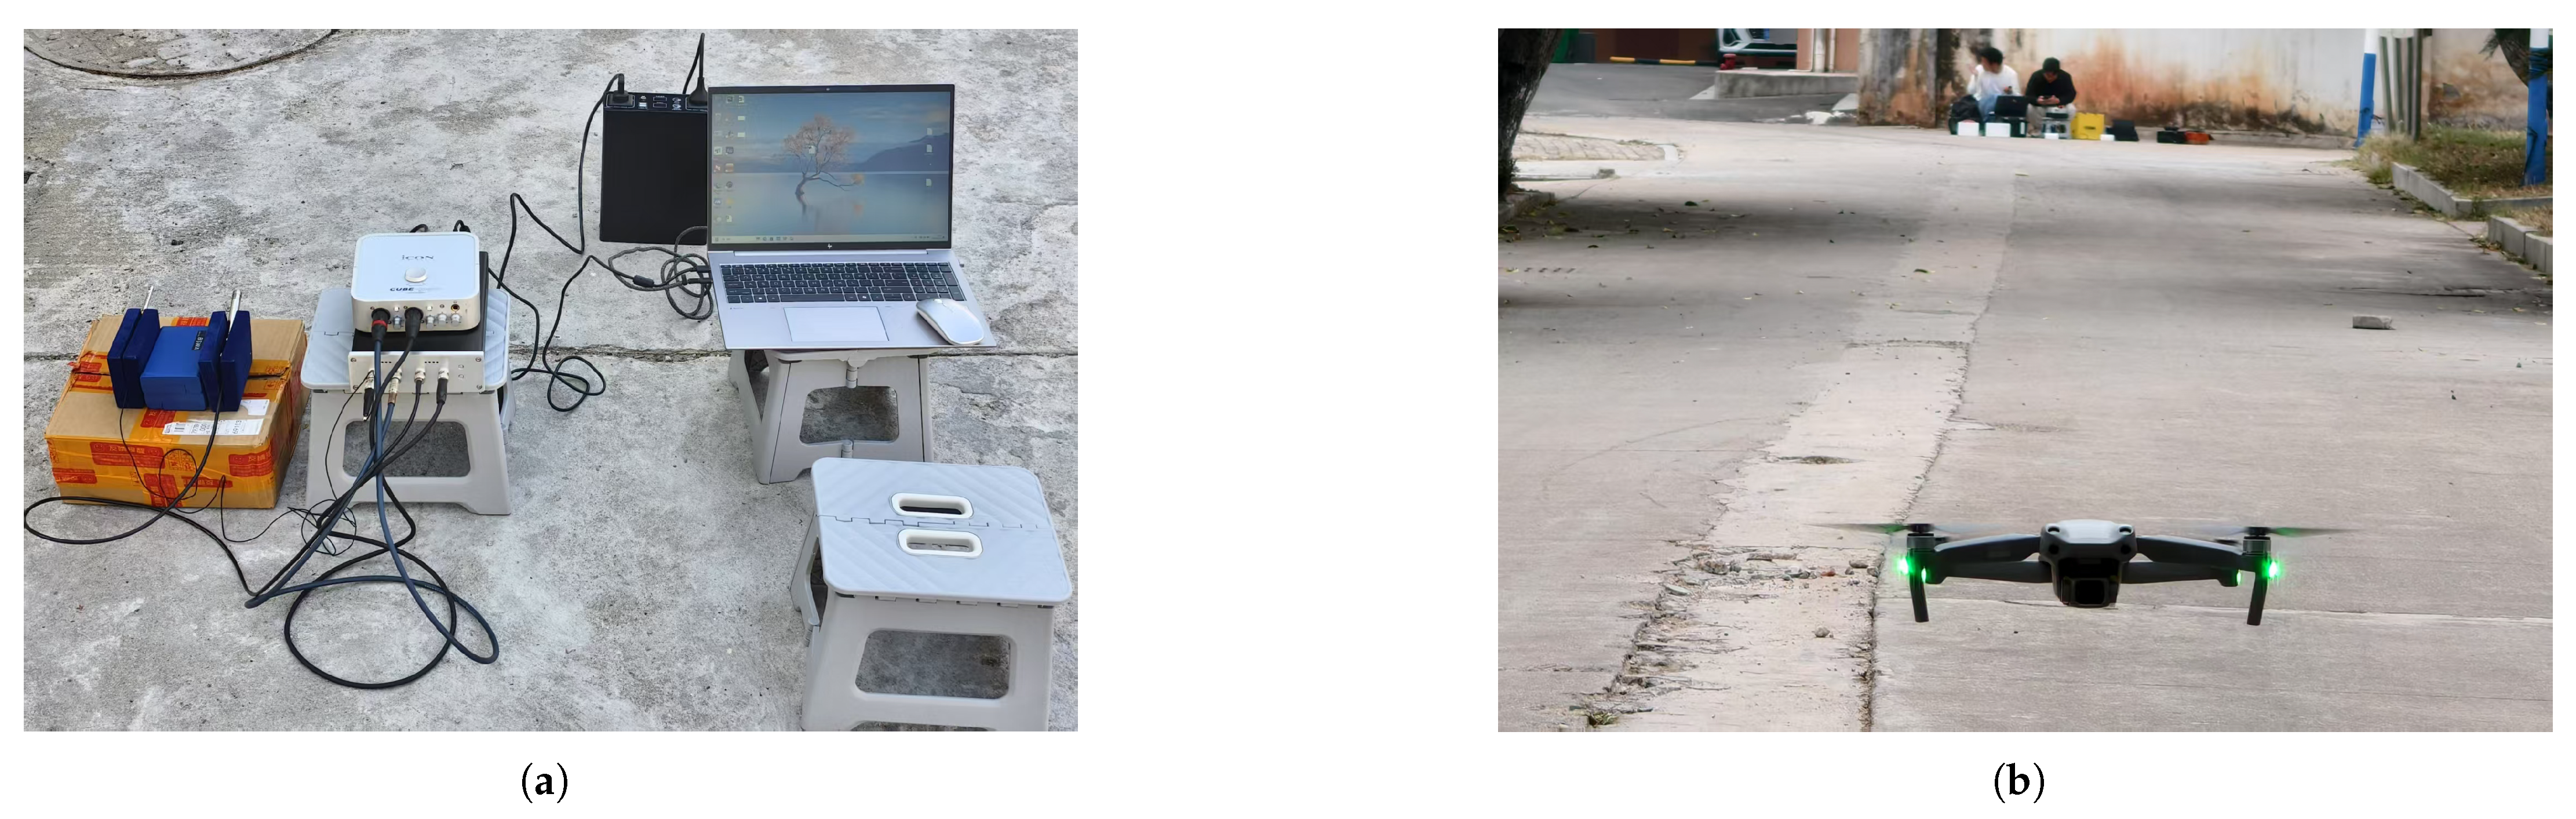
3.1. Experimental Data Collection

Experimental data collection was carried out using experimental equipment at multiple experimental sites. This paper designed three experiments in different scenarios: between trees, on the roadside, and indoors, as shown in Figure 2. These three scenes have different environmental noise or interference, bird calls, car honking, and multi-path propagation interference. The experimental site and equipment are shown in Figure 3.
A total of approximately 10,000 s of audio data was collected, encompassing various UAV sounds and environmental noise. The data specifications are as follows: a sampling rate of 48,000 Hz, a bit depth of 16-bit, and acquisition via the LM1111 acoustic sensor. The sound sources include multiple UAV models from the laboratory: DJI Phantom 4 Pro V2.0, DJI AIR 2S, and DJI Spark. All recordings are labeled with corresponding distance metadata.
For the DJI Phantom 4 Pro V2.0, audio data includes hovering at medium-to-long distances of 40, 50, 60, and 70 m, as well as hovering at long distances of 100, 110, and 120 m. The DJI AIR 2S dataset comprises hovering recordings at 1 m intervals from 5 to 20 m and additional recordings at 10 m intervals from 40 to 100 m. The DJI Spark data includes hovering sounds at distances ranging from 30 to 70 m. The volume of UAV sound data recorded in the experiment is shown in Table 3.
The waveform and spectrogram plots for the three UAVs are shown in Figure 4. The three upper plots (a,b,c) represent the acoustic waveforms of hovering flight sounds from different UAVs, while the three lower plots (d,e,f) display the corresponding spectrogram plots of the signals. The left plots (a,d) correspond to the DJI Air2S UAV, the center plots (b,e) to the DJI Spark UAV, and the right plots (c,f) to the DJI Phantom4 Pro UAV.

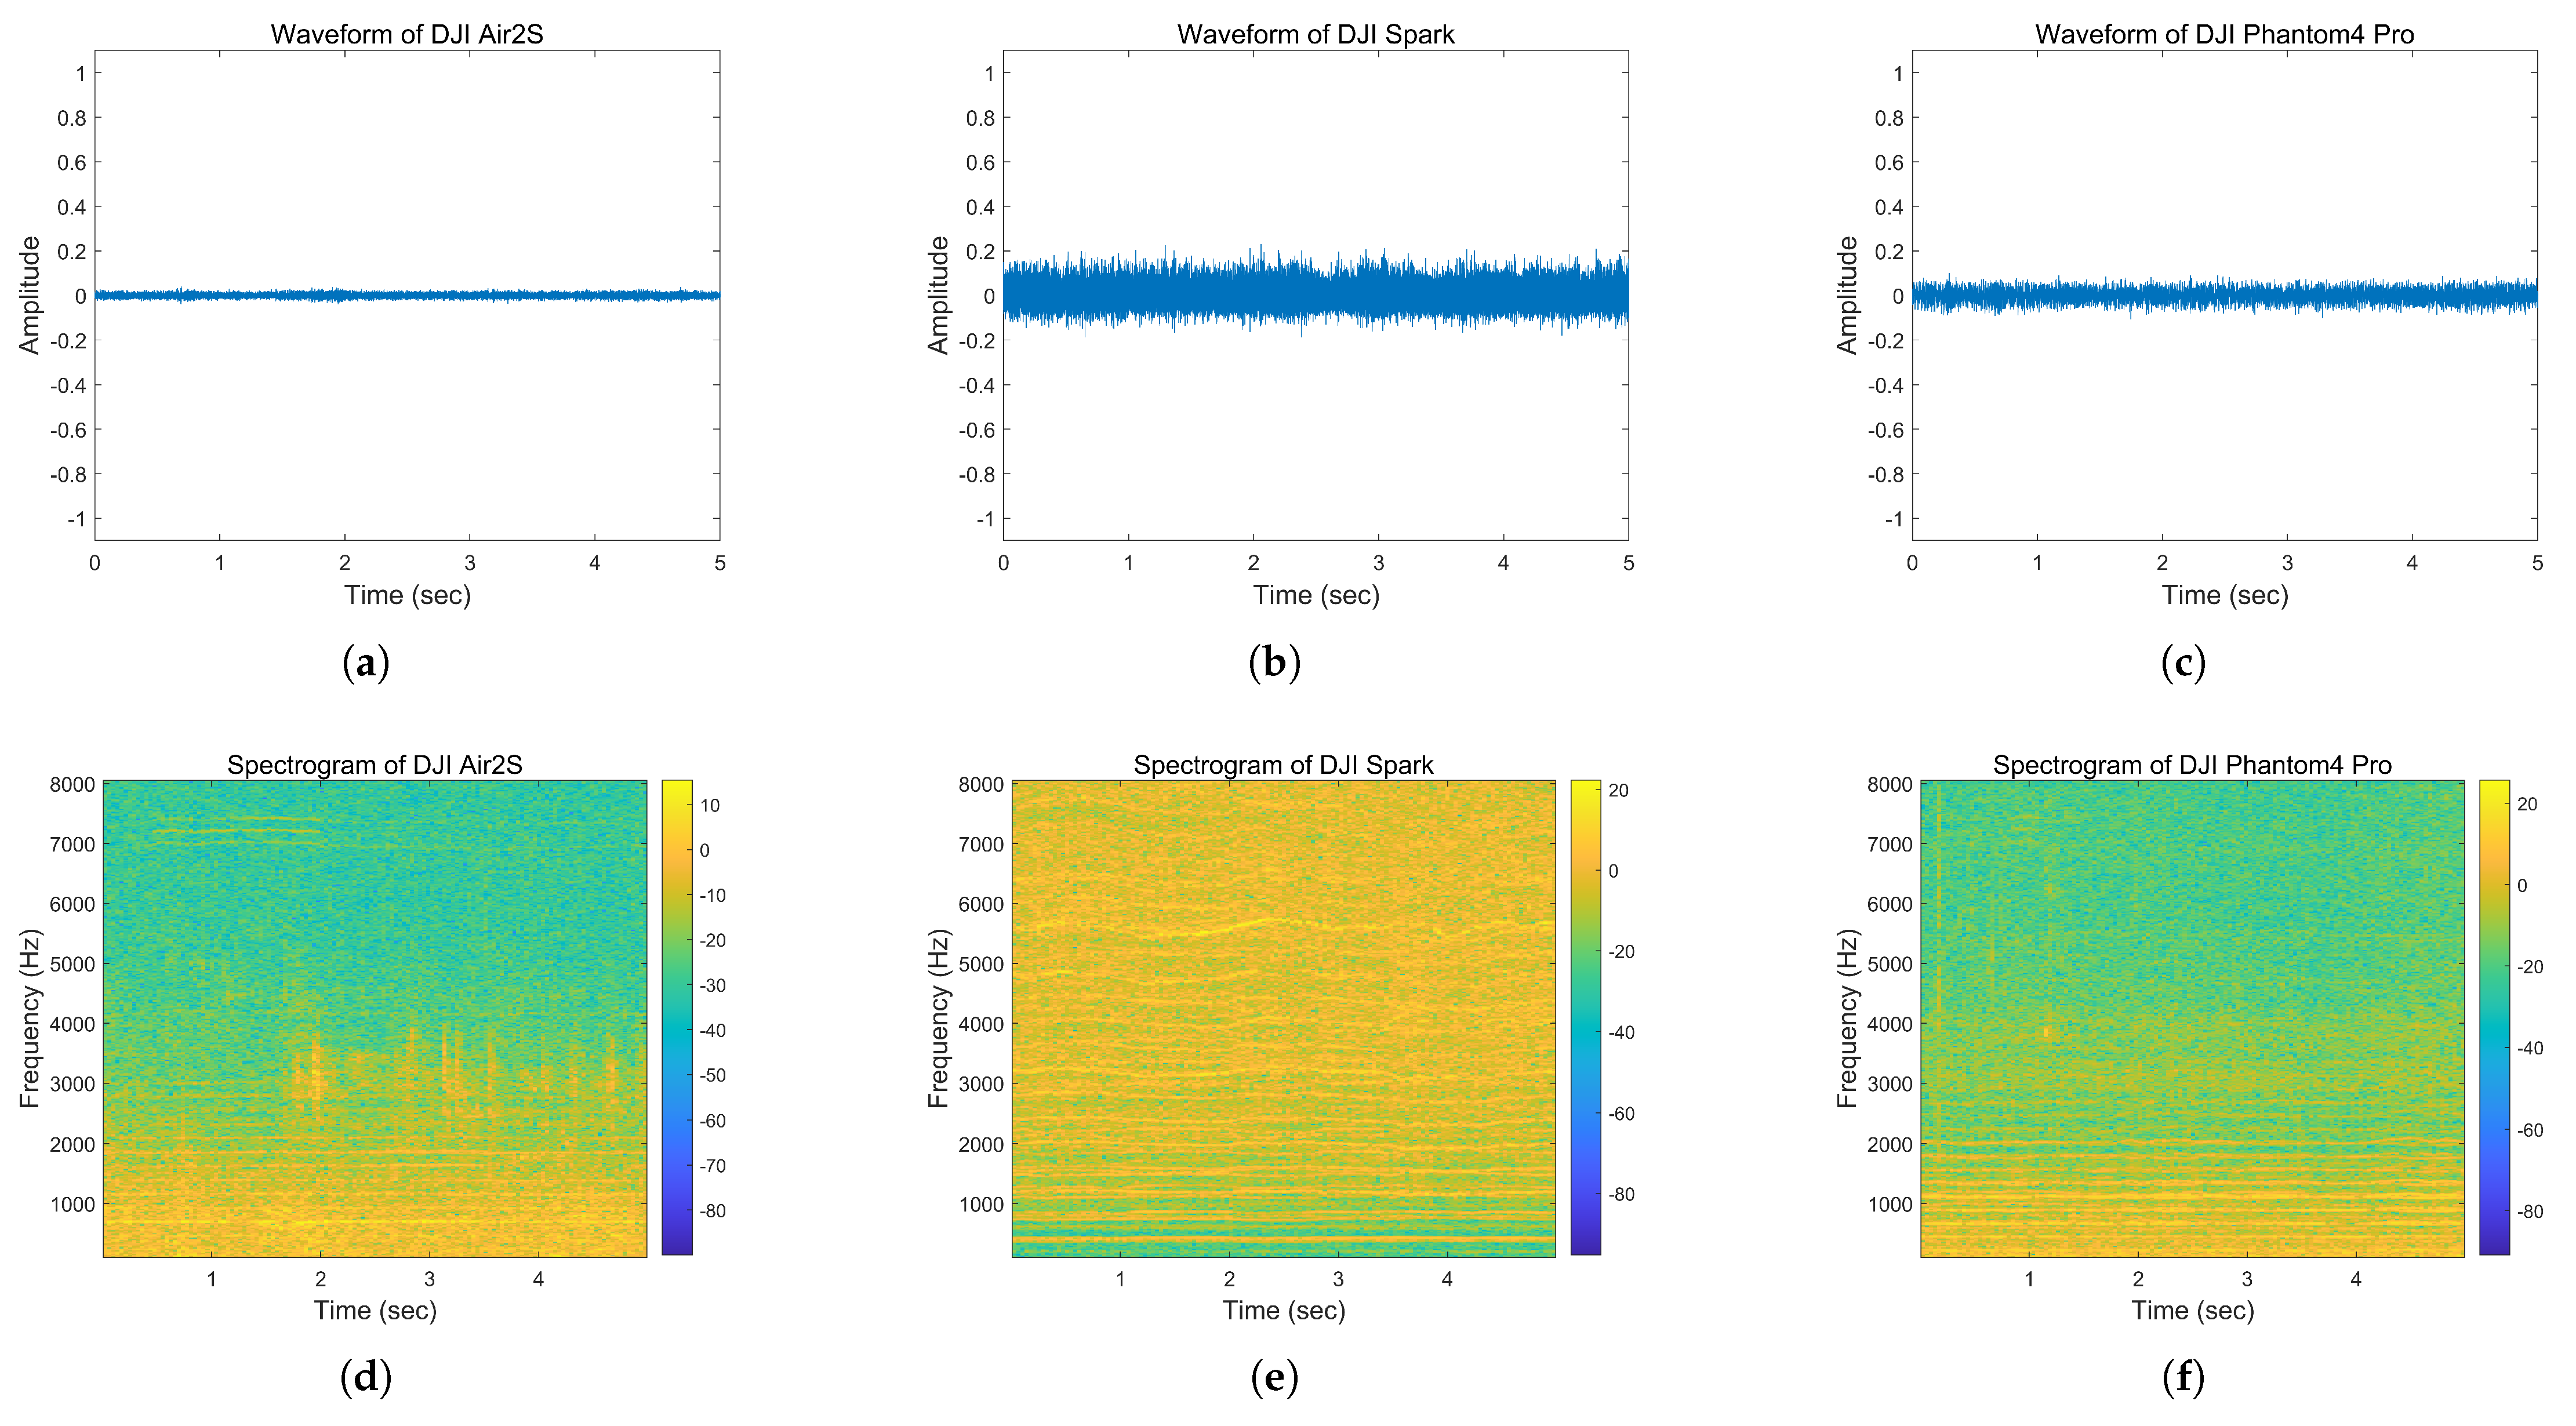
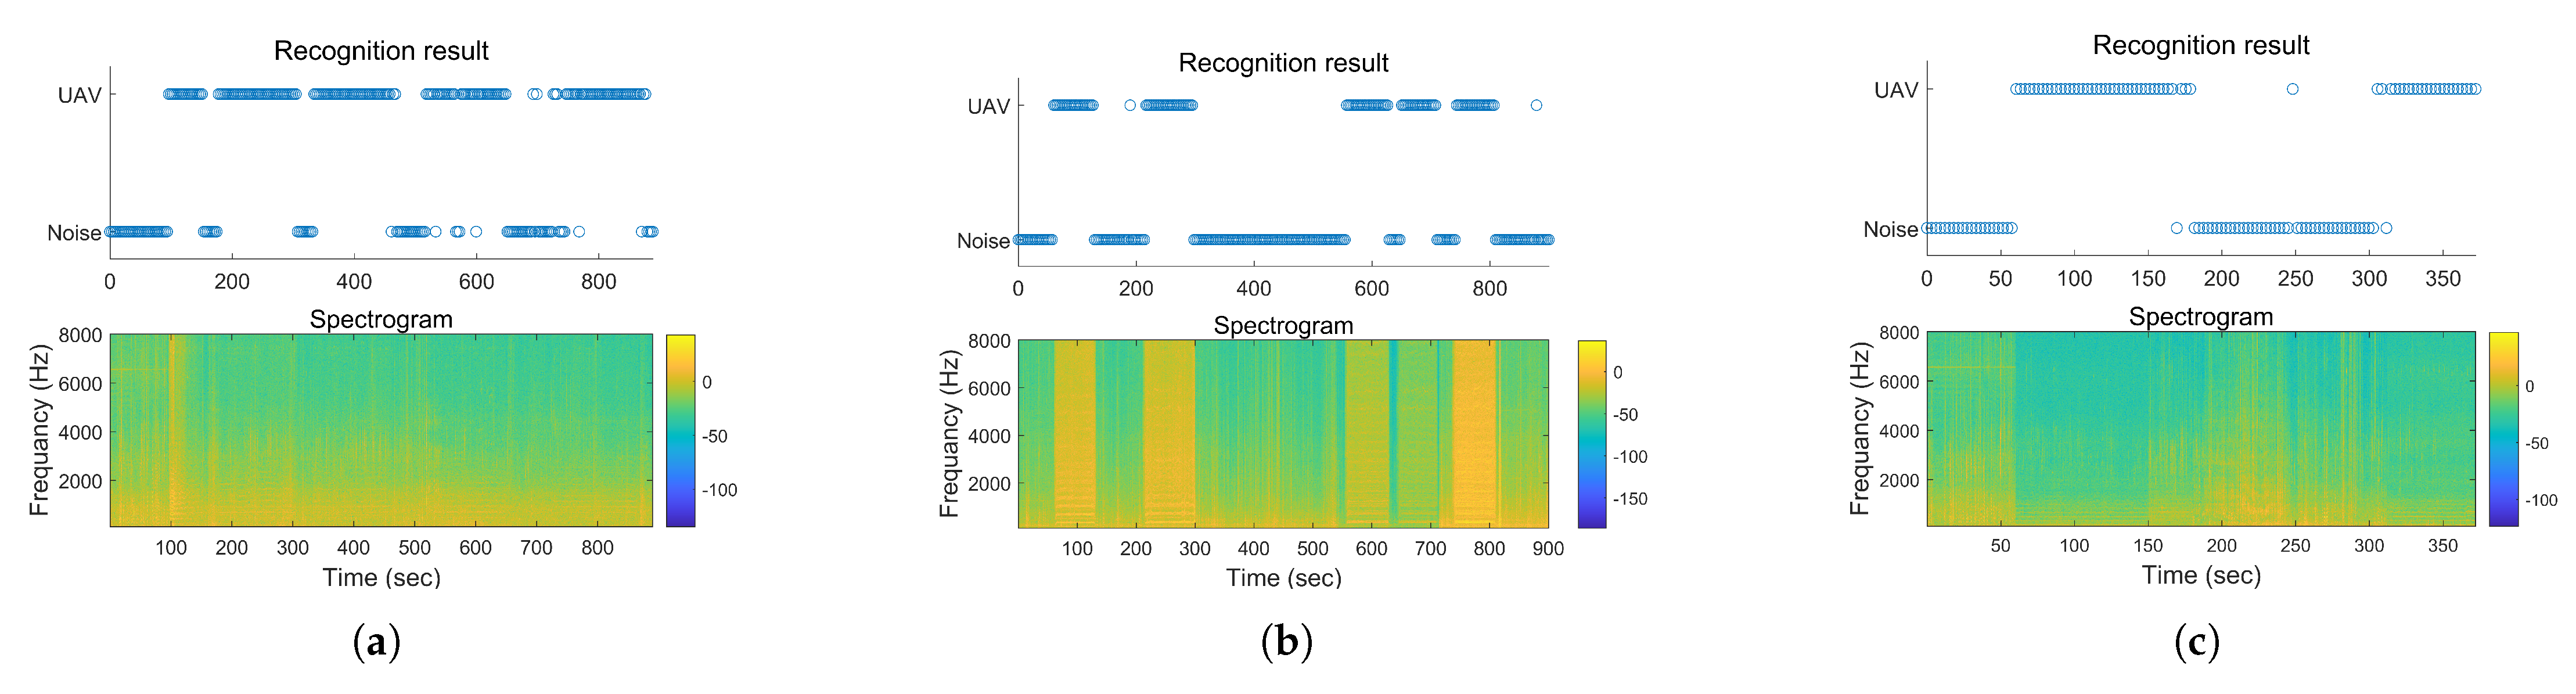
3.2. Experimental Data Analysis

In the experimental part, this paper uses the above three kinds of experimental UAV audio, which is divided into 3 s segments to preserve the time continuity of the UAV spectrum. The frequency band feature extraction method, the GFCC feature extraction method, and the MFCC feature extraction method were used to extract the UAV sound, and the UAV sound feature dataset was composed, respectively. The sample number of sound features and noise features of each UAV in the dataset is shown in the column “Feature Samples” of Table 3.
The feature datasets of two different feature extraction methods were combined with the CNN model of the same structure to carry out the network training of UAV sound feature recognition. The dataset was randomly divided into training set, verification set and test set according to the ratio of 6:2:2. The training set and validation set are used for model training and small batch validation. The test set is used to evaluate the recognition effect of the model. The experimental results are shown in Table 4, in which ufbf represents the UAV Frequency Band Feature.
It can be seen from Table 4 that the training results using the three features show high accuracy, precision, and recall in the test set, and the UAV frequency band feature has slightly higher accuracy than the MFCC feature and GFCC feature in the recognition models of the three UAV sounds.
Since the sounds in the dataset have similar recording environment and ambient background noise, the flight environment of the same audio is the same, and the test set is randomly selected from the dataset, it may have correlation with the feature data participating in the training, thus affecting the accuracy. After completion of the network training, the continuous audio of three types of UAV flying randomly respectively is used to carry out feature extraction and data labeling using the same method as that used to make the feature dataset. The generalization of the training results is tested using this audio. The results of the recognition effect are shown in Figure 5.
Figure 5 represents the prediction results of the model and the spectrogram plot corresponding to the predicted audio. The recognition effects of the three UAV sounds in three types of feature are shown in Table 5.
According to Table 5. The CNN recognition effect using frequency band feature method, the sound recognition accuracy of DJI Air2s was 91.2%, the sound recognition accuracy of DJI spark was 94.7%, and the sound recognition accuracy of the DJI Phantom4 Pro reached 96.8%.
By comparing the frequency band feature method with the MFCC feature method on the recognition rates of different types of UAV sound. Using the proposed method, the DJI Air2S recognition accuracy is improved by 1.7%, the DJI Spark recognition accuracy is improved by 2.0%, and the DJI Phantom4 Pro recognition accuracy is improved by 12.1%. By comparing the frequency band feature method with the GFCC feature method, the DJI Air2S recognition accuracy is improved by 5.1%, the DJI Spark recognition accuracy is improved by 7.0%, and the DJI Phantom4 Pro recognition accuracy is improved by 5.1%.

4. Discussion

In the previous text, the article analyzed the main methods in the current field of UAV sound recognition. Through research, the frequency band feature extraction method was proposed, and the improvement of the recognition rate of the proposed method was verified through comparative experiments with the classical MFCC methods. However, this study still has certain limitations.
(1) Due to the limitations of the experimental conditions, only three types of UAV were used for the experiments in this article. This limits the universal verification of the proposed method on other types of UAV, and restricts the optimization and parameter iteration of the proposed method. The limitation of training data also leads to an imbalance of training samples.
(2) The weight of the function f u f b in the method is based on experience, which also brings about some limitations.
(3) The research does not take into account the situation of strong noise interference. Strong noise will cover most of the frequency bands where the UAV sound is located, thereby causing the audio to lose the feature of the UAV. As a result, the sound features of the UAV cannot be correctly extracted, and recognition cannot be carried out. This is the limitation of the feature extraction method based on the frequency distribution of UAV sounds.

5. Conclusions

To address the demand for UAV detection and recognition in anti-UAV technology, microphones were used as sensors to collect UAV sounds in the environment for the recognition of UAV sounds. A novel frequency band feature extraction method, which defines a UAV-specific filter bank using a new frequency scaling function, is proposed. This method extracts UAV acoustic feature vectors by segmenting continuous 3 s audio data into frames, extracting features from each frame, and assembling them into a 2-D feature matrix. A CNN was used for UAV sound recognition. Experimental results demonstrate that the proposed frequency band feature extraction method effectively captures features from various types of UAVs at varying distances and improves recognition accuracy. Future research on the recognition of UAV sounds may include the following:
(1) Experiments can be conducted using more types of UAV to verify the universality of the proposed method. More sounds can be collected to ensure the balance of training samples. Experiments can include more data as well as optimize the weight parameters, sample segmentation parameters, and framing parameters in the method.
(2) By applying sound signal filtering algorithms or using microphone arrays for sound source separation and enhancement, the sound is processed [21,22,23]. Combined with feature extraction algorithms, recognition is achieved in environments with strong noise interference, forming a more complete and unified system.
(3) By utilizing wireless communication technology to connect multiple devices [24,25,26,27]. Information such as sound, image, and radar can be integrated for information fusion. The identification, location, tracking, and countermeasures of the UAV can be determined.

Author Contributions

Conceptualization, J.Z. and K.F.; methodology, J.Z. and W.P.; software, J.Z. and A.F.; validation, K.F., W.P., A.F. and L.Z.; writing—original draft preparation, J.Z. and A.F.; writing—review and editing, J.Z., K.F., L.Z. and A.F.; funding acquisition, K.F. All authors have read and agreed to the published version of the manuscript.

Funding

This work was supported by the National Natural Science Foundation of China (No.62363014, No.61763018), the Program of Qingjiang Excellent Young Talents in Jiangxi University of Science and Technology (JXUSTQJBJ2019004), and the Key Plan Project of Science and Technology of Ganzhou (GZ2024ZDZ008).

Data Availability Statement

Data are available upon request.

Conflicts of Interest

The authors declare that there are no conflicts of interest.

References

  1. Rahman, M.H.; Abrar, M.; Aziz, M.A.; Tabassum, R.; Baik, J.I.; Song, H.K. A Comprehensive Survey of Unmanned Aerial Vehicles Detection and Classification Using Machine Learning Approach: Challenges, Solutions, and Future Directions. Remote Sens. 2024, 16, 879. [Google Scholar] [CrossRef]
  2. Shi, X.; Yang, C.; Xie, W.; Liang, C.; Shi, Z.; Chen, J. Anti-Drone System with Multiple Surveillance Technologies: Architecture, Implementation, and Challenges. IEEE Commun. Mag. 2018, 56, 68–74. [Google Scholar] [CrossRef]
  3. Sherman, M.; Shao, S.; Sun, X.; Zheng, J. Counter UAV Swarms: Challenges, Considerations, and Future Directions in UAV Warfare. IEEE Wirel. Commun. 2024, 32, 190–196. [Google Scholar] [CrossRef]
  4. Wang, C.; Tian, J.; Cao, J.; Wang, X. Deep Learning-Based UAV Detection in Pulse-Doppler Radar. IEEE Trans. Geosci. Remote Sens. 2022, 60, 5105612. [Google Scholar] [CrossRef]
  5. Cai, Z.; Wang, Y.; Jiang, Q.; Gui, G.; Sha, J. Toward Intelligent Lightweight and Efficient UAV Identification with RF Fingerprinting. IEEE Internet Things J. 2024, 11, 26329–26339. [Google Scholar] [CrossRef]
  6. Wang, Q.; Yang, P.; Yan, X.; Wu, H.C.; He, L. Radio Frequency-Based UAV Sensing Using Novel Hybrid Lightweight Learning Network. IEEE Sens. J. 2024, 24, 4841–4850. [Google Scholar] [CrossRef]
  7. Zhao, R.; Li, T.; Li, Y.; Ruan, Y.; Zhang, R. Anchor-Free Multi-UAV Detection and Classification Using Spectrogram. IEEE Internet Things J. 2023, 11, 5259–5272. [Google Scholar] [CrossRef]
  8. Xie, Y.L.; Jiang, P.; Xiao, X. Grouping Parallel Detection Method of UAV Based on Multi Features of Image Transmission Signal. Radioengineering 2021, 30, 556–568. [Google Scholar] [CrossRef]
  9. Li, R.; Wang, Q.; Wang, S.; Mao, J.; Zhang, Z.; Cui, X. CT-YoloTrad: Fast and accurate recognition of point-distributed coded targets for UAV images incorporating CT-YOLOv7. Phys. Scr. 2024, 99, 085032. [Google Scholar] [CrossRef]
  10. Zhou, G.; Liu, X.; Bi, H. Recognition of UAVs in Infrared Images Based on YOLOv8. IEEE Access 2025, 13, 1534–1545. [Google Scholar] [CrossRef]
  11. Guo, L.; Yang, R.; Zhong, Z.; Zhang, R.; Zhang, B. Target recognition method of small UAV remote sensing image based on fuzzy clustering. Neural Comput. Appl. 2021, 34, 12299–12315. [Google Scholar] [CrossRef]
  12. Shi, Z.; Shi, G.; Zhang, J.; Wang, D.; Xu, T.; Ji, L.; Wu, Y. Design of UAV Flight State Recognition System for Multisensor Data Fusion. IEEE Sens. J. 2024, 24, 21386–21394. [Google Scholar] [CrossRef]
  13. Utebayeva, D.; Ilipbayeva, L.; Matson, E.T. Practical Study of Recurrent Neural Networks for Efficient Real-Time Drone Sound Detection: A Review. Drones 2022, 7, 26. [Google Scholar] [CrossRef]
  14. Anwar, M.Z.; Kaleem, Z.; Jamalipour, A. Machine Learning Inspired Sound-Based Amateur Drone Detection for Public Safety Applications. IEEE Trans. Veh. Technol. 2019, 68, 2526–2534. [Google Scholar] [CrossRef]
  15. Jiao, Q.; Wang, X.; Wang, L.; Bai, H. Audio features based ADS-CNN method for flight attitude recognition of quadrotor UAV. Appl. Acoust. 2023, 211, 109540. [Google Scholar] [CrossRef]
  16. Lee, H.; Han, S.; Byeon, J.I.; Han, S.; Myung, R.; Joung, J.; Choi, J. CNN-Based UAV Detection and Classification Using Sensor Fusion. IEEE Access 2023, 11, 68791–68808. [Google Scholar] [CrossRef]
  17. Liu, L.; Sun, B.; Li, J.; Ma, R.; Li, G.; Zhang, L. Time-Frequency Analysis and Recognition for UAVs Based on Acoustic Signals Collected by Low-Frequency Acoustic-Electric Sensor. IEEE Sens. J. 2024, 24, 19601–19613. [Google Scholar] [CrossRef]
  18. Li, J.; Zhao, J.; Ren, J.; Gao, X.; Li, Z. A multi-scale integrated learning model with attention mechanisms for UAV audio signal detection. Signal Image Video Process. 2025, 19, 344. [Google Scholar] [CrossRef]
  19. Uddin, Z.; Altaf, M.; Bilal, M.; Nkenyereye, L.; Bashir, A.K. Amateur Drones Detection: A machine learning approach utilizing the acoustic signals in the presence of strong interference. Comput. Commun. 2020, 154, 236–245. [Google Scholar] [CrossRef]
  20. Wang, W.; Fan, K.; Ouyang, Q.; Yuan, Y. Acoustic UAV detection method based on blind source separation framework. Appl. Acoust. 2022, 200, 109057. [Google Scholar] [CrossRef]
  21. Ferreira, A.E.; Alarcão, D. Real-time blind source separation system with applications to distant speech recognition. Appl. Acoust. 2016, 113, 170–184. [Google Scholar] [CrossRef]
  22. Zhou, J.; Bao, C.; Zhang, X.; Xiong, W.; Jia, M. Design of a robust MVDR beamforming method with Low-Latency by reconstructing covariance matrix for speech enhancement. Appl. Acoust. 2023, 211, 109464. [Google Scholar] [CrossRef]
  23. Liu, H.; Fan, K.; He, B.; Wang, W. Unmanned Aerial Vehicle Acoustic Localization Using Multilayer Perceptron. Appl. Artif. Intell. 2021, 35, 537–548. [Google Scholar] [CrossRef]
  24. Pawase, C.J.; Chang, K. 5G-NR Physical Layer-Based Solutions to Support High Mobility in 6G Non-Terrestrial Networks. Drones 2023, 7, 176. [Google Scholar] [CrossRef]
  25. Chen, B.; Ling, X.; Cao, W.; Wang, J.; Ding, Z. Analysis of Channel Uncertainty in Trusted Wireless Services via Repeated Interactions. IEEE J. Sel. Areas Commun. 2025, 1. [Google Scholar] [CrossRef]
  26. Ling, X.; Le, Y.; Chen, S.; Wang, J.; Zhou, X. Blockchain-Enabled Decentralized Services and Networks: Assessing Roles and Impacts. IEEE J. Sel. Areas Commun. 2025, 1. [Google Scholar] [CrossRef]
  27. Ling, X.; Le, Y.; Wang, J.; Huang, Y.; You, X. Trust and Trustworthiness in Information and Communications Technologies. IEEE Wirel. Commun. 2025, 32, 84–92. [Google Scholar] [CrossRef]
Figure 1. Flowchart of frequency band feature extraction.
Drones 09 00351 g001
Figure 2. Experimental places: (a) Between trees, (b) Roadside, (c) Indoors.
Drones 09 00351 g002
Figure 3. Experimental equipment: (a) Sound recording equipment (b) Flying UAV.
Drones 09 00351 g003
Figure 4. Hovering flight sound waveform and spectrogram of UAVs. (a) Sound waveform of DJI Air2S. (b) Sound waveform of DJI Spark. (c) Sound waveform of DJI Phantom4 Pro. (d) Sound spectrogram of DJI Air2S. (e) Sound spectrogram of DJI Spark. (f) Sound spectrogram of DJI Phantom4 Pro.
Drones 09 00351 g004
Figure 5. Results of the recognition effect of the ufbf model on UAVs sound: (a) DJI Air2S, (b) DJI Spark, (c) DJI Phantom4 Pro.
Drones 09 00351 g005
Table 1. Frequency band distribution and weight.
Index of
band
Frequency Band (Hz)
x i x i + 1
Weight
w i
0[0, 100]0.1
1(100, 3000]4
2(3000, 6000]2
3(6000, 12,000]1
4(12,000, 24,000]0.15
Table 2. CNN structure.
Layer LevelLayer NameLayer Type
1input2-D data input layer
2conv12-D data convolutional layer
3bn1Batch normalization layer
4relu1Activation layer
5maxpool12-D data max pooling layer
6conv22-D data convolutional layer
7bn2Batch normalization layer
8relu2Activation layer
9fc1Full connected layer
10relu3Activation layer
11fc2Full connected layer
12softmaxSoftmax function
13classificationOutput of classification
Table 3. UAV audio data volume.
Sound TypeSample Volume (s)Distance (m)Feature Samples
DJI AIR 2S11675–20, 40–100389
DJI Spark100230–70334
DJI Phantom459170–120197
Ambient noise1350Not applicable450
Table 4. UAV recognition result of CNN in the test set.
FeatureUAVAccuracyPrecisionRecall
mfccair2s95.9%96.1%96.1%
spark96.5%96.4%96.5%
phantom493.9%94.1%94.0%
gfccair2s93.3%93.5%91.4%
spark95.1%95.5%94.8%
phantom493.9%94.2%93.8%
ufbfair2s97.1%97.2%97.2%
spark99.3%99.4%99.2%
phantom495.1%95.7%95.0%
Table 5. The CNN recognition result of UAV sound.
FeatureUAVAccuracyPrecisionRecall
mfccair2s89.5%98.1%85.0%
spark92.7%85.3%96.3%
phantom484.7%76.6%98.3%
gfccair2s85.5%94.4%81.7%
spark87.7%82.6%83.3%
phantom491.1%85.5%98.3%
ufbfair2s91.2%91.7%94.6%
spark94.7%89.0%97.2%
phantom496.8%95.2%98.3%
Disclaimer/Publisher’s Note: The statements, opinions and data contained in all publications are solely those of the individual author(s) and contributor(s) and not of MDPI and/or the editor(s). MDPI and/or the editor(s) disclaim responsibility for any injury to people or property resulting from any ideas, methods, instructions or products referred to in the content.

