Article

ST-YOLO: An Enhanced Detector of Small Objects in Unmanned Aerial Vehicle Imagery

by
Haimin Yan
1,
Xiangbo Kong
2,*,
Juncheng Wang
3 and
Hiroyuki Tomiyama
1,*
1
Graduate School of Science and Engineering, Ritsumeikan University, Kusatsu, Shiga 525-8577, Japan
2
Department of Intelligent Robotics, Faculty of Information Engineering, Toyama Prefectural University, Imizu, Toyama 939-0398, Japan
3
Rural Revitalization Institute of Digital Industry, Chongqing 402171, China
*
Authors to whom correspondence should be addressed.
Drones 2025, 9(5), 338; https://doi.org/10.3390/drones9050338
Submission received: 21 March 2025 / Revised: 25 April 2025 / Accepted: 27 April 2025 / Published: 30 April 2025

Abstract

:
This paper presents a redesigned YOLO-based model tailored for small-object detection in drone applications. To enhance its performance in detecting small and blurry targets, this study introduces the C3_CAA module to refine feature maps, integrates the CPA module and SI-IoU to improve detection accuracy, and incorporates channel and spatial attention mechanisms to further enhance target localization and identification performance.The experimental results indicated that the proposed method performs well on multiple datasets. The mAP value increases by 2% on the VISDRONE dataset, 1.6% on the UAVDT dataset, 0.9% on the CARPK dataset, and 1% on the UAVROD data set.

1. Introduction

With the rapid development of unmanned aerial vehicles (UAVs), drones equipped with advanced camera systems have been widely applied in various fields, including agriculture [1], aerial photography [2], and urban surveillance [3]. Due to the advancements in edge servers, data processing has gradually migrated to the cloud, reducing the reliance on local computational resources on drones [4], enabling target detection models with moderate resource requirements to be effectively deployed on UAV platforms. Therefore, high-precision target detection with moderate resource demands has become a key component of UAV platforms.
However, applying existing models directly to target detection scenarios captured by drones typically encounters three major issues, which are clearly demonstrated through several examples in Figure 1 [5]. First, drone-captured images typically encompass vast areas with smaller, more indistinct targets, frequently resulting in incorrect detections. Second, these images often feature a high density of objects, leading to significant occlusion among them. Third, due to the extensive coverage, drone-captured images are likely to include ambiguous geographical elements. Fourth, although some models achieve good results with aerial images, the slow inference speed or large size of the model size prevent its deployment on drones for target detection. These four factors collectively pose substantial challenges to object detection in drone-captured images.
To address the numerous challenges of drone-based object detection, many researchers have developed YOLO models specifically for drone target detection. Zhu et al. [6] introduced TPH-YOLOv5, an enhanced YOLOv5 model incorporating transformer prediction heads (TPHs) for target detection in UAV-captured scenes. Although this work significantly improved model accuracy and achieved good performance, the addition of too many transformer encoder blocks in the feature extraction part of the model substantially increased its size and considerably reduced the inference speed. This makes the model difficult to deploy on drones for target detection. Sahin et al. [7] introduced YOLODrone, an enhanced version of the YOLO architecture, which improves target detection accuracy with drone images through data augmentation, with adjustments in the number of detection layers and modifications in anchor box configurations. Although their improved model showed some enhancements over the baseline, the baseline they improved upon was proposed quite some time ago and exhibits a certain gap in accuracy compared to current models. Hui et al. [8] introduced STF-YOLO, which incorporates a new convolutional structure called STRCN, enhancing feature extraction. Although they successfully improved accuracy without increasing the model size, the improved model has certain drawbacks in terms of inference speed, which may render it unsuitable for practical application in drone-based target detection. These studies demonstrate the potential of YOLO-series models in drone-based target detection. However, these improved models have deficiencies in balancing model size, inference speed, and accuracy, which may render them unsuitable for application in drone target detection.
Inspired by the above work, this paper proposes an efficient neural network model, ST-YOLO, based on the YOLOv5s model, designed to address the issues previously mentioned. Initially, by integrating the efficient CAA mechanism [9] with the C3 module of YOLO into a combined C3_CAA module within the backbone of YOLOv5s, this enhancement not only enhances feature extraction capabilities but also reduces the model size and accelerates computation speed. Furthermore, considering the potential for feature loss due to continuous downsampling in the neck of the YOLO model, this work adopts the PPA attention mechanism from the HCF-Net model [10], proposing a CPA module that is integrated into the neck of YOLOv5s. This modification, through a pyramid pooling structure and parallel multi-branch strategy, effectively captures and integrates features of varying scales, significantly improving detection accuracy for small objects. Moreover, by combining channel and spatial attention mechanisms, it further strengthens the focus on information-rich feature channels, achieving more-precise object localization and recognition. Finally, this paper develops a targeted IoU for drone aerial imagery called SI-IoU. Drawing on the features from both Shape-IoU [11] and Inner-IoU [12], it not only focuses on the shape and scale of the bounding boxes to accurately compute losses, thus enhancing the precision of bounding box regression, but also uses auxiliary bounding boxes to compute the IoU loss, where the size of these auxiliary bounding boxes can be adjusted using a scale factor ratio, further enhancing detection performance.
Our main contributions are listed as follows:
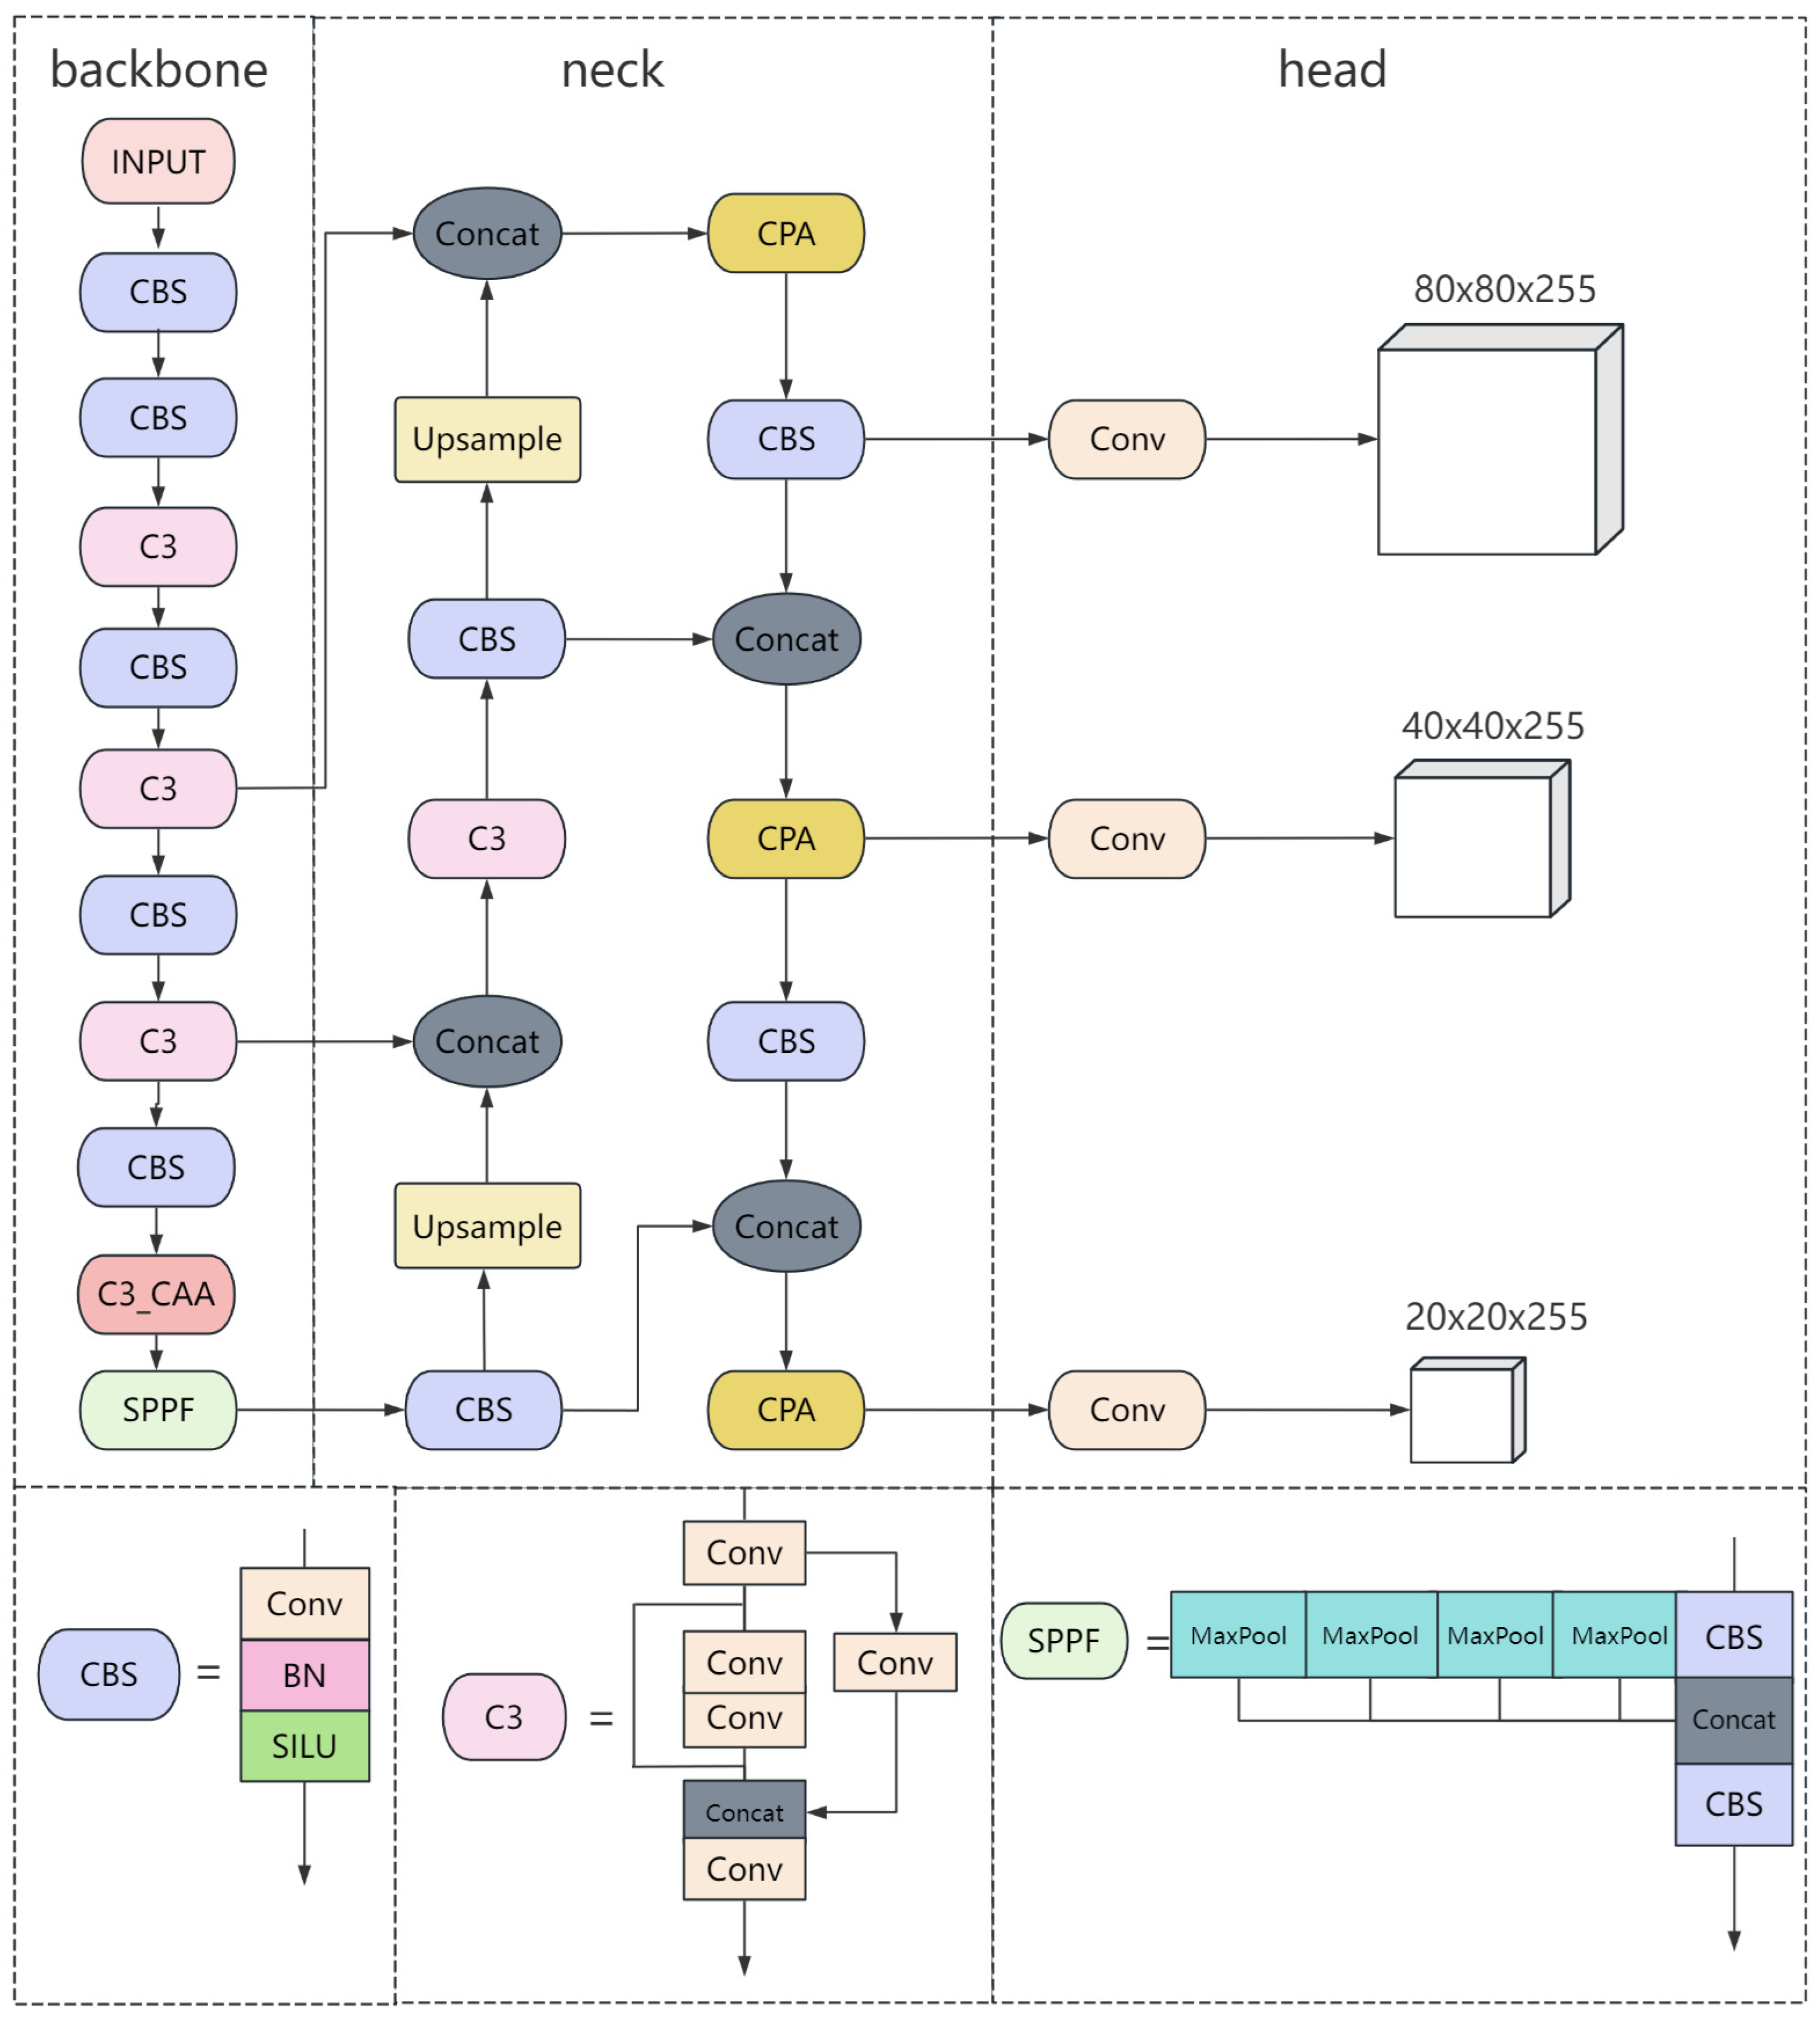
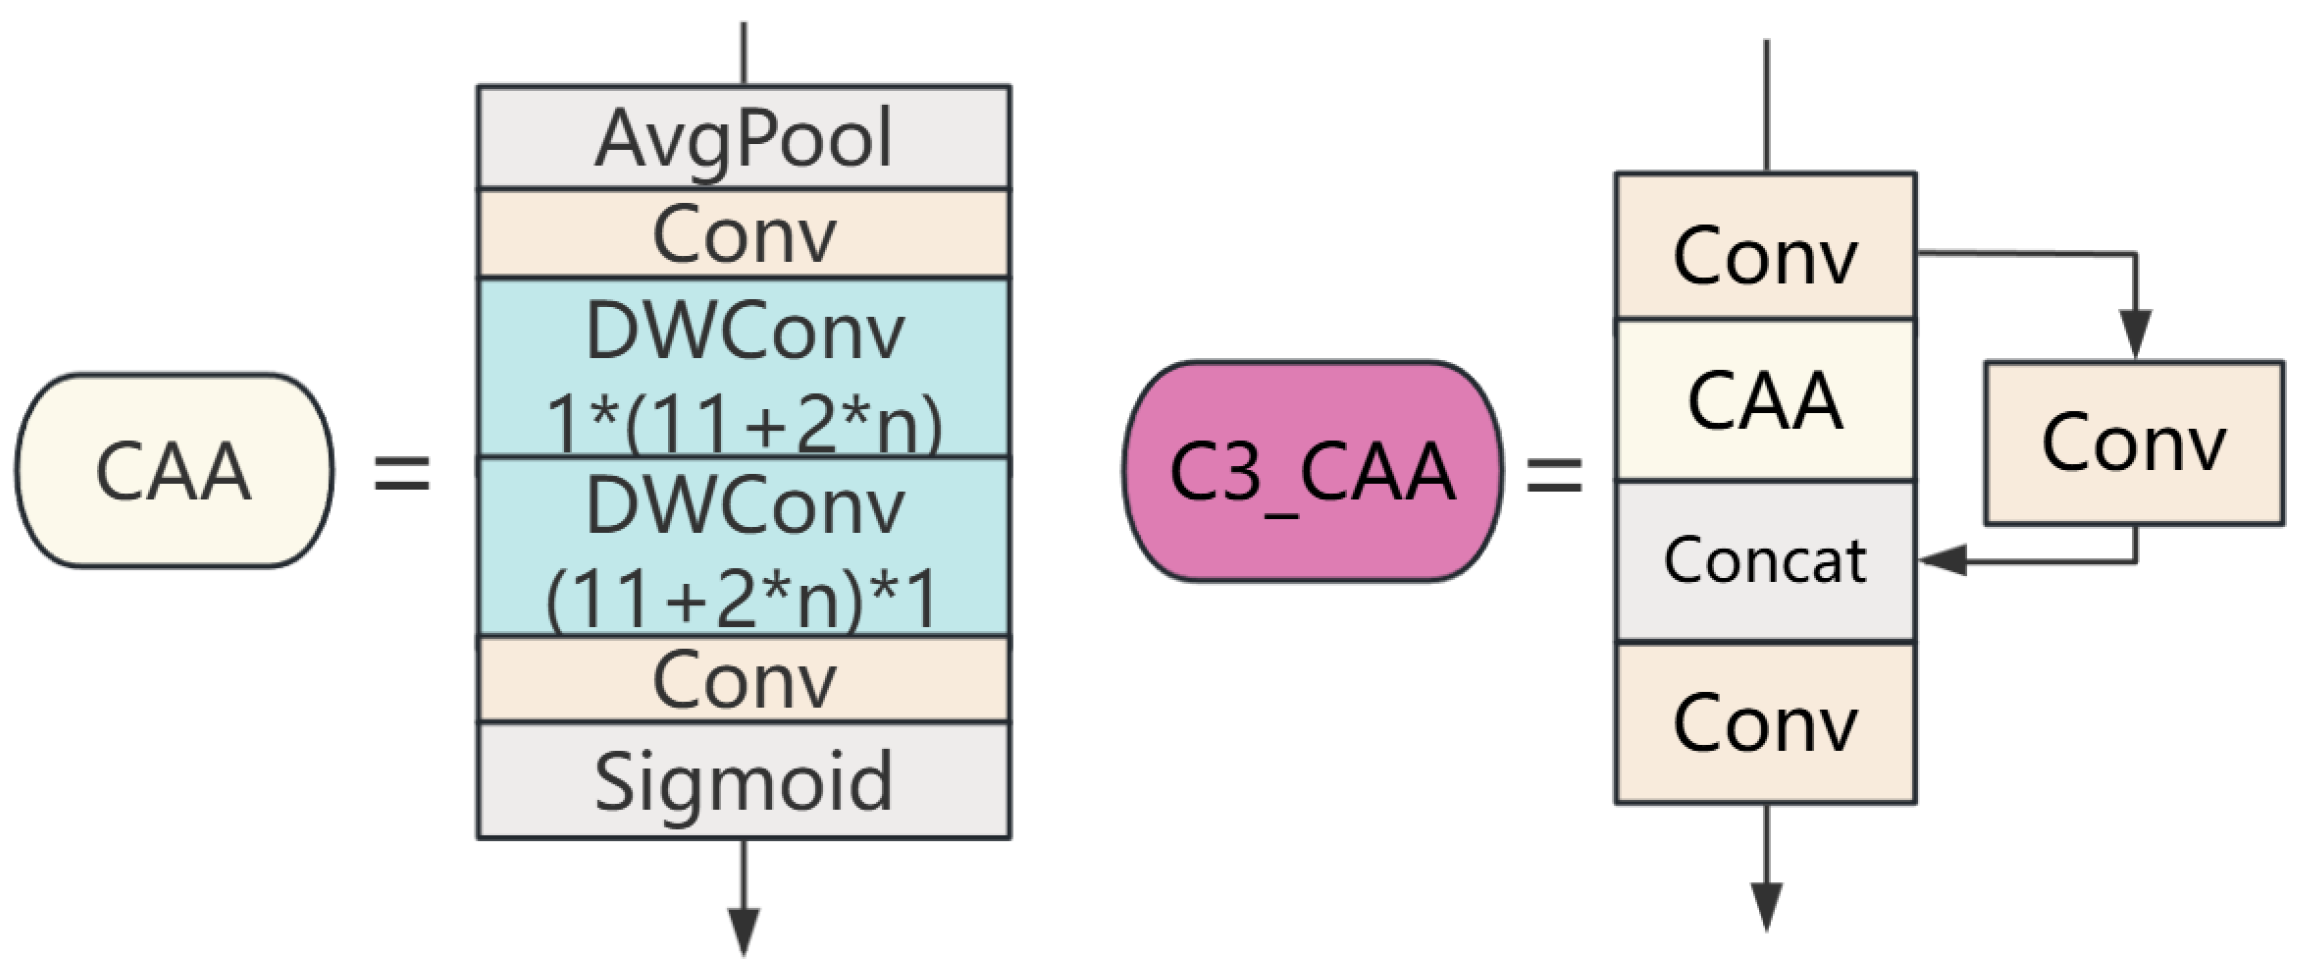
  • To address the challenge of detecting small objects in aerial images, we incorporated the CAA mechanism into the C3 module of YOLO, resulting in the creation of the C3_CAA module. This new integration substantially boosts the feature extraction power of the YOLO backbone and achieves a considerable reduction in model size, all while preserving performance.
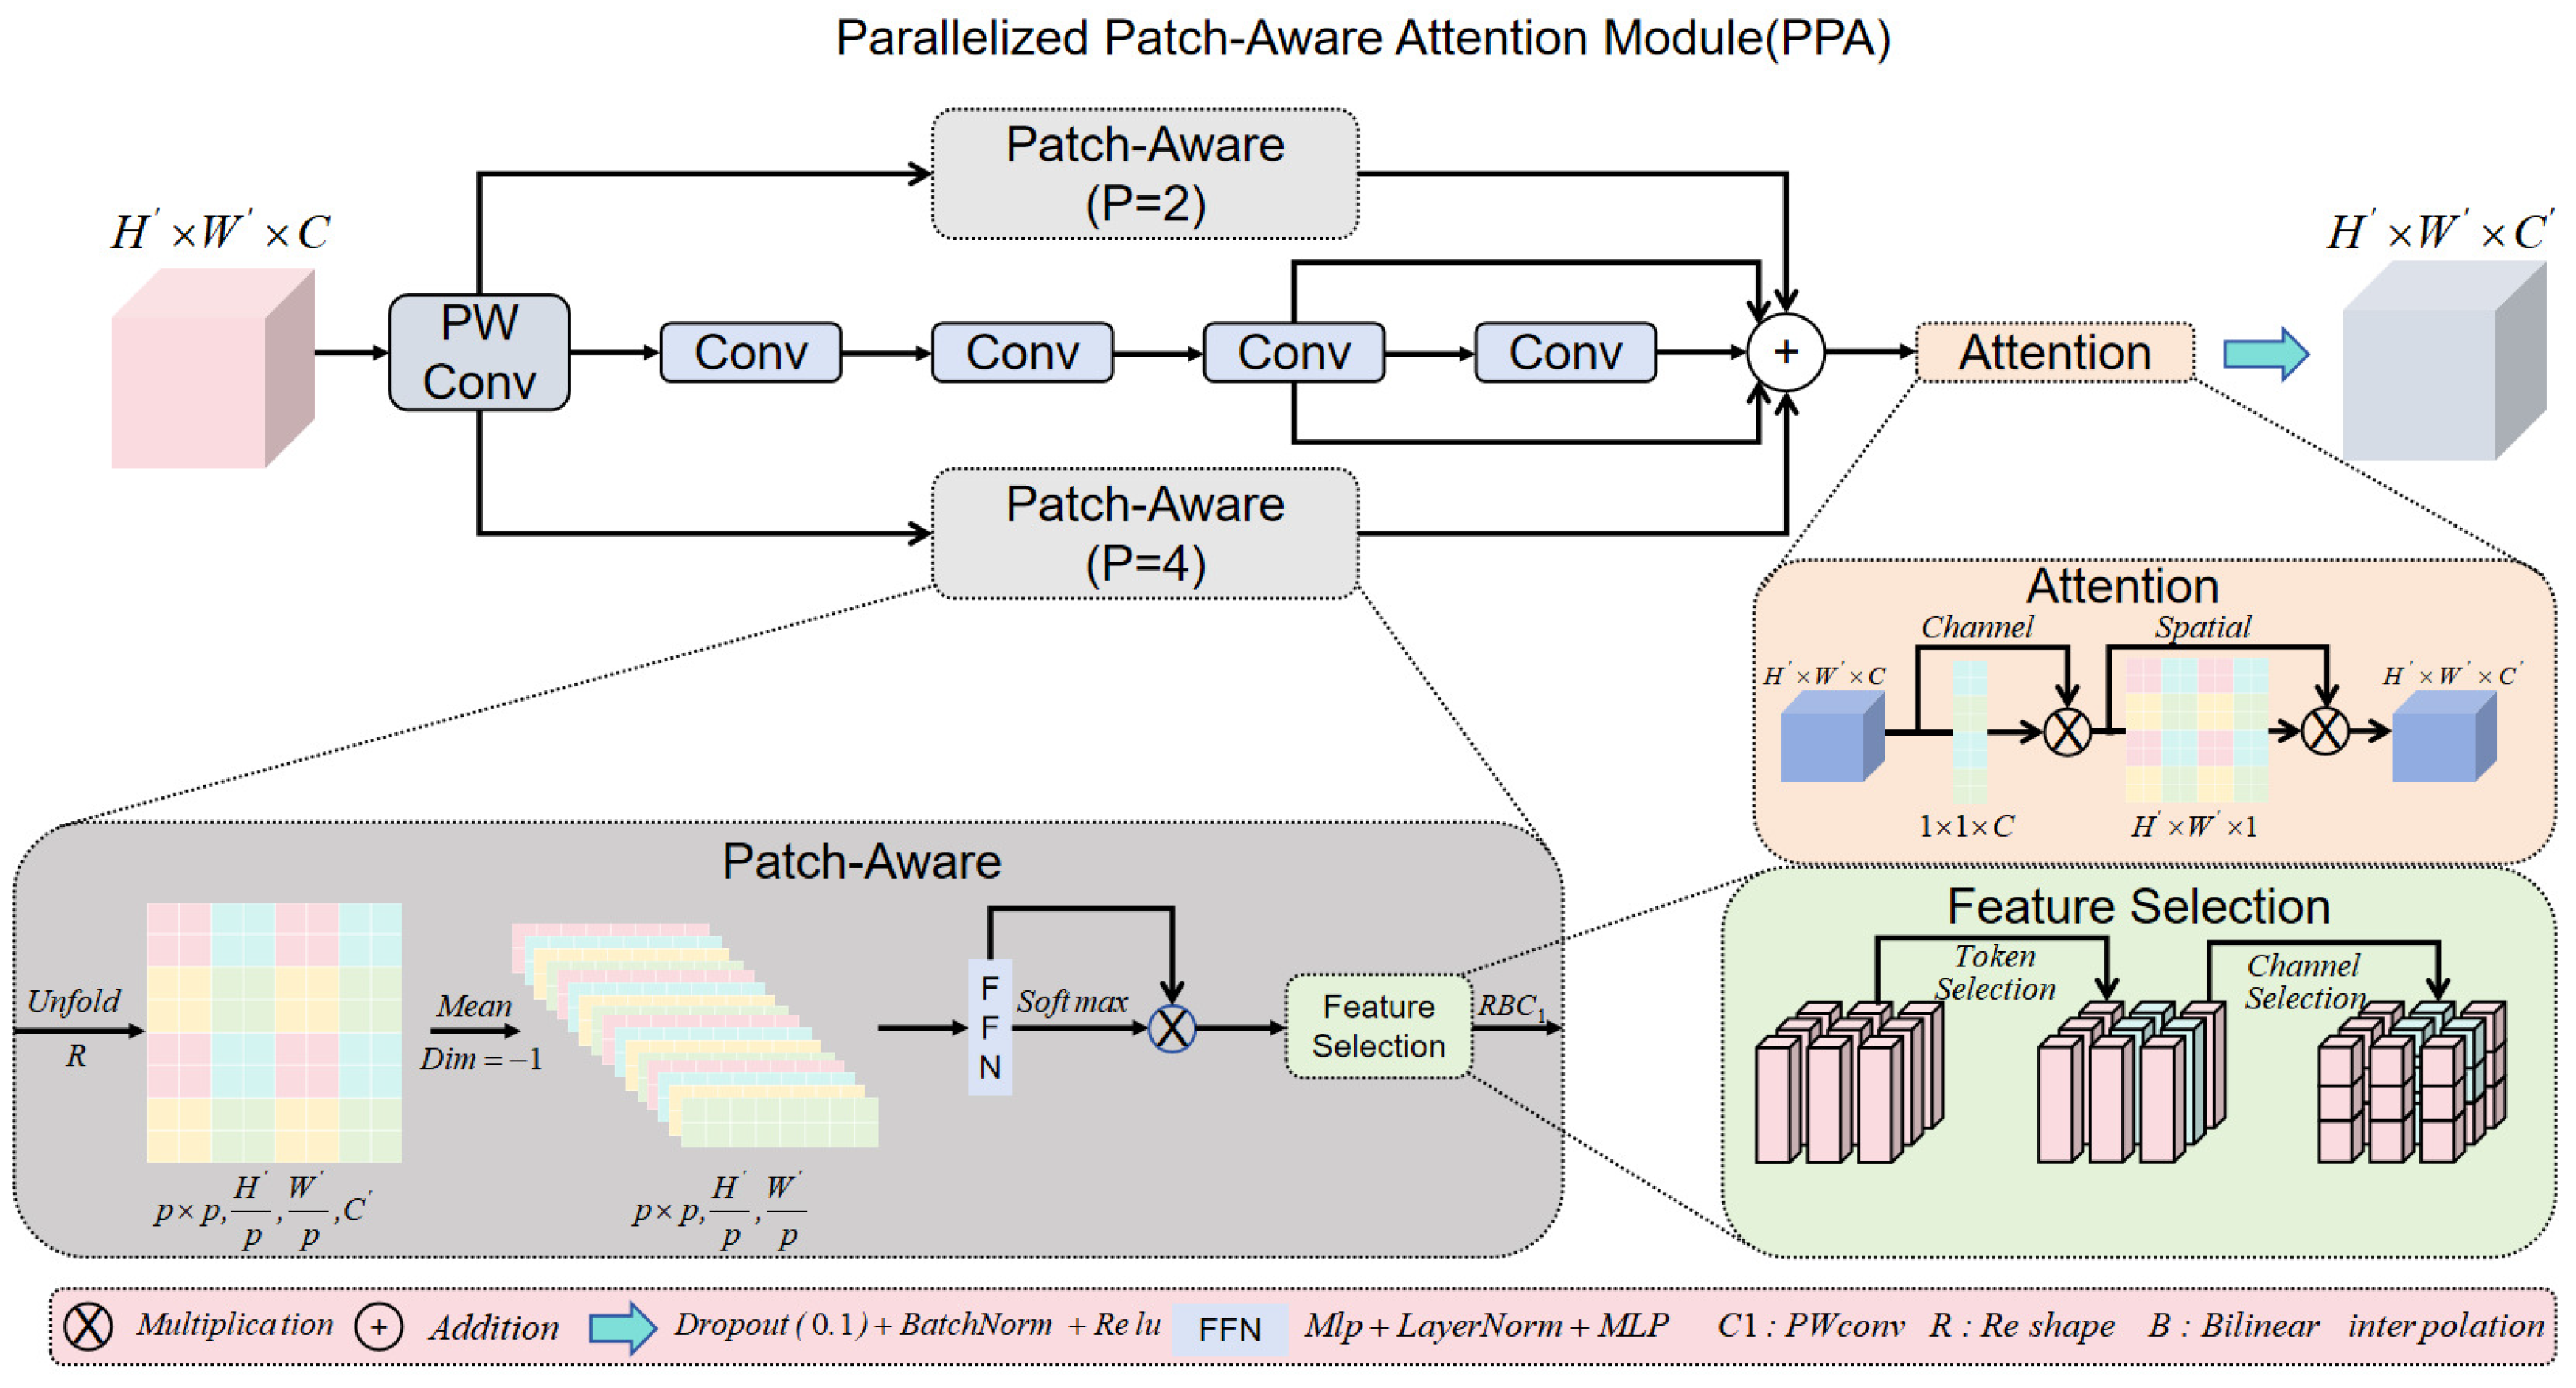
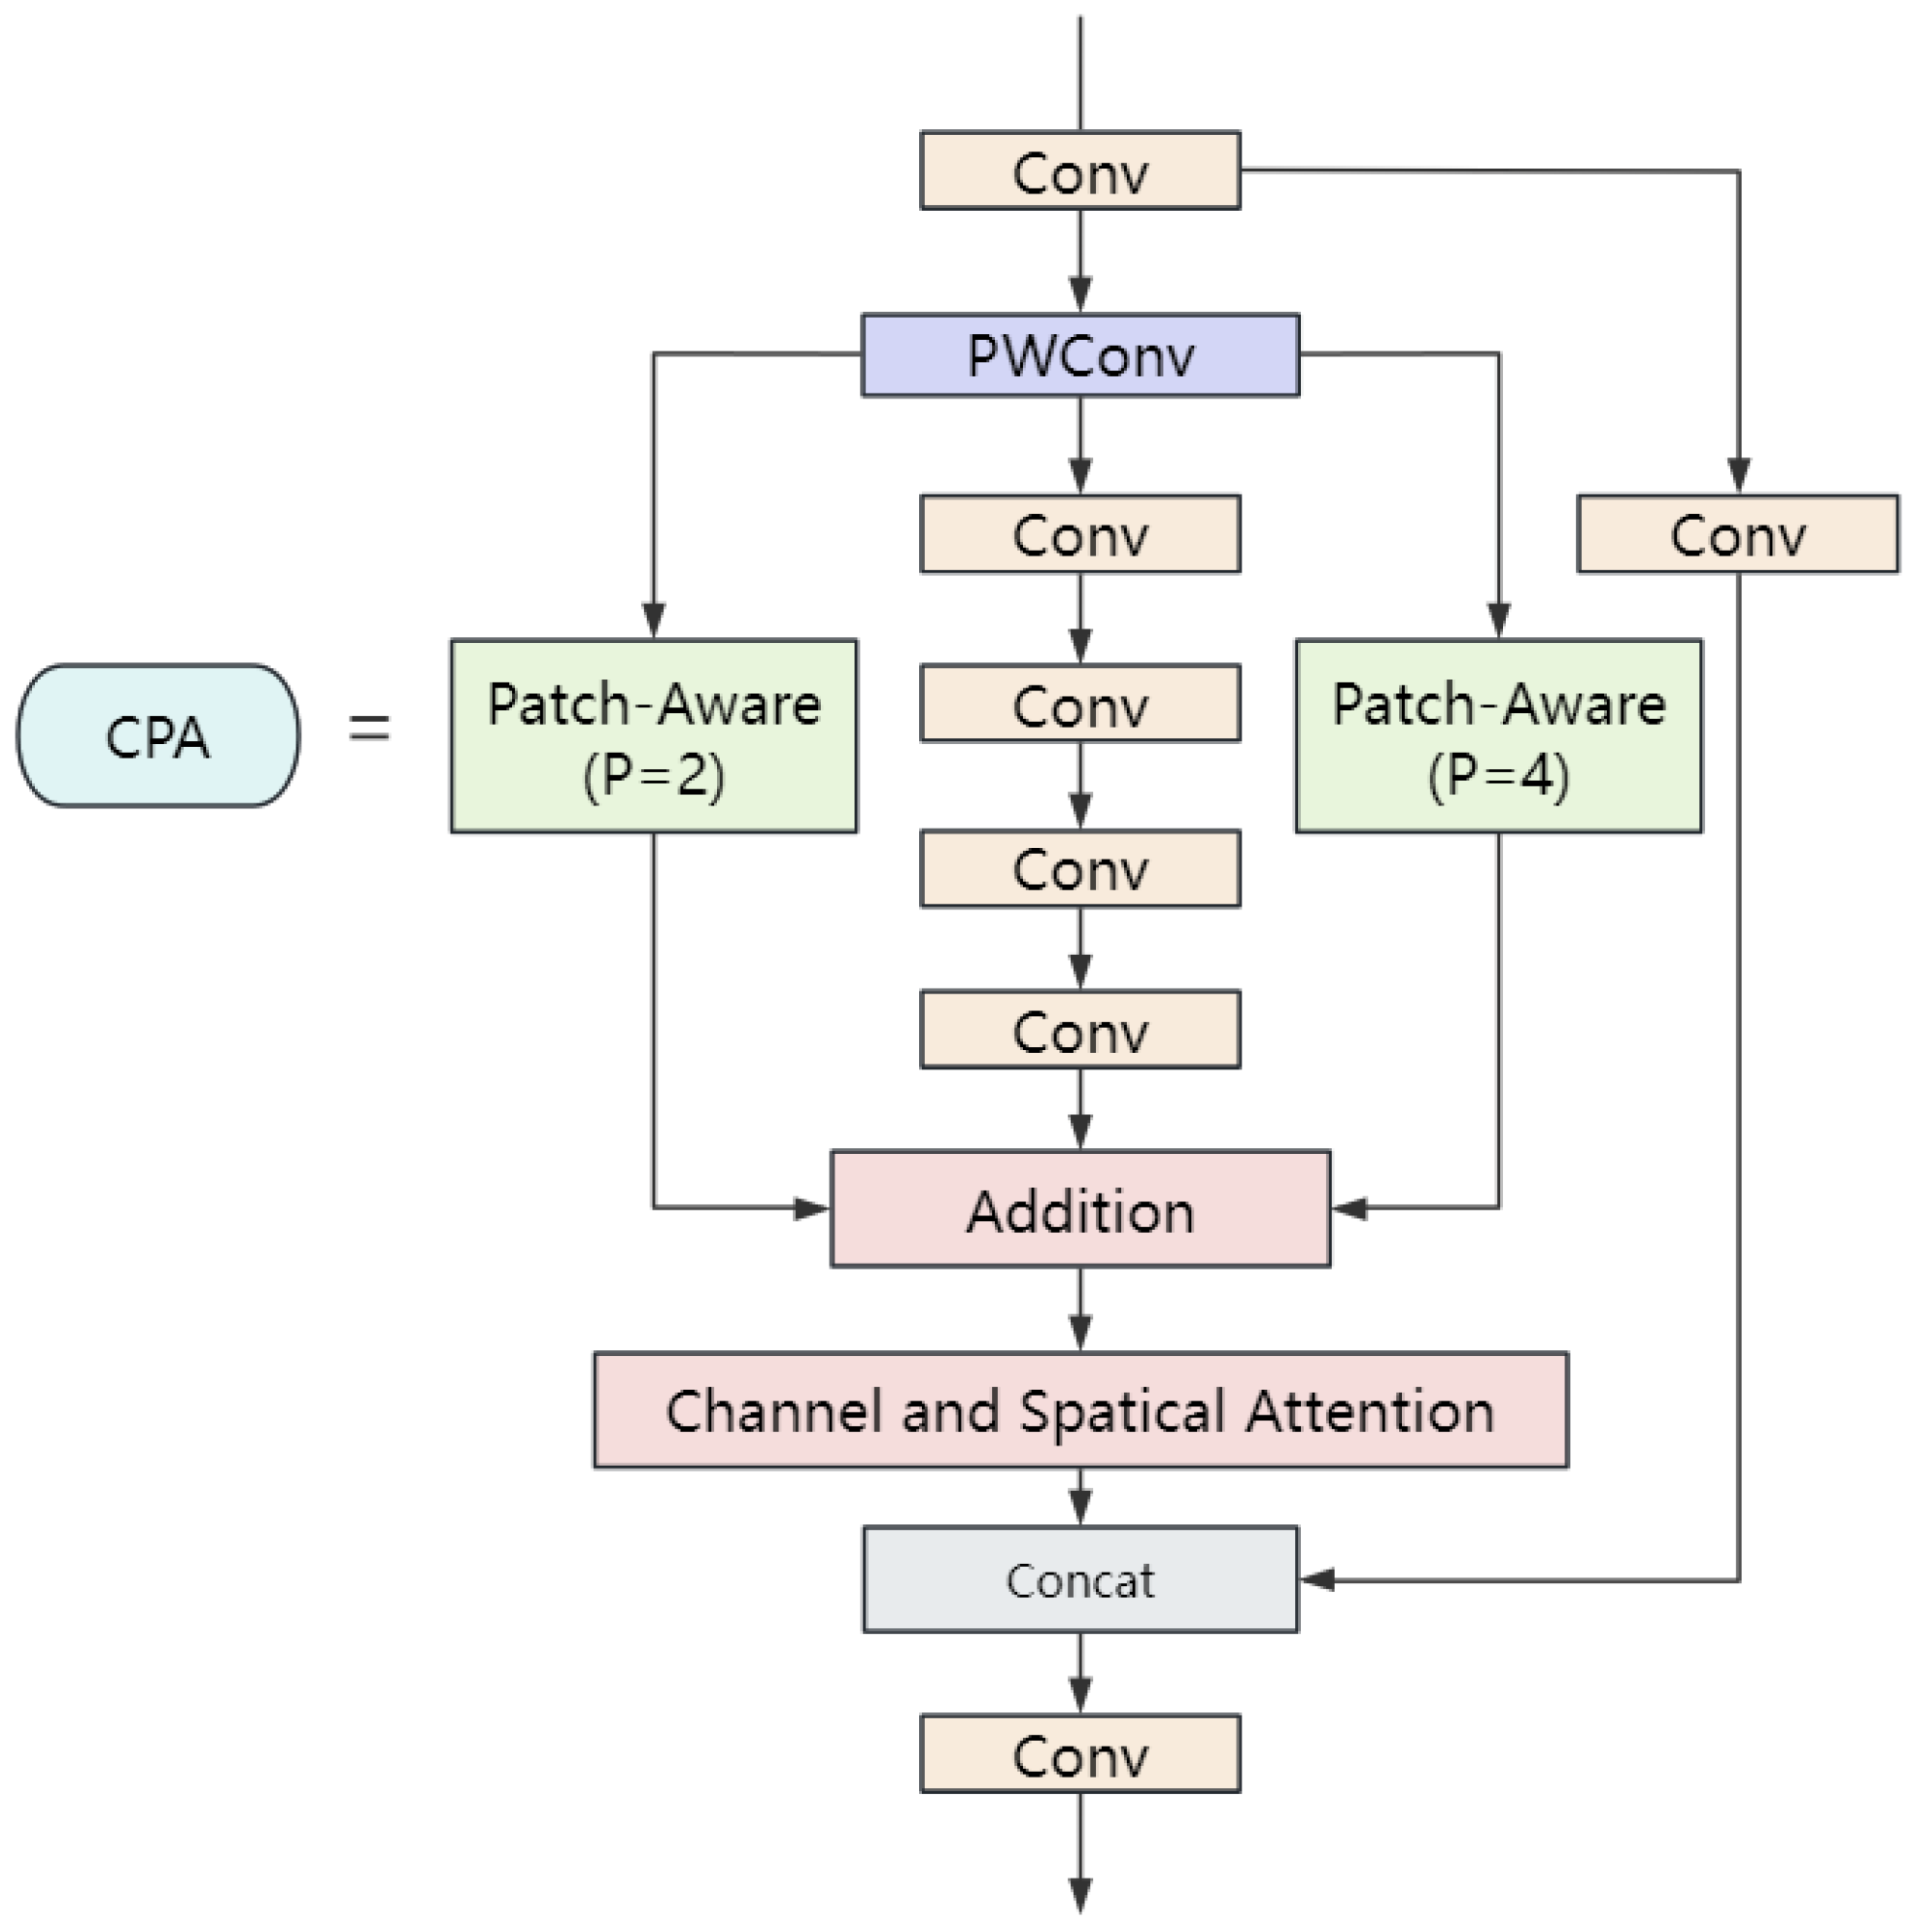
  • Considering the potential for information loss due to continuous downsampling in the neck of the YOLO model, we integrated the PPA attention mechanism into the C3 module, creating the CPA module. This new module effectively captures and integrates features at different scales through a pyramid pooling structure and parallel multi-branch strategy, significantly improving the detection accuracy of small targets.
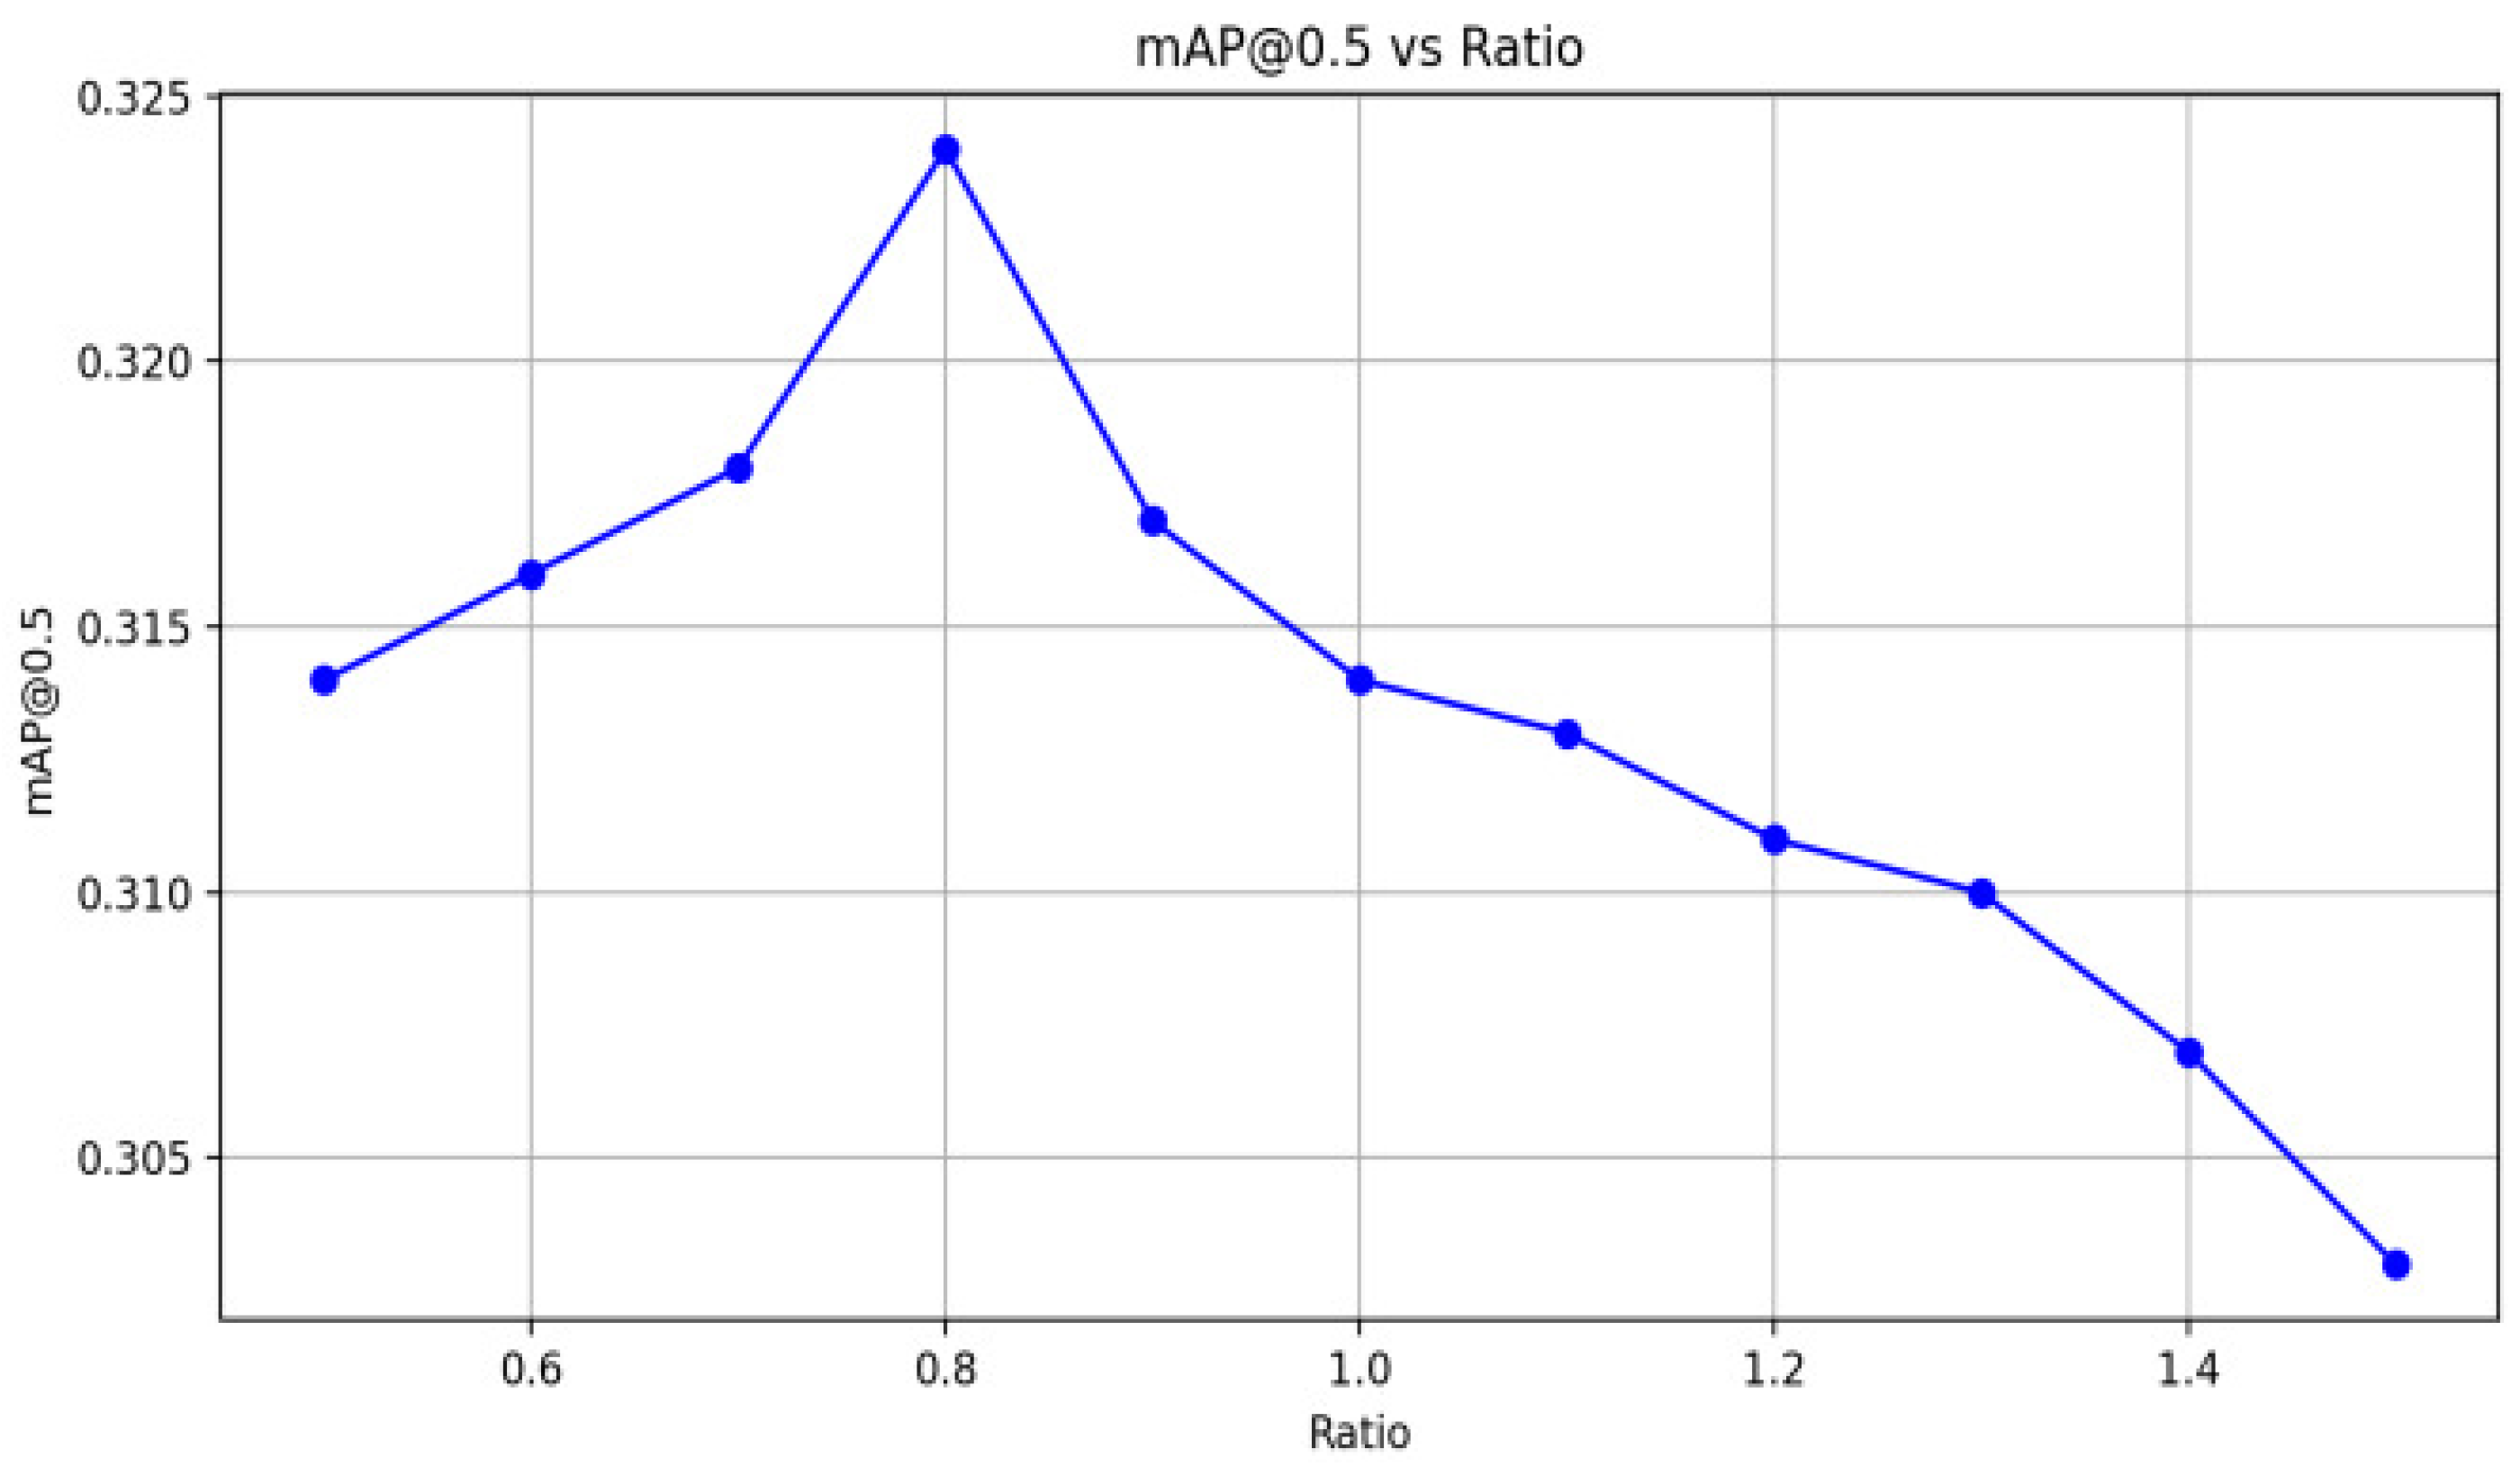
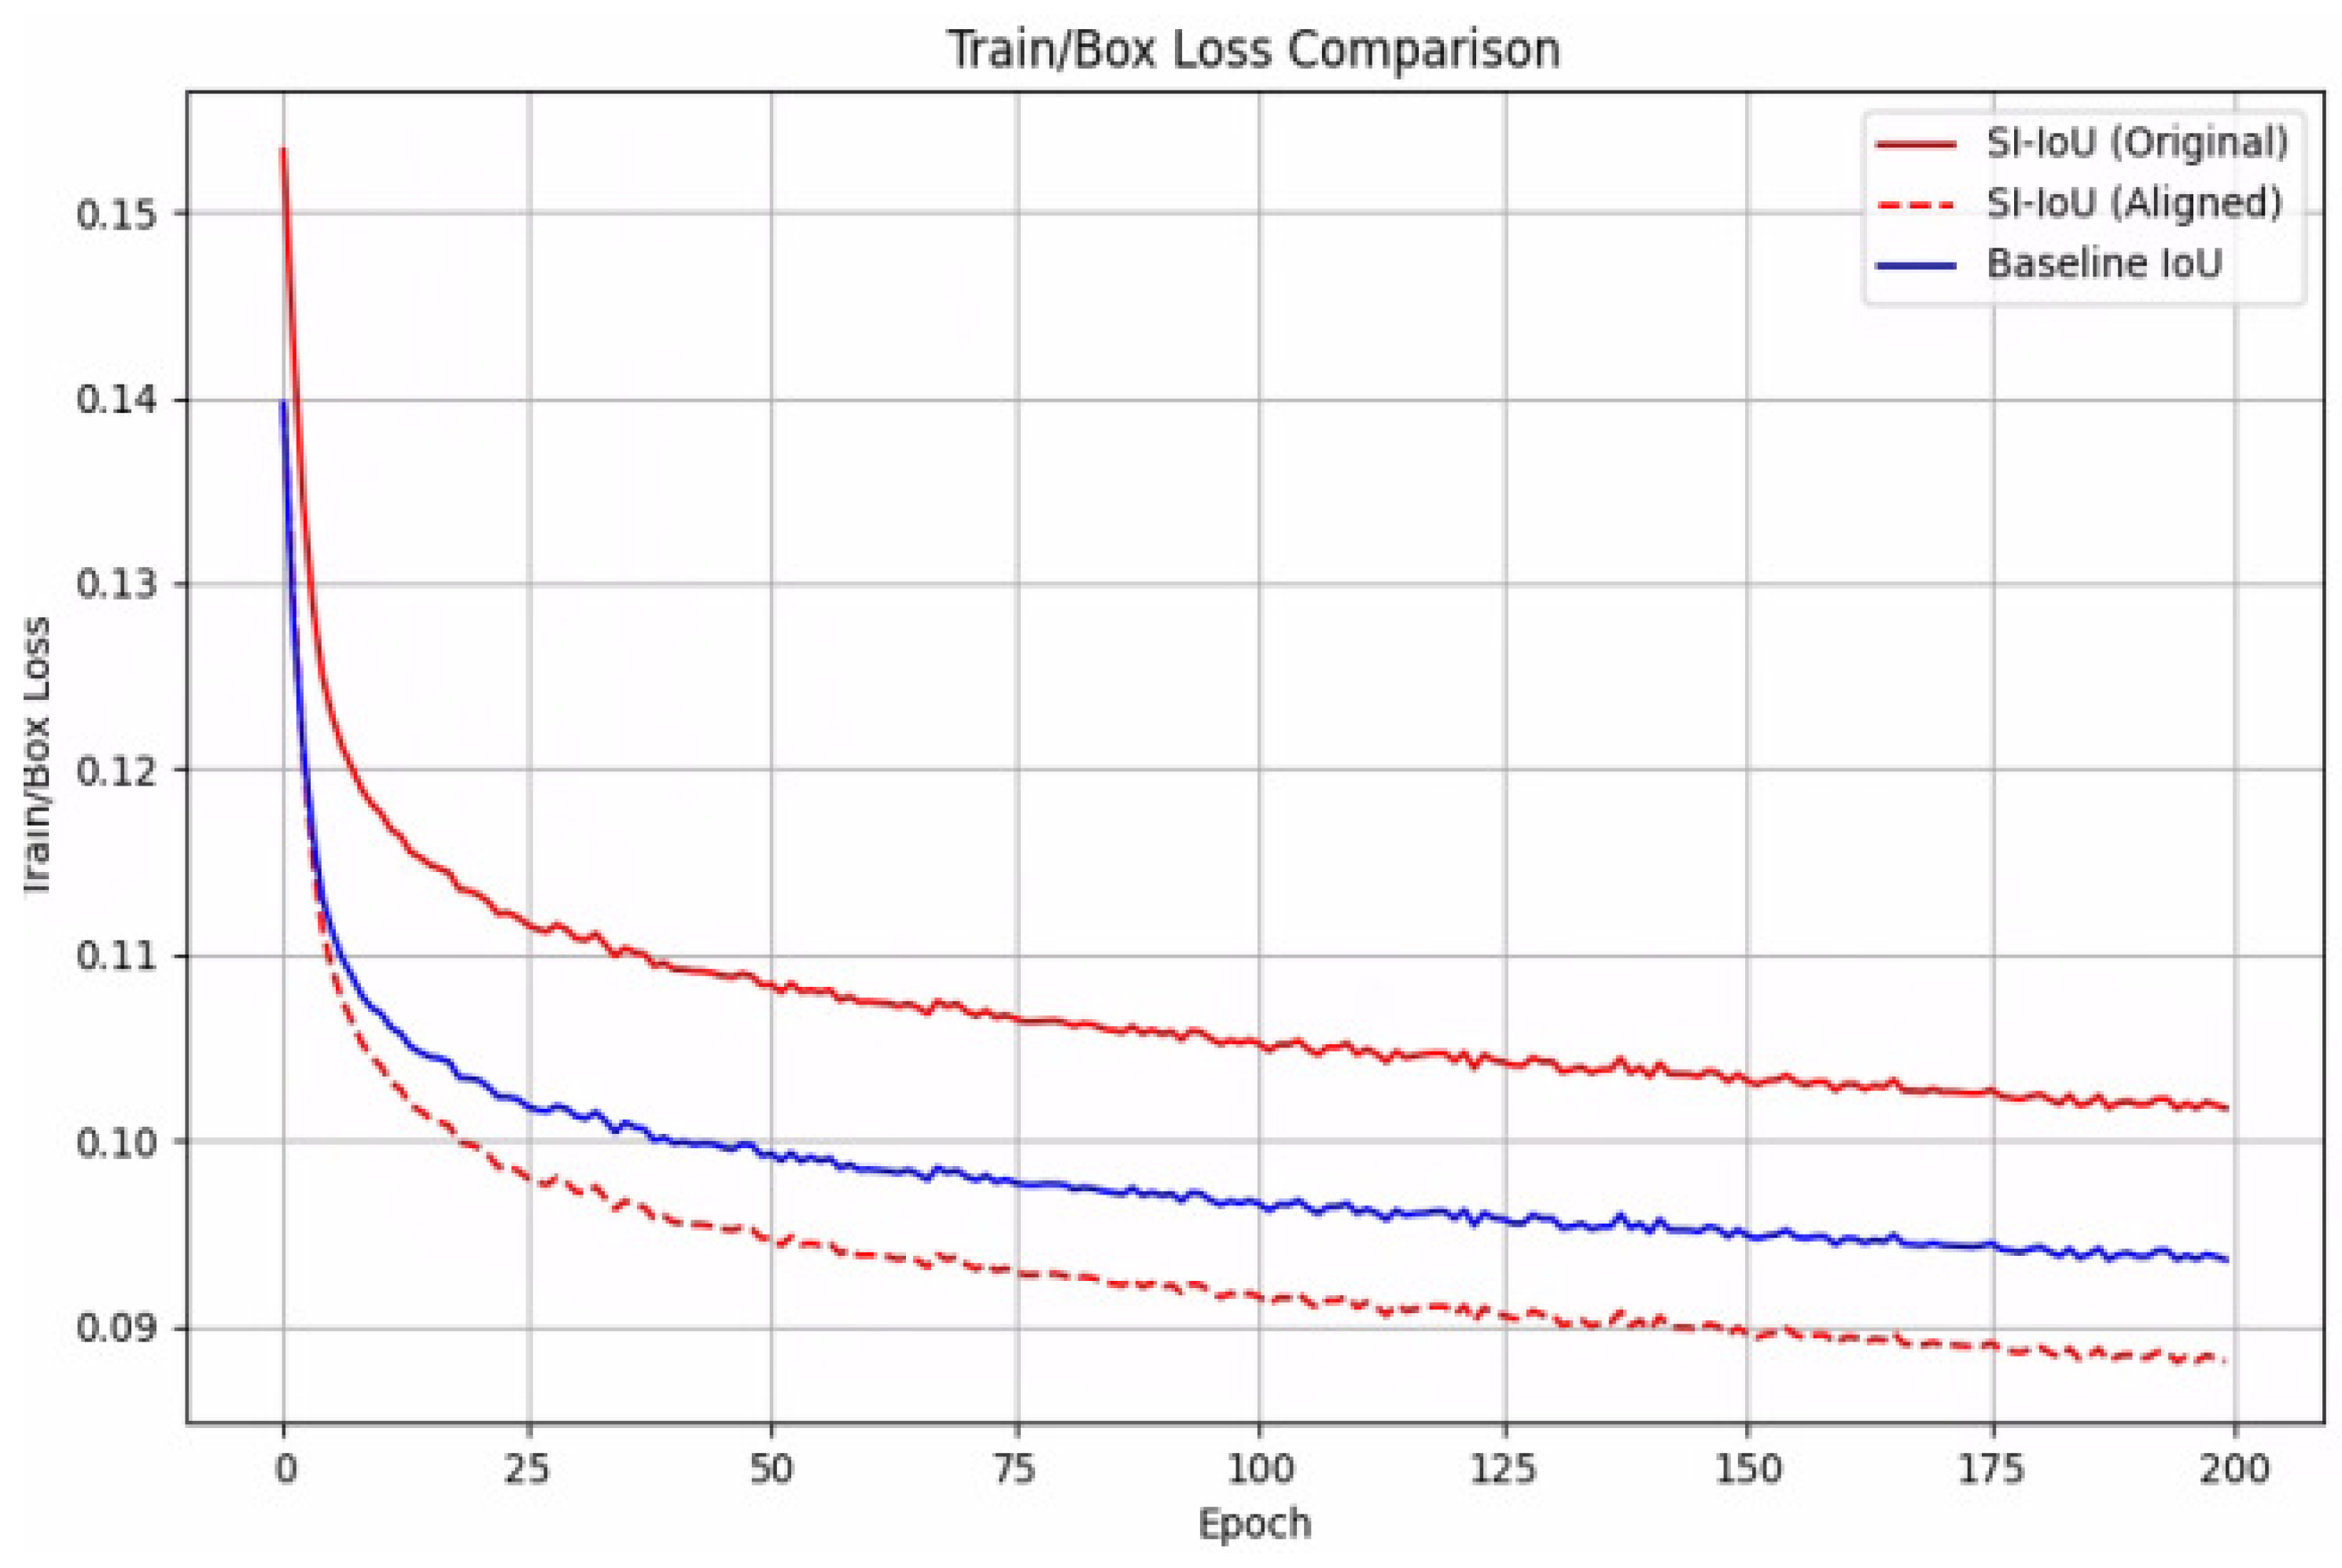
  • Considering the challenges of multiple viewing angles in aerial images and the slow convergence rate of the standard IoU, we introduced a new method for IoU calculation. This approach concentrates on the shape and scale of bounding boxes to determine losses. By applying a scale factor ratio to adjust the creation of auxiliary bounding boxes, this method not only enhances the precision of bounding box localization but also improves the overall efficiency of detection.
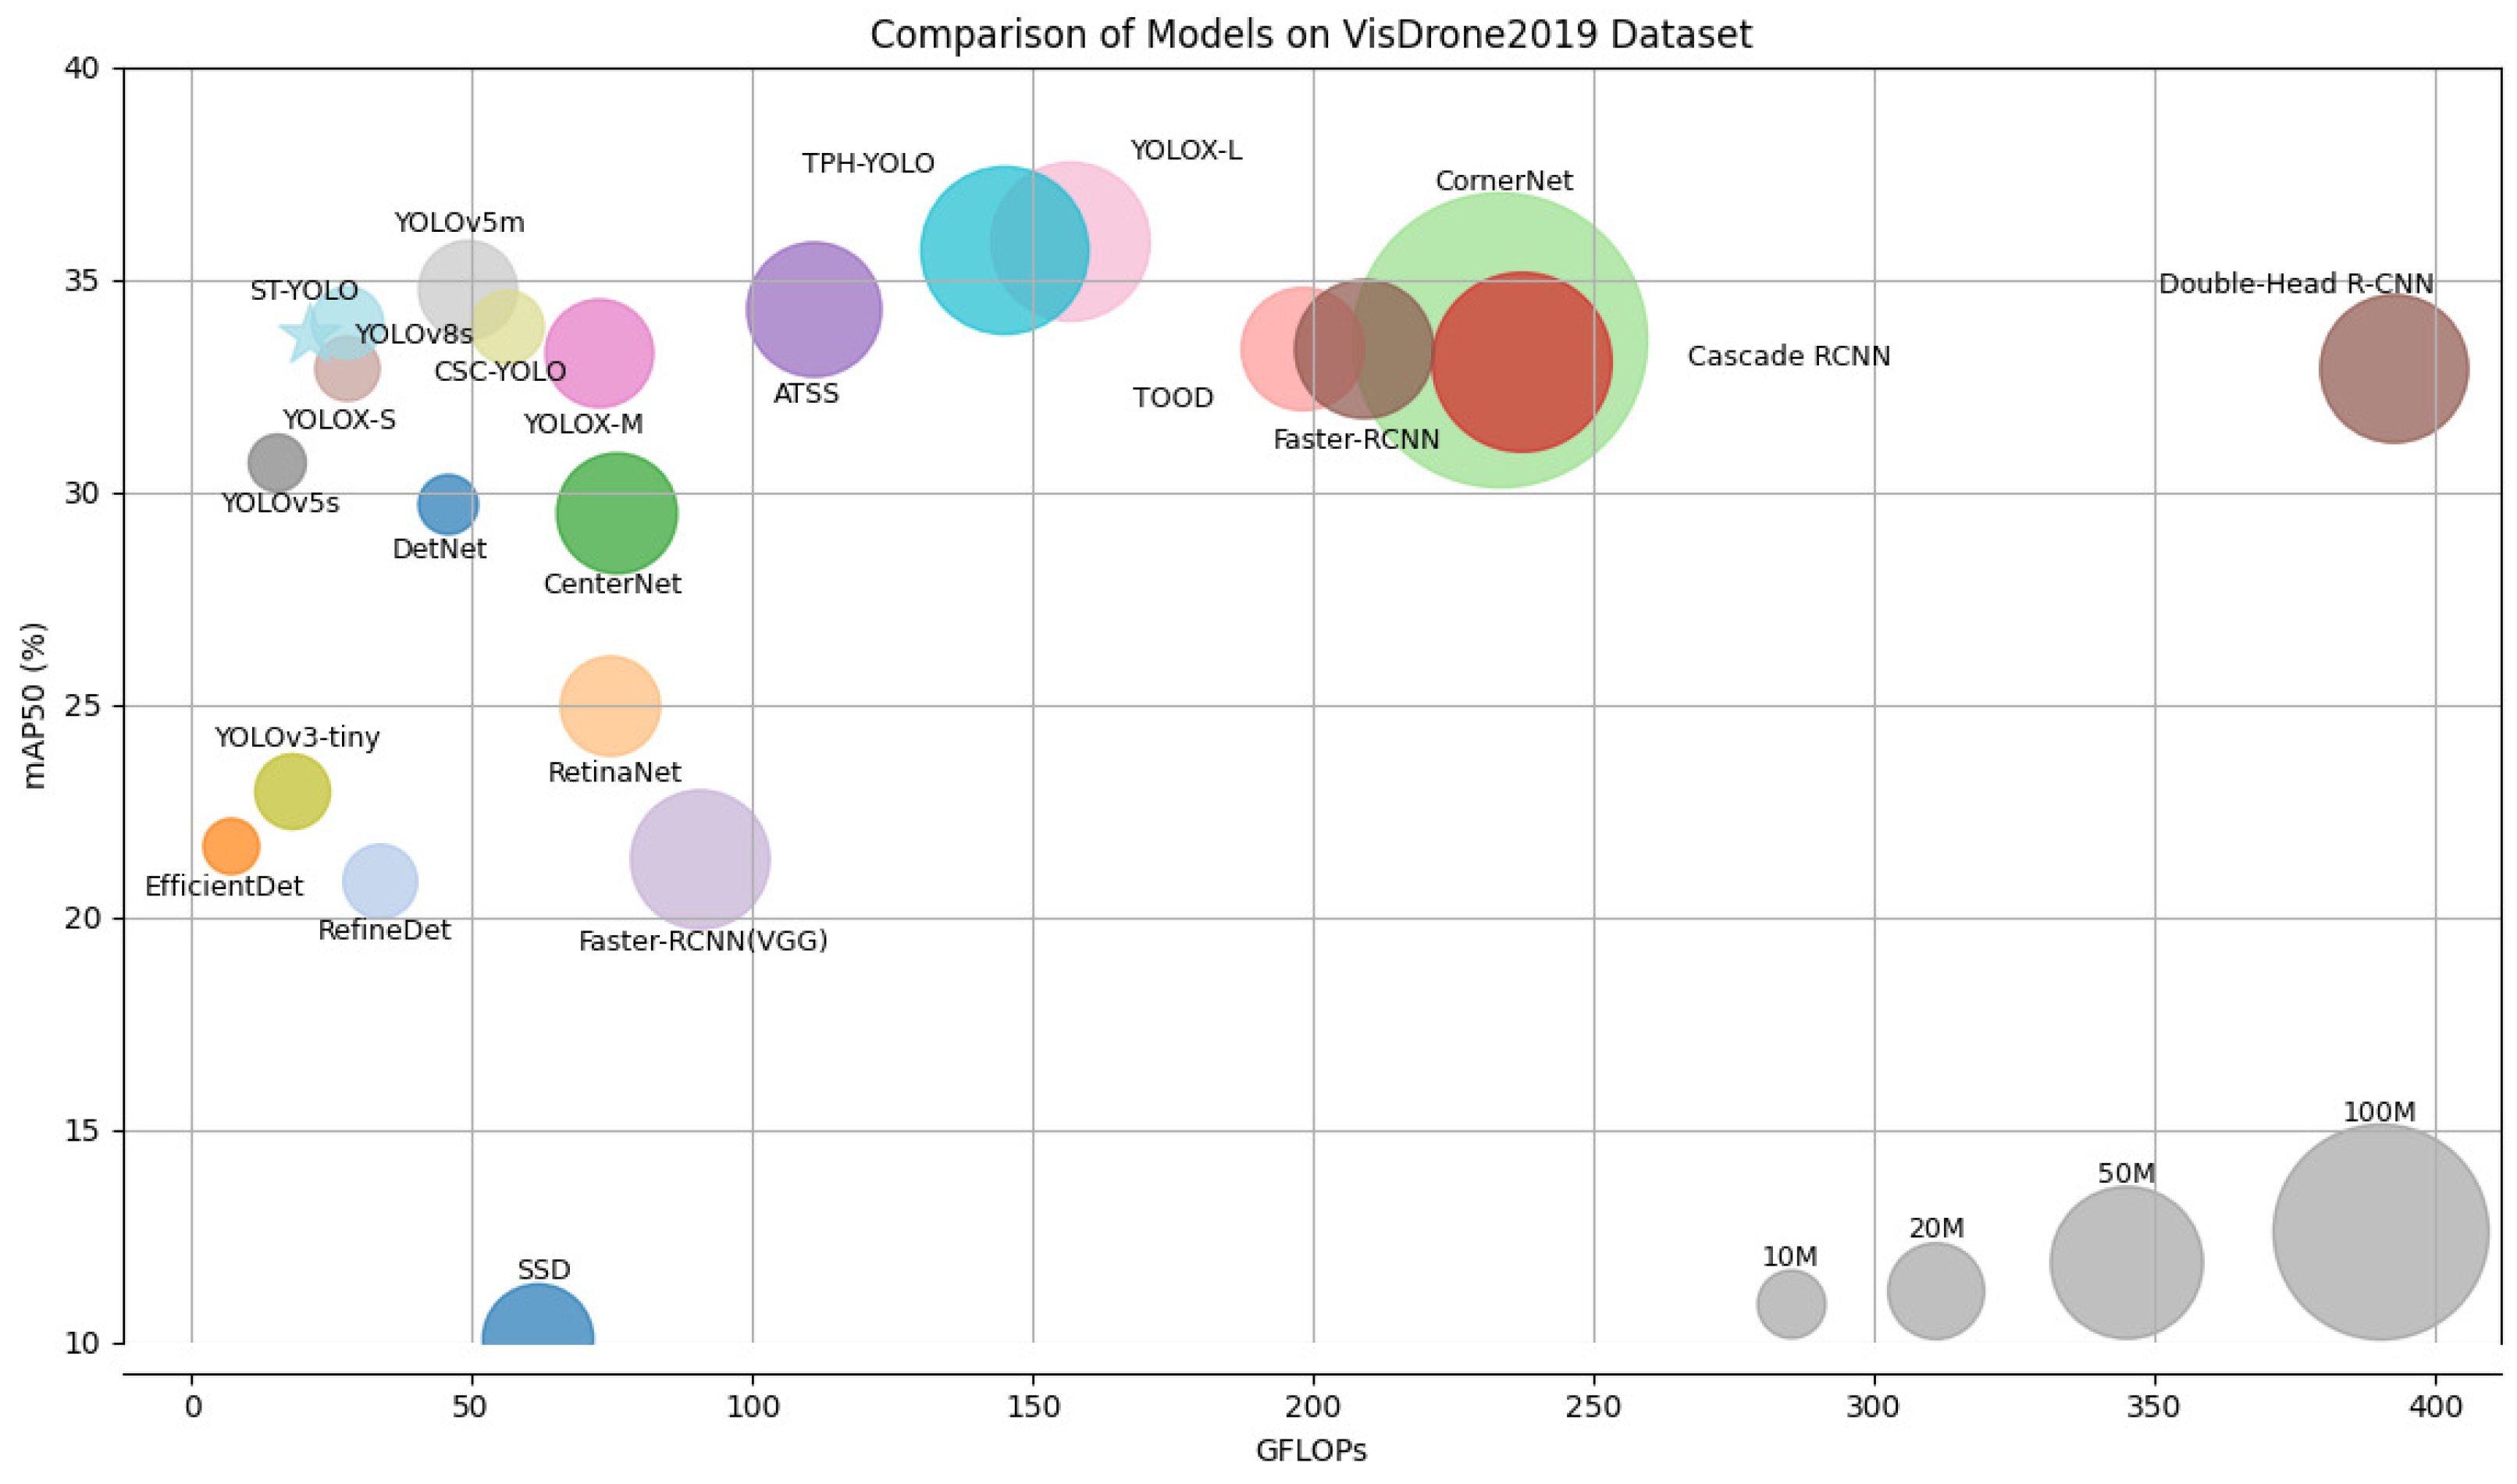
  • We validated our approach on multiple datasets, and the experimental results indicate that although the ST-YOLO model shows a slight increase in the number of model parameters and GFLOPs, it achieves a notable improvement in accuracy compared to the baseline.

2. Related Work

2.1. Traditional Object Detection

Current deep-learning-based target detection technologies can be broadly classified into two primary categories: two-stage detection methods and one-stage detection methods.
In two-stage detection methods, the process begins by generating preliminary candidate target regions. Subsequently, these regions undergo a detailed classification and regression in the second phase to accurately pinpoint the target’s location and identify its category. Notable examples of this approach include Light-Head R-CNN [13] and Cascade RCNN [14]. These methods are renowned for their high accuracy and precise target localization capabilities. However, the substantial computational demand and slower inference speeds associated with these methods generally render them less suitable for applications requiring quick responses, such as real-time detection tasks.
Conversely, one-stage detection methods, exemplified by You Only Look Once (YOLO) [15], streamline the detection process by predicting target categories and locations in a single forward propagation step, without the need for generating candidate regions beforehand. This method’s swift inference speed makes it exceptionally suitable for real-time detection scenarios, making it an optimal choice for deployment in devices with constrained computational capacities. Owing to these benefits, one-stage detection methods have gained widespread popularity in time-sensitive applications, such as drone surveillance.

2.2. Object Detection Methods Based on Transformer

The transformer was first introduced by Vaswani et al. [16], initially applied primarily in the field of machine translation and later widely adopted in computer vision. Within this field, DETR [17] and ViT-FRCNN [18] serve as prominent examples of its application. DETR utilizes the transformer encoder–decoder structure to directly locate and classify objects in images, thereby simplifying the complex workflows typical of traditional object detection. On the other hand, ViT-FRCNN combines the Vision Transformer with the Faster R-CNN framework, using self-attention mechanisms to break down the image into a series of fixed-size patches, treating these patches as independent elements in a sequence. This approach enables the model to capture the global dependencies among these patches, demonstrating the unique advantages and potential applications of the transformer architecture in object detection tasks.
Nevertheless, transformer-based object detection models have a notable limitation: their reliance on global self-attention mechanisms substantially slow down processing speeds, particularly with longer sequences. This drawback makes them less ideal for use in environments where computational resources are limited. Additionally, the need for extensive training data and the computational expense during training can further restrict their practical deployment in real-time applications.

2.3. Attention Mechanism

Attention mechanisms first achieved significant success in the field of natural language processing and were swiftly introduced into computer vision and image processing. Among the earlier proposed and used attention mechanisms are SE attention [19] and CBAM attention [20]. The SE attention mechanism primarily works by adaptively recalibrating the feature channels produced by convolutional layers. It learns the importance of each channel and adjusts the response strength of the channels accordingly. CBAM attention enhances feature representation by sequentially applying spatial and channel attentions. It first focuses on the feature channels that contribute significantly to the output through channel attention, then highlights the important spatial locations with spatial attention. These attention mechanisms enhance the efficiency and effectiveness of feature extraction, significantly improving model performance and generalization ability on tasks such as image classification, object detection, and image segmentation.

2.4. IoU

In the field of object detection, the Intersection over Union [21] is a key metric for evaluating model performance. The IoU assesses the accuracy of detection by measuring the overlap between the predicted bounding boxes and ground-truth bounding boxes. This metric effectively differentiates between the positive and negative samples predicted by the model, providing crucial feedback for optimizing the model during the backpropagation process. In addition to the basic IoU, several variants such as CIoU [22], GIoU [23], and DIoU [24] have been developed, which are commonly used as loss functions for object detection tasks. These IoU variants consider not only the area of overlap but also factors like the distance between the centers of the bounding boxes and shape compatibility, thereby offering more precise loss calculations when dealing with targets of complex geometries and size variations.

3. Proposed Method

This section introduces the proposed ST-YOLO algorithm. the improved modules C3_CAA and CPA, and a new way to calculate the IoU: SI-IoU.

3.1. Overall Structure of ST-YOLO

Although YOLOv5 demonstrates strong performance on several general datasets, it still falls short when detecting targets across multiple scales and in complex environments. This issue is particularly pronounced in drone aerial imagery, where targets are predominantly small and may be occluded by each other, leading to potential misdetections. Additionally, given the broad coverage of drone cameras, the captured images are likely to contain blurry geographical features. To address these challenges, we developed the ST-YOLO detection model.
Figure 2 shows the architecture of our proposed ST-YOLO network. This enhanced neural network model is built on the compact framework of YOLOv5s and incorporates the C3_CAA module into its backbone to boost feature extraction while reducing the overall model size and increasing inference speed. Additionally, to more effectively extract features from small objects, we integrate the PPA attention mechanism into the YOLO’s C3 module, creating the CPA module, which is incorporated into the neck of the model. This module utilizes a pyramid pooling structure and a parallel multi-branch strategy to effectively capture and integrate features across different scales. Moreover, this study also introduces a novel IoU calculation method named SI-IoU. This method refines loss calculations by focusing on the geometric details of the bounding boxes to improve the precision of bounding box regression. It also optimizes the size of auxiliary bounding boxes through the adjustment of scale factors, further enhancing detection performance.

3.2. Context Anchor Attention (CAA)

Cai et al. [9] introduced the Poly Kernel Inception Network (PKINet), a novel framework engineered to address the specific challenges of detecting objects in remote sensing images (RSIs). These challenges include significant variations in object sizes and a wide array of contexts within RSIs. Traditional methods have tried to increase the spatial receptive field of the backbone network to manage these size variations, typically through the use of large-kernel or dilated convolutions. However, these approaches have their drawbacks: large-kernel convolutions tend to incorporate too much background noise, whereas dilated convolutions might result in features that are too sparsely represented. To overcome these limitations, PKINet utilizes multi-scale convolution kernels that operate without dilation, enabling the efficient feature extraction across different scales and the effective capture of local contexts within the images. Additionally, PKINet incorporates a Context Anchor Attention (CAA) module, designed to capture long-range contextual information essential for precise object detection with RSIs.
Inspired by the innovative framework of PKINet, this work incorporated the concept of the Context Anchor Attention (CAA) mechanism into the YOLO framework, resulting in the proposed C3_CAA module. Due to the significant interference between background information and targets in high-altitude images, traditional object detection methods often struggle to accurately identify targets, especially smaller ones that are easily obscured by the background. To address this issue, we introduced the CAA mechanism into the C3 module, enhancing the ability to capture image details. As shown in Figure 3, this module combines standard convolutional layers with the CAA structure, injecting comprehensive contextual information from both local and broad perspectives into the feature maps. This integration allows the model to better understand the spatial relationships within the image, which is crucial for precise object detection in complex environments.
The CAA mechanism [9] is implemented by concatenating elongated depthwise separable convolutions of 1 × (11 + 2N) and (11 + 2N) × 1, which allows the model to sensitively adapt to important features across different scales, enhancing its sensitivity to the varying sizes of objects in remote sensing images. This approach not only improves the model’s ability to capture details but also effectively reduces computational demands through the use of depthwise separable convolutions. As a result, the C3_CAA module provides YOLO with advanced feature extraction capabilities, significantly improving object detection accuracy, especially in remote sensing applications.

3.3. Parallelized Patch-Aware Attention (PPA)

Xu et al. [10] introduced the Hierarchical Context Fusion Network (HCF-Net), specifically designed to enhance the detection of small objects in infrared images, which are often obscured by unclear contours and complex backgrounds. Traditional methods relying on downsampling face significant challenges with information loss. To address these issues, HCF-Net features several specialized modules, among which the Parallelized Patch-Aware Attention (PPA) module is one of the most crucial. The PPA module employs a multi-branch feature extraction strategy that captures detailed feature information at various scales and levels, effectively preserving essential details that are often lost in the downsampling process.
Inspired by the innovative framework of HCF-Net, this study integrates the PPA attention mechanism into the YOLO framework, introducing the CPA module located at the neck of the YOLO architecture. In high-altitude images, there are numerous objects at various scales, and the features of these objects often resemble those of the background, making it difficult to distinguish between targets and background. This issue becomes particularly challenging when the target is small or the background is complex, which leads to decreased detection accuracy. To address this problem, as shown in Figure 4 and Figure 5, we designed the CPA module, which adopts a multi-branch feature extraction strategy to capture detailed object features at different scales and levels. This approach allows the CPA module to effectively preserve key object details while reducing background interference, thereby enhancing the model’s ability to detect targets in complex environments.
One of the core features of the CPA module is the Patch-Aware mechanism, which operates through multiple parallel feature extraction branches, each handling patches of different sizes, to accommodate different spatial scales. This design not only effectively aggregates and shifts non-overlapping patches to capture global context information but also preserves crucial local details. Specifically, the Patch-Aware mechanism first adjusts the input feature tensor through point-wise convolution, then processes different patch sizes across various branches, and finally combines these results to form a comprehensive feature representation. Furthermore, feature selection is a key component of the Patch-Aware mechanism, optimizing model performance by selecting features most relevant to the task through both token selection and channel selection. This mechanism enhances the model’s ability to recognize and locate small targets by calculating and weighting features based on the cosine similarity between the features and specific task embeddings.
On the other hand, the attention mechanism of the CPA module further enhances feature expression through a series of channel and spatial attention components. By sequentially processing one-dimensional channel attention maps and two-dimensional spatial attention maps, the module not only adjusts the importance of features across channel dimensions but also responds precisely across spatial dimensions. This refined design allows the model to more accurately process features, thus improving the detection accuracy of small targets.

3.4. SI-IoU

The YOLOv5 model utilizes the CIoU loss function for bounding box regression, which, despite its effectiveness, struggles with slow convergence and fails to accommodate changes in target box shapes due to varying drone viewing angles. To tackle this problem, this paper introduces the SI-IoU, a novel IoU calculation technique tailored for drone aerial imagery.
The SI-IoU was designed to improve the precision of bounding box regression and hasten the model’s convergence. Drawing on the ideas from previous papers [11,12], SI-IoU enhances traditional IoU evaluations by considering not just the overlap between bounding boxes but also their shape attributes, such as aspect ratio, to gauge shape similarity more accurately. This method refines shape similarity assessments, increasing the model’s sensitivity to changes in the shape and scale of the targets. Such refinements lead to more-accurate loss calculations in bounding box regression, particularly when the target’s aspect ratio varies. Moreover, SI-IoU boosts IoU loss calculations through the use of auxiliary bounding boxes, whose dimensions can be precisely adjusted with a scale factor ratio ranging from 0.5 to 1.5. This adjustment is crucial for detecting small objects, which are often difficult to identify due to their minimal presence in the visual field. By using a scale factor ratio to modify the size of these auxiliary bounding boxes, SI-IoU greatly enhances the detection sensitivity to small objects. It ensures that even minor discrepancies between the predicted and actual bounding boxes are effectively recognized and corrected, thus achieving more accurate localization. This enhancement is particularly beneficial in scenarios where detecting small objects is essential, offering significant advantages with the application of SI-IoU.
As defined by Equations (1)–(6), the SI-IoU loss function comprises three pivotal elements: IoU inner , d shape , Ω shape .
L S I = 1 IoU inner + d shape + 0.5 × Ω shape
Ω shape = t = w , h 1 e w t θ , θ = 4
d shape = h h × ( x c x c g t ) 2 c 2 + w w × ( y c y c g t ) 2 c 2
IoU inner = inner union
inner = ( min ( b r g t , b r ) max ( b l g t , b l ) ) ×   ( min ( b b g t , b b ) max ( b t g t , b t ) )
union = w g t × h g t × ratio 2 + w × h × ratio 2 inner
Firstly, Ω shape is determined by a weighted sum of the width and height alterations, where each element is influenced by a negative exponential of w t and further weighted by the parameter θ , highlighting how shape variations influence the loss function. Secondly, d shape fuses the width weights w w and height weights h h to compute the difference in distance between the centers of the target and anchor boxes, thereby quantifying the precision of shape matching. The center point of the target and inner target boxes are denoted by ( x c , y c ) , and center point of the anchor and inner anchor by ( x c g t , y c g t ) . The constant c is utilized to normalize or adjust the calculations, maintaining consistency across bounding boxes of different scales. Furthermore, for the calculation methods for width weight and height weight, we referred to paper [11]. Lastly, IoU inner is a specific IoU metric used to calculate the ratio of the intersection area (inner) to the union area (union). When calculating the union area, the ratio acts as a scaling factor, adjusting the bounding box dimensions based on real conditions, with w g t and h g t representing the width and height of the bounding boxes, respectively. The calculation of the intersection area (inner) involves determining the overlapping parts of two bounding boxes in both the horizontal and vertical directions. This requires the use of the left boundary b l g t , the right boundary b r , the top boundary b t g t , and the bottom boundary b b of the target box and the anchor box. These boundary coordinates are used to calculate the maximum overlapping area between the two bounding boxes in each dimension, thus calculating the intersection area. Additionally, for the calculation methods for b l g t , b r , b t g t , and b b , refer to paper [12].

4. Experiment Settings

In this section, we introduce the four representative and diverse UAV image datasets used in this experiment: the VisDrone2019-DET dataset [5], the UAVDT dataset [25], the CARPK dataset [26], the UAV-ROD dataset [27], and the UTUAV Urban Traffic dataset [28]. We also describe the experimental setup and the evaluation metrics used for assessment.

4.1. Datasets

The VisDrone2019-DET dataset is used for object detection based on visual data acquired from drones. This dataset contains 10,209 static images, with the training set comprising 6471 images, the validation set 548 images, and the test set 3190 images. It includes ten categories: pedestrian, person, car, van, bus, truck, motor, bicycle, awning-tricycle, and tricycle. Some categories and distant objects have very small bounding boxes. The resolution is approximately 2000 × 1500 pixels.
The UAVDT dataset, collected from urban areas by drones, covers a wide range of weather conditions and flight altitudes, making it a challenging computer vision benchmark for object detection. This dataset consists of 25,137 training images and 15,598 test images, including three categories: car, truck, and bus. The average resolution of the frames is 1080 × 540 pixels.
The CARPK dataset is the largest parking lot dataset collected by drones, containing approximately 90,000 car annotations from four different parking lots. Each car in the dataset is annotated with bounding boxes, with the maximum number of cars in a single scene being 188. We used 989 images as the training set and 459 images as the test set. The frame resolution is 1280 × 720 pixels.
The UAV-ROD dataset is a drone-based vehicle detection dataset covering traffic sections and parking lots, with each car annotated by bounding boxes. The maximum number of cars in a single scene is 75. We used 1150 images as the training set and 427 images as the test set. The frame resolution is 2720 × 1530 pixels.
The UTUAV Urban Traffic dataset is a drone-based dataset captured from three different scenes in Medellín, the second largest city in Colombia. It includes road user classes representative of emerging countries like Colombia, specifically motorcycles (MCs), light vehicles (LVs), and heavy vehicles (HVs). The UTUAV-B dataset used in this study was a subset of the UTUAV dataset, consisting of 6500 labeled images captured from a top-view angle at an approximate height of 100 m. The images have a resolution of 3840 × 2160 pixels (4 K), with minimal turbulence or camera movement. Since the dataset does not provide predefined splits for training, validation, and testing, we he manually divided the images into a 6:3:1 ratio for training, validation, and testing, respectively, to facilitate model training and evaluation.

4.2. Network Training

The network training for this project was conducted on an experimental and development platform established on Ubuntu 22.04.4LTS. The CPU was equipped with the 10th-generation Intel Core i9-10850k CPU with a running frequency of up to 5.20 GHz. The GPU was furnished with an NVIDIA GeForce RTX 3090 with 24 GB of VRAM. Additionally, the CUDA framework used in this work operated under the well-known version 11.3. The Python version utilized was 3.8, and the deep learning framework employed was PyTorch 1.10.0.
For model training, we used a batch size of 16 and trained the network for 200 epochs. The Adam optimizer was employed with a learning rate of 0.001. To account for the varying resolutions of the datasets used, all images were resized to 640 × 640 pixels to maintain consistency in the input dimensions across the training process. Additionally, the model’s performance was validated using the same resizing technique to ensure consistent evaluation conditions.

4.3. Evaluation Metrics

The evaluation metrics utilized for measuring the performance of the detection and classification model included mAP@0.5, mAP@0.5:0.95, precision, and recall. The corresponding formulas for these metrics are outlined as follows:
P = T P T P + F P
Precision is defined as the proportion of true positives in the total number of instances identified as positive by the model. This metric is derived by calculating the number of true positives (TPs), which are the correctly identified positives, and the number of false positives (FPs), which are negatives that have been incorrectly labeled as positives.
R = T P T P + F N
Recall quantifies the proportion of true positives detected by the model out of the total actual positives available in the dataset. This metric is calculated by dividing the number of true positives by the total of true positives and false negatives (FNs), where false negatives represent positive instances that were incorrectly labeled as negatives.
m A P = i = 1 n A P i n
Mean average precision (mAP) is a comprehensive metric used to evaluate the aggregate performance of a model by incorporating both precision and recall across all categories. It is determined by averaging the average precision (AP) for each class, referred to as APi for class i. The mAP@0.5 metric computes this average at an Intersection over Union (IoU) threshold of 0.5. Meanwhile, the mAP@0.5:0.95 is calculated by averaging the mAP values at IoU thresholds ranging from 0.5 to 0.95, in increments of 0.05.

5. Experiments

In this section, we provide a detailed analysis of the improved modules and the refined model. Firstly, we adjusted the ratio values to assess their impact on the performance of the improved IoU. Next, we compared the loss of the improved IoU with that of the baseline IoU. Then, we compared the enhanced SI-IoU with the original IoU of YOLOv5 and its variants, such as Shape-IoU and Inner-IoU. Subsequently, after integrating all the improvement modules into the model, we performed a detailed performance comparison with YOLOv5s. Additionally, we further compared the improved model with other recent models. Lastly, we conducted detailed ablation studies on the refined model to verify the effectiveness of the enhancement strategies. We also visualized the detection results to provide a detailed analysis of the performance improvements in the refined model, particularly emphasizing its enhanced capability to accurately identify small objects.

5.1. Impact of Ratio Value Adjustment on IoU Performance

In this work, we conducted an in-depth analysis of the enhanced model. The first step in the experiment was adjusting the ratio to alter the bounding box size, with the aim of determining the optimal bounding box size for small-object detection scenarios. Specifically, we explored the impact of different ratios on the bounding box in order to identify the best ratio that allowed the box to precisely enclose small targets while effectively minimizing excessive background interference. In small-object detection tasks, the size of the bounding box directly affects the model’s detection accuracy. Therefore, by adjusting the ratio to optimize the bounding box size, we can better accommodate the scale variations in targets, particularly in complex flight angles and high-object-density environments.
As shown in Figure 6, the model’s performance (mAP@0.5) varies with ratios between 0.5 and 1.5. The graph illustrates that the highest performance is achieved at a ratio of 0.8. This optimal point suggests that slightly reducing the bounding box size below the true object size improves detection accuracy. This is because a smaller box allows the model to focus more precisely on the target, reducing background noise and irrelevant features. Ratios less than 1.0 tend to effectively isolate smaller objects, enhancing detection accuracy. However, when the ratio exceeds 1.0, the model starts to include too much surrounding context, which reduces precision and increases the number of false positives. This observation underscores the importance of fine-tuning the bounding box size to strike the right balance between isolating the target and considering relevant context. In summary, the ratio value significantly influences the model’s ability to focus on small objects, and finding the optimal ratio is crucial for improving detection accuracy in UAV imagery.

5.2. Comparison of IoU Loss

Secondly, we analyzed the box loss comparison between SI-IoU and the baseline IoU throughout the training process. Figure 7 illustrates this comparison: the solid red line signifies the SI-IoU loss, the solid blue line depicts the baseline IoU loss, and the red dashed line shows where both IoUs start with the same initial loss. After undergoing 200 training epochs, the loss for SI-IoU demonstrates a greater reduction compared to the baseline IoU, indicating faster convergence. This outcome confirms that SI-IoU offers enhanced convergence rates and improved precision. The findings suggest that SI-IoU substantially boosts the accuracy of bounding box positioning, streamlining loss reduction effectively and thus improving performance in complex object detection scenarios.

5.3. Comparison of SI-IoU with Other Advanced IoUs on the VisDrone2019 Dataset

This work also conducted a comprehensive comparison between the enhanced SI-IoU and a variety of existing IoUs using the VisDrone2019 dataset. The evaluation was carried out using the improved baseline model, YOLOv5s, as the framework. The results, as depicted in Table 1, demonstrate that the SI-IoU consistently outperforms the other IoU metrics across several key performance indicators including precision, recall, and mAP (mean average precision) at different IoU thresholds. Specifically, SI-IoU achieves the highest precision of 0.448 and recall of 0.331, which translates to an mAP50 of 32.4% and an mAP50-95 of 17.3%. These metrics indicate a significant improvement in detecting and localizing objects more accurately and reliably in drone-captured images compared to traditional IoU metrics like C-IoU, Inner-IoU variations, and Shape-IoU.
The superior performance of SI-IoU can be attributed to its ability to account for shape and scale variations more effectively. This makes it particularly well suited for applications involving drone imagery where object shapes and sizes can vary significantly. The results highlight the potential of SI-IoU to enhance the robustness and accuracy of object detection models in real-world scenarios, especially in complex environments captured by drones. In summary, the experimental findings underscore the efficacy of SI-IoU as a promising metric for improving object detection performance, offering significant advantages over conventional IoU metrics in surveillance and other UAV-based applications.

5.4. Comparison of ST-YOLO to State-of-the-Art Methods on the VisDrone2019 Dataset

On the VisDrone2019-DET dataset, this work compared ST-YOLO with several advanced detection methods. Table 2 and Figure 8 show the comparison results of ST-YOLO with other advanced detection methods in terms of mAP50, mAP50:95, parameters, and GFLOPs. Compared to advanced two-stage detection models like SSD, DetNet, RefineDet, EfficientDet, RetinaNet, Faster-RCNN, and Center-Net, ST-YOLO performs better in accuracy, model parameter size, and GFLOPs. Although the accuracy of ST-YOLO is slightly lower than CornerNet, Cascade RCNN, TOOD, ATSS, and Double-Head R-CNN, these two-stage models have three times more parameters and GFLOPs than ST-YOLO, giving our model a greater advantage in practical applications when considering GFLOPs and parameters.
Compared to advanced single-stage detection models in the YOLO series, ST-YOLO surpasses most existing YOLO models in terms of accuracy and parameter metrics. Although the accuracy of ST-YOLO is 3% and 1.2% lower than TPH-YOLO and YOLOv5m, respectively, TPH-YOLO and YOLOv5m have seven times and twice the parameters and GFLOPs of ST-YOLO. When compared to the advanced YOLOv8s, our accuracy is 0.9% lower, but our GFLOPs are 30% smaller. Additionally, TPH-YOLO includes multiple transformers in the downsampling part, which significantly reduce its inference speed, making it difficult to implement in practical real-time UAV object detection applications.

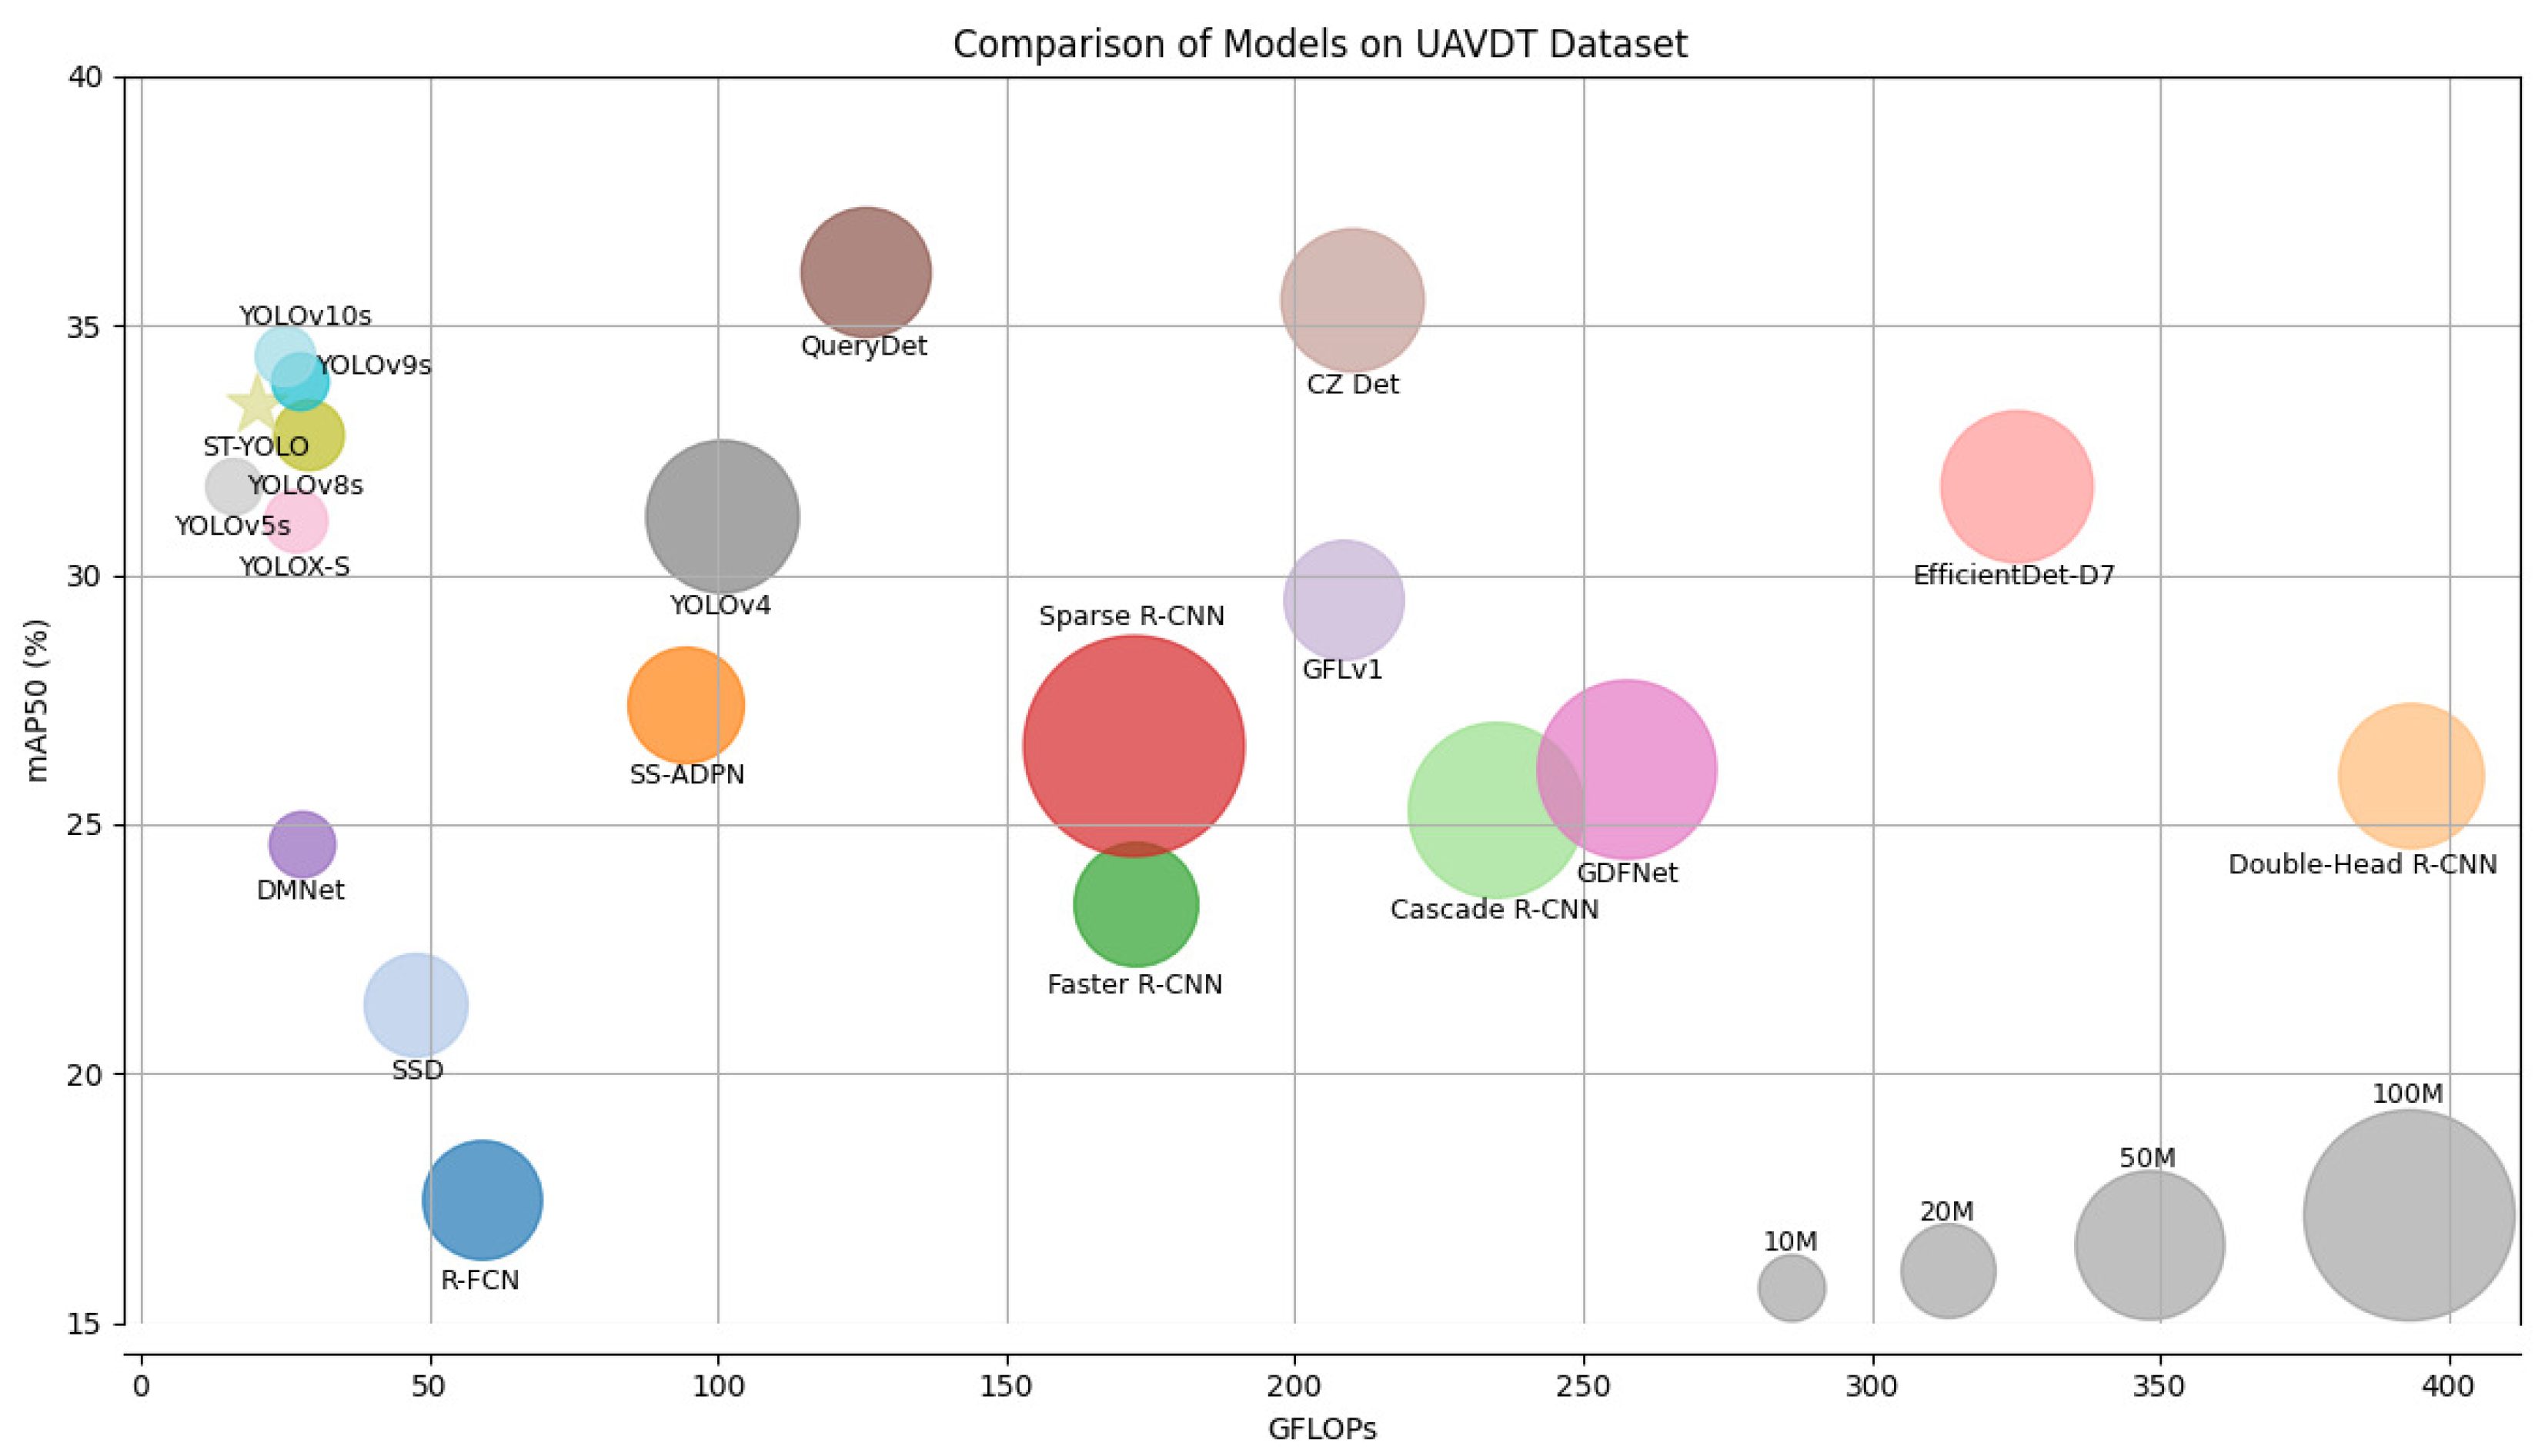
5.5. Comparison of ST-YOLO to State-of-the-Art Methods on the UAVDT Dataset

On the UAVDT dataset, this work compared ST-YOLO with several advanced detection methods. Table 3 and Figure 9 show the comparison results of ST-YOLO with other advanced detection methods in terms of mAP50. The experimental results indicate that ST-YOLO surpasses most two-stage and one-stage object detection models on the UAVDT dataset. Compared to the latest one-stage object detection models YOLOv8s, ST-YOLO achieves a 0.6% higher accuracy with fewer parameters and GFLOPs. Although our model’s accuracy is slightly lower than QueryDet and CZ Det, considering that our model has significantly fewer parameters and GFLOPs and that the model size and inference speed of two-stage detectors like QueryDet and CZ Det are not suitable for real-time UAV object detection, our model is superior in overall metrics, making it more suitable for real-time UAV object detection.

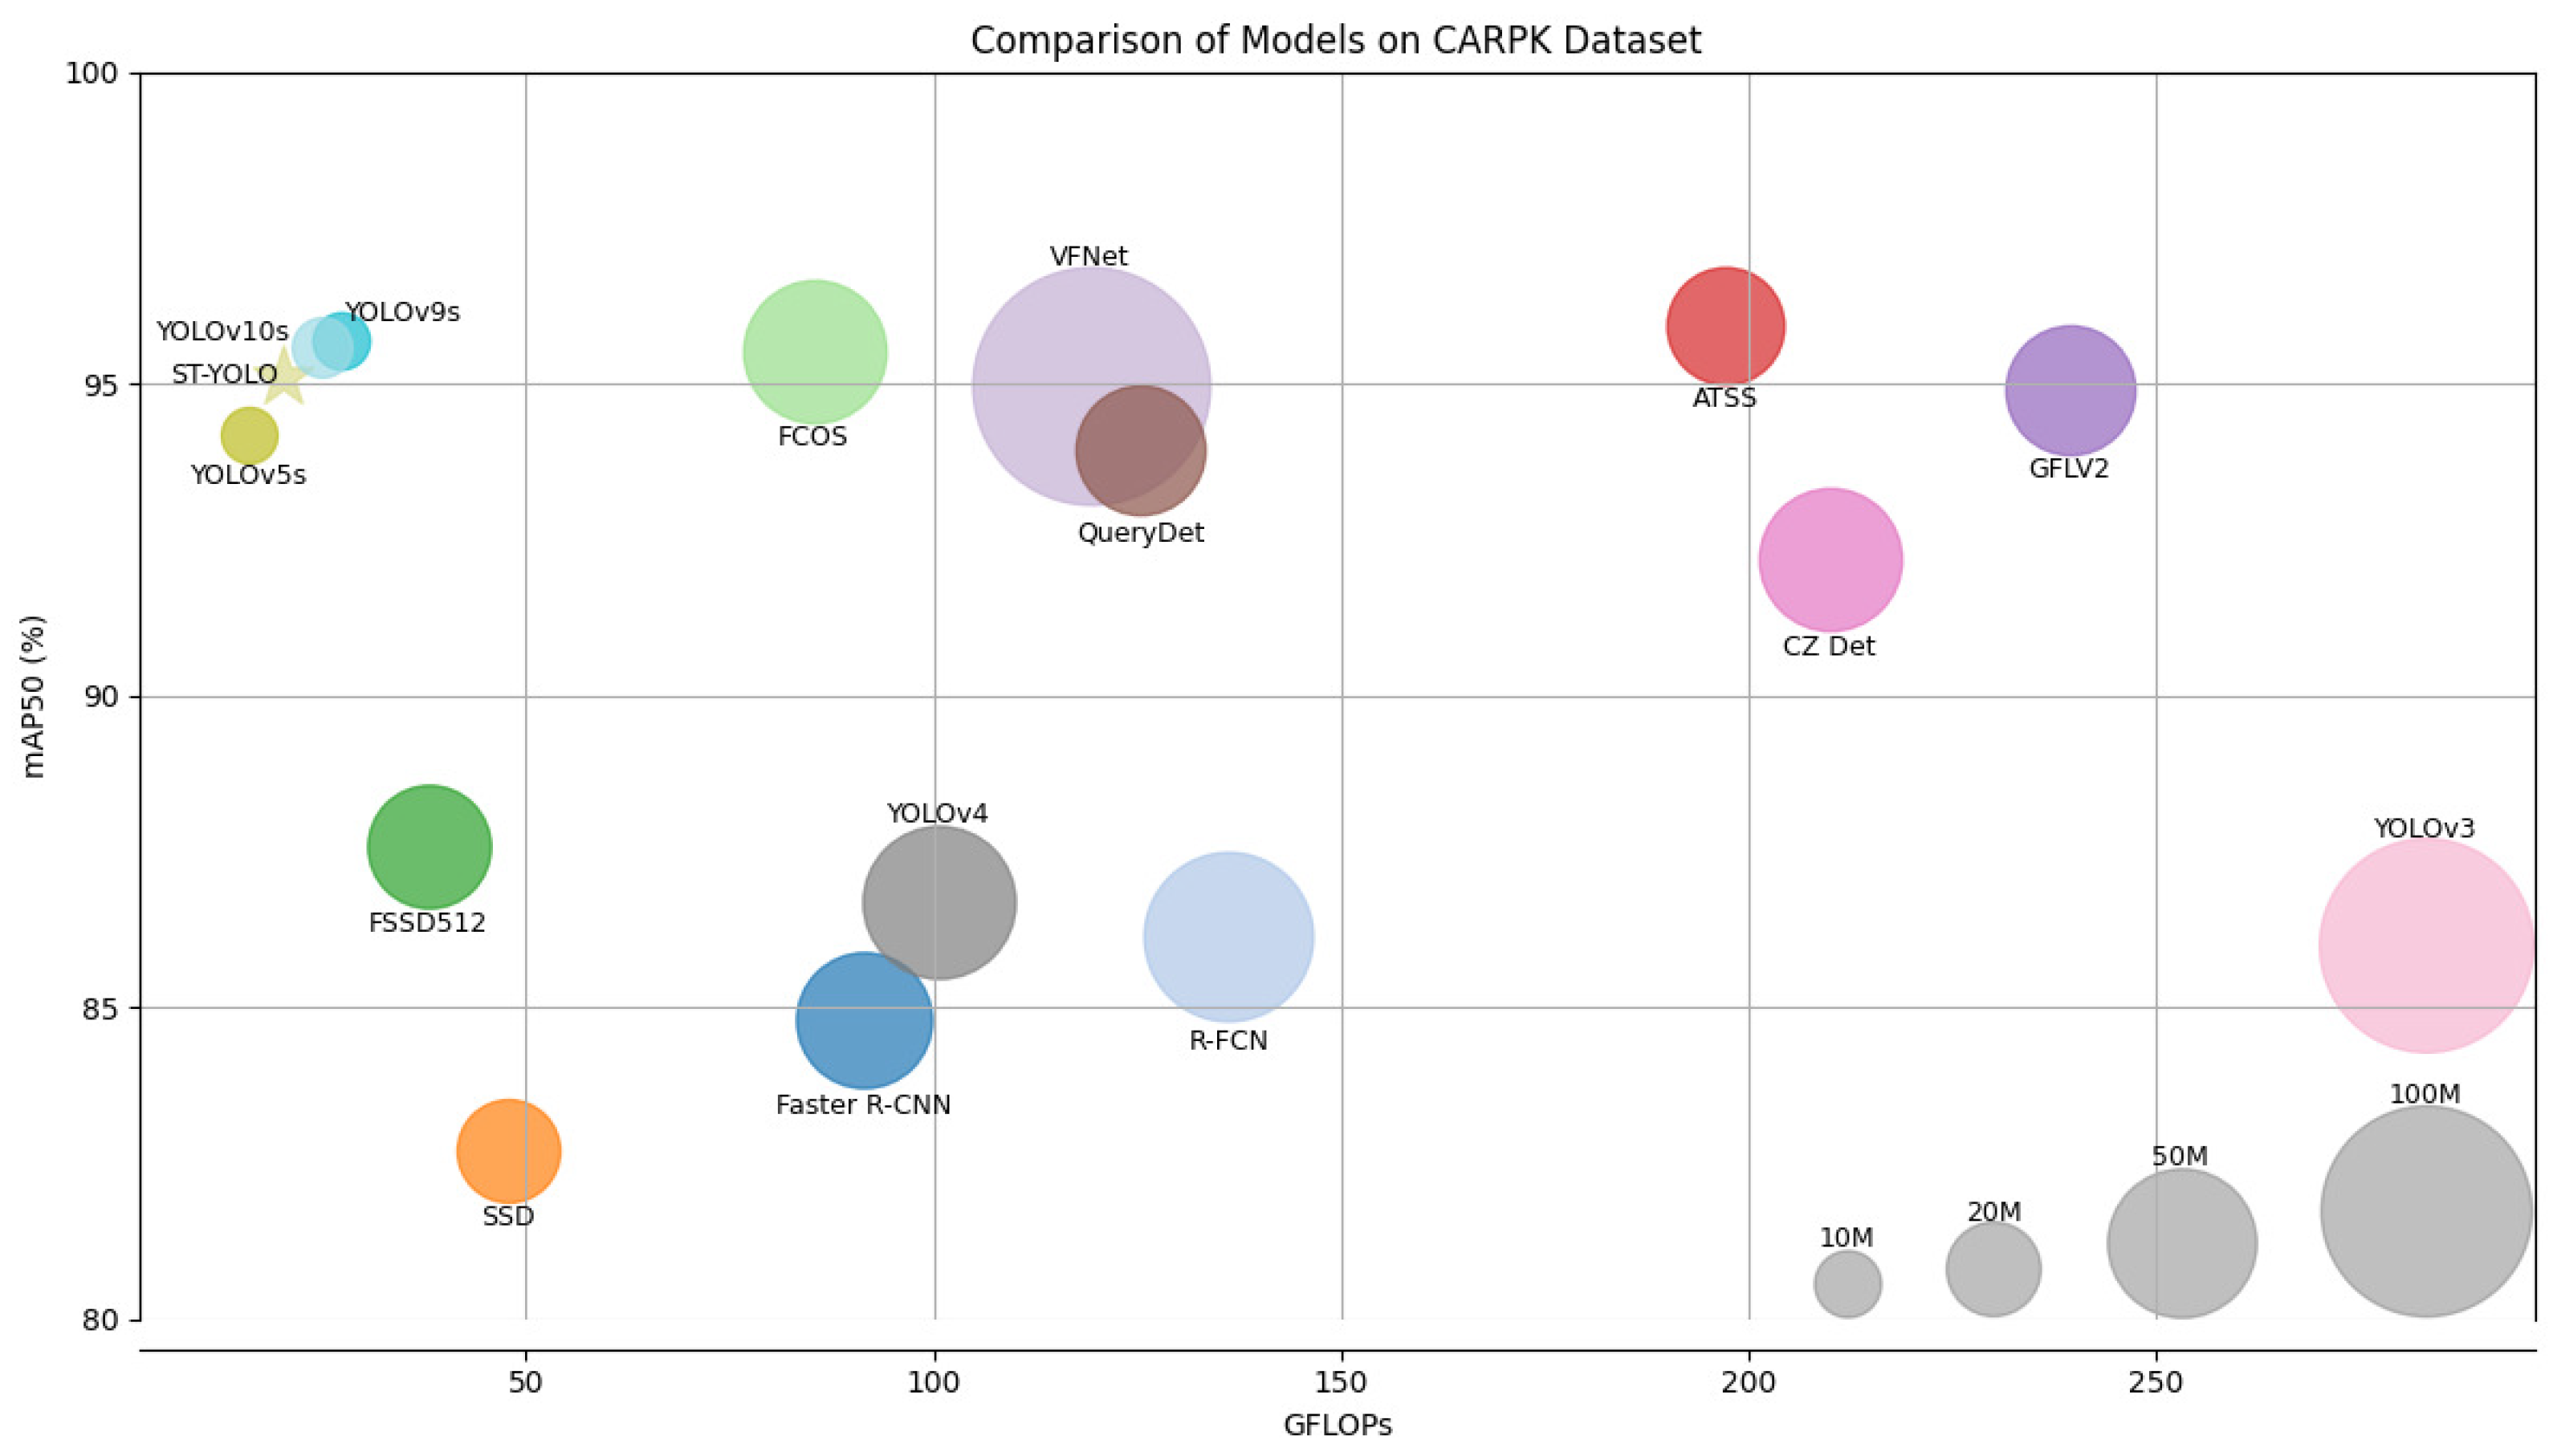
5.6. Comparison of ST-YOLO to State-of-the-Art Methods on the CARPK Dataset

On the CARPK dataset, we compared ST-YOLO with multiple state-of-the-art detection methods. Table 4 and Figure 10 show the comparison results of ST-YOLO with other advanced methods in terms of mAP50, GFLOPs, and parameters. Compared to the classical two-stage model Faster R-CNN, our method achieves 10.3% higher accuracy while having more than four times fewer parameters and GFLOPs. Compared to advanced detection methods like R-FCN, SSD, FSSD512, GFLV2, VFNet, QueryDet, and CZ Det, our method achieves the highest detection accuracy while maintaining very low parameters and GFLOPs. Although our accuracy is 0.4% and 0.8% lower than FCOS and ATSS, respectively, considering our parameters and GFLOPs are more than three times smaller than FCOS and ATSS, ST-YOLO achieves a good balance between model size, running speed, and accuracy. Compared to one-stage detection models, our model surpasses most existing YOLO models in accuracy. Additionally, on the CARPK dataset, the accuracy of our method was 0.9% higher compared to that of the baseline.

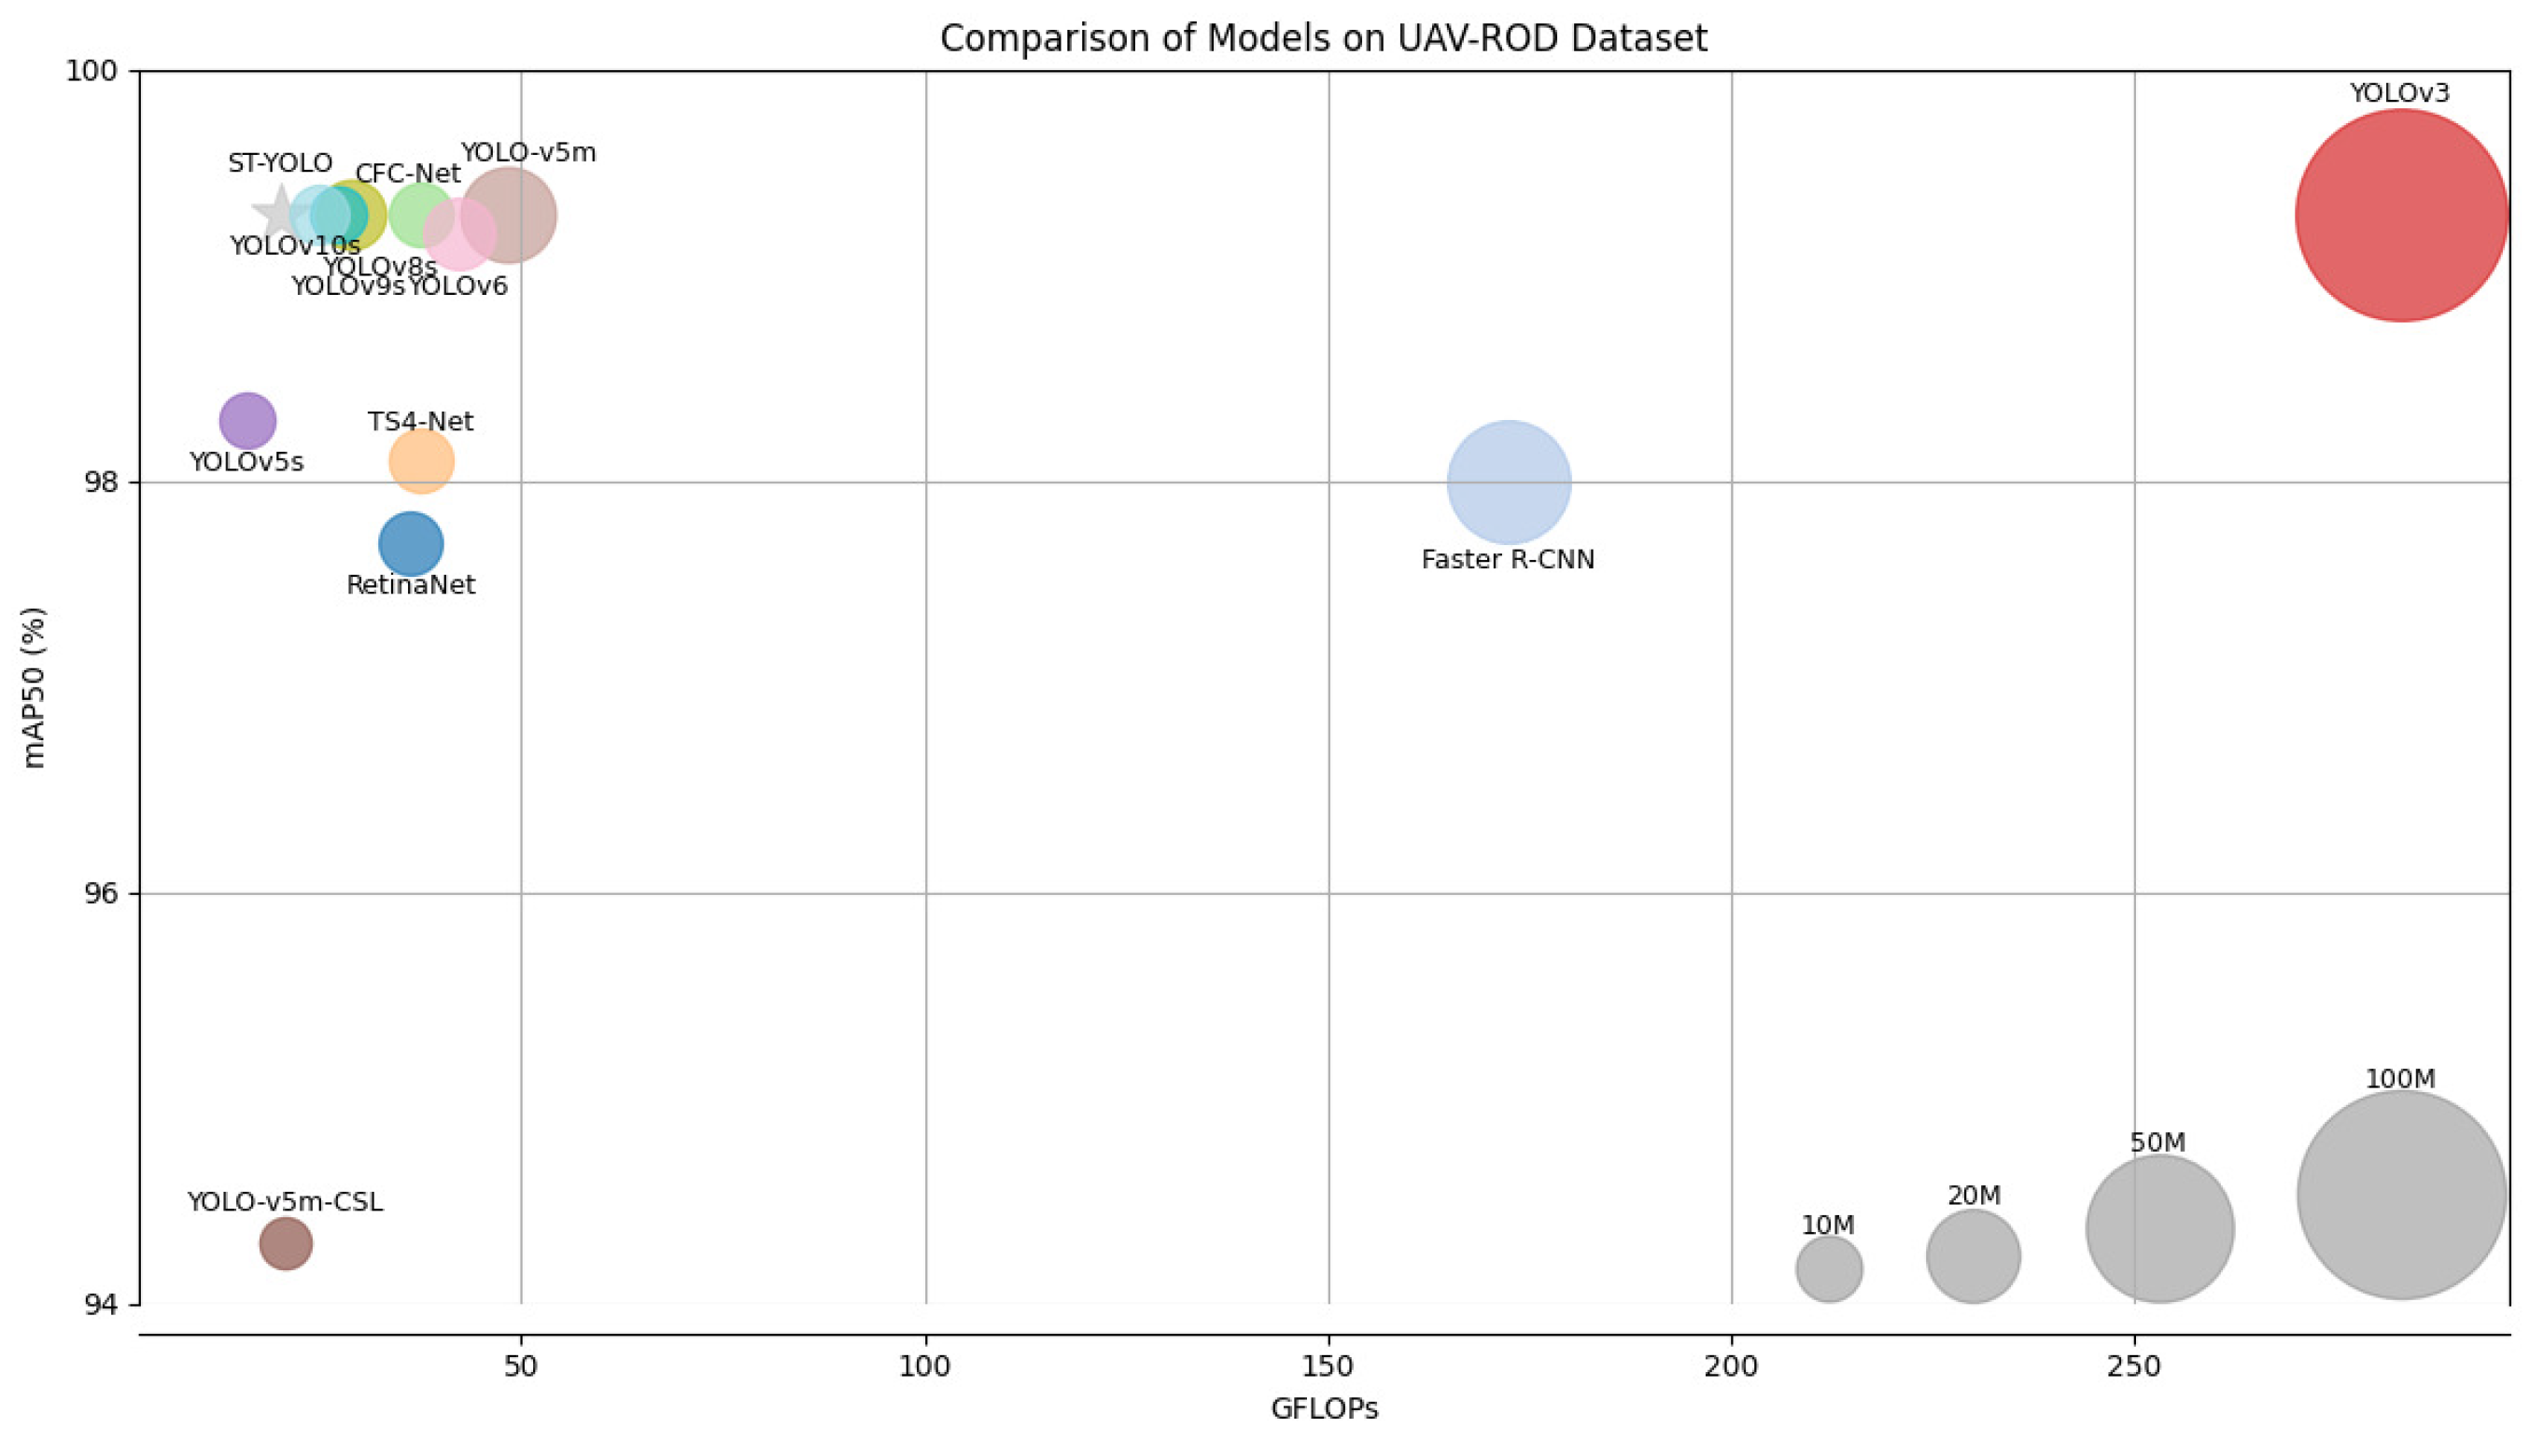
5.7. Comparison of ST-YOLO to State-of-the-Art Methods on the UAV-ROD Dataset

On the UAV-ROD dataset, this work compared ST-YOLO with multiple advanced detection methods. Table 5 and Figure 11 show the comparison results of ST-YOLO with the other advanced methods in terms of mAP50, GFLOPs, and parameters. Compared to the classical two-stage model Faster R-CNN, our method achieves 1.3% higher accuracy while having more than four times fewer parameters and GFLOPs. Compared to the advanced one-stage object detection model YOLOv8s, ST-YOLO reduces GFLOPs by 25% while maintaining the same mAP50 accuracy. Compared to advanced detection methods like RetinaNet, TS4-Net, CFC-Net, YOLOv5m-CSL, YOLOv5m, and YOLOv3, our method not only achieves the highest detection accuracy but also maintains very low parameters and GFLOPs.

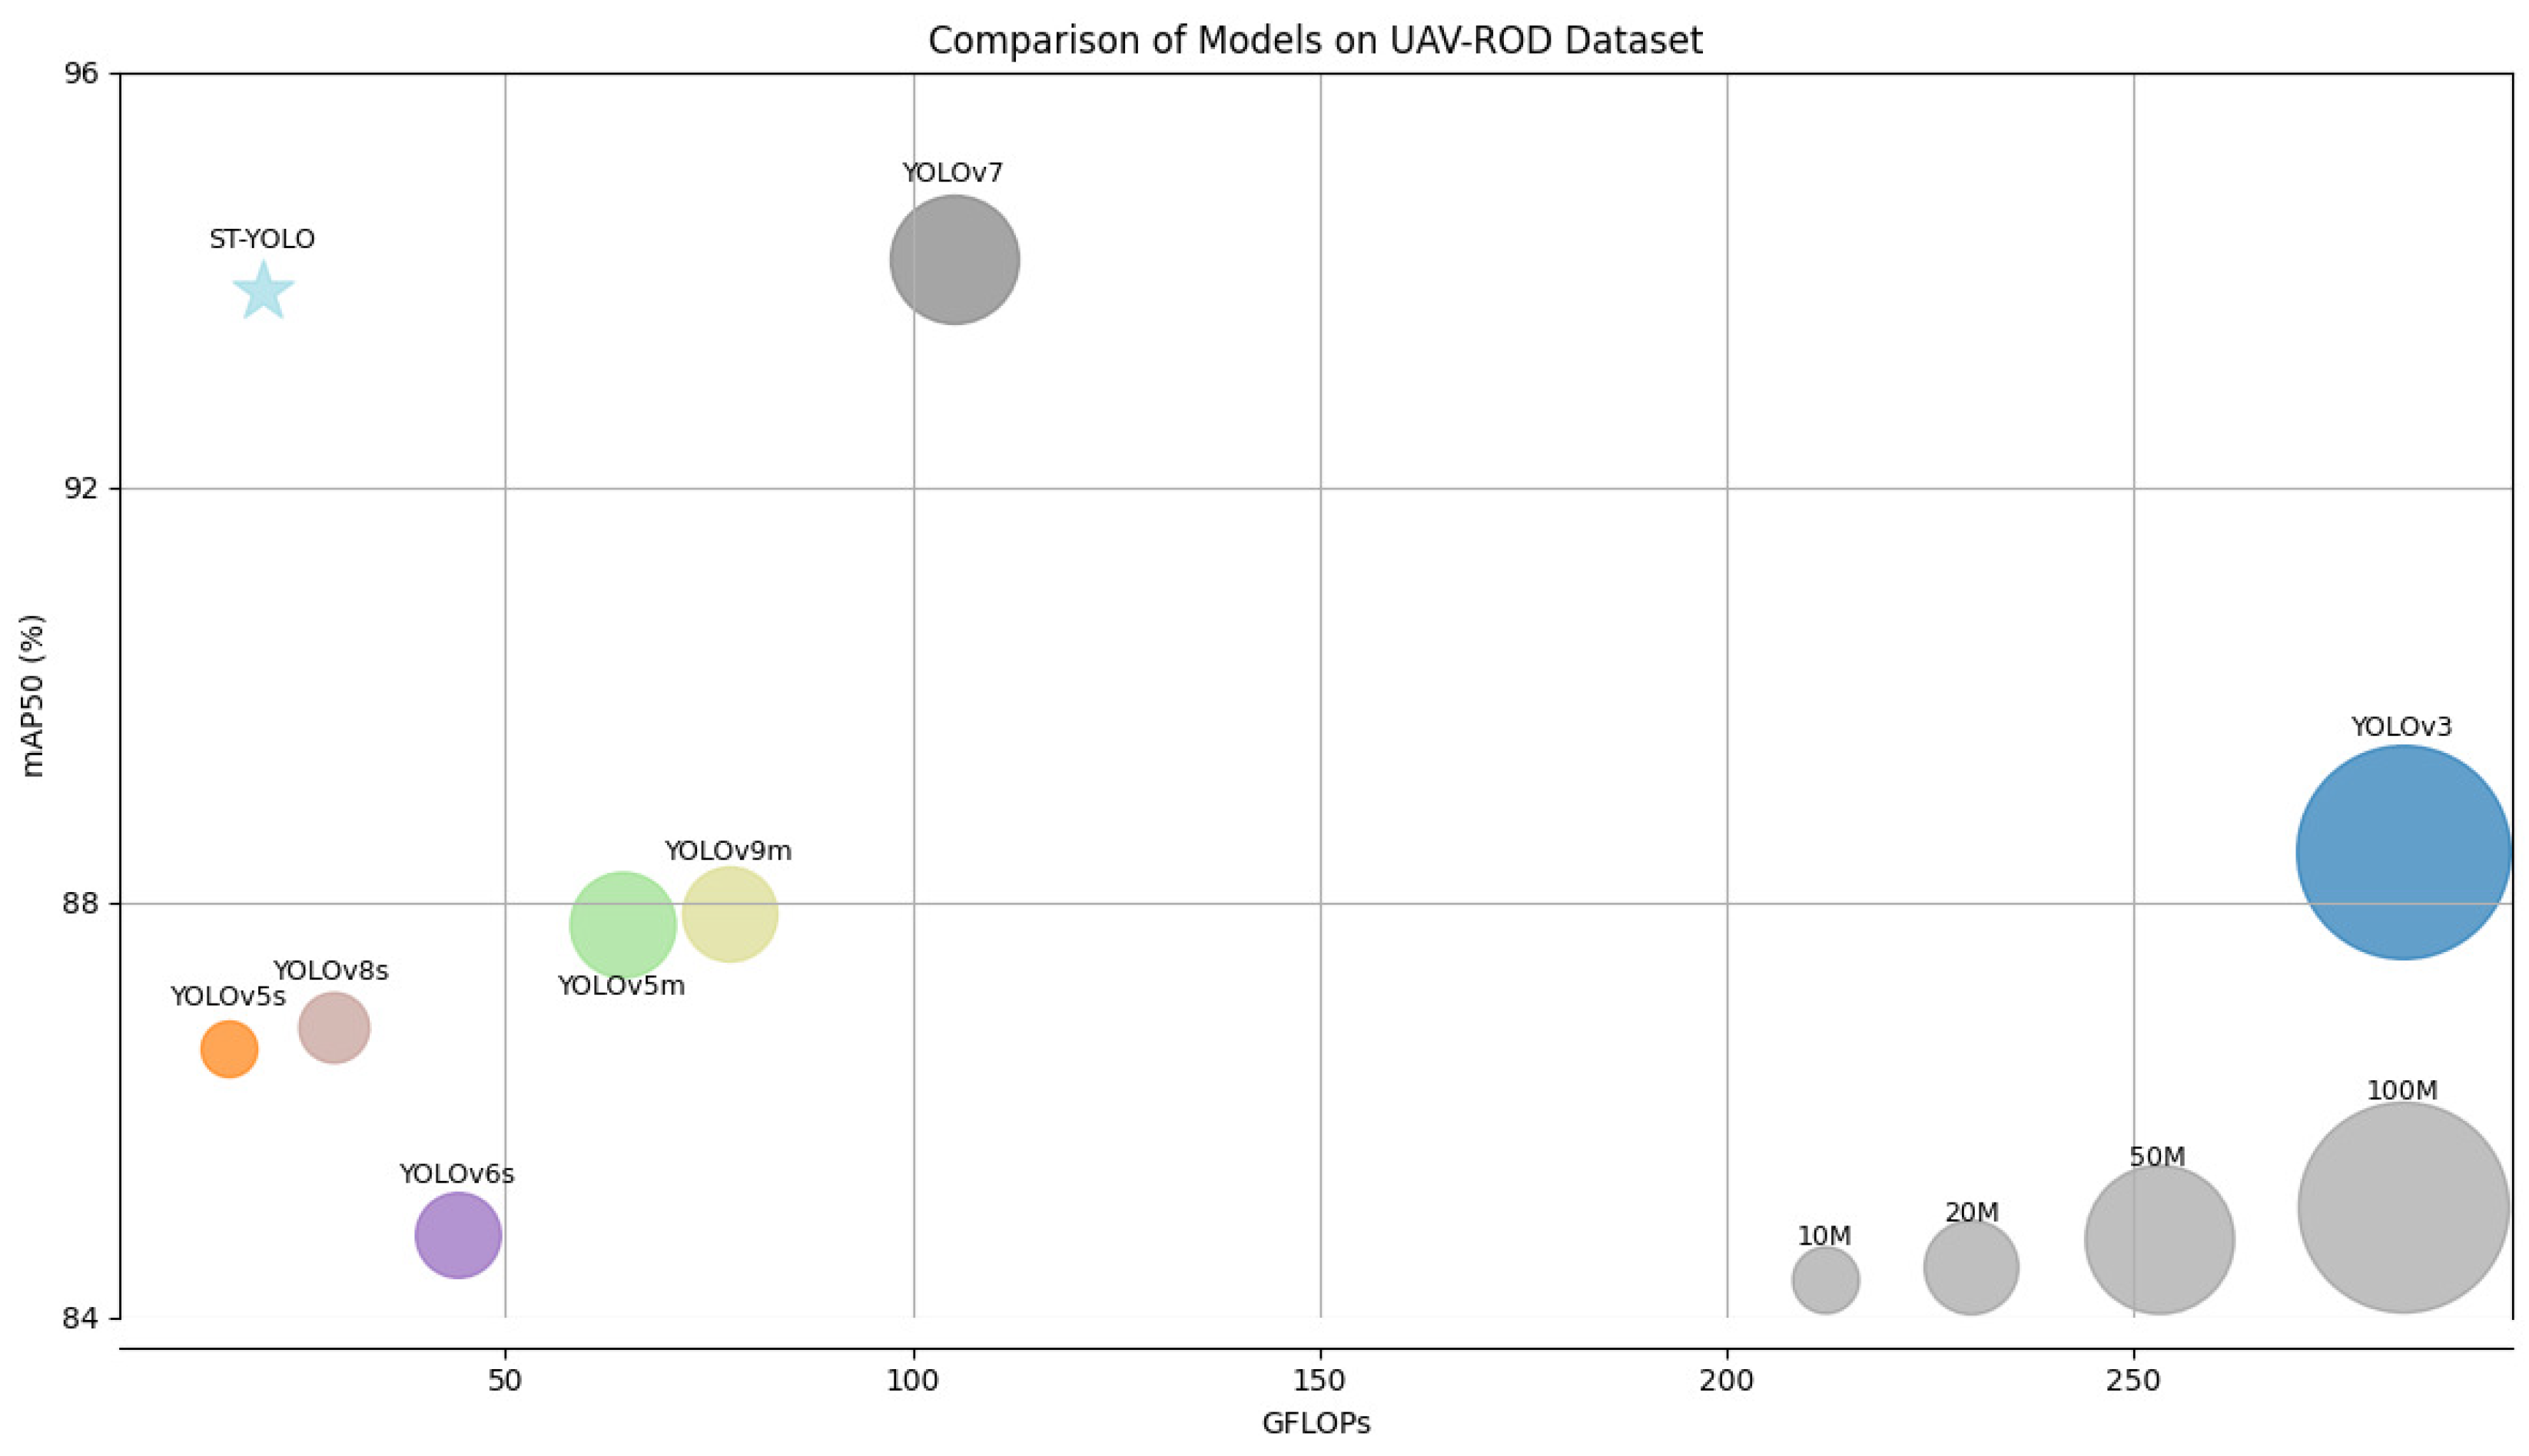
5.8. Comparison of ST-YOLO to State-of-the-Art Methods on the UTUAV-B Dataset

On the UTUAV-B dataset, this study compared ST-YOLO with several advanced detection methods. Table 6 and Figure 12 present the comparison results of ST-YOLO with the other state-of-the-art methods in terms of mAP50, GFLOPs, and parameters. Compared to advanced detection methods like YOLOv3, YOLOv5s, YOLOv5m, YOLOv6s, YOLOv8s, and YOLOv9m, our method not only achieves the highest detection accuracy but also maintains very low values for both parameters and GFLOPs. Although our accuracy is 0.3% lower than that of YOLOv7, our GFLOPs is only one-fifth of its value, and the number of parameters is only one-quarter of YOLOv7. This demonstrates that our method significantly reduces computational complexity while maintaining high accuracy.
As demonstrated on the VisDrone2019, UAVDT, CARPK, UAV-ROD, and UTUAV-B datasets, the proposed ST-YOLO shows competitive overall performance compared to other state-of-the-art methods, validating the effectiveness and versatility of our approach.

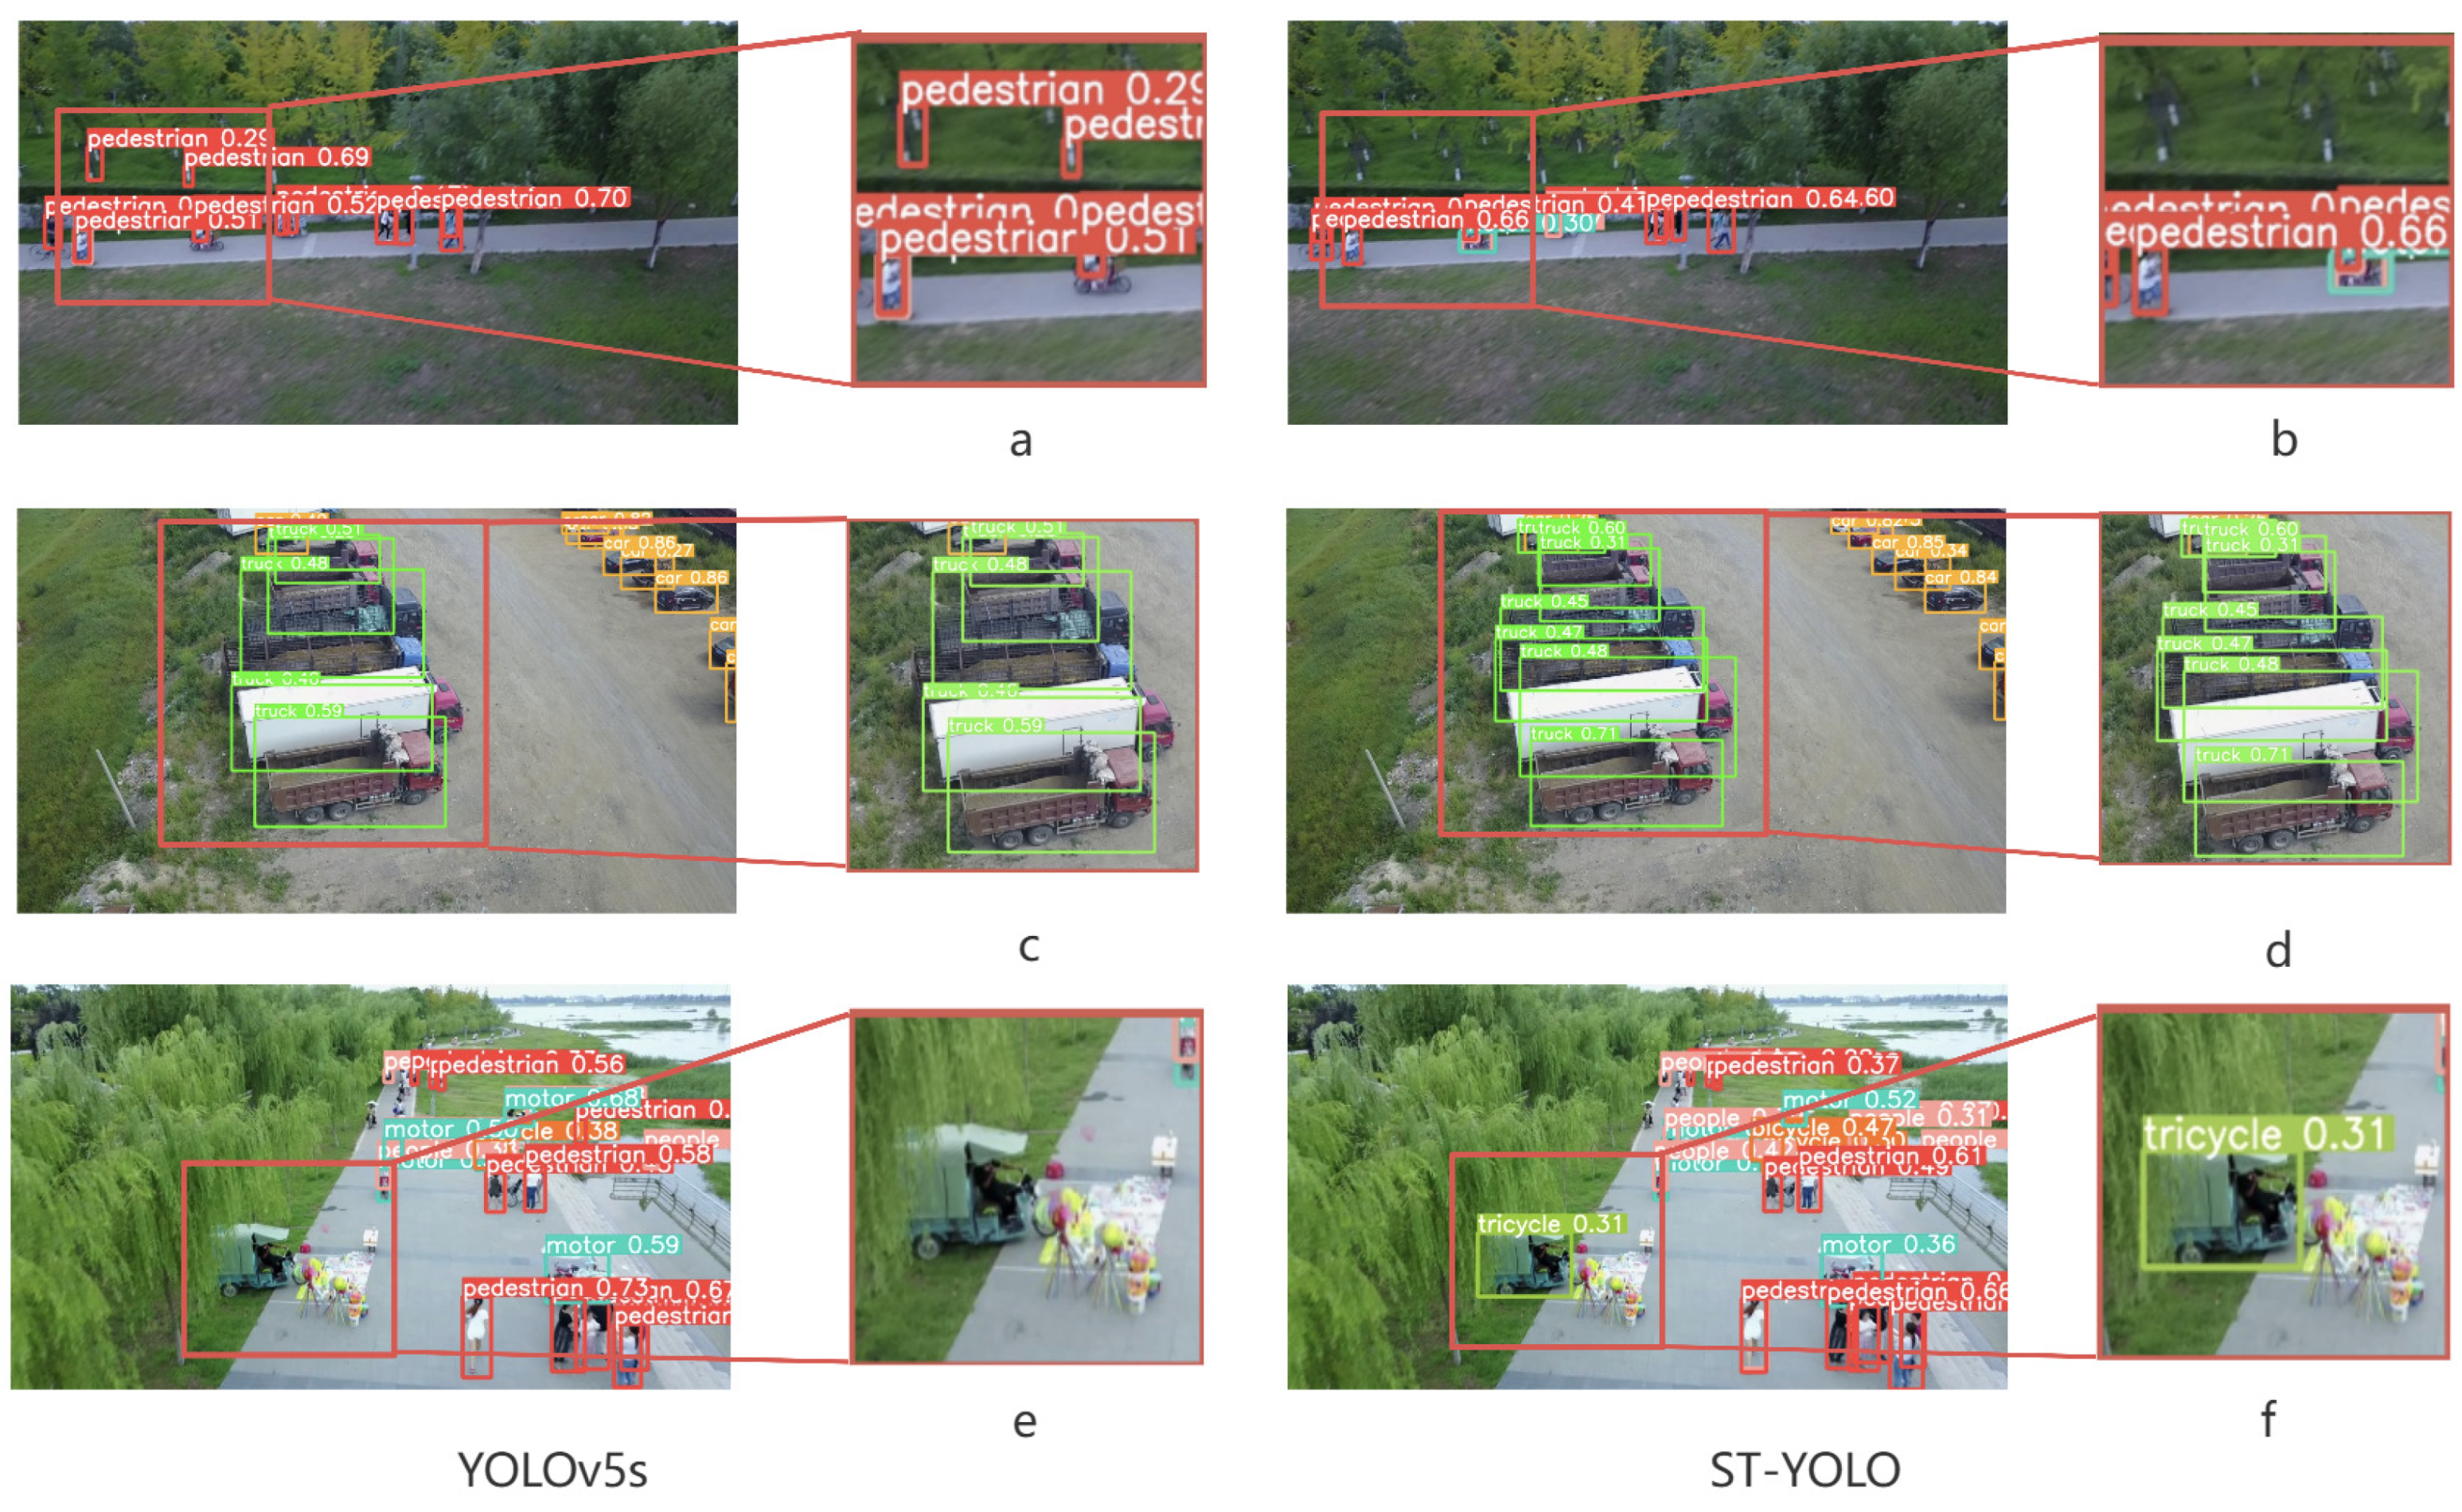
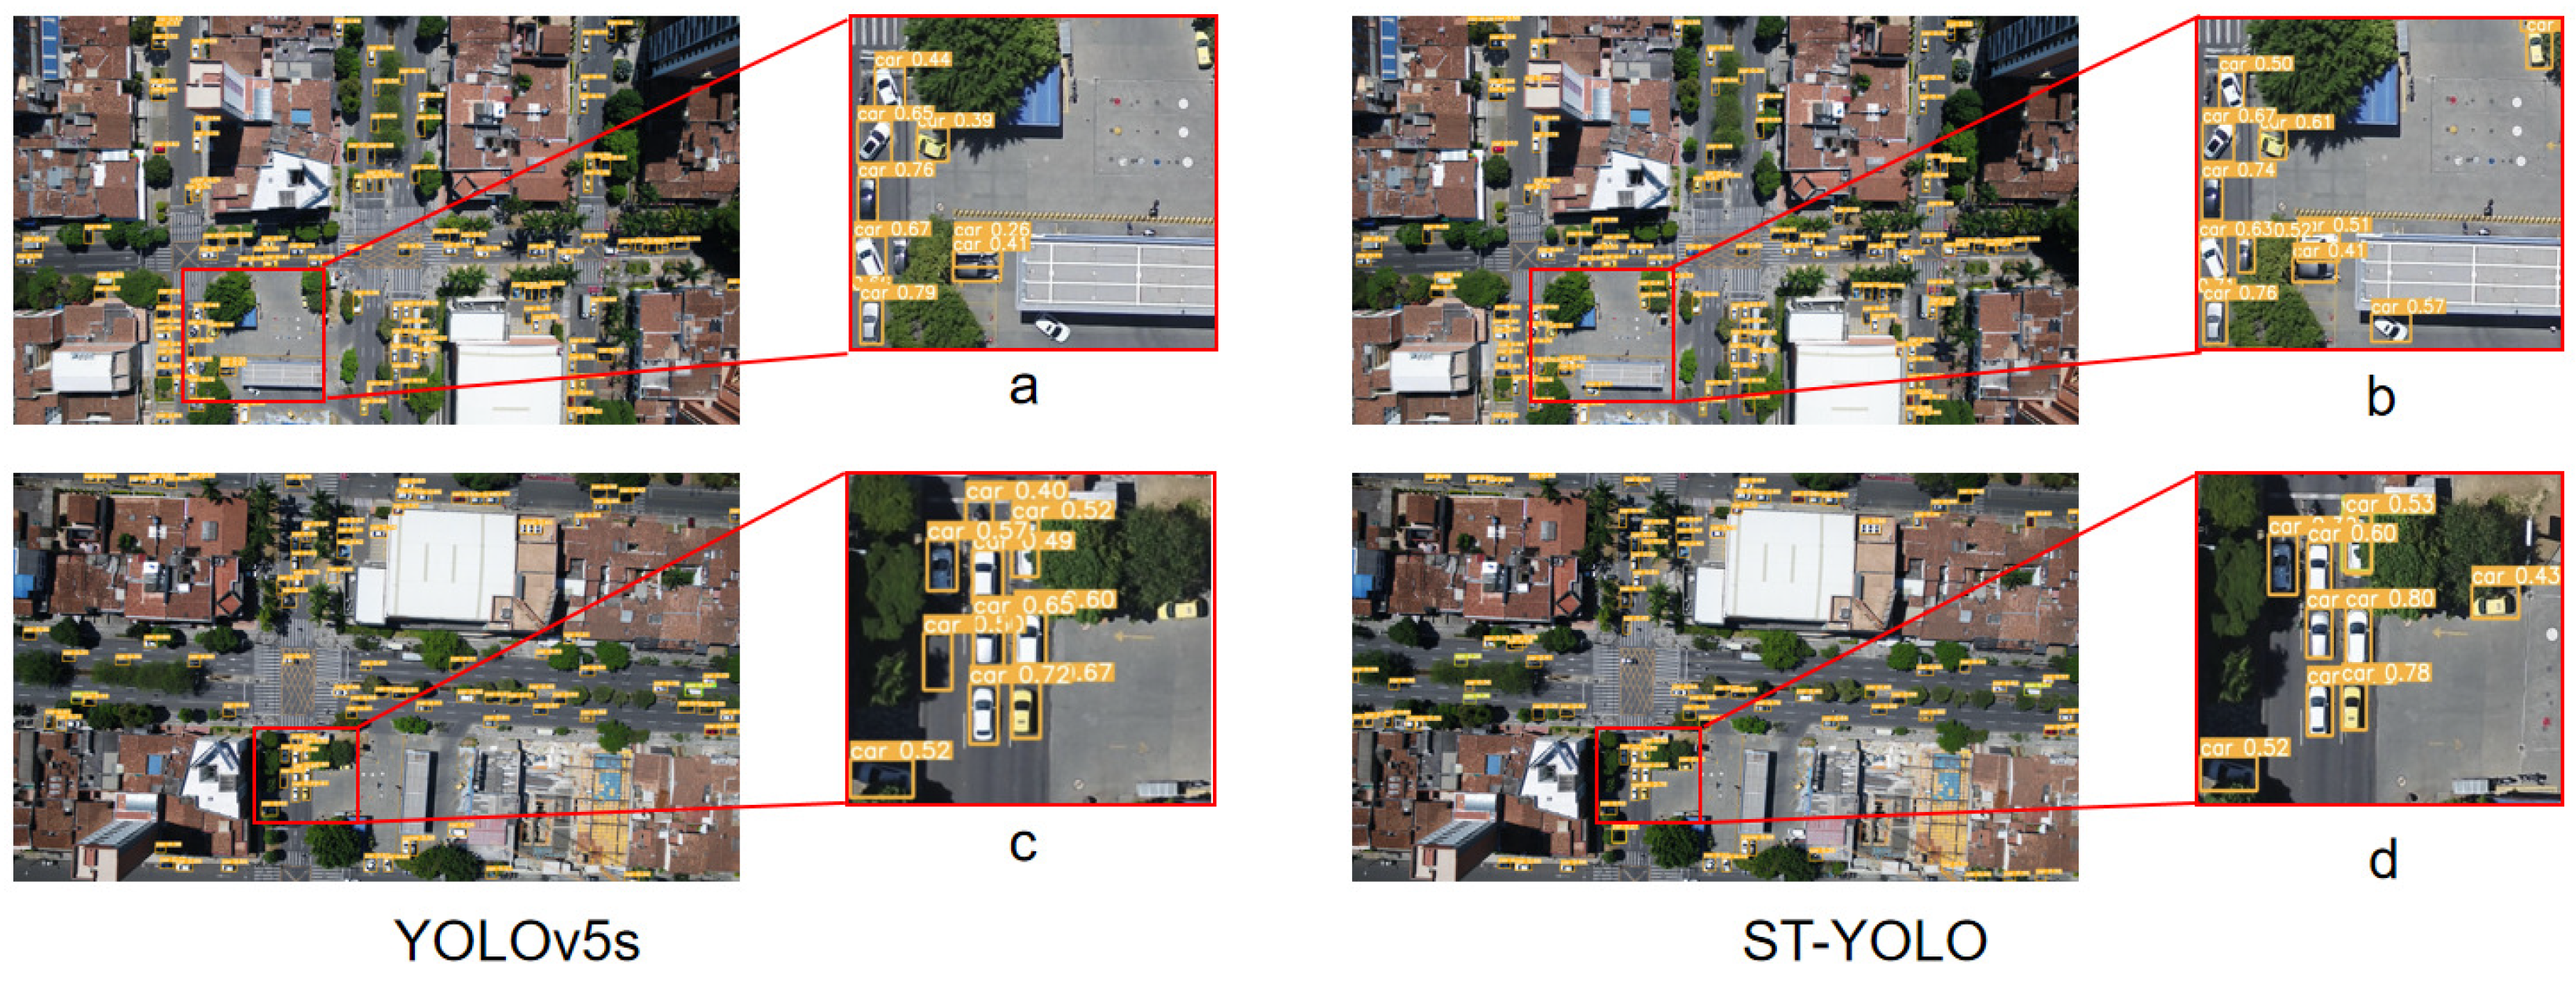
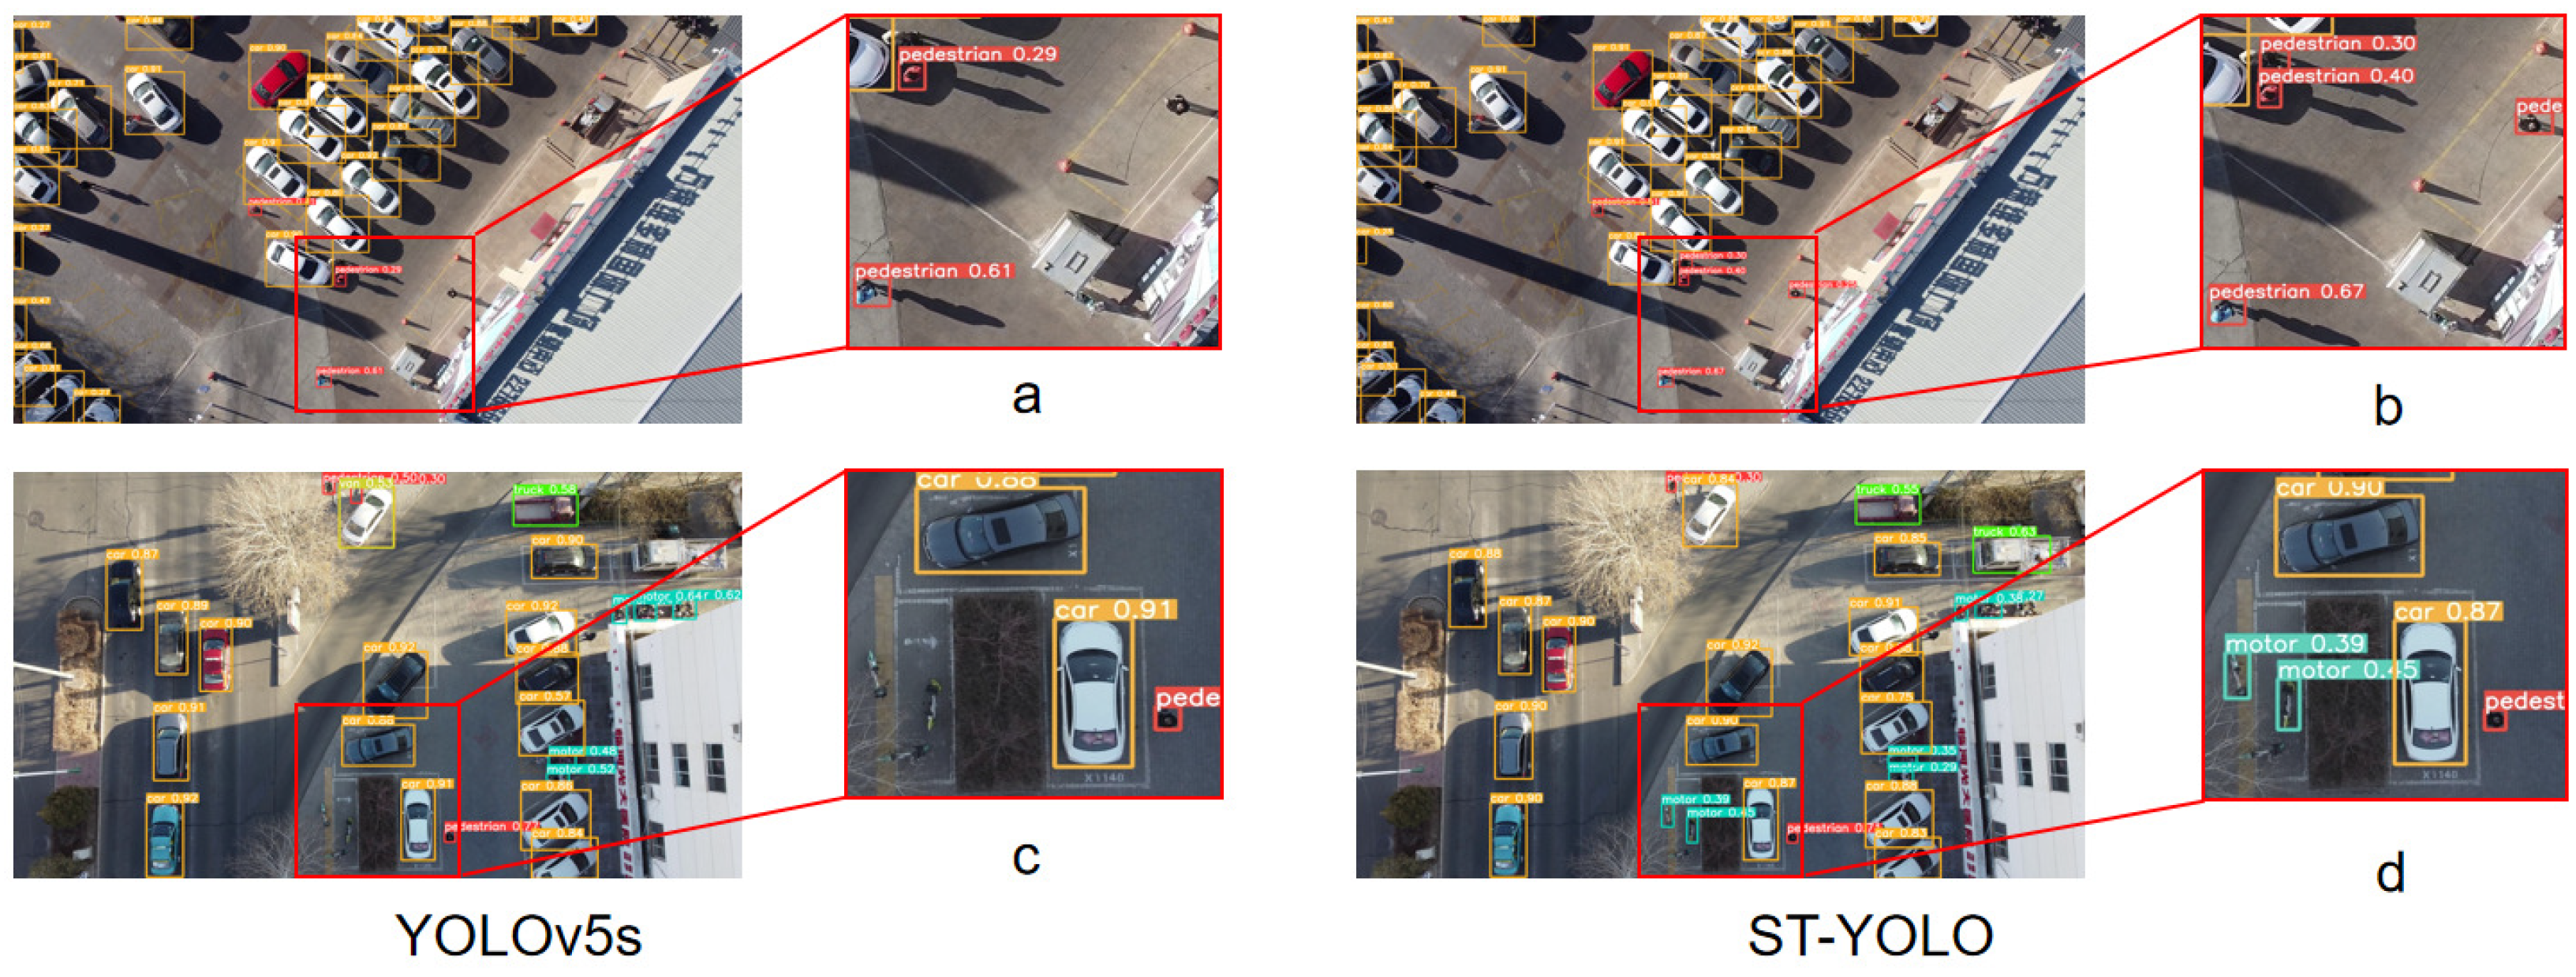
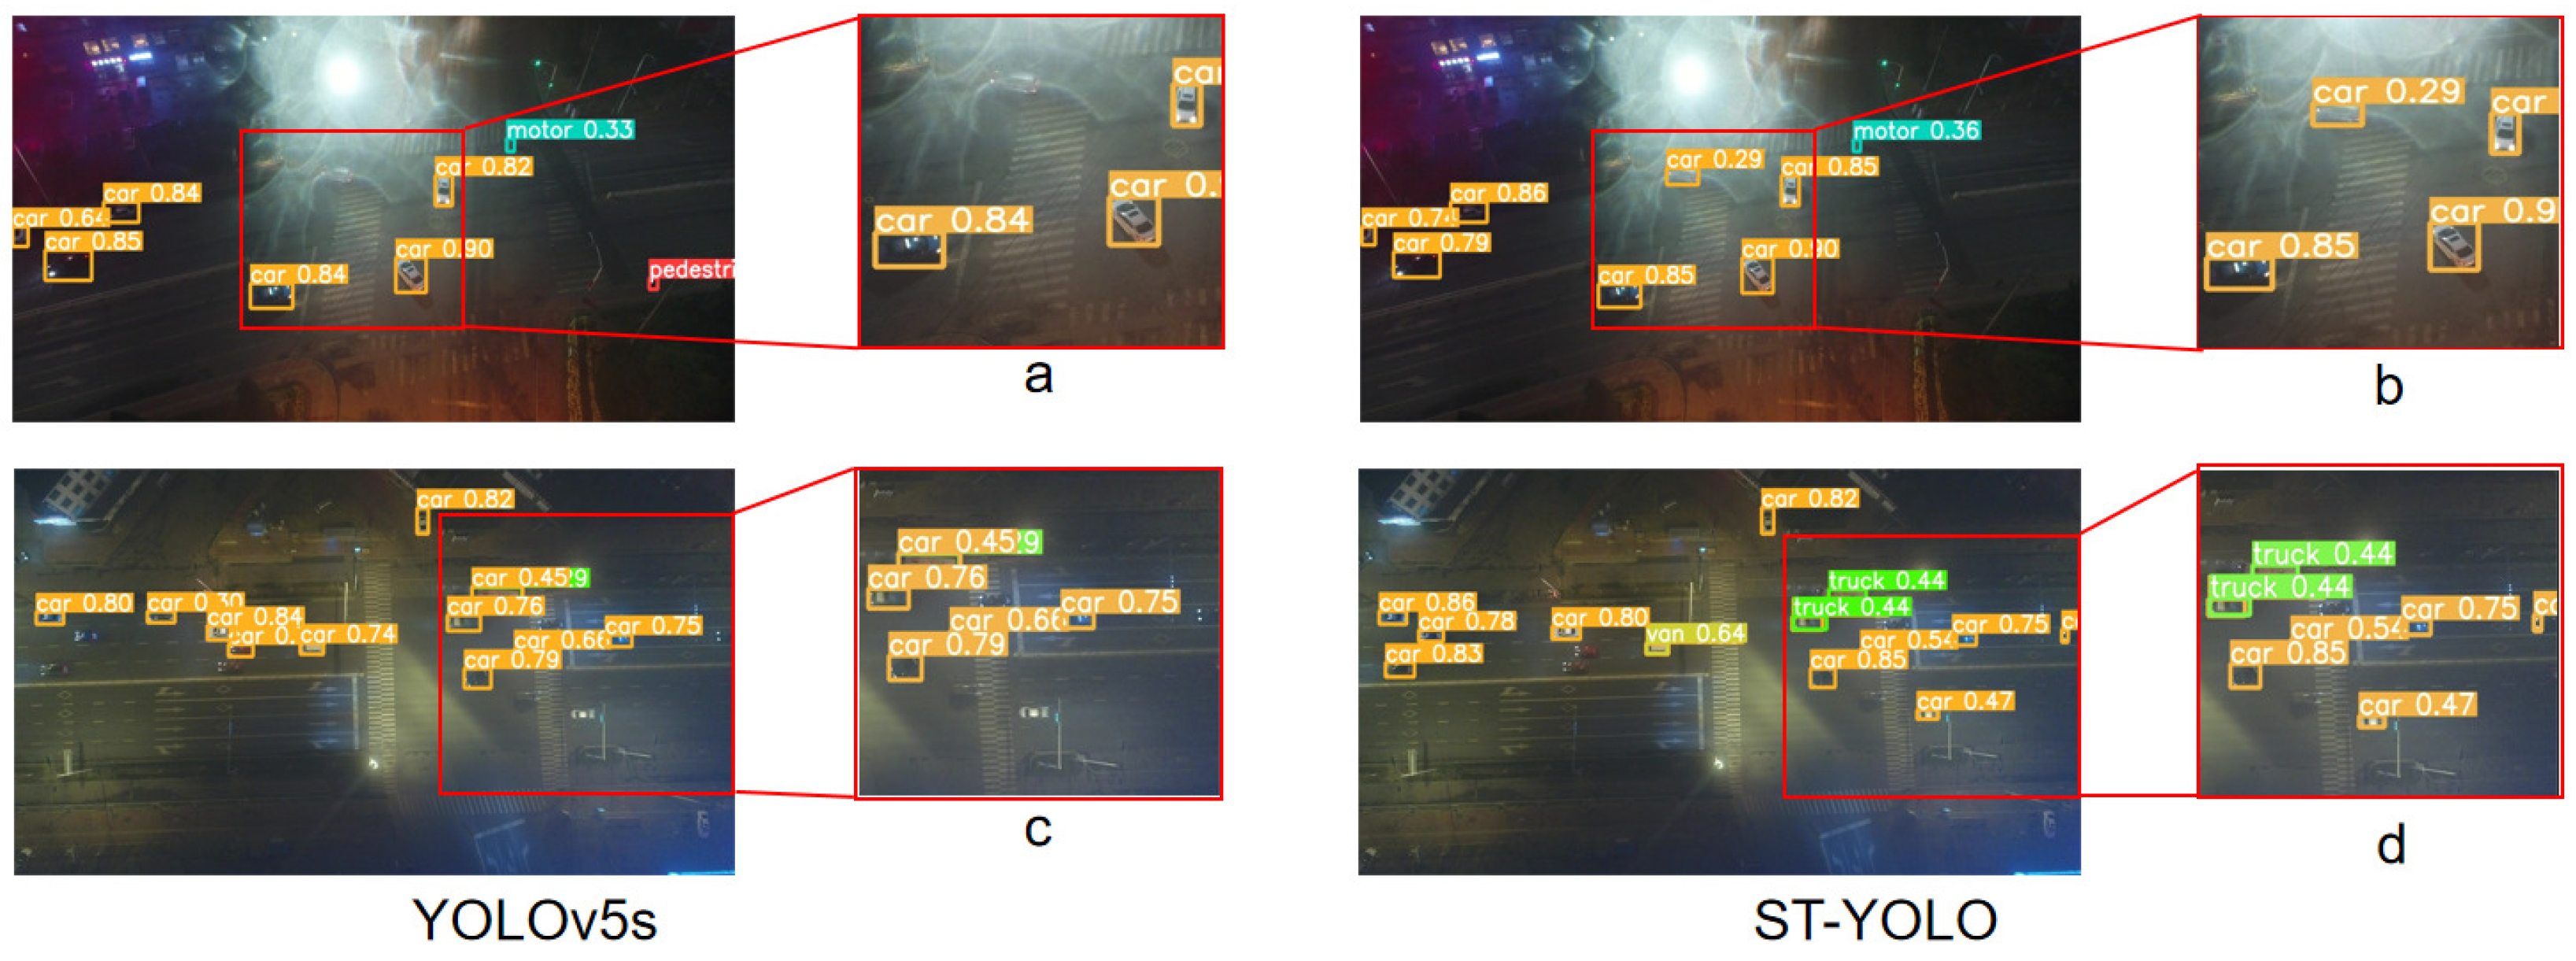
5.9. Ablation Studies and Visualization of Results

The ablation study presented in Table 7 further validates the enhancements made to the model. The table compares the baseline model with various configurations of ST-YOLO, evaluating the impact of three components: CAA, SI-IoU, and PPA. The results show that each component contributes to the overall improvement of the model. For instance, incorporating the SI-IoU component results in a significant enhancement, increasing precision from 0.435 to 0.448 and recall from 0.32 to 0.331. Adding the PPA component further boosts the model’s performance, with precision improving from 0.435 to 0.434 and recall increasing from 0.32 to 0.33. When all three components are combined in the complete ST-YOLO configuration, the model achieves the highest performance across all metrics. Compared to the baseline, the precision increases to 0.453, recall improves to 0.339, mAP50 rises to 33.2%, and mAP50-95 reaches 18.2%.
Additionally, this work visualized the results on the VisDrone2019 dataset. Figure 13 shows the results obtained on the VisDrone2019 test set. The visualization indicates that ST-YOLO performs well in small-object detection, significantly improving issues such as blur, weak feature extraction, and misdetection.
Figure 13a,b show that YOLOv5s incorrectly detects tree trunks as pedestrians and misses cyclists among pedestrians, issues that ST-YOLO has corrected. Figure 13c,d show that YOLOv5s faces some missed detections when detecting dense vehicles, while ST-YOLO further improves this issue. Figure 13e,f show that YOLOv5s fails to detect tricycles that blend with the forest color, whereas ST-YOLO correctly detects them.
To further validate the generalization capability of ST-YOLO across different datasets, we tested a model trained on the VisDrone2019 dataset on four additional datasets. The experimental results, as shown in Figure 14, Figure 15, Figure 16 and Figure 17, demonstrate that the ST-YOLO model trained on the VisDrone2019 dataset exhibits strong generalization ability on the other datasets, effectively detecting multi-scale objects in the images. Moreover, compared to the baseline, ST-YOLO achieves better detection performance. Figure 14 illustrates the visualization results on the UTUAV-B dataset, where ST-YOLO shows higher detection rates for small objects and lower false positive rates. Figure 15 presents the results on the UAV-ROD dataset, where ST-YOLO outperforms the other methods in detecting multi-scale targets in complex environments. Figure 16 shows the visualization on the UAVDT dataset, where ST-YOLO demonstrates higher detection accuracy in low-light conditions. Lastly, Figure 17 presents the results on the CARPK dataset, where ST-YOLO achieves higher detection accuracy even in densely packed images.
These results demonstrate the superiority of ST-YOLO in object detection, especially for edge and background-similar targets, with almost no misdetections. This is because SI-IoU enhances the detection sensitivity for small objects and improves the bounding box regression accuracy by considering the shape attributes of bounding boxes and adjusting auxiliary bounding box sizes. The PPA mechanism, using a multi-branch feature extraction strategy, effectively retains small object details often lost during downsampling, enhancing feature extraction. The CAA module, combining depthwise separable convolutions and context anchor attention mechanisms, improves the capture of the intricate details in images, addressing feature loss and background interference issues.

6. Conclusions

In this paper, we introduce the ST-YOLO model, specifically designed to enhance the detection efficiency of small objects in UAV imagery. Through improvements in key modules and optimization of the IoU calculation methods, ST-YOLO achieves significant enhancements in detecting small targets within aerial images, with only a slight increase in model size.
Faced with the challenges of large-scale aerial imagery and densely packed small objects, this study introduces the optimized C3_CAA module, which integrates the Context-Aware Attention mechanism, greatly enhancing the model’s ability to capture minute features in complex scenes. Additionally, to address the issue of feature loss during the downsampling process inherent in traditional models, this work innovatively combines the enhanced C3 module with the Parallelized Patch-Aware attention mechanism to develop the CPA module. This module not only preserves essential detail but also effectively integrates features across various scales through a pyramid pooling structure and a parallel multi-branch strategy, significantly improving the detection accuracy of small targets. We also innovated the IoU calculation, developing the SI-IoU method. This novel approach to IoU calculation not only considers the overlap of bounding boxes and the shape of bounding boxes but also optimizes the capture of target shape and proportion by adjusting the size of auxiliary bounding boxes, thereby achieving more precise loss calculation and bounding box regression. This method is particularly suited to the variable viewing angles and target sizes in aerial imaging, further enhancing the model’s sensitivity and accuracy in detecting small objects.
The experimental validation on the VisDrone 2019 dataset, UAVDT dataset, and CARPK dataset demonstrates that, despite a minor increase in model parameters and computational demands, the ST-YOLO model significantly outperforms baseline models. This confirms the efficacy and superiority of ST-YOLO in tackling the challenging task of detecting small objects in UAV aerial imagery, enabling drones to recognize and track more small targets during flight missions, thereby significantly enhancing reliability and efficiency in practical applications.

Author Contributions

Methodology, H.Y. and X.K.; Software, H.Y.; Validation, X.K.; Formal analysis, H.Y.; Writing—original draft, H.Y.; Writing—review & editing, J.W. and H.T.; Supervision, X.K., J.W. and H.T.; Funding acquisition, X.K. and H.T. All authors have read and agreed to the published version of the manuscript.

Funding

This work was partly supported by a research grant provided by the First Bank of Toyama, partly supported by Suzuki Foundation, and partly commissioned by NEDO (project number JPNP22006).

Data Availability Statement

No new data were created or analyzed in this study. Data sharing is not applicable to this article.

Conflicts of Interest

The authors declare no conflicts of interest.

References

  1. Tsouros, D.C.; Bibi, S.; Sarigiannidis, P.G. A Review on UAV-based Applications for Precision Agriculture. Information 2019, 10, 11. [Google Scholar] [CrossRef]
  2. Li, X.; Lian, Y. Design and Implementation of UAV Intelligent Aerial Photography System. In Proceedings of the International Conference on Intelligent Human-Machine Systems and Cybernetics, Nanchang, China, 26–27 August 2012. [Google Scholar]
  3. Wu, Y.; Wu, S.; Hu, X. Cooperative Path Planning of UAVs and UGVs for A Persistent Surveillance Task in Urban Environments. IEEE Internet Things J. 2020, 8, 4906–4919. [Google Scholar] [CrossRef]
  4. Lee, J.; Wang, J.; Crandall, D. Real-time, cloud-based object detection for unmanned aerial vehicles. In Proceedings of the IEEE International Conference on Robotic Computing, Taichung, Taiwan, 10–12 April 2017. [Google Scholar]
  5. Du, D.; Zhu, P.; Wen, L.; Bian, X.; Lin, H.; Hu, Q.; Peng, T.; Zheng, J.; Wang, X.; Zhang, Y.; et al. VisDrone-DET2019: The Vision Meets Drone Object Detection in Image Challenge Results. In Proceedings of the IEEE/CVF International Conference on Computer Vision Workshops, Seoul, Republic of Korea, 27–28 October 2019. [Google Scholar]
  6. Zhu, X.; Lyu, S.; Wang, X.; Zhao, Q. TPH-YOLOv5: Improved YOLOv5 Based on Transformer Prediction Head for Object Detection on Drone-captured Scenarios. In Proceedings of the IEEE/CVF International Conference on Computer Vision, Virtual, 11–17 October 2021. [Google Scholar]
  7. Sahin, O.; Ozer, S. Yolodrone: Improved Yolo Architecture for Object Detection in Drone Images. In Proceedings of the International Conference on Telecommunications and Signal Processing, Guntur, India, 11–12 June 2021. [Google Scholar]
  8. Hui, Y.; Wang, J.; Li, B. STF-YOLO: A Small Target Detection Algorithm for UAV Remote Sensing Images Based on Improved SwinTransformer and Class Weighted Classification Decoupling Head. Measurement 2024, 224, 113936. [Google Scholar] [CrossRef]
  9. Cai, X.; Lai, Q.; Wang, Y.; Wang, W.; Sun, Z.; Yao, Y. Poly Kernel Inception Network for Remote Sensing Detection. arXiv 2024, arXiv:2403.06258. [Google Scholar]
  10. Xu, S.; Zheng, S.C.; Xu, W.; Xu, R. HCF-Net: Hierarchical Context Fusion Network for Infrared Small Object Detection. arXiv 2024, arXiv:2403.10778. [Google Scholar]
  11. Zhang, H.; Zhang, S. Shape-IoU: More Accurate Metric Considering Bounding Box Shape and Scale. arXiv 2023, arXiv:2312.17663. [Google Scholar]
  12. Zhang, H.; Xu, C.; Zhang, S. Inner-IoU: More Effective Intersection Over Union Loss with Auxiliary Bounding Box. arXiv 2023, arXiv:2311.02877. [Google Scholar]
  13. Li, Z.; Peng, C.; Yu, G.; Zhang, X.; Deng, Y.; Sun, J. Light-head R-CNN: In Defense of Two-stage Object Detector. arXiv 2017, arXiv:1711.07264. [Google Scholar]
  14. Cai, Z.; Vasconcelos, N. Cascade R-CNN: Delving into High Quality Object Detection. In Proceedings of the IEEE Conference on Computer Vision and Pattern Recognition, Salt Lake City, UT, USA, 18–22 June 2018. [Google Scholar]
  15. Redmon, J.; Divvala, S.; Girshick, R.; Farhadi, A. You Only Look Once: Unified, Real-Time Object Detection. In Proceedings of the IEEE Conference on Computer Vision and Pattern Recognition, Las Vegas, NV, USA, 27–30 June 2016. [Google Scholar]
  16. Vaswani, A.; Shazeer, N.; Parmar, N.; Uszkoreit, J.; Jones, L.; Gomez, A.N.; Kaiser, Ł.; Polosukhin, I. Attention is All You Need. In Proceedings of the 31st International Conference on Neural Information Processing Systems, Long Beach, CA, USA, 4–9 December 2017. [Google Scholar]
  17. Carion, N.; Massa, F.; Synnaeve, G.; Usunier, N.; Kirillov, A.; Zagoruyko, S. End-to-end Object Detection with Transformers. In Proceedings of the European Conference on Computer Vision, Online, 23–28 August 2020. [Google Scholar]
  18. Beal, J.; Kim, E.; Tzeng, E.; Park, D.H.; Zhai, A.; Kislyuk, D. Toward Transformer-based Object Detection. arXiv 2020, arXiv:2012.09958. [Google Scholar]
  19. Hu, J.; Shen, L.; Sun, G. Squeeze-and-excitation Networks. In Proceedings of the IEEE Conference on Computer Vision and Pattern Recognition, Salt Lake City, UT, USA, 18–22 June 2018. [Google Scholar]
  20. Woo, S.; Park, J.; Lee, J.Y.; Kweon, I.S. CBAM: Convolutional Block Attention Module. In Proceedings of the European Conference on Computer Vision, Munich, Germany, 8–14 September 2018. [Google Scholar]
  21. Yu, J.; Jiang, Y.; Wang, Z.; Cao, Z.; Huang, T. Unitbox: An Advanced Object Detection Network. In Proceedings of the ACM International Conference on Multimedia, Amsterdam, The Netherlands, 15–19 October 2016. [Google Scholar]
  22. Zheng, Z.; Wang, P.; Ren, D.; Liu, W.; Ye, R.; Hu, Q.; Zuo, W. Enhancing Geometric Factors in Model Learning and Inference for Object Detection and Instance Segmentation. IEEE Trans. Cybern. 2021, 52, 8574–8586. [Google Scholar] [CrossRef]
  23. Rezatofighi, H.; Tsoi, N.; Gwak, J.Y.; Sadeghian, A.; Reid, I.; Savarese, S. Generalized Intersection Over Union: A Metric and A Loss for Bounding Box Regression. In Proceedings of the IEEE/CVF Conference on Computer Vision and Pattern Recognition, Long Beach, CA, USA, 15–20 June 2019. [Google Scholar]
  24. Zheng, Z.; Wang, P.; Liu, W.; Li, J.; Ye, R.; Ren, D. Distance-IoU Loss: Faster and Better Learning for Bounding Box Regression. In Proceedings of the AAAI Conference on Artificial Intelligence, New York, NY, USA, 7–12 February 2020. [Google Scholar]
  25. Du, D.; Qi, Y.; Yu, H.; Yang, Y.; Duan, K.; Li, G.; Zhang, W.; Huang, Q.; Tian, Q. The Unmanned Aerial Vehicle Benchmark: Object Detection and Tracking. In Proceedings of the European Conference on Computer Vision, Munich, Germany, 8–14 September 2018. [Google Scholar]
  26. Hsieh, M.R.; Lin, Y.L.; Hsu, W.H. Drone-based Object Counting by Spatially Regularized Regional Proposal Network. In Proceedings of the IEEE International Conference on Computer Vision, Venice, Italy, 22–29 October 2017. [Google Scholar]
  27. UAV-ROD. Available online: https://github.com/fengkaibit/UAV-ROD (accessed on 26 June 2024).
  28. Espinosa, J.E.; Jairo, E.; Sergio, A. Classification and Tracking of Vehicles Using Videos Captured by Unmanned Aerial Vehicles. In Machine Learning Techniques for Smart City Applications: Trends and Solutions; Springer International Publishing: Cham, Switzerland, 2022; pp. 59–73. [Google Scholar]
  29. Ma, S.; Yong, X. Mpdiou: A Loss for Efficient and Accurate Bounding Box Regression. arXiv 2023, arXiv:2307.07662. [Google Scholar]
  30. Wu, X.; Xu, J. P-IoU: Accurate Motion Prediction Based Data Association for Multi-object Tracking. In Proceedings of the International Conference on Neural Information Processing, New Orleans, LA, USA, 10–16 December 2023. [Google Scholar]
  31. Tong, Z.; Chen, Y.; Xu, Z.; Yu, R. Wise-IoU: Bounding Box Regression Loss with Dynamic Focusing Mechanism. arXiv 2023, arXiv:2301.10051. [Google Scholar]
  32. Liu, W.; Anguelov, D.; Erhan, D.; Szegedy, C.; Reed, S.; Fu, C.; Berg, A.C. SSD: Single Shot Multibox Detector. In Proceedings of the European Conference on Computer Vision, Amsterdam, The Netherlands, 11–14 October 2016. [Google Scholar]
  33. He, K.; Zhang, X.; Ren, S.; Sun, J. Deep Residual Learning for Image Recognition. In Proceedings of the IEEE Conference on Computer Vision and Pattern Recognition, Las Vegas, NV, USA, 27–30 June 2016. [Google Scholar]
  34. Li, Z.; Peng, C.; Yu, G.; Zhang, X.; Deng, Y.; Sun, J. DetNet: Design Backbone for Object Detection. In Proceedings of the European Conference on Computer Vision, Munich, Germany, 8–14 September 2018. [Google Scholar]
  35. Zhang, S.; Wen, L.; Bian, X.; Lei, Z.; Li, S.Z. Single-shot Refinement Neural Network for Object Detection. In Proceedings of the IEEE Conference on Computer Vision and Pattern Recognition, Salt Lake City, UT, USA, 18–22 June 2018. [Google Scholar]
  36. Simonyan, K.; Zisserman, A. Very Deep Convolutional Networks for Large-scale Image Recognition. arXiv 2014, arXiv:1409.1556. [Google Scholar]
  37. Tan, M.; Pang, R.; Le, Q.V. EfficientDet: Scalable and Efficient Object Detection. In Proceedings of the IEEE/CVF Conference on Computer Vision and Pattern Recognition, Seattle, WA, USA, 14–19 June 2020. [Google Scholar]
  38. Lin, T.Y.; Goyal, P.; Girshick, R.; He, K.; Dollár, P. Focal Loss for Dense Object Detection. In Proceedings of the IEEE International Conference on Computer Vision, Venice, Italy, 22–29 October 2017. [Google Scholar]
  39. Lin, T.Y.; Dollár, P.; Girshick, R.; He, K.; Hariharan, B.; Belongie, S. Feature Pyramid Networks for Object Detection. In Proceedings of the IEEE Conference on Computer Vision and Pattern Recognition, Venice, Italy, 22–29 October 2017. [Google Scholar]
  40. Duan, K.; Bai, S.; Xie, L.; Qi, H.; Huang, Q.; Tian, Q. CenterNet: Keypoint Triplets for Object Detection. In Proceedings of the IEEE/CVF International Conference on Computer Vision, Seoul, Republic of Korea, 27 October–2 November 2019. [Google Scholar]
  41. Law, H.; Deng, J. CornerNet: Detecting Objects as Paired Keypoints. In Proceedings of the European Conference on Computer Vision, Munich, Germany, 8–14 September 2018. [Google Scholar]
  42. Zhou, X.; Wang, D.; Krähenbühl, P. Objects as Points. arXiv 2019, arXiv:1904.07850. [Google Scholar]
  43. Feng, C.; Zhong, Y.; Gao, Y.; Scott, M.R.; Huang, W. TOOD: Task-aligned One-stage Object Detection. In Proceedings of the IEEE/CVF International Conference on Computer Vision, Virtual, 11–17 October 2021. [Google Scholar]
  44. Zhang, S.; Chi, C.; Yao, Y.; Lei, Z.; Li, S.Z. Bridging the Gap between Anchor-based and Anchor-free Detection via Adaptive Training Sample Selection. In Proceedings of the IEEE/CVF Conference on Computer Vision and Pattern Recognition, Seattle, WA, USA, 14–19 June 2020. [Google Scholar]
  45. Dai, X.; Chen, Y.; Xiao, B.; Chen, D.; Liu, M.; Yuan, L.; Zhang, L. Dynamic Head: Unifying Object Detection Heads with Attentions. In Proceedings of the IEEE/CVF Conference on Computer Vision and Pattern Recognition, Virtual, 19–25 June 2021. [Google Scholar]
  46. Ren, S.; He, K.; Girshick, R.; Sun, J. Faster R-CNN: Towards Real-time Object Detection with Region Proposal Networks. IEEE Trans. Pattern Anal. Mach. Intell. 2017, 39, 1137–1149. [Google Scholar] [CrossRef]
  47. Wu, Y.; Chen, Y.; Yuan, L.; Liu, Z.; Wang, L.; Li, H.; Fu, Y. Rethinking Classification and Localization for Object Detection. In Proceedings of the IEEE/CVF Conference on Computer Vision and Pattern Recognition, Seattle, WA, USA, 14–19 June 2020. [Google Scholar]
  48. Ge, Z.; Liu, S.; Wang, F.; Li, Z.; Sun, J. YOLOX: Exceeding YOLO Series in 2021. arXiv 2021, arXiv:2107.08430. [Google Scholar]
  49. Bochkovskiy, A.; Wang, C.Y.; Liao, H.Y.M. YOLOv4: Optimal Speed and Accuracy of Object Detection. arXiv 2020, arXiv:2004.10934. [Google Scholar]
  50. Ultralytics. YOLOv5: V6.0-YOLOv5n ’Nano’ Models, Roboflow Integration, TensorFlow Export, OpenCV DNN Support. Available online: https://zenodo.org/records/5563715 (accessed on 26 June 2024).
  51. Redmon, J.; Farhadi, A. YOLOv3: An Incremental Improvement. arXiv 2018, arXiv:1804.02767. [Google Scholar]
  52. Huang, Z.; Li, L.; Krizek, G.C.; Sun, L. Research on Traffic Sign Detection Based on Improved YOLOv8. Remote Sens. 2023, 11, 226–232. [Google Scholar] [CrossRef]
  53. Zhang, G.; Chen, T.; Wang, J. CSC-YOLO: An Image Recognition Model for Surface Defect Detection of Copper Strip and Plates. J. Shanghai Jiaotong Univ. (Sci.) 2024. [Google Scholar] [CrossRef]
  54. Dai, J.; Li, Y.; He, K.; Sun, J. R-FCN: Object Detection via Region-based Fully Convolutional Networks. In Proceedings of the 30th International Conference on Neural Information Processing Systems, Barcelona, Spain, 5–10 December 2016. [Google Scholar]
  55. Zhang, R.; Shao, Z.; Huang, X.; Wang, J.; Wang, Y.; Li, D. Adaptive Dense Pyramid Network for Object Detection in UAV Imagery. Neurocomputing 2022, 489, 377–389. [Google Scholar] [CrossRef]
  56. Hong, Q.; Liu, F.; Li, D.; Liu, J.; Tian, L.; Shan, Y. Sparse R-CNN: End-to-end Object Detection with Learnable Proposals. In Proceedings of the IEEE/CVF Conference on Computer Vision and Pattern Recognition, Virtual, 19–25 June 2021. [Google Scholar]
  57. Li, C.; Yang, T.; Zhu, S.; Chen, C.; Guan, S. Density Map Guided Object Detection in Aerial Images. In Proceedings of the IEEE/CVF Conference on Computer Vision and Pattern Recognition Workshops, Seattle, WA, USA, 14–19 June 2020. [Google Scholar]
  58. Li, X.; Wang, W.; Wu, L.; Chen, S.; Hu, X.; Li, J.; Tang, J.; Yang, J. Generalized Focal Loss: Learning Qualified and Distributed Bounding Boxes for Dense Object Detection. Adv. Neural Inf. Process. Syst. 2020, 33, 21002–21012. [Google Scholar]
  59. Yang, C.; Huang, Z.; Wang, N. QueryDet: Cascaded Sparse Query for Accelerating High-resolution Small Object Detection. In Proceedings of the IEEE/CVF Conference on Computer Vision and Pattern Recognition, New Orleans, LA, USA, 18–24 June 2022. [Google Scholar]
  60. Meethal, A.; Granger, E.; Pedersoli, M. Cascaded Zoom-in Detector for High Resolution Aerial Images. In Proceedings of the IEEE/CVF Conference on Computer Vision and Pattern Recognition, Vancouver, BC, Canada, 18–22 June 2023. [Google Scholar]
  61. Zhang, R.; Shao, Z.; Huang, X.; Wang, J.; Li, D. Object Detection in UAV Images via Global Density Fused Convolutional Network. Remote Sens. 2020, 12, 3140. [Google Scholar] [CrossRef]
  62. Wang, C.; Yeh, I.; Liao, H. Yolov9: Learning what you want to learn using programmable gradient information. In Proceedings of the European Conference on Computer Vision, Milan, Italy, 29 September–4 October 2024. [Google Scholar]
  63. Wang, A.; Chen, H.; Liu, L.; Chen, K.; Lin, Z.; Han, J.; Ding, G. Yolov10: Real-time end-to-end object detection. Adv. Neural Inf. Process. Syst. 2024, 37, 107984–108011. [Google Scholar]
  64. Li, Z.; Yang, L.; Zhou, F. FSSD: Feature Fusion Single Shot Multibox Detector. arXiv 2017, arXiv:1712.00960. [Google Scholar]
  65. Tian, Z.; Shen, C.; Chen, H.; He, T. FCOS: A Simple and Strong Anchor-free Object Detector. IEEE Trans. Pattern Anal. Mach. Intell. 2020, 44, 1922–1933. [Google Scholar] [CrossRef]
  66. Li, X.; Wang, W.; Hu, X.; Li, J.; Tang, J.; Yang, J. Generalized Focal Loss v2: Learning Reliable Localization Quality Estimation for Dense Object Detection. In Proceedings of the IEEE/CVF Conference on Computer Vision and Pattern Recognition (CVPR), Virtual Conference, 19–25 June 2021. [Google Scholar]
  67. Zhang, H.; Wang, Y.; Dayoub, F.; Sunderhauf, N. VarifocalNet: An IoU-aware Dense Object Detector. In Proceedings of the IEEE/CVF Conference on Computer Vision and Pattern Recognition (CVPR), Virtual Conference, 19–25 June 2021. [Google Scholar]
  68. Zhou, J.; Feng, K.; Li, W.; Han, J.; Pan, F. TS4Net: Two-stage Sample Selective Strategy for Rotating Object Detection. Neurocomputing 2022, 501, 753–764. [Google Scholar] [CrossRef]
  69. Ming, Q.; Miao, L.; Zhou, Z.; Dong, Y. CFC-Net: A Critical Feature Capturing Network for Arbitrary-oriented Object Detection in Remote-sensing Images. IEEE Trans. Geosci. Remote Sens. 2022, 60, 5605814. [Google Scholar] [CrossRef]
  70. Li, C.; Li, L.; Jiang, H.; Weng, K.; Geng, Y.; Li, L. YOLOv6: A Single-stage Object Detection Framework for Industrial Applications. arXiv 2022, arXiv:2209.02976. [Google Scholar]
  71. Wang, C.; Bochkovskiy, A.; Liao, H. YOLOv7: Trainable bag-of-freebies sets new state-of-the-art for real-time object detectors. In Proceedings of the IEEE/CVF Conference on Computer Vision and Pattern Recognition, Vancouver, BC, Canada, 18–22 June 2023. [Google Scholar]
Figure 1. Visualization of drone-captured images.
Drones 09 00338 g001
Figure 2. The framework of ST-YOLO.
Drones 09 00338 g002
Figure 3. C3_CAA and Context Anchor Attention.
Drones 09 00338 g003
Figure 4. The structure of the PPA attention mechanism.
Drones 09 00338 g004
Figure 5. The Structure of the CPA.
Drones 09 00338 g005
Figure 6. The performance of SI-IoU (ratio between 0.5 and 1.5).
Drones 09 00338 g006
Figure 7. The loss curves between SI-IoU and baseline.
Drones 09 00338 g007
Figure 8. Comparison of models on VisDrone2019 dataset.
Drones 09 00338 g008
Figure 9. Comparison of models on UAVDT dataset.
Drones 09 00338 g009
Figure 10. Comparison of models on CARPK dataset.
Drones 09 00338 g010
Figure 11. Comparison of models on UAV-ROD dataset.
Drones 09 00338 g011
Figure 12. Comparison of models on UTUAV-B dataset.
Drones 09 00338 g012
Figure 13. Visualization of the detection results obtained on the VisDrone2019 dataset. (a,c,e) show the detection results of YOLOv5s, while (b,d,f) show the results of ST-YOLO. In the figure, red, blue, pink, light green, green, and yellow bounding boxes represent the predicted objects as pedestrians, motors, trucks, tricycles and cars respectively. Zoomed-in views are provided to highlight detection details.
Drones 09 00338 g013
Figure 14. Visualization results of the pre-trained ST-YOLO on the UTUAV-B dataset. (a,c) show the detection results of YOLOv5s, while (b,d) show the results of ST-YOLO. In the figure, yellow bounding boxes represent the predicted objects as cars. Zoomed-in views are provided to highlight detection details.
Drones 09 00338 g014
Figure 15. Visualization results of the pre-trained ST-YOLO on the UAV-ROD dataset. (a,c) show the detection results of YOLOv5s, while (b,d) show the results of ST-YOLO. In the figure, yellow, red, blue and green bounding boxes represent the predicted objects as cars, pedestrians, motors, trucks. Zoomed-in views are provided to highlight detection details.
Drones 09 00338 g015
Figure 16. Visualization of the detection results obtained on the UAVDT dataset. (a,c) show the detection results of YOLOv5s, while (b,d) show the results of ST-YOLO. In the figure, yellow, red, blue, green and olive green bounding boxes represent the predicted objects as cars, pedestrians, motors, trucks and van. Zoomed-in views are provided to highlight detection details.
Drones 09 00338 g016
Figure 17. Visualization of the detection results obtained on the CARPK dataset. (a,c) show the detection results of YOLOv5s, while (b,d) show the results of ST-YOLO. In the figure, yellow, red bounding boxes represent the predicted objects as cars, pedestrians. Zoomed-in views are provided to highlight detection details.
Drones 09 00338 g017
Table 1. Comparison experiments of SI-IoU with other IoUs.
IoUPrecisionRecallmAP50 (%)mAP50-95 (%)
SI-IoU 0.448 0.331 32.4 17.3
C-IoU0.4350.32031.216.4
Inner-G0.4330.30130.216.4
Inner-D0.4230.31530.816.4
Inner-C0.4410.31531.216.7
Inner-S0.4370.32931.716.9
Inner-E0.4400.32832.117.1
Shape-IoU0.4360.32431.616.8
Mpd-IoU [29]0.4320.32731.316.8
P-IoU [30]0.4290.32231.216.6
Wise-IoU [31]0.4260.32731.316.5
Table 2. Comparison of ST-YOLO to state-of-the-art methods on the VisDrone2019 dataset.
ModelBackboneGFLOPsParameters (M)mAP50 (%)
SSD [32]ResNet-50 [33]62.7026.3010.60
DetNet [34]ResNet-50 [33]44.607.6029.23
RefineDet [35]VGG-16 [36]34.4011.8021.37
EfficientDet [37]EfficientDet-D1 [37]6.10 6.63 21.20
RetinaNet [38]ResNet-50-FPN [39]75.5021.3025.50
CenterNet [40]ResNet-50 [33]74.9031.2029.00
CornerNet [41]Hourglass-104 [42]234.00187.0034.10
Cascade RCNN [14]ResNet-50-FPN [39]236.0069.2932.60
TOOD [43]ResNet-50 [33]199.0032.4033.90
ATSS [44]ResNet-50-FPN-DyHead [45]110.0038.9133.80
Faster-RCNN [46]VGG16 [36]91.4041.5021.90
Faster-RCNN [46]ResNet-50-FPN [39]208.0041.3932.90
Double-Head R-CNN [47]ResNeXt-101 [33]393.3747.1233.40
YOLOX-S [48]CSPDarkNet [49]26.808.9032.40
YOLOX-M [48]CSPDarkNet [49]73.5025.1033.80
YOLOX-L [48]CSPDarkNet [49]155.6054.2035.40
YOLOv5s [50]CSPDarkNet [49]16.007.0431.20
YOLOv5m [50]CSPDarkNet [49]48.3020.9034.30
YOLOv3-tiny [51]Darknet-19 [51]19.1012.1023.50
YOLOv8s [52]CSPDarkNet [49]28.8011.1034.00
CSC-YOLO-S [53]CSPDarkNet [49]55.1011.5033.40
TPH-YOLO [6]CSPDarkNet [49]145.7060.4036.20
ST-YOLO CSPDarkNet [49]20.078.9633.20
Table 3. Comparison of ST-YOLO to state-of-the-art methods on the UAVDT dataset.
ModelBackboneGFLOPsParameters (M)mAP50 (%)
R-FCN [54]ResNet50 [33]58.9031.9017.50
SSD [32]VGG16 [36]47.7423.8821.40
SS-ADPN [55]ResNet50 [33]94.4930.1127.40
Double-Head R-CNN [47]ResNeXt-101 [33]393.3747.1226.00
Faster R-CNN [46]ResNet50 [33]172.3034.6023.40
Cascade R-CNN [14]ResNet50 [33]234.7169.1725.30
Sparse R-CNN [56]Transformer [16]172.00109.7026.60
EfficientDet-D7 [37]Efficient-B7 [37]325.0051.8431.80
DMNet [57]ResNet50 [33]27.999.7224.60
GFLv1 [58]ResNet50 [33]208.4032.2029.50
QueryDet [59]ResNet50 [33]125.4037.7436.10
CZ Det [60]ResNet50 [33]210.0045.9035.54
GDFNet [61]ResNet-50-FPN [39]257.6072.0026.10
YOLOX-S [48]CSPDarkNet [49]26.808.9031.10
YOLOv4 [49]CSPDarkNet [49]100.6052.5031.20
YOLOv5s [50]CSPDarkNet [49]16.00 7.04 31.80
YOLOv8s [52]CSPDarkNet [49]28.8011.1032.80
YOLOv9s [62]CSPDarkNet [49]27.407.2833.90
YOLOv10s [63]CSPDarkNet [49]24.808.0634.20
ST-YOLO CSPDarkNet [49]20.078.9633.40
Table 4. Comparison of ST-YOLO to state-of-the-art methods on the CARPK dataset.
ModelBackboneGFLOPsParameters (M)mAP50 (%)
Faster R-CNN [46]ResNet101 [33]91.4041.5084.80
R-FCN [54]ResNet101 [33]136.2064.4286.13
SSD [32]ResNet101 [33]47.7423.8882.72
FSSD512 [64]VGG16 [36]38.1234.1387.59
FCOS [65]ResNet101 [33]85.4046.0095.52
ATSS [44]ResNet101 [33]197.0931.0095.94
GFLV2 [66]ResNet101 [33]239.3237.7494.91
VFNet [67]ResNet101 [33]119.21127.1294.97
QueryDet [59]ResNet50 [33]125.437.7493.96
CZ Det [60]ResNet50 [33]210.0045.9092.18
YOLOv3 [51]DarkNet53 [51]283.00103.0086.01
YOLOv4 [49]CSPDarkNet [49]100.6052.5086.70
YOLOv5s [50]CSPDarkNet [49]16.00 7.04 94.20
YOLOv8s [52]CSPDarkNet [49]28.8011.1095.60
YOLOv9s [62]CSPDarkNet [49]27.407.2895.70
YOLOv10s [63]CSPDarkNet [49]24.808.0696.10
ST-YOLO CSPDarkNet [49]20.078.9695.10
Table 5. Comparison of ST-YOLO to state-of-the-art methods on the UAV-ROD dataset.
ModelBackboneGFLOPsParameters (M)mAP50 (%)
RetinaNet [38]ResNet50 [33]36.309.2097.70
Faster R-CNN [43]ResNet50 [33]172.3034.6098.00
TS4-Net [68]ResNet50 [33]37.609.4098.10
CFC-Net [69]ResNet50 [33]37.509.4099.30
YOLOv3 [51]Darknet53 [51]283.00103.0099.30
YOLOv5s [50]CSPDarkNet [49]16.00 7.0498.30
YOLO-v5m-CSL [50]CSPDarkNet [49]20.806.10 94.30
YOLO-v5m [50]CSPDarkNet [49]48.2020.8099.30
YOLOv6s [70]CSPDarkNet [49]44.2016.3199.20
YOLOv8s [52]CSPDarkNet [49]28.8011.1099.30
YOLOv9s [62]CSPDarkNet [49]27.407.2899.30
YOLOv10s [63]CSPDarkNet [49]24.808.0699.30
ST-YOLO CSPDarkNet [49]20.078.9699.30
Table 6. Comparison of ST-YOLO to state-of-the-art methods on the UTUAV-B dataset.
ModelBackboneGFLOPsParameters (M)mAP50 (%)
YOLOv3 [51]Darknet53 [51]283.00103.0088.5
YOLOv5s [50]CSPDarkNet [49]16.007.0486.6
YOLOv5m [50]CSPDarkNet [49]64.4025.0687.8
YOLOv6s [70]CSPDarkNet [49]44.2016.3184.8
YOLOv7 [71]CSPDarkNet [49]105.1037.294.2
YOLOv8s [60]CSPDarkNet [49]28.8011.1086.8
YOLOv9m [62]CSPDarkNet [49]77.620.1687.9
ST-YOLO CSPDarkNet [49]20.07 8.96 93.9
Table 7. Ablation study for ST-YOLO.
Model+CAA+SI-IoU+PPAPrecisionRecallmAP50 (%) mAP50-95 (%)
Baseline---0.4350.32031.216.4
--0.4280.32631.616.6
--0.4480.33132.417.3
--0.4340.33131.917.2
-0.4410.33432.517.3
-0.4530.33132.617.4
-0.4450.33932.917.9
ST-YOLO0.4530.33933.218.2
Disclaimer/Publisher’s Note: The statements, opinions and data contained in all publications are solely those of the individual author(s) and contributor(s) and not of MDPI and/or the editor(s). MDPI and/or the editor(s) disclaim responsibility for any injury to people or property resulting from any ideas, methods, instructions or products referred to in the content.

