
Unravelling the Characteristics of Microhabitat Alterations in Floodplain Inundated Areas Based on High-Resolution UAV Imagery and Remote Sensing: A Case Study in Jingjiang, Yangtze River


Abstract
1. Introduction
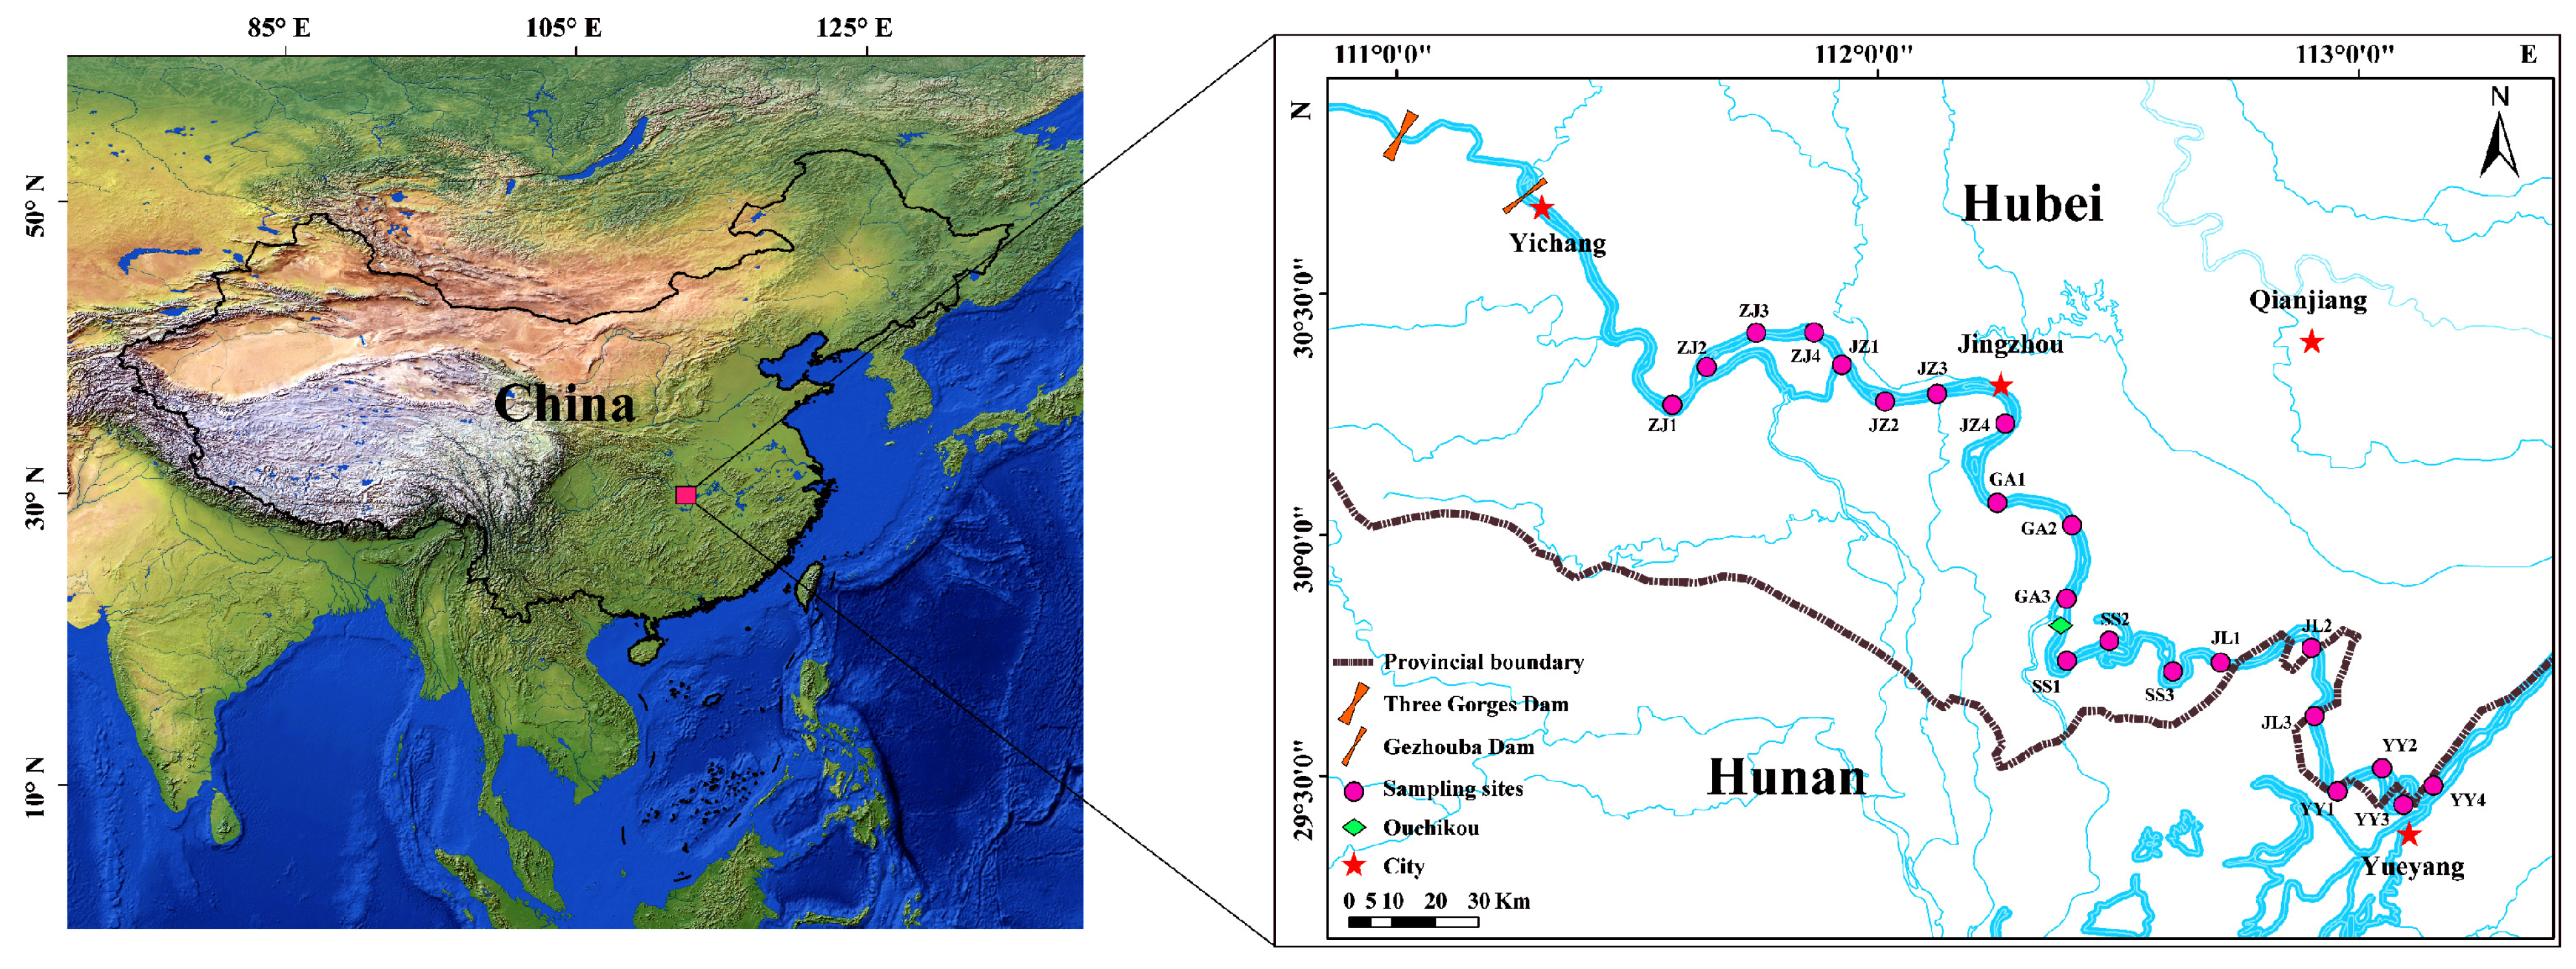
2. Study Area
3. Method
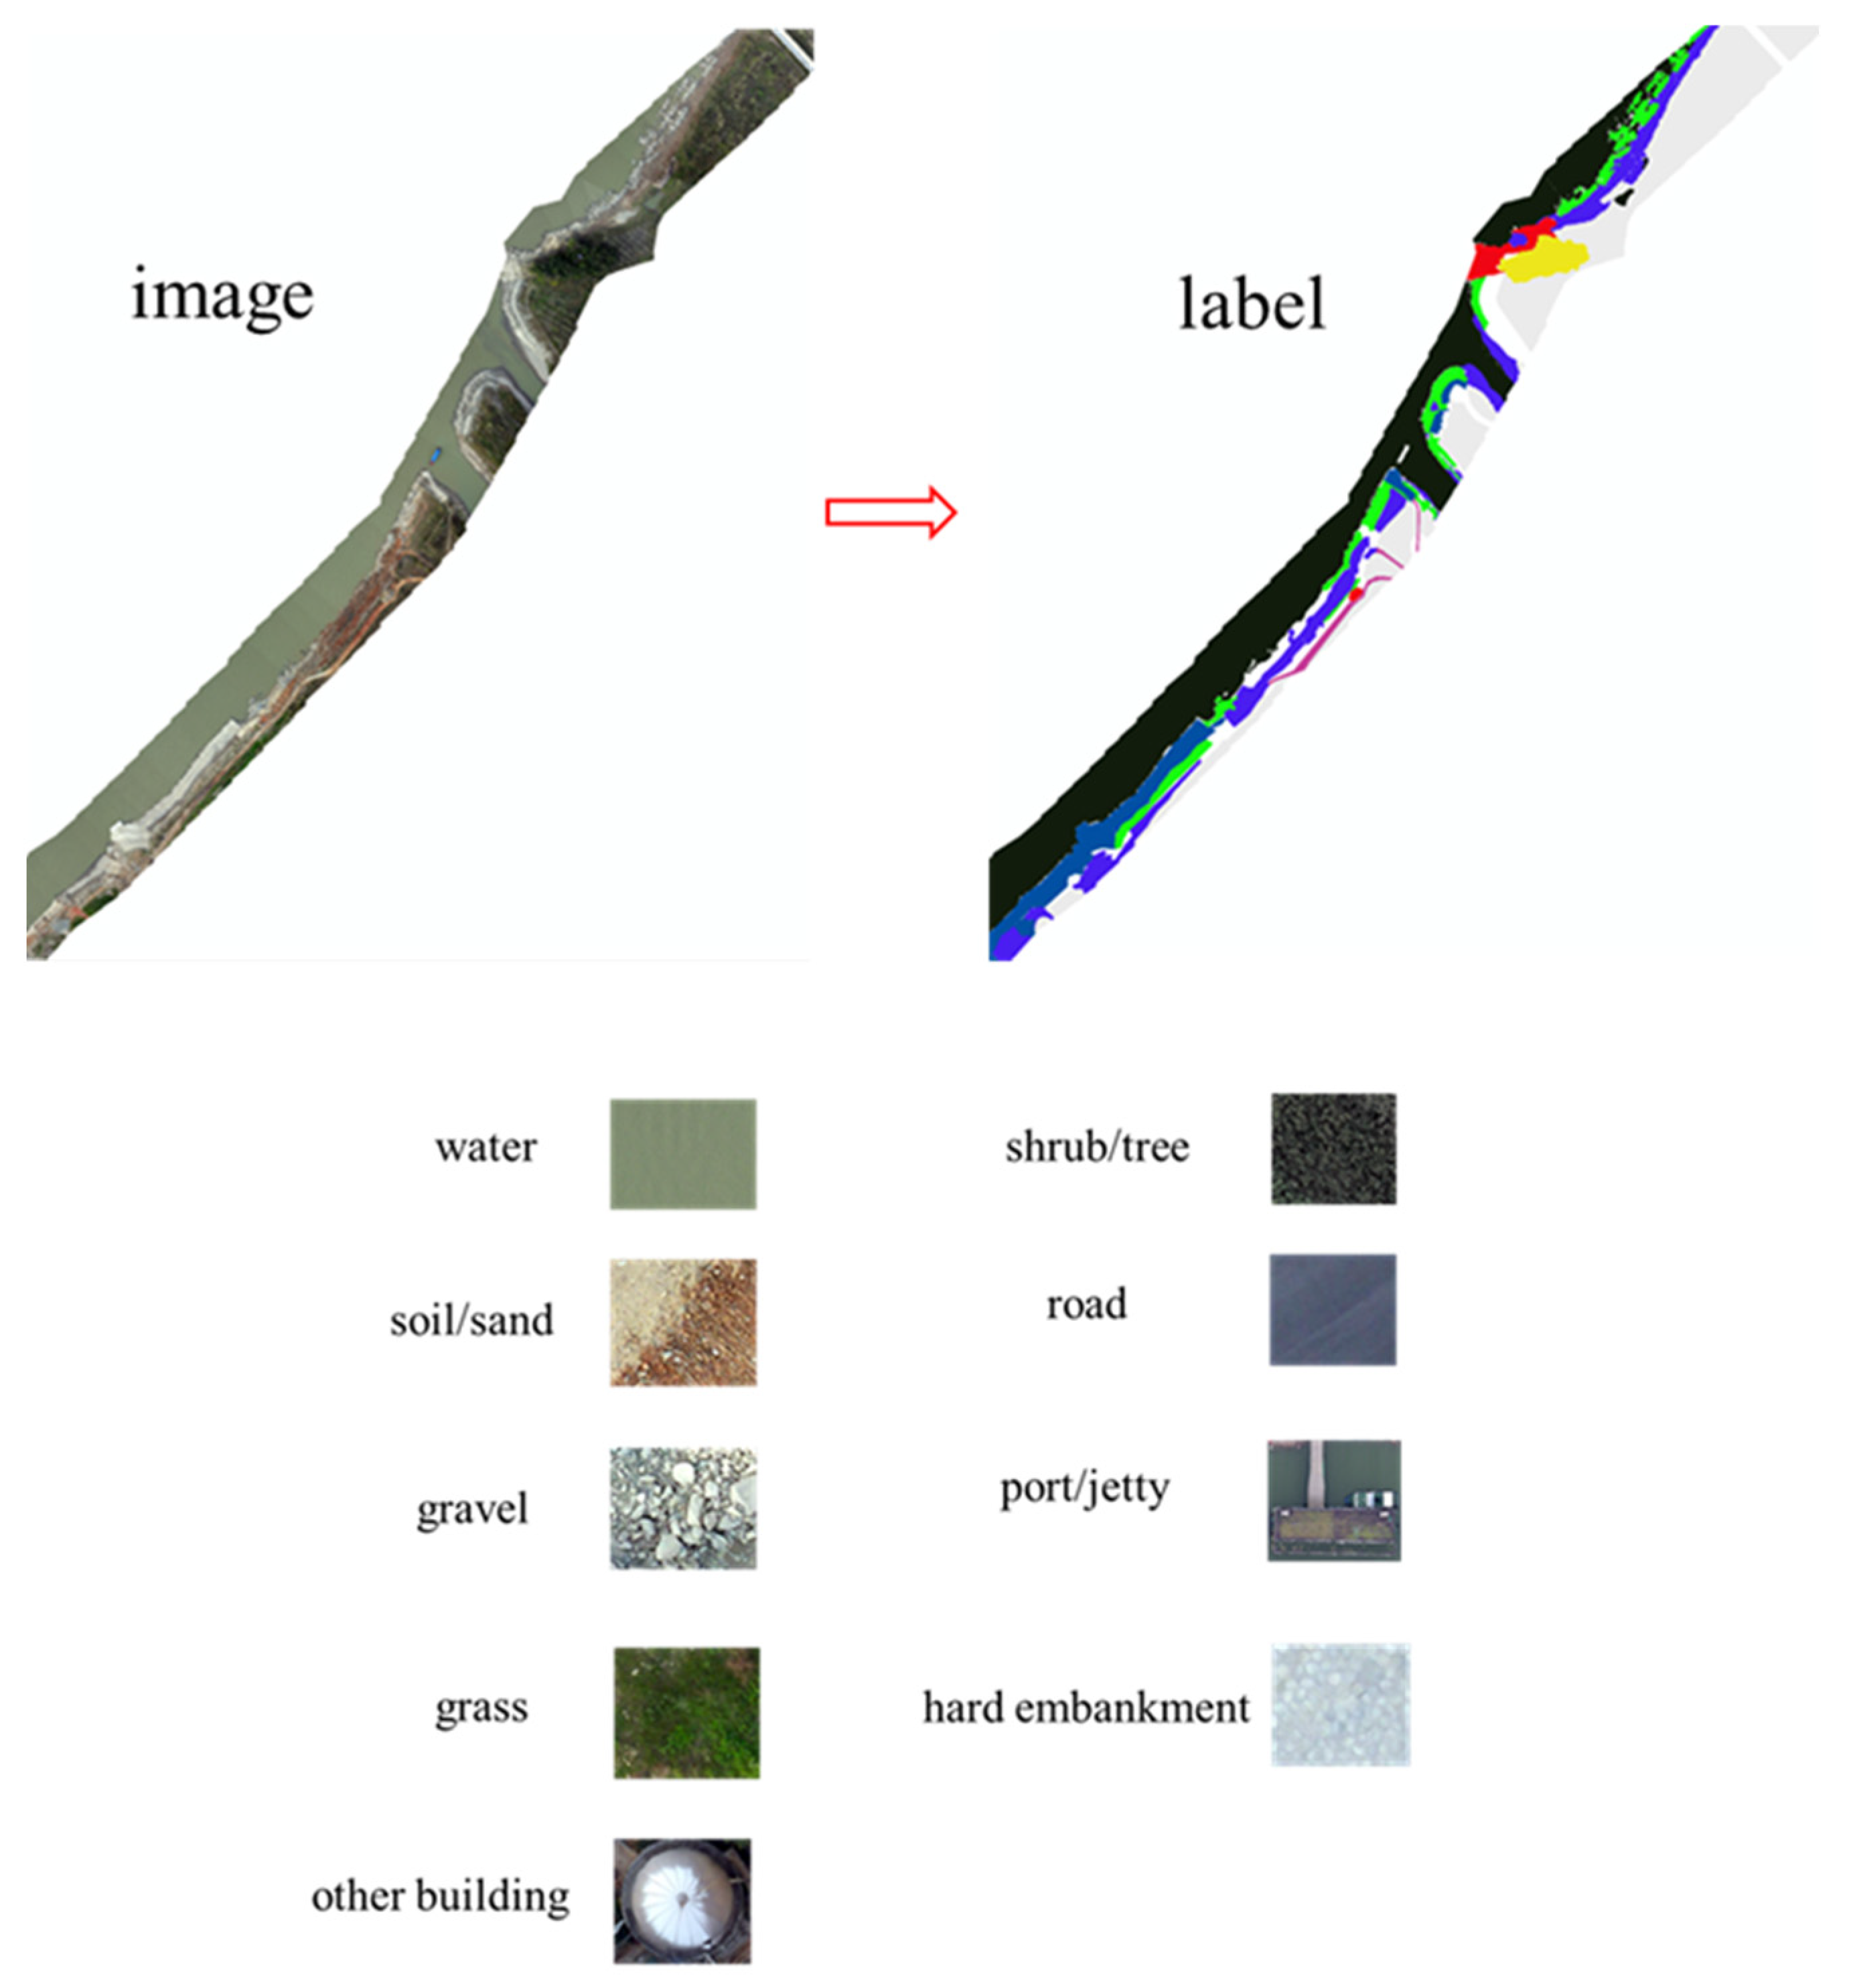
3.1. Data
3.2. Modeling Approach
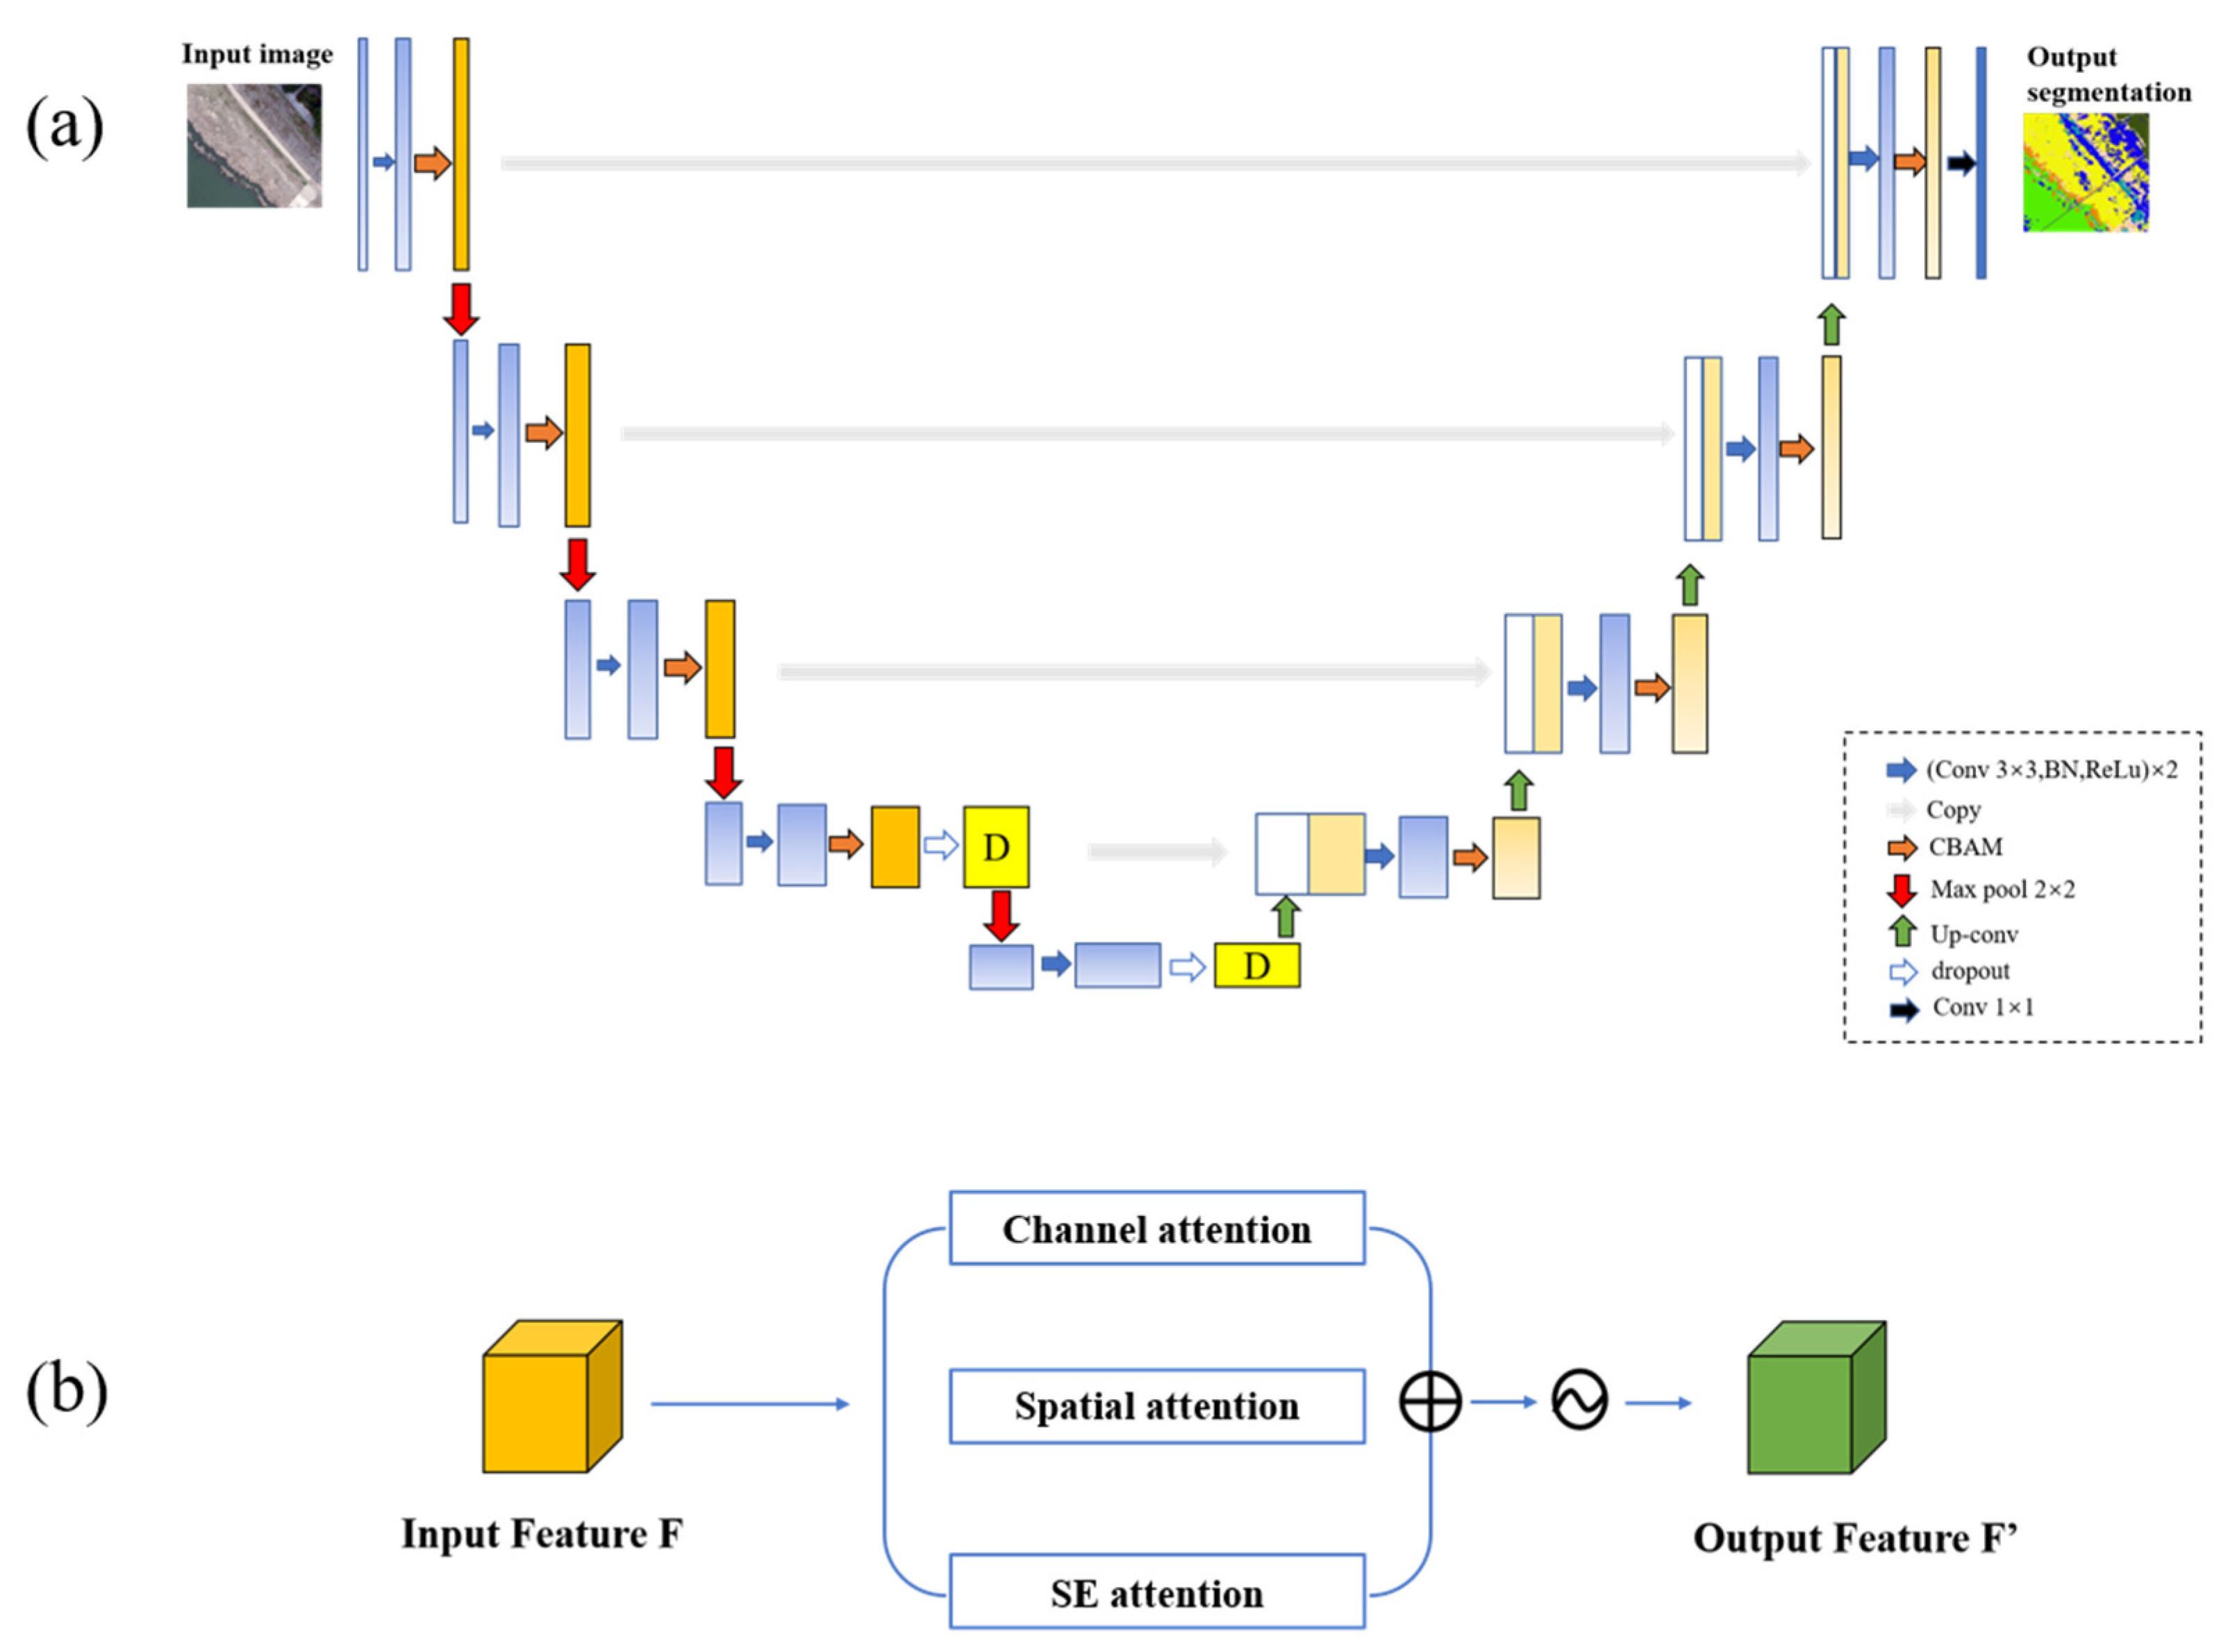
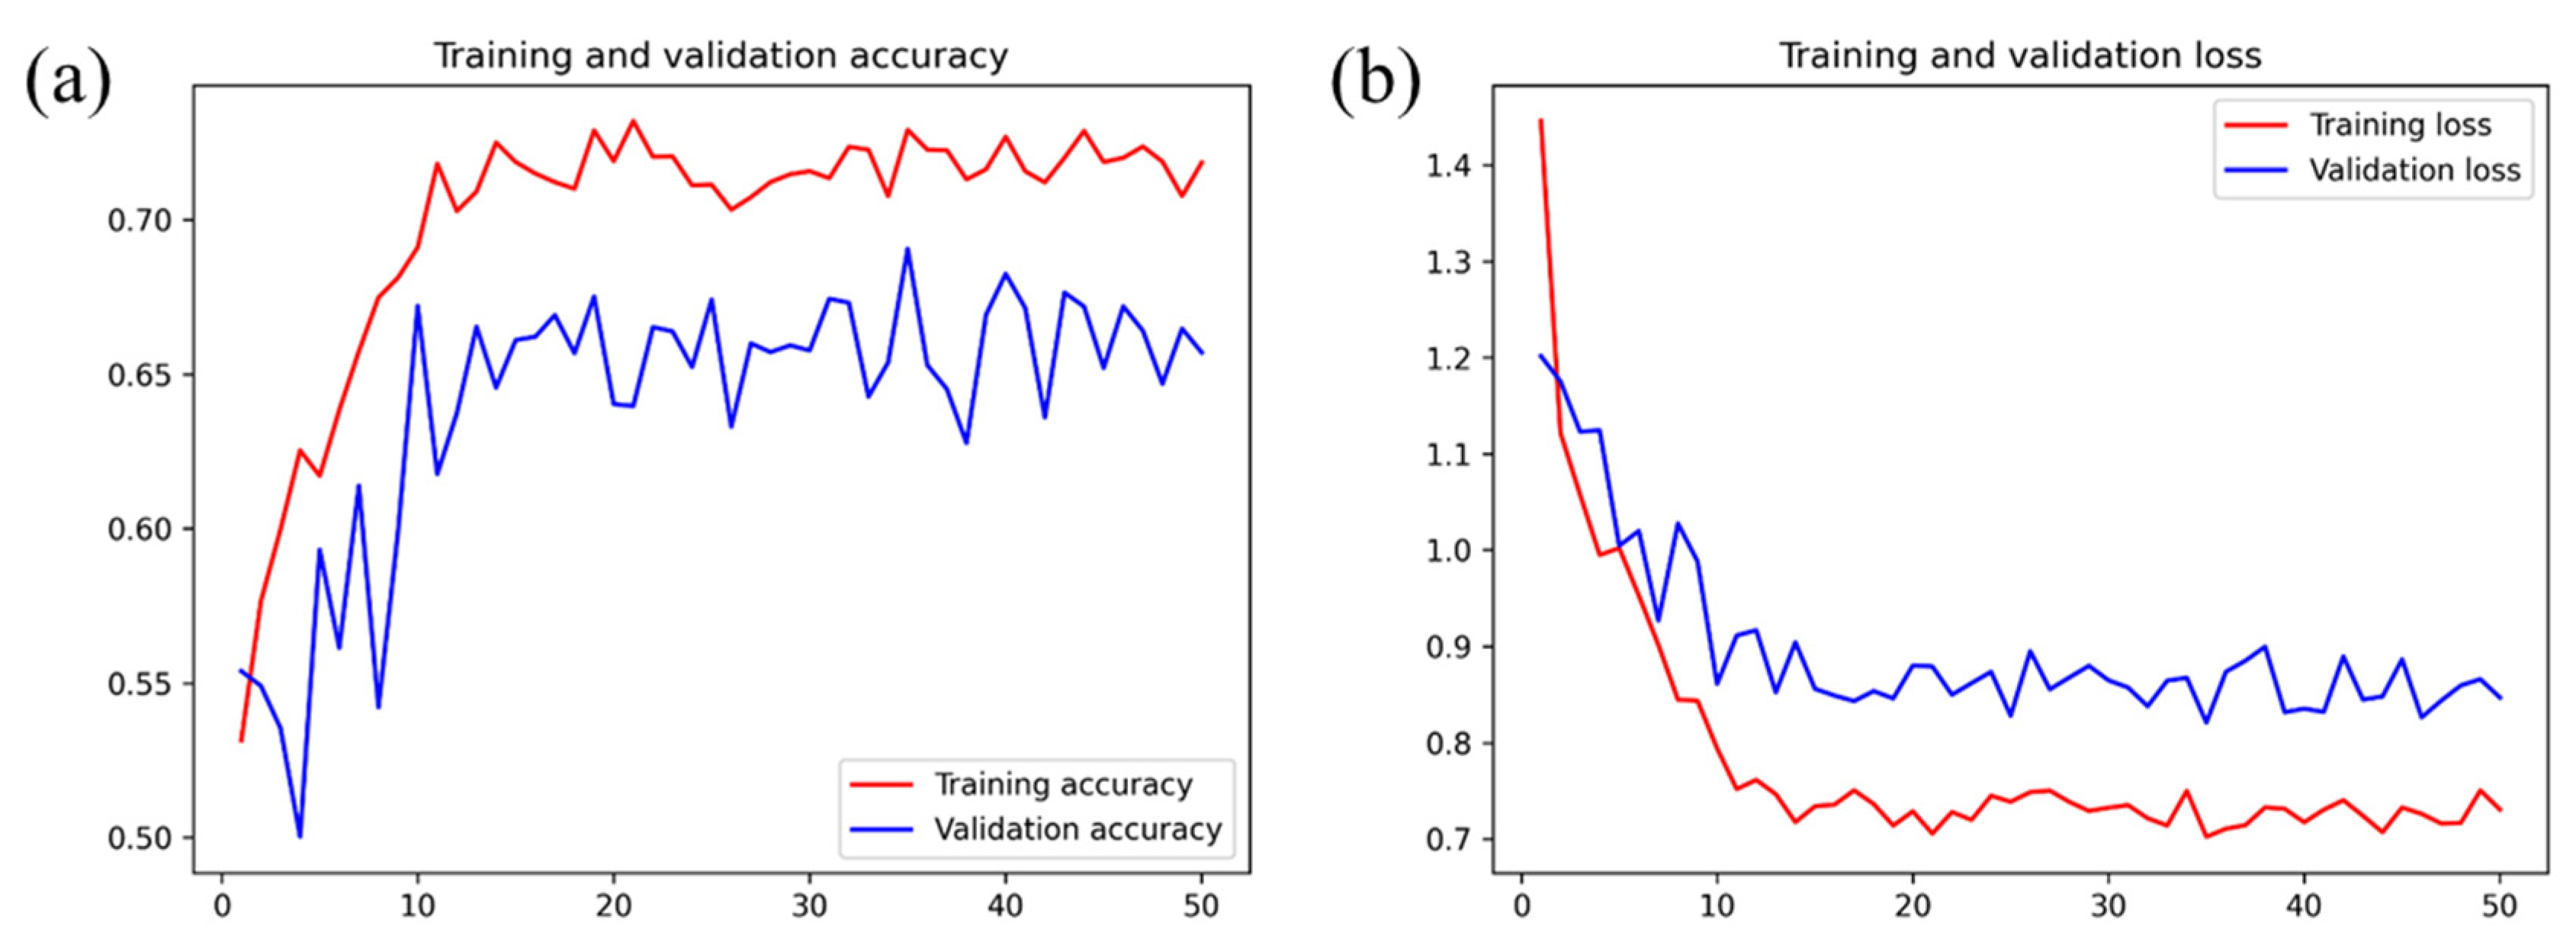
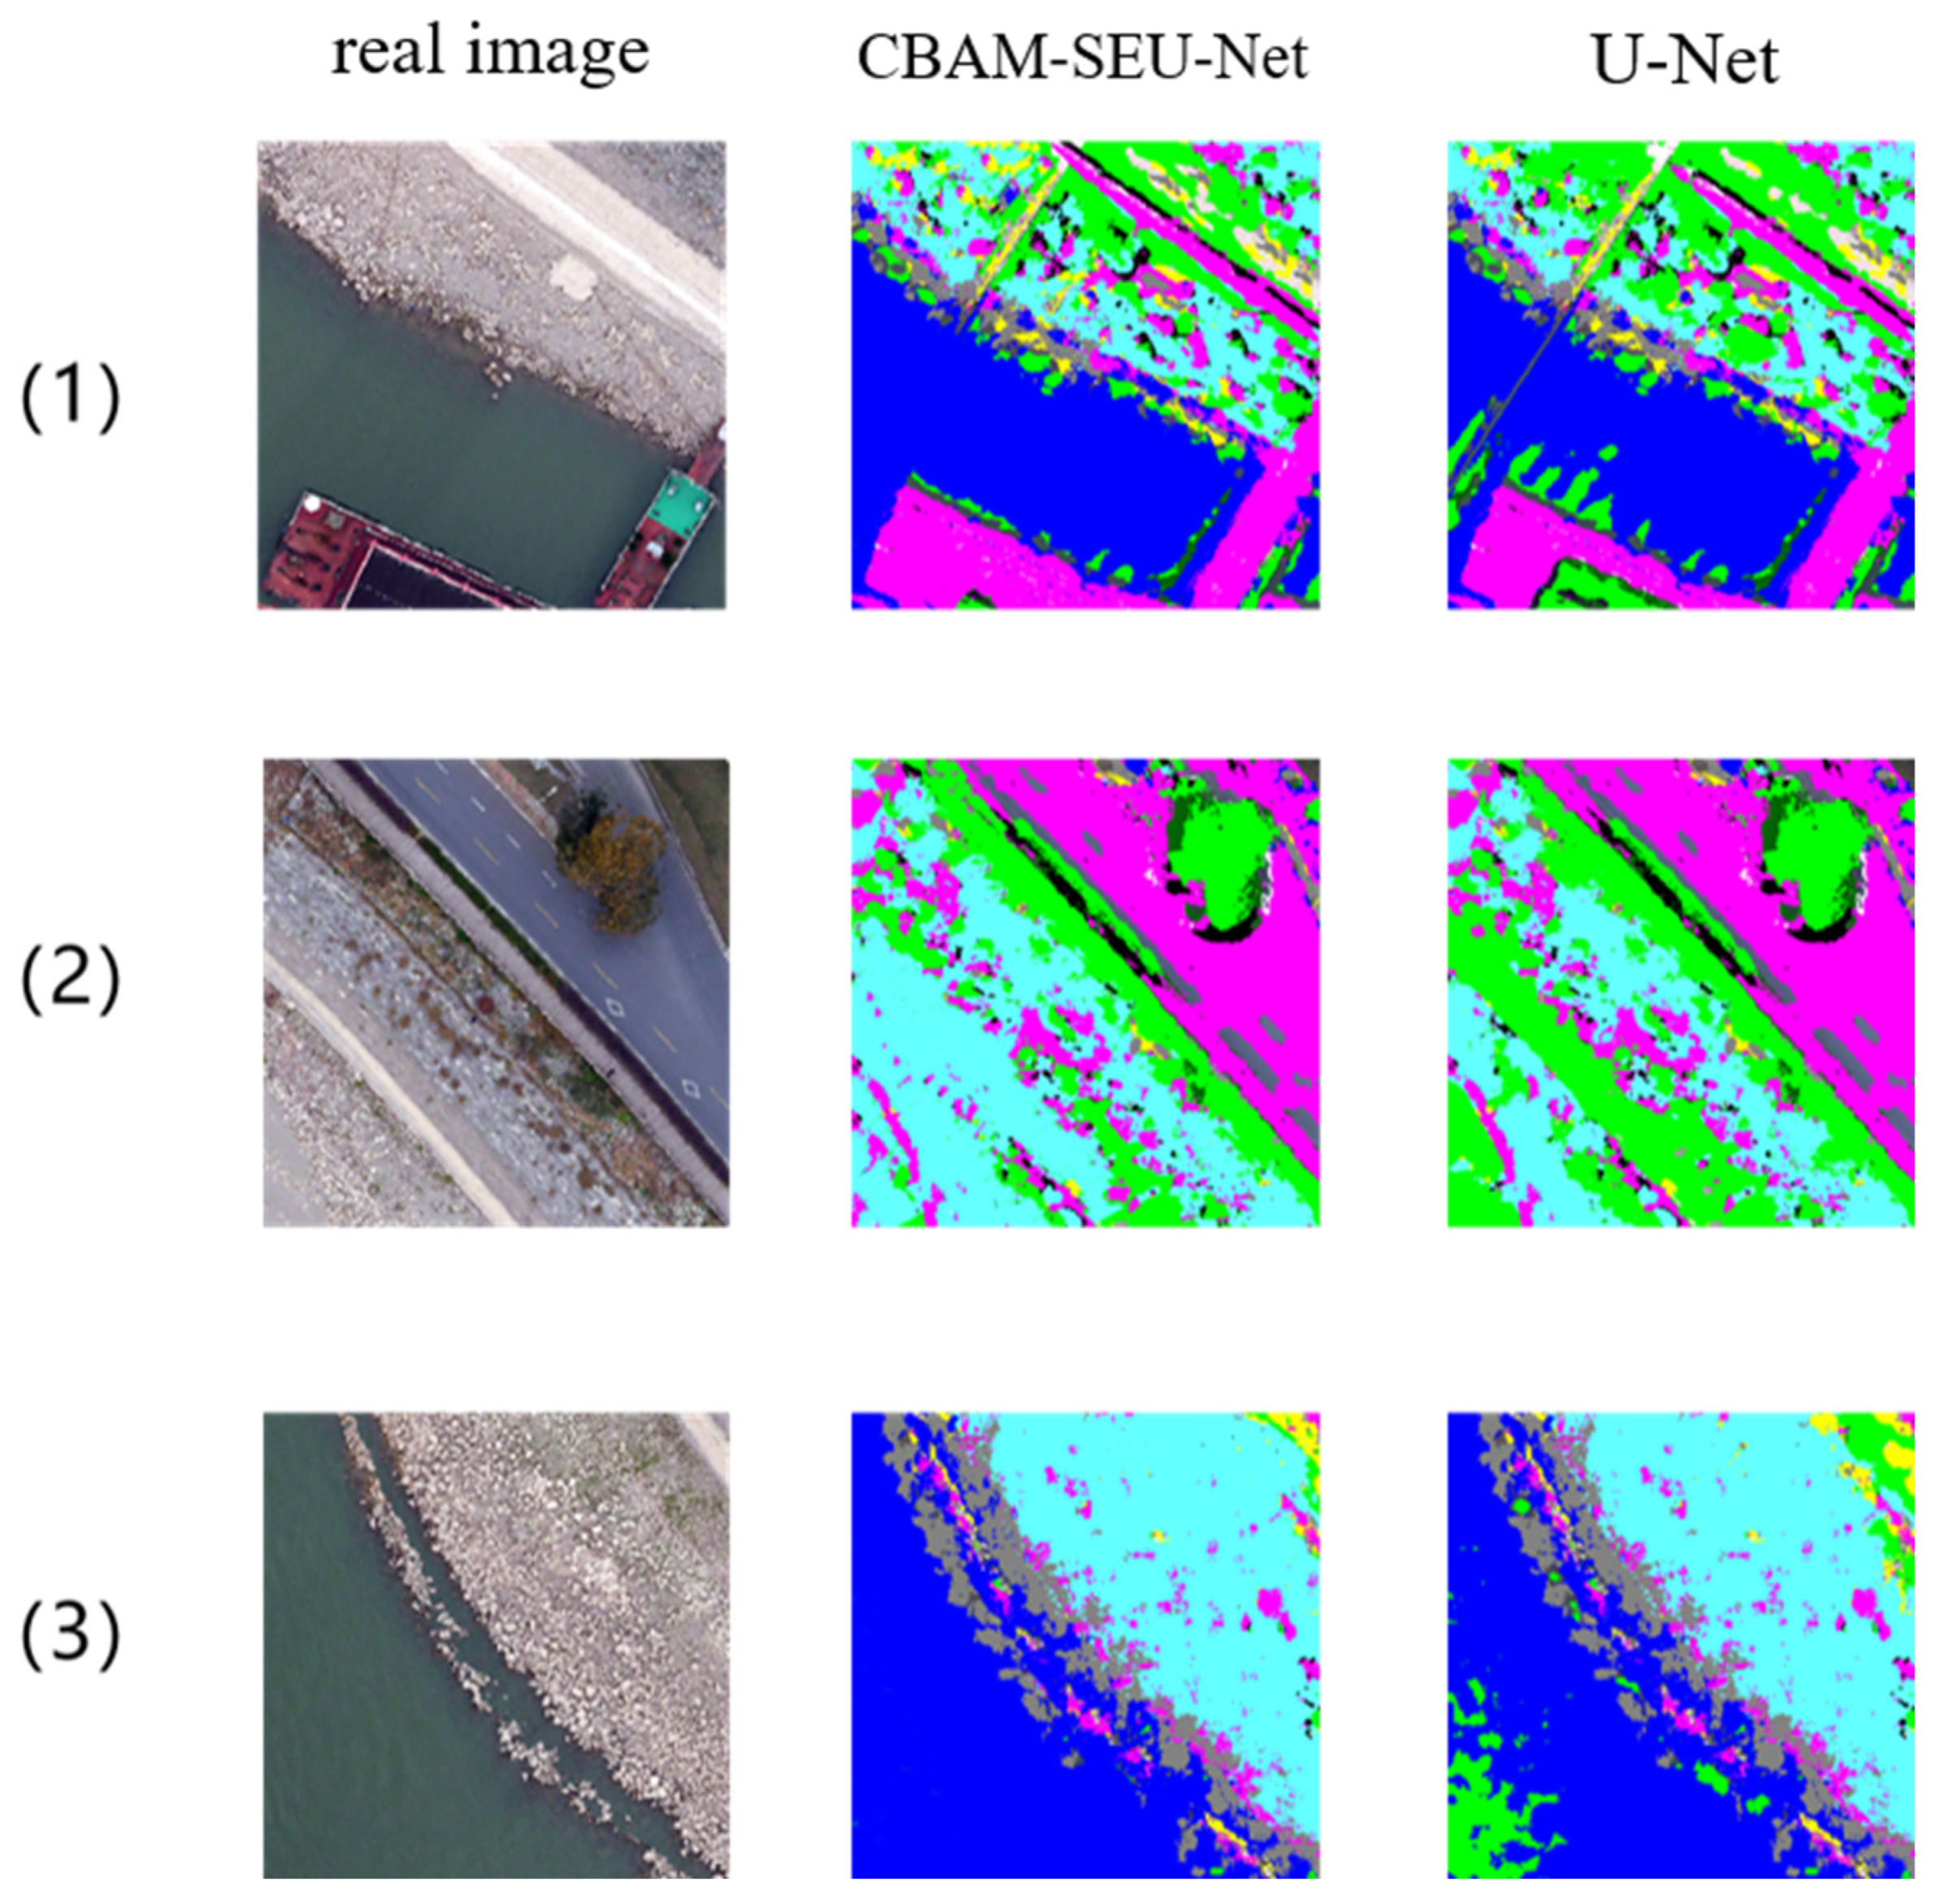
3.3. Model Structure
4. Results
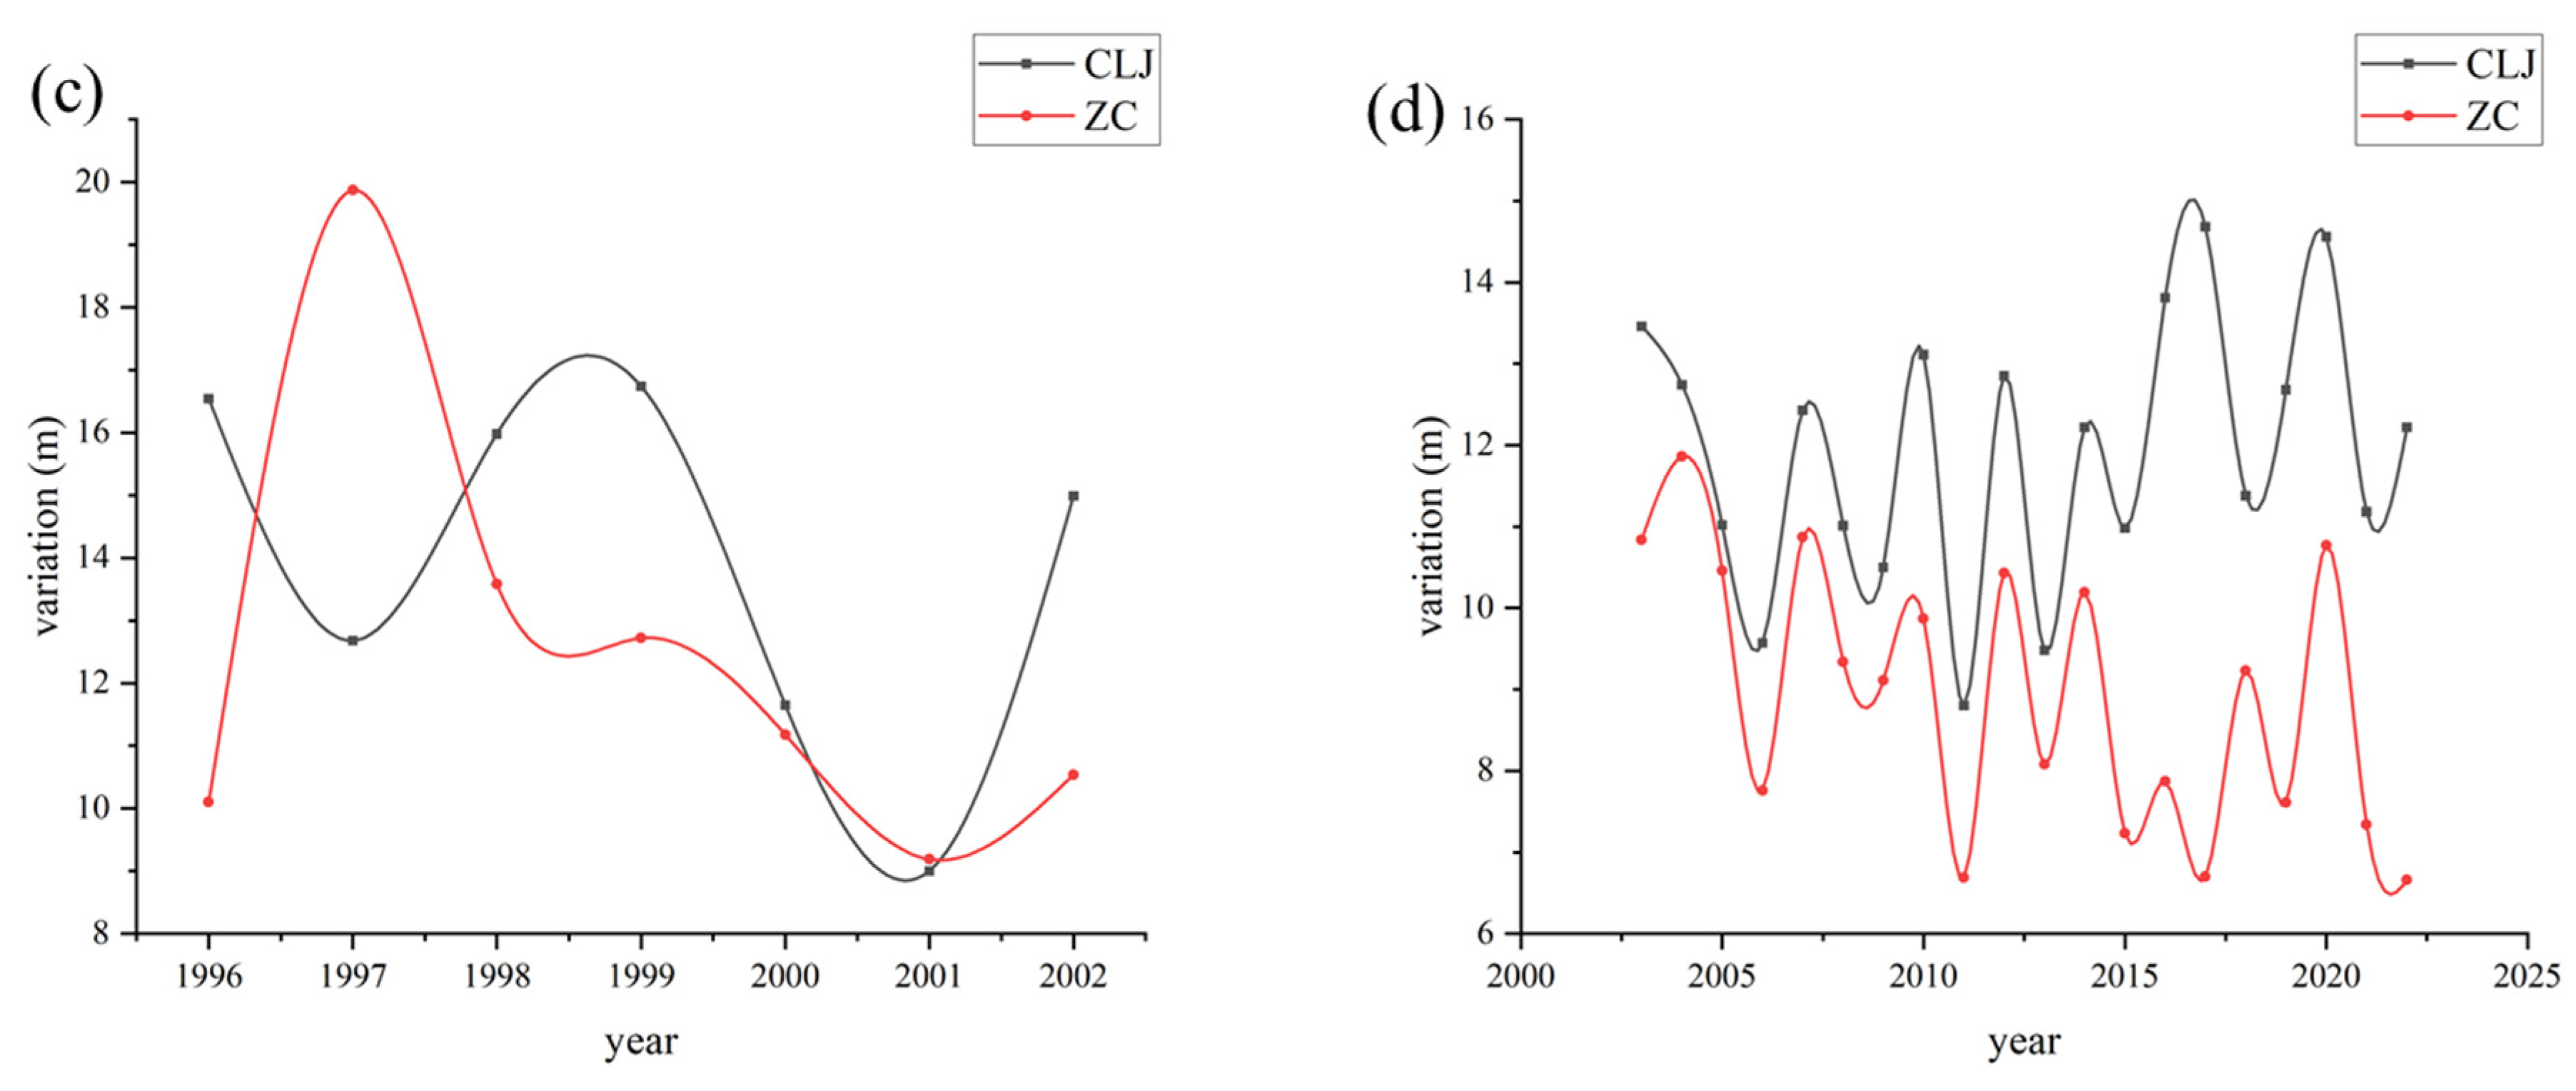
4.1. Inherent Hydrological Characteristics
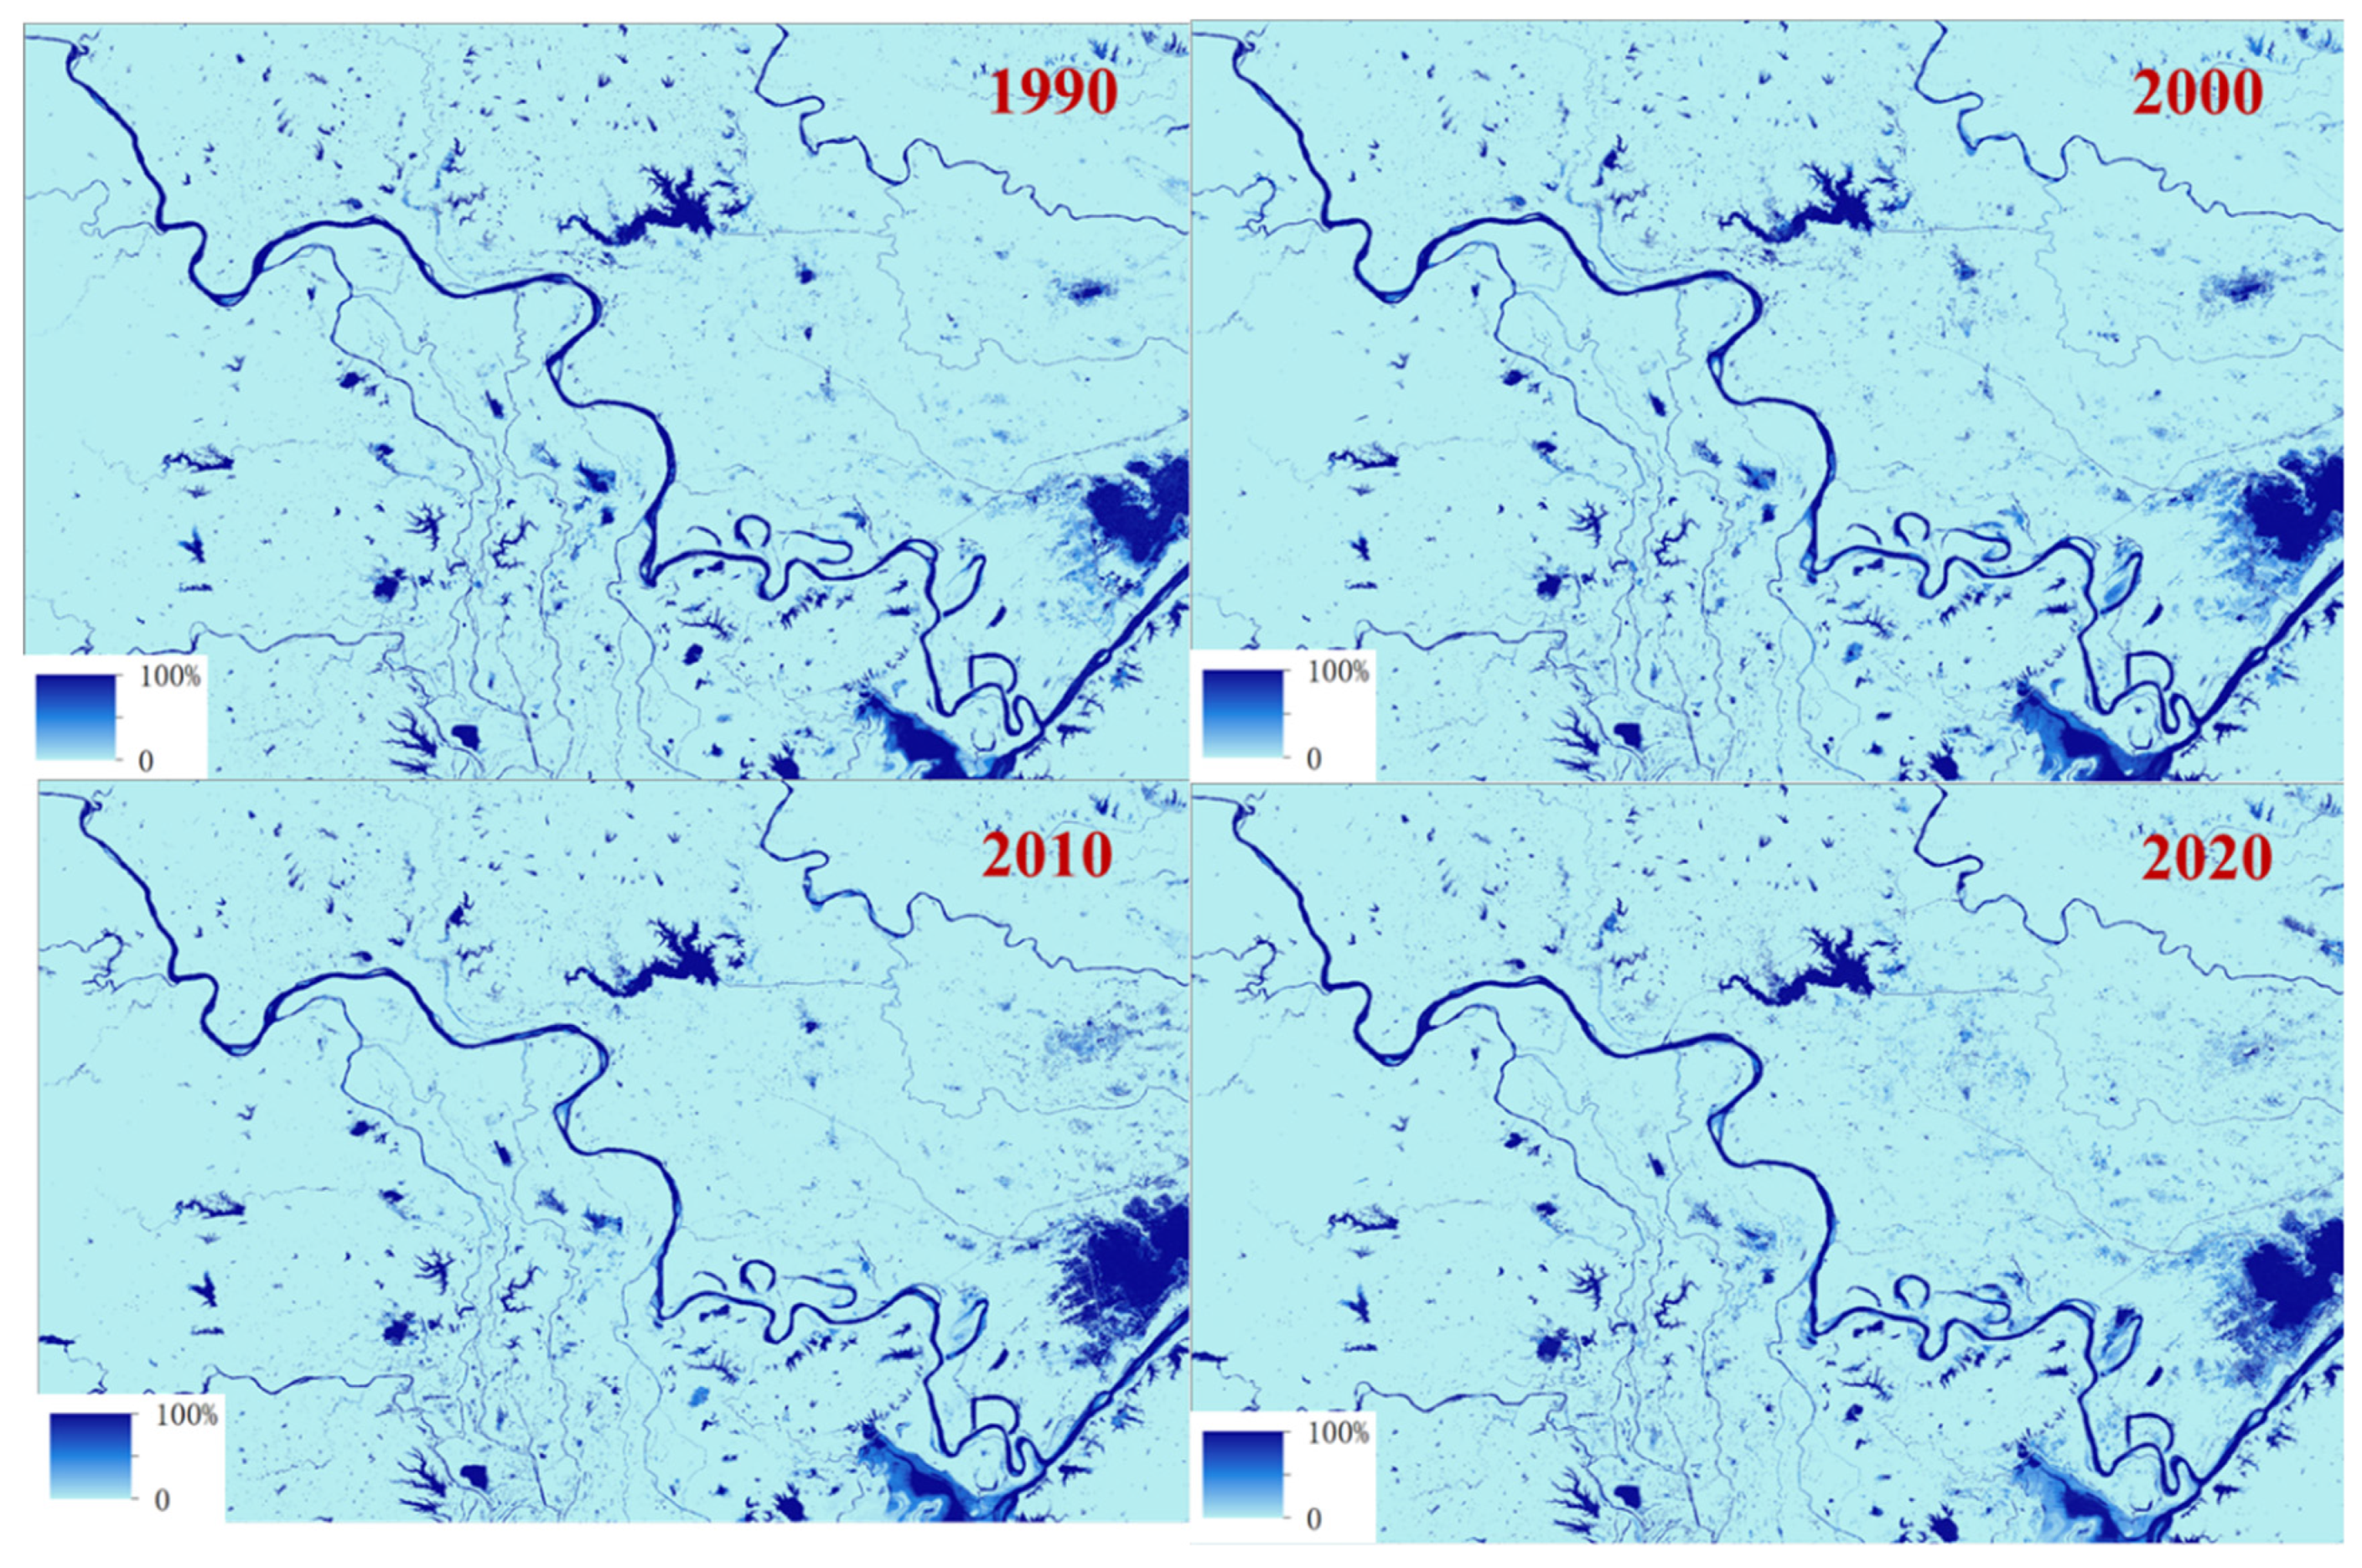
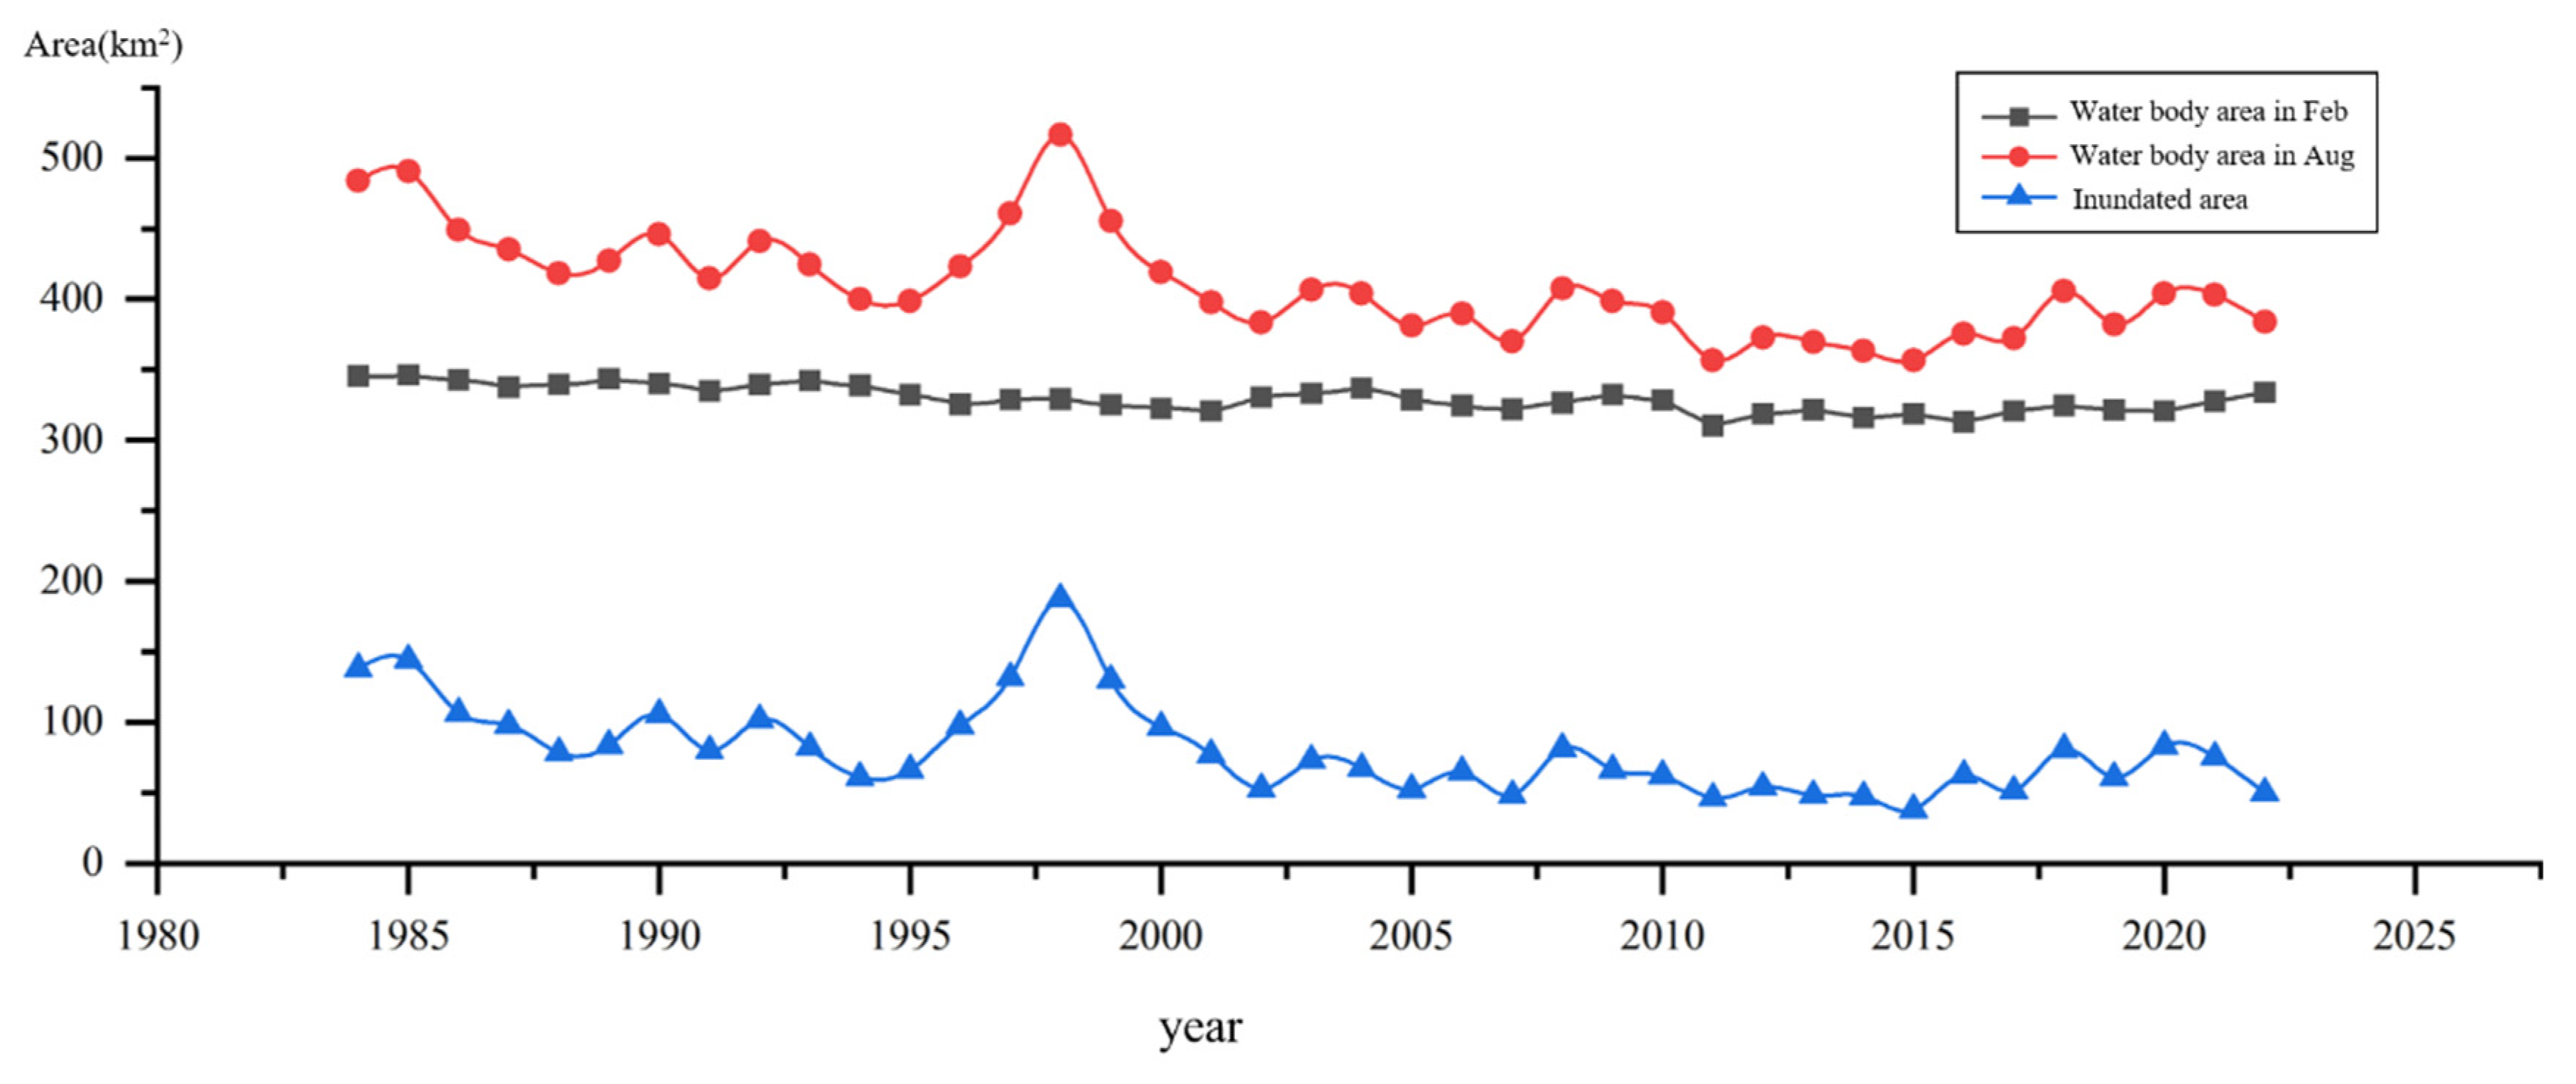
4.2. Inundated Range and Area
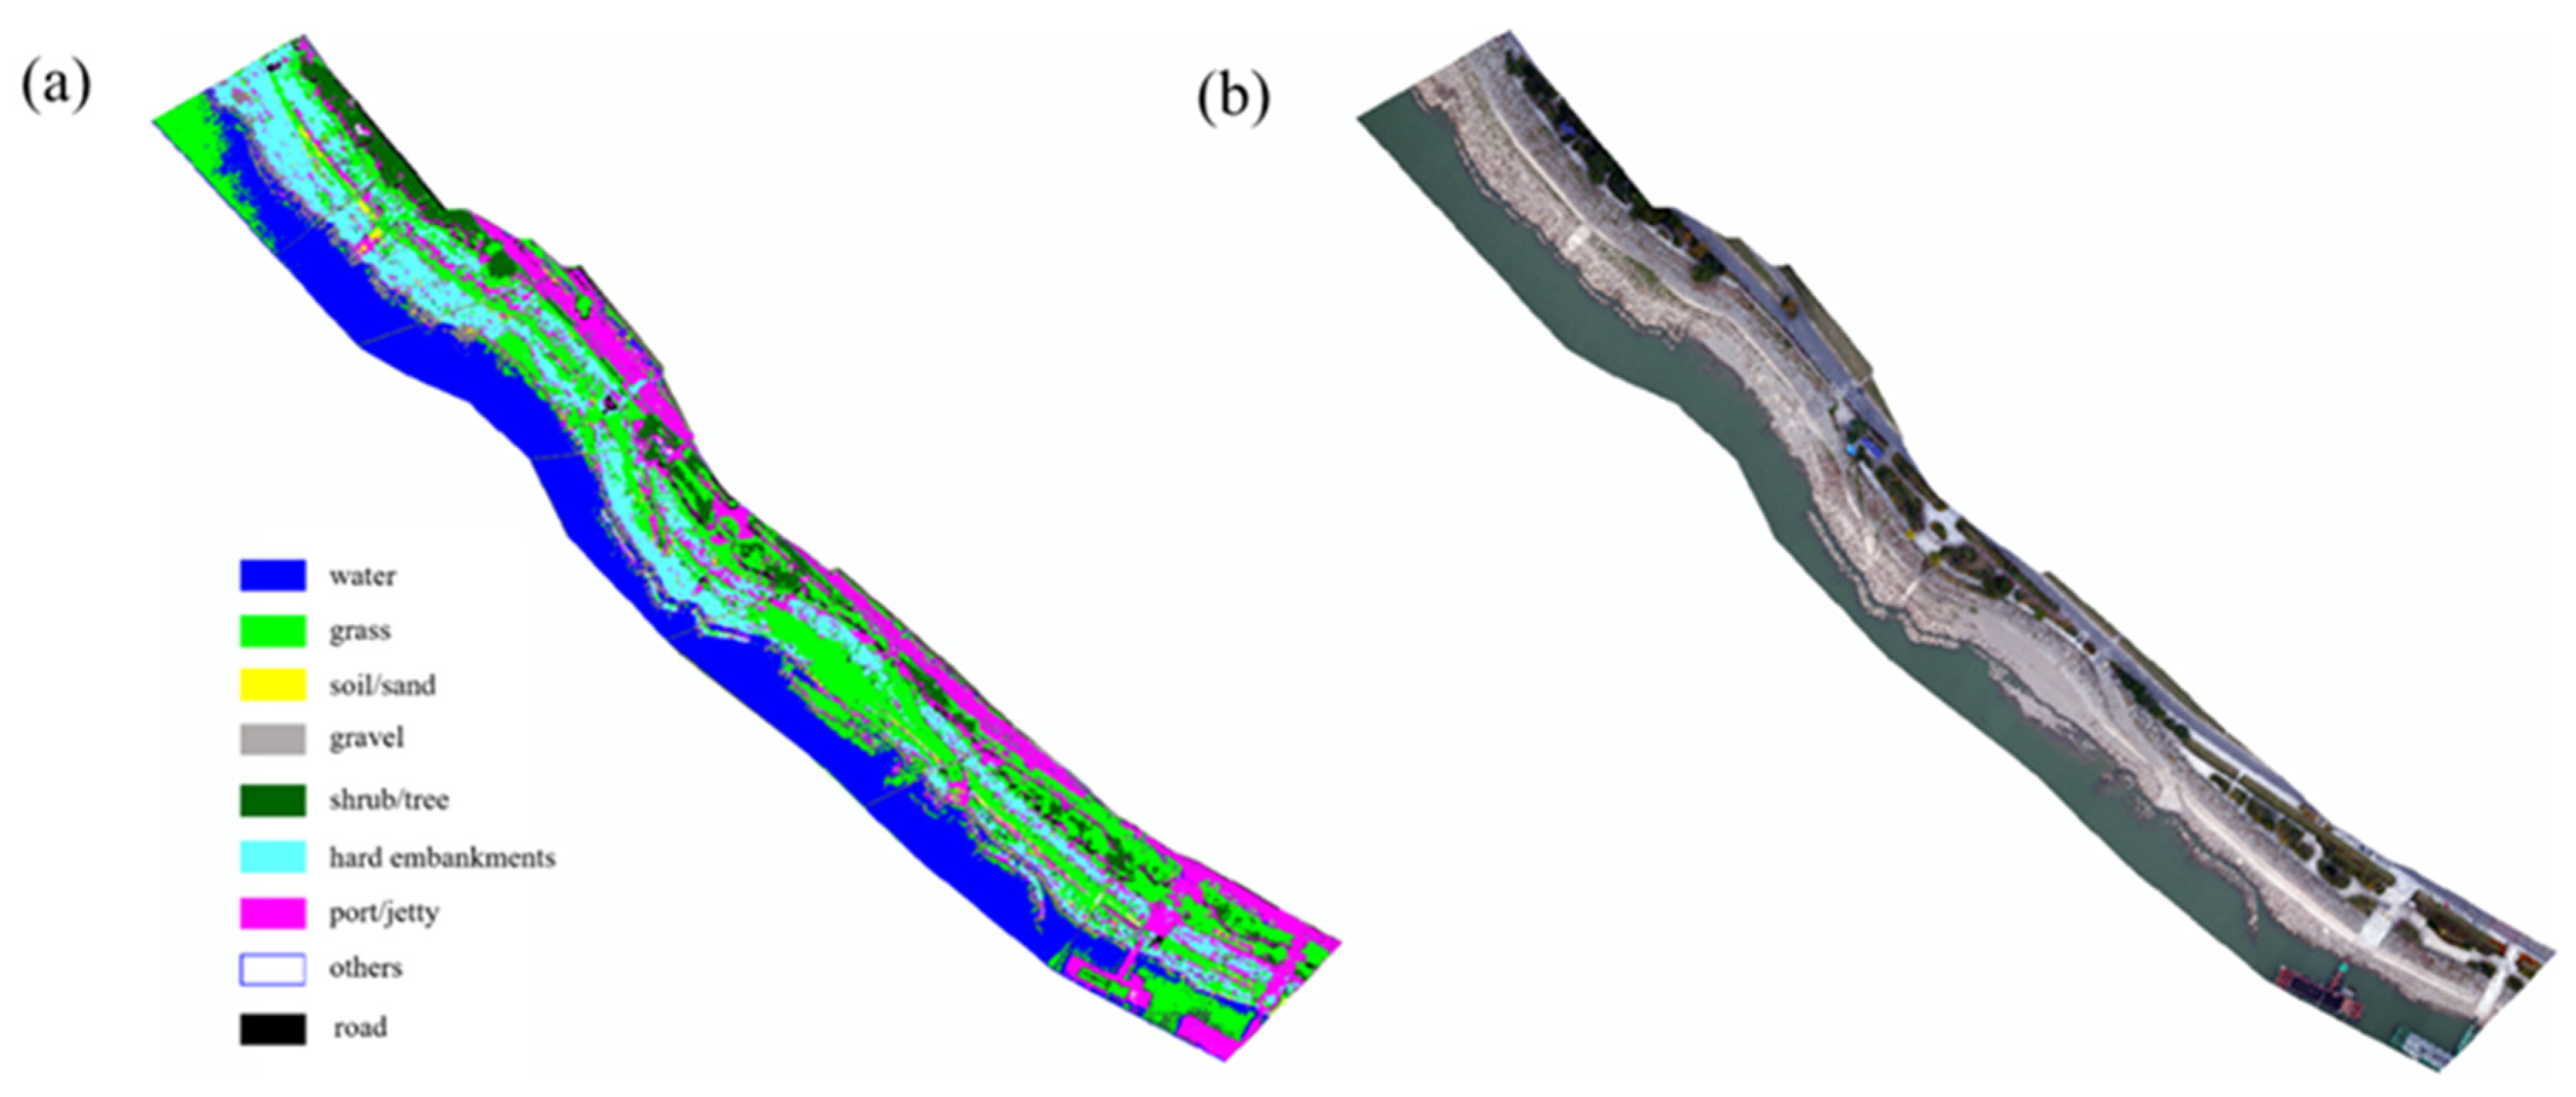
4.3. Categorization of Microhabitat Environmental Units in Inundated Zones
5. Discussion
5.1. Key Factors Influencing the Dynamics of Floodplain Inundation Extent
5.2. Drivers of Change in Environmental Units
5.3. Impacts of Alterations in Floodplain Inundation Areas on Ecosystem
6. Conclusions
Author Contributions
Funding
Data Availability Statement
Acknowledgments
Conflicts of Interest
References
- Bayley, P.B. Understanding Large River: Floodplain Ecosystems. BioScience 1995, 45, 153–158. [Google Scholar] [CrossRef]
- Nilsson, C.; Berggren, K. Alterations of Riparian Ecosystems Caused by River Regulation. Bioscience 2000, 50, 783–792. [Google Scholar] [CrossRef]
- Gregory, S.; Wildman, R.; Hulse, D.; Ashkenas, L.; Boyer, K. Historical Changes in Hydrology, Geomorphology, and Floodplain Vegetation of the Willamette River, Oregon. River Res. Appl. 2019, 35, 1279–1290. [Google Scholar] [CrossRef]
- Bayley, P.B. The Flood Pulse Advantage and the Restoration of River-floodplain Systems. Regul. Rivers Res. Mgmt. 1991, 6, 75–86. [Google Scholar] [CrossRef]
- Dziock, F.; Henle, K.; Foeckler, F.; Follner, K.; Scholz, M. Biological Indicator Systems in Floodplains—A Review. Int. Rev. Hydrobiol. 2006, 91, 271–291. [Google Scholar] [CrossRef]
- Richardson, J.S.; Taylor, E.; Schluter, D.; Pearson, M.; Hatfield, T. Do Riparian Zones Qualify as Critical Habitat for Endangered Freshwater Fishes? Can. J. Fish. Aquat. Sci. 2010, 67, 1197–1204. [Google Scholar] [CrossRef]
- Mouton, A.M.; Buysse, D.; Stevens, M.; Van Den Neucker, T.; Coeck, J. Evaluation of Riparian Habitat Restoration in a Lowland River. River Res. Appl. 2012, 28, 845–857. [Google Scholar] [CrossRef]
- Rood, S.B.; Scott, M.L.; Dixon, M.; González, E.; Marks, C.O.; Shafroth, P.B.; Volke, M.A. Ecological Interfaces between Land and Flowing Water: Themes and Trends in Riparian Research and Management. Wetlands 2020, 40, 1801–1811. [Google Scholar] [CrossRef]
- Bates, P.D.; Stewart, M.D.; Desitter, A.; Anderson, M.G.; Renaud, J.-P.; Smith, J.A. Numerical Simulation of Floodplain Hydrology. Water Resour. Res. 2000, 36, 2517–2529. [Google Scholar] [CrossRef]
- Ward, J.V.; Tockner, K.; Schiemer, F. Biodiversity of Floodplain River Ecosystems: Ecotones and Connectivity1. Regul. Rivers Res. Mgmt. 1999, 15, 125–139. [Google Scholar] [CrossRef]
- Benke, A.C. Importance of Flood Regime to Invertebrate Habitat in an Unregulated River–Floodplain Ecosystem. J. N. Am. Benthol. Soc. 2001, 20, 225–240. [Google Scholar] [CrossRef]
- Thoms, M.C.; Southwell, M.; McGinness, H.M. Floodplain–River Ecosystems: Fragmentation and Water Resources Development. Geomorphology 2005, 71, 126–138. [Google Scholar] [CrossRef]
- Ly, S.; Uk, S.; Theng, V.; Kaing, V.; Yoshimura, C. Integration of Life Cycle and Habitat Conditions in Modeling Fish Biomass in the Floodplain of the Lower Mekong Basin. Ecol. Model. 2024, 488, 110605. [Google Scholar] [CrossRef]
- Bournaud, M.; Tachet, H.; Berly, A.; Cellot, B. Importance of Microhabitat Characteristics in the Macrobenthos Microdistribution of a Large River Reach. Ann. Limnol. Int. J. Lim. 1998, 34, 83–98. [Google Scholar] [CrossRef]
- Tockner, K.; Stanford, J. Riverine Flood Plains: Present State and Future Trends. Environ. Conserv. 2002, 29, 308–330. [Google Scholar] [CrossRef]
- Rajib, A.; Zheng, Q.; Lane, C.R.; Golden, H.E.; Christensen, J.R.; Isibor, I.I.; Johnson, K. Human Alterations of the Global Floodplains 1992–2019. Sci. Data 2023, 10, 499. [Google Scholar] [CrossRef] [PubMed]
- Macfarlane, W.W.; Gilbert, J.T.; Gilbert, J.D.; Saunders, W.C.; Hough-Snee, N.; Hafen, C.; Wheaton, J.M.; Bennett, S.N. What Are the Conditions of Riparian Ecosystems? Identifying Impaired Floodplain Ecosystems across the Western U.S. Using the Riparian Condition Assessment (RCA) Tool. Environ. Manag. 2018, 62, 548–570. [Google Scholar] [CrossRef]
- Arantes, C.C.; Winemiller, K.O.; Asher, A.; Castello, L.; Hess, L.L.; Petrere, M.; Freitas, C.E.C. Floodplain Land Cover Affects Biomass Distribution of Fish Functional Diversity in the Amazon River. Sci. Rep. 2019, 9, 16684. [Google Scholar] [CrossRef]
- Zhang, N.; Fryirs, K. Trends in Post-1950 Riparian Vegetation Recovery in Coastal Catchments of NSW Australia: Implications for Remote Sensing Analysis, Forecasting and River Management. Earth Surf. Process. Landf. 2023, 48, 2152–2170. [Google Scholar] [CrossRef]
- Castello, L.; Bayley, P.B.; Fabré, N.N.; Batista, V.S. Flooding Effects on Abundance of an Exploited, Long-Lived Fish Population in River-Floodplains of the Amazon. Rev. Fish Biol. Fish. 2019, 29, 487–500. [Google Scholar] [CrossRef]
- Stoffers, T.; Buijse, A.D.; Geerling, G.W.; Jans, L.H.; Schoor, M.M.; Poos, J.J.; Verreth, J.A.J.; Nagelkerke, L.A.J. Freshwater Fish Biodiversity Restoration in Floodplain Rivers Requires Connectivity and Habitat Heterogeneity at Multiple Spatial Scales. Sci. Total Environ. 2022, 838, 156509. [Google Scholar] [CrossRef]
- Petsch, D.K.; Cionek, V.D.M.; Thomaz, S.M.; dos Santos, N.C.L. Ecosystem Services Provided by River-Floodplain Ecosystems. Hydrobiologia 2023, 850, 2563–2584. [Google Scholar] [CrossRef]
- Lan, D.; Rui-Hong, Y. New Grassland Riparian Zone Delineation Method for Calculating Ecological Water Demand to Guide Management Goals. River Res. Appl. 2020, 36, 1838–1851. [Google Scholar] [CrossRef]
- Chen, L.; Wu, Y.; Xu, Y.J.; Zhang, G. Alteration of Flood Pulses by Damming the Nenjiang River, China—Implication for the Need to Identify a Hydrograph-Based Inundation Threshold for Protecting Floodplain Wetlands. Ecol. Indic. 2021, 124, 107406. [Google Scholar] [CrossRef]
- Nuhlíčková, S.; Svetlík, J.; Šibíková, M.; Jarolímek, I.; Zuna-Kratky, T. Current Distribution, Microhabitat Requirements and Vulnerability of the Keeled Plump Bush-Cricket (Isophya Costata) at the North-Western Periphery of Its Range. J. Insect Conserv. 2021, 25, 65–76. [Google Scholar] [CrossRef]
- Tan, Z.; Wang, X.; Li, Y.; Zhang, Z.; Xue, C.; Yao, J.; You, H. The Impact of Three Gorges Dam on the Hydrological Connectivity of “off-Stream” Floodplains. J. Hydrol. 2024, 629, 130619. [Google Scholar] [CrossRef]
- Barnas, A.F.; Darby, B.J.; Vandeberg, G.S.; Rockwell, R.F.; Ellis-Felege, S.N. A Comparison of Drone Imagery and Ground-Based Methods for Estimating the Extent of Habitat Destruction by Lesser Snow Geese (Anser Caerulescens Caerulescens) in La Pérouse Bay. PLoS ONE 2019, 14, e0217049. [Google Scholar] [CrossRef]
- Schumann, G.J.-P.; Muhlhausen, J.; Andreadis, K.M. Rapid Mapping of Small-Scale River-Floodplain Environments Using UAV SfM Supports Classical Theory. Remote Sens. 2019, 11, 982. [Google Scholar] [CrossRef]
- Ivošević, B.; Lugonja, P.; Brdar, S.; Radulović, M.; Vujić, A.; Valente, J. UAV-Based Land Cover Classification for Hoverfly (Diptera: Syrphidae) Habitat Condition Assessment: A Case Study on Mt. Stara Planina (Serbia). Remote Sens. 2021, 13, 3272. [Google Scholar] [CrossRef]
- Hauer, F.R.; Lorang, M.S.; Gonser, T. Remote Sensing to Characterize River Floodplain Structure and Function. Remote Sens. 2022, 14, 1132. [Google Scholar] [CrossRef]
- McFeeters, S.K. The Use of the Normalized Difference Water Index (NDWI) in the Delineation of Open Water Features. Int. J. Remote Sens. 1996, 17, 1425–1432. [Google Scholar] [CrossRef]
- Gao, B.C. NDWI—A normalized difference water index for remote sensing of vegetation liquid water from space. Remote Sens. Environ. 1996, 58, 257–266. [Google Scholar] [CrossRef]
- Han-Qiu, X.U. A Study on Information Extraction of Water Body with the Modified Normalized Difference Water Index (MNDWI). J. Remote Sens. 2005, 9, 589–595. [Google Scholar] [CrossRef]
- Ronneberger, O.; Fischer, P.; Brox, T. U-Net: Convolutional Networks for Biomedical Image Segmentation. In Proceedings of the Medical Image Computing and Computer-Assisted Intervention—MICCAI 2015, Munich, Germany, 5 October 2015. [Google Scholar]
- Zhang, Y.; Kong, J.; Long, S.; Zhu, Y.; He, F. Convolutional Block Attention Module U-Net: A Method to Improve Attention Mechanism and U-Net for Remote Sensing Images. J. Appl. Remote Sens. 2022, 16, 026516. [Google Scholar] [CrossRef]
- Woo, S.; Park, J.; Lee, J.-Y.; Kweon, I.S. CBAM: Convolutional Block Attention Module 2018. In Proceedings of the 15th European Conference, Munich, Germany, 8–14 September 2018. [Google Scholar]
- Hu, J.; Shen, L.; Albanie, S.; Sun, G.; Wu, E. Squeeze-and-Excitation Networks 2019. IEEE Access 2019, 42, 2011–2023. [Google Scholar]
- Kong, J.; Gao, Y.; Zhang, Y.; Lei, H.; Wang, Y.; Zhang, H. Improved Attention Mechanism and Residual Network for Remote Sensing Image Scene Classification. IEEE Access 2021, 9, 134800–134808. [Google Scholar] [CrossRef]
- Amjoud, A.B.; Amrouch, M. Object Detection Using Deep Learning, CNNs and Vision Transformers: A Review. IEEE Access 2023, 11, 35479–35516. [Google Scholar] [CrossRef]
- Jiang, J.; Feng, X.A.; Ye, Q.; Hu, Z.; Gu, Z.; Huang, H. Semantic Segmentation of Remote Sensing Images Combined with Attention Mechanism and Feature Enhancement U-Net. Int. J. Remote Sens. 2023, 44, 6219–6232. [Google Scholar] [CrossRef]
- Yang, J.; Huang, X. The 30 m Annual Land Cover Dataset and Its Dynamics in China from 1990 to 2019. Earth Syst. Sci. Data 2021, 13, 3907–3925. [Google Scholar] [CrossRef]
- Hupp, C.R.; Pierce, A.R.; Noe, G.B. Floodplain Geomorphic Processes and Environmental Impacts of Human Alteration along Coastal Plain Rivers, USA. Wetlands 2009, 29, 413–429. [Google Scholar] [CrossRef]
- Asselman, N.E.M.; Middelkoop, H. Floodplain Sedimentation: Quantities, Patterns and Processes. Earth Surf. Processes Landf. 1995, 20, 481–499. [Google Scholar] [CrossRef]
- Jiao, C.; Wu, X.; Song, S.; Wang, S.; Xiang, B.; Fu, B. River Stabilization Reshaped Human-Nature Interactions in the Lower Yellow River Floodplain. J. Environ. Manag. 2024, 371, 122957. [Google Scholar] [CrossRef] [PubMed]
- Hsu, C.-Y.; Ou, S.-J. A Study on Application of Ecological Engineering Methods to a River Pollution Remediation—Case Study of Liuchuan River. IOP Conf. Ser. Earth Environ. Sci. 2019, 291, 012021. [Google Scholar] [CrossRef]
- Tang, C.; Yan, Q.; Li, W.; Yang, X.; Zhang, S. Impact of Dam Construction on the Spawning Grounds of the Four Major Chinese Carps in the Three Gorges Reservoir. J. Hydrol. 2022, 609, 127694. [Google Scholar] [CrossRef]
- Xiao, Y.; Deng, J.; Yang, S.; Hu, J.; Wang, L.; Li, W. Study on the Spawning Habitat Suitability of Four Major Chinese Carps in the Fluctuating Backwater Area of the Three Gorges Reservoir. Ecol. Indic. 2022, 143, 109314. [Google Scholar] [CrossRef]
- Rosenfeld, J.S.; Hatfield, T. Information Needs for Assessing Critical Habitat of Freshwater Fish. Can. J. Fish. Aquat. Sci. 2006, 63, 683–698. [Google Scholar] [CrossRef]
- Deng, Q.; Zhang, X.; Zhao, Z.; Tang, W. Conservation and Restoration of Riverine Spawning Habitats Require Fine-Scale Functional Connectivity and Functional Heterogeneity. Sci. Total Environ. 2023, 857, 159571. [Google Scholar] [CrossRef]


| Year | Water Body Area in Feburary (km2) | Water Body Area in August (km2) | Inundated Area (km2) |
|---|---|---|---|
| 1984 | 345.6 | 483.8 | 138.2 |
| 1985 | 346.3 | 490.7 | 144.4 |
| 1986 | 342.8 | 449.3 | 106.5 |
| 1987 | 337.5 | 435.5 | 98 |
| 1988 | 339.6 | 418.2 | 78.6 |
| 1989 | 343.5 | 427.2 | 83.7 |
| 1990 | 340.1 | 445.8 | 105.7 |
| 1991 | 334.8 | 414.7 | 79.9 |
| 1992 | 339.3 | 441.1 | 101.8 |
| 1993 | 342.3 | 424.5 | 82.2 |
| 1994 | 338.9 | 399.9 | 61 |
| 1995 | 332.1 | 398.5 | 66.4 |
| 1996 | 325.5 | 423.2 | 97.7 |
| 1997 | 328.9 | 460.6 | 131.7 |
| 1998 | 329.1 | 516.7 | 187.6 |
| 1999 | 325.3 | 455.4 | 130.1 |
| 2000 | 322.5 | 419.3 | 96.8 |
| 2001 | 320.9 | 397.9 | 77 |
| 2002 | 330.6 | 383.5 | 52.9 |
| 2003 | 333.4 | 406.7 | 73.3 |
| 2004 | 336.8 | 404.2 | 67.4 |
| 2005 | 328.6 | 381.2 | 52.6 |
| 2006 | 324.6 | 389.5 | 64.9 |
| 2007 | 321.9 | 370.2 | 48.3 |
| 2008 | 326.3 | 407.8 | 81.5 |
| 2009 | 332.4 | 398.8 | 66.4 |
| 2010 | 328.3 | 390.7 | 62.4 |
| 2011 | 310.2 | 356.7 | 46.5 |
| 2012 | 318.6 | 372.7 | 54.1 |
| 2013 | 321.5 | 369.7 | 48.2 |
| 2014 | 315.9 | 363.3 | 47.4 |
| 2015 | 318.6 | 356.8 | 38.2 |
| 2016 | 312.9 | 375.5 | 62.6 |
| 2017 | 320.9 | 372.2 | 51.3 |
| 2018 | 324.7 | 405.8 | 81.1 |
| 2019 | 321.3 | 382.3 | 61 |
| 2020 | 320.8 | 404.2 | 83.4 |
| 2021 | 327.8 | 403.2 | 75.4 |
| 2022 | 333.8 | 383.8 | 50 |
| Model | OA | mIoU | FWIoU |
|---|---|---|---|
| CBAM-SEU-Net | 81.85% | 54.56% | 70.79% |
| U-Net | 65.46% | 41.83% | 51.39% |
| Categories | Water | Soil/Sand | Gravel | |||
|---|---|---|---|---|---|---|
| CBAM-SEU-Net | U-Net | CBAM-SEU-Net | U-Net | CBAM-SEU-Net | U-Net | |
| Recall | 96.68% | 93.32% | 71.61% | 80.79% | 74.04% | 80.31% |
| Accuracy | 96.13% | 63.55% | 72.31% | 43.13% | 79.12% | 82.99% |
| F1-Score | 96.41% | 75.62% | 71.96% | 56.23% | 76.49% | 81.62% |
| IoU | 93.06% | 60.79% | 56.21% | 39.11% | 61.94% | 68.95% |
| grass | shrub/tree | road | ||||
| CBAM-SEU-Net | U-Net | CBAM-SEU-Net | U-Net | CBAM-SEU-Net | U-Net | |
| Recall | 80.23% | 69.76% | 75.69% | 39.43% | 47.82% | 56.46% |
| Accuracy | 90.07% | 94.52% | 73.39% | 54.66% | 31.68% | 37.71% |
| F1-Score | 84.86% | 55.65% | 74.53% | 61.29% | 38.11% | 45.21% |
| IoU | 73.71% | 38.55% | 59.41% | 44.19% | 23.54% | 29.21% |
| port/jetty | embankment | others | ||||
| CBAM-SEU-Net | U-Net | CBAM-SEU-Net | U-Net | CBAM-SEU-Net | U-Net | |
| Recall | 78.65% | 75.37% | 80.33% | 89.45% | 44.09% | 20.67% |
| Accuracy | 79.99% | 61.37% | 87.81% | 75.68% | 12.04% | 4.11% |
| F1-Score | 79.31% | 67.65% | 83.91% | 81.99% | 18.91% | 6.86% |
| IoU | 65.72% | 51.12% | 72.27% | 69.48% | 10.44% | 3.55% |
Disclaimer/Publisher’s Note: The statements, opinions and data contained in all publications are solely those of the individual author(s) and contributor(s) and not of MDPI and/or the editor(s). MDPI and/or the editor(s) disclaim responsibility for any injury to people or property resulting from any ideas, methods, instructions or products referred to in the content. |
© 2025 by the authors. Licensee MDPI, Basel, Switzerland. This article is an open access article distributed under the terms and conditions of the Creative Commons Attribution (CC BY) license (https://creativecommons.org/licenses/by/4.0/).
Share and Cite
Zheng, Y.; Lu, D.; Yang, Z.; Chang, J. Unravelling the Characteristics of Microhabitat Alterations in Floodplain Inundated Areas Based on High-Resolution UAV Imagery and Remote Sensing: A Case Study in Jingjiang, Yangtze River. Drones 2025, 9, 315. https://doi.org/10.3390/drones9040315
Zheng Y, Lu D, Yang Z, Chang J. Unravelling the Characteristics of Microhabitat Alterations in Floodplain Inundated Areas Based on High-Resolution UAV Imagery and Remote Sensing: A Case Study in Jingjiang, Yangtze River. Drones. 2025; 9(4):315. https://doi.org/10.3390/drones9040315
Chicago/Turabian StyleZheng, Yichen, Dongshuo Lu, Zongrui Yang, and Jianbo Chang. 2025. "Unravelling the Characteristics of Microhabitat Alterations in Floodplain Inundated Areas Based on High-Resolution UAV Imagery and Remote Sensing: A Case Study in Jingjiang, Yangtze River" Drones 9, no. 4: 315. https://doi.org/10.3390/drones9040315
APA StyleZheng, Y., Lu, D., Yang, Z., & Chang, J. (2025). Unravelling the Characteristics of Microhabitat Alterations in Floodplain Inundated Areas Based on High-Resolution UAV Imagery and Remote Sensing: A Case Study in Jingjiang, Yangtze River. Drones, 9(4), 315. https://doi.org/10.3390/drones9040315