Article

Agricultural Drone-Based Variable-Rate N Application for Regulating Wheat Protein Content

1
Division of Crop Rotation Research for Lowland Farming, Kyushu-Okinawa Agricultural Research Center, National Agriculture and Food Research Organization, 496 Izumi, Chikugo, Fukuoka 833-0041, Japan
2
Division of Lowland Farming Research, Central Region Agricultural Research Center, National Agriculture and Food Research Organization, 1-2-1 Inada, Joetsu, Niigata 943-0193, Japan
*
Author to whom correspondence should be addressed.
Drones 2025, 9(4), 310; https://doi.org/10.3390/drones9040310
Submission received: 28 February 2025 / Revised: 12 April 2025 / Accepted: 13 April 2025 / Published: 16 April 2025
(This article belongs to the Special Issue Advances of UAV in Precision Agriculture—2nd Edition)

Abstract

:
Implementing a variable-rate application (VRA) of fertilization based on real-time crop growth status reduces costs and enhances work efficiency. However, the technical challenges associated with obtaining accurate growth-distribution maps and applying VRA, particularly with agricultural drones, remain underexplored. In this study, we specifically focused on agricultural drone-based VRA fertilization for regulating wheat protein content. First, normalized difference vegetation index (NDVI) distribution maps were obtained using multispectral images captured using a small unmanned aerial vehicle. Subsequently, a prescription map based on the NDVI values was generated to facilitate the implementation of VRA for fertilization. Continuous monitoring of changes in related vegetation indices was conducted from post-topdressing to harvest. Experimental results indicated that selecting targeted experimental survey areas based on different growth conditions can result in accurate predictions of the final yield. However, it is sill ineffective for predicting protein content or protein yield. Additionally, VRA fertilization with less fertilizer in high-NDVI areas and more fertilizer in low-NDVI areas showed no significant difference in final protein content or protein yield compared to conventional uniform fertilization. These findings provide reference data for advancing precision agriculture by addressing field-scale variability for high-quality and uniform production while presenting further research challenges.

1. Introduction

The pursuit of precision and efficiency in contemporary agriculture, driven by the ever-growing global demand for crop production, has become increasingly imperative [1]. Variable-rate application (VRA), a practice that tailors nutrient, herbicides, and insecticide control based on crop growth status, is at the forefront of the precision agriculture revolution [2]. The potential economic and environmental benefits associated with VRA have been widely acknowledged, promising reduced costs and improved work efficiency [3,4].
Recent studies have focused on the use of spectral indices to produce prescription maps useful for the application of VRA [5]. These prescription maps are typically generated based on the analysis results of crop growth status, soil conditions, or historical data distributions, and are then transmitted to VRA-compatible agricultural machinery for conducting precise farming operations [6]. With the increasing maturity of unmanned aerial vehicle (UAV)-based remote sensing technology in recent years, various indices derived from UAV imagery, such as vegetation indices (VIs), field elevation differences, and surface water retention rates, are highly suitable for generating precise prescription maps [7,8]. These prescription maps can be used for applications such as cotton defoliation spraying [9,10], cotton pesticide application [11], and herbicide patch spraying in maize [12].
Although various agricultural machines support VRA, including emerging agricultural drones for crop protection, research reports on prescription-map-based VRA remain limited. With regard to agricultural drones, there were originally few commercial models that supported VRA, and their usage methods were specialized and not publicly available to general users. Using an agricultural drone capable of VRA, Yi et al. [13] successfully applied the green normalized difference vegetation index (GNDVI) derived from UAV imagery for variable-rate spraying in cotton defoliation applications. Song et al. [14] developed a variable-rate control system for a UAV-based granular fertilizer spreader. Nevertheless, for extensive arable crops such as wheat, corn, and rice, practical applications of VRA remain scarce, let alone in the area of wheat protein uniformity, which is a particular concern of ours.
Some studies have elucidated the relationship between wheat protein content, yield, and nitrogen (N) application [15,16]; however, they have not explored technologies for wheat protein regulation. In practical production, variations in field geography and localized soil nutrient imbalances often lead to inconsistent wheat protein distribution, resulting in uneven grain quality. The VRA of fertilization is essential to standardize growth differences within a field and ensure both high and uniform protein content.
Our research specifically utilized VRA technology to regulate growth heterogeneity in wheat fields. We used two types of UAVs: one for remote sensing and the other for plant protection. Based on the extensive literature we reviewed, we will refer to the small commercial UAV used for remote sensing simply as the ‘UAV’, and the one used for agricultural plant protection as the ‘agricultural drone’ hereafter. Our experiment overcame multiple technical challenges, including diagnosing in-field growth variations using UAVs, generating normalized difference vegetation index (NDVI)-based prescription maps, applying VRA fertilization via agricultural drones based on the prescription maps, selecting experimental survey plots with different growth statuses using UAVs, analyzing the temporal variations in NDVI and other growth indices between VRA and uniform fertilization, and investigating their correlations with yield and protein content. The following sections of this paper elaborate on solutions to these technical challenges, present the experimental results, and discuss the strengths and limitations of this study. The aim of this study was to offer a holistic understanding of the interplay between agricultural drone-based variable-rate N application, wheat protein control, and overall crop quality in the context of precision agriculture.

2. Materials and Methods
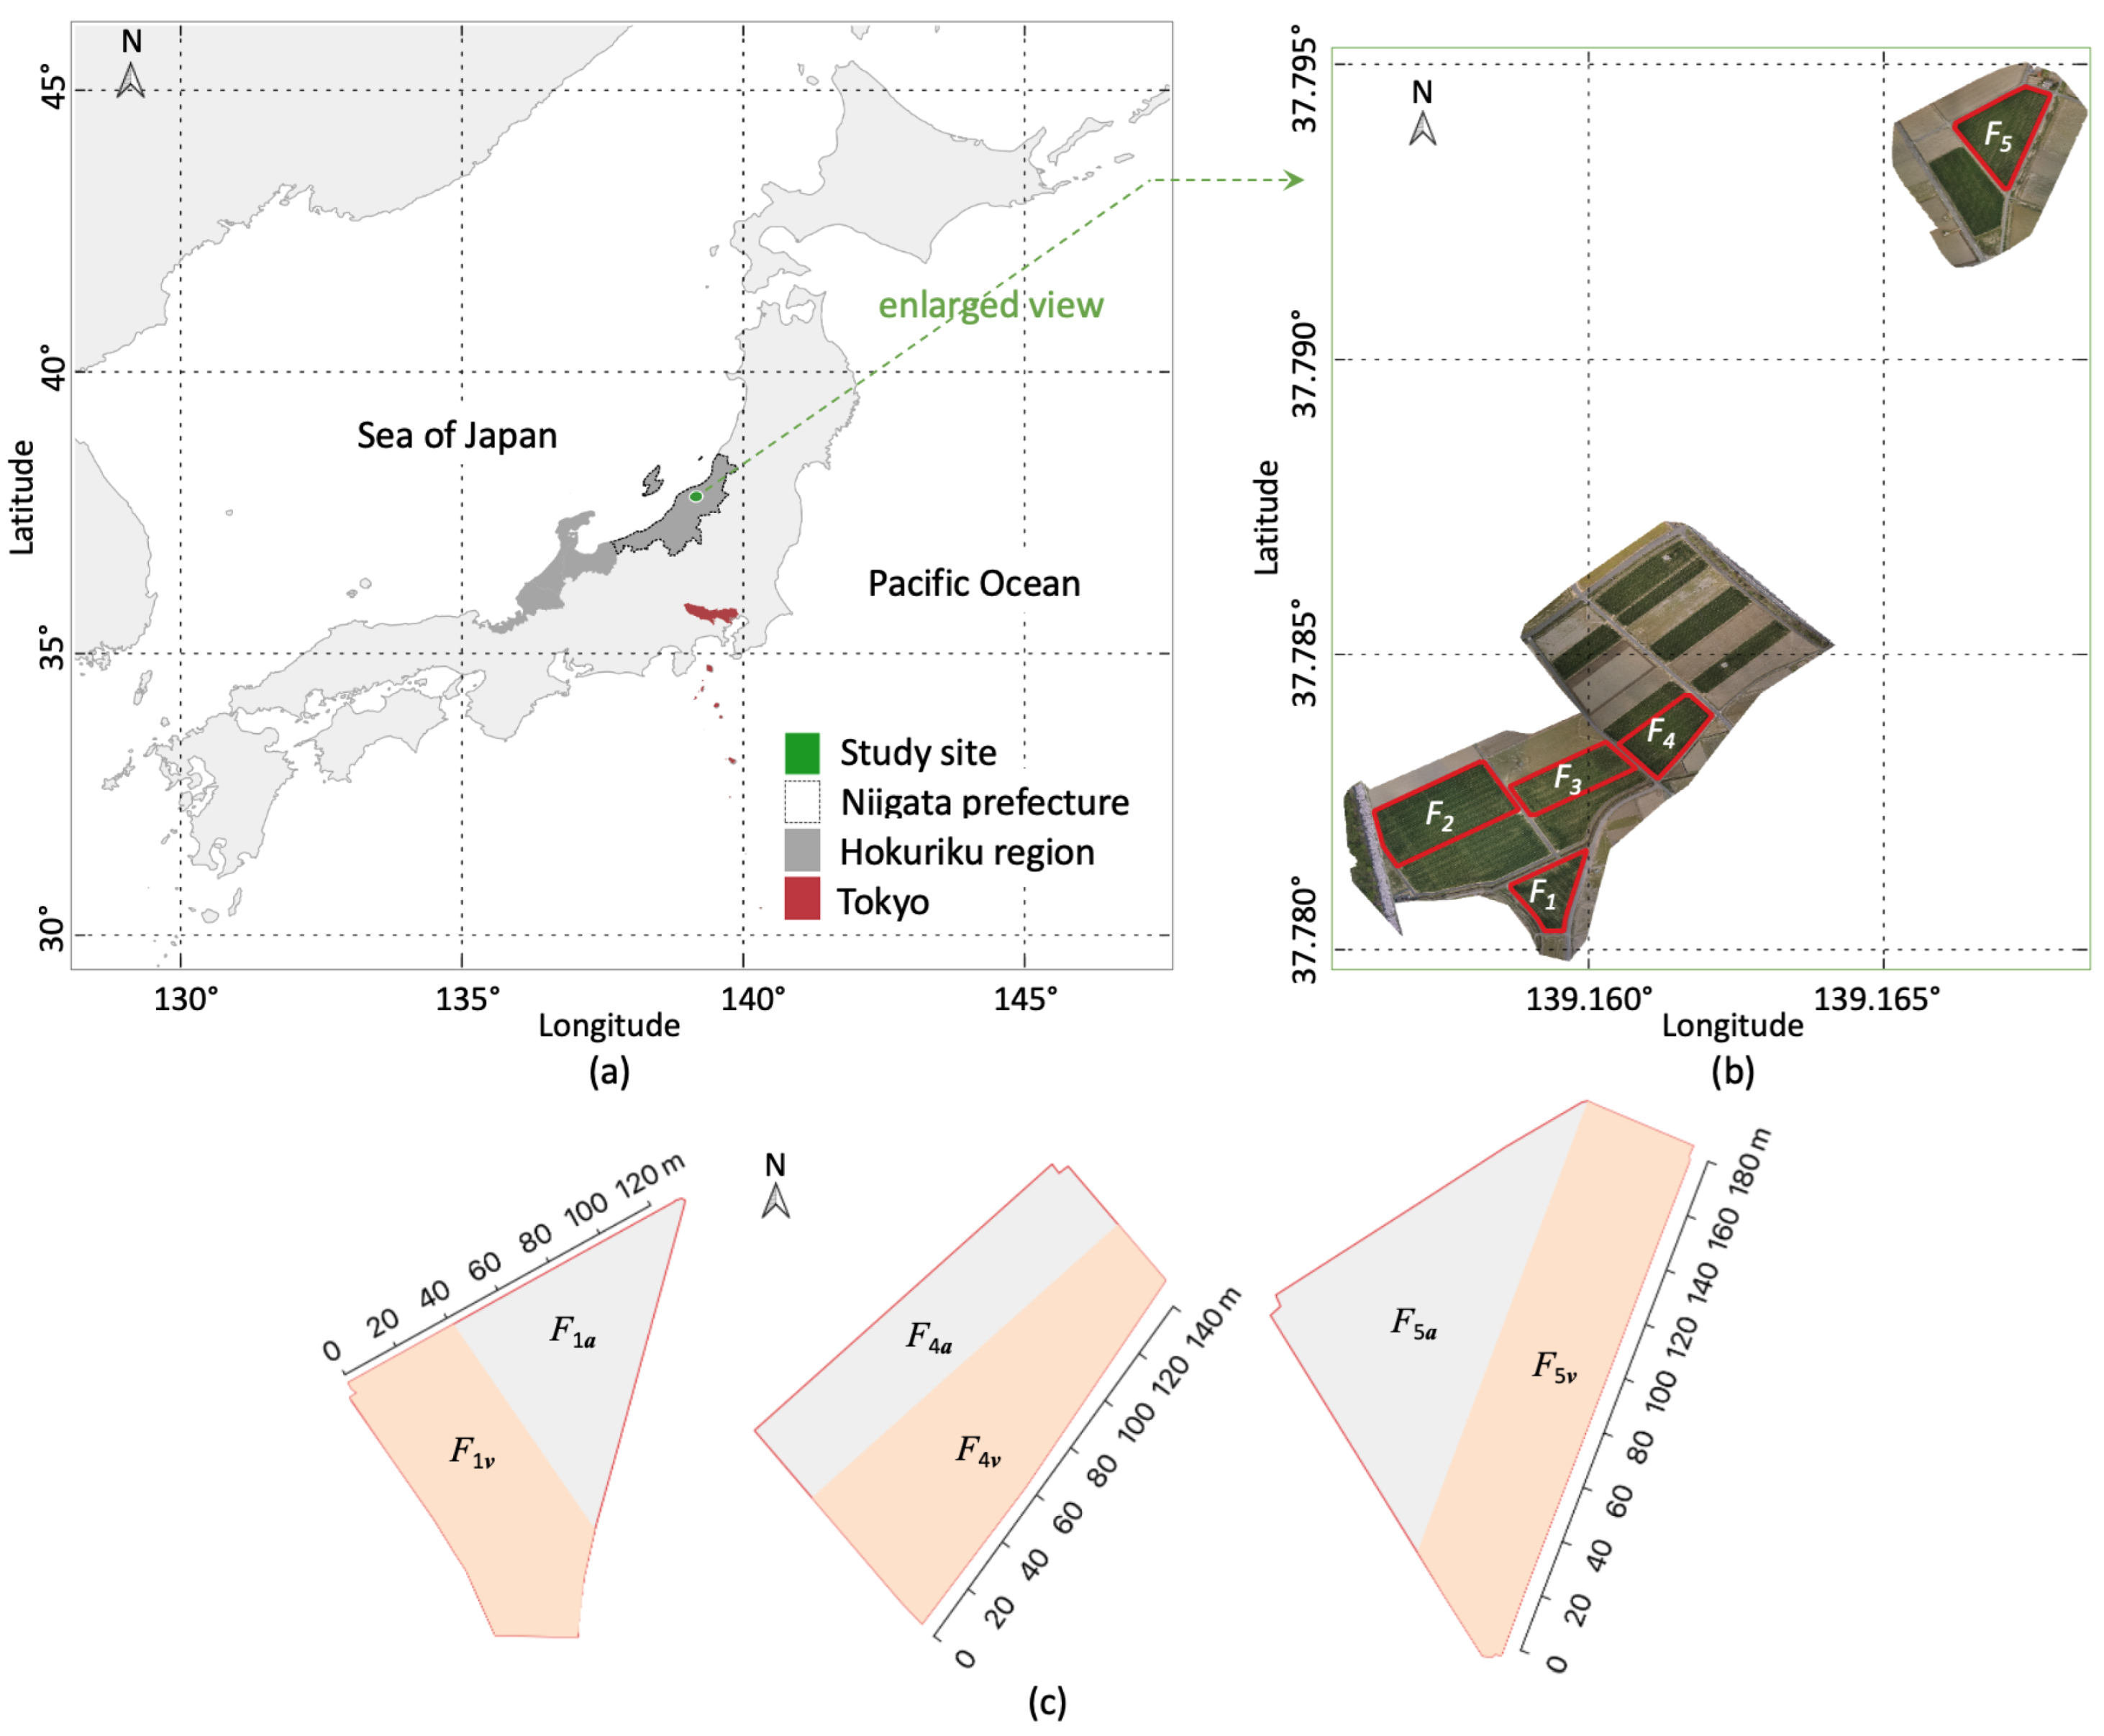
2.1. Study Site

Our study site was situated in the Hokuriku region along the Japan Sea coastline, encompassing Niigata Prefecture, spanning approximately 400 km from southwest to northeast (Figure 1a). During winter, the Hokuriku region typically experiences snowfall when seasonally dry Siberian air masses carrying accumulated moisture from their journey across the Sea of Japan ascend upon encountering the mountains of Honshu, leading to the condensation of humidity into snow [17,18]. Furthermore, snowfall in this region is influenced by the Japan-Sea Polar-airmass Convergence Zone [19,20], resulting in prolonged and extensive snow cover over most agricultural fields from late December to mid-March.
Cultivating wheat in the Hokuriku region, where continuous snow cover persists for nearly three months, requires varieties with robust cold and snow tolerance characteristics. The wheat variety ‘Yukichikara’ demonstrates strong resistance to cold and snow, shows early maturation, and is well suited for bread making. In addition, the strain displays robust resistance to red rust, powdery mildew, and stripe rust. Typically sown from late September to early October, it grows until late November, reaching a straw length of approximately 25 cm, which marks the onset of a 90-day overwintering period. With the melting of the accumulated snow and the rise in temperature during the latter half of March, the plant enters the joint elongation stage. Harvesting occurs in mid-late June after reaching maturity in early June. In addition to applying basal fertilizer at sowing, additional fertilization is carried out after wintering, as well as during the stem elongation, flag leaf, and anthesis stages to enhance yield and protein content [21,22].
We conducted a comparative evaluation of various fertilization methods to ensure high and uniform protein content in the wheat variety ‘Yukichikara’. Five experimental fields were chosen in the Niigata Prefecture (Figure 1b). Among them, F 1 , F 4 , and F 5 were subdivided into two zones, each for drone-based VRA fertilization ( F 1 v , F 4 v , and F 5 v ) and uniform fertilization ( F 1 a , F 4 a , and F 5 a ) (Figure 1c). The comparative cultivation experiments for F 1 , F 2 , and F 3 were conducted during the 2021–2022 crop season, while those for F 4 and F 5 were conducted during the 2022–2023 crop season to evaluate the feasibility of applying our method in practical production under different climatic and soil conditions. To observe and assess the impact of climatic and soil variations on wheat growth, we periodically conducted above-ground observations and measured growth parameters such as plant height and dry weight to determine the optimal timing for NDVI measurements and topdressing applications.
Basal fertilization was applied at approximately equal rates within each crop season but differed between the two seasons. F 4 and F 5 received a reduced amount of basal fertilizer but underwent three minor split fertilizations using a drone-based uniform application with urea coating specifically designed for drone use during the elongation phase after snowmelt and before booting. A backpack spreader was used to apply a small amount of urea in F 1 at 43 days after sowing (DAS) during the early elongation phase. Both VRA and uniform N application targeting higher grain protein content were conducted in all experimental fields in late April, immediately before heading. Detailed information on the experimental fields and fertilization is provided in Table 1.
As Table 1 shows, the timing of VRA N application in both the 2022 and 2023 seasons was set between the booting and heading stages. This was because N application after the booting stage—when sink capacity has already been determined—primarily contributes to increasing grain protein content [23]. Therefore, the timing of VRA N application at the pre-heading stage in our study was aligned with the physiological window for protein formation. Furthermore, our previous study reported that higher nitrogen accumulation in the above-ground parts at the anthesis stage tends to result in higher grain protein content [24]. While inherent soil fertility variations may influence protein content outcomes, higher fertilization rates at anthesis typically result in greater nitrogen accumulation, which in turn leads to increased grain protein levels. Therefore, we did not investigate residual soil nitrogen or baseline fertility differences, but instead focused on the design of fertilization rates at the anthesis stage. Prior to this stage, different types of basal and topdressing fertilizers were applied. In 2022, a slow-release fertilizer was used, with a basal application rate of 117 kg N ha 1 . In contrast, in 2023, a quick-release fertilizer was used as the basal application, resulting in a higher nitrogen input of approximately 134–135 kg N ha 1 even before fertilization date (194–201 DAS) at the anthesis stage.

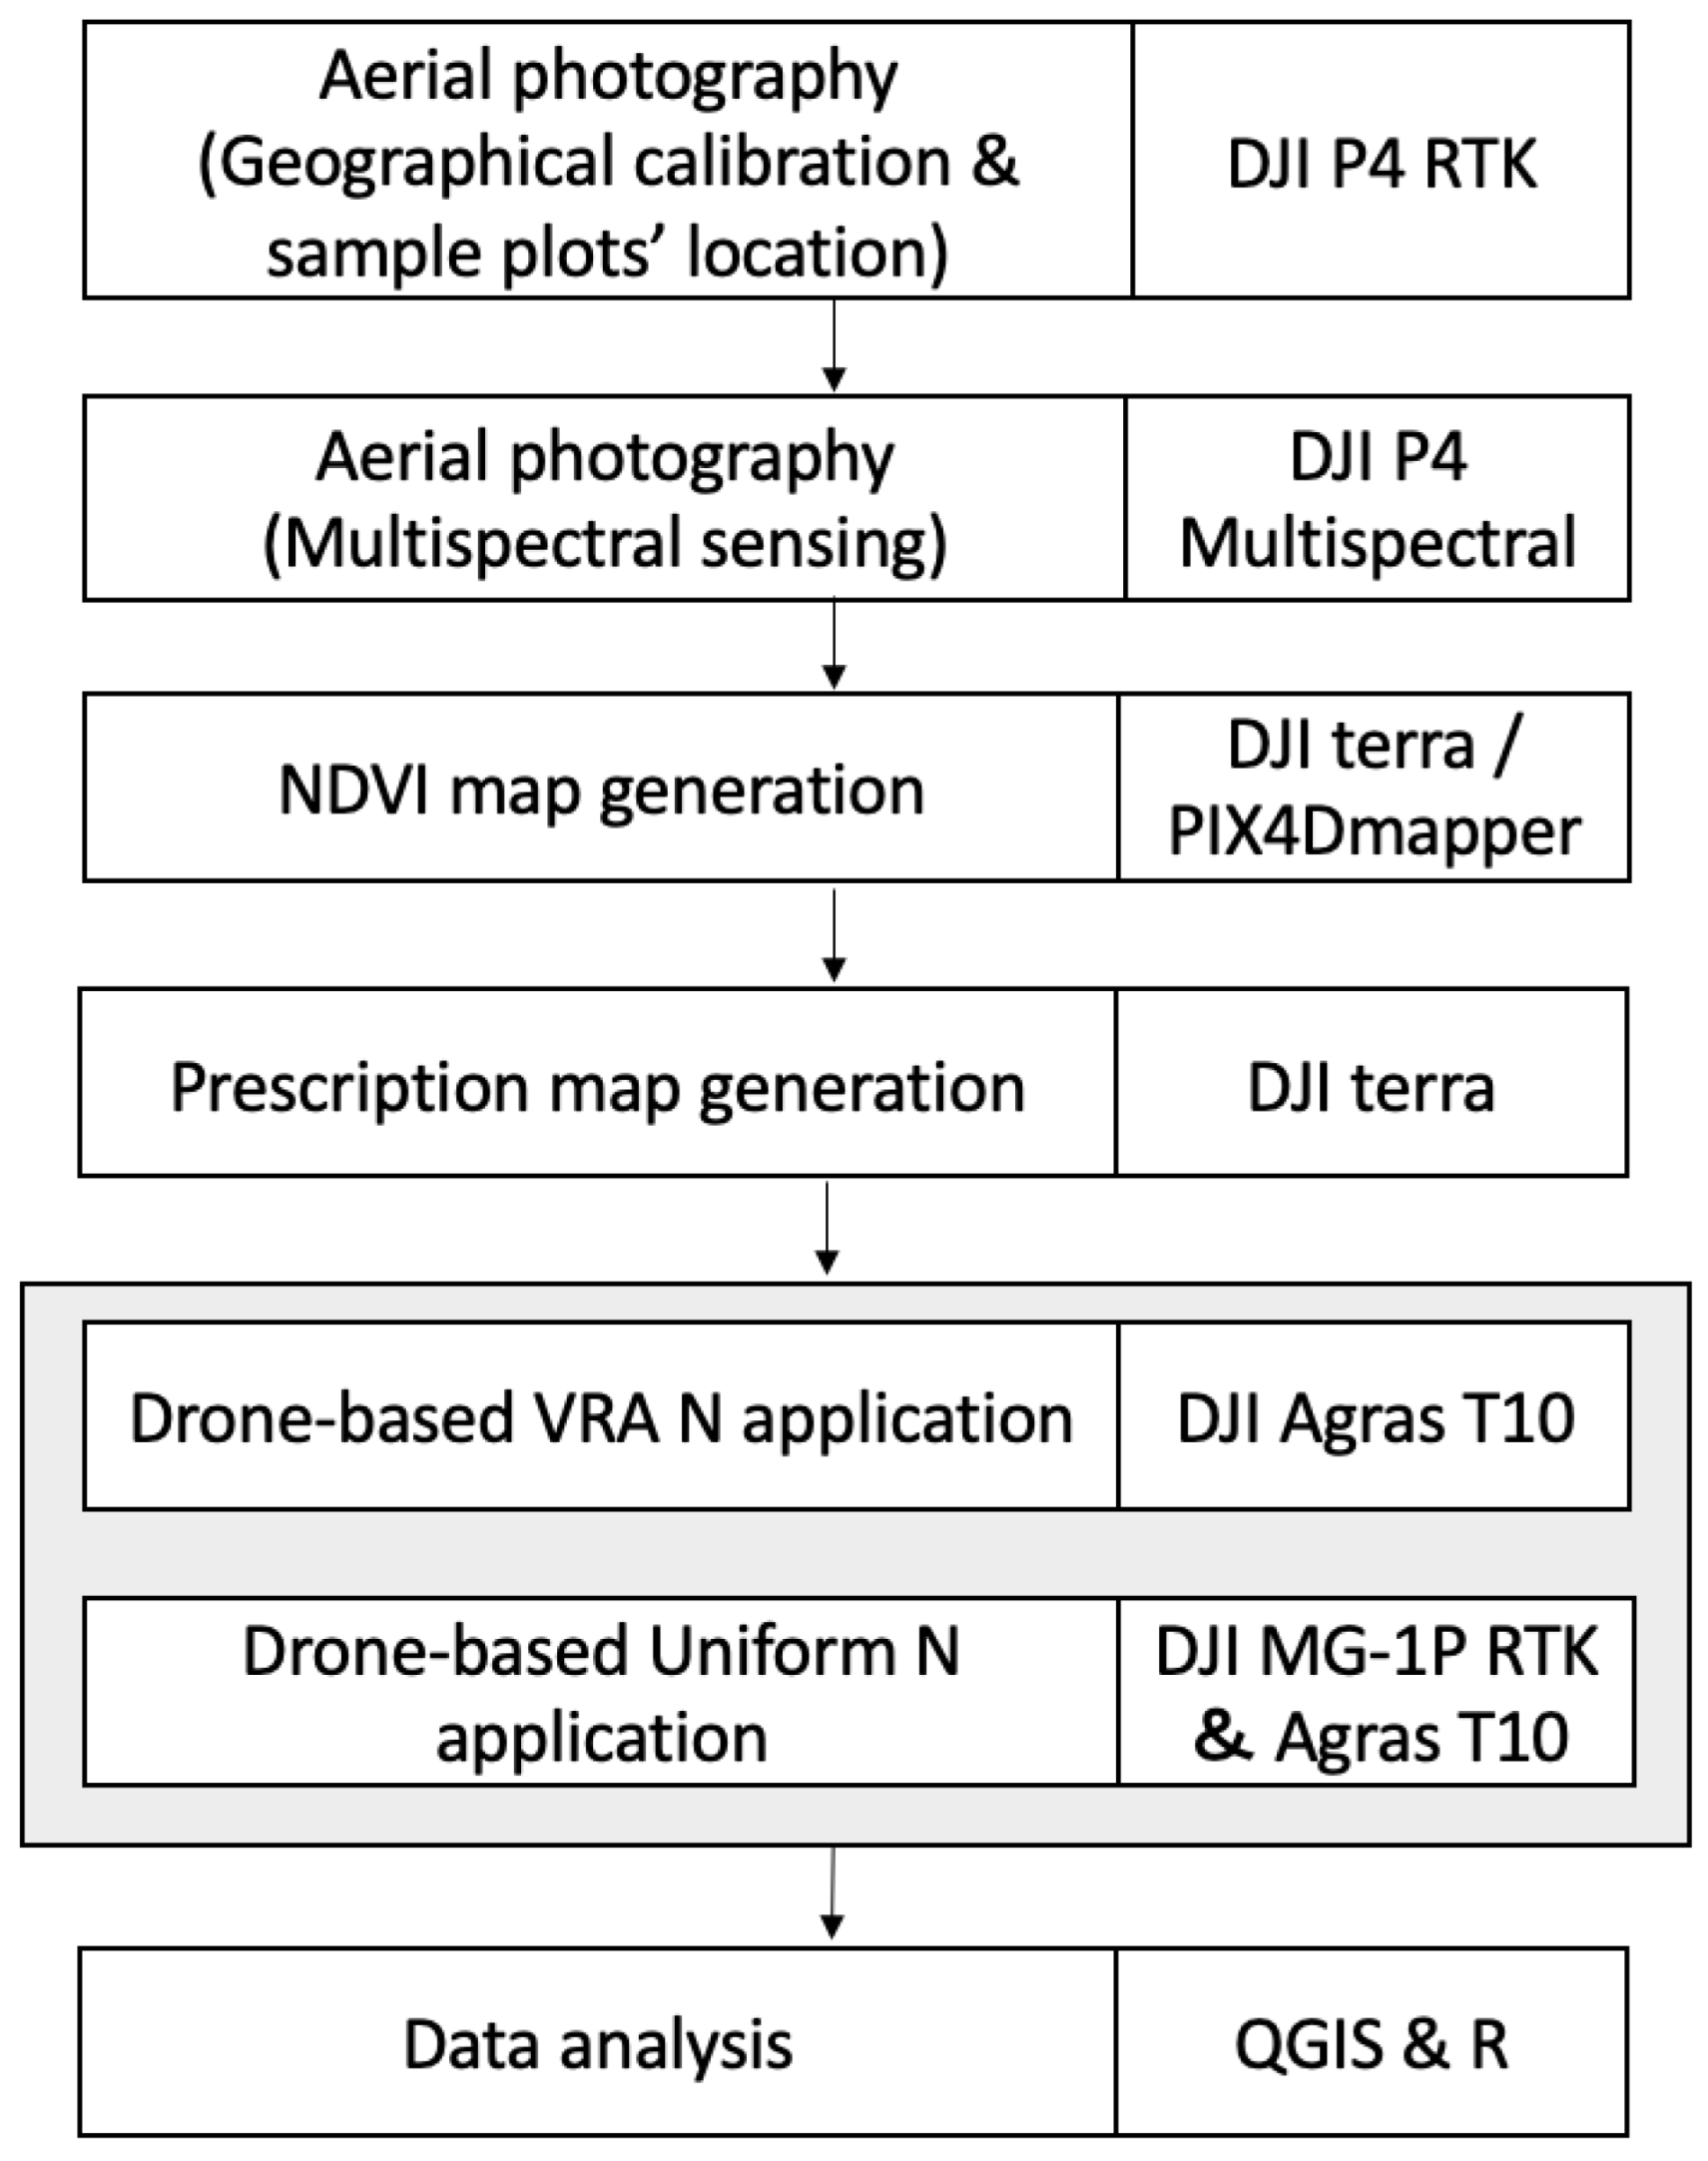
2.2. UAVs for Remote Sensing and Agricultural Drones for N Application

We used two small commercial UAVs for aerial imaging of experimental fields to precisely execute variable-rate fertilization based on wheat growth variations. As shown in the simple flow chart of Figure 2, a Phantom 4 RTK (DJI, Shenzhen, China) was primarily used for geographical calibration, whereas a P4 Multispectral (DJI) was used to assess wheat growth. Both UAVs operated at an altitude of 140 m above ground level (AGL) in 2022 and 100 m AGL in 2023, with a front and side overlap of 75%, maintaining real-time kinematic (RTK) FIX status. In 2022, high-voltage power lines passed directly above the experimental field. To ensure safe flight and avoid potential interference from the power lines, we set the flight altitude close to Japan’s legal limit of 150 m AGL. In contrast, in 2023, there were no power lines above the two experimental fields, which allowed us to lower the flight altitude for improved ground resolution.
Aerial imaging for 2022 and 2023 took place during the two weeks preceding heading, specifically on the mornings of 13 April 2022 (clear weather with a wind speed of 3 m/s) and 14 April 2023 (partly cloudy with a wind speed of 2 m/s). Meteorological data were obtained from historical records of Niitsu Station ( 37 47.5 N, 139 5.2 E), near the study site, collected through an automated meteorological data acquisition system provided by the Japan Meteorological Agency. Before takeoff, images from the P4 Multispectral were captured using a calibrated reflectance panel (CRP) (AgEagle Aerial Systems Inc., Kansas, MI, USA).
After drone-based VRA or uniform fertilization, we conducted multiple subsequent aerial photography flights using the P4 Multispectral to observe changes in post-fertilization wheat growth, which continued until yield sampling was completed. All flights were executed with identical settings.
The fertilizer application utilized two drone models, MG-1P RTK (DJI) and Agras T10 (DJI), both equipped with a 10 kg spread tank internal load capacity. Although the MG-1P RTK lacked VRA fertilization capabilities, it was utilized for uniform fertilization without RTK settings, using the A-B Route or Manual Plus operation mode. In contrast, the Agras T10, featuring a spreading system 3.0 with weight sensors and hopper gate control modules to enhance the spreading accuracy, was used for VRA fertilization. It can determine the appropriate flight speed and dynamically adjust the hopper outlet size in real time to align it with the designated spreading quantity specified on a prescription map.
Due to the unsuccessful configuration of variable-rate fertilization on the Agras T10, the F 1 v zone in the 2022 experiment adopted a multi-layered fertilization strategy, applying it to several specific zones within the field. These zones were created based on the values from the prescription fertilization map generated using DJI Terra Pro software (DJI), involving multiple low, normal, and high fertilization zones, along with corresponding flight routes. The F 1 v zone initially received a comprehensive low fertilizer application, followed by incremental fertilizer applications in the normal and high fertilization zones to achieve the desired variations in the spreading quantity.
In contrast to the zone-specific fertilization in F 1 v , the F 4 v and F 5 v zones were designated for precise VRA fertilization in 2023. NDVI index distribution maps and prescription maps were initially generated using DJI Terra software. Subsequently, flight regions and routes were established and the data were transmitted to the remote controller’s DJI Agras application via an SD card. The Agras T10 automated spreading operations were executed while the RTK system was in a fixed state.
Additional information, including the target field or zone, target area percentage, treatment, weather conditions, wind speed, wind direction, temperature, working width, and flight speed, is summarized in Table 2.

2.3. Data Processing and Field Survey

RGB orthomosaic, NDVI, GNDVI, and other index maps were generated from raw RGB and multispectral images using PIX4D Mapper Pro (PIX4D S.A., Prilly, Switzerland). The processing was conducted on a Windows 10 Pro 64-bit system equipped with an Intel Xeon(R) Silver 4208 processor (2.1 GHz, 8 cores), 48 GB RAM, and an NVIDIA RTX A2000 graphics accelerator. Georeferencing was achieved using ground control points (GCPs) in the processing workflow, and camera radiometric correction was conducted using CRP images with the ’Camera and Sun Irradiance’ option.
Six experimental plots were identified within the VRA fertilization zones ( F 1 v , F 4 v , F 5 v ) on the generated NDVI map using QGIS software. These plots were selected on the basis of low, normal, and high NDVI values, with each category containing two plots. Each plot was demarcated as an operational area measuring 1 m long along the furrow direction and 2.2 m in width. The same methodology was adopted to designate six plots in uniform fertilization zones ( F 1 a , F 4 a , F 5 a ). The centers of these 12 plots were then connected to create LineString in the KML format, which was subsequently imported into DJI GS Pro to generate waypoint flight routes. The Phantom 4 RTK flew at 2.5 m AGL along the designated flight route, pausing for 30 s at each waypoint to allow ground personnel to set markers. These markers were placed in their original positions until the completion of the yield sampling, at which point they were removed.
Unit acreage yield sampling was performed for all designated plots. Upon completion of yield sampling, aerial photography using a Phantom 4 RTK was conducted to identify precise geographical positions and sizes of these plots. For yield sampling in F 2 and F 3 , where only uniform fertilization was applied, the conventional method of selecting three evenly distributed plots along the diagonal of the field was used. All yield values were converted to a 12.5% moisture content equivalent after sieving through a 2.2 mm screen, and the grain protein content was calculated using the conventional 13.5% moisture content equivalent for wheat.
QGIS was used to compare flight routes generated by DJI Terra. Statistical analysis was performed using R language in RStudio (Version 2023.09.1 Build 394, Posit Software, PBC).

3. Results

3.1. Prescription Maps and Implementation Results of Agricultural Drone-Based N Application

Prescription maps were generated based on NDVI values, which were derived from UAV-based remote sensing measurements conducted approximately two weeks prior to the heading date. The NDVI maps are shown in Figure 3a–c, particularly for experimental fields F 1 , F 4 , and F 5 . The uneven NDVI distribution in the upper left section of experimental field F 1 was caused by residual effects from the previous crop and non-uniform application of organic compost.
Uniform base fertilization was first applied at a rate of 36.7 kg N ha 1 in the zone-specific VRA F 1 v (Figure 3b). Subsequently, an additional uniform fertilization of 12.8 kg N ha 1 was applied to the continuous areas that did not exceed the mean NDVI of 0.75. Finally, another uniform topdressing of 7.9 kg N ha 1 was applied to continuous areas where the NDVI did not exceed 0.65. As a result, three distinct N application zones were established in F 1 v : low, normal, and high N zones with cumulative N application rates of 36.7, 49.5, and 57.4 kg N ha 1 , respectively.
In measuring actual fertilization rate, we recorded the fertilizer weight before and after application for each VRA experimental zone. Since the first N application of 12.8 kg N ha 1 reached 91.8% of the target value, we did not adjust the parameters for the subsequent two multiple-layered fertilization applications (normal N zone and high N zone) to maintain consistency in spreading parameters throughout the application process. However, some areas within the normal N zone and high N zone were quite small, sometimes even shorter than the distance required for the agricultural drone to accelerate to a stable spraying speed and decelerate to a stop. As a result, a significant portion of the working time in these zones was spent in acceleration or deceleration phases, leading to uneven spreading. This may be one of the reasons why the overall application did not reach the designed target levels and remained lower than that of the control uniform fertilization zone F 1 a , which had an average N application rate of 58.1 kg N ha 1 .
The prescription maps for experimental zones F 4 a , F 4 v , F 5 a , and F 5 v were generated using DJI Terra software. The fertilization strategy for F 4 v and F 5 v followed these rules: for NDVI values ranging from the minimum to the average, the fertilization rate was linearly scaled from 80 to 60 kg N ha 1 . At the NDVI average, the fertilization rate was set to 60 kg N ha 1 . For NDVI values from average to maximum, the rate was linearly scaled from 60 to 40 kg N ha 1 . For F 4 a and F 5 a , the fertilization rates for the minimum, average, and maximum NDVI values were set at 60 kg N ha 1 , resulting in a uniform application of 60 kg N ha 1 for each 1 m × 1 m mesh on the prescription map. The generated prescription maps, along with data on the spreading area boundaries, marked obstacles (such as utility poles), and predefined spreading routes and directions, were transferred to the Agras T10 remote controller via an SD card for precise application.
Despite the designed target topdressing rates, the actual fertilization rates deviated from the target values owing to factors such as drone performance, as shown in Table 3. One reason for this deviation is the difference between the reference area used to determine the target rates and the actual spreading area, which excludes obstacles, such as field ridges, utility poles, and machinery entry/exit zones. Among the four experimental zones that used the MG-1P RTK drone for topdressing, only F 1 a and F 2 exhibited errors within 5%, whereas F 3 and F 4 a exceeded this threshold. In contrast, deviations from the target rates exceeded 5% for the four treatment zones ( F 1 v , F 4 v , F 5 a , and F 5 v ) using the Agras T10 drone.
The target rates for the three VRA treatment zones ( F 1 v , F 4 v , and F 5 v ) were estimated as average values. The large deviation in the actual fertilization rates in F 1 v was considered primarily due to the suboptimal parameter settings for drone spreading. Significant discrepancies in the cases of F 4 v and F 5 v where the application rates varied according to the NDVI distribution were mainly attributed to the nature of the prescription maps. When the proportion of areas with NDVI values lower than the average was relatively high, the actual application rate in the VRA treatment zones increased. Therefore, we considered these deviations reasonable.

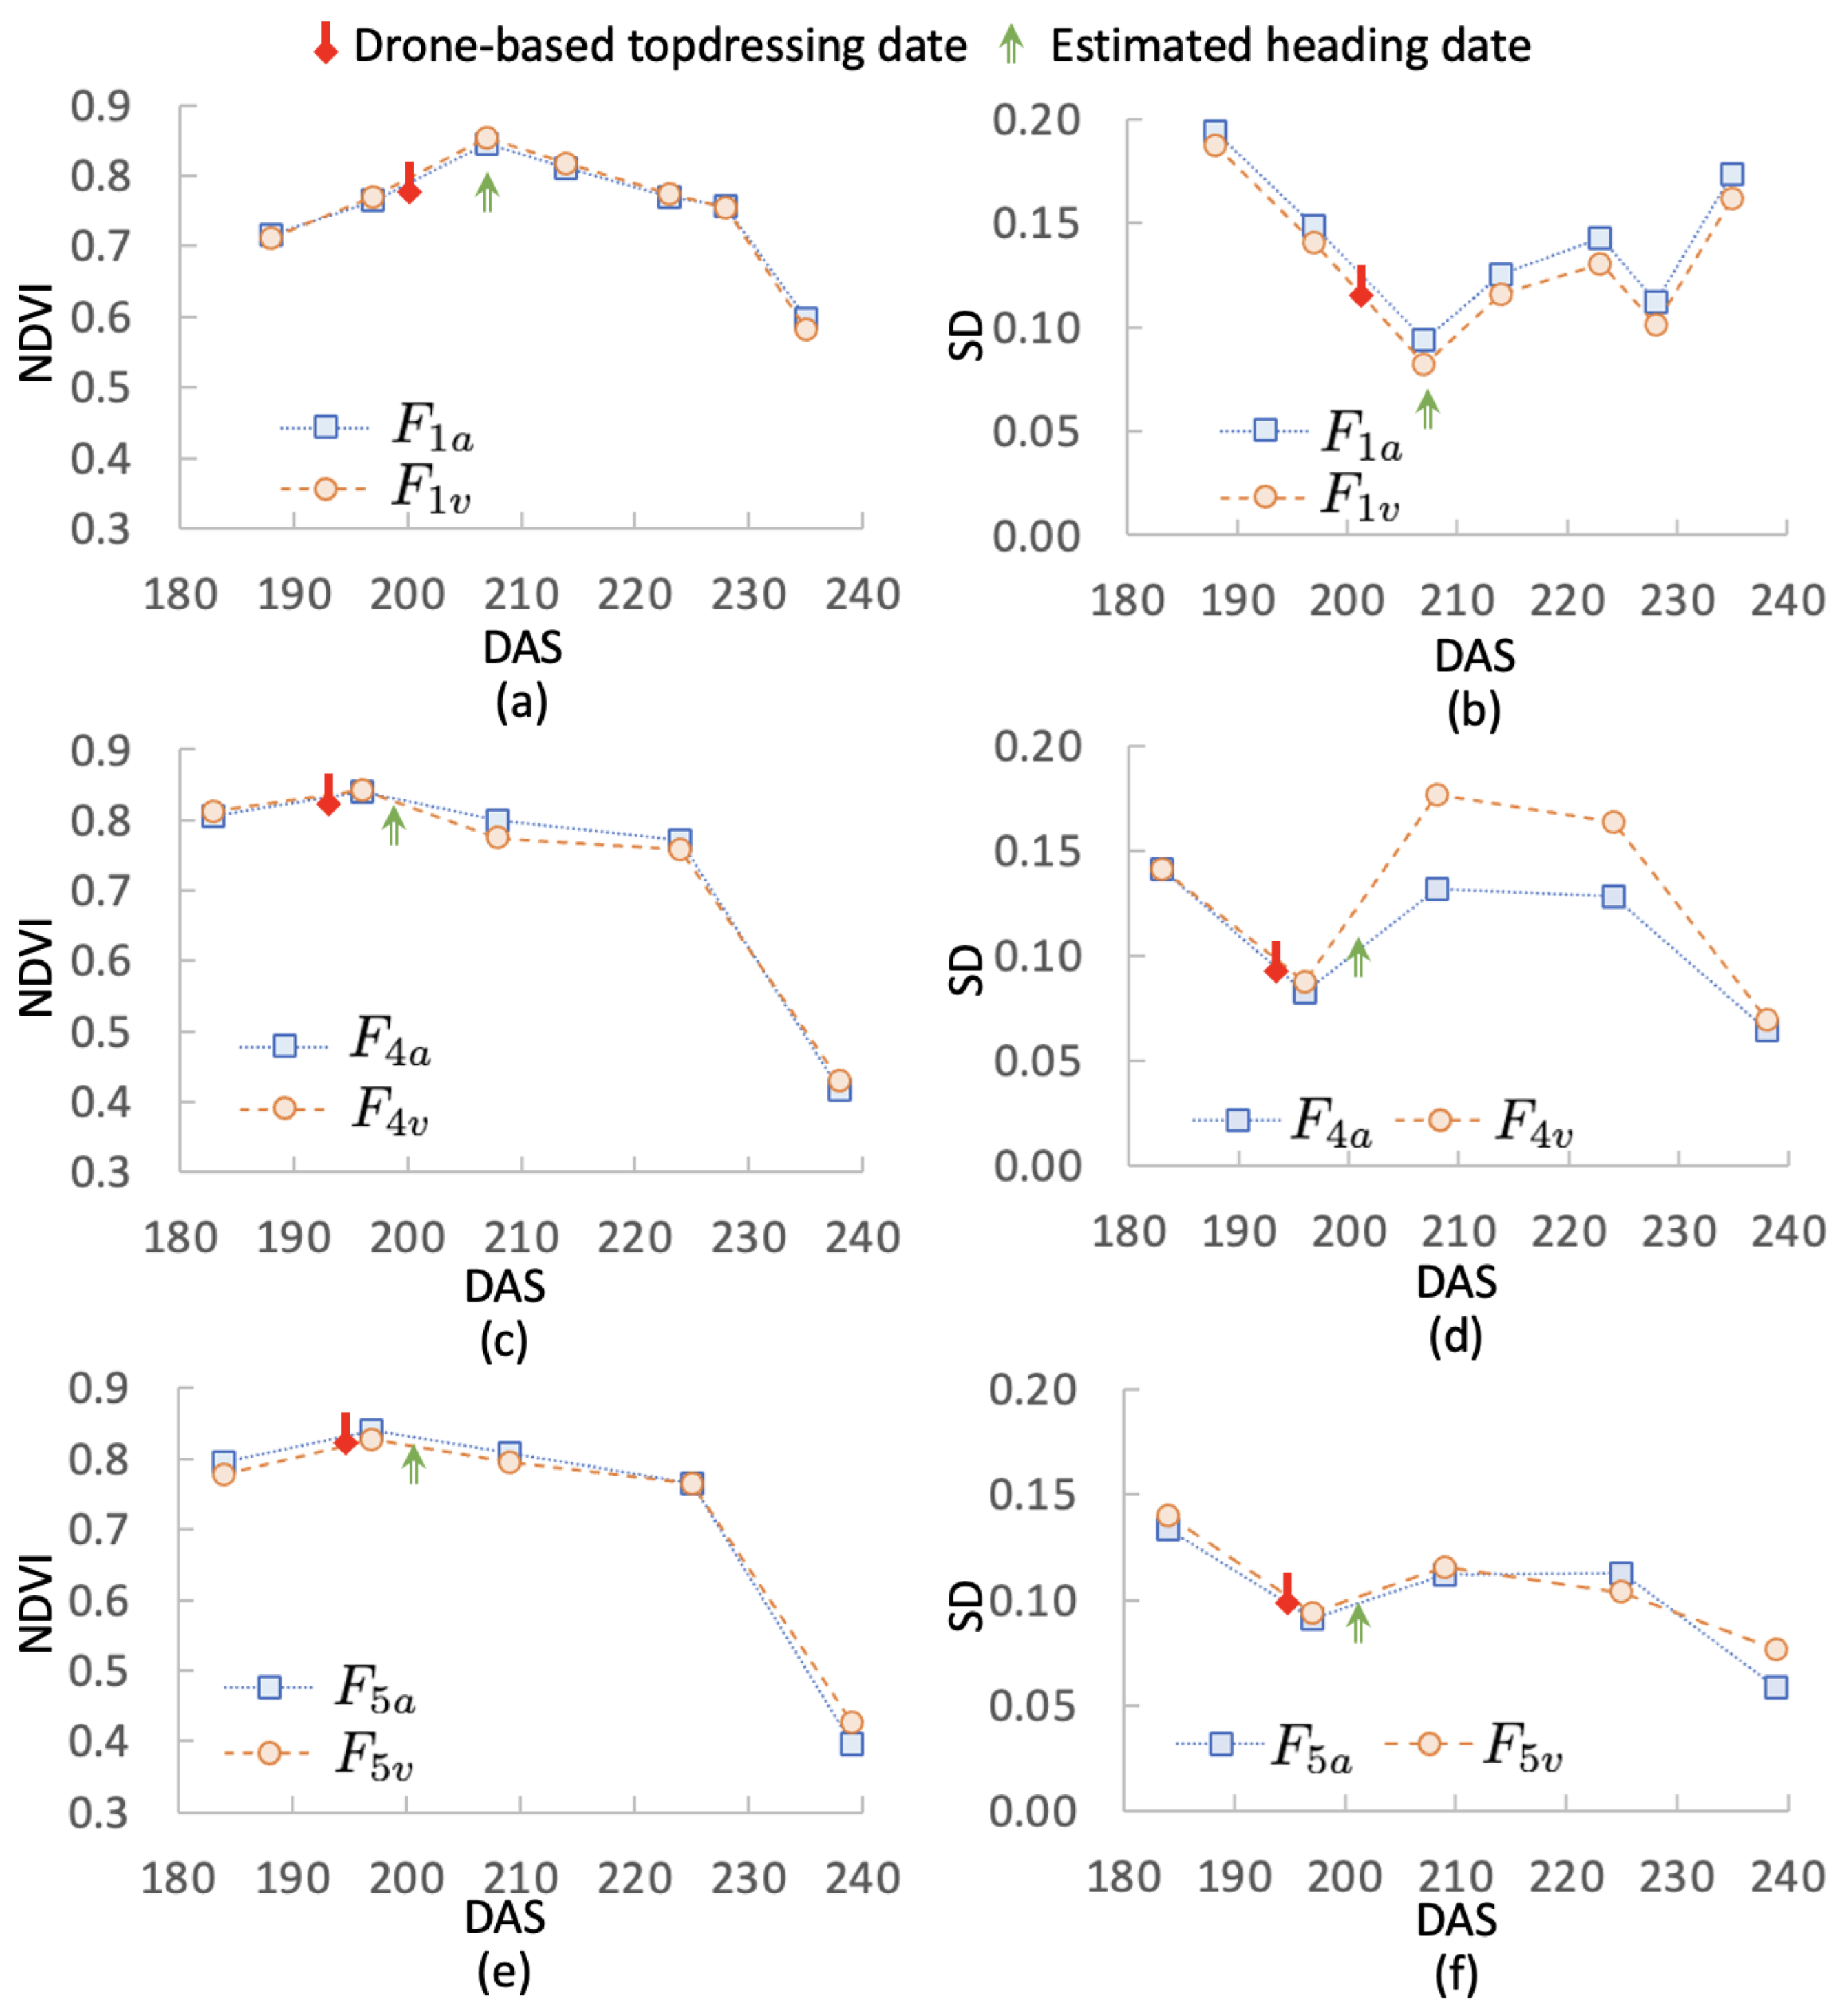
3.2. Effectiveness Analysis of Agricultural Drone-Based N Application

We measured NDVI values using UAV-based remote sensing from approximately 2 weeks before topdressing to approximately 10 days before harvest to observe the effectiveness of drone-based N application on wheat growth. The comparative trends in NDVI changes for the three experimental fields ( F 1 , F 4 , and F 5 ), which were divided into uniform and VRA treatment zones, are shown in Figure 4a,c,e. The corresponding standard deviations of NDVI for each treatment zone are plotted in Figure 4b,d,f.
First, the NDVI in all the treatment zones peaked around the heading stage and then continuously declined as the crops entered the ripening stage. However, we did not observe a reversal in the NDVI standard deviations between the uniform and VRA treatments within 1–2 weeks of topdressing. This indicated that neither the uniform nor VRA treatment methods significantly altered the variation in wheat NDVI values, nor did they contribute to reducing the growth differences that already existed at the time of fertilization during the pre-heading stage.
The distributions of protein content, yield, and protein yield per unit N for each treatment zone in different years are shown as box plots in Figure 5. The red dots represent the mean values for each group, and the red-colored numerical values on the right indicate the mean values. The mean protein content of the uniform treatment in 2022 (11.83) was higher than that of VRA (11.45) (Figure 5a), whereas the mean protein content of the uniform treatment (13.06) was lower than that of VRA (13.63) in 2023 (Figure 5b). We attribute the higher grain protein content in the 2023 crop primarily to differences in N application rates from basal fertilizer to before the booting stage. Similar trends were observed in the yield and protein yield per unit N (Figure 5c–f), except for the VRA treatment in Figure 5f.
We conducted normality (Shapiro–Wilk test) and homogeneity of variance (Levene’s test) tests for all datasets. Since homogeneity of variance was confirmed, we applied Student’s t-test to assess significant differences. The results showed no significant differences (p ≥ 0.05) between groups. Due to limitations in manpower and cost, only six VRA experimental plots were designed in 2022. Although no outliers were observed, the small sample size means that the lack of significant differences in results should be considered exploratory.
The actual fertilization rate did not reach the target in certain experimental zones of the uniform treatment in 2022 and in any zone of the VRA in 2022. Consequently, a small portion of the protein content fell below the expected range of 11.5–14.0, which is the standard for high-quality bread production. However, all experimental zones exceeded the lower bound of this range in 2023, and except for one outlier, the majority of values were in the upper part of the range, reaching premium quality.
In Figure 5a, the outlier in the “Uniform” treatment corresponds to an area where little to no fertilizer was applied. This occurred near the field boundary, where the MG-1P RTK, operating in manual mode, was unable to precisely control the spreading range, resulting in an untreated border zone. In Figure 5b, the outlier in the “VRA” treatment resulted from two rounds of topdressing due to flight parameter adjustments, causing the protein content to reach 16.01. We conducted statistical analyses in two scenarios: one including these two outliers and the other excluding them. Since the final statistical results showed no substantial difference, we opted to retain the outliers in the figure.

3.3. Correlation Between VIs and Yield

We analyzed the correlation between NDVI, GNDVI, and yield using the experimental datasets from 2022 and 2023. Figure 6 presents a scatter plot illustrating the relationship between the NDVI data used for topdressing decisions in 2022 (DAS = 188) and the yield. The figure includes a linear regression equation along with R 2 , RMSE, and confidence intervals. The coefficient of determination ( R 2 = 0.848) indicated a strong correlation between the NDVI and yield (Figure 6a). Additionally, we compared another linear regression model with a higher R 2 value based on GNDVI versus yield (Figure 6b). The p-values for both linear regression models were <0.001. These results suggested that NDVI and GNDVI can predict the yield effectively approximately 2 weeks before the heading stage.
The changes in the coefficient of determination ( R 2 ) for the linear regression models between NDVI, GNDVI, and yield across different growth stages are shown in Figure 7. R 2 remained consistently high from 188 to 230 DAS in 2022. However, only the period from DAS 169 to 197 showed R 2 values > 0.65 in 2023. The low correlation between NDVI, GNDVI, and yield after 197 DAS in 2023 may be due to differences in fertilization, but it is more likely attributed to significant variations in weather conditions. The average stem length across all experimental plots was 89.6 cm for the 2022 crop and 97.1 cm for the 2023 crop. The 2023 growing season experienced a warmer winter, which led to earlier growth in the spring. Overgrowth led to lodging in some areas. Unfortunately, due to the lack of specific lodging measurement data, we can only speculate and cannot definitively conclude that lodging is the cause of the low correlation.
Although NDVI and GNDVI showed a strong correlation with yield around heading, there were no significant differences (p > 0.05) in their correlations with protein content and protein yield. NDVI and GNDVI could be used to predict yield but not protein content or protein yield.

4. Discussion

In this study, we conducted NDVI-based uniform and VRA fertilization experiments for two consecutive years under the geographical and climatic conditions of the Hokuriku region of Japan to regulate the grain protein content of wheat. By designing field trials in actual farmers’ fields throughout the growing season and implementing UAV-based remote sensing to successfully perform VRA fertilization using agricultural drones, we accumulated first-hand data and valuable experience. This included the selection of wheat fields with uneven growth for bread making, methods for determining fertilization rates based on NDVI, implementation procedures for uniform and variable-rate fertilization via autonomous drone flights, the categorization of test plots as ‘poor’, ‘normal’, and ‘good’ growth conditions before fertilization (with two plots per category, totaling six plots), and key considerations for conducting multi-year trials.
We compared the standard deviation values of the NDVI across the entire treatment zone and selected areas with larger standard deviations as the VRA zones. Based on conventional knowledge, we hypothesized that VRA fertilization would lead to more uniform crop growth and improve and homogenize grain protein content. Therefore, we adopted an algorithm to apply less fertilizer in high NDVI areas and more fertilizer in low NDVI areas. However, as shown in Figure 4, fertilization immediately before heading did not significantly affect the subsequent NDVI or GNDVI values, and this approach did not yield the expected results. The VRA treatment yielded a slightly higher protein content than the uniform treatment during the 2023 growing season; however, the difference was not statistically significant (Figure 5).
We considered various factors that might have influenced these results, including residual soil nitrogen or baseline fertility differences, weather conditions, the total amount and timing of fertilization throughout the growing season, discrepancies between the actual and planned fertilizer application rates using agricultural drones, and the algorithm employed to determine fertilization rates. Regarding residual soil nitrogen or baseline fertility differences, our previous research indicates that higher fertilization rates at the anthesis stage typically result in increased grain protein levels, and that higher nitrogen accumulation in the above-ground parts at this stage is also associated with higher grain protein content [24]. Therefore, we did not specifically investigate these factors in this study. The most influential factors identified were as follows:
(1)
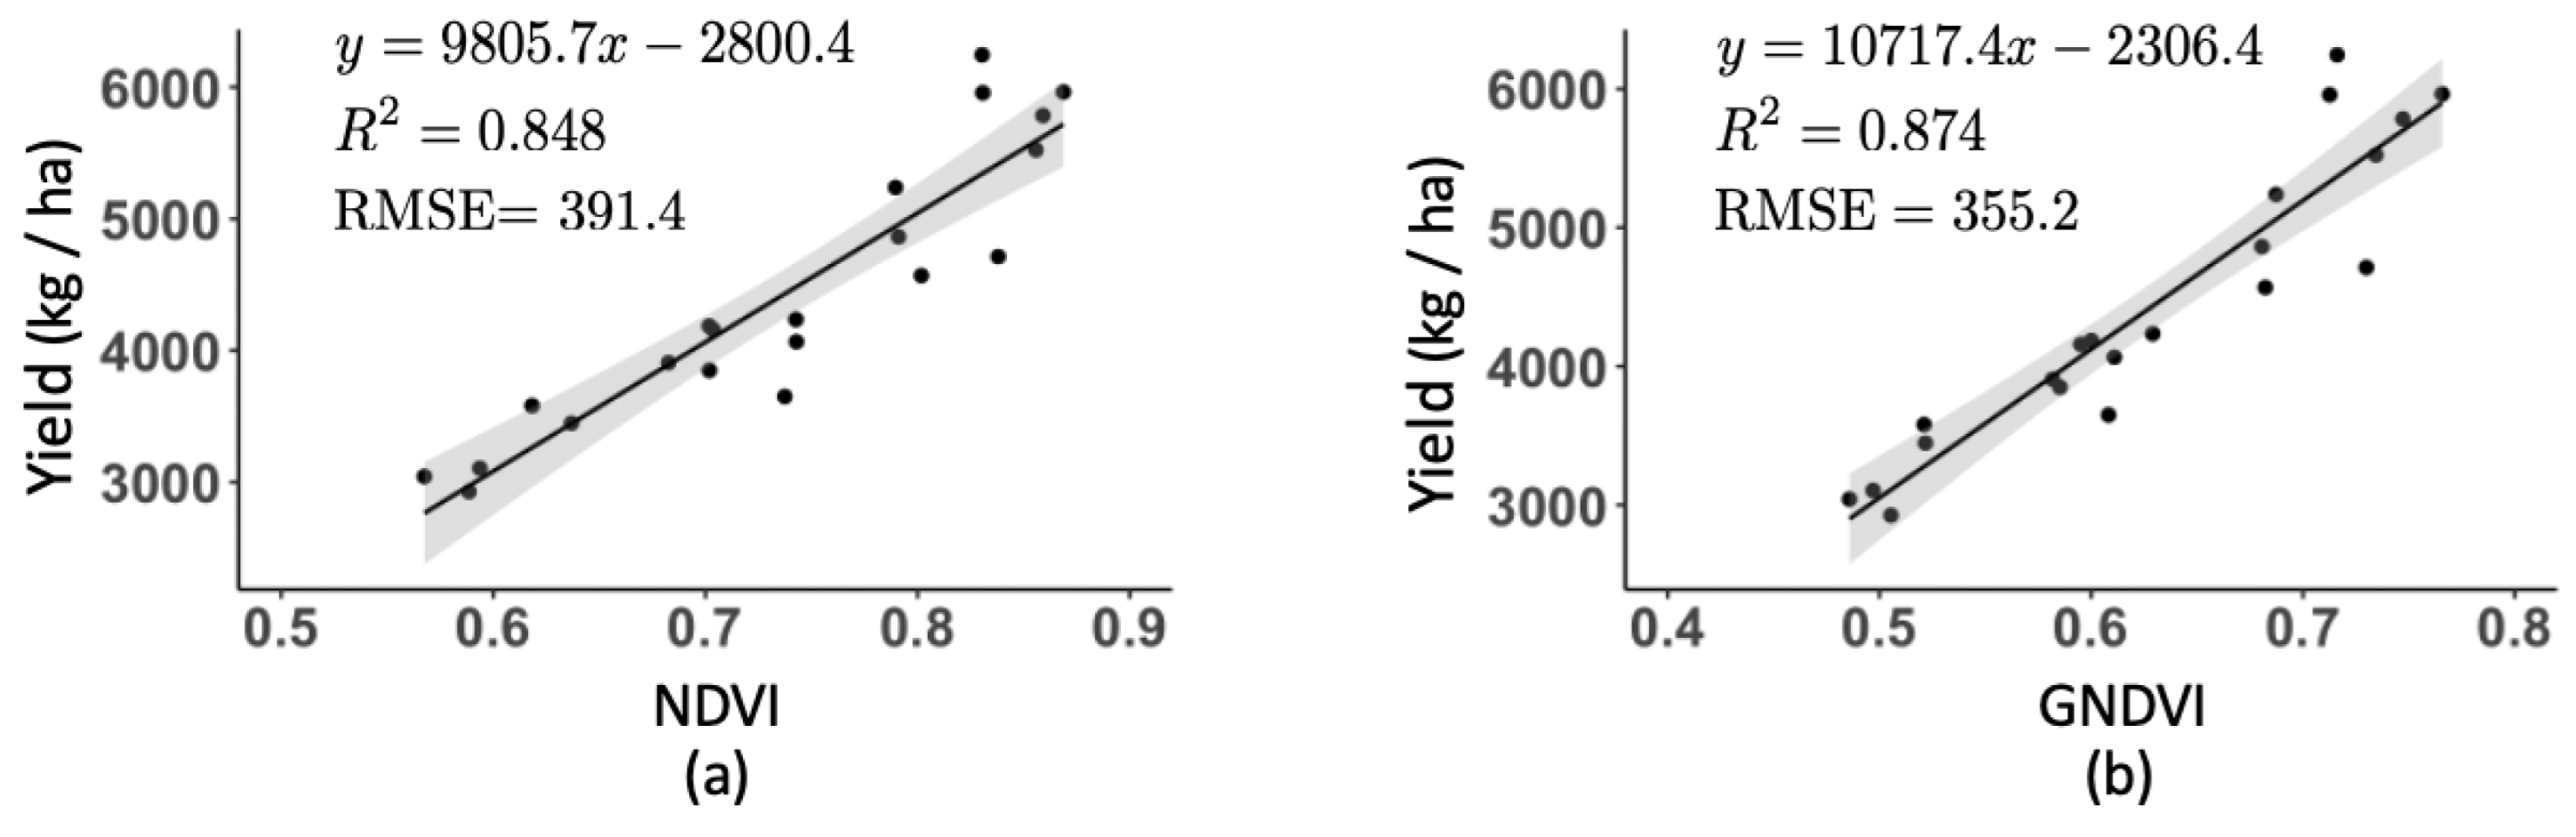
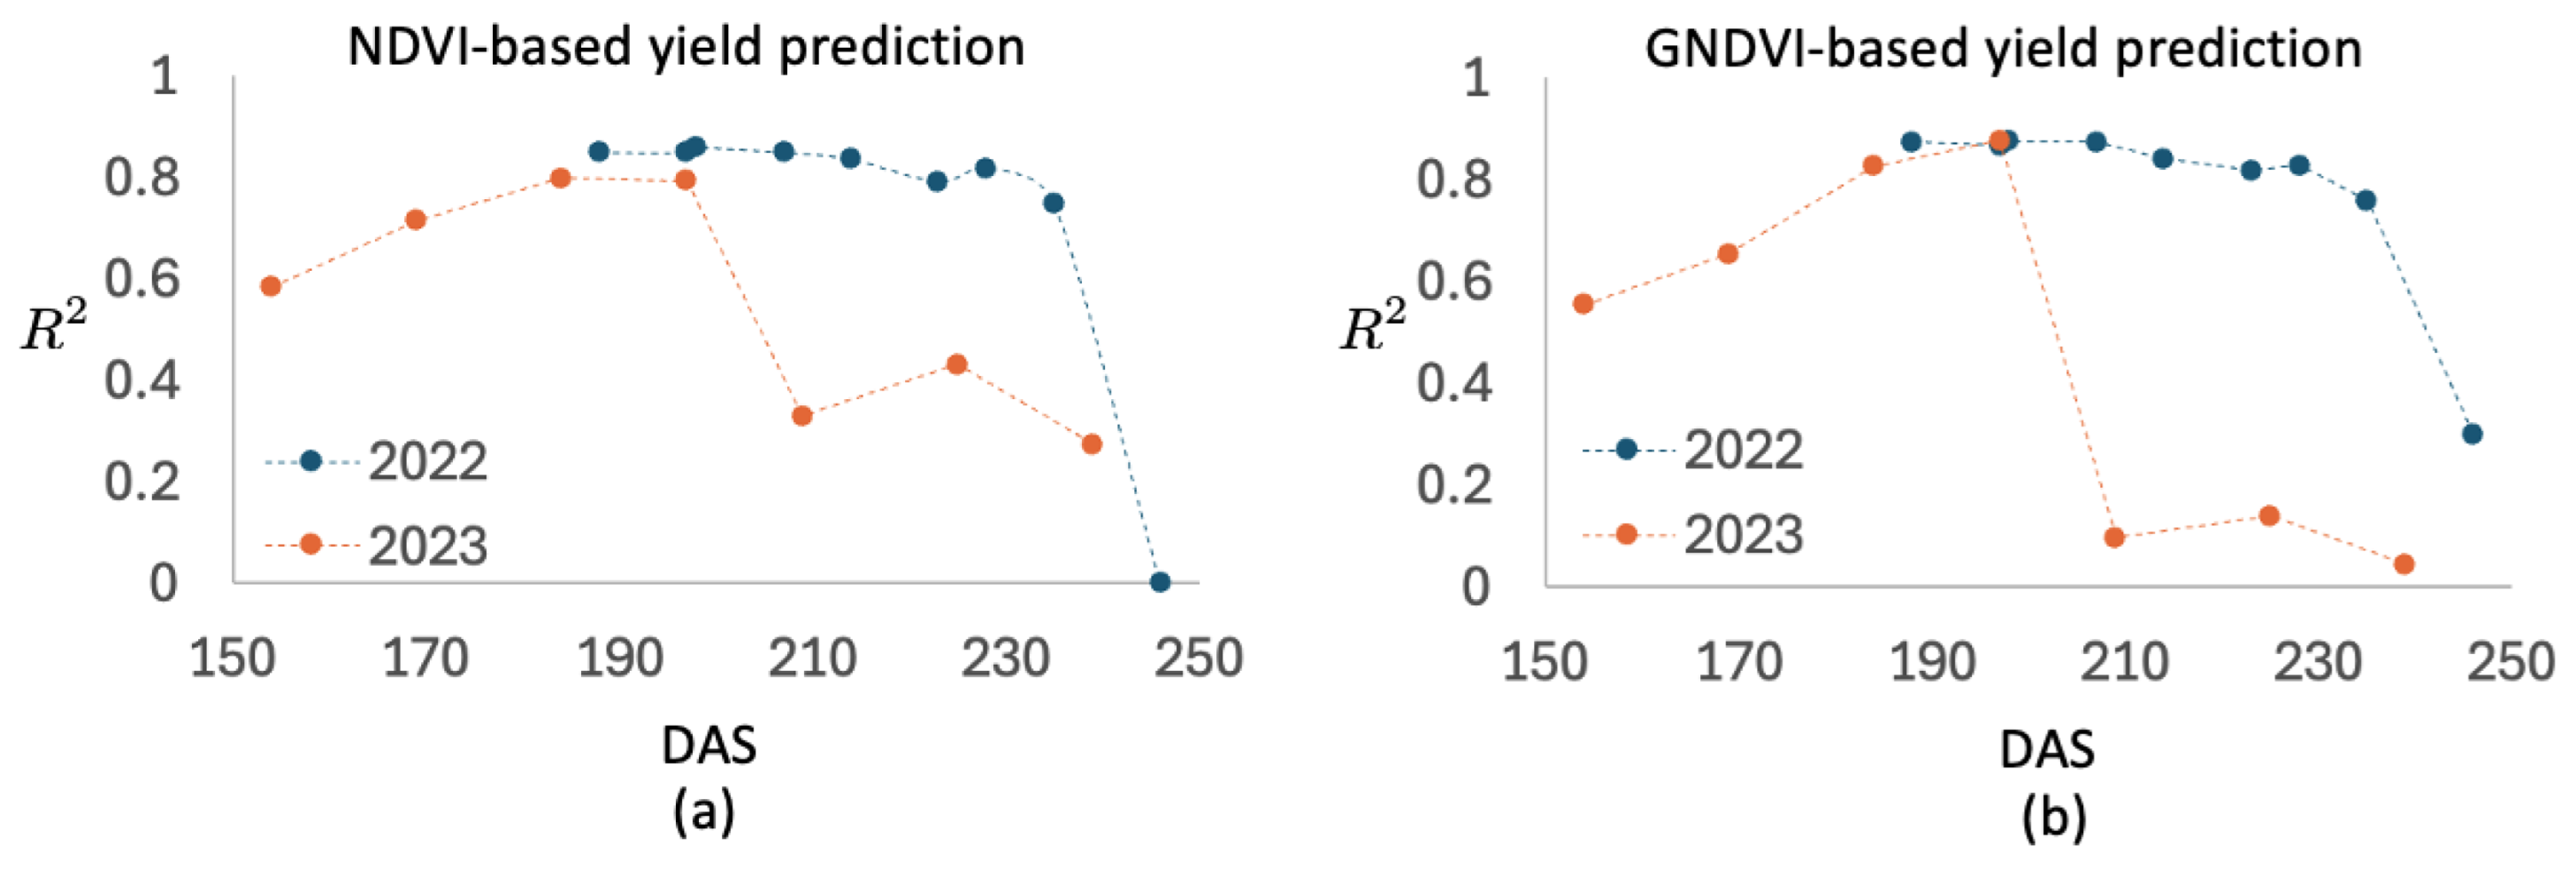
Decision algorithm for fertilization rates:
Building on previous studies [25,26], we adopted an NDVI-based fertilization algorithm. As expected, NDVI measurements taken approximately two weeks before the heading stage predicted yield with high accuracy (Figure 6). Subsequent drone-based nitrogen application was unlikely to have a major impact on wheat growth or yield but primarily influenced the final grain protein content. Wheat plants with higher NDVI values, which reflected better growth conditions, in fact required more nutrients at this stage to ensure higher grain protein content. This suggests that a strategy opposite to our current algorithm—applying more fertilizer in high-NDVI areas and less in low-NDVI areas—could potentially be a more accurate and effective approach. However, this remains a hypothesis and requires further investigation.
Additionally, although NDVI and GNDVI showed a strong correlation with yield, they did not exhibit a significant relationship with wheat protein content. Some satellite remote sensing studies have reported that the optimized soil-adjusted vegetation index (OSAVI) is significantly correlated with wheat protein content [27]. However, these indices are not entirely consistent with those derived from UAV-based remote sensing and generally exhibit weaker correlations, making them less suitable for determining fertilization rates.
Compared to NDVI, recent studies have indicated that the nitrogen nutrition index (NNI) shows a stronger correlation with grain protein content [28]. Additionally, some researchers have successfully predicted wheat protein content using support vector machine (SVM) algorithms based on four NNIs and five VIs [29]. In our evaluation of other VIs—such as red-edge NDVI (RENDVI), leaf chlorophyll index (LCI), and OSAVI—none showed a significant correlation with grain protein content. Therefore, we suggest that utilizing VIs more strongly correlated with protein content, including those not yet tested, or applying advanced algorithms based on these indices, could lead to a more robust and effective approach to determining fertilization rates.
(2)
Number of experimental plots:
Due to limitations in manpower and resources, only six VRA experimental plots were included in the 2022 trial. As a result, the observed statistical significance may not be broadly generalizable. To draw more robust and widely applicable conclusions, future trials should include a sufficient and appropriate number of experimental plots.
(3)
Deviation between actual and designed application rates:
Although we calibrated the agricultural drone’s spreading parameters in advance, we did not conduct a preliminary test application outside the target area before initiating the experiment. Such pre-tests are essential for ensuring high application accuracy. Furthermore, most current agricultural drones lack the capability to automatically adjust the spreading rate during acceleration and deceleration. Consequently, when spreading routes are too short—as was the case in the normal N zone and high N zone in 2022—the agricultural drone frequently operated in transitional speed phases, leading to significant deviations from the target application rate. Therefore, VRA may not be well suited for small experimental plots or fields where spreading paths are only a few meters long.
As fertilization immediately before the heading stage has a more pronounced effect on grain protein content than on final yield, NDVI measurements around this stage can be used for highly accurate yield predictions. Our method of selecting test plots included various growth conditions (“poor”, “normal”, and “good”), which is more reasonable than the conventional random or diagonal sampling methods in experimental fields. Therefore, the regression models achieved a higher accuracy for yield prediction than that reported previously [30].
Additionally, UAV-based remote sensing with the RTK FIX status at a flight altitude of 100 m achieved a high operational efficiency of over 60 ha/h, making it suitable for large-scale field monitoring. Compared with manual operation, autonomous agricultural drone fertilization for both uniform and VRA treatments is more convenient. However, the two agricultural drones used in the experiment had a limited payload capacity, requiring frequent fertilizer refills and battery replacements, which resulted in an application efficiency of only approximately 0.55 ha/h. Furthermore, the Agras T10 fertilizer-dispensing control unit exhibited a certain degree of time lag in real-time application, which affected the transitional zones. When selecting the experimental zones, it is advisable to avoid these transitional areas as much as possible.
Based on these findings and experiences, we will continue our research by exploring new VI-based fertilization strategies, improving the precision of drone-based fertilizer applications, and identifying optimal cultivation methods for regulating grain protein content.

5. Conclusions

In this study, UAV-based crop-growth monitoring and VRA fertilization were conducted in farming fields to improve and regulate the heterogeneity of wheat protein content. The results showed that NDVI and GNDVI near the heading stage were strongly correlated with wheat yield but were not significantly associated with protein content or protein yield. A comparison between VRA and uniform fertilization revealed no significant differences in final protein content, grain yield, or protein yield. We concluded that the current prescription map algorithm, which applies less fertilizer in high-NDVI areas and more in low-NDVI areas, is ineffective in practice. A reverse strategy—applying more fertilizer in high-NDVI areas and less in low-NDVI areas—could potentially be a more accurate and effective approach. Another way to enhance the effectiveness of VRA is to explore an alternative or more refined fertilization strategy that does not rely on NDVI but instead utilizes other VIs, NNIs, or advanced algorithms that are more closely correlated with protein content.
Although our study focused on using VRA to regulate wheat protein content, agricultural drone-based VRA technology itself is highly adaptable and scalable. It can be applied to the optimization of wheat yield or extended to other land-use crops beyond wheat, making it particularly suitable for precision farming in small- to medium-sized fields.

Author Contributions

S.G., conceptualization, methodology, investigation, software, validation and writing—original draft preparation, review and editing; Y.S., conceptualization, methodology, investigation, validation and writing—original draft preparation, review and editing; K.T., conceptualization, methodology, project administration, investigation, supervision, funding acquisition, and writing—review. H.K., investigation, resources, and writing—review; K.F., investigation, resources, and writing—review. S.W., investigation, resources, and writing—review. All authors have read and agreed to the published version of the manuscript.

Funding

This research was partly supported by “Research project for technologies to strengthen the international competitiveness of Japan’s agriculture and food industry” Shin1do1 (21452858).

Institutional Review Board Statement

Not applicable.

Informed Consent Statement

Not applicable.

Data Availability Statement

The data presented in this study are available on request from the corresponding author.

Acknowledgments

We sincerely thank technologists Akitoshi Honbu, Makoto Nakajima, and Atsuya Yokota from the Chikugo Technical Team, Technical Support Center of the Kyushu-Okinawa Region, Department of Technical Support, NARO, as well as the other technologists from the Hokuriku Operation Unit, Technical Support Center of the Central Region of the same department, for their contributions to data acquisition in both the field survey experiment and UAV photogrammetry. The authors would also like to extend special thanks to Masumi Kabashima for her diligent efforts in programming and assisting with data processing and analysis for this research.

Conflicts of Interest

The authors declare no conflicts of interest. The funders had no role in the design of the study; in the collection, analyses, or interpretation of data; in the writing of the manuscript; or in the decision to publish the results.

Abbreviations

The following abbreviations are used in this manuscript:
AGLAbove Ground Level
GCPGround Control Point
DASDays After Sowing
GNDVIGreen Normalized Difference Vegetation Index
GNDVI = (NIR - Green) / (NIR + Green)
NDVINormalized Difference Vegetation Index
NDVI = (NIR - Red) / (NIR + Red)
NNINitrogen Nutrition Index
OSAVIOptimized Soil Adjusted Vegetation Index
OSAVI = 1.16(NIR - Red) / (NIR + Red + 0.16)
RTKReal-Time Kinematic
UAVUnmanned Aerial Vehicle
VIVegetation Index
VRAVariable Rate Application

References

  1. Bhakta, I.; Phadikar, S.; Majumder, K. State-of-the-art technologies in precision agriculture: A systematic review. J. Sci. Food Agric. 2019, 99, 4878–4888. [Google Scholar] [CrossRef] [PubMed]
  2. Sishodia, R.P.; Ray, R.L.; Singh, S.K. Applications of remote sensing in precision agriculture: A review. Remote Sens. 2020, 12, 3136. [Google Scholar] [CrossRef]
  3. Savci, S. Investigation of effect of chemical fertilizers on environment. Apcbee Procedia 2012, 1, 287–292. [Google Scholar] [CrossRef]
  4. Pawase, P.P.; Nalawade, S.M.; Bhanage, G.B.; Walunj, A.A.; Kadam, P.B.; Durgude, A.G.; Patil, M.G. Variable rate fertilizer application technology for nutrient management: A review. Int. J. Agric. Biol. Eng. 2023, 16, 11–19. [Google Scholar] [CrossRef]
  5. Romano, E.; Bergonzoli, S.; Pecorella, I.; Bisaglia, C.; De Vita, P. Methodology for the definition of durum wheat yield homogeneous zones by using satellite spectral indices. Remote Sens. 2021, 13, 2036. [Google Scholar] [CrossRef]
  6. Lindblom, J.; Lundström, C.; Ljung, M.; Jonsson, A. Promoting sustainable intensification in precision agriculture: Review of decision support systems development and strategies. Precis. Agric. 2017, 18, 309–331. [Google Scholar] [CrossRef]
  7. Campos, J.; Gallart, M.; Llop, J.; Ortega, P.; Salcedo, R.; Gil, E. On-farm evaluation of prescription map-based variable rate application of pesticides in vineyards. Agronomy 2020, 10, 102. [Google Scholar] [CrossRef]
  8. Garcia-Ruiz, F.; Campos, J.; Llop-Casamada, J.; Gil, E. Assessment of map based variable rate strategies for copper reduction in hedge vineyards. Comput. Electron. Agric. 2023, 207, 107753. [Google Scholar] [CrossRef]
  9. Chen, P.; Xu, W.; Zhan, Y.; Yang, W.; Wang, J.; Lan, Y. Evaluation of cotton defoliation rate and establishment of spray prescription map using remote sensing imagery. Remote Sens. 2022, 14, 4206. [Google Scholar] [CrossRef]
  10. Zhang, L.; Sun, B.; Zhao, D.; Shan, C.; Wang, G.; Song, C.; Chen, P.; Lan, Y. Prediction of cotton FPAR and construction of defoliation spraying prescription map based on multi-source UAV images. Comput. Electron. Agric. 2024, 220, 108897. [Google Scholar] [CrossRef]
  11. Li, X.; Liang, Z.; Yang, G.; Lin, T.; Liu, B. Assessing the Severity of Verticillium Wilt in Cotton Fields and Constructing Pesticide Application Prescription Maps Using Unmanned Aerial Vehicle (UAV) Multispectral Images. Drones 2024, 8, 176. [Google Scholar] [CrossRef]
  12. Castaldi, F.; Pelosi, F.; Pascucci, S.; Casa, R. Assessing the potential of images from unmanned aerial vehicles (UAV) to support herbicide patch spraying in maize. Precis. Agric. 2017, 18, 76–94. [Google Scholar] [CrossRef]
  13. Yi, L.; Lan, Y.; Kong, H.; Kong, F.; Huang, H.; Han, X. Exploring the potential of UAV imagery for variable rate spraying in cotton defoliation application. Int. J. Precis. Agric. Aviat. 2019, 2, 42–45. [Google Scholar] [CrossRef]
  14. Song, C.; Zhou, Z.; Zang, Y.; Zhao, L.; Yang, W.; Luo, X.; Jiang, R.; Ming, R.; Zang, Y.; Zi, L.; et al. Variable-rate control system for UAV-based granular fertilizer spreader. Comput. Electron. Agric. 2021, 180, 105832. [Google Scholar] [CrossRef]
  15. Yu, Z.; Islam, S.; She, M.; Diepeveen, D.; Zhang, Y.; Tang, G.; Zhang, J.; Juhasz, A.; Yang, R.; Ma, W. Wheat grain protein accumulation and polymerization mechanisms driven by nitrogen fertilization. Plant J. 2018, 96, 1160–1177. [Google Scholar] [CrossRef]
  16. Zhang, J.; Wang, W.; Krienke, B.; Cao, Q.; Zhu, Y.; Cao, W.; Liu, X. In-season variable rate nitrogen recommendation for wheat precision production supported by fixed-wing UAV imagery. Precis. Agric. 2022, 23, 830–853. [Google Scholar] [CrossRef]
  17. Kusaka, H.; Suzuki, N.; Yabe, M.; Kobayashi, H. The snow-shadow effect of Sado Island on Niigata City and the coastal plain. Atmos. Sci. Lett. 2023, 24, e1182. [Google Scholar] [CrossRef]
  18. Whitaker, A.C.; Sugiyama, H. Seasonal snowpack dynamics and runoff in a cool temperate forest: Lysimeter experiment in Niigata, Japan. Hydrol. Process. 2005, 19, 4179–4200. [Google Scholar] [CrossRef]
  19. Eito, H.; Murakami, M.; Muroi, C.; Kato, T.; Hayashi, S.; Kuroiwa, H.; Yoshizaki, M. The structure and formation mechanism of transversal cloud bands associated with the Japan-Sea polar-airmass convergence zone. J. Meteorol. Soc. Jpn. 2010, 88, 625–648. [Google Scholar] [CrossRef]
  20. Tachibana, Y.; Honda, M.; Nishikawa, H.; Kawase, H.; Yamanaka, H.; Hata, D.; Kashino, Y. High moisture confluence in Japan Sea polar air mass convergence zone captured by hourly radiosonde launches from a ship. Sci. Rep. 2022, 12, 21674. [Google Scholar] [CrossRef]
  21. Shibukawa, H.; Shimazaki, Y.; Seki, M. Impact of Nitrogen Topdressing at Flowering on Grain Protein and Ash content in Wheat Variety ’Yukichikara’ for Bread. Hokuriku Crop Sci. 2018, 53, 16–19. [Google Scholar] [CrossRef]
  22. Shimazaki, Y. The growth of Wheat Variety ’Natsukogane’ compare with ‘Yukichikara’ in Niigata Prefecture. Hokuriku Crop Sci. 2021, 56, 11–16. [Google Scholar] [CrossRef]
  23. Shimazaki, Y.; Watanabe, Y. Grain Protein Concentration of Wheat T. aestivum L.)-Can cultivation techniques control the grain protein concentration of wheat? Jpn. J. Crop Sci. 2010, 79, 407–413. [Google Scholar] [CrossRef]
  24. Shimazaki, Y.; Akasaka, M.; Watanabe, Y.; Ohshita, Y.; Matsuyama, H.; Hirasawa, T. Nitrogen Content of Wheat Plants at Anthesis Affects Grain Protein Content and its Increase in Response to Nitrogen Topdressing at Anthesis. Jpn. J. Crop Sci. 2015, 84, 140–149. [Google Scholar] [CrossRef]
  25. Wang, K.; Huggins, D.R.; Tao, H. Rapid mapping of winter wheat yield, protein, and nitrogen uptake using remote and proximal sensing. Int. J. Appl. Earth Obs. 2019, 82, 101921. [Google Scholar] [CrossRef]
  26. Walsh, O.S.; Marshall, J.M.; Nambi, E.; Jackson, C.A.; Ansah, E.O.; Lamichhane, R.; McClintick-Chess, J.; Bautista, F. Wheat Yield and Protein Estimation with Handheld and Unmanned Aerial Vehicle-Mounted Sensors. Agronomy 2023, 13, 207. [Google Scholar] [CrossRef]
  27. Song, X.; Wang, J.; Huang, W.; Yan, G.; Chang, H. Monitoring spatial variance of winter wheat growth and grain quality under variable-rate fertilization conditions by remote sensing data. Trans. Chin. Soc. Agric. Eng. 2009, 25, 155–162. [Google Scholar]
  28. Fabbri, C.; Delgado, A.; Guerrini, L.; Napoli, M. Precision nitrogen fertilization strategies for durum wheat: A sustainability evaluation of NNI and NDVI map-based approaches. Eur. J. Agron. 2025, 164, 127502. [Google Scholar] [CrossRef]
  29. Qu, S.; Li, Z.; Qiu, C.; Yang, G.; Song, X.; Chen, Z.; Liu, C. Remote sensing prediction of winter wheat grain protein content based on nitrogen nutrition index at anthesis stage. Trans. Chin. Soc. Agric. Eng. 2017, 33, 186–193. [Google Scholar]
  30. Duan, T.; Chapman, S.; Guo, Y.; Zheng, B. Dynamic monitoring of NDVI in wheat agronomy and breeding trials using an unmanned aerial vehicle. Field Crop. Res. 2017, 210, 71–80. [Google Scholar] [CrossRef]
Figure 1. Experimental fields at the study site. (a) study site; (b) five experimental fields; (c) two split zones of VRA ( F 1 v , F 4 v , and F 5 v ) and uniform ( F 1 a , F 4 a , and F 5 a ) fertilization in F 1 , F 4 , and F 5 , respectively.
Drones 09 00310 g001
Figure 2. Flow chart of the methodology.
Drones 09 00310 g002
Figure 3. NDVI maps ((a,c,e), sharing the same NDVI legend and the same distance scale) and corresponding prescription maps (b,d,f) for experimental fields F 1 , F 4 , and F 5 . Each field was divided into uniform fertilization zones ( F 1 a , F 4 a , and F 5 a ) and VRA fertilization zones ( F 1 v , F 4 v , and F 5 v ). (a) NDVI map of F 1 ; (b) VRA zone F 1 v and uniform N zone F 1 a of F 1 ; (c) NDVI map of F 4 ; (d) uniform N zone F 4 a and VRA zone F 4 v of F 4 ; (e) NDVI map of F 5 ; (f) uniform N zone F 5 a and VRA zone F 5 v of F 5 .
Drones 09 00310 g003
Figure 4. NDVI trends over DAS for different treatment zones— F 1 a vs. F 1 v in F 1 (a), F 4 a vs. F 4 v in F 4 (c), and F 5 a vs. F 5 v in F 5 (e)—and the corresponding standard deviations of NDVI (b,d,f) are shown for F 1 , F 4 , and F 5 , respectively.
Drones 09 00310 g004
Figure 5. Distribution of protein content, yield, and protein yield per unit N in treatment zones across 2022 and 2023, where n is the sample size. (a,c,e): Boxplots of protein content, yield, and protein yield per unit N, respectively, for the 2022 uniform and VRA treatments; (b,d,f): Comparative boxplots for the 2023 uniform and VRA treatments.
Drones 09 00310 g005
Figure 6. Correlation between NDVI and yield (a), and between GNDVI and yield (b).
Drones 09 00310 g006
Figure 7. Changes in R 2 values between NDVI and yield over DAS (a), and between GNDVI and yield over DAS (b).
Drones 09 00310 g007
Table 1. Information on the experimental fields and fertilizations.
FieldF1F2F3F4F5
Planted area (ha)0.952.321.241.091.45
Basal fertilizer date30 September 20216 October 2022
Seeding date7 October 20219 October 20218 October 202113 October 202212 October 2022
Basal fertilizer *117 a80 b
Manual N application * @ DAS3 c @ 43
39 d @ 14440 d @ 145
Drone-based10 d @ 16010d @ 161
N application * @ DAS5 d @ 1665 d @ 168
60 d @ 20160 d @ 19860 d @ 19960 d @ 19460 d @ 195
Estimated total N application *179177177194195
Estimated heading date (DAS)207205206201202
Harvest date (DAS)253251252249250
* Unit of N application: kg N ha 1 ; a (39% N, 4% P 2 O 5 , 1% K 2 O); b (40% N, 3% P 2 O 5 , 1% K 2 O); c (46% N, 0% P 2 O 5 , 0% K 2 O); d (45% N, 0% P 2 O 5 , 0% K 2 O)).
Table 2. Information on drone-based fertilizer application.
Drone ModelMG-1PAgras T10
Target field/zone F 3 F 2 F 1 a F 4 a F 1 v F 4 v F 5 v F 5 a
Target area percentage (%)100100464154595248
TreatmentUniformVRAUniform
WeatherSunnySunnyCloudySunnyCloudySunnyCloudyCloudy
Wind speed (m/s)-2.51.34.93.03.74.77.2
Wind direction-WNWSNNESEENNEESE
Temperature (dd)-26.222.818.124.716.117.518.8
Working width (m)4.05.0
Flight speed (km/h)15.014.410.810.810.8
Table 3. The experimental conditions for air spreading.
Treatment ZoneDesigned Fertilization Rate
(kg N ha−1)
Actual Fertilization Rate
(kg N ha−1)
Ratio to Designed
Fertilization Rate
F 1 a 6058.196.9%
F 1 v 60 *45.575.8%
F 2 6061.4102.4%
F 3 6065.1108.5%
F 4 a 6067.6112.7%
F 4 v 60 *64.3107.2%
F 5 a 6055.692.6%
F 5 v 60 *67.5112.5%
* Estimated value.
Disclaimer/Publisher’s Note: The statements, opinions and data contained in all publications are solely those of the individual author(s) and contributor(s) and not of MDPI and/or the editor(s). MDPI and/or the editor(s) disclaim responsibility for any injury to people or property resulting from any ideas, methods, instructions or products referred to in the content.

