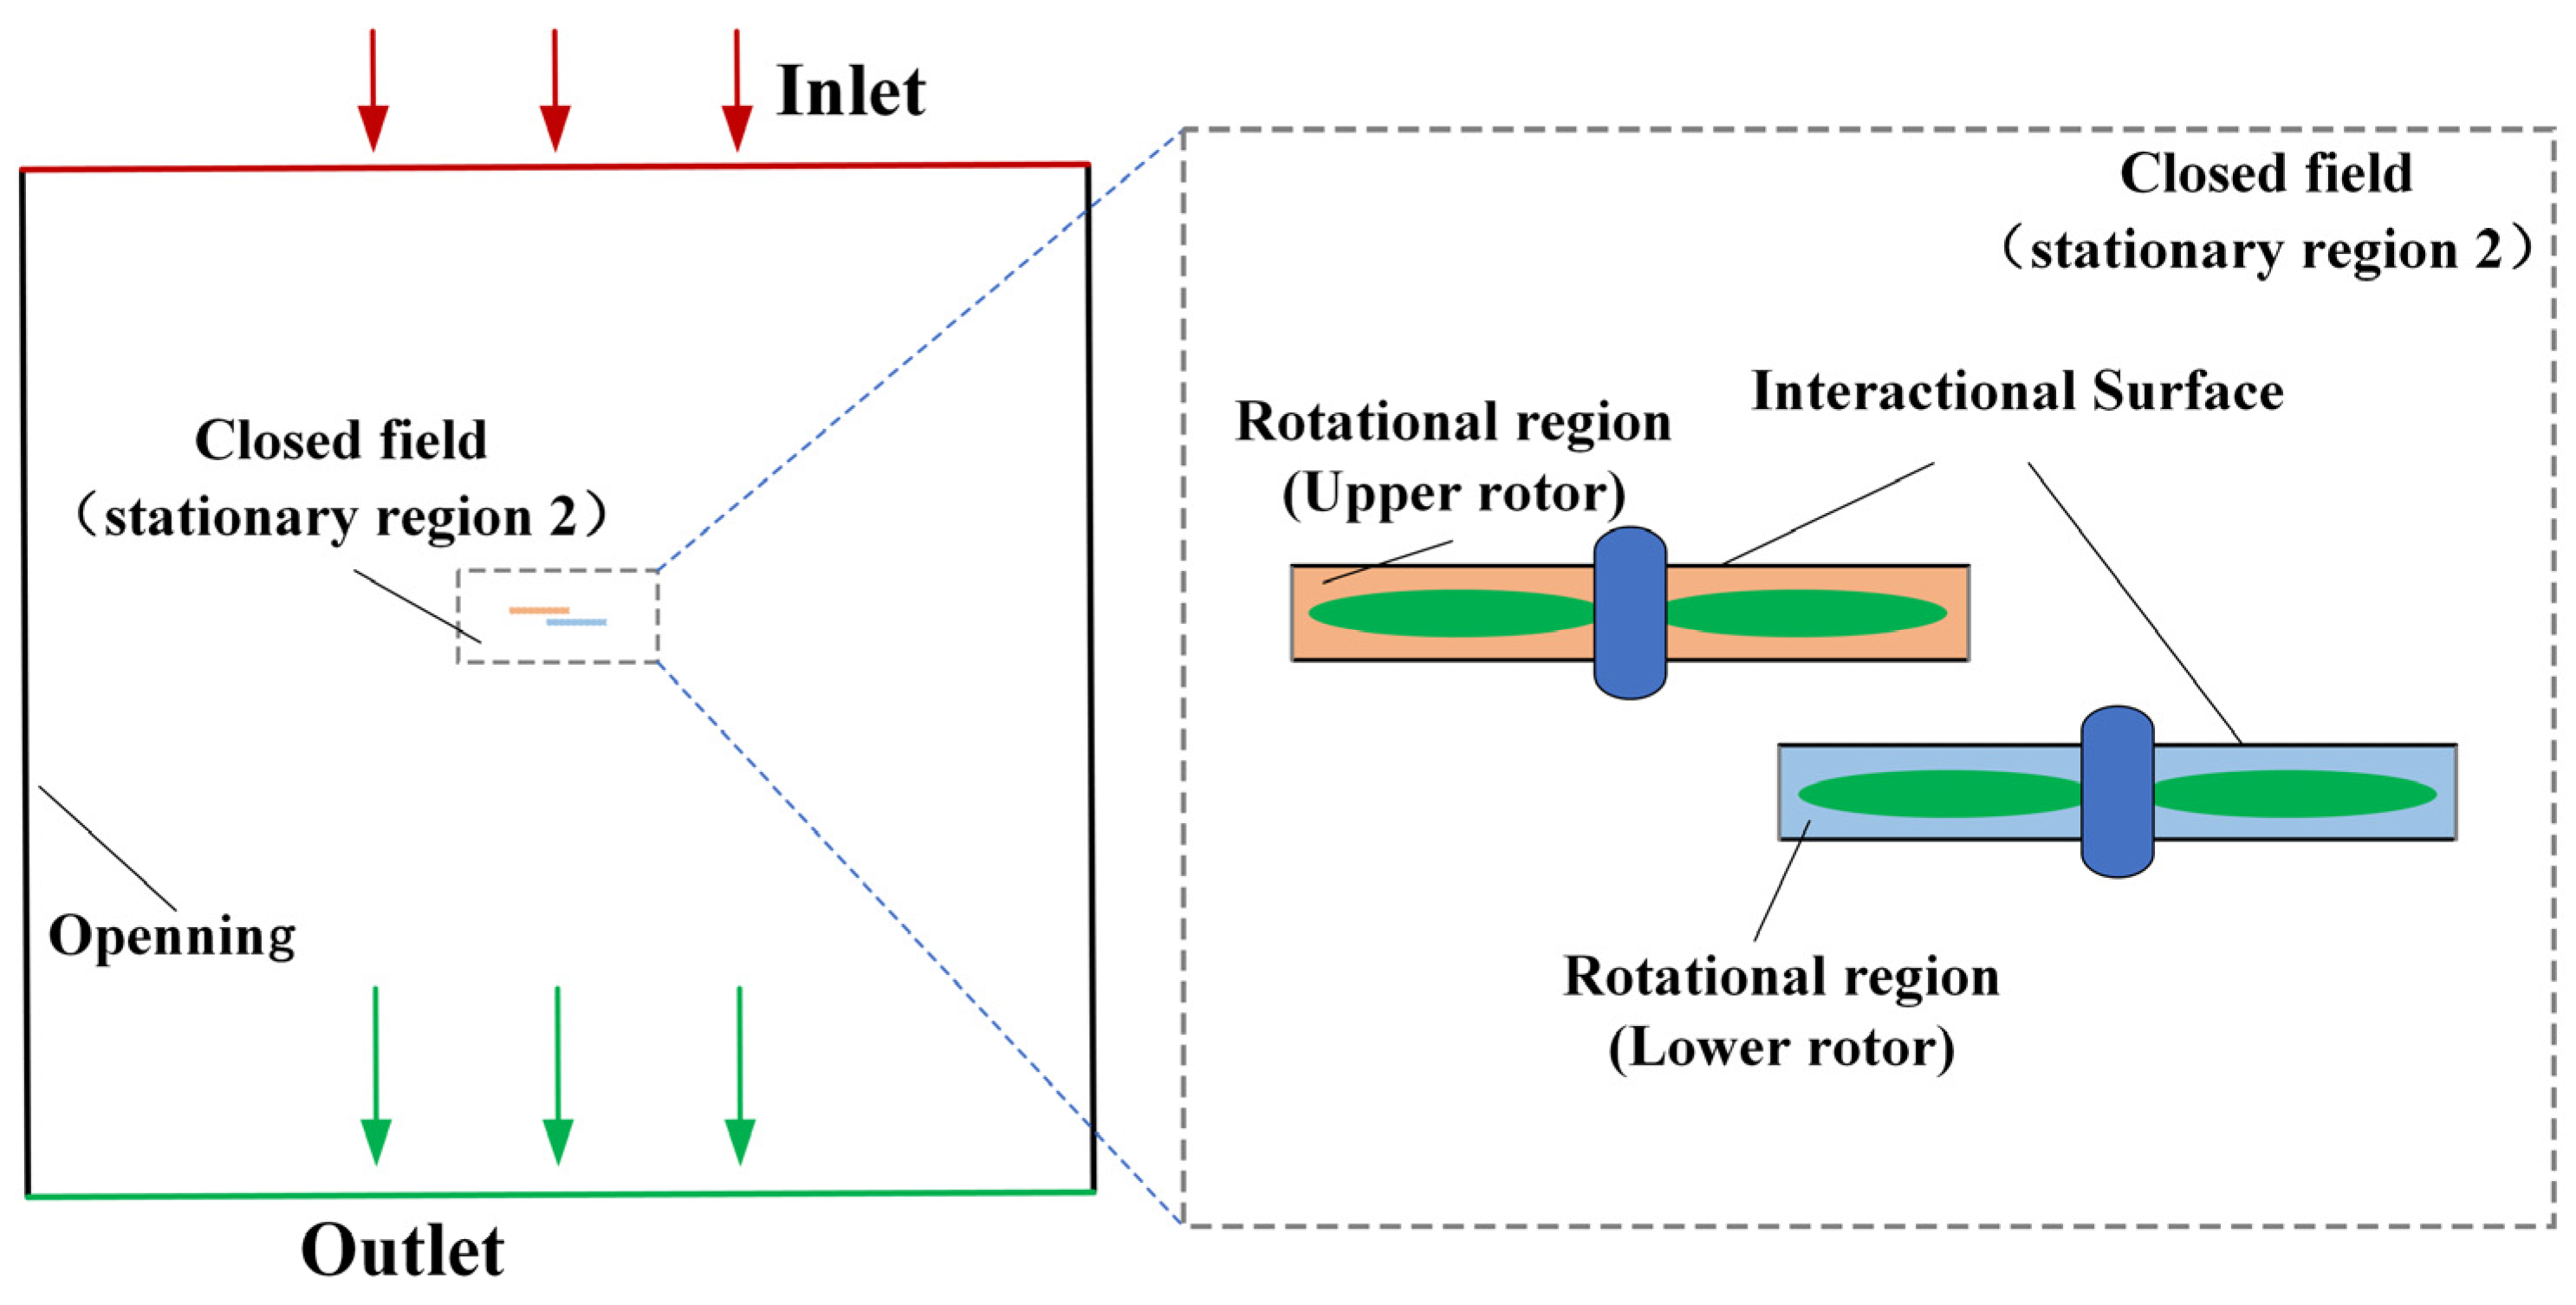
3.1. Aerodynamic Interaction of the Overlapping Rotor
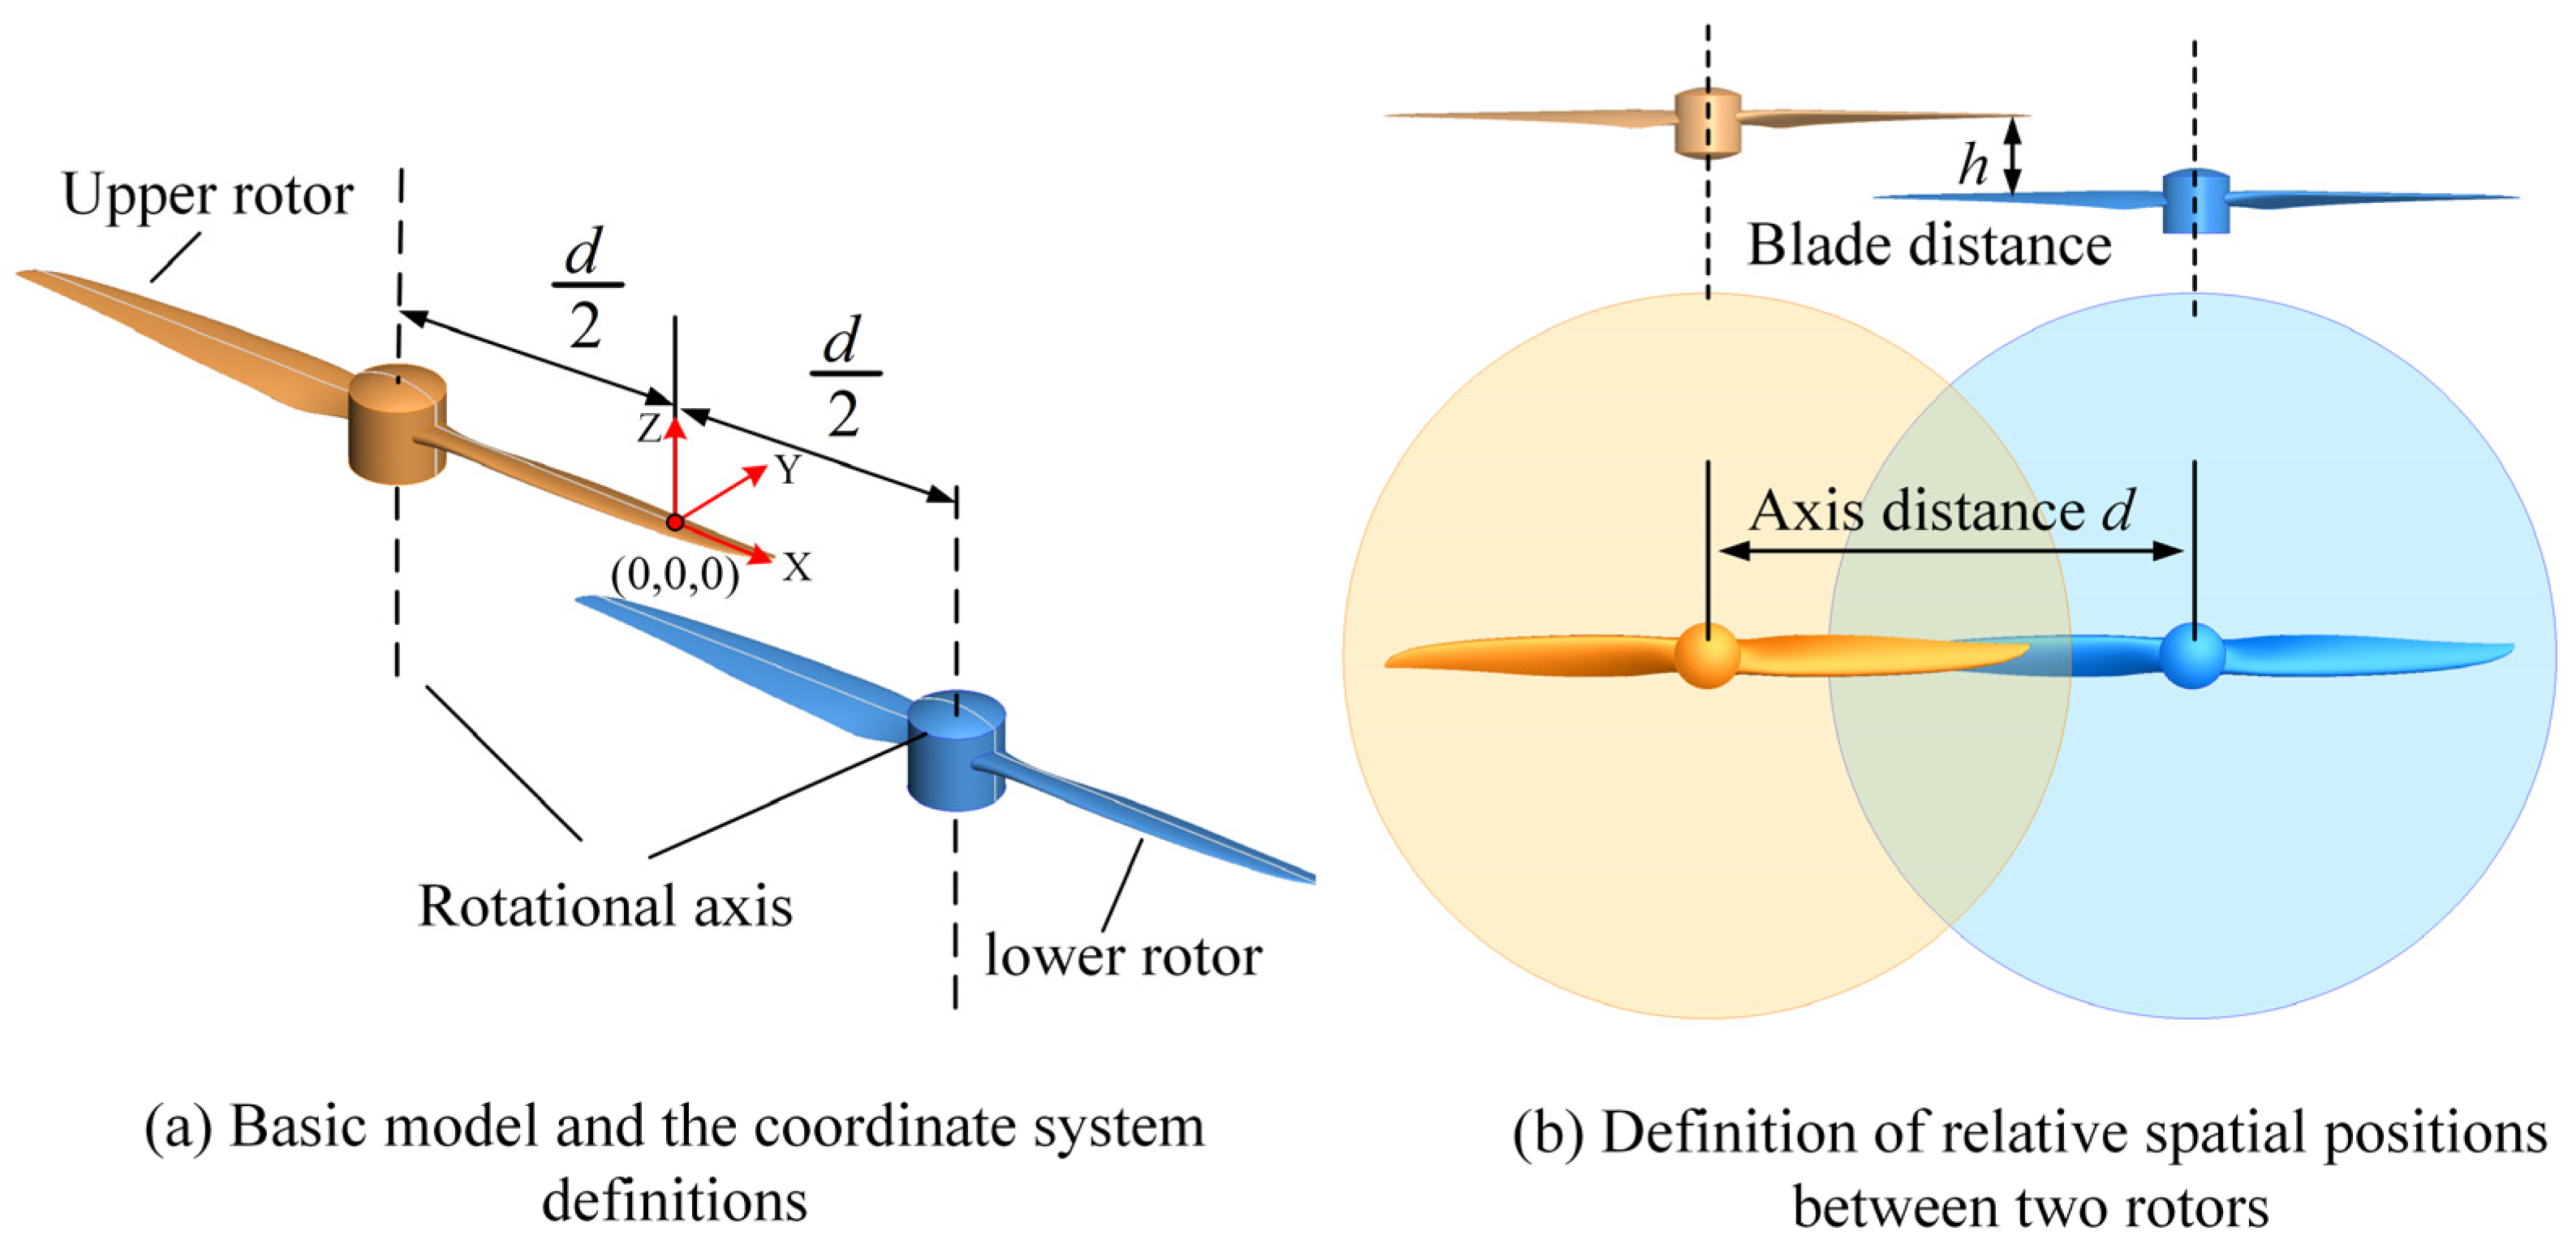
When viewed from above, the basic model of two rotors organized in an overlapping configuration is refined, as seen in
Figure 5. In the coordinate system, the Z-axis is defined as the axis of rotation, while the X-axis is defined as the direction of the initial phase expansion of the rotor. Subsequently, in accordance with the right-hand rule, the direction of the Y-axis in the coordinate system can be defined. The origin of the coordinate system is defined to be situated along the horizontal plane of the upper rotor, precisely at the midway of the rotational axis between the two rotors.
Figure 5b defines the blade distance,
h, as the axial distance between two rotor blades, and the axis distance,
d, as the spanwise distance between the rotating axis of two rotors. Divided by the diameter
D of the rotor, the axis distance and blade distance can be expressed by the dimensionless parameters
d/D and
h/D.
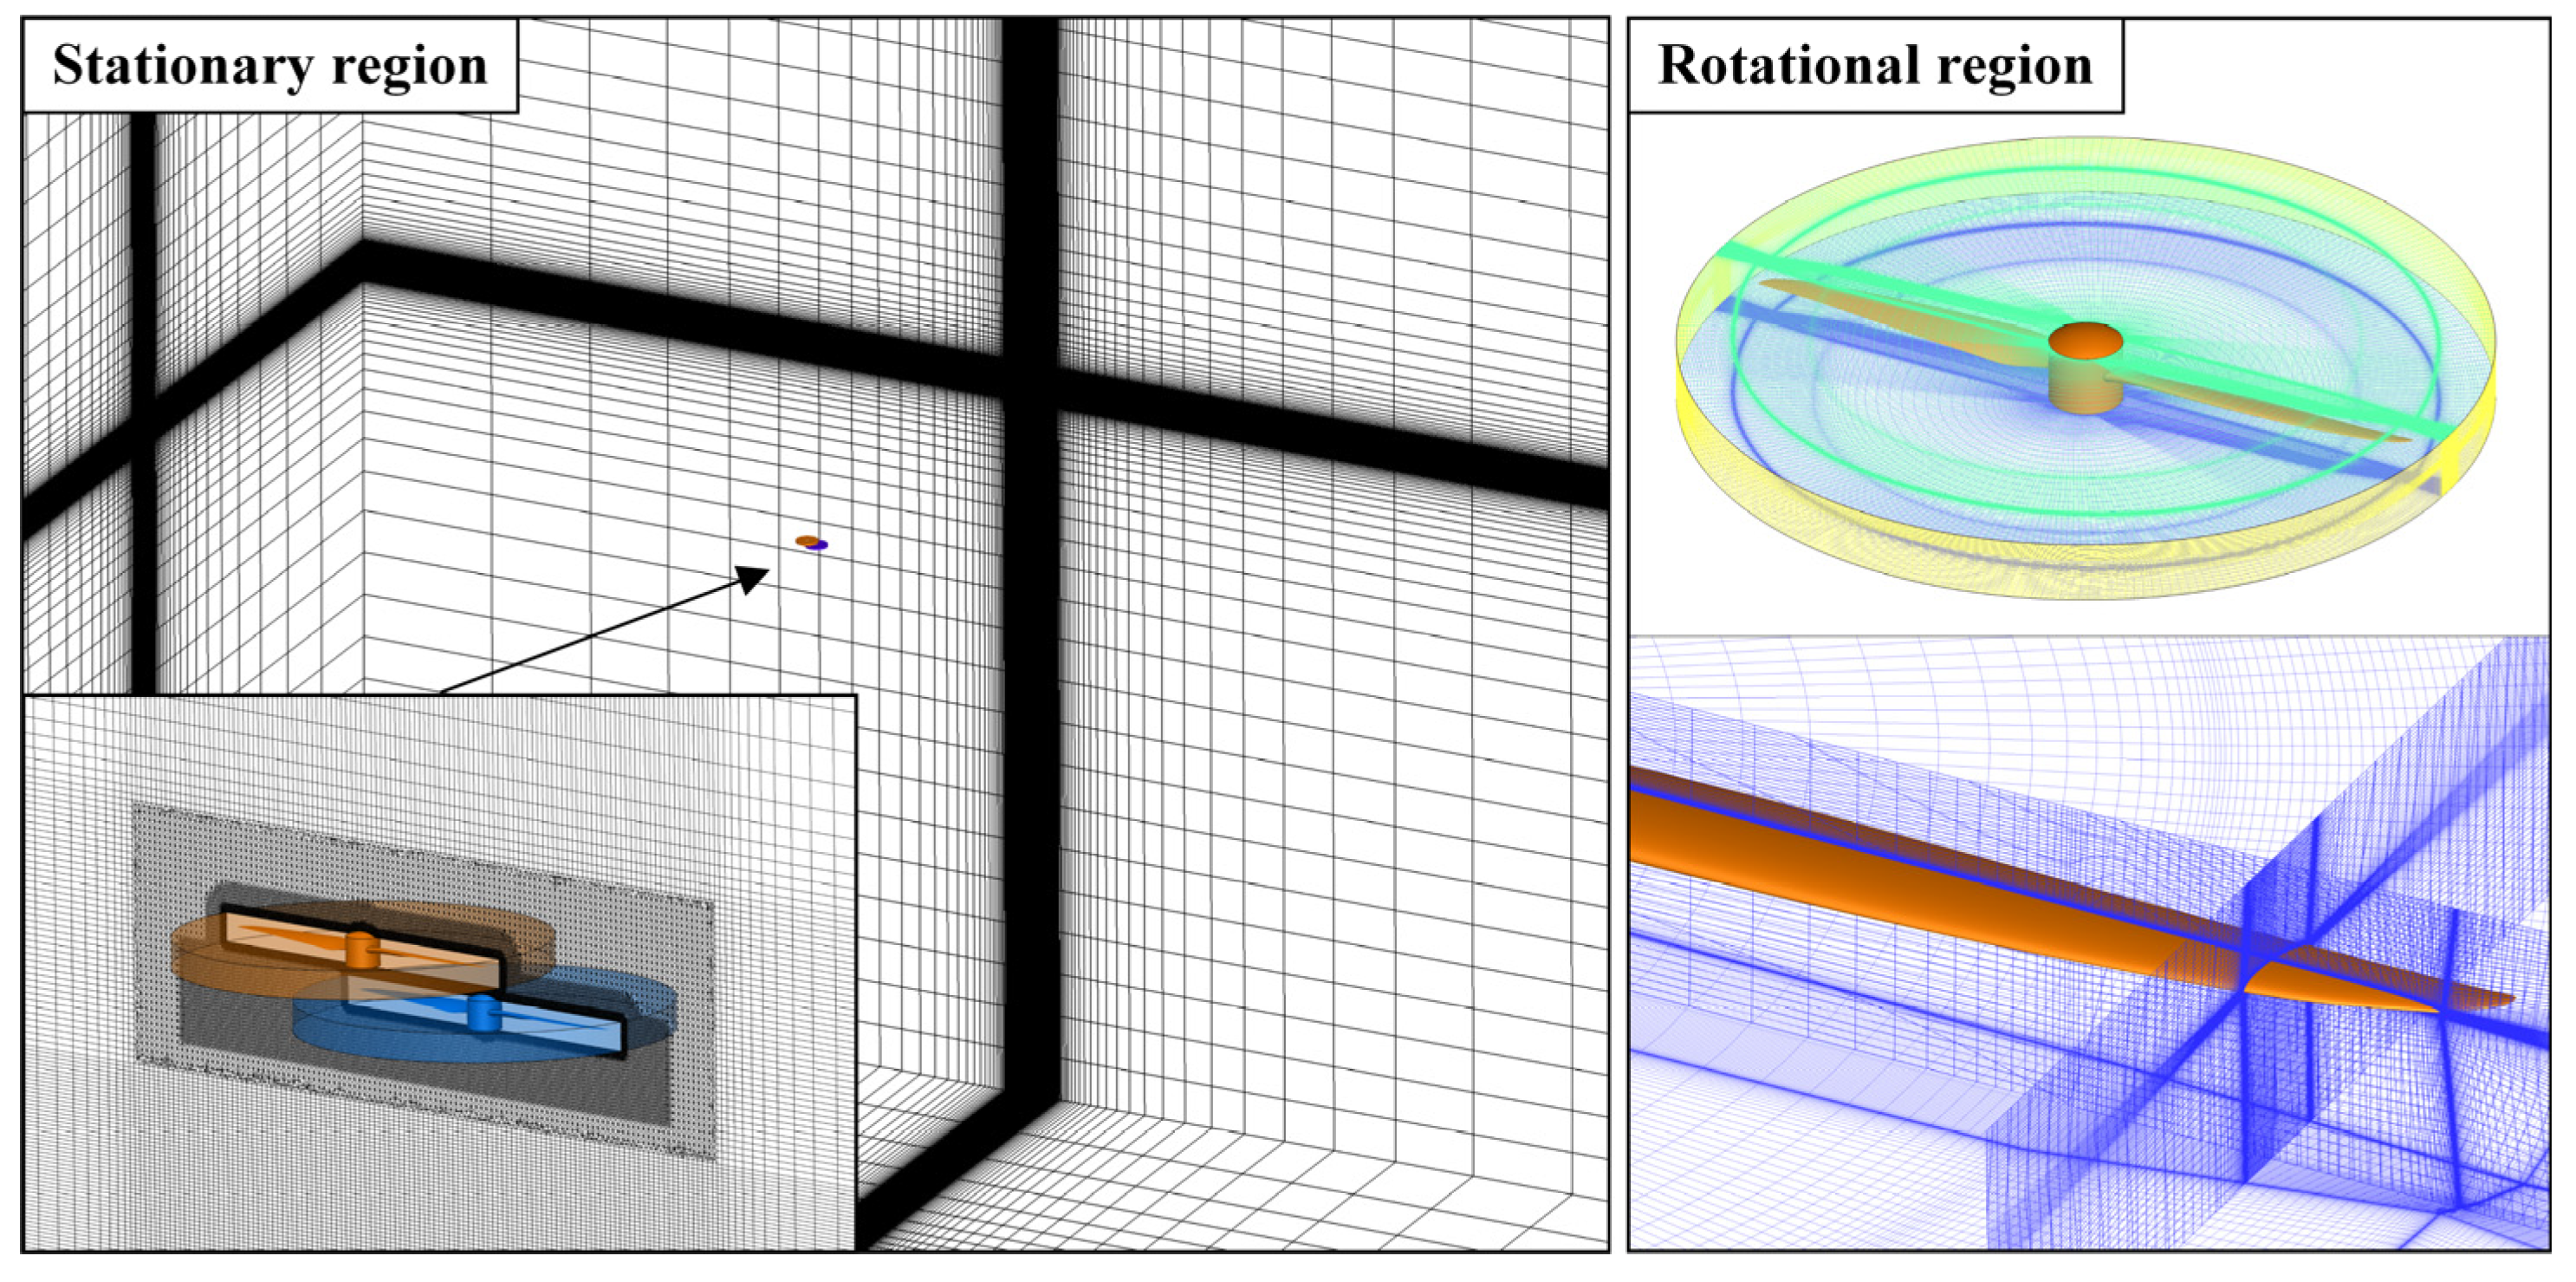
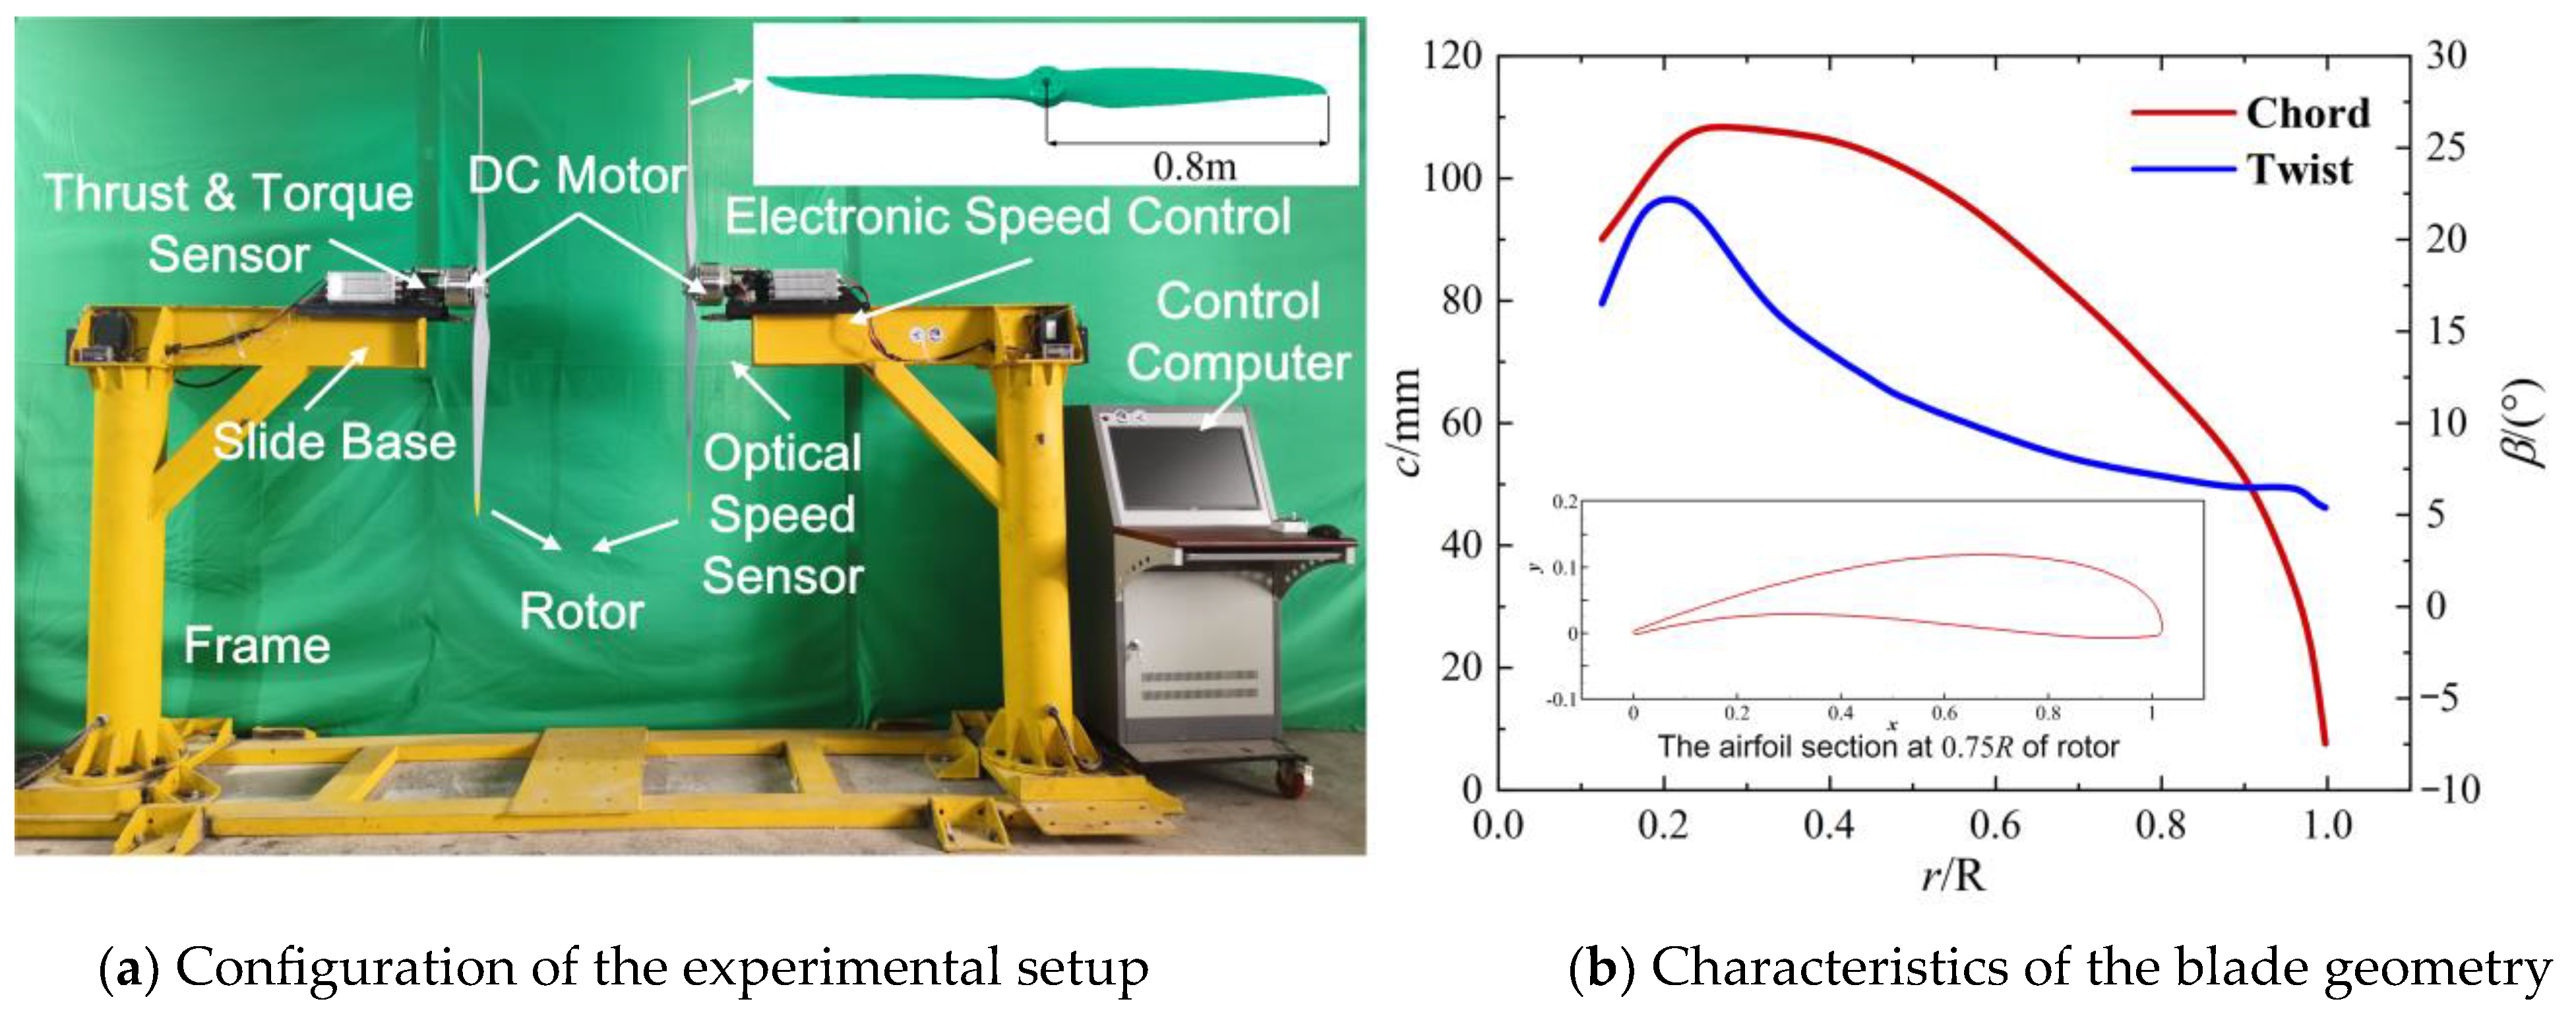
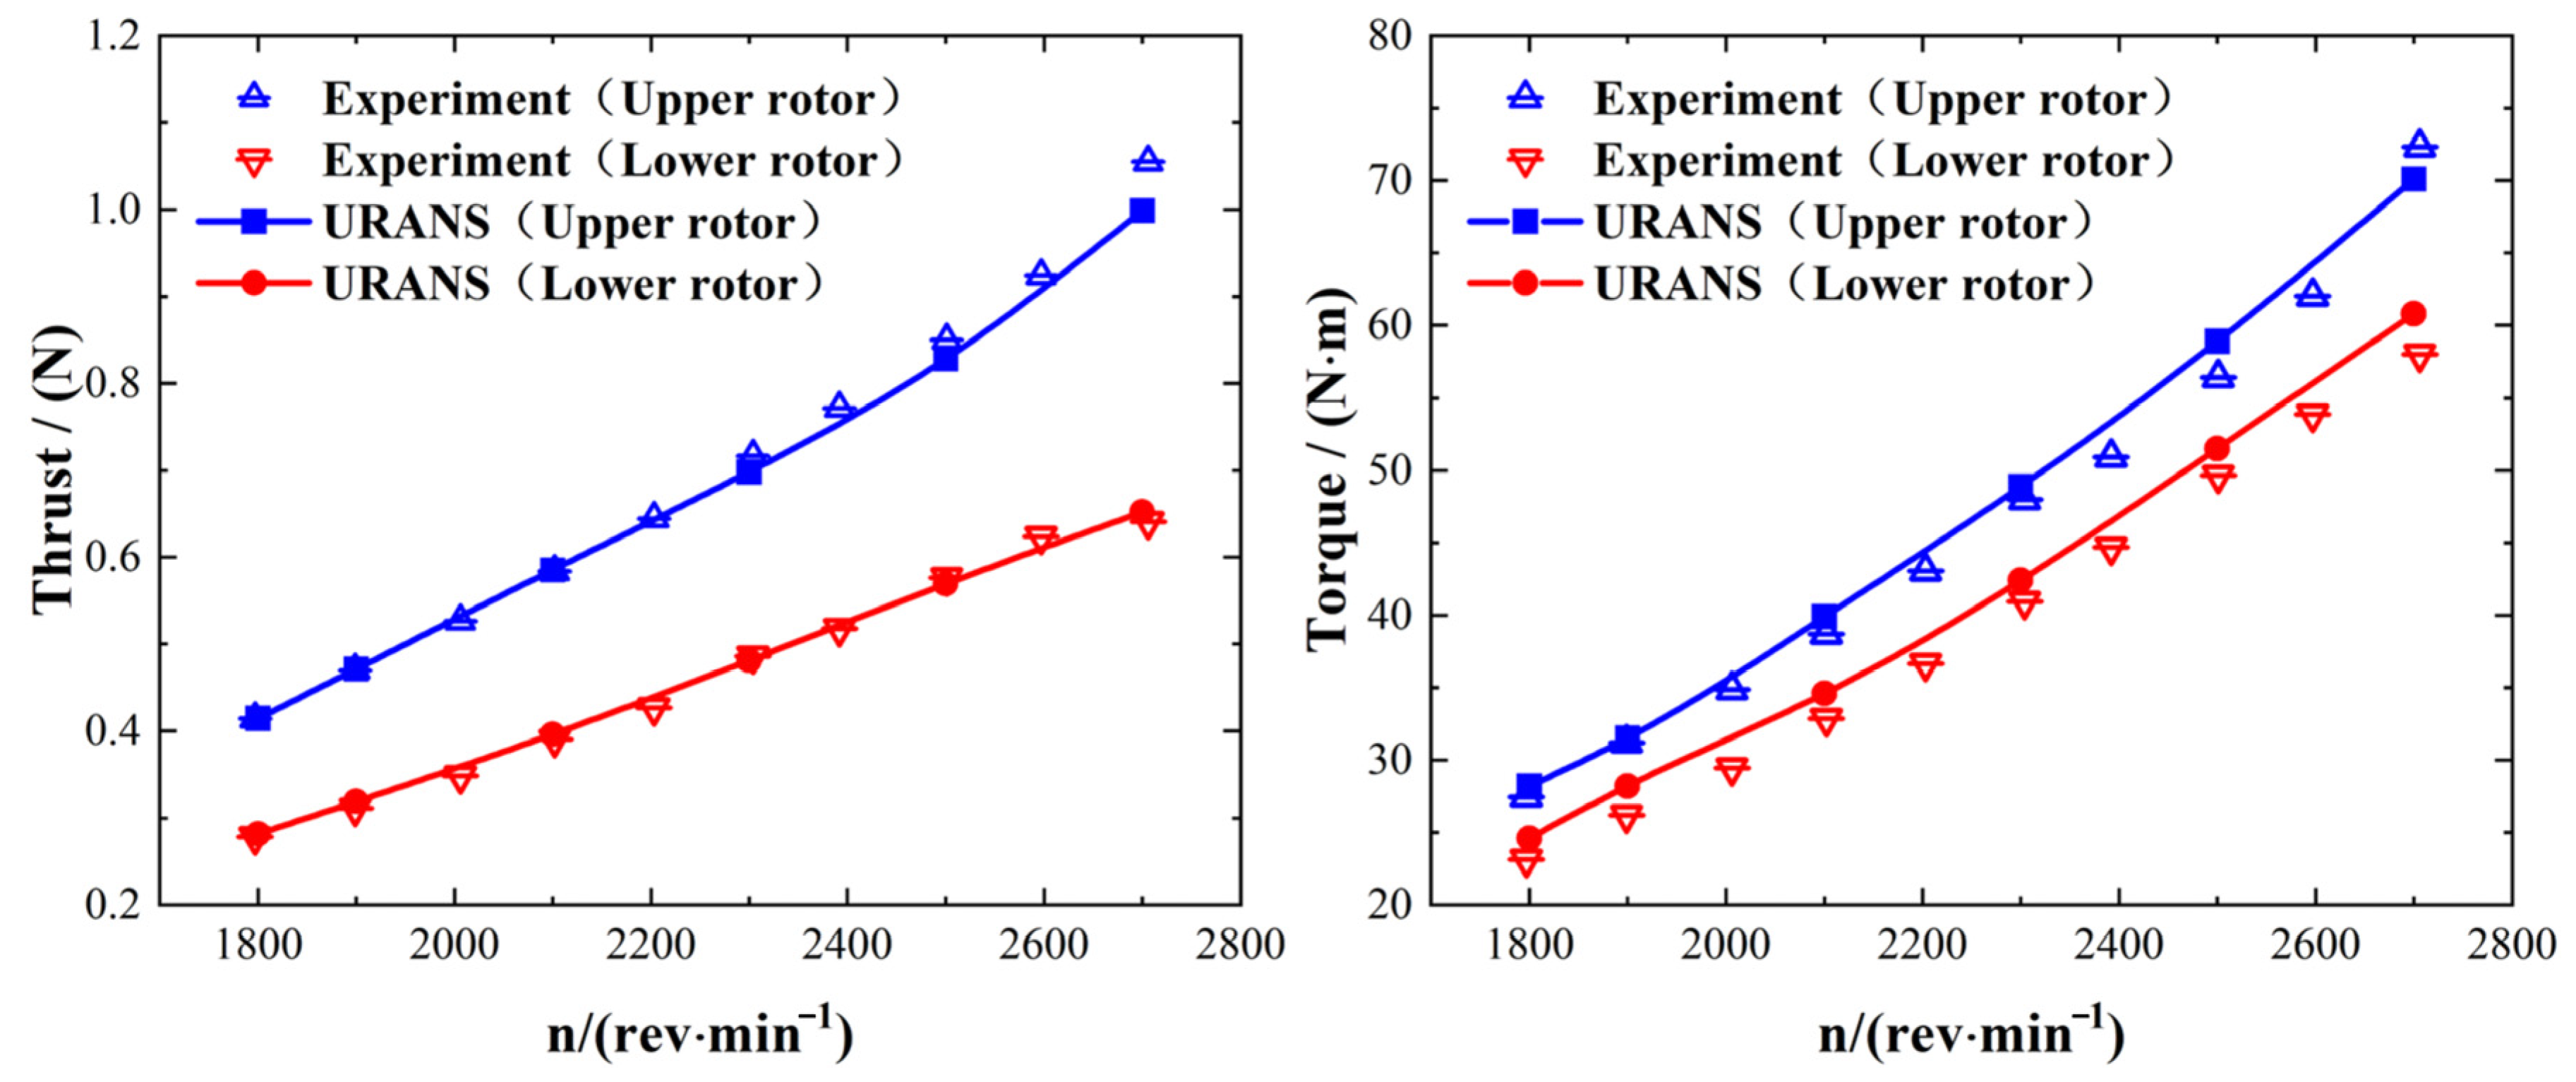
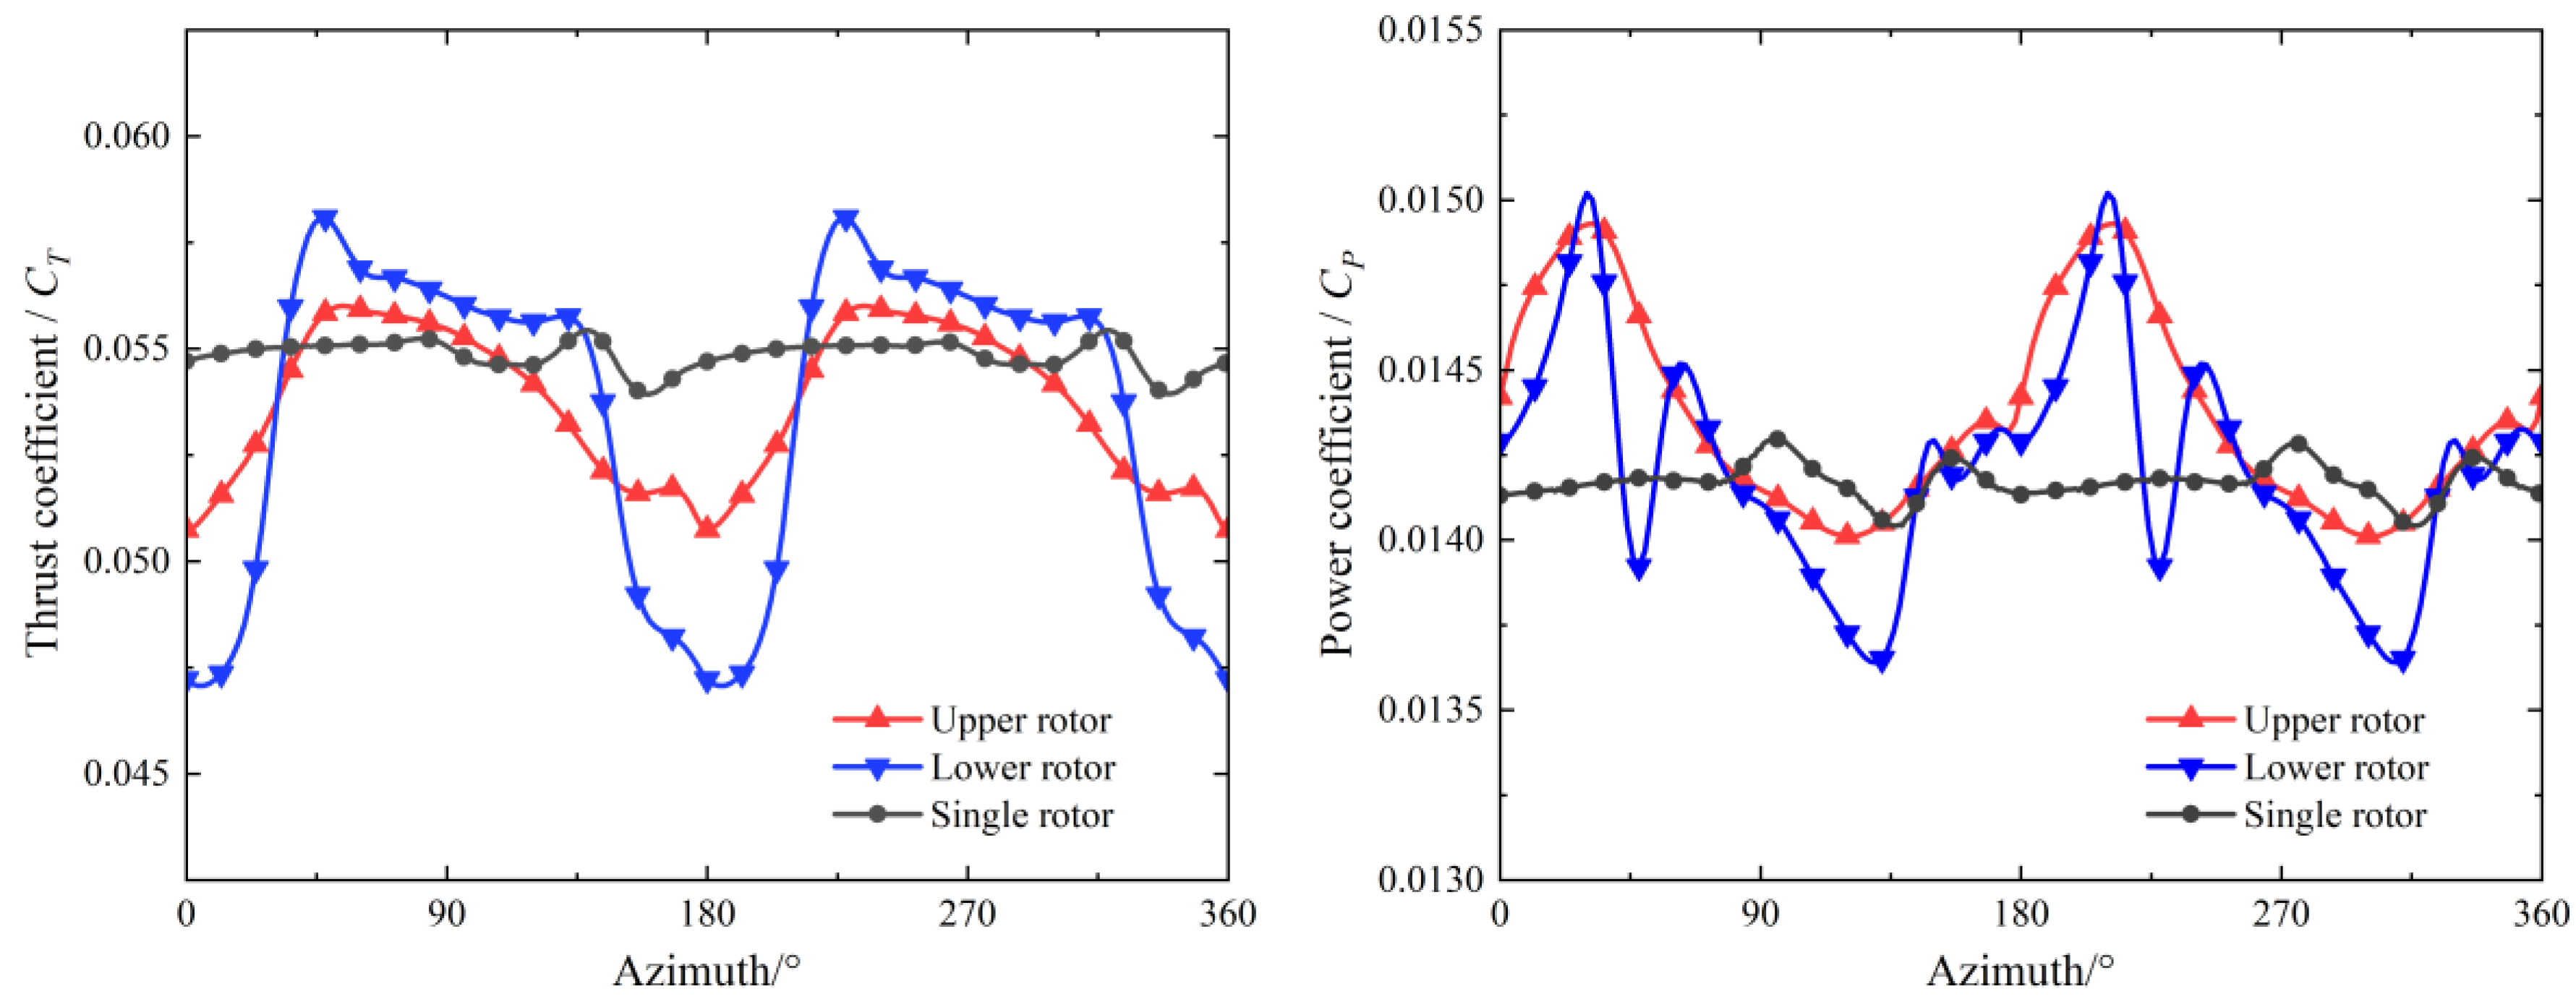
The analysis of the aerodynamic interaction mechanism is conducted with the overlapping rotors in hover states. The axis distance d/D between the two rotors is set as 0.75 and each rotor has half a blade in the overlapping area (r/R is larger than 0.5, r is the distance from the location to the rotational axis, and R is the radius of the rotor). The blade distance h/D is set as 0.156 and the rotational velocity for the two rotor blades of the overlapping rotor configuration is set as 2100 RPM.
Figure 6 shows the temporal performances of the overlapping rotor and single-rotor configurations. The single-rotor configuration corresponds to the upper rotor without the lower rotor’s interference. From
Figure 6, both the thrust coefficients (
CT) and power coefficients (
CP) for both the upper and lower rotors of the overlapping rotor configuration exhibit periodic fluctuations as the azimuth angle increases. In contrast, the
CT and
Cp of the single-rotor configuration nearly maintain a flat trend, with an azimuth angle range of 0–360°.
Both
CT and
CP show periodic unsteady fluctuations, while the single rotor nearly stays stable. As seen in
Figure 6, the
CT values of the upper and lower rotors rapidly decrease when the blade approaches and increase again. The fluctuation in the
CT of the lower rotor is much larger than that of the upper rotor. Moreover, another small fluctuation appears on the trough of the curve where the blades meet. This aerodynamic interference is because the slipstream and attached vortex of the blade influence the positive attack angle of the other rotor. The mechanism analysis of the overlapping rotor configuration primarily considers suction, slipstream, and induced effects, which can be explained as follows.
As
Figure 7 shows, the meeting of the two rotors’ blades can be approximated by two airfoils moving in opposite directions. When the two rotor blades meet in the overlapping area, the suction and slipstream effects induce additional axial velocities in the upper and lower blades, decreasing their thrust by decreasing their actual attack angles. When the two rotor blades approach each other, the induced velocity produced by the attached vortex on each blade will alter the flow field around the neighboring rotor blade. Additionally, the relative position variation of the two rotor blades causes changes in the strengths of the induced effects. When two blades meet but do not coincide, the attached vortex on a blade induces upside flow and leads to an increase in thrust on the other blade. As the blade elements of the two counterrotating rotors transition from a state of crossing to moving apart, the induced flow reverses direction, thereby altering the aerodynamic interference effects and ultimately resulting in significant unsteady variations in the thrust and torque distributions across the upper and lower rotor blade elements.
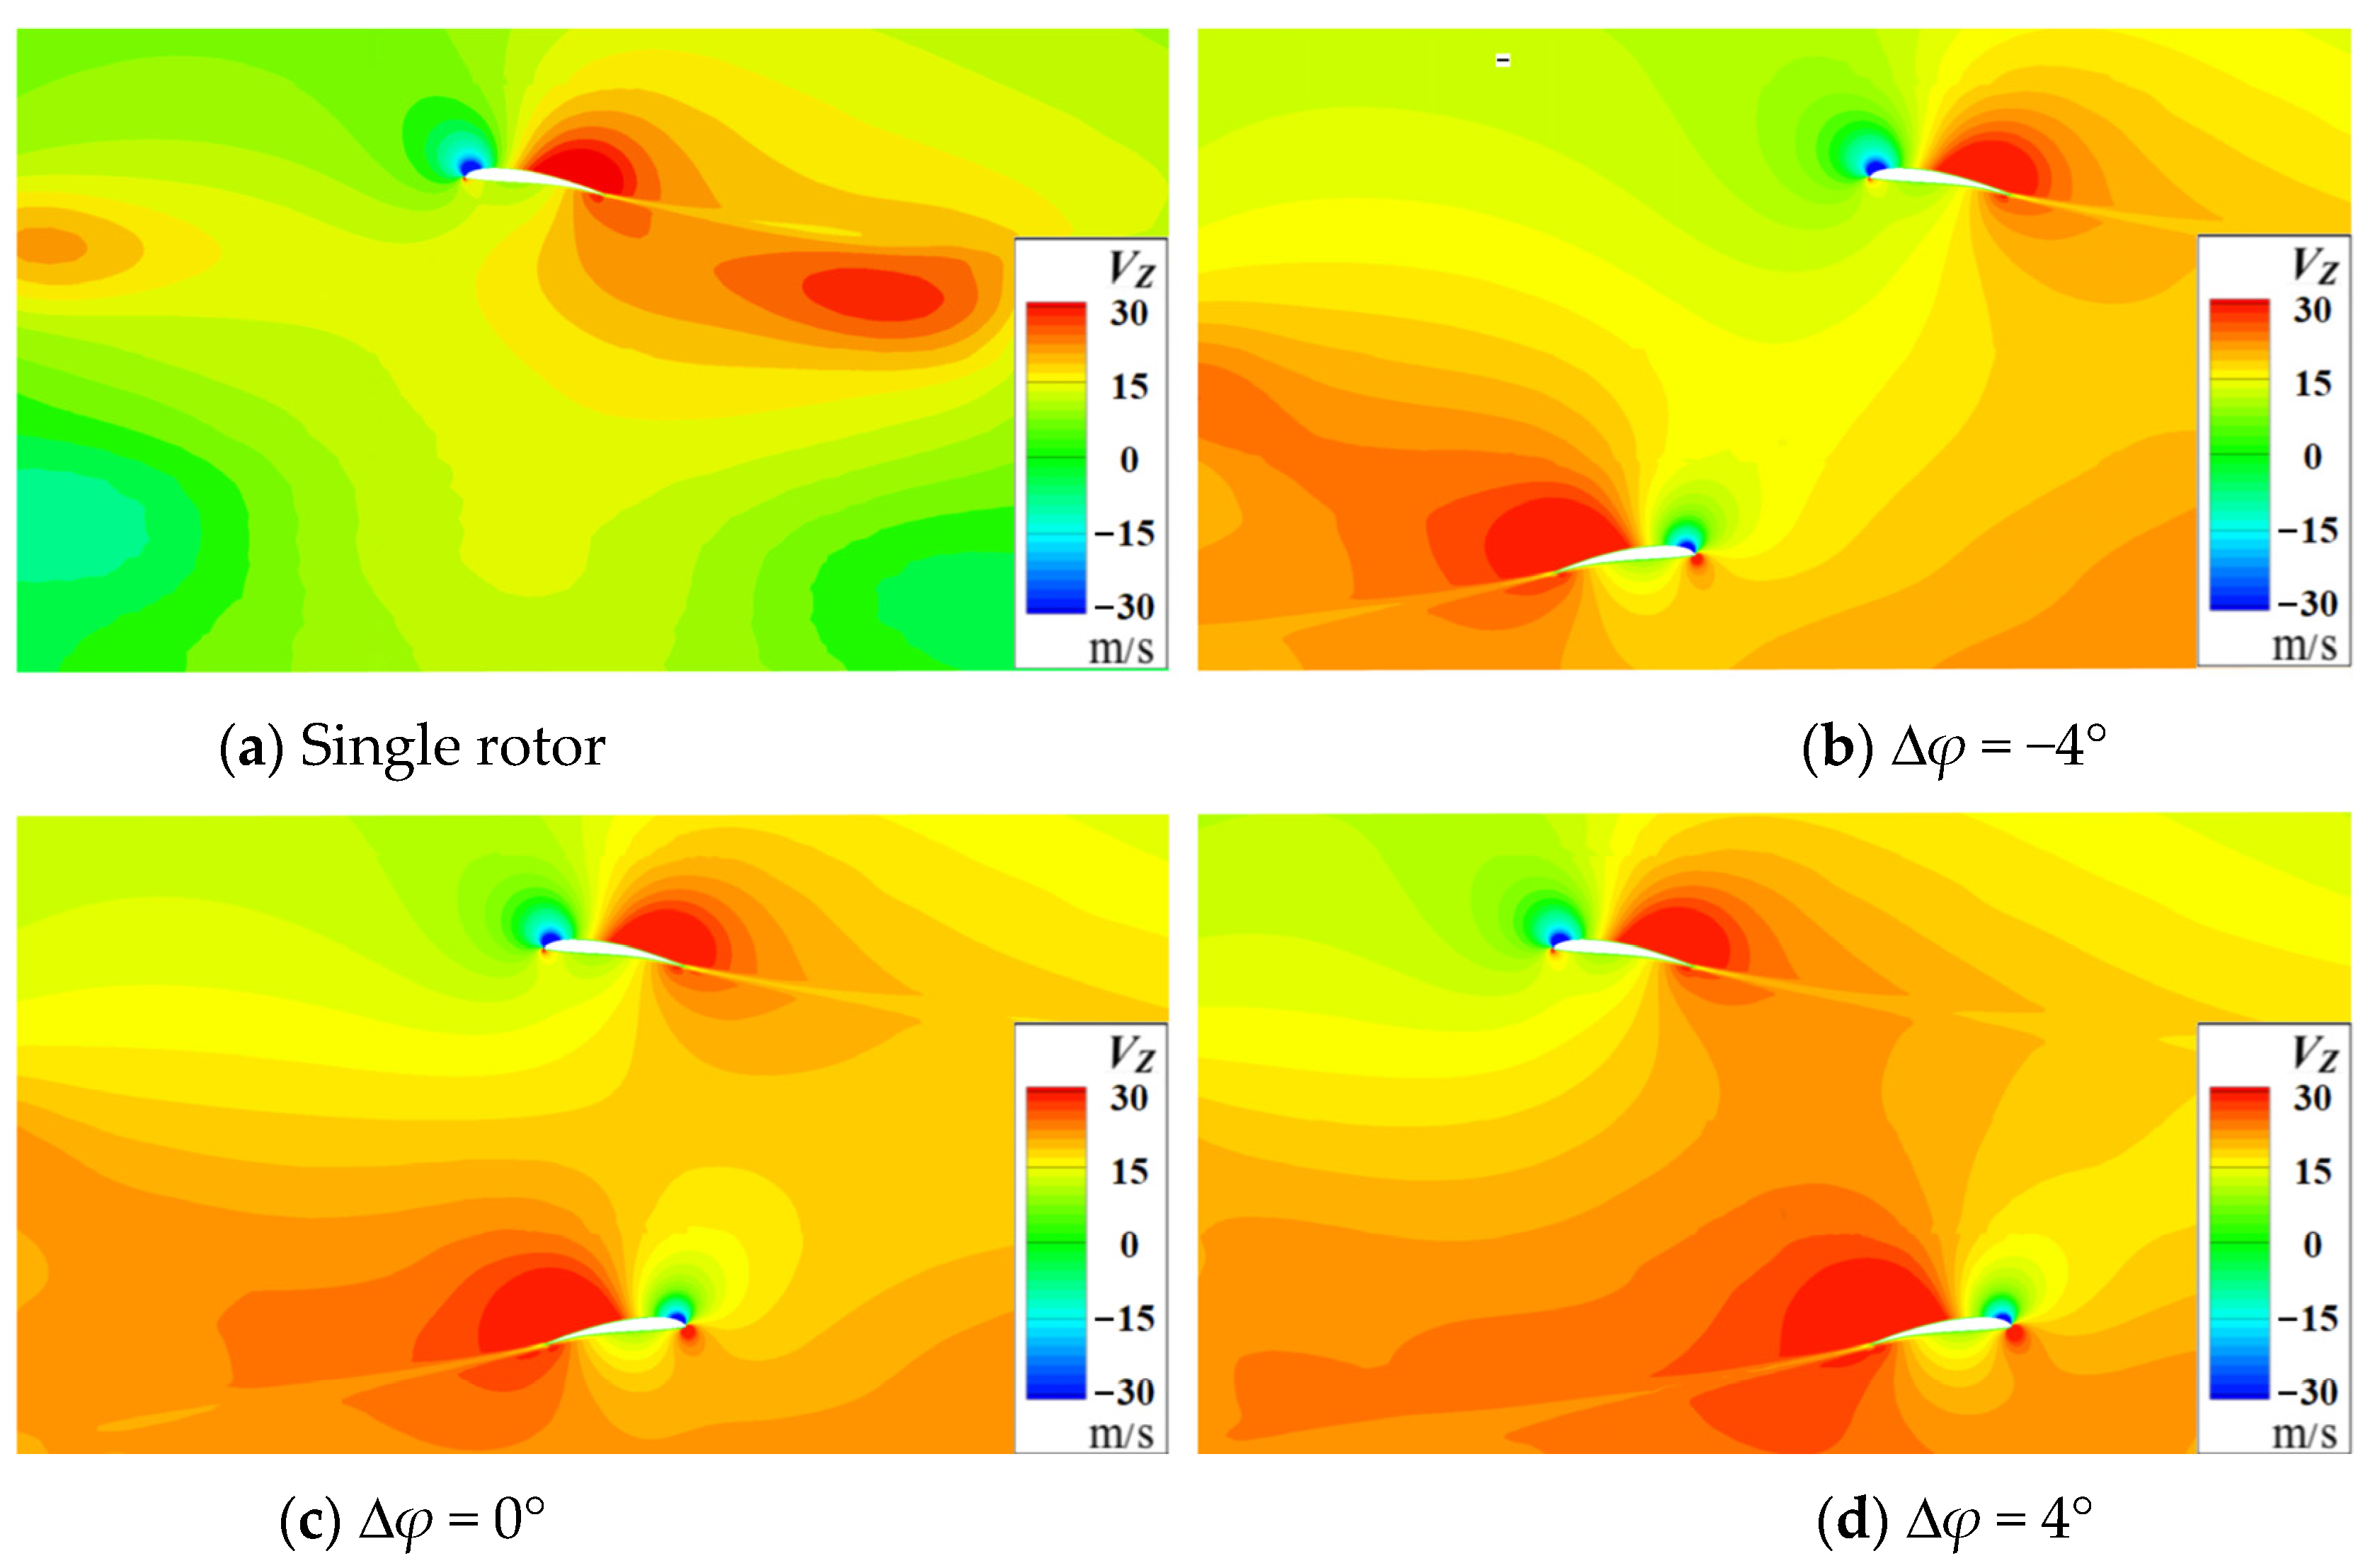
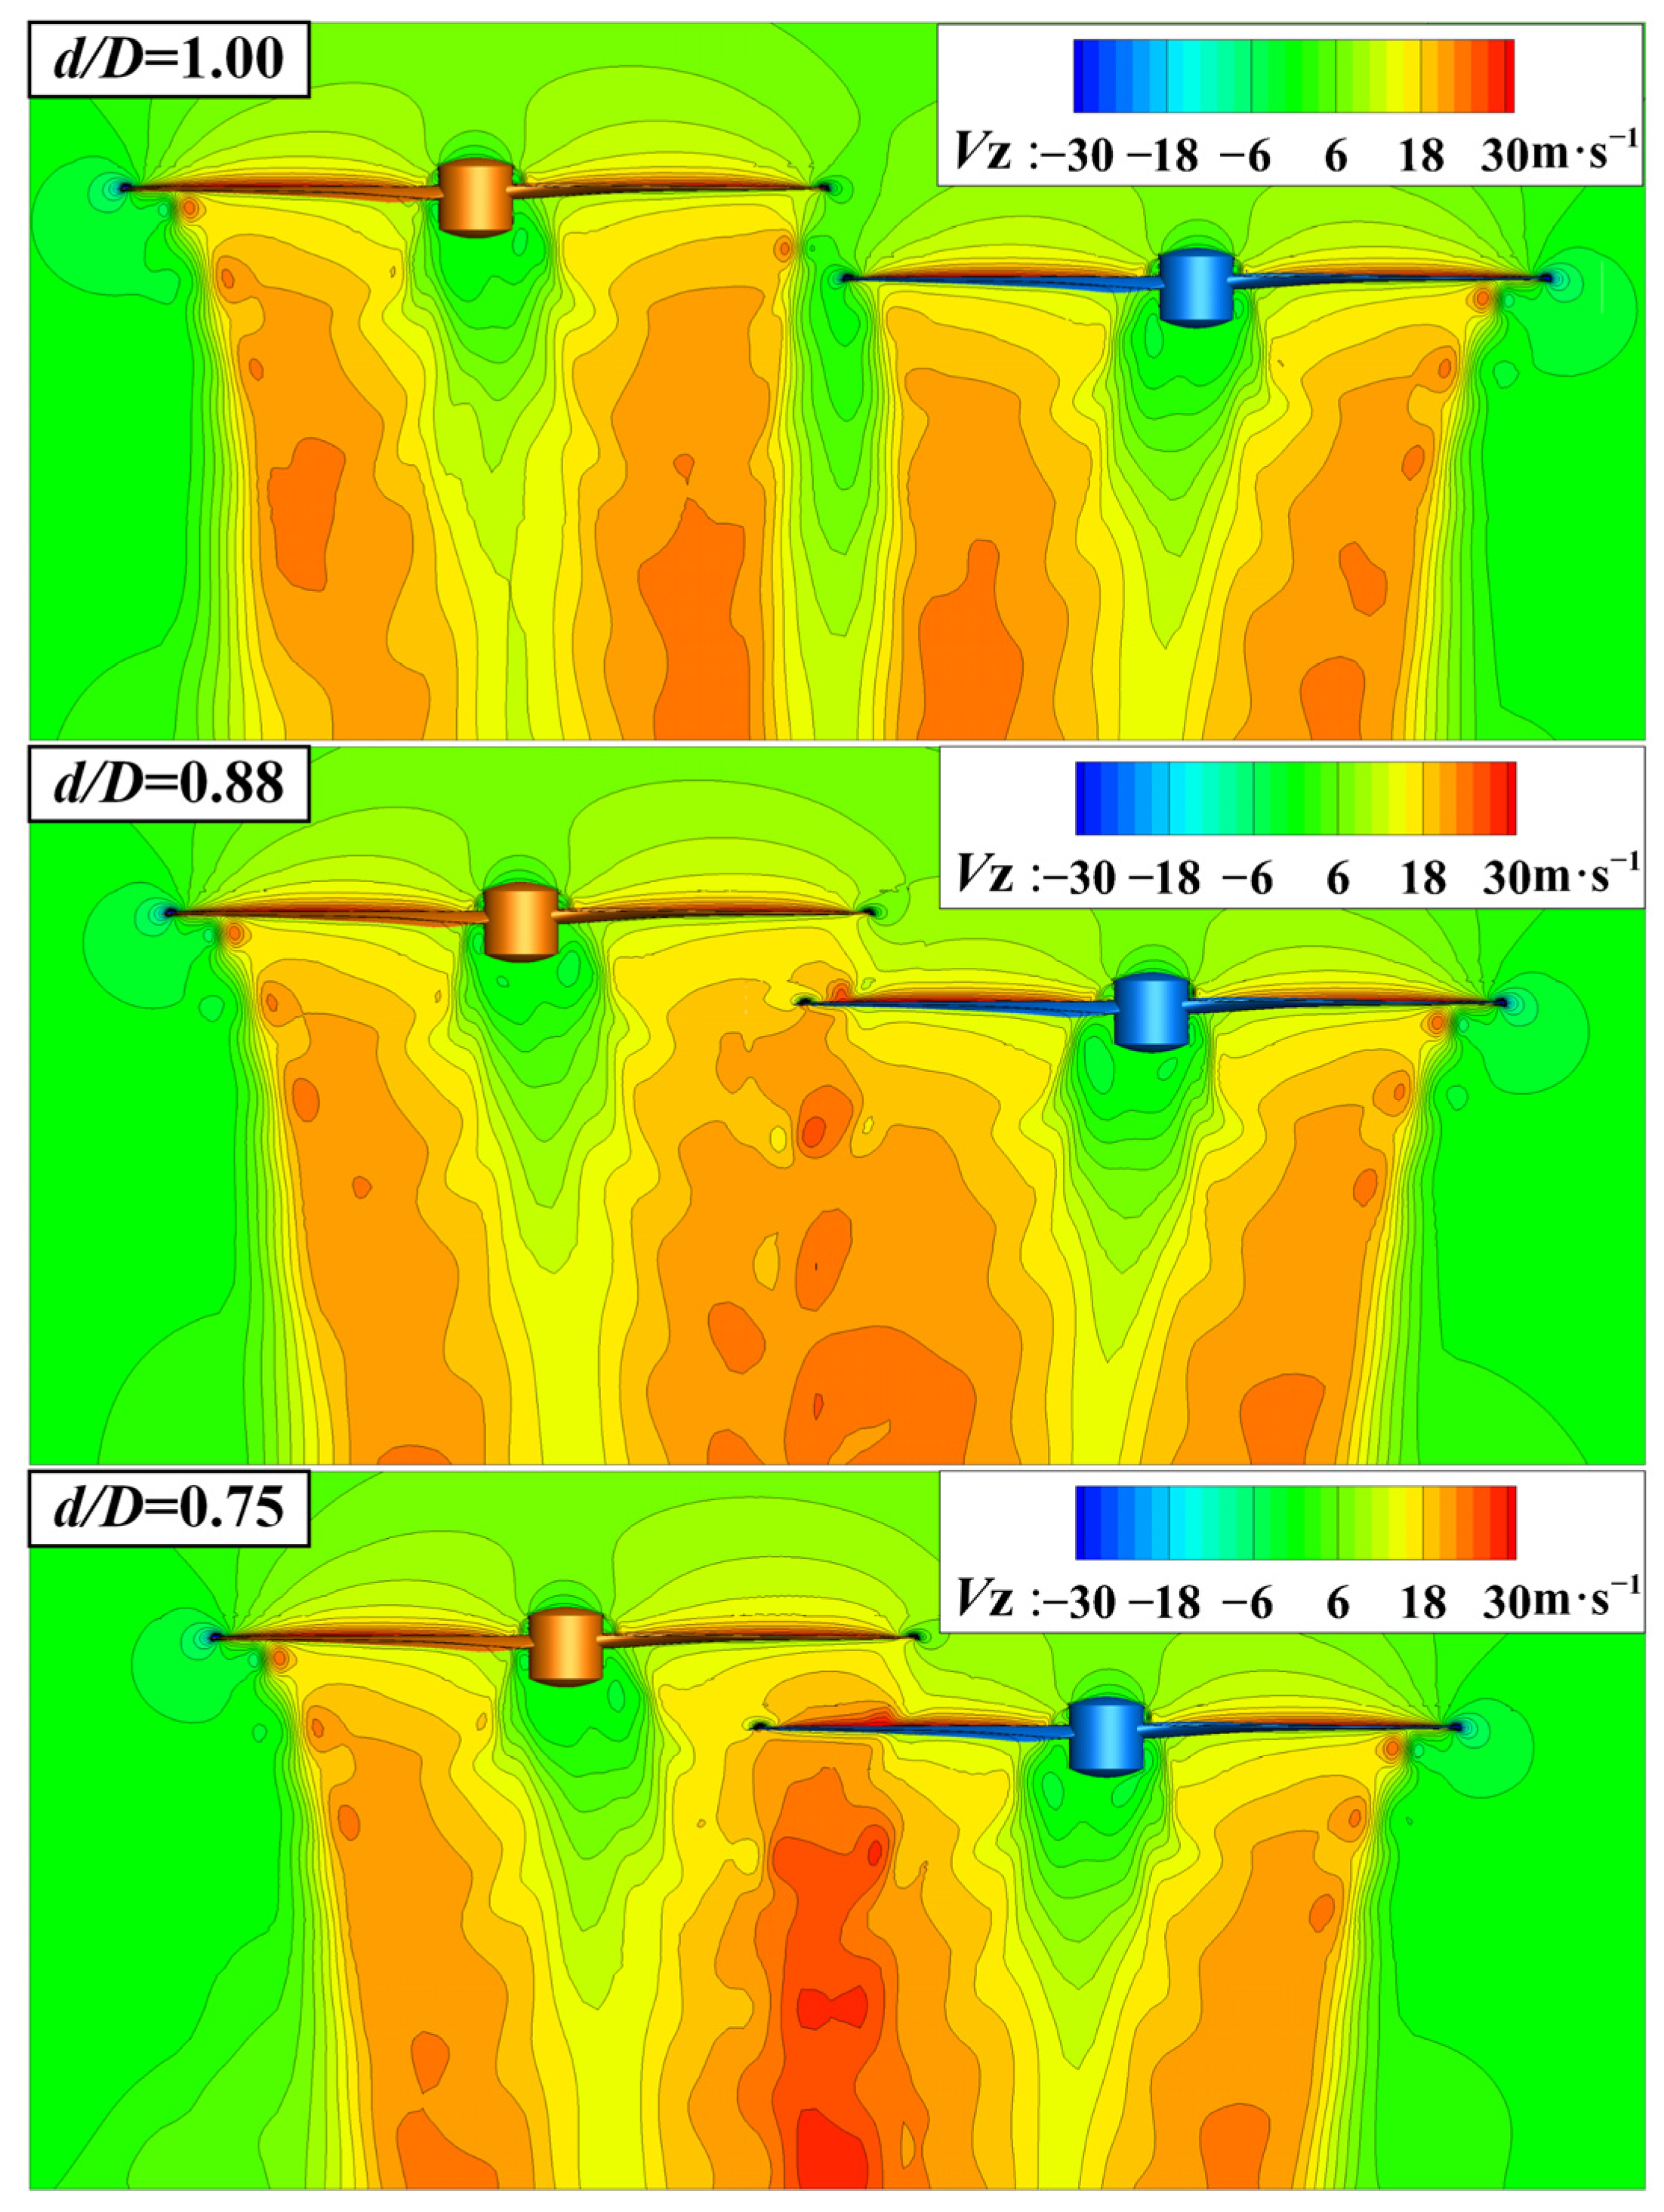
Figure 8 gives the
Vz contours of 0.75
R sections for the overlapping rotors and the single rotor. For the single rotor, the section is located at 0.75
R of a blade, and for the overlapping system, this is the blade within the overlapping area. As shown in
Figure 8a, an upwash flow is induced ahead of the leading edge of the single rotor and a strong downwash flow is induced behind the trailing edge. As shown in
Figure 8b–d, when the two blades approach each other, the upwash of the upper and the lower blades meet together. Each blade is under the upwash of another blade, so the thrust of each rotor will increase. When the blades move away, each blade lies in the downwash of another blade, so the interaction between two blades changes to be the opposite. Moreover, the induced upwash flow around two blades only appears in a small region. This means the interaction between two rotors caused by induced effects is weak. However, the downwash flow is also influenced by the slipstream effect, resulting in a stronger
Vz between the two blades. As the lower rotor is under the wake of the upper rotor, the downwash interaction on the lower rotor is stronger than that of the upper rotor.
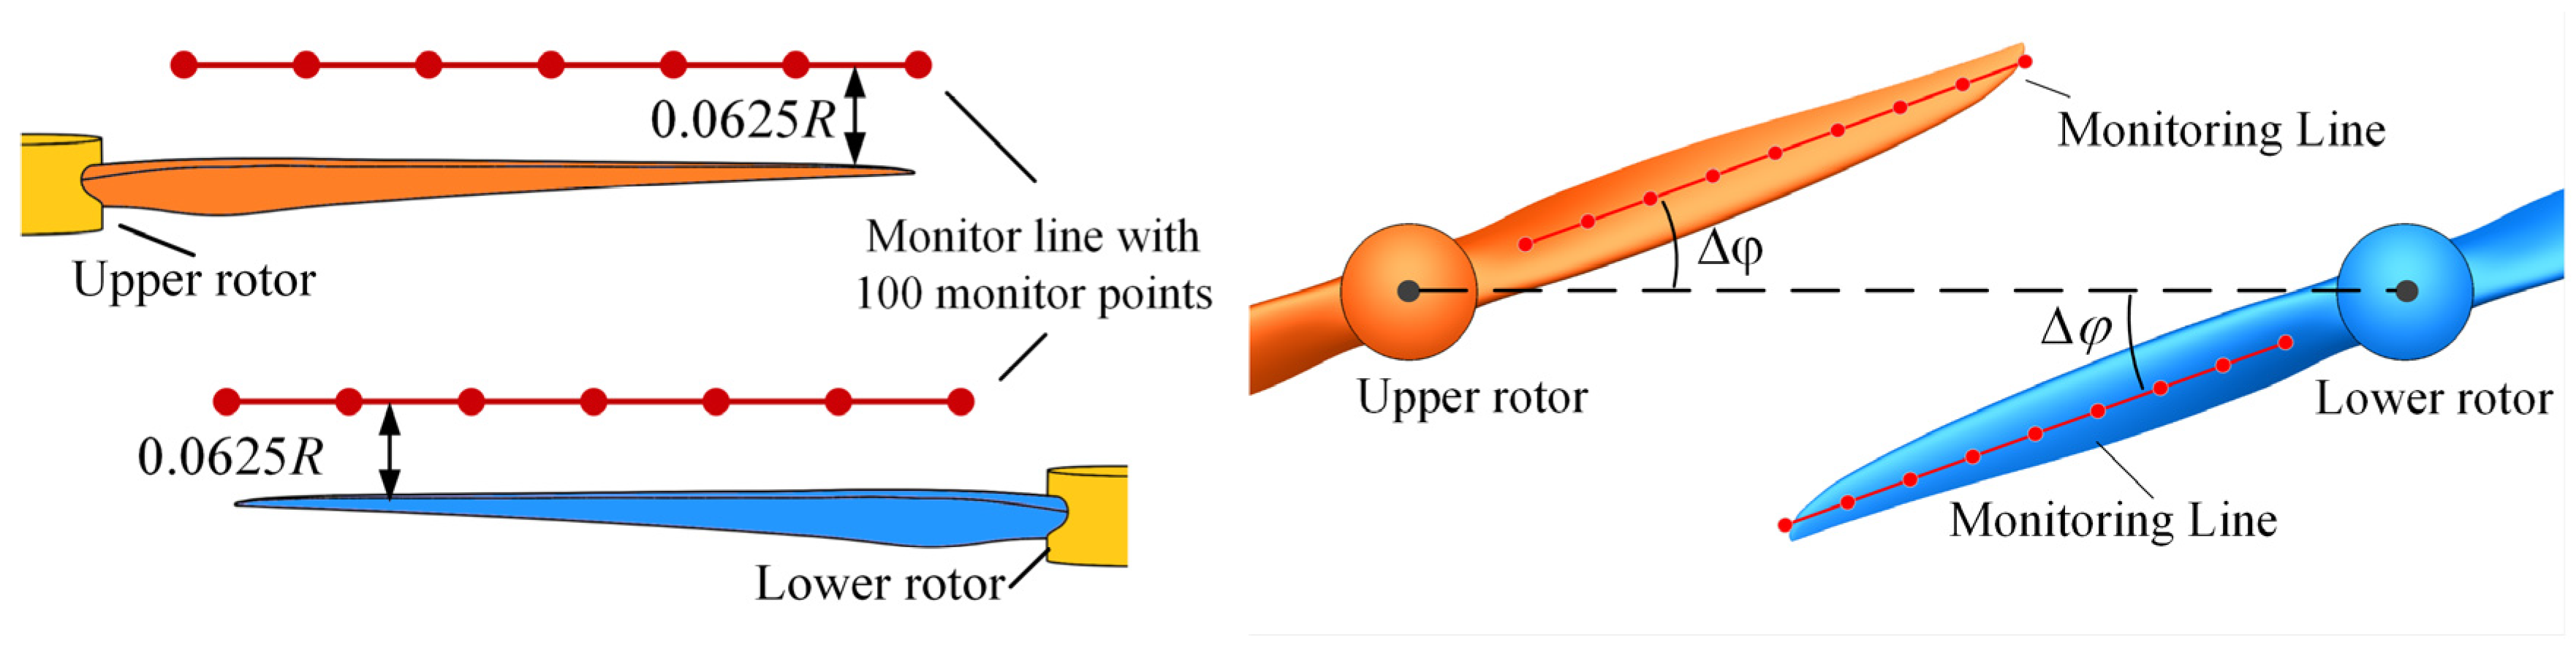
As
Figure 9 shows, each monitor line is arranged above the upper and lower rotor blades with a distance of 0.0625
R, and 100 monitor points are evenly distributed on each line. The gap angle between the monitor line and the line where the two blades of each rotor will meet is defined as the D
φ. When the two blades do not meet, the value of angle D
φ is negative. When the two blades move away from each other, the angle D
φ changes to be positive.
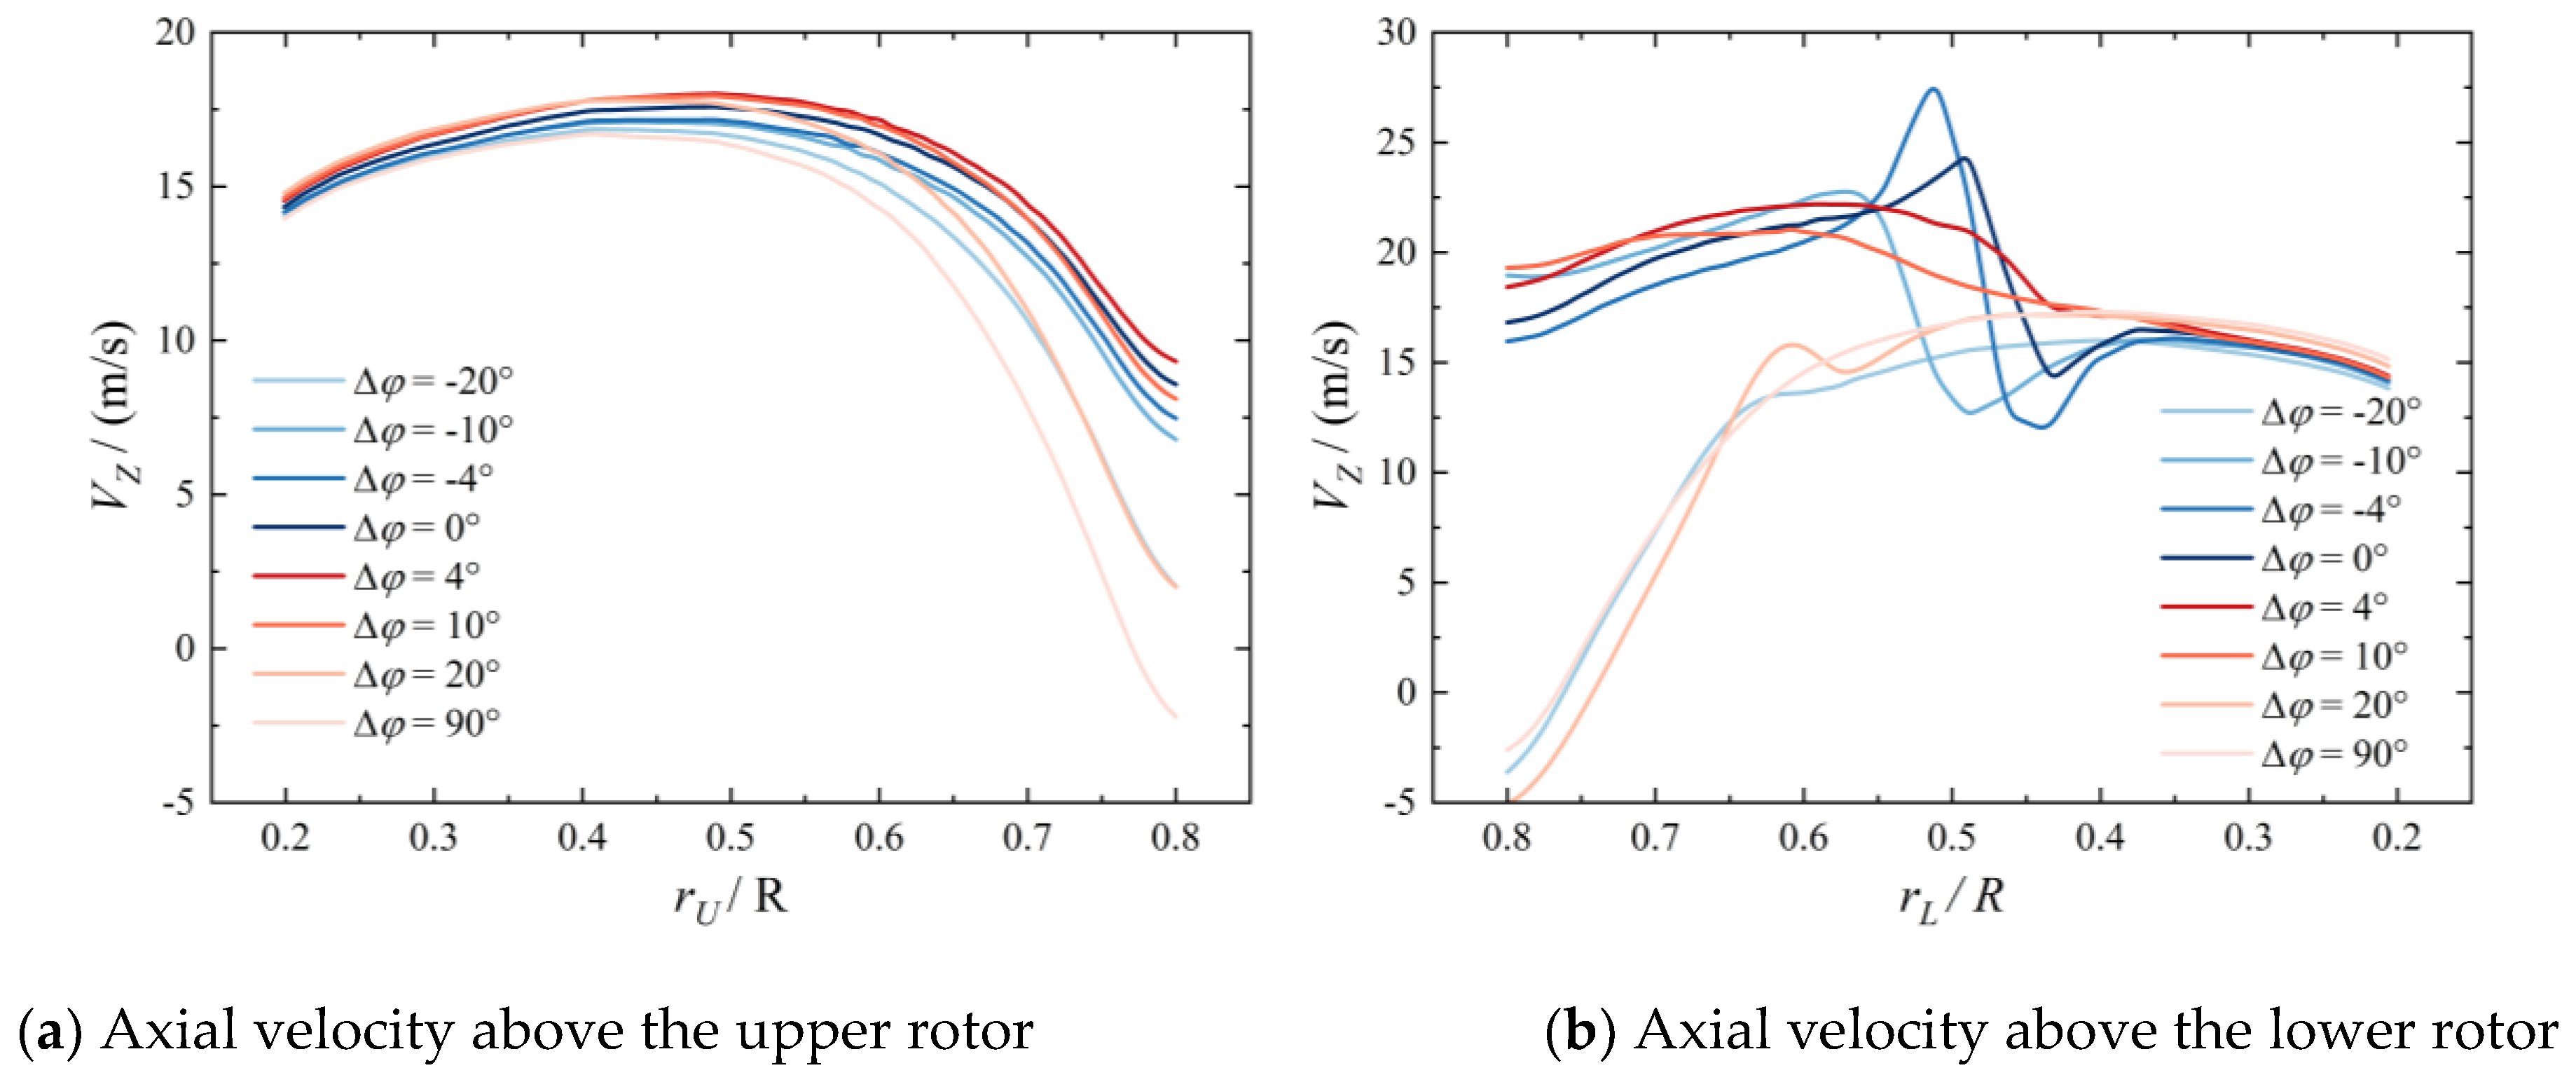
Figure 10 shows the distribution of axial velocity
Vz on the monitor line during the meeting and separation of the two rotors with different Δ
φ angles. When the Δ
φ is ±20 deg and 90 deg, the blades of the two rotors move far from each other and the interaction on the flow field between the two rotors is slight, so the distributions of axial velocity
Vz near the upper rotor and lower rotor are similar. In
Figure 10a, when the Δ
φ increases, the
Vz changes mildly in the range outside of the overlapping area between the two rotors, where the
r/R is less than 0.5. In the overlapping area, the
Vz of the upper rotor quickly increases until the two rotor grow close. With the blades of the two rotors meeting and passing by, the
Vz above the upper rotor increases at first and then decreases, so the suction effect and induced effect are verified. In
Figure 10b, when the two rotors meet each other, the induced effect on the curve of
Vz distribution is also observed at the monitor line above the lower rotor. The slipstream effect is also verified because of the significant increase in
Vz in the overlapping area. However, when the Δ
φ is less than -10 deg or larger than 10 deg, the
Vz in the overlapping area drops quickly. This indicates that the slipstream is strong, but can only influence a limited range of the flow field. Additionally, an S-shape fluctuation appears on the curve of
Vz in
Figure 10b near the location r/R = 0.5. This is the influence of the upper rotor’s blade vortex.
3.2. Effect of the Axis Distance
To analyze the effect of the axis distance between two rotors on the overlapping rotor system, the blade distance h/D is set as 0.156 and the rotational velocity for the two rotors remains as 2100 RPM in this section.
Figure 11 shows the axial velocity contour distributions for overlapping rotor configurations with different axial installation distances. When the two rotors start to overlap, there is no significant interaction among the slipstream regions of the upper and lower rotors. As the blade of the lower rotor comes into the wake of the upper rotor, the upper rotor is also within the suction flow of the lower rotor. A channel with high-speed flow is formed in the overlapping area. The velocity of the flow on the inlet of each rotor is higher, resulting in a decrease in the effective attack angle and thrust. As the axis distance decreases, the accelerating channel expands and the area of the blades affected by overlapping interference also increases. In addition, the slipstream regions of the two rotors exhibit an asymmetrical distribution relative to their corresponding rotor axes and the wakes of two rotors are attracted towards each other. This is because the high-speed flow is in the accelerating channel, resulting in the pressure difference between inside and outside of the overlapping area.
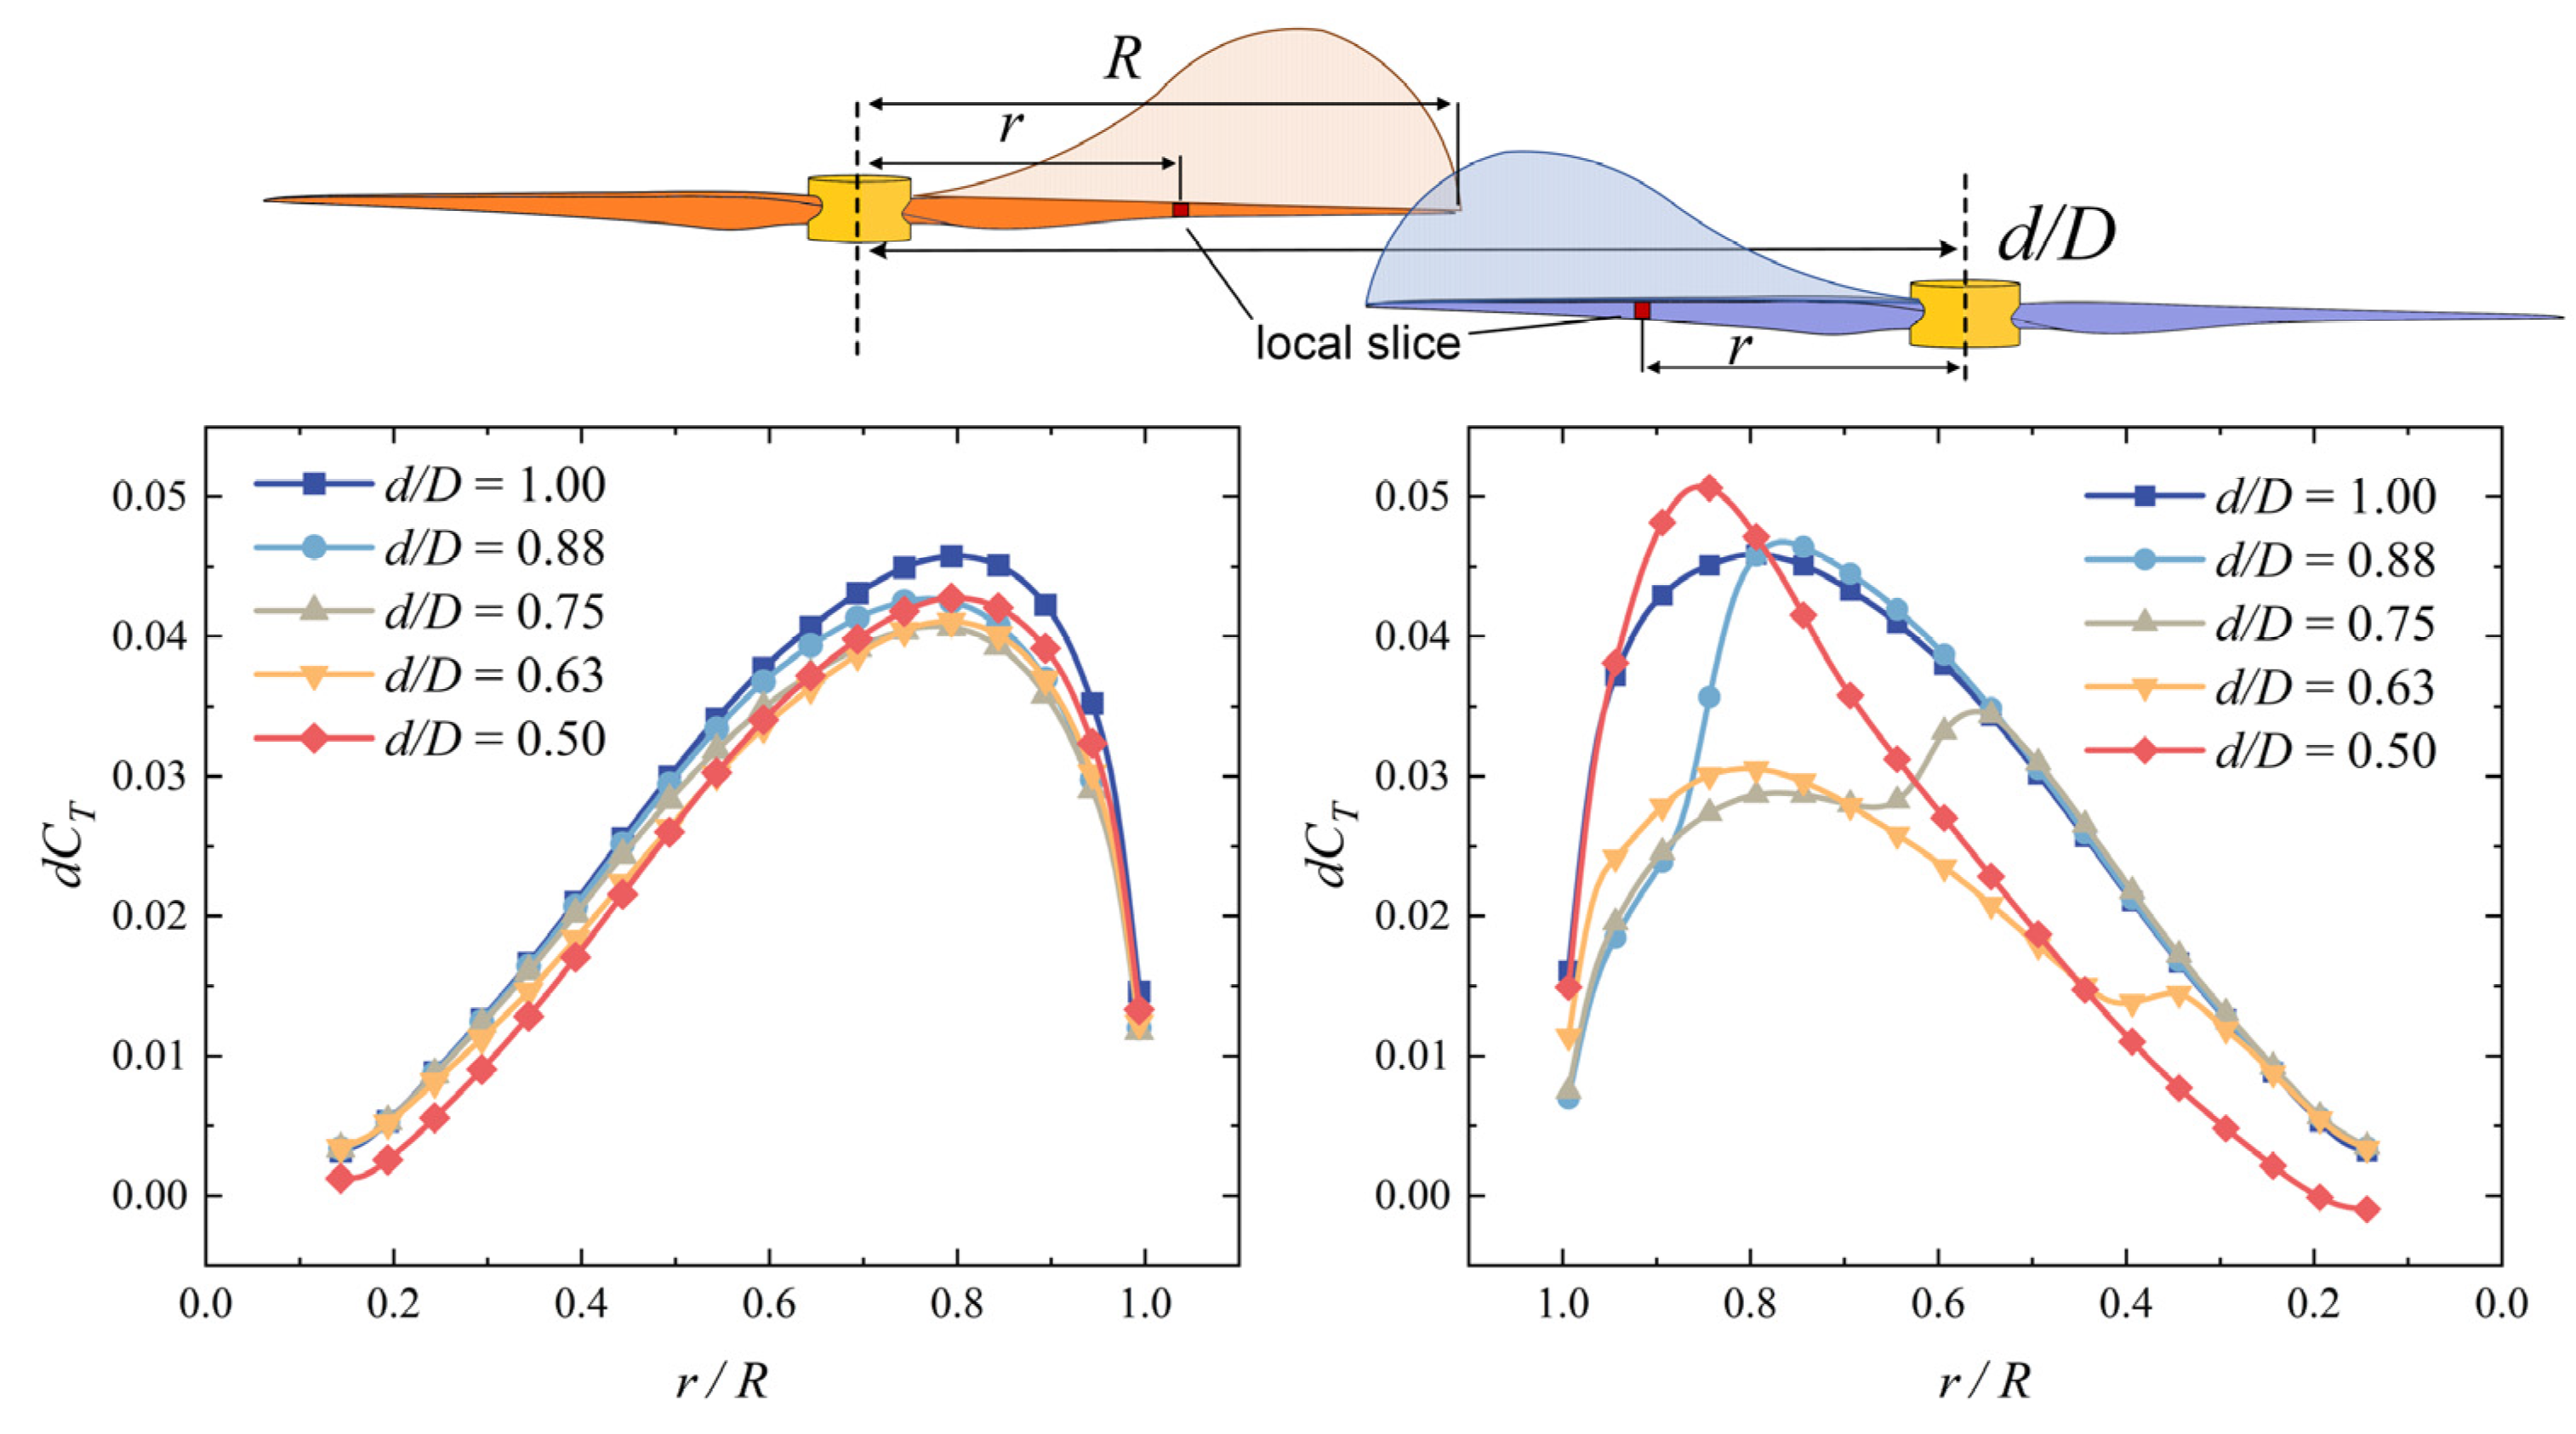
Figure 12 shows the spanwise load distributions on the blades of two rotors when they meet in the overlapping area at different axis distances. When the axis distance
d/
D is one, the two rotors have not overlapped. The curves of thrust distribution on the blades of two rotors are similar, without a strong interaction between each other. When the two rotors overlap, due to the interaction between the two rotors, the thrust distribution on the two rotors within the overlapping area decreases. Comparing the curve of thrust distribution in
Figure 12, the variation in the curves of the lower rotor is much more significant than that for the upper rotor. This indicates that the slipstream effect is more powerful than the suction and induced effects. As the axis distance decreases, more of the area on the blades of the two rotors is affected by the interaction between the two rotors, resulting in a partial decrease in thrust distribution. As the axis distance
d/
D decreases to 0.5, the blade tip of the lower rotor is closed to the hub of the upper rotor, where the slipstream from the upper rotor is slow. With the weakening of the slipstream effect, the thrust on the tip of the lower rotor returns to a high level.
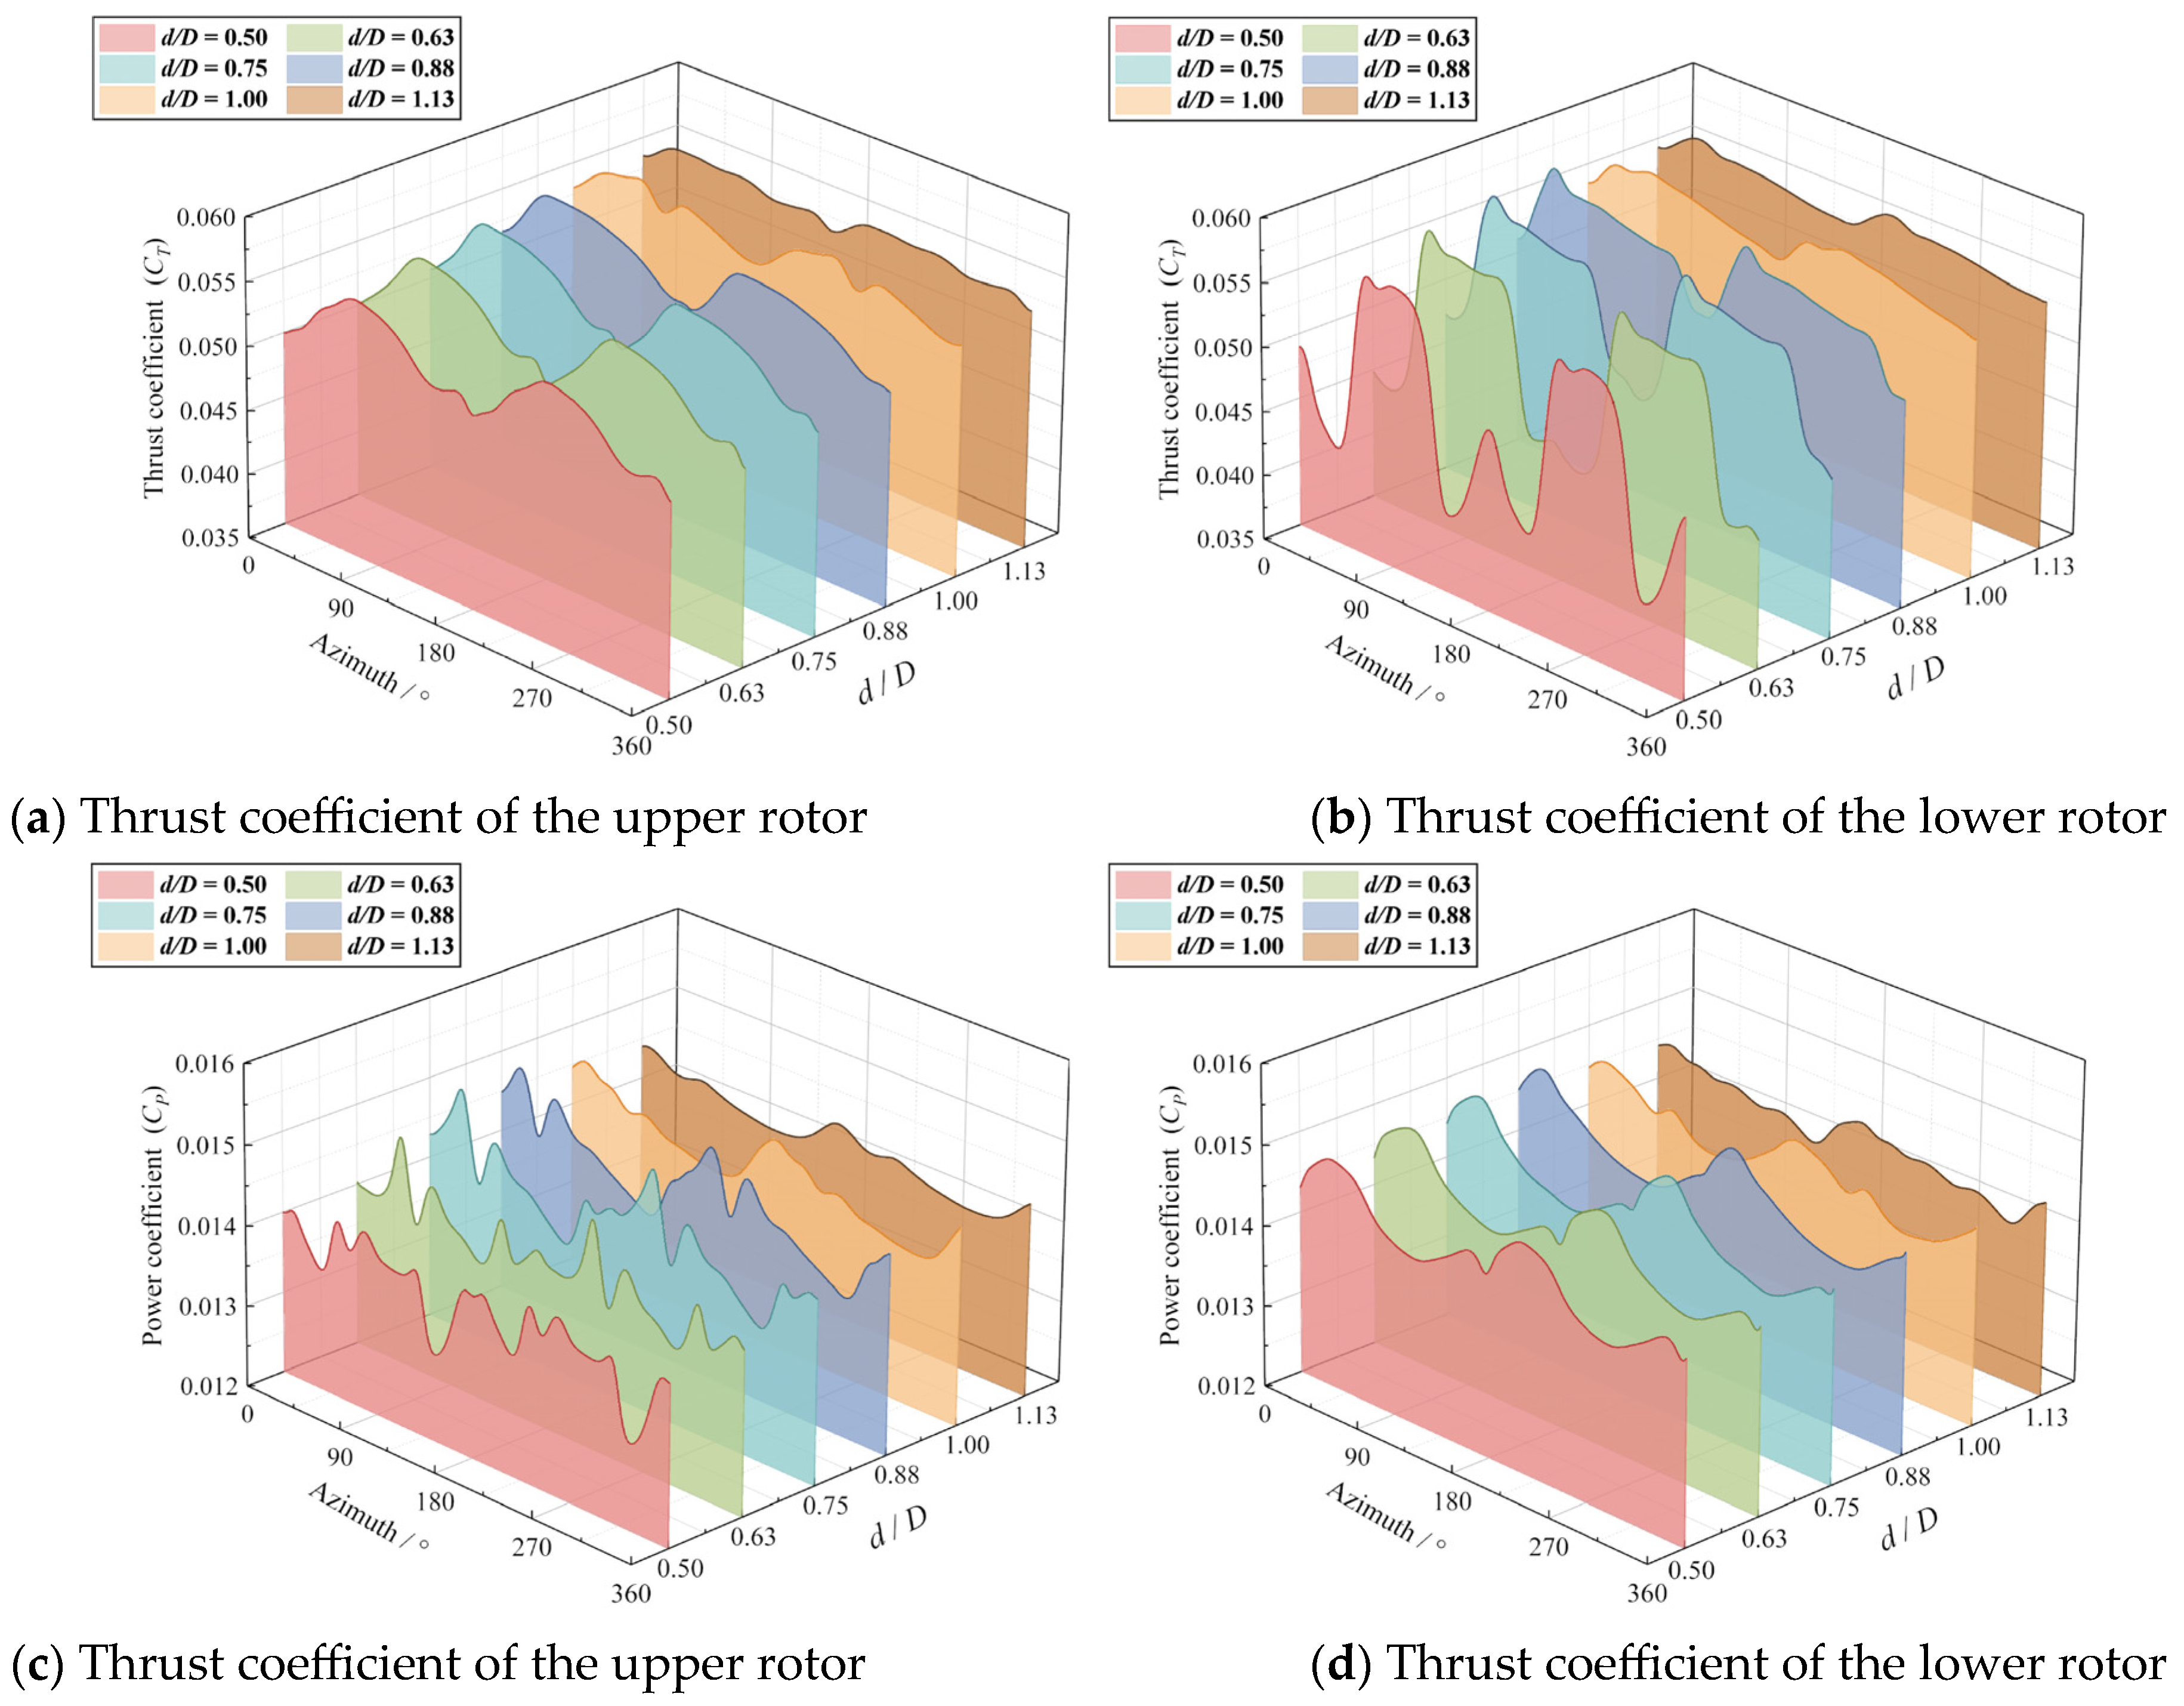
Figure 13 shows the variation characteristic curves of the thrust and power coefficients of the upper and lower rotor blades with azimuth angles at different axis distances. When the upper and lower rotor blades are not overlapping (i.e.,
d/D = 1.00 or 1.13), the lift and power coefficients of the two rotor blades fluctuate slightly within the azimuth angle range of 0–360°. In contrast, when the upper and lower rotor blades are partially overlapping (i.e.,
d/D < 1.00), the thrust coefficients of the two rotor blades experience unsteady periodic variations, due to the suction, slipstream, and induced effects. In addition, as the axis distance (
d/D) decreases, the increased overlapping area between the two rotor blades results in apparent increases in both the range and magnitude of the two rotors’ thrust characteristic curves. As the distance between the axis of the two rotors decreases, the overlapping area increases quickly, which leads to increases in the range and magnitude of the unsteady fluctuations on the curve.
As shown in the
Figure 13a,b, a small fluctuation appears on the thrust coefficient curves of the two rotors around the azimuth angle of 180° during a revolution because of the interaction between them. Because of the stronger slipstream effect, the fluctuation peak on the curve of the lower rotor is larger than that of the upper rotor. In
Figure 13c,d, a fluctuation also appears on the power coefficient curves of the upper rotor and the fluctuation peak increases with a decreasing axis distance. The power coefficient of the lower rotor is very unsteady, and its curve changes from a single peak to multiple peaks as the axis distance decreases due to the influence of wake.
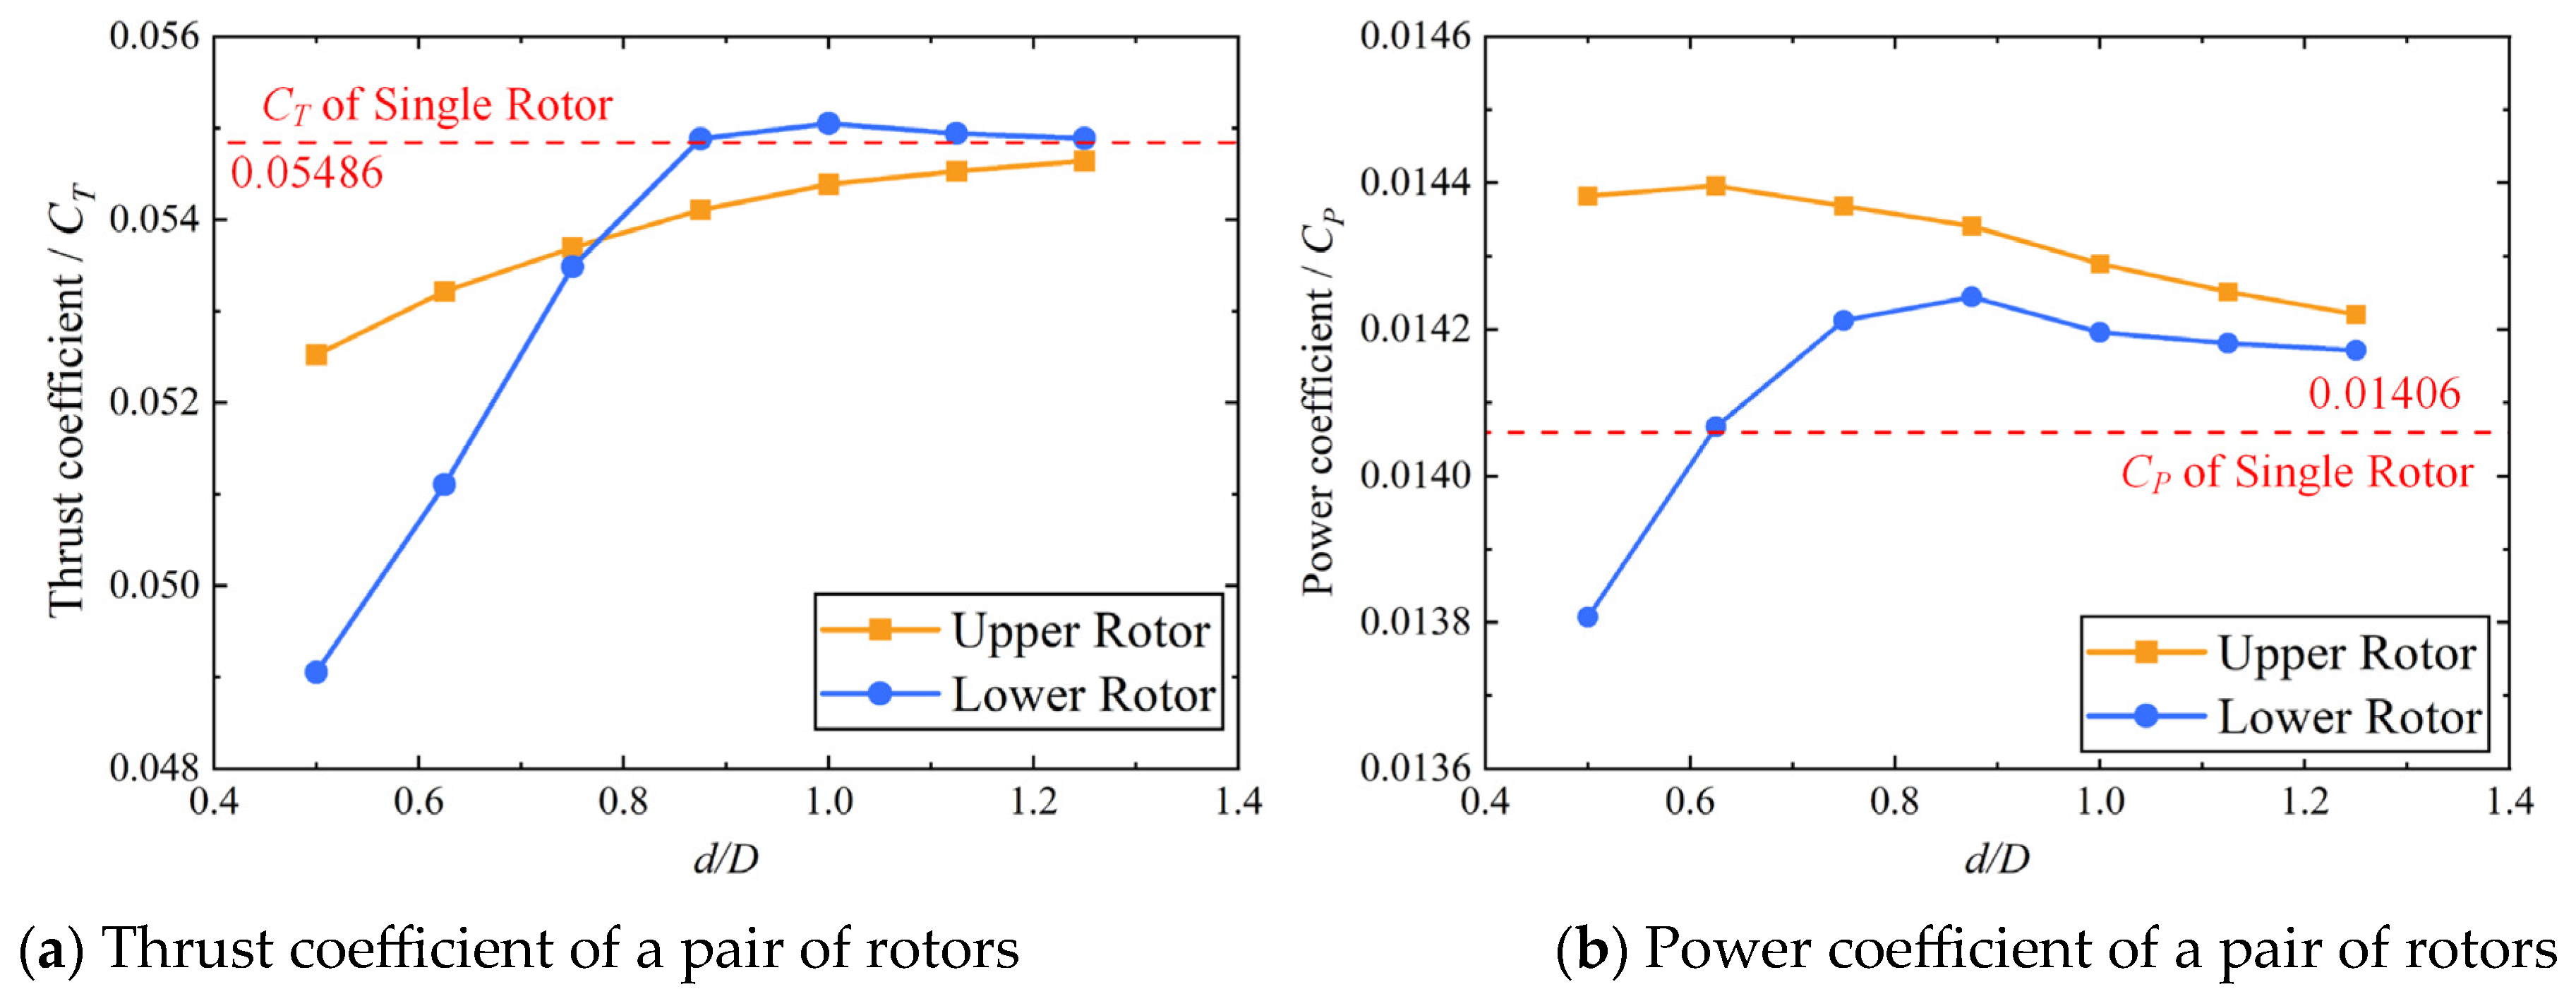
Figure 14 displays the average thrust and power coefficients in one revolution at different axis distances (
d/D). When the two rotors are far from each other, the average thrust and power coefficients of each rotor blade are approximately the thrust and power coefficient of a single rotor. As the axis distance (
d/D) decreases, the thrust coefficient of the upper rotor decreases and the power coefficient of the upper rotor increases uniformly. The thrust and power coefficients of the lower rotor increase slightly at first and then decrease rapidly when the lower rotor blade meets the upper rotor slipstream. In addition, the variation ranges of the thrust coefficient and power coefficient of the upper rotor are much lower than those of the lower rotor, which reconfirms that the intensity of the suction effect and induction effect is weaker than that of the slipstream effect. In general, when the overlapping area of the two rotors is small, the power coefficients of the two rotors are slightly increased, with the whole overlapping rotor system still maintaining a high thrust coefficient.
3.3. Effect of the Blade Distance
In this section, the axis distance
d/D is set as 0.75 and the rotational velocity for the two rotors remains as 2100 RPM. To analyze the effect of the axis distance between two rotors to on overlapping rotor system, two monitor lines with 100 monitor points are arranged above the upper and lower rotor blades, as shown in
Figure 9.
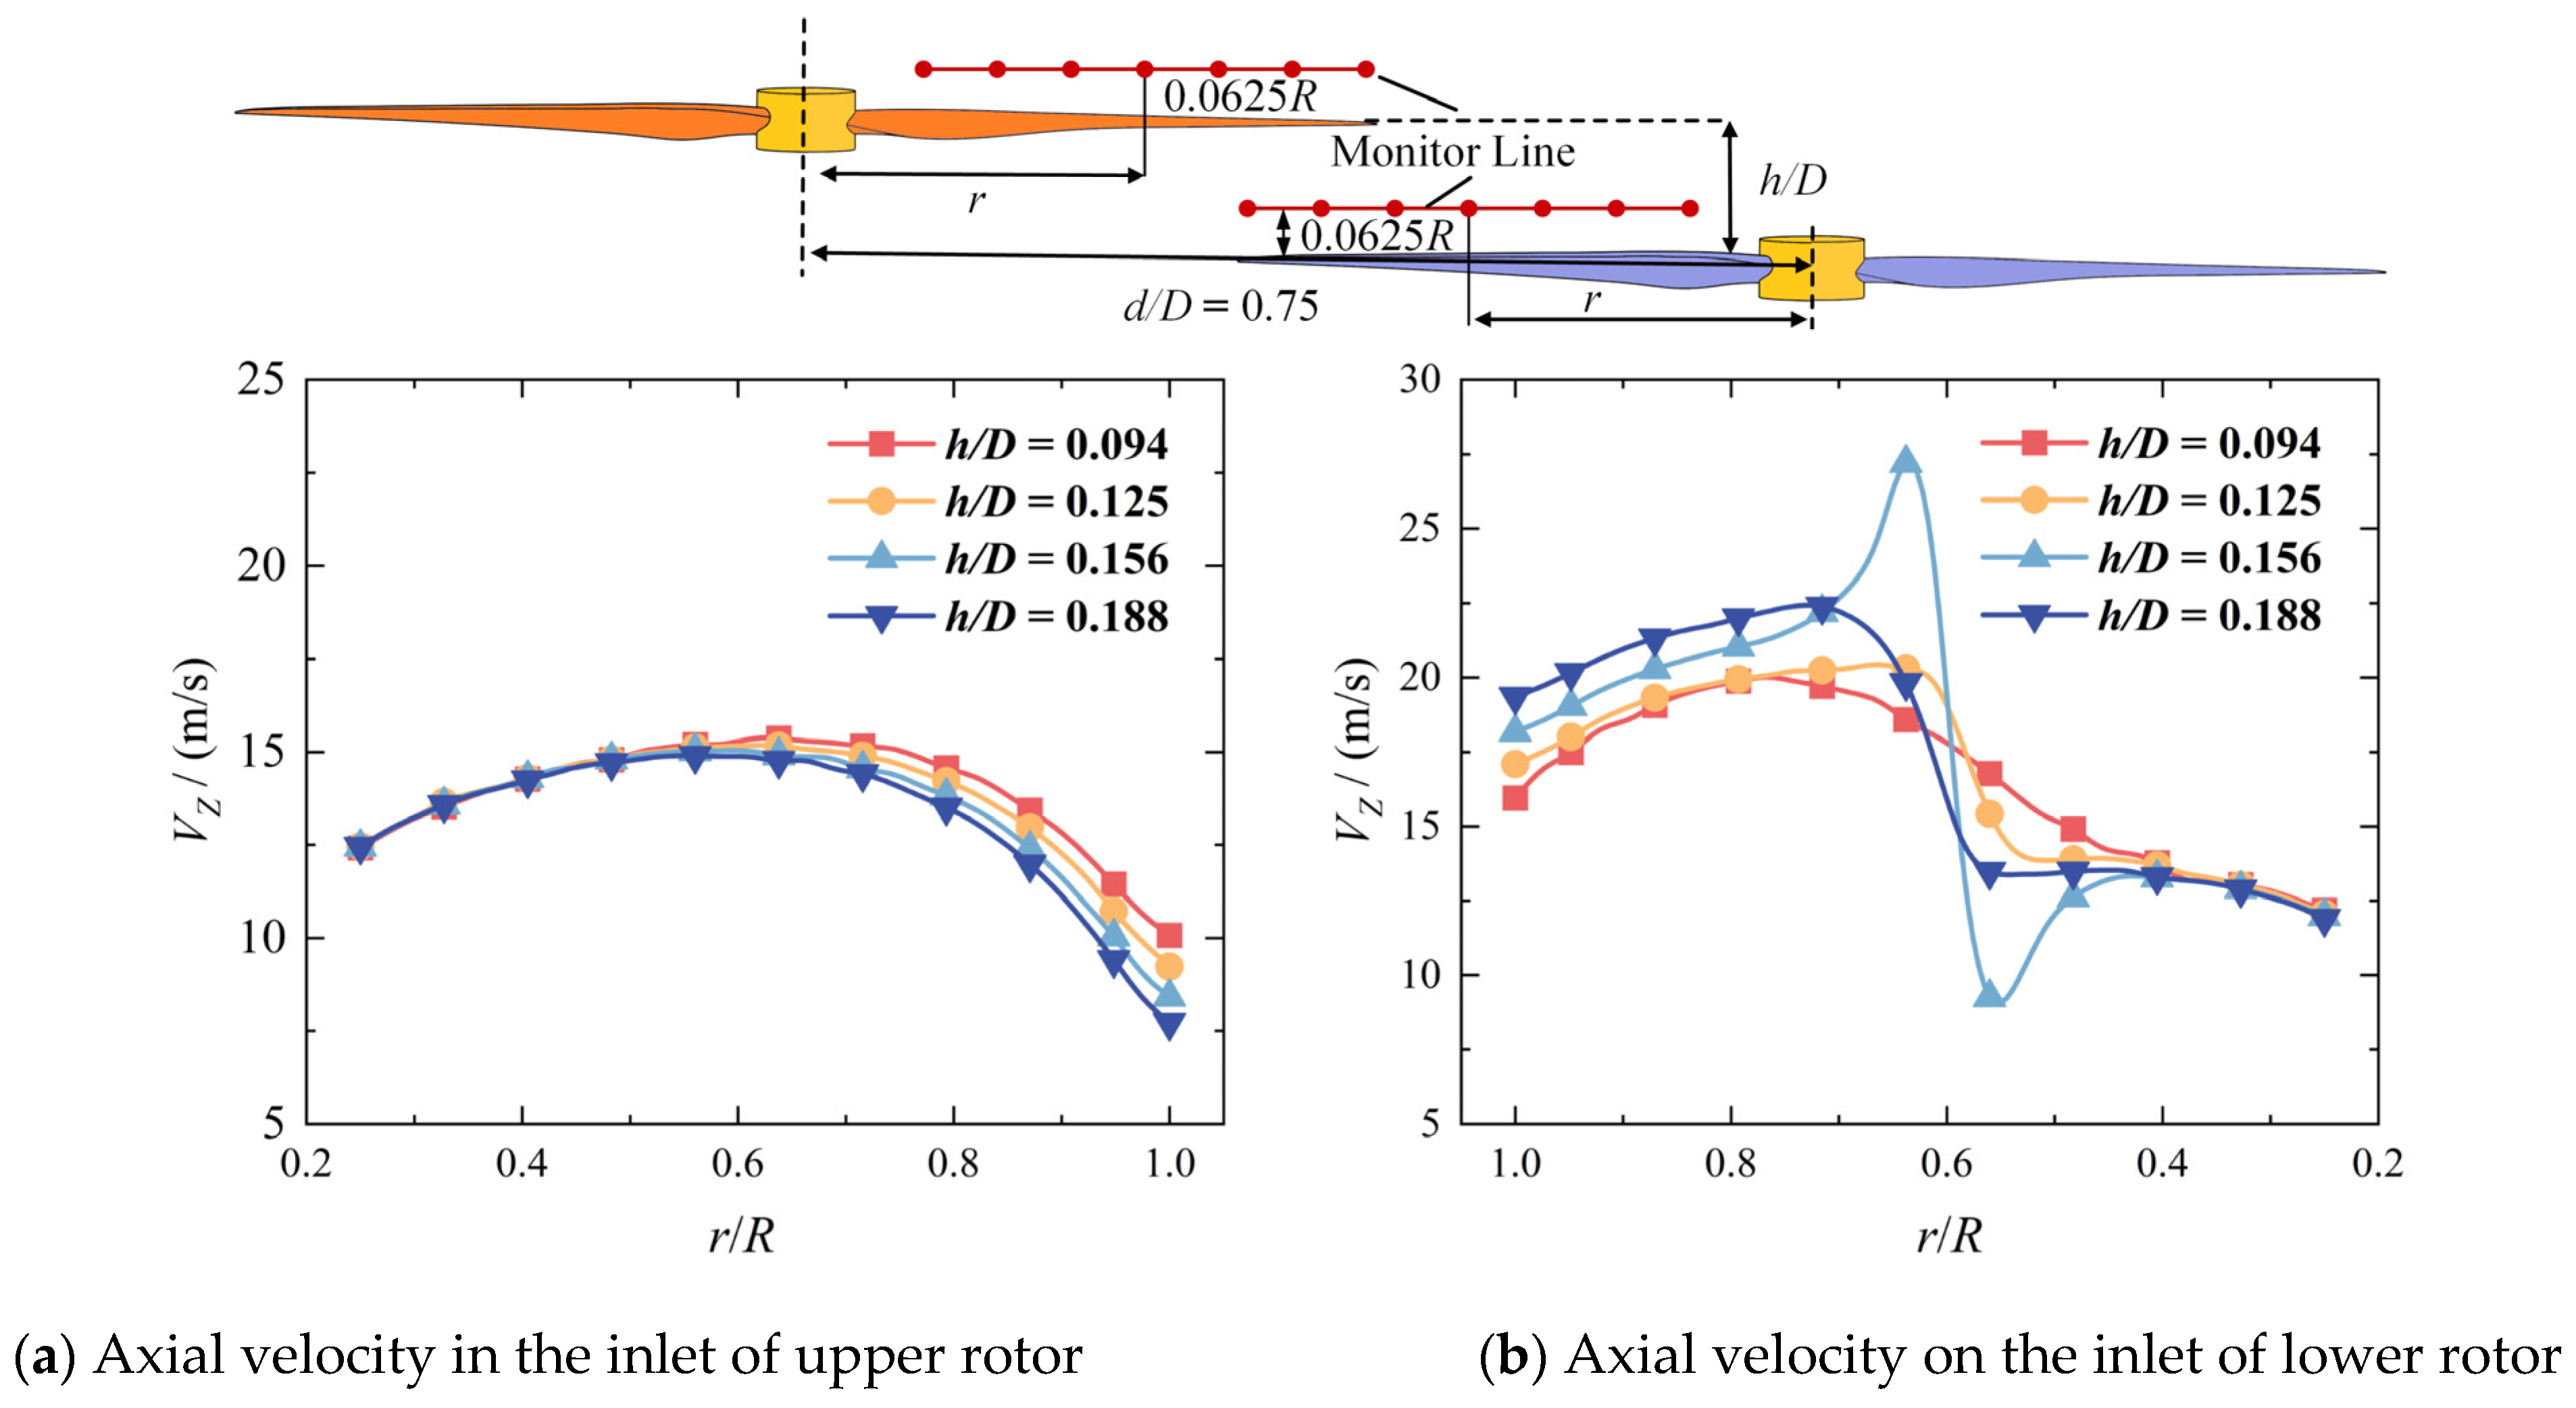
Figure 15 shows the distribution of axial velocity
VZ on the monitor line when two rotors meet. In
Figure 15a, as the blade distance
h/D increases, within the overlapping area, the
VZ in the inlet of the upper rotor increases because the suction effect and induced effect are enhanced at a short distance. In
Figure 15b, the
VZ in the inlet of the lower rotor decreases with the
h/D. This is because the compressed flow produced by the upper rotor does not have enough distance to accelerate, so the slipstream effect is weakened. In addition, there is an S-shaped fluctuation in the curve of
VZ around
r/R = 0.6. This is caused by the tip leakage vortex, which induces a downward velocity on the left side and upward velocity on the other side. As the blade distance increases, the amplitude of the S-shaped fluctuation increases at first and then decreases.
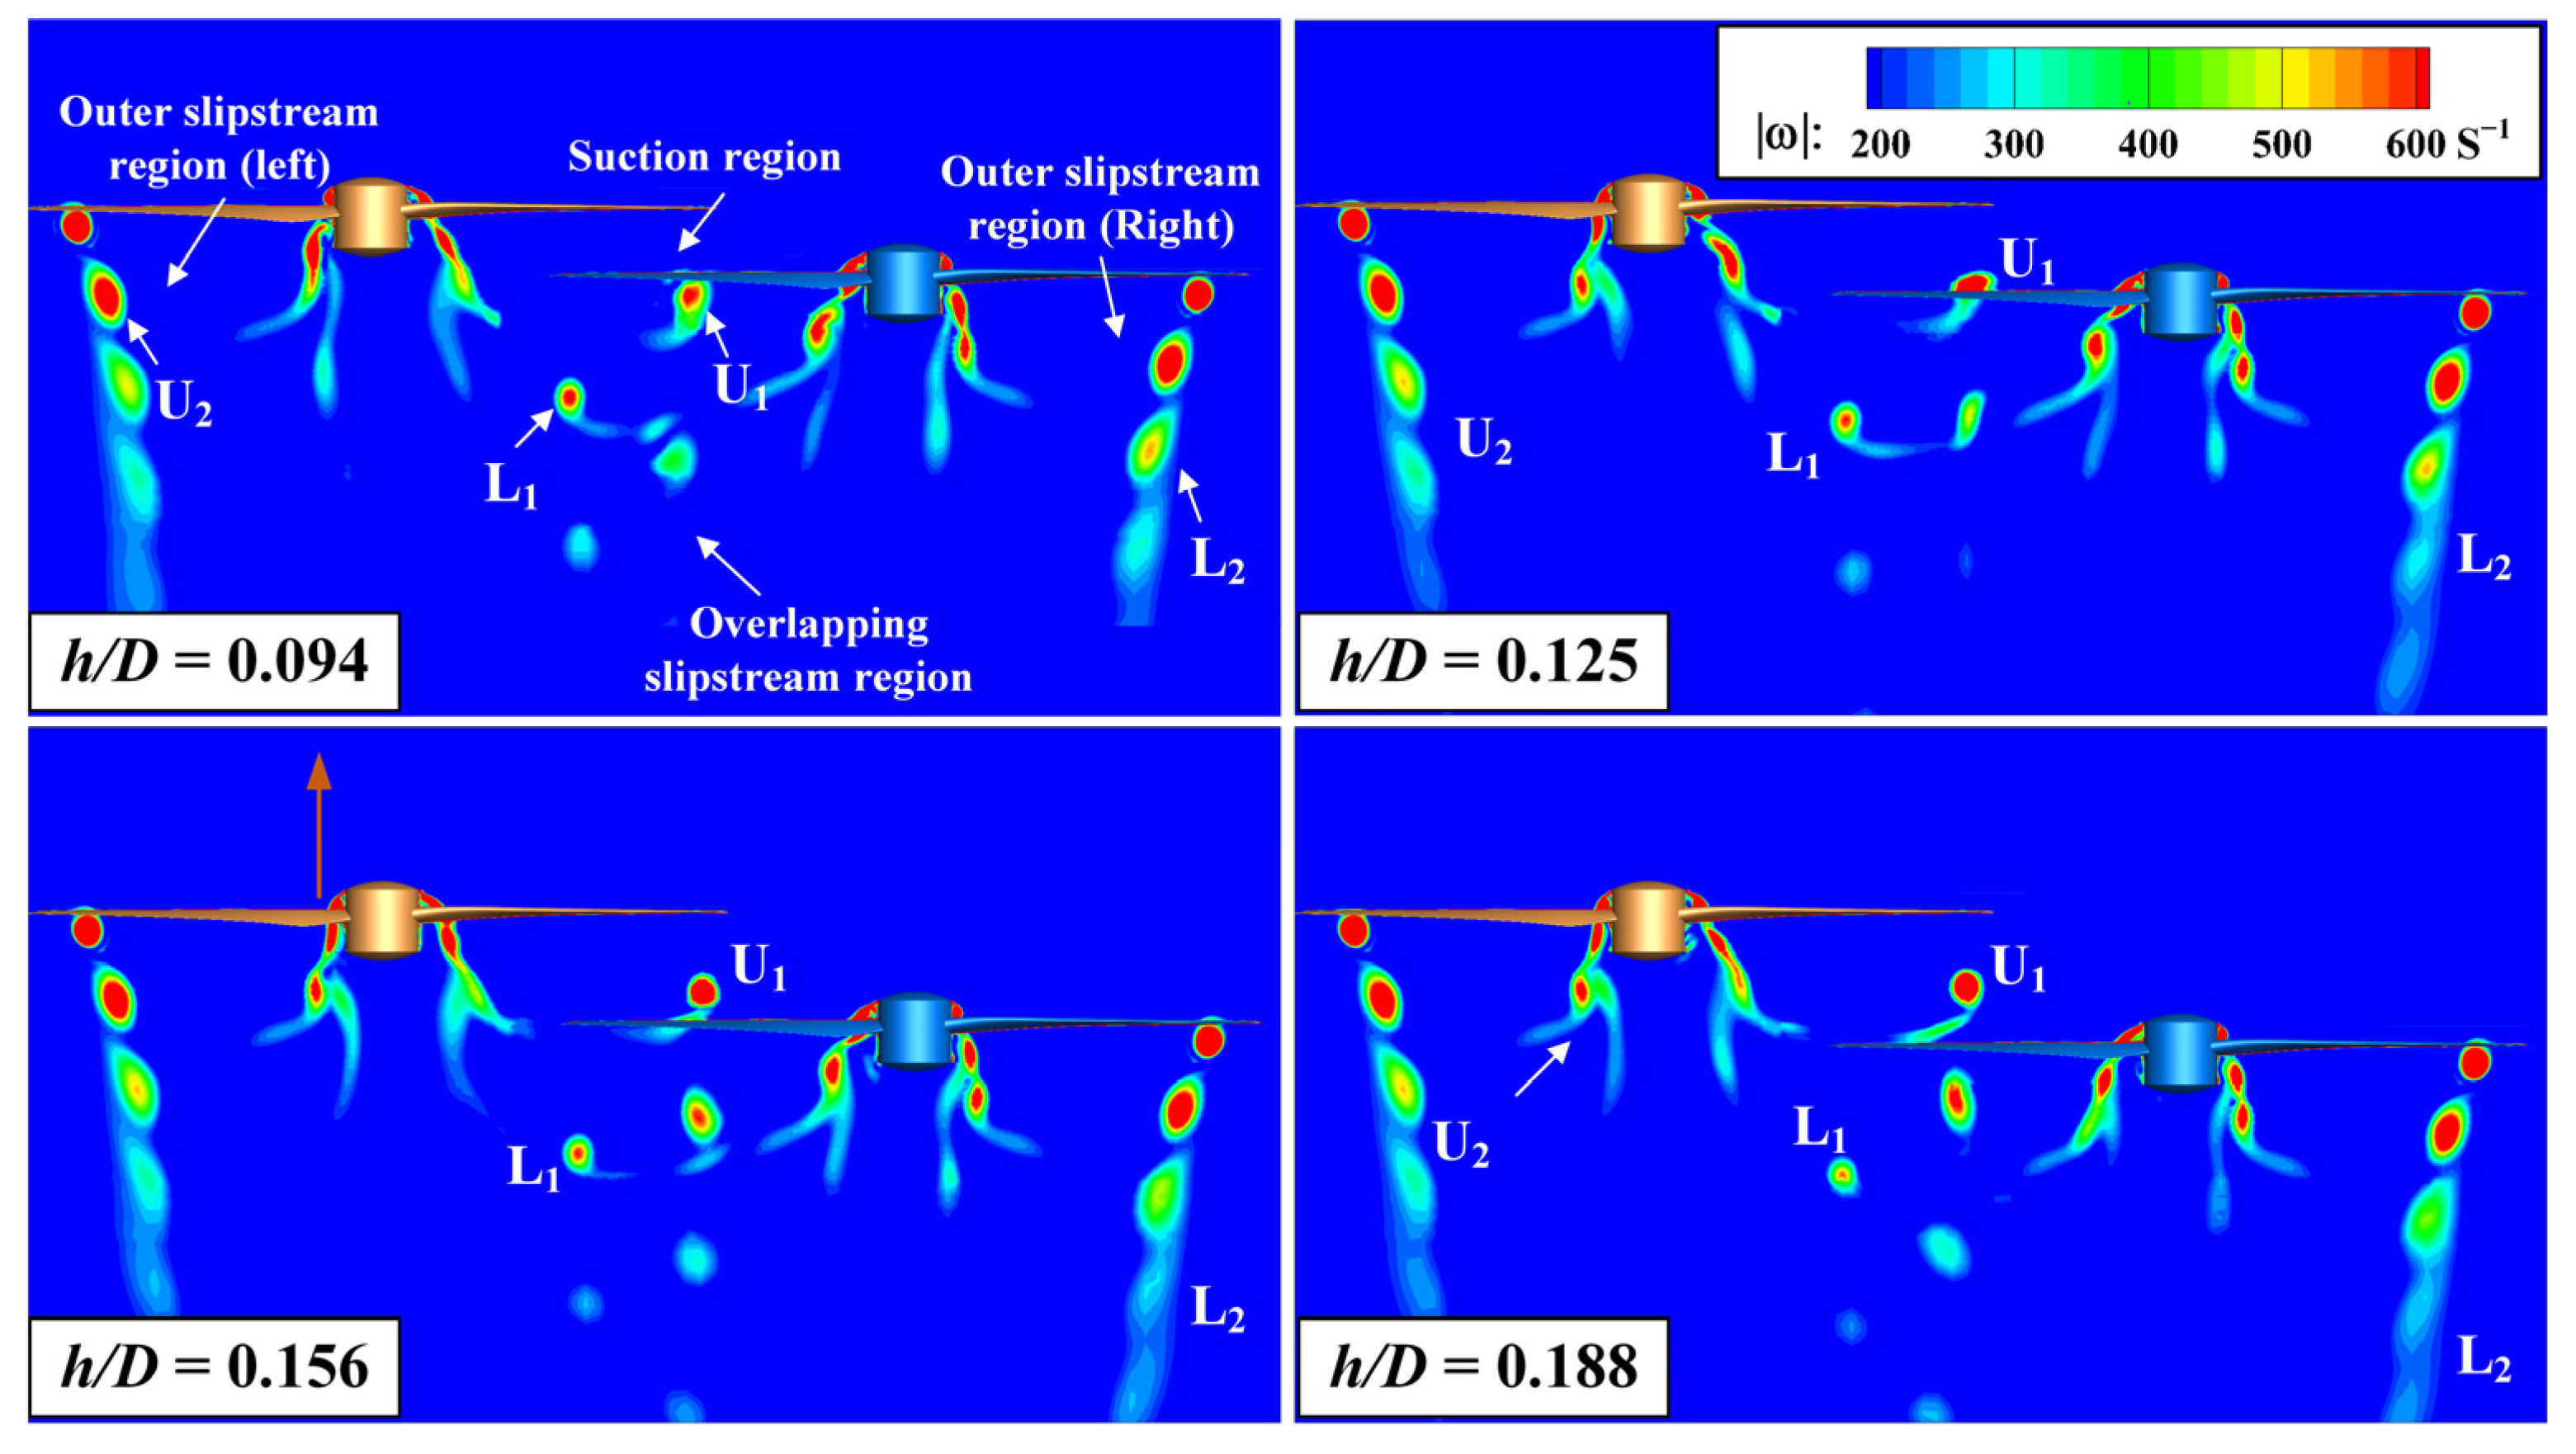
Figure 16 displays the vorticity magnitude contours at the vertical slice at different blade distances. Above all, the leakage vortex produced by the outer blade of the upper rotor is marked as U
1, whereas the vortex produced by the inner blade is marked as U
2. The flow field may be categorized into the following sections based on distinct spatial placements and disturbances: the overlapping slipstream region, the outer slipstream region, and the suction region. As the blade distance
h/D is 0.094, the suction effect is stronger, leading to a high axial velocity flow in the suction area, so the vortex U
1 quickly passes through the suction region and meets the blade of the lower rotor in the overlapping slipstream area. With the blade distance
h/D increases, the position of the vortex is variable. When the blade distance
h/D is 0.125, the vortex U
1 directly impacts the lower blade, resulting in blade–vortex interaction (BVI). The partial attack angle on the lower rotor changes and the load distribution on the distribution shifts. Disturbed by the surface of the lower rotor, the vortex U
1 dissipates quickly. When the blade distance
h/D continually increases to 0.188, the suction region is large and the vortex U
1 is far from the lower blade. The BVI phenomenon disappears and the structure of vortex U
1 recovers to being stable, which means that the fluctuations on the thrust distribution of the lower rotor will also disappear.
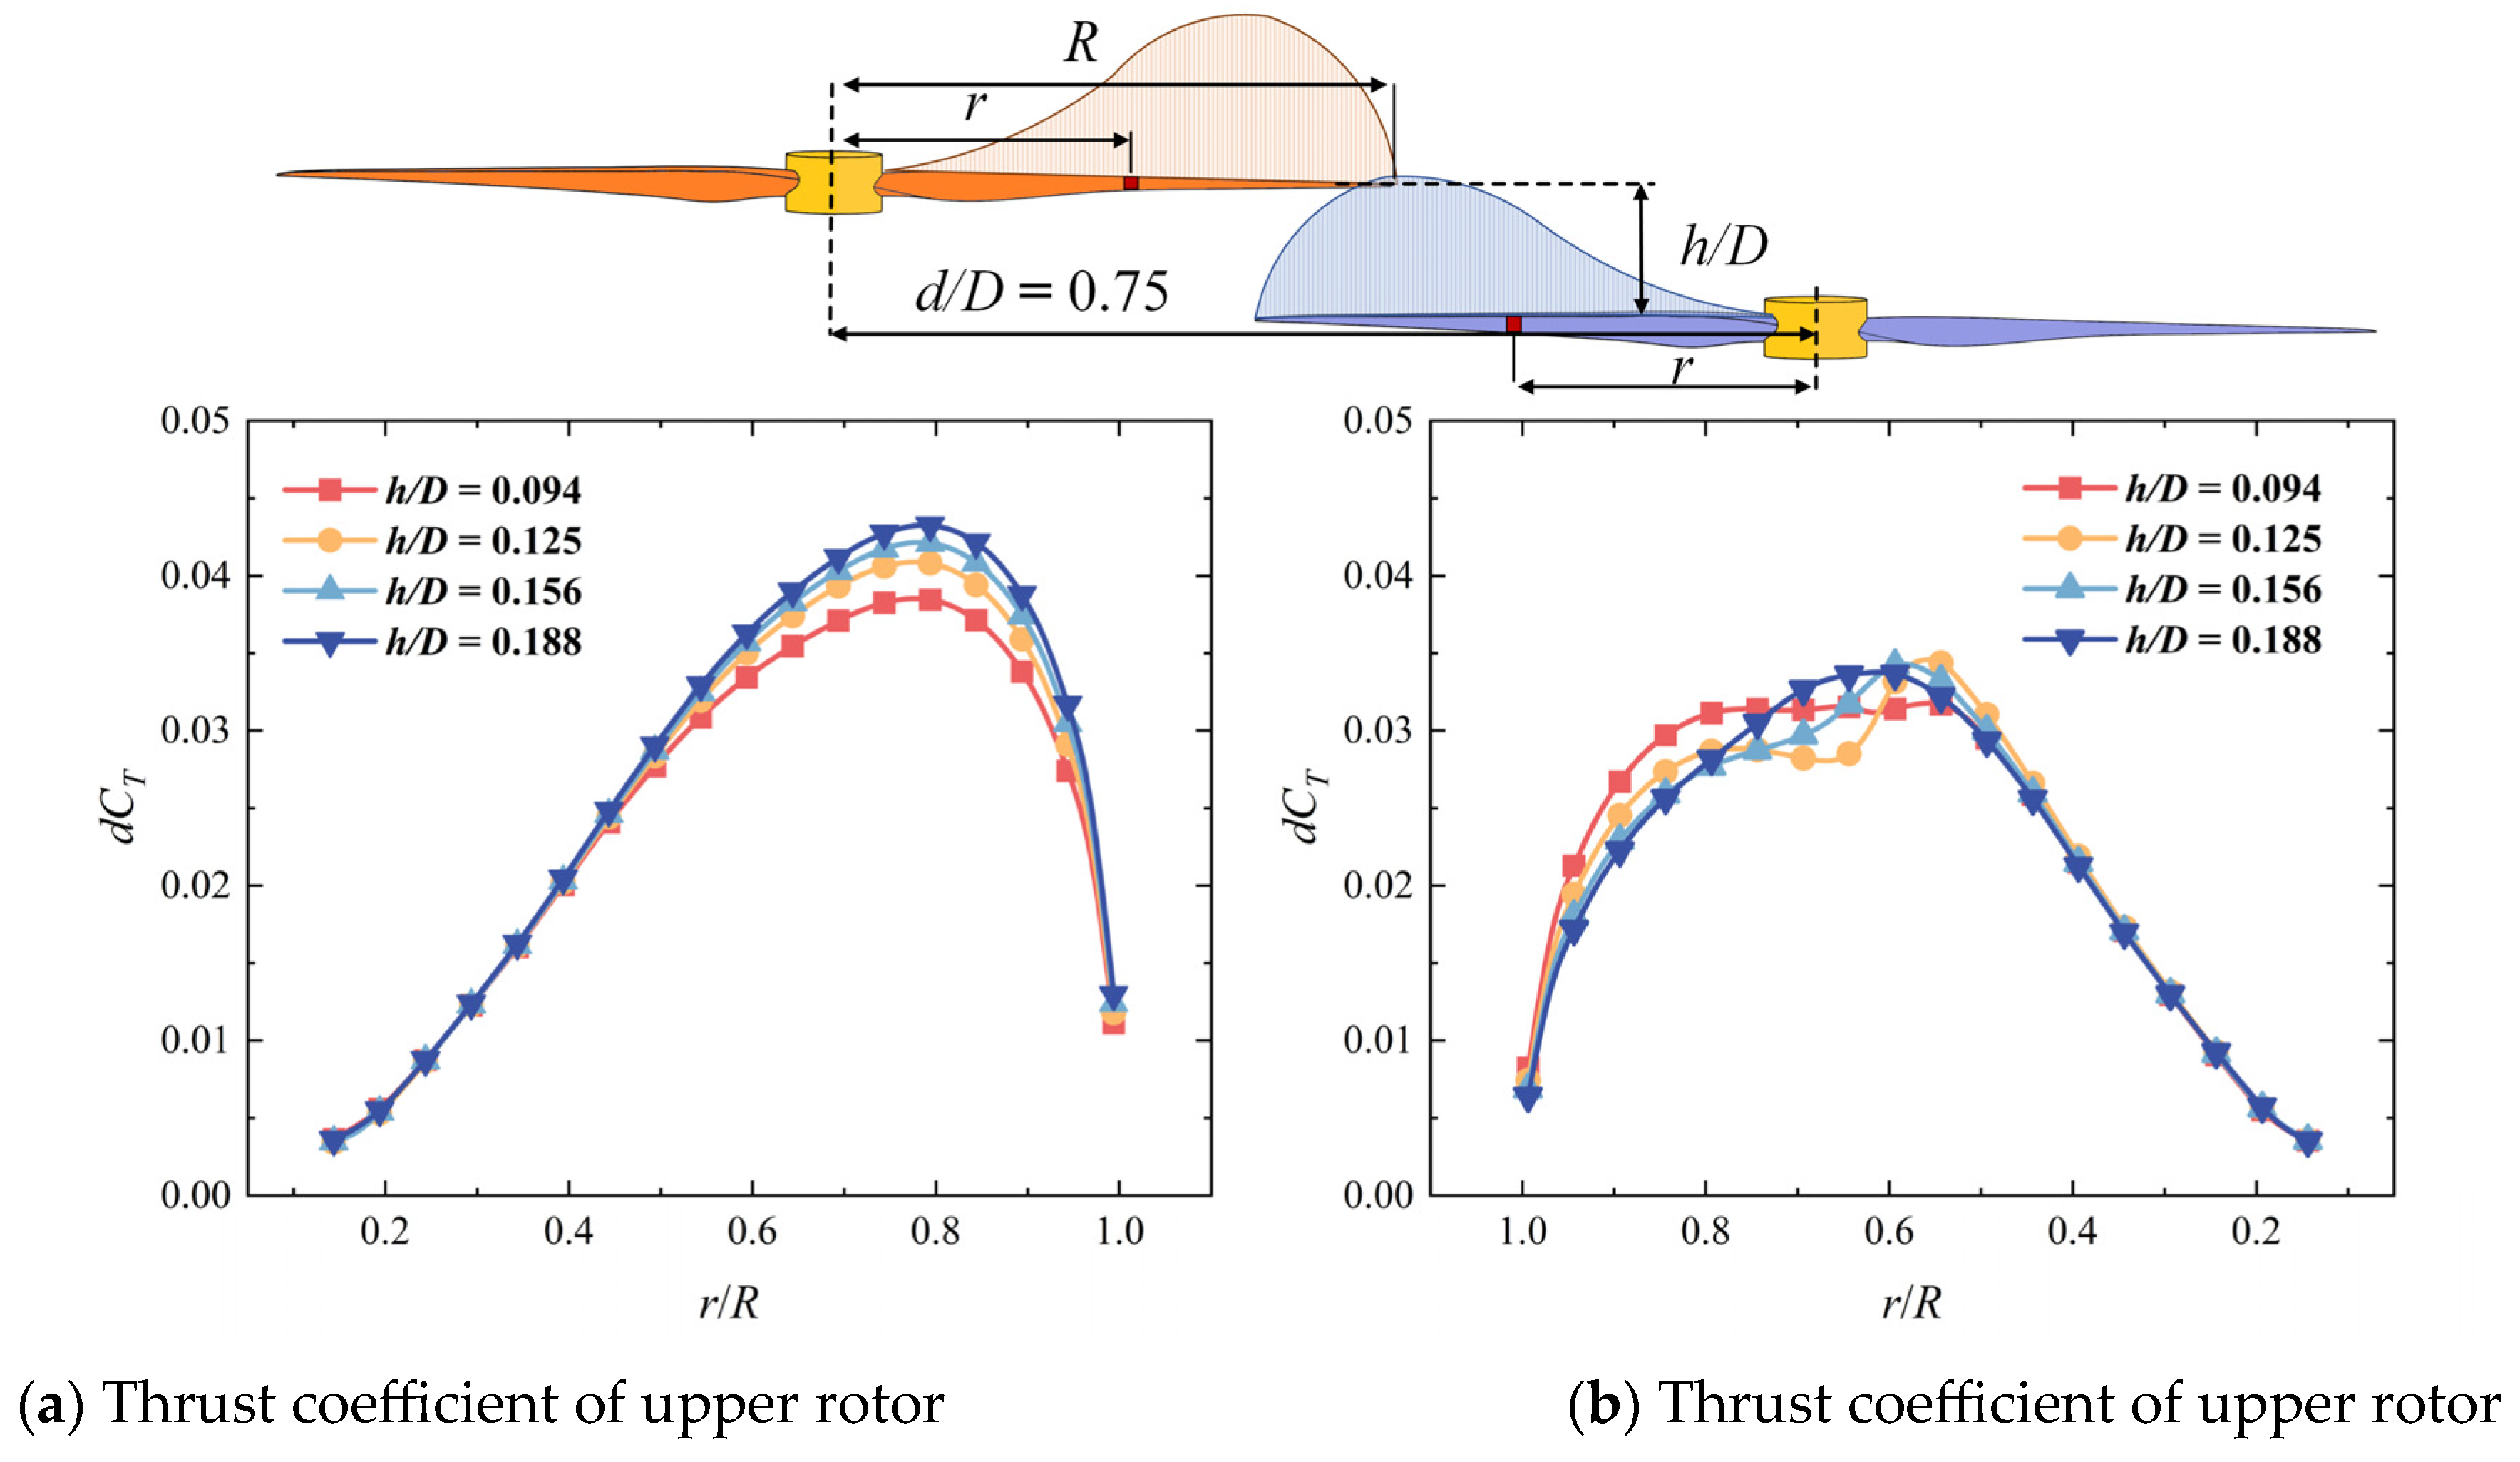
Figure 17 shows the spanwise load distributions on the blades of two rotors when they meet in the overlapping area at different blade distances. As the blade distance increases, because of the weakening of the interaction between two rotors, the thrust coefficient of the upper rotor increases and the thrust coefficient of the lower rotor decreases. However, the range of influence on the blades of the two rotors basically remains unchanged. In
Figure 17 when the blade distance
h/D is 0.125 and 0.156, an S-shaped fluctuation appears on the load distribution curve of the thrust coefficient at the position
r/R = 0.6 because of the BVI effect between the tip leakage vortex of the upper rotor and the blade of the lower rotor. At the blade distance
h/D is 0.188, the “S” shape fluctuation on the distribution curve disappears when the BVI effect disappears.
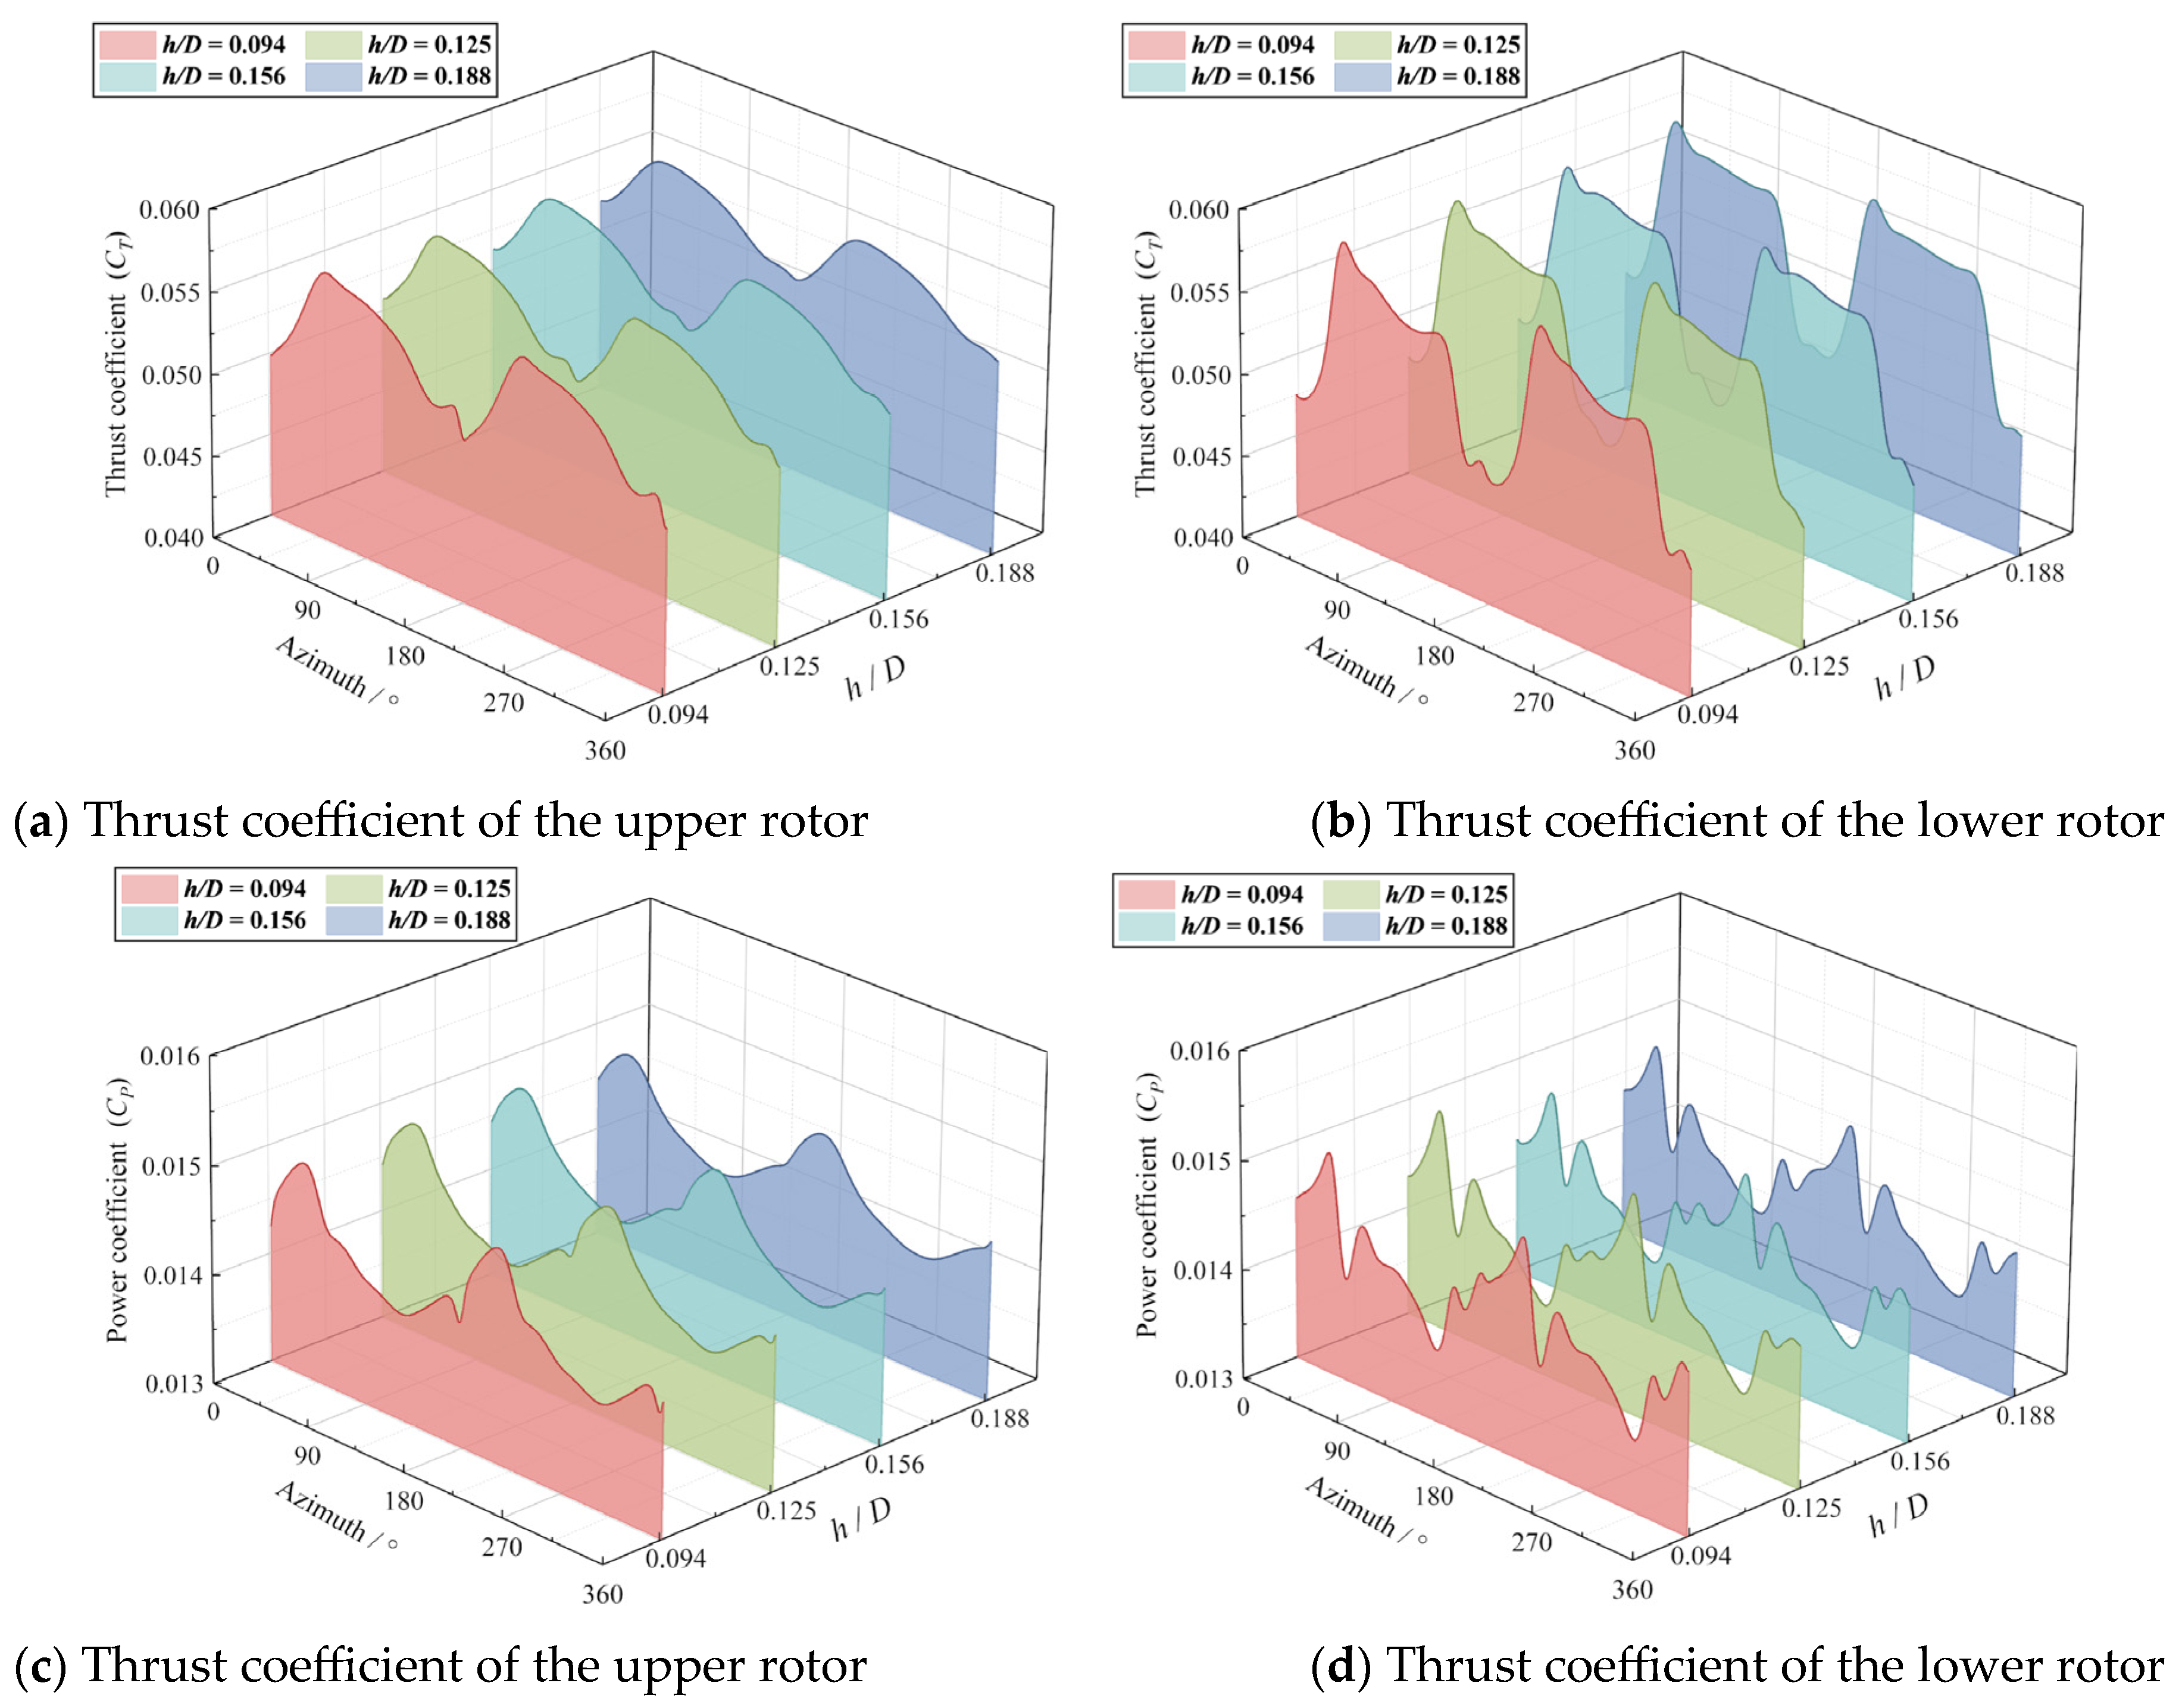
Figure 18 shows the variation characteristic curves of the thrust and power coefficients of the upper and lower rotor blades with azimuth angles at different blade distances. As shown in
Figure 18a,b, at an azimuth angle when the two rotors do not meet, the thrust coefficients of each rotor are similar at different blade distances. When two rotors meet around the 180 deg azimuth angle, a significant fluctuation appears on the curve of coefficient and power coefficient. With the blade distance decreases, the amplitude of the fluctuation increases gradually because of the enhanced suction effect and induced effect. In addition, in
Figure 18b, at an azimuth angle of around 150 deg, the thrust coefficient of the lower rotor decreases with a blade distance decrease. This may be caused by the variation in the circumferential velocity of the slipstream. In
Figure 18c,d, as the blade distance decreases, the fluctuation also appears around an azimuth angle of 180 deg. However, the overall variation pattern of the power coefficient curve remains essentially unchanged.
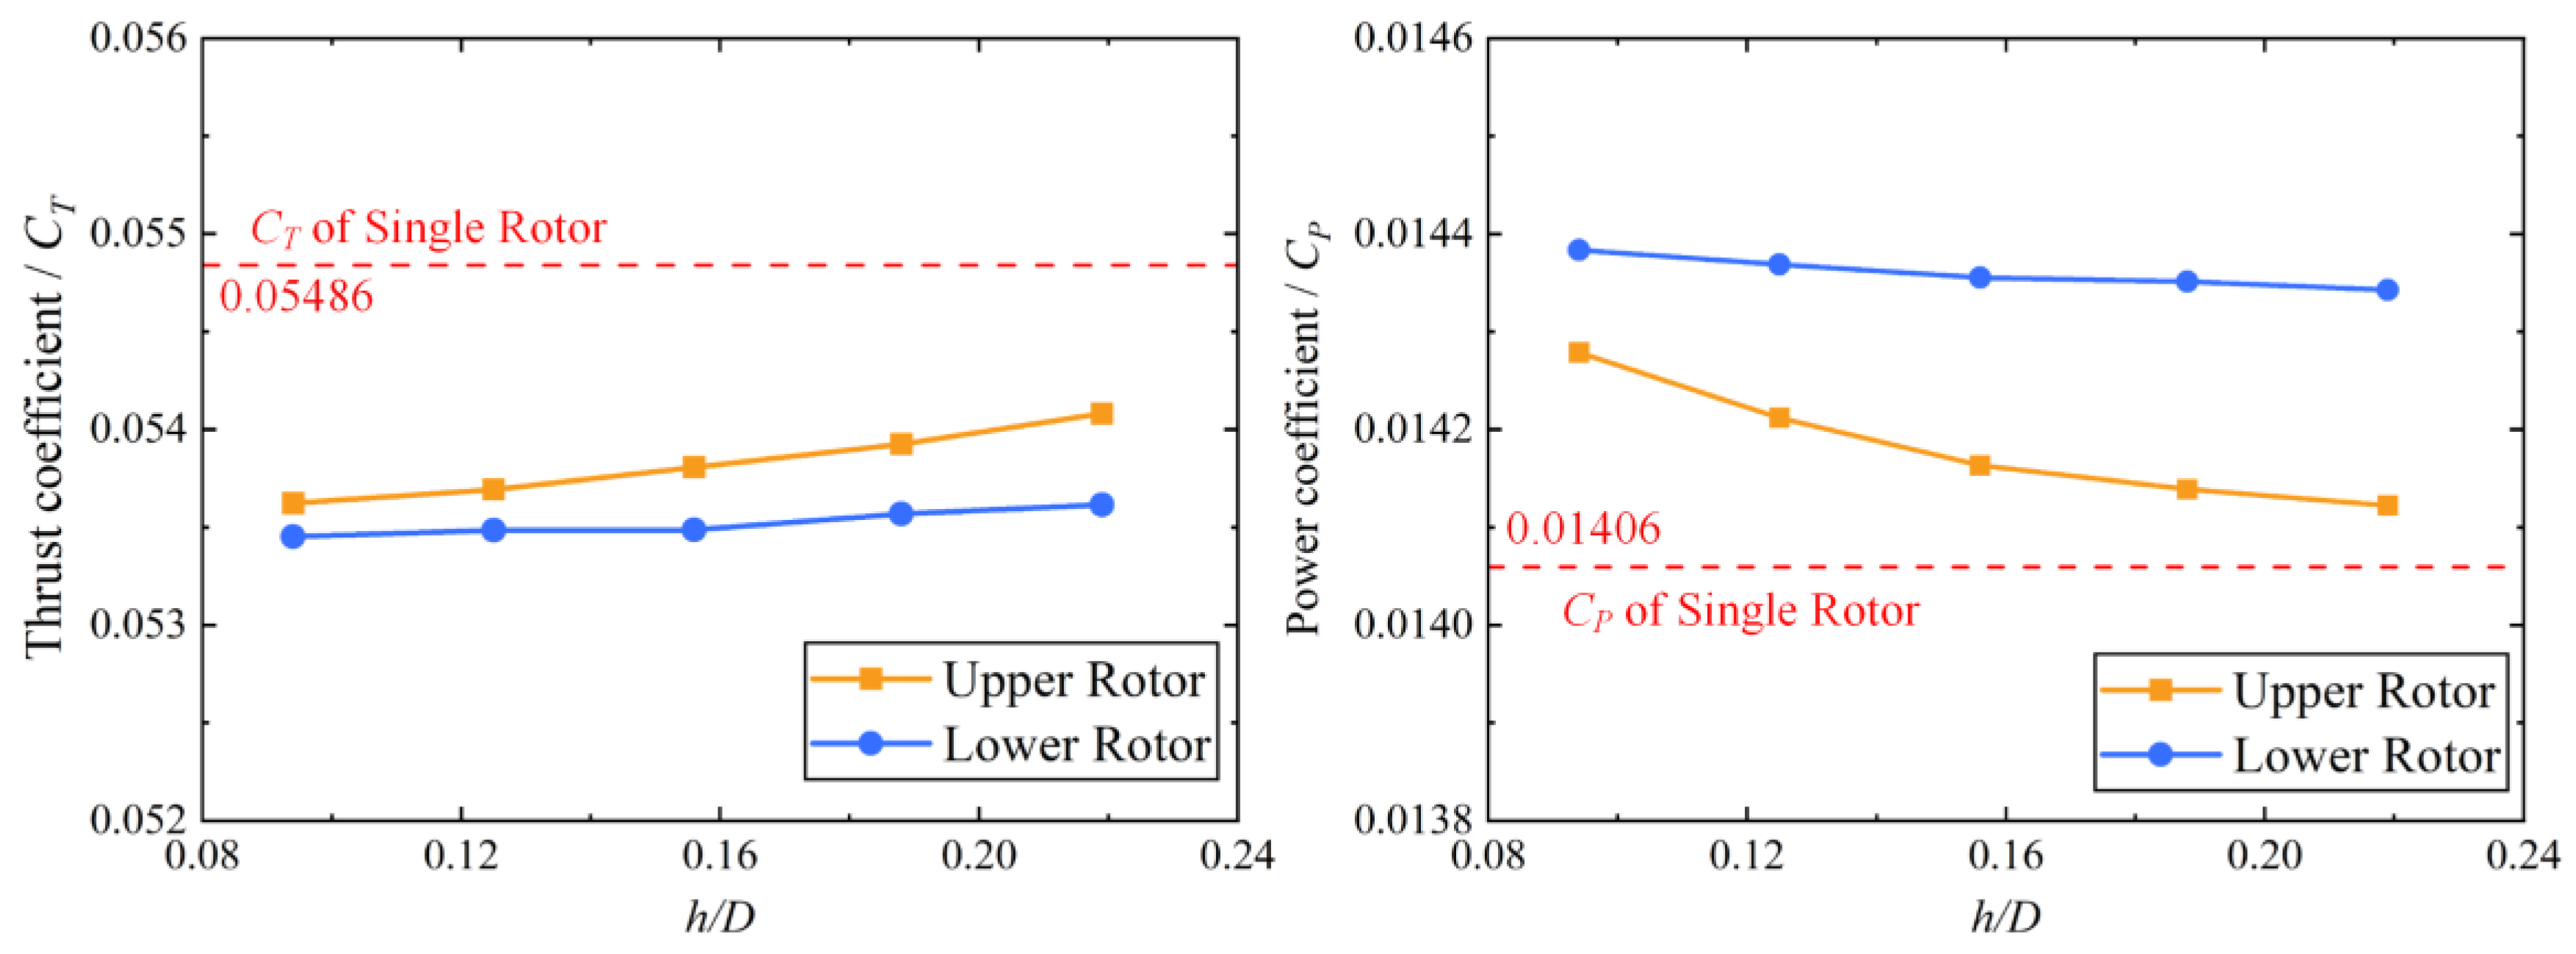
Figure 19 displays the average thrust and power coefficients in one revolution at different axis distances (
d/D). As the blade distance increases, the suction effect and induced effect rapidly weaken. The thrust and power coefficient of the upper rotor progressively approach the characteristics of the single rotor. However, due to the fact that these effects constitute a weak interaction, the variation ranges of the thrust and power coefficients of the upper rotor are constrained. When the blade distance is close, the wake of the upper rotor has a slower velocity but a larger cover area. So, the average thrust and power coefficient of the lower rotor in one revolution change a little as the blade distance increases. In conclusion, reducing the blade distance between the two rotors will strengthen the interference between the two rotors and lead to a stronger fluctuation in load distribution when the two rotors are overlapping, but this has a limited influence on the aerodynamic performance of the whole overlapping rotor system. This may be beneficial for reducing the size of the rotor system to further improve space utilization for overlapping rotor configurations.


