Abstract
Existing aerial forest fire monitoring data primarily consist of infrared or visible light images. However, there is a lack of in-depth research on the ability of models to perceive fire regions across different spectral images. To address this, we first constructed a dataset of infrared and visible light images captured in the same scene, from the same perspective, and at the same time, with pixel-level segmentation annotations of the flame regions in the images. In response to the issues of poor flame segmentation performance in the current fire images and the large number of learnable parameters in large models, we propose an improved large model algorithm, SAMFA (Segmentation Anything Model, Fire, Adapter). Firstly, while freezing the original parameters of the large model, only the additionally incorporated Adapter module is fine-tuned to better adapt the network to the specificities of the flame segmentation task. Secondly, to enhance the network’s perception of flame edges, a U-shaped mask decoder is designed. Lastly, to reduce the training difficulty, a progressive strategy combining self-supervised and fully supervised learning is employed to optimize the entire model. We compared SAMFA with five state-of-the-art image segmentation algorithms on a labeled public dataset, and the experimental results demonstrate that SAMFA performs the best. Compared to SAM, SAMFA improves the IoU by 11.94% and 6.45% on infrared and visible light images, respectively, while reducing the number of learnable parameters to 11.58 M.
1. Introduction
Fire monitoring typically involves extracting flame information from fire images using spectral bands of different wavelengths. For forest fires, the spectral types primarily used include bands ranging from visible light to short-wave infrared, while mid-wave infrared is particularly sensitive to abnormally high temperatures [1]. Common methods for forest fire monitoring are usually based on aerial images captured in infrared or visible light.
Given the thermal sensitivity of infrared spectra, which allows for the accurate identification of fire source locations even in the presence of obstructions, scholars have proposed using deep learning techniques to segment infrared aerial images for fire monitoring. For example, Gowravaram et al. [2] utilized thermal infrared drone technology to measure the extent of forest fire coverage and mapped the evolution of the fire. Kumar et al. [3] proposed two flame segmentation networks suitable for drone-captured forest scenes, and the experimental results on three datasets showed that the network parameters were 1/3 and 1/6 of the baseline network, respectively. Wang et al. [4] proposed a multimodal flame segmentation network called SemiFSNet, which identified flames by capturing the unique features of forest fires. Experiments on the Flame dataset and the Corsican dataset demonstrated that SemiFSNet can effectively segment flame features in environments with obstructions. De et al. [5] proposed a flame segmentation method for forest fire images based on edge detection, and the experiments conducted on images captured by drone-mounted infrared cameras showed that this method had higher robustness compared to the Canny algorithm. Hopkins et al. [6] introduced a dataset of drone-captured thermal infrared images of forest fires, aiming to promote the development of a new generation of models that would utilize thermal radiation imaging, thereby improving the effectiveness of flame segmentation in aerial forest fire images. Niu et al. [7] proposed a forest flame segmentation model based on infrared drone images to address the issues of obstructions and poor segmentation accuracy of traditional methods. The experimental results showed that this method improved the accuracy by 2.1% and the recall rate by 2.7% compared to the baseline model, effectively segmenting forest fires of different sizes and shapes.
From the above, it can be seen that methods based on infrared images have improved the efficiency of aerial forest fire monitoring to some extent. However, during the early stages of a fire, the relatively low temperature can lead to a high missed detection rate and make image segmentation challenging. To address these issues, researchers have used various spectral bands for forest fire monitoring. For example, Boroujeni et al. [8] proposed an improved conditional generative adversarial network that converts visible light images into infrared images to infer flame temperatures. In terms of the evaluation metric of mean accuracy, this algorithm outperformed the baseline algorithm by 12%. Comesaña et al. [9] generated labeled synthetic data for fire-sensitive classification using infrared and visible light spectral data and segmented the image data based on deep neural networks, achieving the effective monitoring of forest fires. Kaaret et al. [10] used multiband visible/near-infrared imaging to distinguish between artificial light sources and forest fires, providing a technical means for nighttime fire monitoring in the areas surrounding forests. Liang et al. [11] proposed a flame segmentation network for forest fire images, and the experiments on a constructed multispectral image dataset showed that the network could effectively segment flames and smoke, providing effective algorithmic support for fire early warning. Abdusalomov et al. [12] addressed the challenge of monitoring flames and smoke with drones by proposing a multi-sensor (infrared and synthetic aperture radar, etc.) fire monitoring method. Extensive experiments under low visibility conditions showed that this method outperforms the current advanced networks and is suitable for real-time deployment on drones. Jin et al. [13] proposed a forest fire image fusion framework using a multilevel multiclass network and applied the fused fire images to flame segmentation, solving the problem where traditional networks tend to ignore visible light contrast information and infrared detailed texture information. This provides ideas for subsequent fire monitoring. The above analysis indicates that different spectral bands capture different radiation information when detecting different targets. Currently, the most commonly used spectral bands for fire monitoring are infrared and visible light, but there has been limited in-depth research on the infrared and visible light images captured in the same scene, from the same perspective, and at the same time.
In light of this, we focus our research on infrared and visible light images and optimize the algorithm model to facilitate the goal of “early detection” of forest fires. To address the aforementioned issues, we propose a flame segmentation algorithm, SAMFA, based on large model optimization. Our contributions are as follows:
- (1)
- We have constructed a dataset of infrared and visible light aerial images captured in the same scene, from the same perspective, and at the same time;
- (2)
- By fine-tuning an additionally incorporated Adapter module, we ensure that the network better adapts to the specificity of the flame segmentation task without altering the original parameters of the SAM network;
- (3)
- To enhance the model’s ability to recognize flame edge features, we propose a U-shaped flame feature mask decoder;
- (4)
- To prevent poor segmentation performance resulting from direct training, we employ a progressive training strategy for experiments on the fire dataset.
2. Construction and Analysis
To gain an understanding of the fire image datasets currently available, we collected and organized the most commonly used datasets, as detailed in Table 1. The left column presents infrared images, while the right column shows both infrared and visible light images. Clicking on the “Name” will redirect you to the corresponding dataset website. As indicated in the table, there are numerous aerial forest fire image datasets available, but most of them are based on single-spectral images. Although datasets like FLAME2 [14] contain infrared and visible light image data from the same scene, they do not provide labels for image segmentation tasks. To thoroughly validate the model’s perceptual capabilities across different spectra, we selected images from the same scenes in the FLAME2 dataset and annotated them at the pixel level for segmentation, laying the foundation for subsequent experiments.

Table 1.
Analysis Table of Infrared/Visible Light Dataset.
2.1. Collection and Annotation
To facilitate the experiments and simulate real forest fire environments, we thoroughly analyzed the dataset selected for our study, as detailed in Table 2. As shown in the table, we selected video data from the publicly available aerial forest fire dataset FLAME2 [14], which includes both infrared and visible light bands. The footage was captured using a DJI Mavic 2 Enterprise Advanced (M2EA) drone equipped with an infrared thermal imaging camera and a visible light camera, with resolutions of 640 × 512 and 1920 × 1080, respectively. For the same scene, captured from the same perspective and at the same time, the memory footprint of the infrared image data was smaller than that of the visible light image data.
Table 2.
Detailed information of the FLAME2 dataset.
Five files were selected for annotation, with one image extracted every two seconds from the videos. The five folders were named as follows: #3) Video Pair 3.zip (202 images), #4) Video Pair 4.zip (151 images), #5) Video Pair 5.zip (134 images), #6) Video Pair 6.zip (93 images), and #7) Video Pair 7.zip (120 images). There were 700 infrared and visible light images in total, each with a bit depth of 24. Among them, 525 images were used as the training set, and 175 images as the test set. Examples from the dataset are shown in Figure 1. To ensure comparability, the image resolution was uniformly set to 640 × 512. As illustrated in the figure, each row displays infrared and visible light original images and their corresponding Ground Truth (GT) labels for the same scene, captured from the same perspective and at the same time. In scenes with heavy smoke, the infrared images can better identify flames beneath the smoke, while the visible light images perform poorly. In scenes with less smoke, the visible light images provide clearer outlines of the fire source, whereas the infrared images have less textural information and thus poorer identification performance. Although there may be false positive fire sources in the infrared images with less smoke, they can still indirectly indicate the presence of a fire source, for example, by determining if there are nearby fire sources, thereby enhancing monitoring capabilities. Overall, the infrared and visible light images each have their advantages in presenting fire source information. The dataset is publicly available: The original contributions presented in the study are included in the article, further inquiries can be directed to the corresponding author.
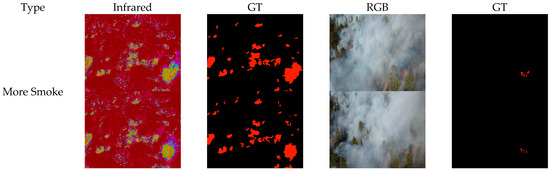
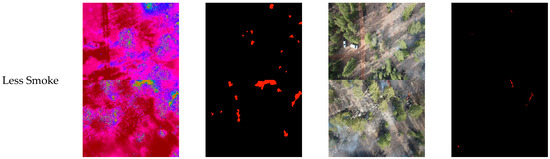
Figure 1.
Example of annotation for infrared and visible light images of the same scene.
2.2. Data Analysis
The following provides a visualization of the mask sizes for the 700 infrared images annotated in FLAME2, as shown in Figure 2. As illustrated, the overall target size of the flames is distributed within a width of 20 pixels and a height of 20 pixels. Compared to the entire image size of 640 × 512 pixels, the flame targets are relatively small, which aligns with the small target environment of aerial forest fire detection. Furthermore, the infrared and visible light images from this dataset have been utilized by many researchers in aerial forest fire monitoring tasks, attesting to the reliability of the data.
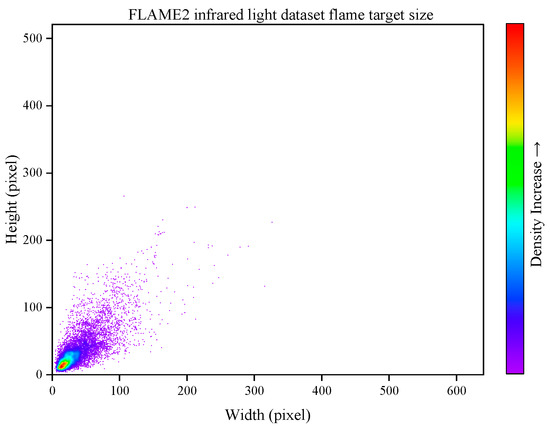
Figure 2.
Visualization of flame target size in the infrared dataset.
To better accommodate fire scenarios, the 700 visible light images in FLAME2 were annotated, and the sizes of the annotated masks were visualized, as shown in Figure 3. As illustrated, the masks in the visible light dataset are generally small, similar to the flame targets in aerial forest fire images, indicating the reliability of the data.
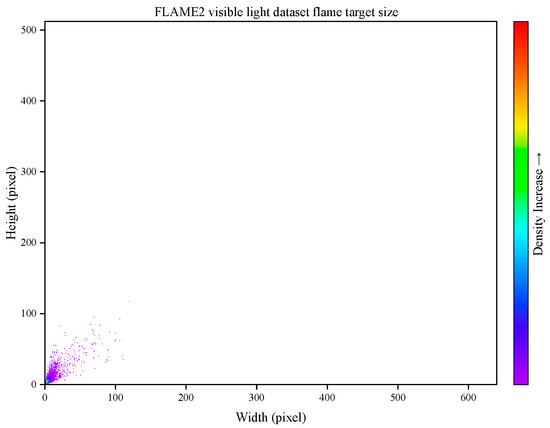
Figure 3.
Visualization of flame target size in the visible light dataset.
In summary, the infrared and visible light images each have their unique characteristics in forest fire monitoring. The former can effectively capture thermal information and is suitable for low-visibility environments, while the latter provides intuitive visual features. Subsequent experiments will analyze the effectiveness of flame segmentation in the infrared and visible light images of forest fires, leading to the conclusion that these two types of images have distinct differences in monitoring forest fires.
3. Methodology
The Segment Anything Model (SAM) [29] is a segmentation model pretrained on 11 million images and over 1 billion masks. It demonstrates strong learning and generalization capabilities in segmenting various target objects in natural images, exhibiting good versatility and supporting user-interactive input to better adapt to complex segmentation scenarios. However, directly applying it to flame segmentation in aerial forest fire images gives rise to the issues of large model parameter count and unsatisfactory segmentation performance. Therefore, we have devised an improved flame segmentation method tailored for large models.
3.1. SAMFA
Given the complexity of flame segmentation in aerial forest fire images, directly applying pretrained models often fail to capture the intricate details of flames. However, model fine-tuning can effectively adapt these models to the flame segmentation task, enhancing the recognition of forest fires. Although full fine-tuning (FFT) can guide the model to accurately segment targets, its large parameter count leads to lower overall efficiency, making it difficult to meet practical requirements. Conversely, parameter-efficient fine-tuning (PEFT) achieves performance comparable to that of FFT by keeping the pretrained model’s parameters unchanged and only adding and training a small number of additional parameters. In light of this, this paper first inserts Adapter modules into each Transformer Encoder Block (feature extraction block) of the Image Encoder in the SAM model. By fine-tuning the newly added Adapter modules, the network can better adapt to the specificities of the flame segmentation task without altering the original SAM network parameters, achieved through training only a small number of newly added parameters. Subsequently, to effectively fuse the image features extracted by the Image Encoder with the information generated by the Prompt Encoder, a “U-shaped” mask decoder is designed. This decoder employs progressive upsampling and skip connections to integrate features of different depths and resolutions, facilitating more precise delineation of the flame target’s edge contours. Finally, a progressive training strategy is adopted, where the parameters requiring fine-tuning in the Image Encoder are updated using a self-supervised method, followed by optimization of both the Image Encoder and the mask decoder using a fully supervised method. This training strategy enables SAMFA to first adapt to fire-related image data without semantic segmentation labels and then transfer to the specific flame segmentation task. The network architecture is illustrated in Figure 4.
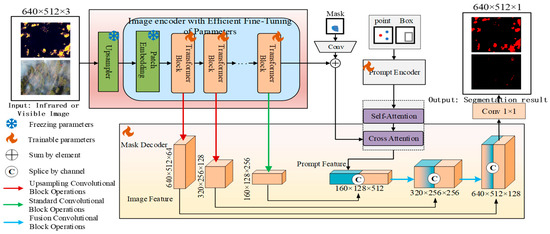
Figure 4.
Structure of SAMFA network.
3.2. PEFT
For the SAM model, the Image Encoder generates image embedding based on a Vision Transformer (ViT) [30]. The official implementation provides three versions of ViT (vit_h, vit_l, and vit_b), which mainly differ in the number of encoder layers, attention heads, and embedding dimensions. Due to experimental constraints, this paper opts for the lightweight vit_b as the subject of our experiments. When an infrared or visible light image of size C × H × W is input, where C represents the number of channels, H the image height, and W the image width, the image is first divided into N non-overlapping small patches of size P × P. Each patch is then flattened into a vector and mapped to a multi-dimensional embedding space. The computation can be expressed as follows:
In the equation, represents the i-th patch. Therefore, the final input vector can be represented as follows:
In the equation, represents the positional encoding corresponding to the patch, and represents the i-th input vector. The Image Encoder consists of 12 Transformer Blocks. For each Transformer Block, each embedded vector X passes through multi-head attention and a feedforward neural network in sequence, before obtaining the final output through Residual Connection (RC) [31]. Specifically, the output of the i-th encoder layer can be represented as follows:
In the equation, FNN represents the output after passing through the feedforward neural network, and represents the output value after passing through the multi-head attention mechanism. The calculation formula for can be expressed as follows:
In the equation, MHA represents the output after passing through the multi-head attention mechanism, and represents the input vector of the (i−1)-th layer. Therefore, the calculation formula for can be expressed as follows:
The network structure of the Transformer Block in SAM is illustrated in Figure 5. It primarily consists of a Layer Normalization (Layer Norm), a multi-head attention mechanism, and a Multilayer Perceptron (MLP). Its main function is to capture global dependencies in the image and perform specific feature encoding operations.
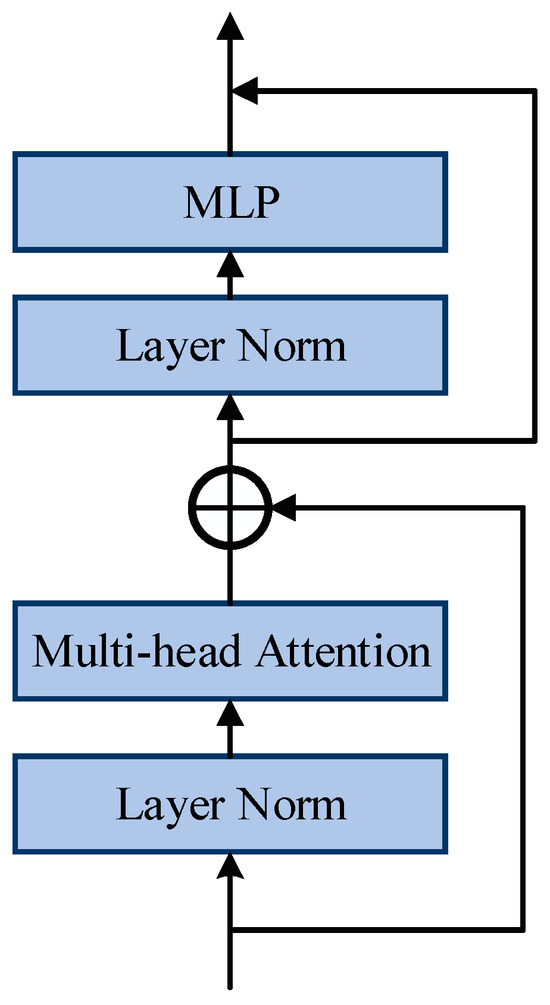
Figure 5.
Transformer Block network structure of SAM.
In SAM, efficient parameter-efficient fine-tuning methods based on additions primarily include Adapter tuning, Prompt tuning, Prefix tuning, and Side tuning [32]. We integrate the Adapter module from Adapter tuning into each Transformer Block of the Image Encoder. While keeping the other parameters of the encoder unchanged, we only update the parameters within the two Adapter modules introduced. The Adapter module adopts a network architecture similar to UNet, which sequentially includes downsampling, a ReLU activation function, and upsampling. Downsampling mainly compresses the input embeddings to a lower dimension, while upsampling expands the compressed embeddings back to their original dimension. To prevent data explosion, the ReLU activation function within the Adapter is modified to ReLU6 [33]. Each Transformer Block is embedded with two Adapter modules, as follows: the first Adapter module is inserted after the multi-head attention mechanism, and the second one is inserted after the residual connection. Additionally, a scaling factor is introduced to adjust the weight of the Adapter modules, enabling the network to better adapt to the current environment. The adjusted network structure of each Transformer Block is shown in Figure 6, where trainable parameters refer to those that are normally updated, and frozen parameters refer to those that do not participate in backpropagation and gradient updates.
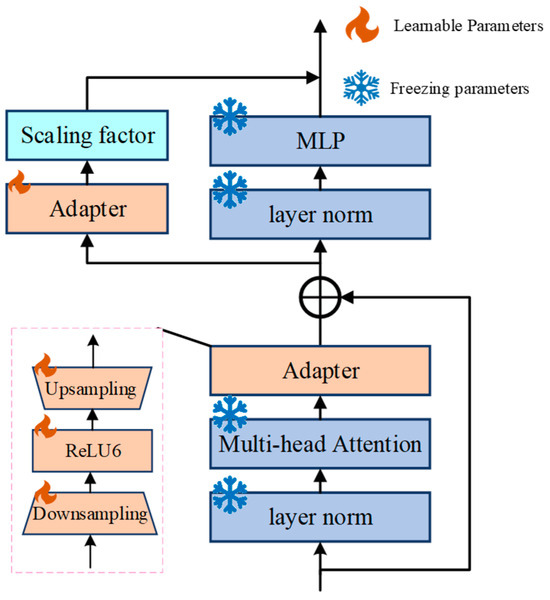
Figure 6.
Adjusted Transformer Block network structure.
Under the aforementioned fine-tuning strategy, SAM only updates a small fraction of the total parameters, significantly reducing the storage requirements and training time during the model training process, thereby enhancing training efficiency. Moreover, it does not introduce any additional inference latency during the inference process.
3.3. Prompt Encoder
The Prompt Encoder maps the prompt input values into prompt embeddings. SAM provides two types of fusible embeddings, namely sparse embeddings (Point, Box, and Text) and dense embeddings (Pixel/Region Mask). When sparse embeddings are input in the form of points, they are mapped to positional encodings and numerical forms (0 or 1) to distinguish whether the input points belong to the target or the background. When the input is in the form of a bounding box, its mapping consists of positional encodings and a set of one-dimensional vectors, which can effectively distinguish the form of the current point (top-left or bottom-right). For the prompts in this paper, we use the pre-trained text encoder from CLIP (Contrastive Language–Image Pre-training) to obtain the sum of each prompt embedding and the text prompt, which is then mapped into the embedding space. For dense embeddings of input masks, preprocessing (four-fold downsampling) is first applied and mapped to the Prompt Encoder. This is followed by two 2 × 2 convolutions with a stride of 2 to match the input feature size with the image embedding size. Finally, a 1 × 1 convolution kernel is used to ensure that the channel values are the same as the original input values, yielding the final dense embeddings. The Prompt Encoder network offers an interactive approach that distinguishes it from other algorithmic models, as illustrated in Figure 7. An MLP is used to encode user-provided points (Point) and bounding boxes (Box) into prompt vectors, providing hints for the prediction target. Due to the lack of large-scale pre-trained models for flame image–text alignment, the use of text prompts is limited. Therefore, our proposed SAMFA only considers points, bounding boxes, and masks as prompt inputs.
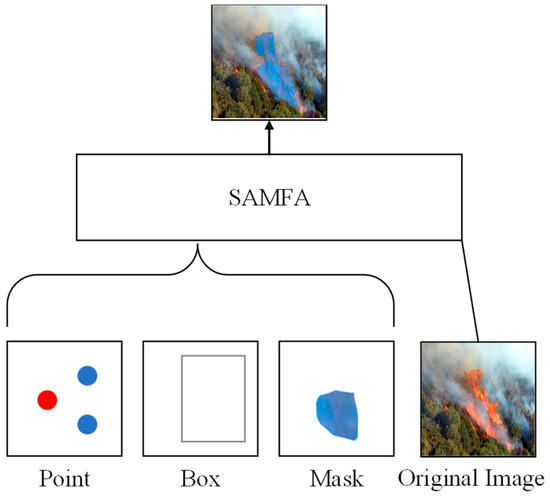
Figure 7.
Flame Segmentation Network Prompt Type.
3.4. U-Mask Decoder
In the SAM network architecture, a lightweight mask decoder can quickly segment the mask region of the target. However, since flame targets in aerial fire images often exhibit irregular shapes, a lightweight mask decoder may struggle to accurately depict the flame boundaries. Therefore, we construct a U-shaped mask decoder tailored for the specific task of flames to enhance the network’s ability to capture edge features. The mask decoder primarily maps image embeddings, prompt embeddings, and output tokens to an image mask, as well as performs segmentation mask prediction based on these features. Specifically, the mask decoder is responsible for fusing the image embeddings obtained from the Image Encoder with the prompt embeddings obtained from the Prompt Encoder. Both image and prompt embeddings undergo a series of preprocessing steps before being input into the mask decoder. The preprocessing formula for image embeddings can be represented as follows:
In the equation, represents the image embedding, represents the dense prompt embedding, represents the positional encoding, and Images represents the preprocessed image embedding. The preprocessing formula for the prompt embedding can be expressed as follows:
In the equation, represents the prediction confidence score, represents the mask token, represents the prompt embedding, and T represents the preprocessed prompt embedding. For each decoder layer, firstly, the prompt embedding is fed into the self-attention mechanism, and the calculation formula can be expressed as follows:
In the equation, represents the attention, , , and represent the weight matrices for the query, key, and value of the prompt embedding, respectively, and represents the dimension of the matrices. Subsequently, the processed prompt embedding is used as a query pair and fed into the cross-attention mechanism, with the calculation formula expressed as follows:
In the equation, represents the cross-attention, represents the query matrix in the decoder, which is derived from the prompt embedding processed by self-attention in the previous step, and and represent the weight matrices for the key and value of the image embedding, respectively. Subsequently, the mask embedding is not directly upsampled to predict the flame mask, but rather fused with the intermediate layer features (image embeddings) of the U-shaped mask decoder to excavate deep fusion features.
Due to the feature maps (image embeddings) generated by the Image Encoder having a resolution of 80 × 64, the image embeddings from the three intermediate layers are applied to “one standard convolution” and “two upsampling convolutions”, respectively, to generate fire feature maps with different resolutions and channel numbers. Specifically, as shown in Figure 8a, a “standard convolution” structure composed of convolutional layers and residual connections is employed to deeply re-encode and extract features from the image embeddings. As illustrated in Figure 8b, in the “upsampling convolution”, one or more deconvolution layers (DeConv) are cleverly inserted between two convolutional layers, with each deconvolution layer upsampling the resolution of the feature maps by a factor of two to produce higher-resolution feature representations. The image embeddings from the three intermediate layers originate from feature representations at different depths of the Image Encoder, sequentially capturing rich image information ranging from low-level features (edge details and local textures) to high-level features (overall shape and global context information). Subsequently, the mask embedding is fused with the image embedding of matching dimensions, aiming to guide the model to focus more on the flame target region, thereby enhancing the pertinence and effectiveness of the feature representations. Afterwards, a two-stage fusion strategy is adopted to refine the extracted semantic knowledge. Each stage includes a deconvolution layer and a convolutional layer. The deconvolution layer is responsible for increasing the resolution of the concatenated embedding features, while the convolutional layer further deeply encodes and refines these embedding features, as depicted in Figure 8c. Ultimately, these deeply fused and refined features are utilized to generate precise flame prediction masks.

Figure 8.
Structure of the decoder sub-block convolutional network. (a) Standard Convolution; (b) Upsampling convolution; (c) Fusion convolution.
3.5. Progressive Training Strategy
There are significant differences in the target distribution between the natural and fire images and directly training SAMFA often leads to poor flame segmentation results. Therefore, a progressive training strategy is applied to the flame segmentation task to improve segmentation performance. The progressive training strategy comprises a self-supervised training phase and a fully supervised training phase. To facilitate the model’s adaptation from natural images to fire images and align with the design philosophy of SAM, a Masked Autoencoder (MAE) is employed for the initial self-supervised training of the Image Encoder. This training utilizes the unlabeled FLAME2 fire dataset, specifically the folder named “#9) 254p Frame Pairs” on the official website, which contains 53,451 infrared and visible light images, obtained at a relatively low cost. The Image Encoder of SAMFA is combined with an image decoder to form a self-supervised network. The image decoder is designed to include two deconvolution layers and one convolutional layer, responsible for upsampling the feature maps and reconstructing the original images, respectively. During this phase, the masked images are processed sequentially through the Image Encoder and image decoder, and the parameters of the Image Encoder and image decoder are optimized by minimizing the mean squared error. The self-supervised loss function can be expressed as follows:
In the equation, represents the number of fire images per batch, and and denote the original fire image and the fire image reconstructed by the decoder, respectively. As illustrated in Figure 9, during training, the network randomly masks out some areas of the image, retaining only a small portion of image patches for the encoder to process, and then introduces mask tokens to identify the masked regions. Subsequently, a small decoder is employed to process the encoded image patches and mask tokens and reconstruct the original image. After training is complete, the decoder is automatically removed, and the encoder is used to process complete images for the segmentation task.
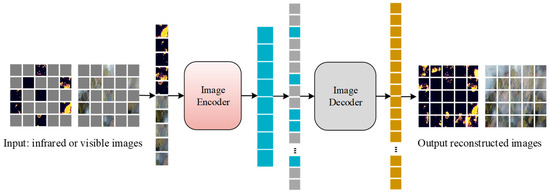
Figure 9.
Structure of the self-supervised network.
After the self-supervised training, the image decoder is discarded, and the FLAME2 annotated dataset is used for further training. Since Dice Loss emphasizes the overall segmentation accuracy more, while Cross-Entropy Loss focuses more on the accuracy of each pixel category, the sum of Dice Loss and Cross-Entropy Loss is used as the optimization objective here. The formula for Dice Loss in flame segmentation can be expressed as follows:
In the equation, represents whether the i-th pixel in the predicted results belongs to the positive class, represents whether the i-th pixel in the true labels belongs to the positive class, n represents the total number of pixels, and represents a bias term or smoothing coefficient to avoid a zero denominator. The formula for Cross-Entropy Loss can be expressed as follows:
Combining the advantages of both to balance the accuracy of overall segmentation and pixel categories, the optimized loss function can be expressed as follows:
In the equation, α and β represent the weights of the two loss functions, which can be adjusted as needed. When n is 2, it represents the two categories of background and foreground.
4. Experimental Setup and Analysis
The following section provides a detailed description of the experimental environment and evaluation metrics. Additionally, a quantitative and qualitative comparison of the annotated infrared and visible light datasets is conducted to ensure the reliability of both the data and the algorithm.
4.1. Experimental Environment
The experiments were conducted on an Ubuntu 20.04 LTS operating system in a 64-bit environment. Two NVIDIA GeForce RTX 3090 graphics cards, each with 24 GB of VRAM, were used for the experiments. The input images were uniformly resized to a resolution of 640 × 512 before being fed into the network. To ensure the reliability of the experiments, all comparison algorithm codes were obtained from officially published sources, and the hyperparameters were used without modification, adhering to their original settings.
4.2. Evaluation Indicators
To validate the effectiveness of the proposed algorithm, a quantitative and qualitative comparative analysis was conducted against five state-of-the-art algorithms (BuildFormer [34], UnetFormer_R18 [35], PIDNet-S [36], SAM-ViT-B [29], and SFA-Net_EfficientNet-B3 [37]) on two public datasets. Representative evaluation metrics selected include the following: Floating Point Operations (FLOPs), Parameters (Params), Learnable Parameters (L_Params), and Intersection over Union (IoU). FLOPs and Params provide a good assessment of network complexity and are calculated using Equations (14)–(17), respectively. For the convolutional layers, the formula for calculating FLOPs can be expressed as follows:
In the equation, and represent the height and width of the output convolutional layer, respectively, represents the number of input channels, represents the number of output channels, K represents the size of the convolutional kernel, g represents the number of groups in group convolution, and “+1” indicates that the convolution includes a bias term. For the fully connected layers, the formula for calculating FLOPs can be expressed as follows:
For the pooling layer, the formula for calculating FLOPs can be expressed as follows:
For CNNs, the formula for calculating the Params of each convolutional layer can be expressed as follows:
In the equation, represents the width of the convolutional kernel, and represents the height of the convolutional kernel. IoU is a commonly used evaluation metric for image segmentation, which primarily calculates the ratio of the intersection to the union between the predicted region and the true region, providing a good indication of the network’s ability to localize objects. The calculation formula can be expressed as follows:
In the equation, ∣a∩b∣ represents the intersection of regions a and b, and ∣a∪b∣ represents the union of regions a and b. The IoU value ranges within [0, 1]. The following sections present the quantitative and qualitative experimental studies on the flame segmentation performance of the infrared and visible light imagery within the aerial forest fire images, along with an analysis of the experimental results. In the subsequent quantitative comparisons, “↑” indicates that a higher value corresponds to better performance, while “↓” indicates that a lower value corresponds to better performance.
4.3. Infrared/Visible Light Quantitative Comparison
Table 3 presents the quantitative comparison of hyperparameters for all algorithms. As shown in the table, in terms of FLOPs, UnetFormer performs the best, followed by SFA-Net and PIDNet, with values of 14.63 G, 47.04 G, and 47.86 G, respectively. In terms of L_Params, SFA-Net exhibits the best performance, followed by SAMFA and UnetFormer, with values of 10.57 M, 11.58 M, and 11.67 M, respectively. Regarding Params, SFA-Net also performs the best, followed by UnetFormer, with values of 10.57 M and 11.67 M, respectively. From the above, it can be concluded that UnetFormer and SFA-Net have the lowest hyperparameters and the best performance. Additionally, compared to SAM, SAMFA reduces L_Params by 96.76%, significantly decreasing computational resource consumption.
Table 3.
Comparison of model parameters.
It is well known that IoU can reflect the performance of network segmentation to some extent. Table 4 presents the quantitative comparison of IoU results for all the algorithms. Due to the abundance of smoke occlusion scenarios in the dataset under the same scene, viewpoint, and time, the segmentation performance of the infrared images is superior to that of the visible light images, which corresponds to the evaluation metrics in the table and indicates reliable data. For the infrared images, SAMFA performs the best, followed by BuildFormer, with IoU values of 72% and 69%, respectively. SAMFA improves the IoU by 11.94% compared to SAM. For the visible light images, SAMFA also performs the best, followed by SFA-Net, with IoU values of 66% and 64%, respectively. SAMFA improves the IoU by 6.45% compared to SAM. From the above, it can be concluded that SAMFA achieves significant improvement in segmentation performance compared to SAM, and it outperforms other advanced algorithms in terms of segmentation effectiveness.
Table 4.
Comparison of model flame segmentation performance.
4.4. Infrared/Visible Light Qualitative Comparison
The SAMFA algorithm is qualitatively compared with the aforementioned five advanced algorithms, and three images are randomly selected from the test set for display. Due to the abundance of flame targets, marking them would reduce readability; therefore, no significance markers (such as circles or boxes) are applied to the comparison images. The same applies to the subsequent experiments, as detailed in Figure 10. As illustrated in the figure, the overall density of fire points is high in the infrared images. In the first row, only the BuildFormer, SFA-Net, and SAMFA algorithms successfully segment the fire points located at the upper part of the image, while PIDNet segments only sporadic areas of flame, and UNetFormer and SAM miss detections. Among them, the SAMFA algorithm exhibits the best segmentation performance. In the second row, focusing on the flame area at the bottom right of the image, only SAMFA demonstrates good recognition performance, followed by BuildFormer, SAM, and SFA-Net, whereas UnetFormer and PIDNet perform relatively poorly. In the third row, where the image contains numerous flame targets, SAMFA and SFA-Net identify the most flame targets, followed by BuildFormer, UnetFormer, and SAM. Additionally, it is observed that PIDNet identifies flame targets sparsely, resulting in poor performance. In summary, the SAMFA algorithm exhibits superior flame segmentation performance, followed by SFA-Net and SAM.
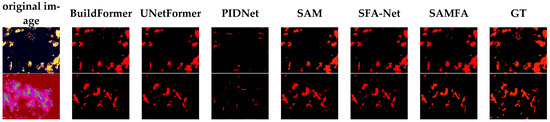

Figure 10.
Comparison of flame segmentation performance of infrared images.
Three visible light images from the same scenes as the aforementioned infrared images are selected for visualization, as shown in Figure 11. As illustrated in the figure, the number of flame targets segmented by the algorithms is relatively less compared to the infrared images. In the first row, only the SAMFA algorithm segments the flame in the bottom-left corner of the image, while the other algorithms miss the detection. In the second row, focusing on the area directly above the image, PIDNet and SAM miss the detection, whereas the other algorithms perform well. In the third row, PIDNet fails to segment the flame, and SAMFA exhibits the highest similarity to the true bounding box. Therefore, it can be concluded that SAMFA demonstrates the best performance in flame segmentation.
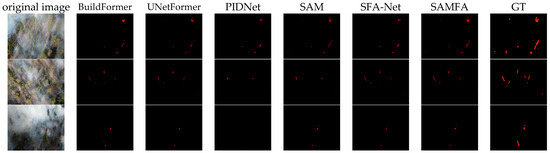
Figure 11.
Comparison of flame segmentation performance of visible image.
4.5. Ablation Experiments and Summary
The following section presents ablation experiments on the three components designed in this chapter—the fine-tuned Image Encoder, the U-shaped mask decoder, and the progressive training strategy.
Figure 12 presents the ablation experiments conducted in this chapter. “SAM + Adapter” represents the SAM model with the addition of the Adapter method, “SAM + Adapter + U ” denotes the SAM model enhanced with both the Adapter and the U-shaped mask decoder, and “SAMFA” signifies the results obtained by incorporating the Adapter, the U-shaped mask decoder, and employing the progressive training strategy on the SAM model. According to the figure, after adding the Adapter to SAM, the IoU for infrared images improves to 69%, while the performance for visible light images remains unchanged. This is because the efficient fine-tuning of the Adapter parameters primarily aims to reduce the number of learnable parameters in the model while maintaining or enhancing its original performance. Following the design of the U-shaped mask decoder, the IoU for infrared and visible light images increases to 71% and 63%, respectively. This improvement is attributed to the U-shaped mask decoder’s ability to effectively enhance the model’s capability to delineate irregular flame edge features. Building on these foundations, the progressive training strategy is then employed, yielding the final IoU metrics of 75% and 66% for infrared and visible light images, respectively. In summary, the SAMFA exhibits superior segmentation performance.
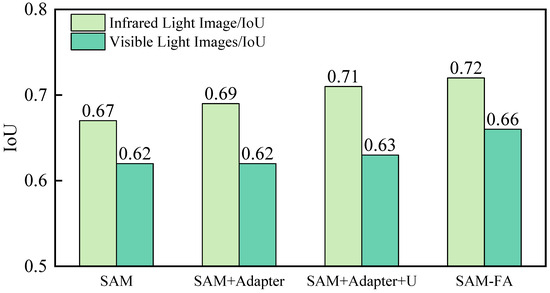
Figure 12.
Comparison of IoU sizes for ablation experiments.
Figure 13 presents a comparison of the loss curves for infrared and visible light images. As the number of iterations increases, the loss curves for all algorithms continuously decrease, and by the 100th iteration, the loss values stabilize, indicating that the algorithms are functioning normally without issues such as overfitting. For both infrared and visible light images, as the SAM model undergoes continuous optimization, its performance improves accordingly, leading to a continuous decrease in the corresponding loss values. This demonstrates the feasibility of the optimization approach. Upon observation, it is evident that the loss values for the infrared images are lower compared to those for the visible light images, indicating that the segmentation performance for flames is better in the infrared images than in the visible light images, which is consistent with the experimental results presented earlier.
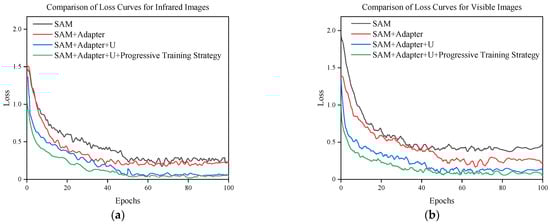
Figure 13.
Variation of infrared and visible Loss curves. (a) Comparison of Loss curves of infrared images; (b) Comparison of Loss curves for visible images.
5. Conclusions
Addressing the ineffectiveness of the current forest fire monitoring systems primarily relying on infrared or visible light images, this study begins by elaborating on the details of existing fire datasets and justifying our choice of using the FLAME2 dataset. Subsequently, we optimize large model algorithms and propose an improved large model algorithm, SAMFA. By efficiently fine-tuning the Segment Anything Model (SAM) with embedded Adapter parameters, designing a U-shaped mask decoder, and adopting a progressive training strategy, we enhance the model’s performance in flame segmentation while significantly reducing the number of learnable parameters. SAMFA is compared with five state-of-the-art algorithms. Experimental results demonstrate that SAMFA outperforms others on multiple key indicators, effectively improving the monitoring effectiveness of forest fires. In the future, as large models increasingly attract the attention of researchers, it will be of paramount importance to employ large model technology to integrate the advantages of both infrared and visible light for the real-time monitoring of forest fires.
Author Contributions
J.Y.: Designed the experiments and the code for the paper and organized the content of the manuscript. M.Y. (Corresponding author): Involved in theoretical development and fund support to provide ideas for the paper. H.W. (Corresponding author): Provided financial support and polished the manuscript. X.D.: Revised the structure of the manuscript. S.L.: Provided theoretical support and designed the conceptual framework of the paper. W.G.: Provided theoretical support and designed the conceptual framework of the paper. All authors have read and agreed to the published version of the manuscript.
Funding
This work was supported by Shenzhen Science and Technology Innovation Committee (Grant No. RCBS20221008093311028), and National Natural Science Foundation of China (Grant No. 52406207, 62202248). The APC was funded by the Research Foundation of Shenzhen Polytechnic University (Grant No. 6025310060K).
Data Availability Statement
The dataset for this experiment came from Wuhan University. All relevant data are within the paper.
Conflicts of Interest
The authors declare that they have no known competing financial interests or personal relationships that could have appeared to influence the work reported in this paper.
References
- Veraverbeke, S.; Dennison, P.; Gitas, I.; Hulley, G.; Kalashnikova, O.; Katagis, T.; Kuai, L.; Meng, R.; Roberts, D.; Stavros, N. Hyperspectral Remote Sensing of Fire: State-of-the-Art and Future Perspectives. Remote Sens. Environ. 2018, 216, 105–121. [Google Scholar] [CrossRef]
- Gowravaram, S.; Chao, H.; Zhao, T.; Parsons, S.; Hu, X.; Xin, M.; Flanagan, H.; Tian, P. Prescribed Grass Fire Evolution Mapping and Rate of Spread Measurement Using Orthorectified Thermal Imagery from a Fixed-Wing UAS. Int. J. Remote Sens. 2022, 43, 2357–2376. [Google Scholar] [CrossRef]
- Kumar, A.; Perrusquía, A.; Al-Rubaye, S.; Guo, W. Wildfire and Smoke Early Detection for Drone Applications: A Light-Weight Deep Learning Approach. Eng. Appl. Artif. Intell. 2024, 136, 108977. [Google Scholar] [CrossRef]
- Wang, J.; Fan, X.; Yang, X.; Tjahjadi, T.; Wang, Y. Semi-Supervised Learning for Forest Fire Segmentation Using UAV Imagery. Forests 2022, 13, 1573. [Google Scholar] [CrossRef]
- De, F.; Battipede, M.; Johnson, E. Infra-Red Line Camera Data-Driven Edge Detector in UAV Forest Fire Monitoring. Aerosp. Sci. Technol. 2021, 111, 106574. [Google Scholar]
- Hopkins, B.; ONeill, L.; Marinaccio, M.; Rowell, E.; Parsons, R.; Flanary, S.; Nazim, I.; Seielstad, C.A.; Afghah, F. FLAME 3 Dataset: Unleashing the Power of Radiometric Thermal UAV Imagery for Wildfire Management. arXiv 2024, arXiv:2412.2831. [Google Scholar]
- Niu, K.; Wang, C.; Xu, J.; Yang, C.; Zhou, X.; Yang, X. An Improved YOLOv5s-Seg Detection and Segmentation Model for the Accurate Identification of Forest Fires Based on UAV Infrared Image. Remote Sens. 2023, 15, 4694. [Google Scholar] [CrossRef]
- Boroujeni, S.; Pedram, H.; Razi, A. IC-GAN: An Improved Conditional Generative Adversarial Network for RGB-to-IR Image Translation with Applications to Forest Fire Monitoring. Expert Syst. Appl. 2024, 238, 121962. [Google Scholar] [CrossRef]
- Comesaña, L.; Martínez, J.; Suárez, G.; Arias, P. Wildfire Response of Forest Species from Multispectral LiDAR Data. A Deep Learning Approach with Synthetic Data. Ecol. Inform. 2024, 81, 102612. [Google Scholar] [CrossRef]
- Kaaret, P.; Tammes, S.; Wang, J.; Schnell, T.; Linderman, M.; Richey, C.H.; Packard, C.M.; Zhou, M. On the Potential of Flaming Hotspot Detection at Night Via Multiband Visible/Near-Infrared Imaging. Remote Sens. 2022, 14, 5019. [Google Scholar] [CrossRef]
- Liang, H.; Zheng, C.; Liu, X.; Tian, Y.; Zhang, J. Super-Resolution Reconstruction of Remote Sensing Data Based on Multiple Satellite Sources for Forest Fire Smoke Segmentation. Remote Sens. 2023, 15, 4180. [Google Scholar] [CrossRef]
- Abdusalomov, A.; Umirzakova, S.; Bakhtiyor, M.; Mukhiddinov, M.; Kakhorov, A.; Buriboev, A. Drone-Based Wildfire Detection with Multi-Sensor Integration. Remote Sens. 2024, 16, 4651. [Google Scholar] [CrossRef]
- Jin, Q.; Tan, S.; Zhang, G.; Yang, Z.; Wen, Y.; Xiao, H.; Wu, X. Visible and Infrared Image Fusion of Forest Fire Scenes Based on Generative Adversarial Networks with Multi-Classification and Multi-Level Constraints. Forests 2023, 14, 1952. [Google Scholar] [CrossRef]
- Chen, X.; Hopkins, B.; Wang, H.; O’Neill, L.; Afghah, F.; Razi, A.; Fule, P.; Coen, J.; Rowell, E.; Watts, A.; et al. Wildland Fire Detection and Monitoring Using a Drone-Collected RGB/IR Image Dataset. IEEE Access 2022, 10, 121301. [Google Scholar] [CrossRef]
- Cazzolato, M.T.; Avalhais, L.; Chino, D.; Ramos, J.S.; de Souza, J.A.; Rodrigues, J.F., Jr.; Traina, A. Fismo: A Compilation of Datasets from Emergency Situations for Fire and Smoke Analysis. In Proceedings of the Brazilian Symposium on Databases-SBBD, Uberlândia, Minas Gerais, Brazil, 2–5 October 2017; pp. 213–223. [Google Scholar]
- Shivakumar, S.S.; Rodrigues, N.; Zhou, A.; Miller, I.D.; Kumar, V.; Taylor, C.J. Pst900: Rgb-Thermal Calibration, Dataset and Segmentation Network. In Proceedings of the 2020 IEEE International Conference on Robotics and Automation (ICRA), Paris, France, 31 May–31 August 2020; pp. 9441–9447. [Google Scholar]
- Braović, M.; Stipaničev, D.; Krstinić, D. Cogent Confabulation Based Expert System for Segmentation and Classification of Natural Landscape Images. Adv. Electr. Comput. Eng. 2017, 17, 85–94. [Google Scholar] [CrossRef]
- Shamsoshoara, A.; Afghah, F.; Razi, A.; Zheng, L.; Fulé, P.Z. Aerial Imagery Pile Burn Detection Using Deep Learning: The Flame Dataset. Comput. Netw. 2021, 193, 108001. [Google Scholar] [CrossRef]
- Toulouse, T.; Rossi, L.; Campana, A.; Celik, T.; Akhloufi, M.A. Computer Vision for Wildfire Research: An Evolving Image Dataset for Processing and Analysis. Fire Saf. J. 2017, 92, 188–194. [Google Scholar] [CrossRef]
- Dewangan, A.; Pande, Y.; Braun, H.-W.; Vernon, F.; Perez, I.; Altintas, I.; Cottrell, G.W. Figlib & Smokeynet: Dataset and Deep Learning Model for Real-Time Wildland Fire Smoke Detection. Remote Sens. 2022, 14, 1007. [Google Scholar]
- Koklu, M.; Taspinar, Y.S. Determining the Extinguishing Status of Fuel Flames with Sound Wave by Machine Learning Methods. IEEE Access 2021, 9, 86207–86216. [Google Scholar] [CrossRef]
- Khan, A.; Hassan, B.; Khan, S.; Ahmed, R. Deepfire: A Novel Dataset and Deep Transfer Learning Benchmark for Forest Fire Detection. Mob. Inf. Syst. 2022, 2022, 5358359. [Google Scholar] [CrossRef]
- Buza, E.; Akagic, A. Unsupervised Method for Wildfire Flame Segmentation and Detection. IEEE Access 2022, 10, 55213–55225. [Google Scholar] [CrossRef]
- Harkat, H.; Nascimento, J.; Bernardino, A.; Ahmed, H.F.T. Fire Images Classification Based on a Handcraft Approach. Expert Syst. Appl. 2023, 212, 118594. [Google Scholar] [CrossRef]
- Jong, A.; Yu, M.; Dhrafani, D.; Kailas, S.; Moon, B.; Sycara, K.; Scherer, S. WIT-UAS: A Wildland-Fire Infrared Thermal Dataset to Detect Crew Assets from Aerial Views. In Proceedings of the 2023 IEEE/RSJ International Conference on Intelligent Robots and Systems (IROS), Detroit, MI, USA, 1–5 October 2023; pp. 11464–11471. [Google Scholar]
- Ribeiro, T.; Silva, F.; Moreira, J.; Costa, R.L.d.C. Burned Area Semantic Segmentation: A Novel Dataset and Evaluation Using Convolutional Networks. ISPRS J. Photogramm. Remote Sens. 2023, 202, 565–580. [Google Scholar] [CrossRef]
- Yuan, J.; Wang, H.; Yang, T.; Su, Y.; Song, W.; Li, S.; Gong, W. Ff-Net: A Target Detection Method Tailored for Mid-to-Late Stages of Forest Fires in Complex Environments. Case Stud. Therm. Eng. 2024, 65, 105515. [Google Scholar] [CrossRef]
- Wang, M.; Yue, P.; Jiang, L.; Yu, D.; Tuo, T. An Open Flame and Smoke Detection Dataset for Deep Learning in Remote Sensing Based Fire Detection. Geo-Spat. Inf. Sci. 2024, 1–16. [Google Scholar] [CrossRef]
- Kirillov, A.; Mintun, E.; Ravi, N.; Mao, H.; Rolland, C.; Gustafson, L.; Xiao, T.; Whitehead, S.; Berg, A.C.; Lo, W.-Y. Segment Anything. In Proceedings of the IEEE/CVF International Conference on Computer Vision, Paris, France, 1–6 October 2023; pp. 4015–4026. [Google Scholar]
- Alexey, D. An Image is Worth 16 × 16 Words: Transformers for Image Recognition at Scale. arXiv 2020, arXiv:2010.11929. [Google Scholar]
- Xin, Y.; Luo, S.; Zhou, H.; Du, J.; Liu, X.; Fan, Y.; Li, Q. Dual Residual Networks Leveraging the Potential of Paired Operations for Image Restoration. In Proceedings of the 32nd IEEE/CVF Conference on Computer Vision and Pattern Recognition (CVPR), Long Beach, CA, USA, 15–20 June 2019; pp. 7000–7009. [Google Scholar]
- Xin, Y.; Luo, S.; Zhou, H.; Du, J.; Liu, X.; Fan, Y.; Li, Q.; Du, Y. Parameter-Efficient Fine-Tuning for Pre-Trained Vision Models: A Survey. arXiv 2024, arXiv:2402.02242. [Google Scholar]
- Wang, L.; Fang, S.; Meng, X.; Li, R. Improving Accuracy of Binary Neural Networks Using Unbalanced Activation Distribution. In Proceedings of the IEEE/CVF Conference on Computer Vision and Pattern Recognition (CVPR), Nashville, TN, USA, 20–25 June 2021; pp. 7858–7867. [Google Scholar]
- Wang, L.; Li, R.; Zhang, C.; Fang, S.; Duan, C.; Meng, X.; Atkinson, P.M. Building Extraction with Vision Transformer. IEEE Trans. Geosci. Remote Sens. 2022, 60, 1–11. [Google Scholar] [CrossRef]
- Wang, L.; Li, R.; Zhang, C.; Fang, S.; Duan, C.; Meng, X.; Atkinson, P.M. UNetFormer: A Unet-Like Transformer for Efficient Semantic Segmentation of Remote Sensing Urban Scene Imagery. ISPRS J. Photogramm. Remote Sens. 2022, 190, 196–214. [Google Scholar] [CrossRef]
- Xu, J.; Xiong, Z.; Bhattacharyya, S.P. PIDNet: A Real-Time Semantic Segmentation Network Inspired by PID Controllers. In Proceedings of the IEEE/CVF Conference on Computer Vision and Pattern Recognition (CVPR), Vancouver, BC, Canada, 17–24 June 2023; pp. 19529–19539. [Google Scholar]
- Hwang, G.; Jeong, J.; Lee, S.J. SFA-Net: Semantic Feature Adjustment Network for Remote Sensing Image Segmentation. Remote Sens. 2024, 16, 3278. [Google Scholar] [CrossRef]
Disclaimer/Publisher’s Note: The statements, opinions and data contained in all publications are solely those of the individual author(s) and contributor(s) and not of MDPI and/or the editor(s). MDPI and/or the editor(s) disclaim responsibility for any injury to people or property resulting from any ideas, methods, instructions or products referred to in the content. |
© 2025 by the authors. Licensee MDPI, Basel, Switzerland. This article is an open access article distributed under the terms and conditions of the Creative Commons Attribution (CC BY) license (https://creativecommons.org/licenses/by/4.0/).