1. Introduction
River morphology is among the most dynamic landscape features, making it essential to produce accurate datasets and topographic models for mapping. This precision is crucial for understanding links between processes, patterns, and spatiotemporal volumetric changes [
1,
2,
3]. In this context, drones have become invaluable, as their remote sensing capabilities, combined with traditional field surveys, now provide essential data sources in modern fluvial geomorphology. Floods are extreme weather events that pose a significant risk to human populations, causing substantial economic and personal losses [
4]. With the advent of climate change and changes in population demographics, these phenomena are becoming not only more frequent but also more severe, affecting larger populations [
5]. Studies show that up to 24% of the global population is exposed to flood risk [
6], and the United Nations Office for Disaster and Risk Reduction reported a total of 1.6 billion people affected by floods between 2000 and 2019 [
7]. Mediterranean Spain is an area of particular vulnerability where precipitation has augmented in recent years, and urbanisation processes have increased the number of people at risk [
8]. The most important flash floods in this area include the ones that occurred in October 1957 [
9] and November 2024 [
10], both in the Jucar River basin.
The increase in the severity and frequency of flood events necessitates comprehensive and proactive measures to mitigate their impact. One crucial strategy for reducing the risks associated with flooding is the proper maintenance of river areas. This includes adequate management of woody debris, all while striving to maintain biodiversity and minimise negative impacts on surrounding ecosystems. Despite its potentially hazardous effects, woody debris is an important element of the stream ecosystem and provides essential habitats for different species. Therefore, effective river management is a delicate balance between human safety and environmental conservation [
11,
12,
13].
Woody debris, which includes wooden parts and logs from fallen trees, often accumulates in river currents, particularly following storm events. This accumulation can lead to the formation of log jams, which obstruct the natural flow of water. When water is unable to flow freely, it can lead to the flooding of larger areas as it backs up behind the obstruction. Additionally, these log jams can suddenly collapse, releasing the pent-up water and creating powerful, destructive currents downstream. Lastly, the accumulation of wood close to bridges and weirs can increase the risk of infrastructure collapse [
14]. Other authors suggest that large woody debris jams can help mitigate the impact of floods as they reduce flow speed [
15].
Although the removal of woody debris is not always the optimal solution, the accumulation of wood needs to be taken into account when generating risk assessment models [
13,
16]. Despite its importance, knowledge of wood transport dynamics along rivers is still very limited [
17], and this information is usually not included in the hydrological models [
16]. Locating and quantifying debris along large segments of rivers presents a significant challenge. The traditional method involves visual inspection, which requires traversing the length of the river. This process is time-consuming and carries inherent risks, as riverbanks are often difficult to access.
To improve the efficiency and safety of this task, innovative approaches and technologies are being explored. Remote sensing technologies, such as aerial drones equipped with cameras and sensors, offer a promising solution. These drones can fly over river areas, capturing high-resolution images and data that can be analysed to identify potential blockages. In some cases, a similar approach is applied to quantify forest woody debris [
18]. This method significantly reduces the time required for inspections and minimises the risk to personnel.
Another approach involves the use of satellite imagery and advanced data analysis techniques. By analysing changes in river flow patterns and surface characteristics, potential log jams and debris accumulations can be detected from space. However, satellite imagery does not provide enough spatial information for dealing with woody debris and a detailed recording of the hydraulic infrastructures along the rivers.
Terrestrial approaches for river monitoring have also been applied; however, the difficulty of visualising the river due to vegetation and the large areas that require monitoring are important challenges. One solution is using mobile mapping systems (MMS) mounted on all-terrain amphibious vehicles [
19]. This methodology is faster than the terrestrial laser scanner with tripod setups but it still involves very specific equipment, and high cost, all-terrain vehicles can also have negative impacts on the ecosystems [
20]. Backpack-mounted MMS [
21] and LiDAR [
22] can also be used; however, they are limited to small areas. Other studies use shipborne methods, such as controlled mini-boats with attached sensors [
23], but this approach requires more specific equipment and a continuous river flow with a minimum depth.
In order to process large quantities of data from large river sections, artificial intelligence (AI) and computer vision (CV) integrated onboard drones are the most promising solutions for the automatic surveillance and maintenance of river basins. Some works in this direction include the detection of debris from terrestrial video at fixed locations [
24,
25]. For instance, ref. [
26] uses CV and AI (i.e., YOLOv4 and Faster R-CNN) to detect flood borne elements in terrestrial images. The combination of aerial drones and CV is used in river management for the detection of plastics [
27], and in other studies for mapping woody debris without automatic detection procedures [
28].
In this work, we present a methodology that employs AI and CV to detect and segment woody debris in rivers, using aerial drone images. The tool then assigns a risk level to each detection based on the percentage of river width affected. When an orthoimage is used as input, the tool provides the coordinates of each detection along with a final report containing relevant information for end-users.
As a result, this tool allows the processing of large river areas in a fast and automatic manner, enabling the monitoring of large and inaccessible river basin areas, providing early warnings and facilitating intervention planning.
This paper has been structured as follows: after this introduction, the methodology of the tool is described, including the aerial drone data acquisition, photogrammetric process, debris detection, and risk assessment for the detected elements. Subsequently, an experimental process is presented, where the tool is tested with real-world data, and the corresponding results are analysed and discussed. Finally, the paper concludes with a summary of the findings and relevant conclusions.
2. Materials and Methods
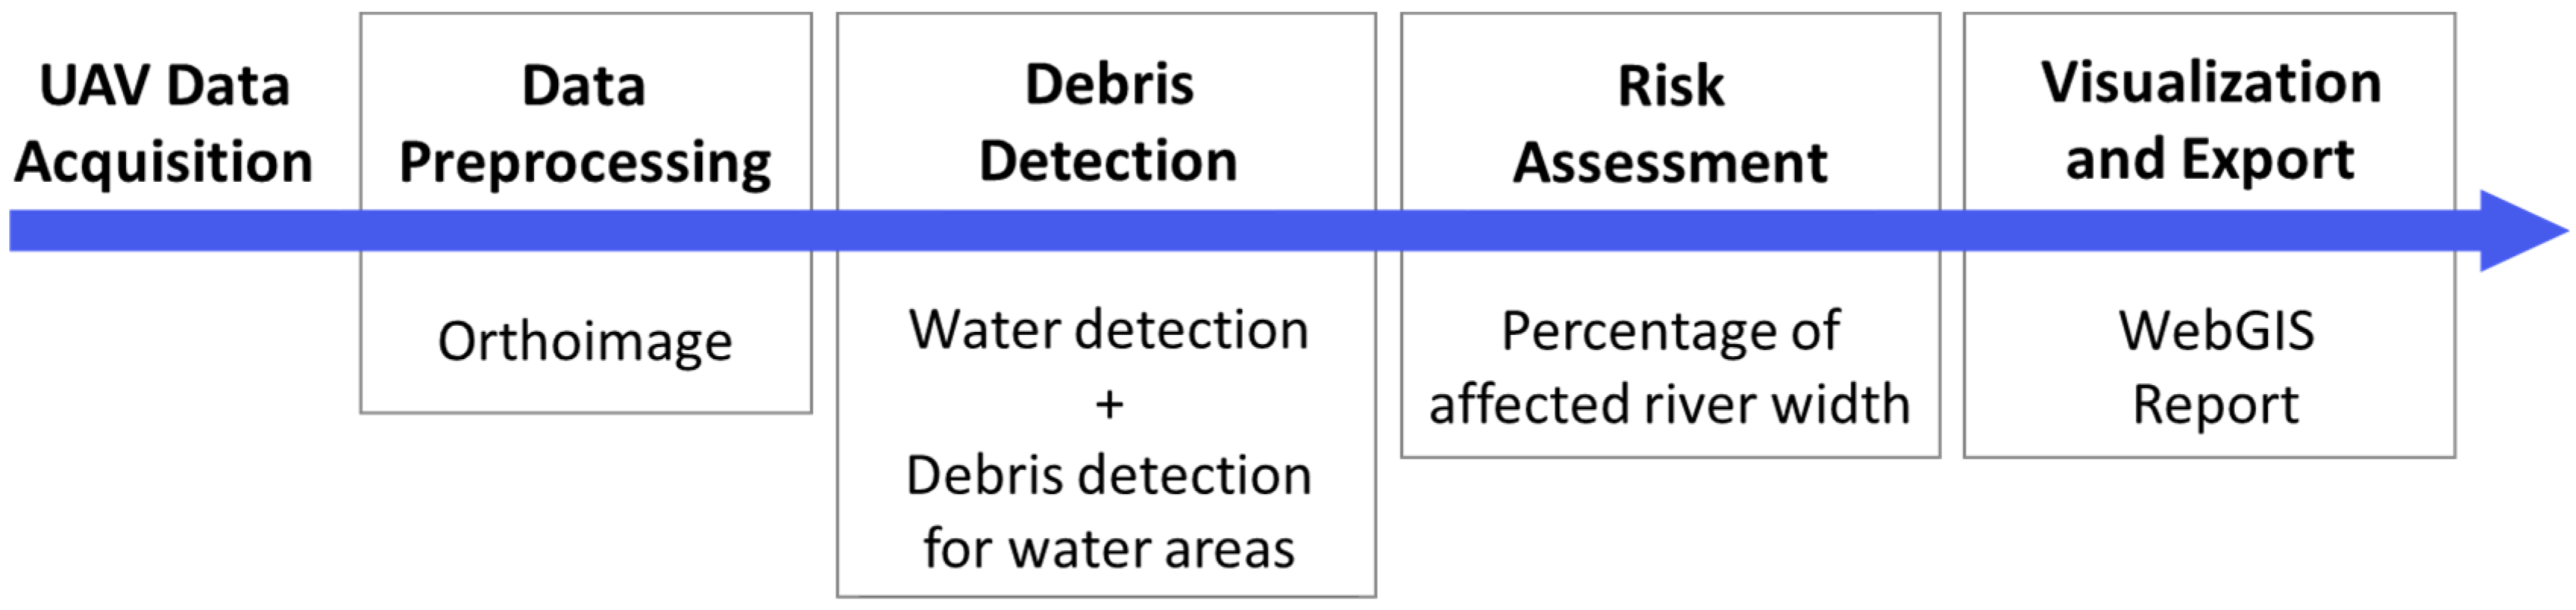
The methodology requires a photogrammetric flight and photogrammetric processing. RGB images are collected using an aerial drone, and the usual photogrammetric processes are carried out using open-source software to generate the cartographic products, particularly the orthoimage that is used in the process. This is followed by debris detection, which includes identifying water areas and locating debris within those areas. A risk assessment is then performed for each detected element by calculating the affected river width. Finally, the results are visualised through a WebGIS platform and a comprehensive report. The workflow is shown in
Figure 1.
2.1. Challenges and Requirements
Detecting woody debris and providing end users with a useful tool for river basin monitoring involves several challenges:
Large river areas need to be covered efficiently, providing a geolocation of woody debris with submetric accuracy.
Woody debris exhibits high variability, varying from small branches to log jams covering large areas.
Woody debris can also be found outside of river channels, where it does not directly impact the current; however, it poses a potential risk if water flow increases.
The risk associated with woody debris is not solely dependent on simple parameters such as the size. Therefore, individual detection should be assessed using multiple factors, such as the location and percentage of covered river width.
As a result of these challenges, the following requirements are identified:
A methodology for efficient data acquisition and preprocessing needs to be defined, including the aerial drone and camera requirements, as well as the photogrammetric work to be carried out. The whole process should be covered using open-source software.
Woody debris detection should cover as much variability as possible, applying to different backgrounds. The tool should also have the potential to be adapted to specific areas or updated if required.
The detection area should be confined to the river and its immediate edges.
A methodology for risk assessment needs to be implemented. The calculated risk should take into account the real affectation of the river and provide the final user with information useful and easy to understand, which can effectively inform decision-making processes.
2.2. Drone Platform and Sensors
Aerial drones are an effective alternative for collecting data over large areas. They can reduce acquisition time and risks to technicians, particularly in hard-to-reach places or hostile environments.
Selecting the appropriate drone type, sensors, and flight plan is vital for achieving accurate results in woody debris detection. For this application, a fixed-wing drone is recommended. These fixed-wing drones offer several advantages over multirotor drones. First, they are more efficient and can cover large areas, such as long stretches of rivers, in less time and with lower battery consumption. Additionally, the noise produced by these fixed-wing drones is low in comparison to rotor-based drones, which is particularly beneficial when operating in natural environments.
The fixed-wing drone must be equipped with an RGB sensor, and the flight height should allow for capturing images with a maximum ground sampling distance (GSD) of 0.25 m. Cameras with a wide field of view (FOV) and a large sensor size should be prioritised. To obtain accurate photogrammetric data, the camera should have a full-frame sensor, and the pixel size should be smaller than 4 µm.
For image georeferencing, it is recommended to use a real-time kinematic (RTK) setup to achieve centimetre-level accuracy. However, modern drones are usually equipped with GNSS capable of providing submetric accuracy, which is often sufficient for the tool’s objective of estimating the approximate position of the woody debris. It is also important to consider that the debris is prone to movement, so achieving higher positional accuracy would not necessarily offer significant advantages. Ground control points (GCPs) are not required unless a higher precision is necessary.
2.3. Data Acquisition
The flight plan consists of strips along the monitored river. For narrow, small rivers, a single strip can be sufficient, while wider rivers could require two strips. Images should be captured with a nadiral orientation. The recommended forward overlap is 80%, and for wider rivers, the side overlap should exceed 50%. It is important to ensure that each image contains some land features, as images that cover only water lack distinctive features, making the subsequent matching and photogrammetric processing difficult. This can be achieved by increasing the GSD (while maintaining a maximum of 0.25 m/pixel), increasing the FOV of the sensor, or increasing the number of strips.
For large river sections that cannot be covered in a single flight, it is recommended to perform two flights from each take-off location, flying in opposite directions (upstream and downstream), so the number of take-off/landing locations is minimised. It is also recommended to fly during the central hours of the day to optimise lighting and minimise shadows or sun glint effects [
29].
2.4. Data Preprocessing
Accurate geographic information from the images is essential for subsequent analysis. In this case, an orthoimage derived from aerial drone data is used as the input for the woody debris detection process. An orthoimage, which is a geometrically corrected and georeferenced aerial image with a uniform scale, provides high geometric precision and geolocation properties. Georeferencing enables the precise retrieval of geographic coordinates for any detected element in the image.
Different photogrammetric tools are available for processing aerial images, with many of the options being proprietary. In this case, we propose the use of GRAPHOS [
30], an open-source tool. Additionally, GRAPHOS is integrated as a node, called NodeGraphos within OpenDroneMap (ODM) (
https://www.opendronemap.org/, accessed on 4 November 2024). ODM is a command line toolkit for aerial image processing. ODM includes NodeODM, a lightweight interface and an application program interface (API) where new developments can be built, and WebODM, which adds extra functions and allows for the processing of the nodes. WebODM is a widely used open-source photogrammetry suite supported by an active community of contributors (
https://github.com/OpenDroneMap/WebODM/, accessed on 4 November 2024) [
31,
32].
NodeGraphos follows a photogrammetric pipeline consisting of (i) image preprocessing, (ii) feature extraction and matching, (iii) self-calibration and bundle adjustment, (iv) dense image matching, and (v) quality control. The software requires user interaction at each step, and the results benefit from user expertise and parameter tuning; however, some default parameters can be applied, allowing automatic use for non-expert users. Detailed information of the tool can be found in [
28] and the repository page
https://github.com/TIDOP-USAL/graphos, accessed on 16 December 2024, where the desktop version of the software is also available.
The input for nodeGraphos processing is the obtained drone images and the image positioning data obtained by the Pixhawk. The processing produced several outputs, including the point cloud, digital terrain model (DTM), and the camera self-calibration parameters. However, for this application, only the orthoimage is required.
2.5. Data Postprocessing
This step involves debris detection using AI, including a subprocess for water detection and the assessment of risk for the detected elements. The workflow can be visualised in
Figure 1. This post-processing step was implemented in Python 3.6, and the resulting tool was deployed on a WebGIS, based on PHP 8.1 and JavaScript, and a cloud computing platform using Docker 4.29.
2.5.1. Water Detection
The water detection process is performed to constrain woody debris detection to a specific river area. Fallen trees and branches are also common in dry areas and share similar characteristics with those in rivers. Therefore, isolating water areas is a crucial step to improve the model accuracy and potentially reduce the number of false positives.
Watercourse detection was conducted using U-Net [
33]. U-Net is a convolutional neural network architecture designed for image segmentation. It consists of an encoder–decoder structure, where the encoder captures context through downsampling, and the decoder enables precise localisation via upsampling and skip connections. U-Net is capable of producing high-resolution segmentation maps with accurate boundary delineation. The model is widely used in computer vision tasks and medical imaging. The U-Net architecture can be configured with different backbones, the feature extraction components used in the encoder to capture contextual information from input images. Since different configurations work better for specific applications, evaluating the model is essential to identify the best approach. In this case, an EfficientNet-B0 [
34] backbone was chosen as the best-performing alternative.
A training dataset was generated by collecting a total of 1932 aerial images from diverse sources, including Google Earth and drone flights. Best practices for model training were applied by including a wide range of backgrounds in order to represent different water surface characteristics. The training dataset was manually segmented with Roboflow Version 1.0 [
35] using the smart polygon tool, based on the Segment Anything Model [
36], and the polygons were refined manually when required. Two classes are defined: water and non-water.
Image resolution is crucial for segmentation, as higher resolution increases computational cost without always improving accuracy. An optimal GSD of approximately 0.25 m/pixel was identified, achieving an area under the curve (AUC) of 0.96 during testing, which is considered suitable for river segmentation. After training, the orthoimage was resized to 0.25 m/pixel GSD. The images were divided into 128 × 128 pixel tiles. This tile size was selected after conducting several tests to determine the optimal balance between computational efficiency and model performance. Larger tiles would require significantly higher computational resources, particularly in terms of memory consumption. Smaller tiles could lead to increased edge artefacts due to the loss of continuity between adjacent tiles. The chosen 128 × 128 size was found to maintain manageable memory requirements while minimising edge noise. Individual masks were obtained for each tile, and the masks were then combined into a single mask for the entire area. To address noise and small errors, a morphological filter was applied, and unconnected water areas smaller than 10 m² were removed, as they were irrelevant for monitoring.
2.5.2. Woody Debris Detection
Detecting woody debris is fundamentally an object detection challenge within images. Moreover, accurately segmenting these detections provides valuable additional information, facilitating the evaluation of debris size and associated risk. The segmentation was carried out using YOLOv8-seg [
37]. YOLOv8-seg is a segmentation model based on the YOLO (You Only Look Once) architecture. It uses a unified encoder–decoder structure, where the encoder (backbone) extracts multi-scale features, and the decoder generates segmentation masks and object detection outputs. The model includes advanced backbones like CSPDarknet to enhance feature representation and achieve high accuracy and speed.
Dataset Preparation
Due to the high variability of woody debris, it is important to generate a variate dataset, one that englobes the diversity of woody debris, as well as the different backgrounds and ecosystems where it can be located. A dataset with a total of 1977 images was generated. The majority of them (approximately 1700 images) were obtained from Google Earth using the historical image dataset. Google Earth images have different resolutions and quality; only those with higher resolution were added. Other images are fragments of orthoimages obtained by drone, as well as open images from different platforms. The dataset comprises images from very different locations and ecosystems around the globe, trying to represent the whole variability of woody debris.
Images were manually normalised in shape, while keeping an approximate GSD of 0.25 m/pixel for all of them. The GSD is an approximation for these training images, as in many cases, they lack accurate metric information. After the shape normalisation, water was masked out using the previously developed U-Net model, and the debris was manually segmented and labelled using Roboflow.
The chosen GSD was optimised for detecting medium and large debris, balancing computational efficiency and accuracy while ignoring smaller elements. Testing higher resolutions showed no improvements, partly due to the limited availability of high-resolution data for creating a suitable training dataset.
Model Training and Validation
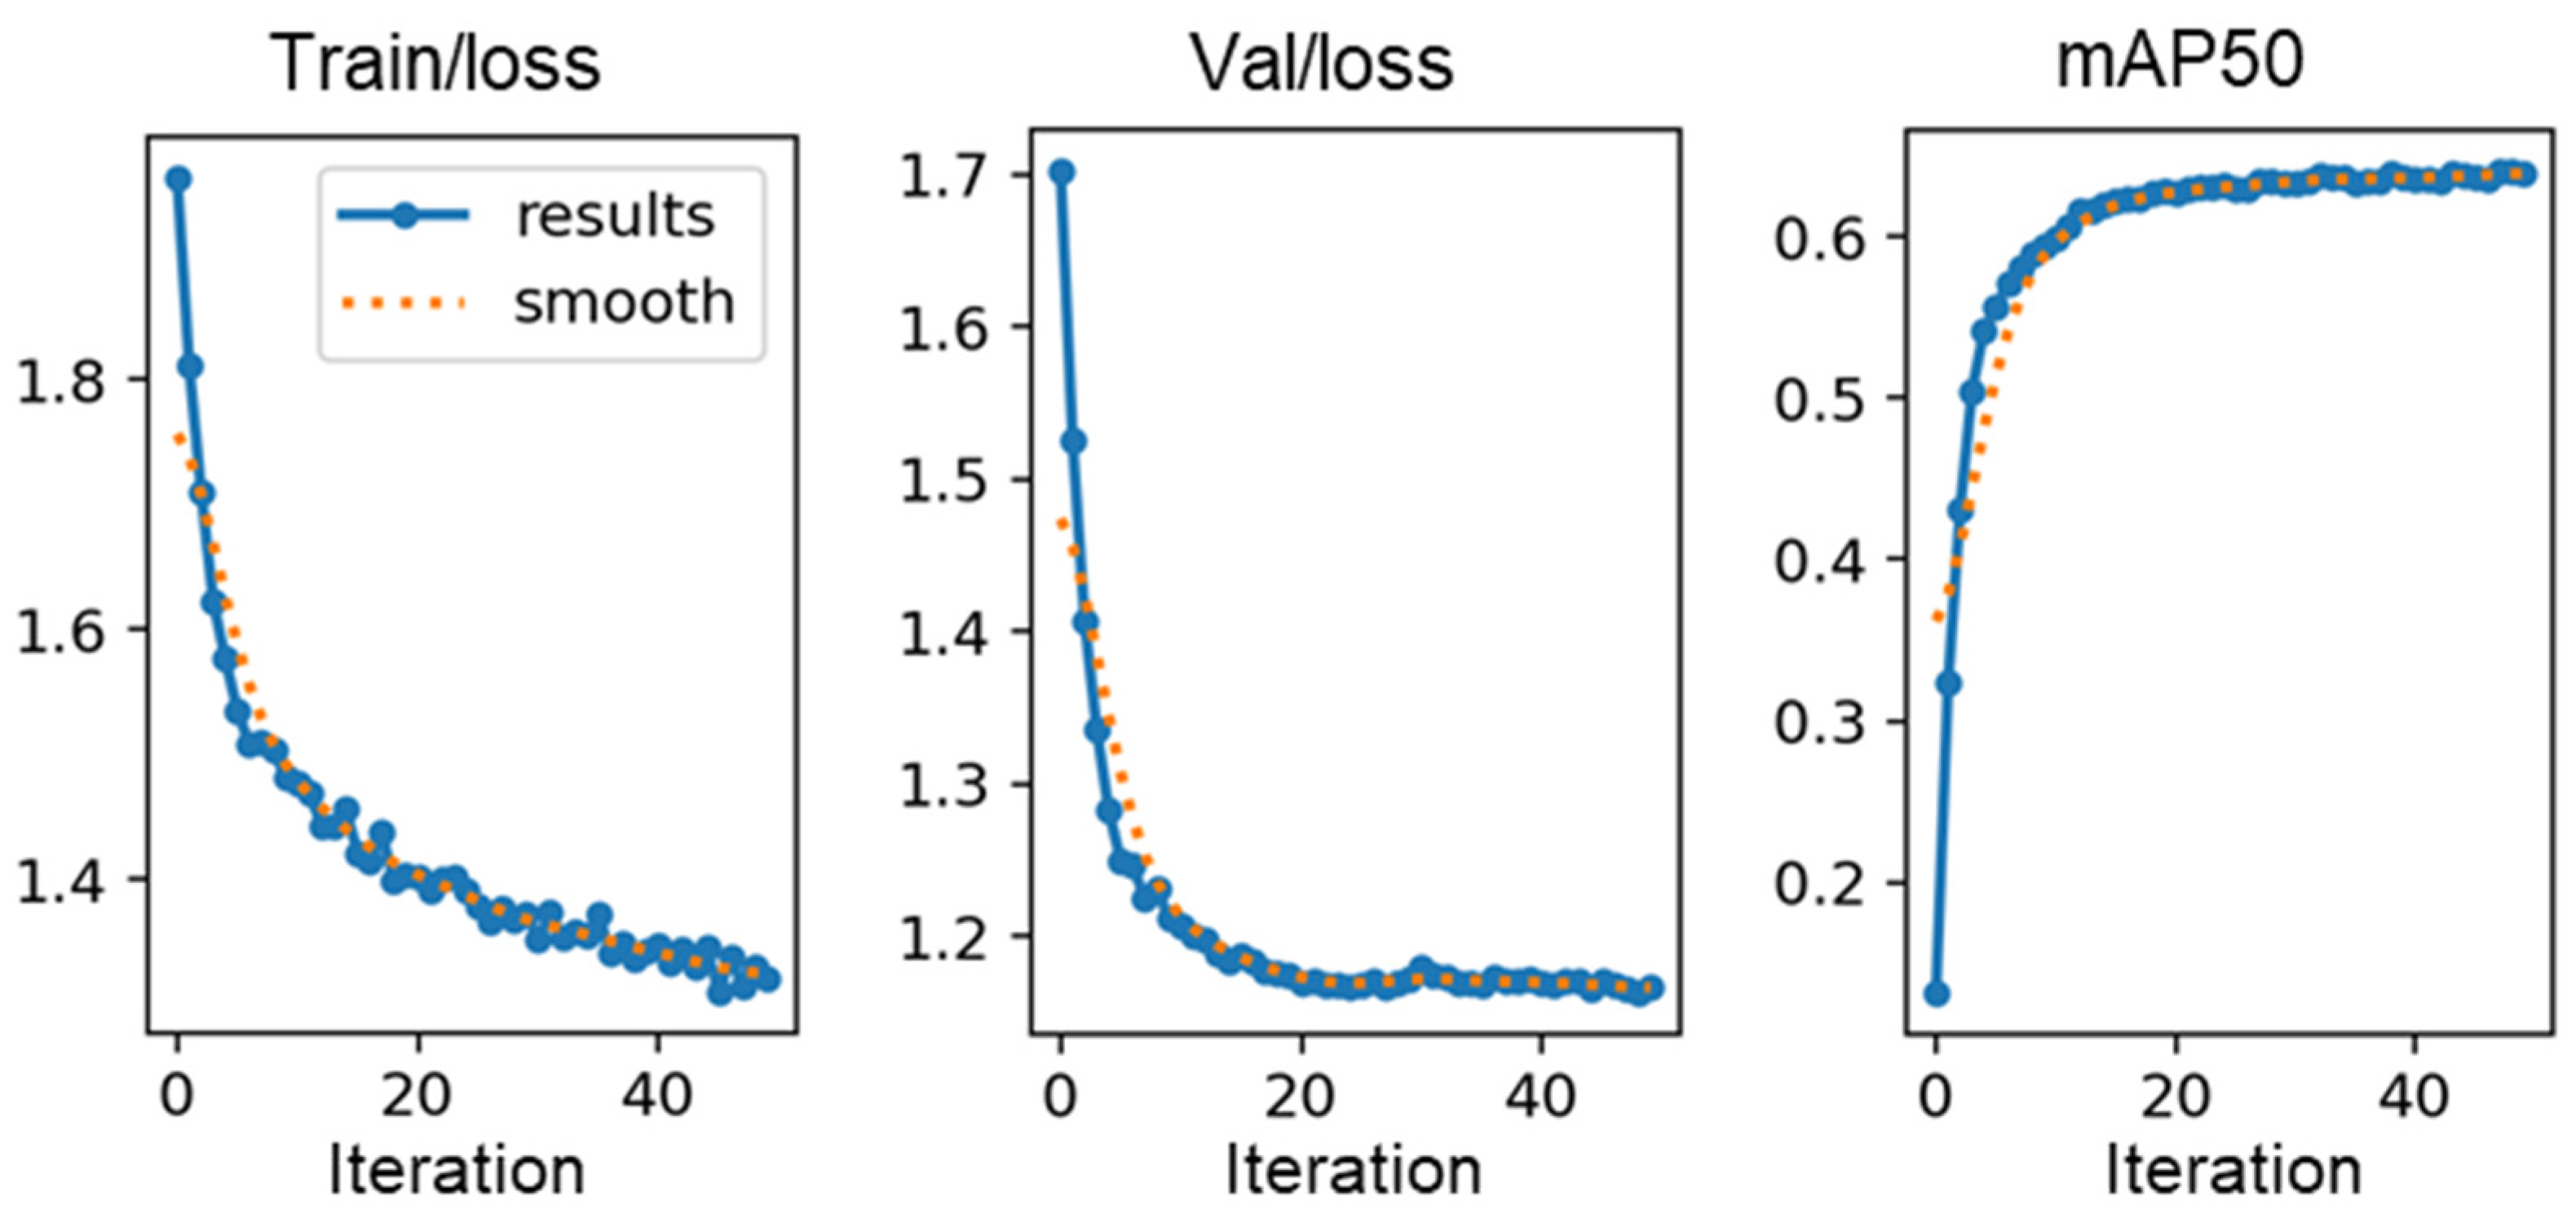
Among the various YOLOv8 versions, YOLOv8x-seg yields the best results. Model parameter tuning was carried out using Ray Tune (
https://docs.ray.io/en/latest/tune/index.html, accessed on 3 June 2024). The dataset was split into training, validation, and test, and the model was trained for 50 epochs with an initial learning rate of 0.0001 (
Figure 2).
The correct validation of model training is the use of a random sample of the dataset, not previously used for training or validation. In this case, given the variability of the training dataset, as well as the low quality of some of the images (i.e., Google Earth images are obtained by satellite or flights, resulting, in some cases, in suboptimal GSD, noise, or unsuitable conditions for this specific application), a second validation was carried out, using only a subset of optimal aerial drone images. For the initial validation using the whole test dataset, the mean average precision at a 50% threshold (mAP50) was 0.64. For the second validation using optimal images, an improvement of the results was obtained with an mAP50 of 0.77.
Detection Process
Detection was performed on water-masked orthoimages at a GSD of 0.25 m/pixel. To address YOLO’s limitations with large images and small object detection, image slicing was implemented. Slicing aided hyper inference (SAHI) [
38] is a slicing-aided inference and fine-tuning pipeline for small object detection. This pipeline can be applied to different object detection and image segmentation models. The authors of the tool report improvements in average precision (AP) of up to 20% for the detection of small objects with some models, especially when combined with slicing-aided fine-tuning and tile overlapping. The methodology allows for combining the improvements of using high-resolution images while keeping low memory requirements. Each slice was set to a size of 1080 × 1080 pixels with an overlap of 20%.
The output of this process consists of a list of detections for the whole image, represented as polygons in image coordinates and stored in YOLO format, each accompanied by a confidence score. This approach ensures compatibility with large-dimension orthoimages, making it suitable for real-world applications.
2.5.3. Risk Assessment
A key capability of this tool is its ability to assess the risk associated with each detected woody debris element. Accurate risk assessment supports decision-making processes and enables efficient on-site actions, such as the removal of high-risk debris. Automating this risk assessment significantly reduces manual processing time, offering a faster and more objective tool. When river current increases, different debris elements present varying levels of risk. Specifically, woody debris blocking a large portion of the river significantly increases the risk of flooding and structural damage to nearby infrastructure. In contrast, objects that only partially obstruct the flow pose a comparatively lower threat. Additionally, the size and location of debris influence the severity of the risk. For example, log jams near bridges represent a major hazard due to their potential to damage these structures directly or create risky blockage areas.
The process of risk assessment is divided into two steps. First, the river axis is determined. Second, the affected width is calculated for each debris element.
Affected River Width Calculation
Once the river axis was determined, the risk assessment for each woody debris element was conducted automatically using the following approach:
Firstly, a checking for full division was carried out (
Figure 4): Two binary images were generated by modifying the original water mask. In the first image, the debris was considered as water, representing the state of the river without debris interference (
Figure 4b); in the second image, the debris was treated as non-water (
Figure 4c). The number of unconnected water elements was counted in both images. If the second image showed more disconnected water elements than the image without debris, this indicates the debris was fully dividing the river’s flow. In such cases, the affected river width ratio was set to 1.
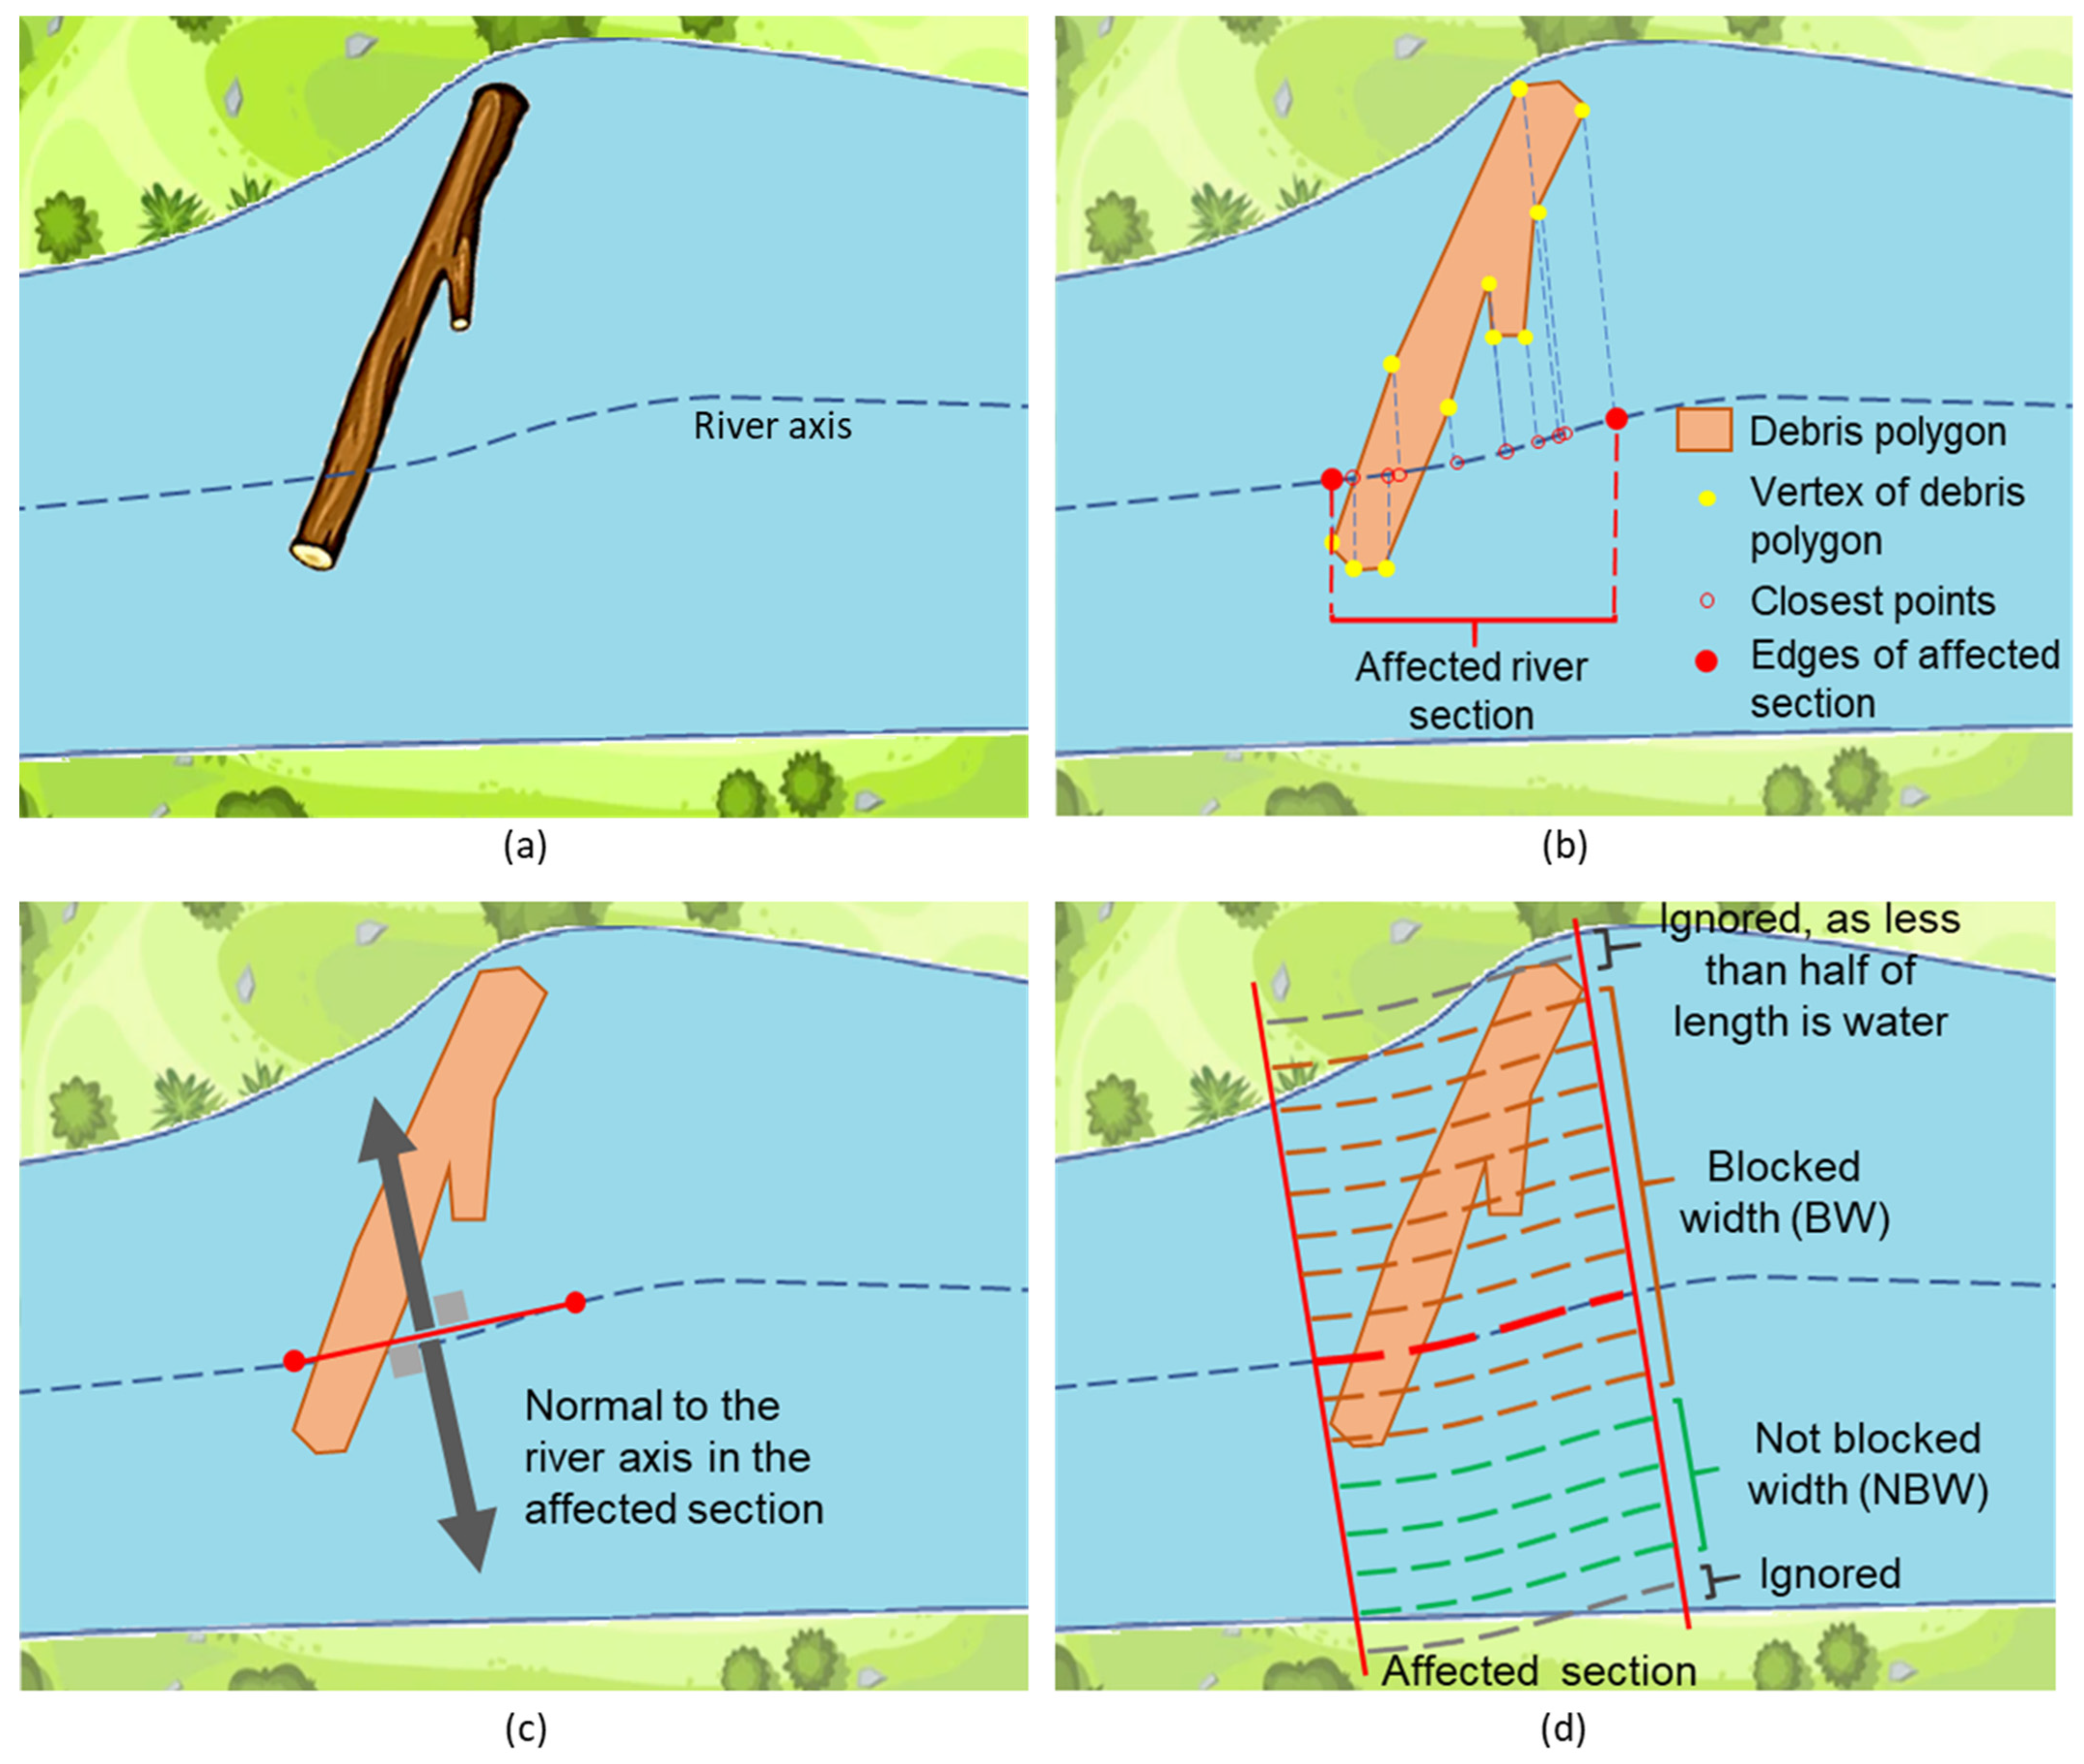
If the debris element did not divide the water area, then the process continued to determine the affected river width following the subsequent approach (
Figure 5):
Determination of affected river section: For each point of the debris polygon, the closest point of the river axis was determined. The affected section was determined as the segment between the furthest points (
Figure 5b).
Calculation of the normal to the river in the affected section (
Figure 5c): The edges of the affected section were identified, and the normal to the river section was calculated as perpendicular to the line connecting these edges.
Determining the affected width: The axis section was translated pixel-by-pixel in both directions, generating lines parallel to the river axis. For each pixel along this parallel line (represented as discontinuous lines in
Figure 5d), it was determined whether it was water, debris, or none. Each line was assessed to see if it was fully unblocked (all water) or partially obstructed by debris. The process continued until no water pixels were found along a line. Lines with more than half of their pixels classified as “none” were excluded from the calculation (
Figure 5d).
Calculating the obstruction ratio (OR): The obstruction ratio was calculated as the percentage of parallel lines that were blocked by debris (blocked width, BW) relative to the total number of lines considered, calculated as the sum of lines obstructed by debris and the lines non-blocked by debris (non-blocked width, NBW):
The risk to each woody debris was assigned as (i) High: ratio ≥ 0.7; (ii) Medium: 0.7 > ratio ≥ 0.3; (iii) Low: ratio < 0.3.
The output for the risk analysis contained the following data for each detection:
Coordinates of the polygon in the WGS84 coordinate system, provided in well-known text (WKT) format.
Ratio of river width affected.
Risk.
Confidence interval for the detection.
Area of the woody debris in squared meters.
3. Experimental Results
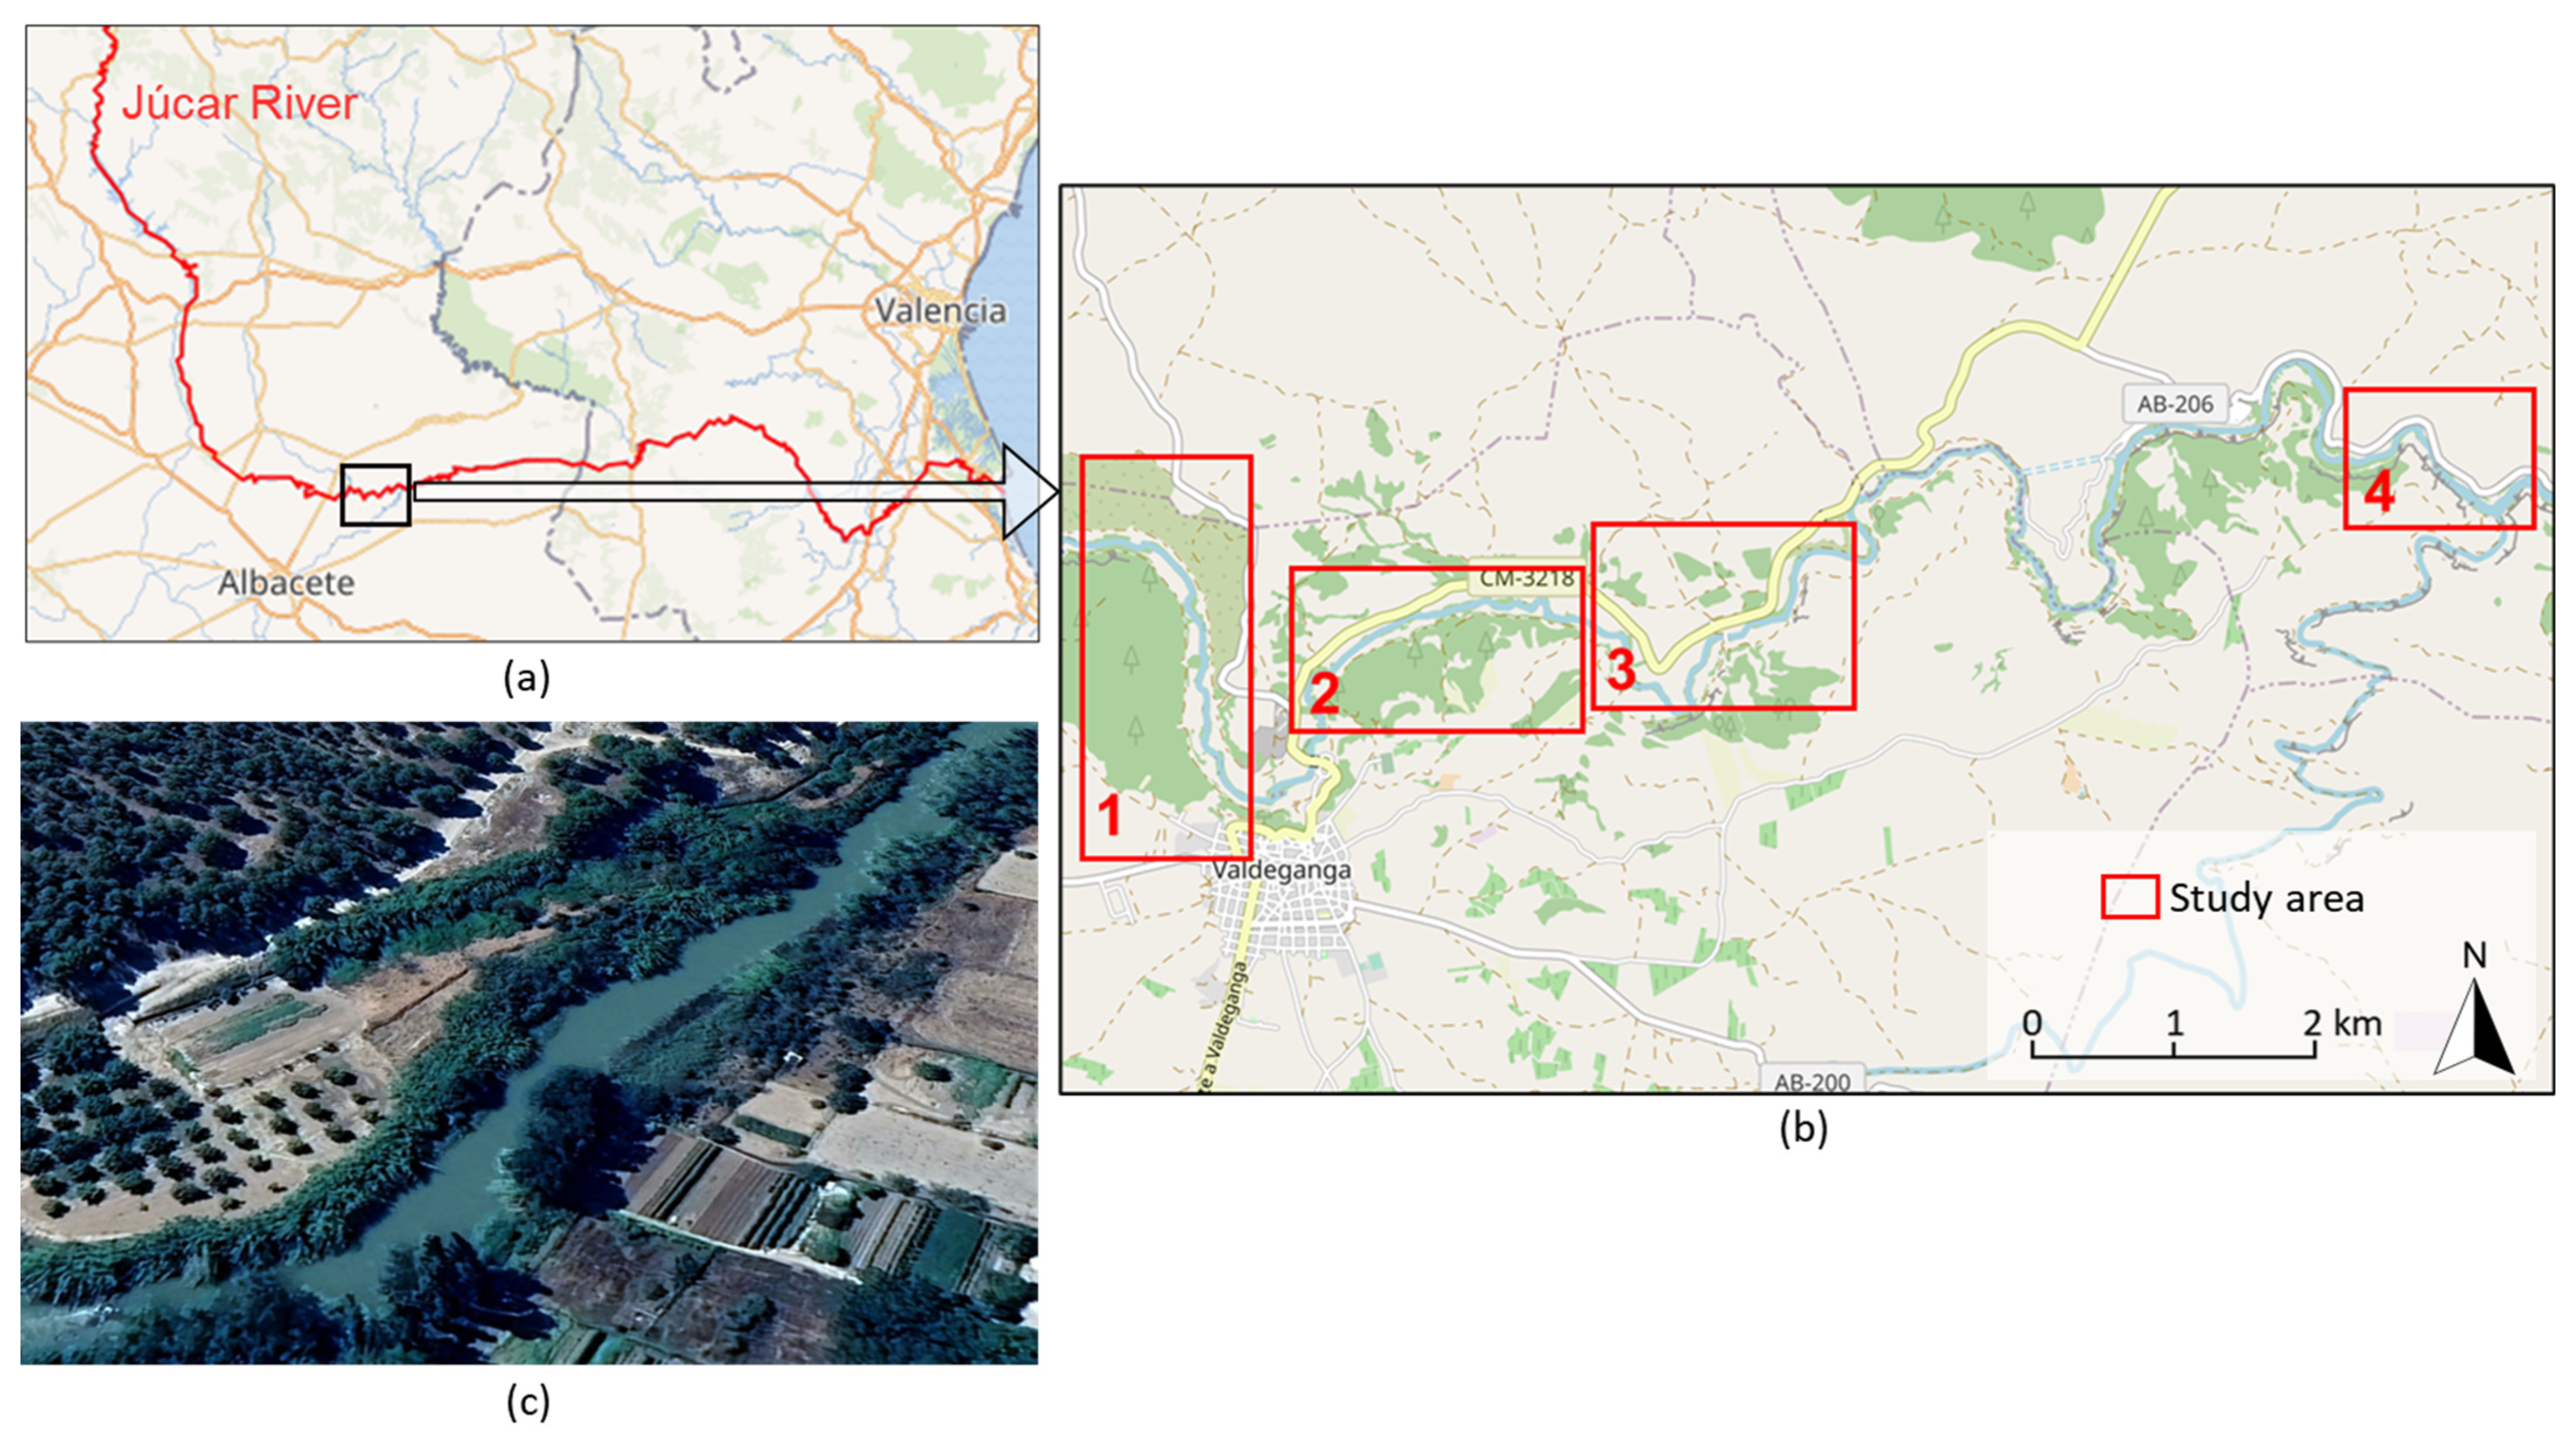
3.1. Study Area
The aerial-drone-based tool was validated using the Júcar River as the pilot area (
Figure 6). The study area is predominantly flat, with the river bordered by trees and farmland (
Figure 6c). The Júcar River was selected due to the presence of woody debris and its hydrological significance. The region experiences recurring multiannual droughts and frequent floods, which makes river monitoring an important task. Four specific zones (
Figure 6b) were selected for validation due to the presence of woody debris.
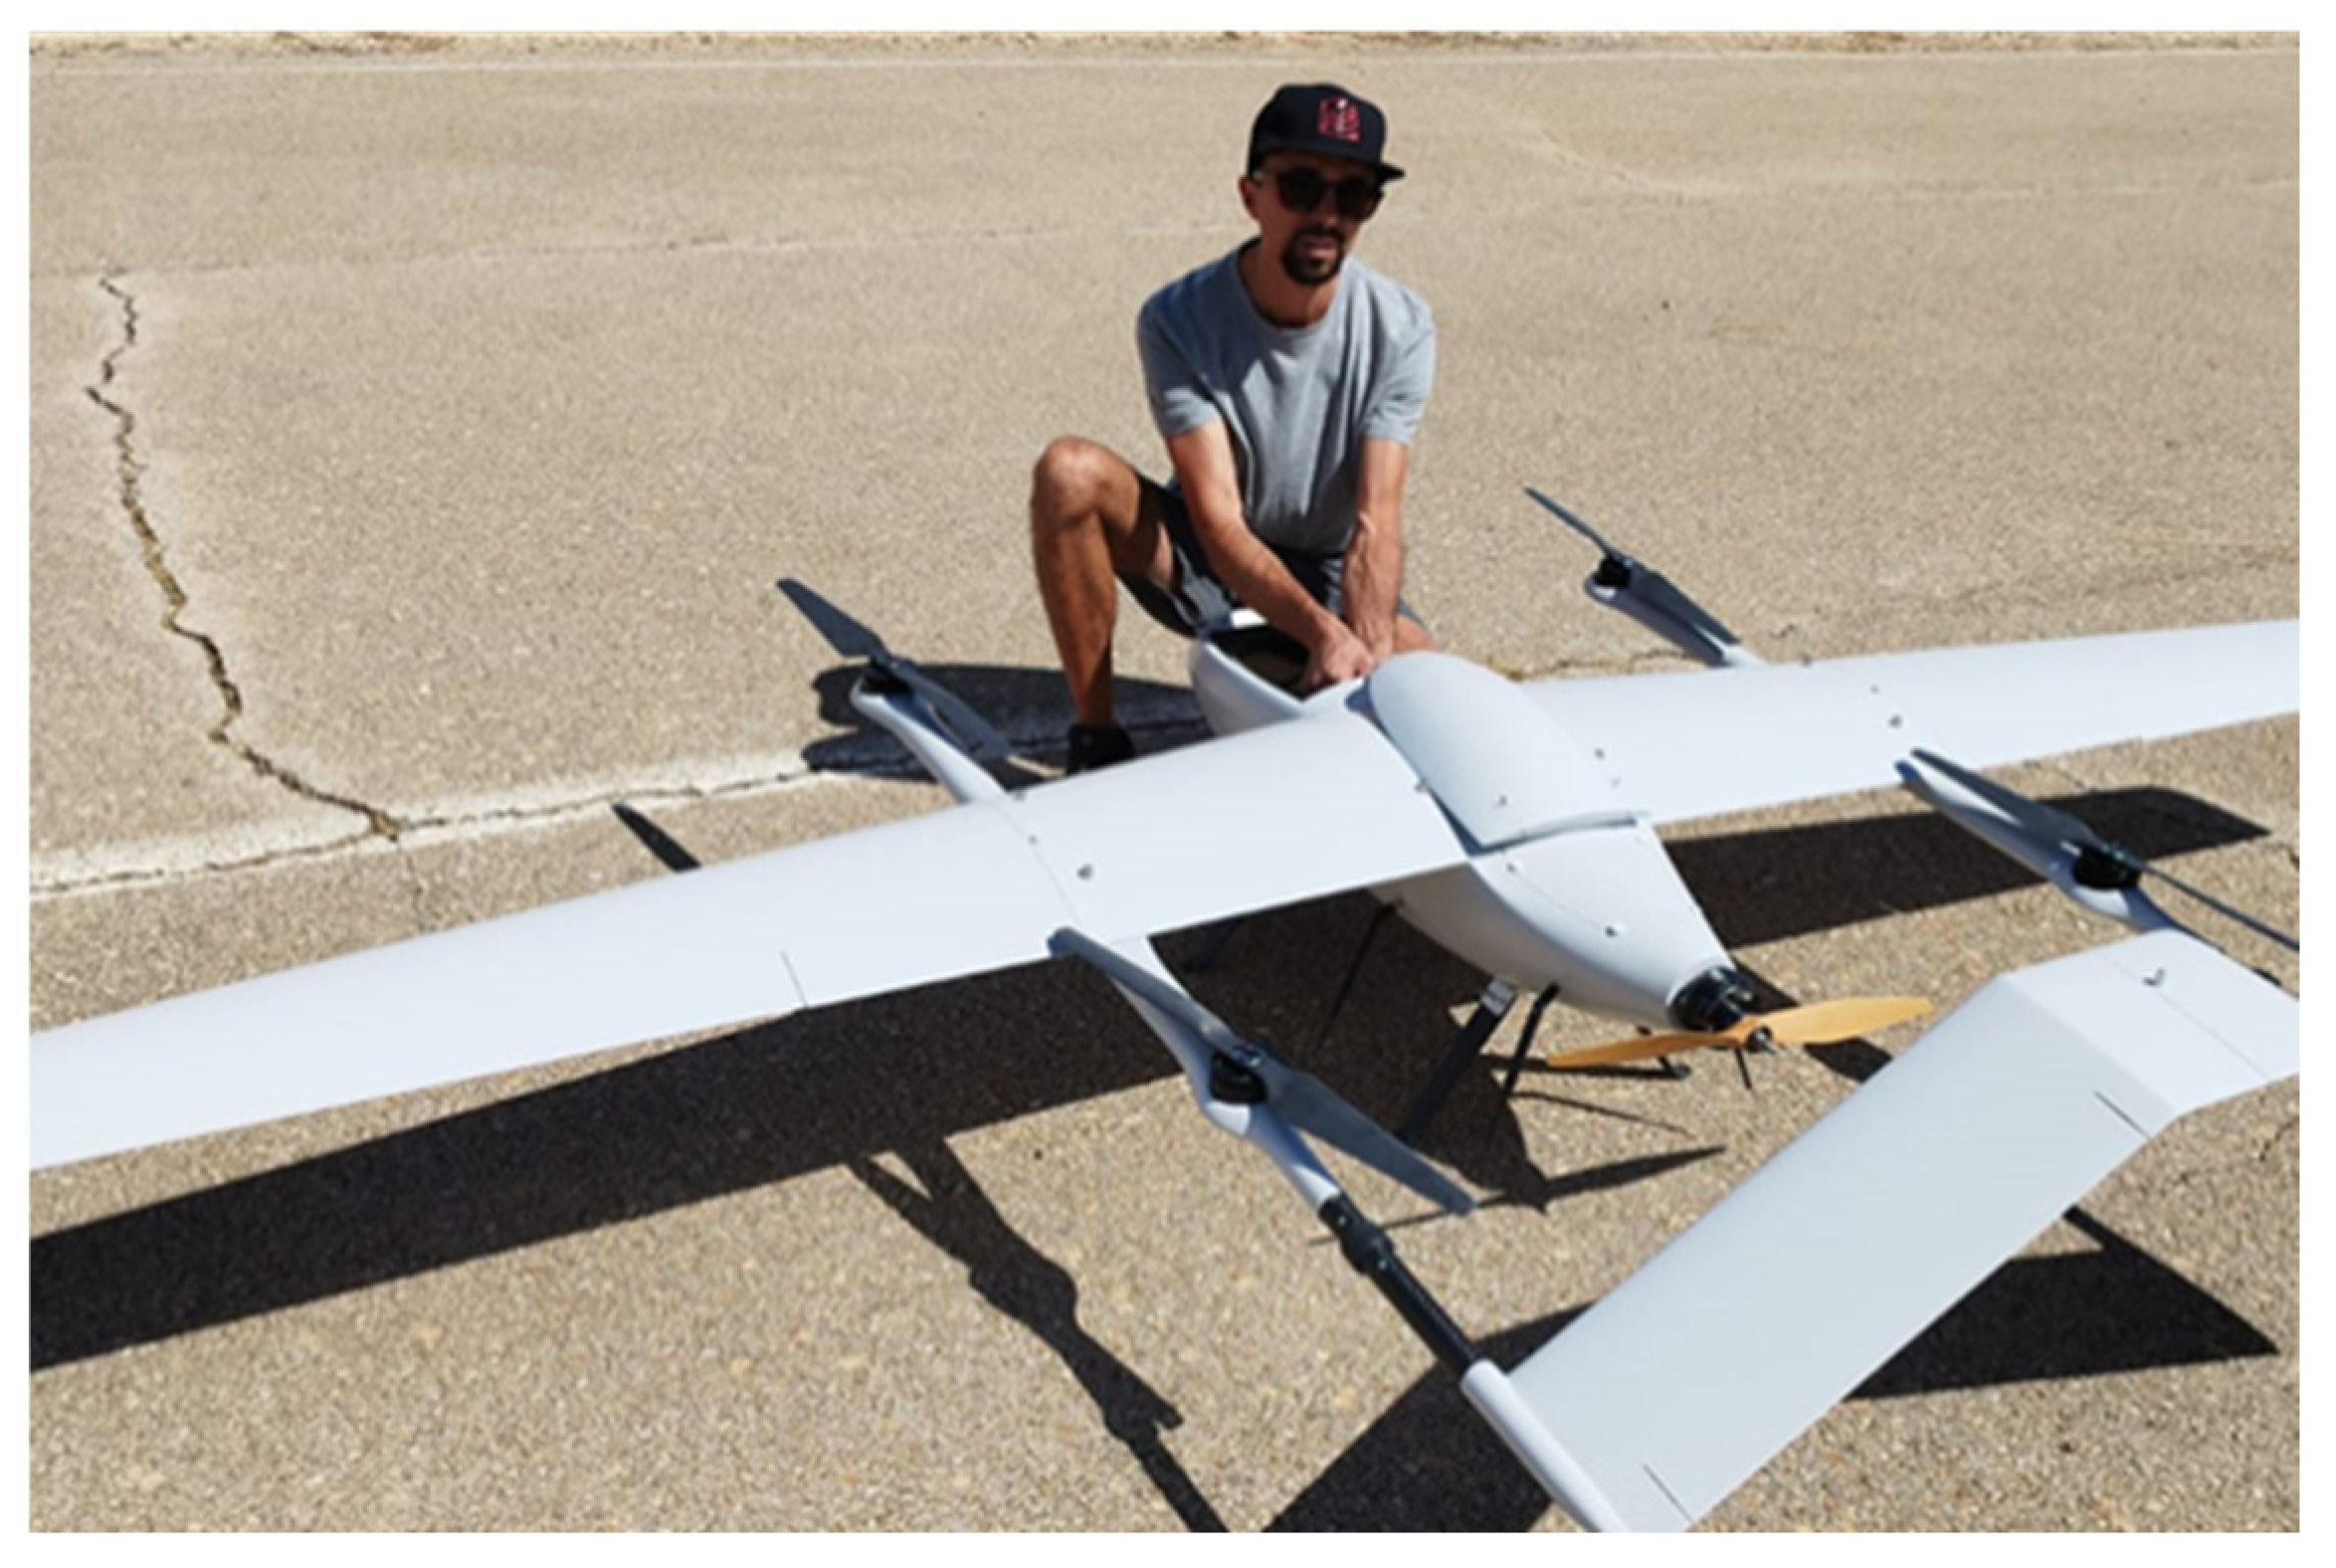
3.2. Drone Acquisition Campaign
For aerial drone data acquisition, a Foxtech Great Shark 330 VTOL (Tianjin, China) (
Figure 7) with a 3 kg payload was employed. This fixed-wing drone was equipped with a Pixhawk 2.1 control system, a Holybro M9N GPS module, and a Canon 5DS R RGB camera (Tokyo, Japan) with a 20 mm focal length. The characteristics of the drone are detailed in
Table 1, while the characteristics of the camera are listed in
Table 2.
A flight was carried out for each of the four locations, covering segments of the river ranging from 1600 to 2250 m (
Table 3). The mean flight height was 100 m in every case, and the approximate GSD was 2 cm/pixel. The forward overlap was set to 80%, and the side overlap to 60%.
All flights were conducted on two consecutive days during the midday hours, when illumination was optimal. This timing is particularly important for capturing clear views of the river, which is bordered by trees and vegetation that can cast shadows. Optimal lighting reduces shadow interference, ensuring better visibility of the river and its surroundings.
The flight plan for zone 1 is presented in
Figure 8; it covers a river segment of approximately 2200 m, and 312 images were captured over a flight distance of 4639 m. At a mean flight speed of 15 m/s, the flight time was slightly below 5 min.
According to drone flight regulations, the flight height must not exceed 120 m to ensure safe operation and avoid conflicts with manned aircrafts. For the used camera, Canon 5 DS R, and a focal length of 20 mm, the mean height was set to 100 m, obtaining a mean GSD of 2 cm/pixel. This resolution is much higher than that required for the present application; therefore, using a lens with a shorter focal length or a sensor with a smaller size could be suitable for data acquisition.
The use of GCPs was not required because the drone was equipped with an RTK GNSS system. This system provides positioning accuracy within a few centimetres, which is sufficient for this application.
The georeferencing of images and flight control were carried out using Pixhawk. During the flight, the trigger events were recorded by the control unit in the Pixhawk. This unit processes the GNSS positioning data with RTK in real time through the wireless connection to the base station. In this process, the base station is connected to the Spanish IGN network of stations to receive RTCM3 corrections, which are then sent to the drone. After the flight, the base software (Ardupilot 4.4.4,
https://ardupilot.org/, accessed on 16 December 2024) injected the position data into the image metadata using the recorded information.
3.3. Data Processing
The aerial-drone-based tool was applied to the group of four orthoimages to validate the performance of the algorithms. All the images corresponded to different areas covering the Júcar River in Spain (
Figure 6).
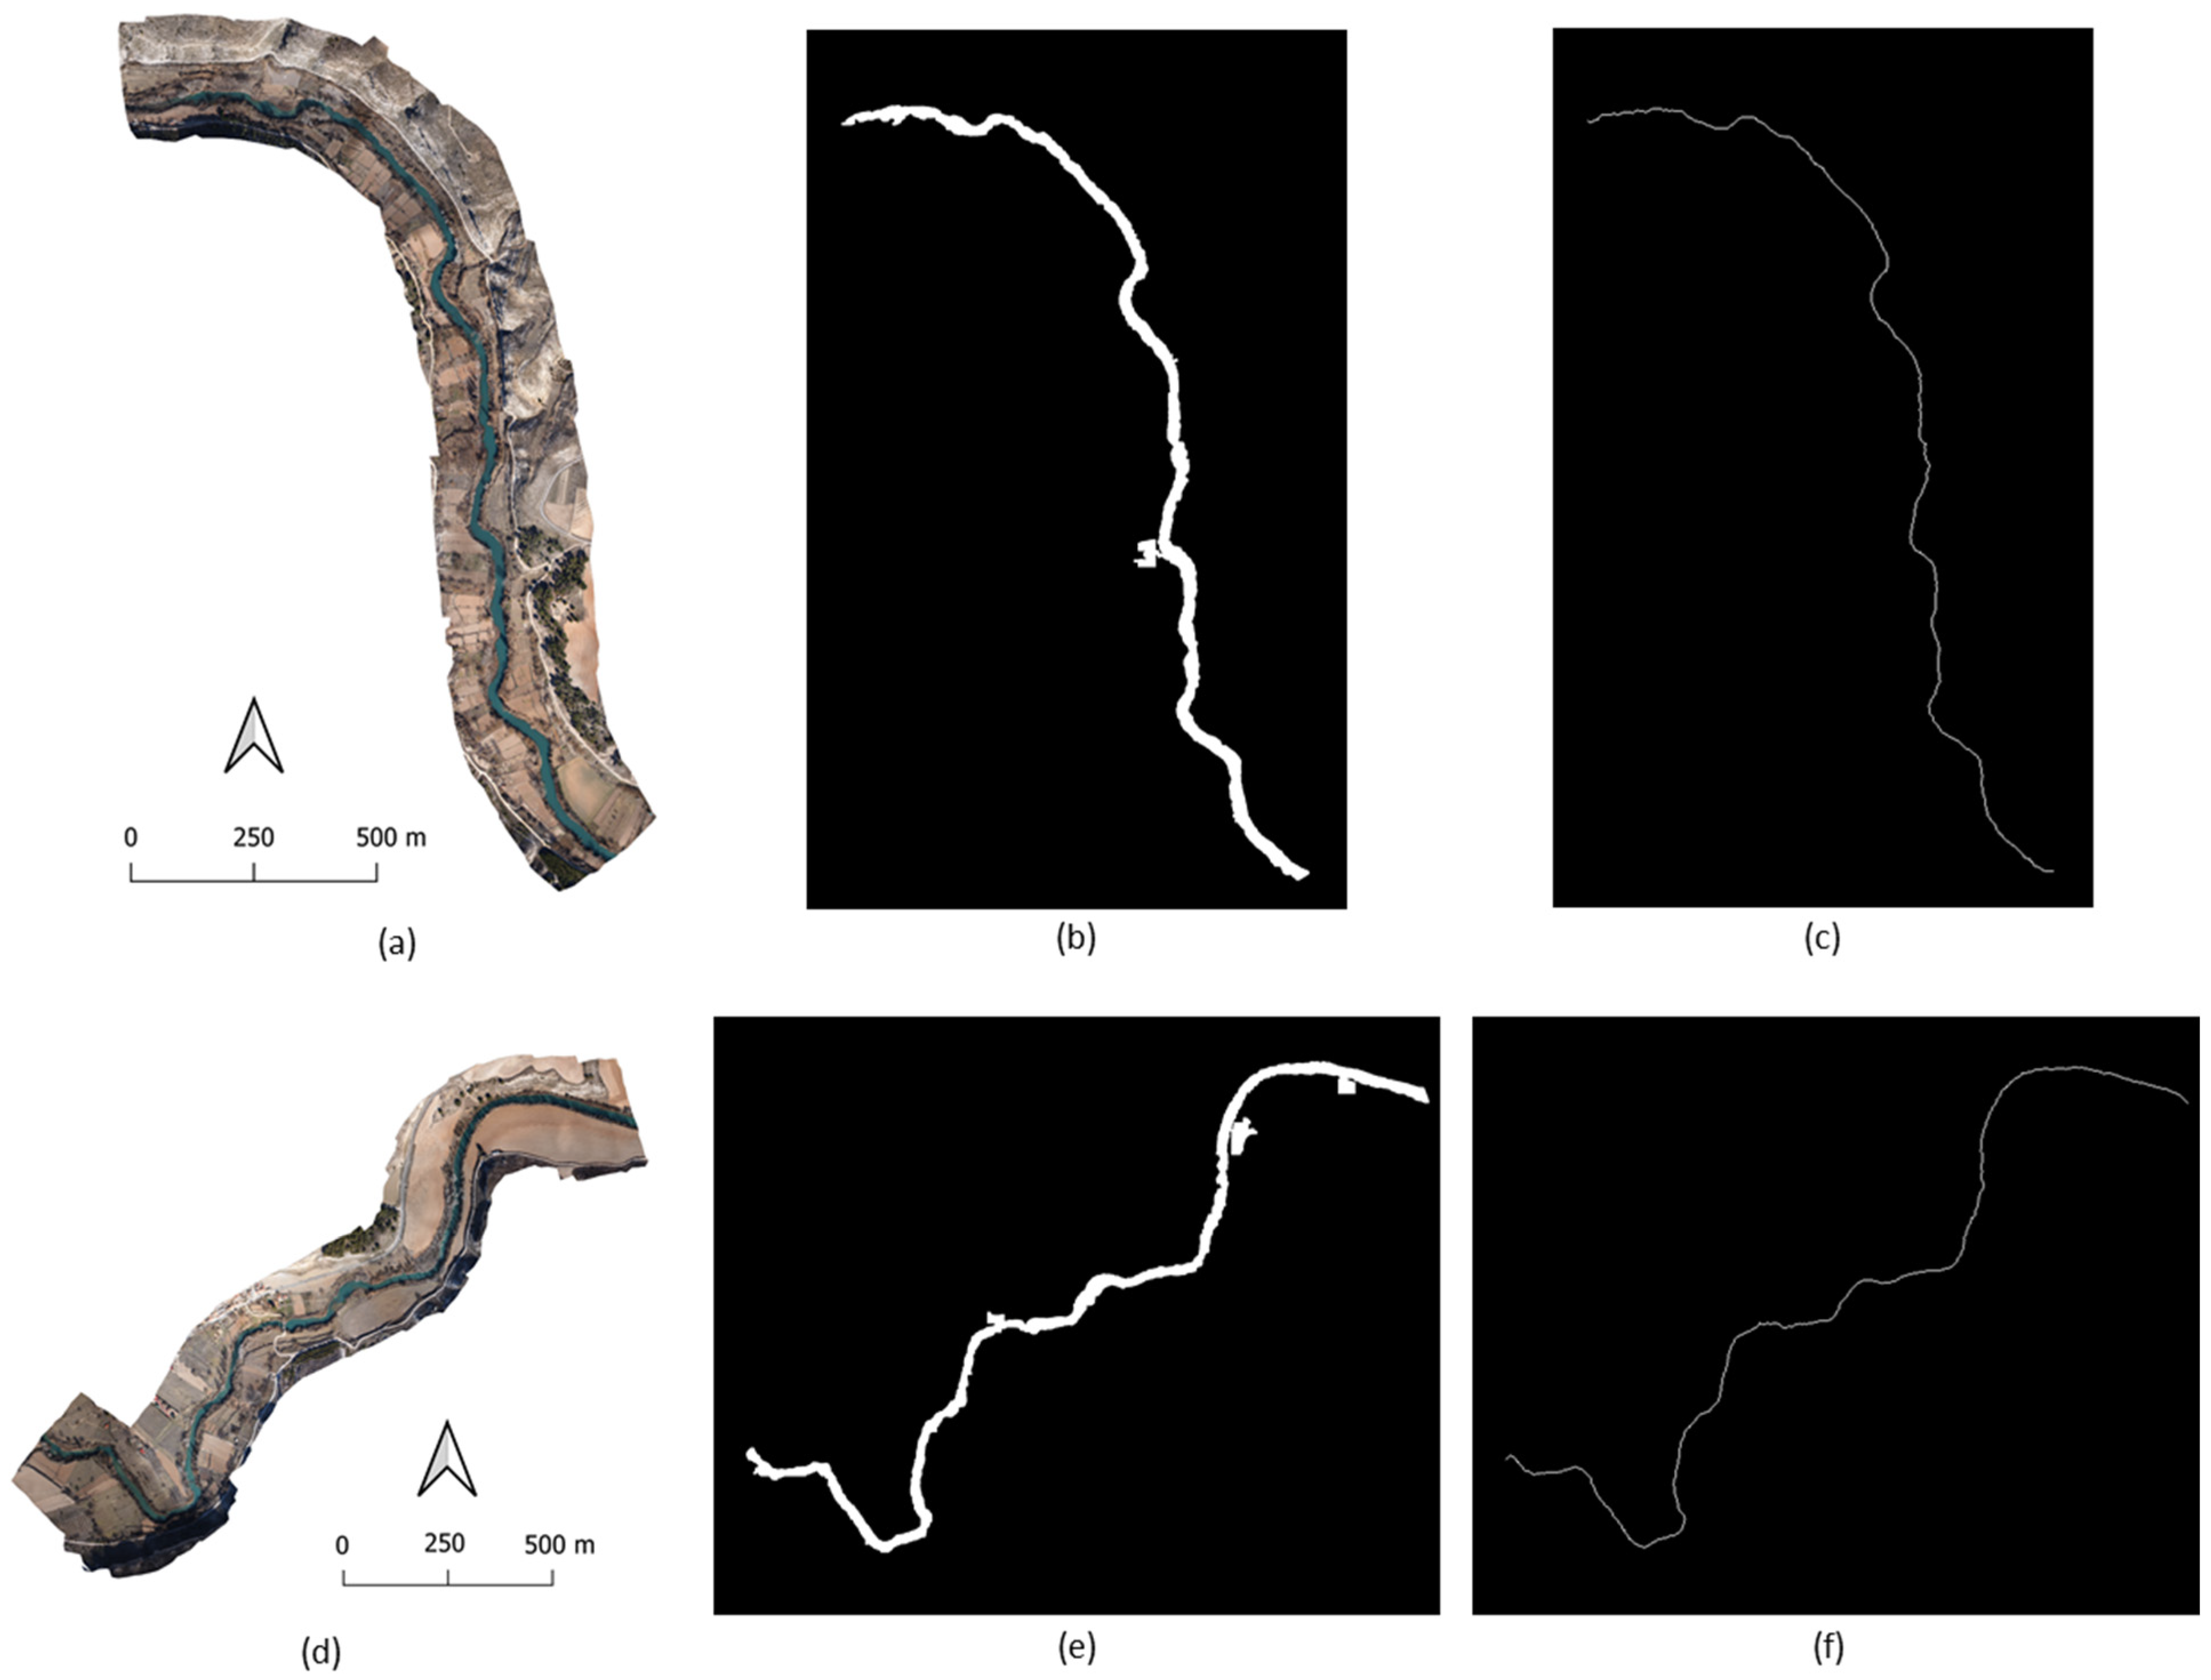
The photogrammetric process was carried out using NodeGraphos (
Figure 9). A bundle adjustment and self-calibration of the images (
Figure 9b) provided a 3D point cloud (
Figure 9c), together with the digital surface model (DSM) and digital terrain model (DTM), and the DTM then was used to generate the orthoimage (
Figure 9d).
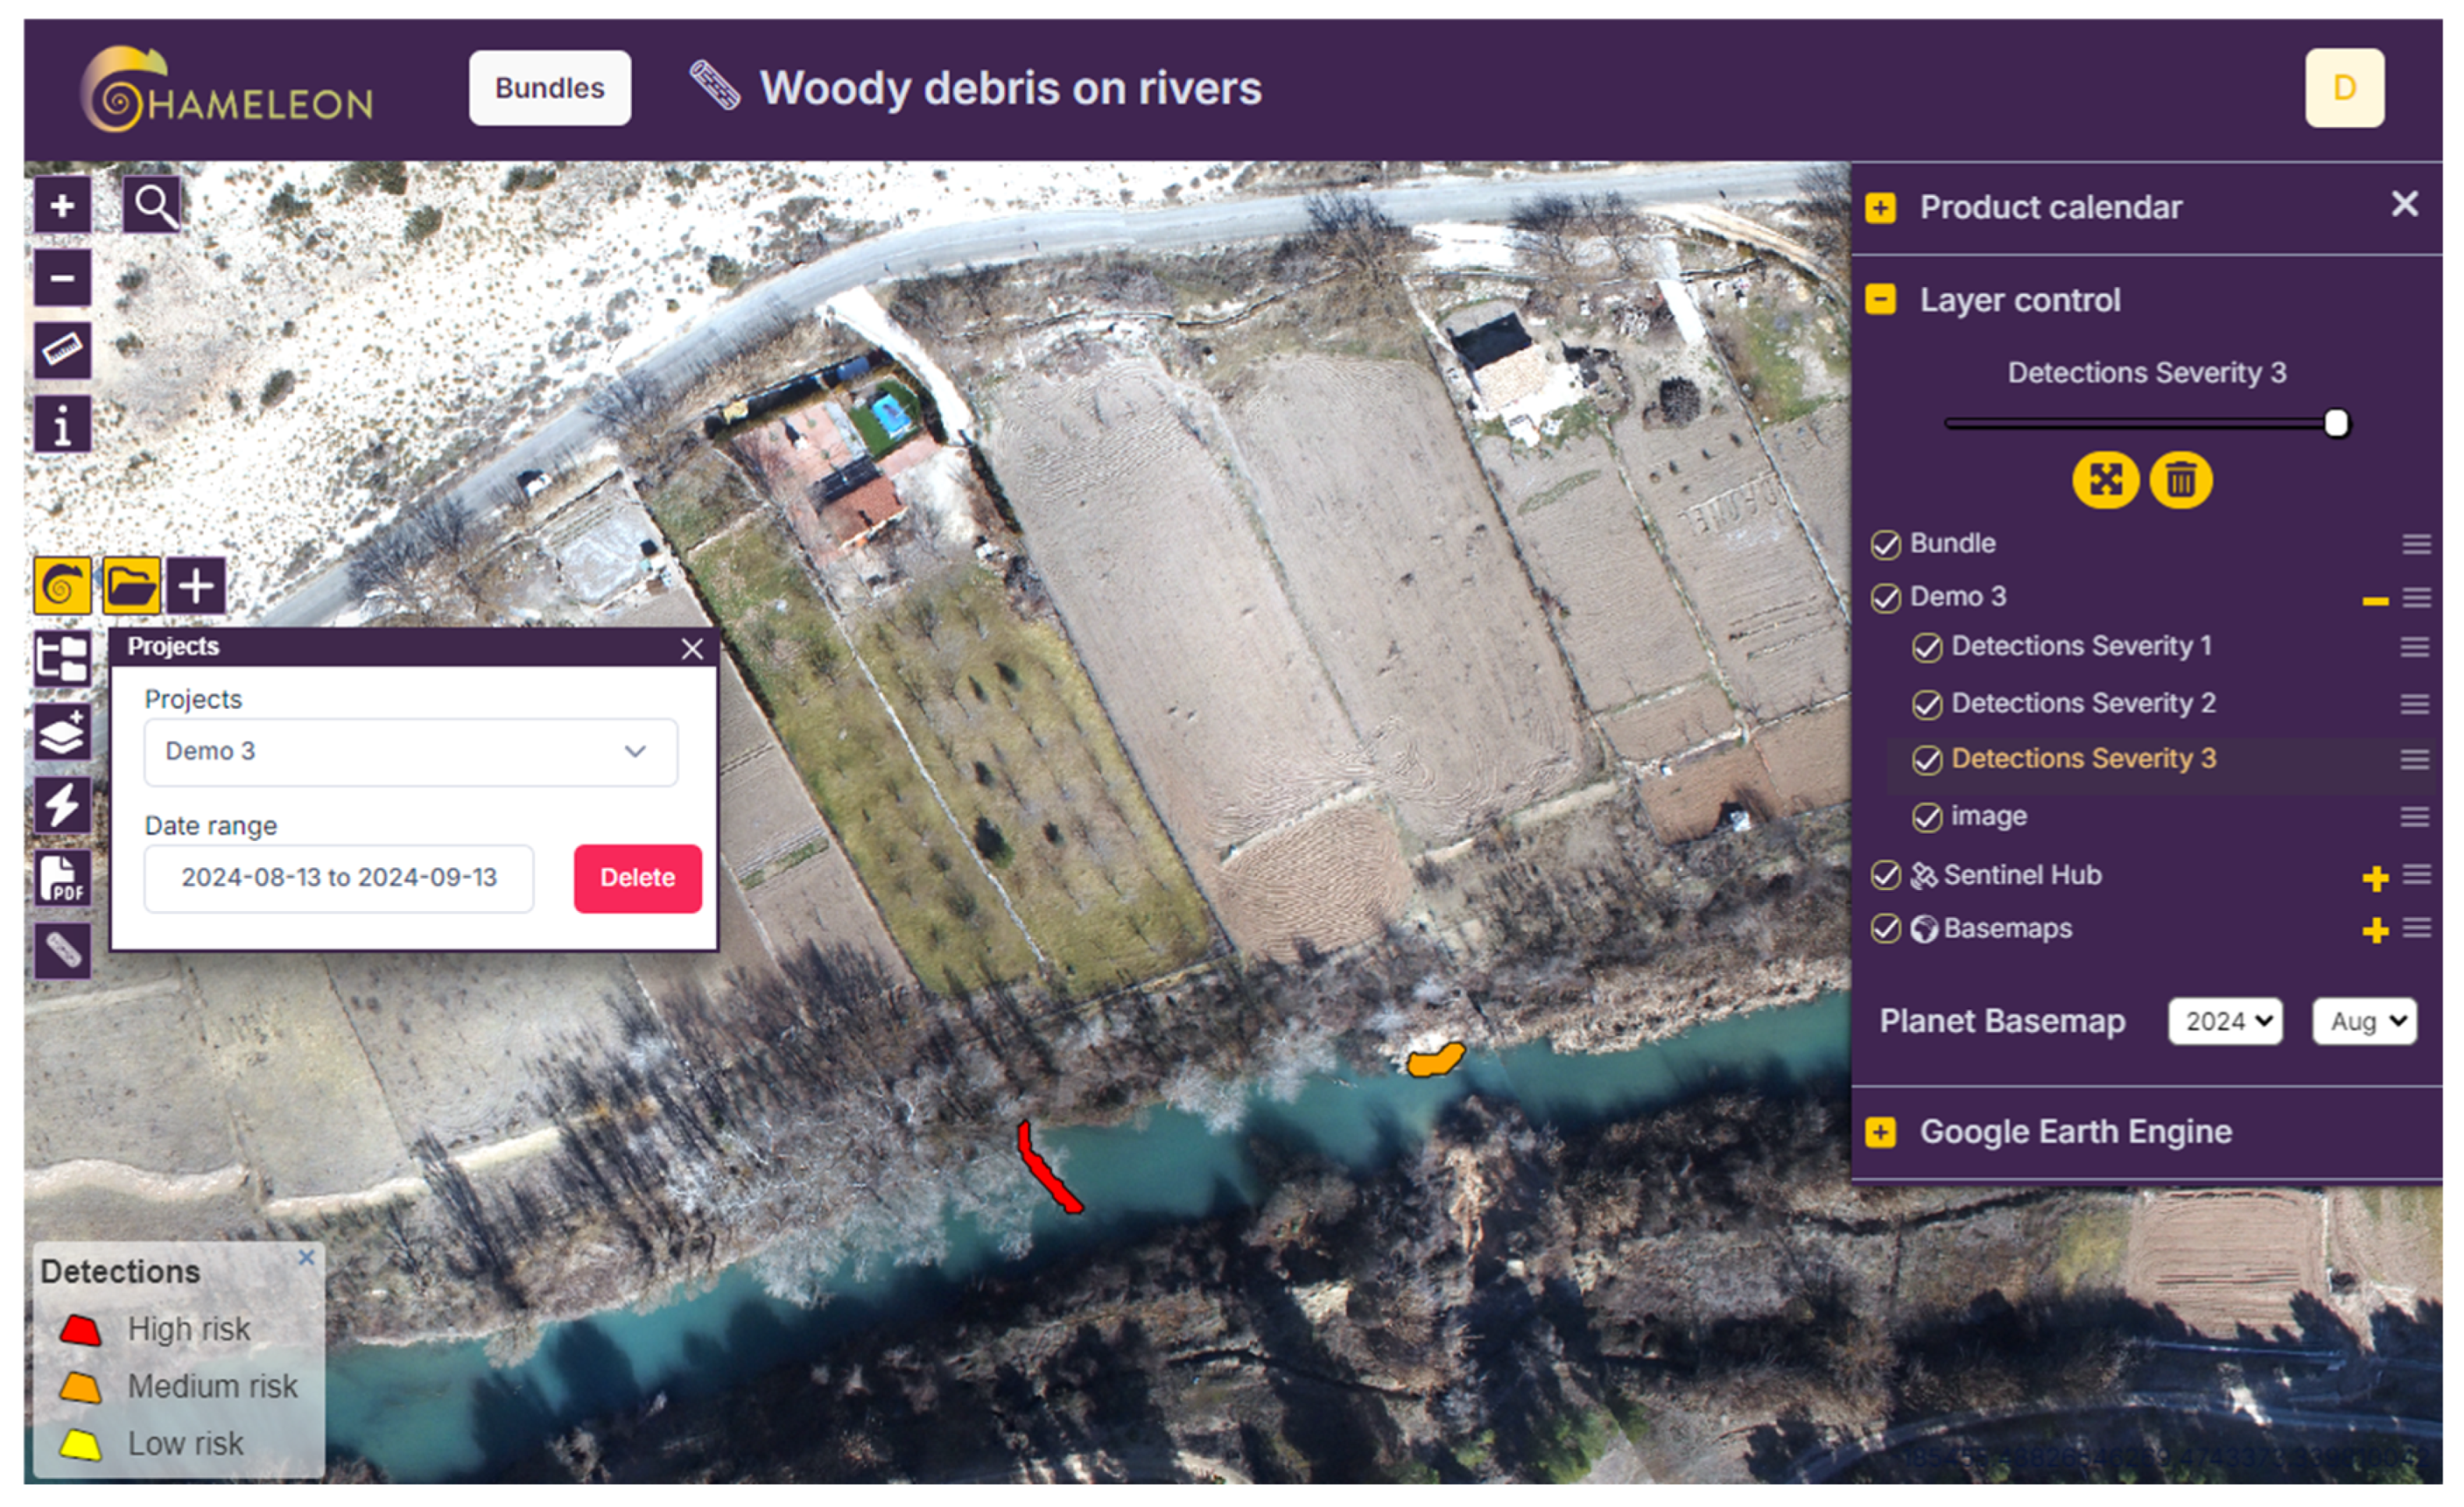
3.4. Woody Debris Detection and Risk Assessment
Then, the created orthoimages were uploaded to the geospatial platform (WebGIS) developed (
Figure 10) to perform woody debris detection and risk assessment. The processing server was equipped with a CPU Intel Xeon E3 1245v5 4C/8T—3.5 GHz (Santa Clara, CA, USA) and 64 GB of RAM, without a dedicated GPU. In every case (
Table 3), the full process was carried out in less than two minutes.
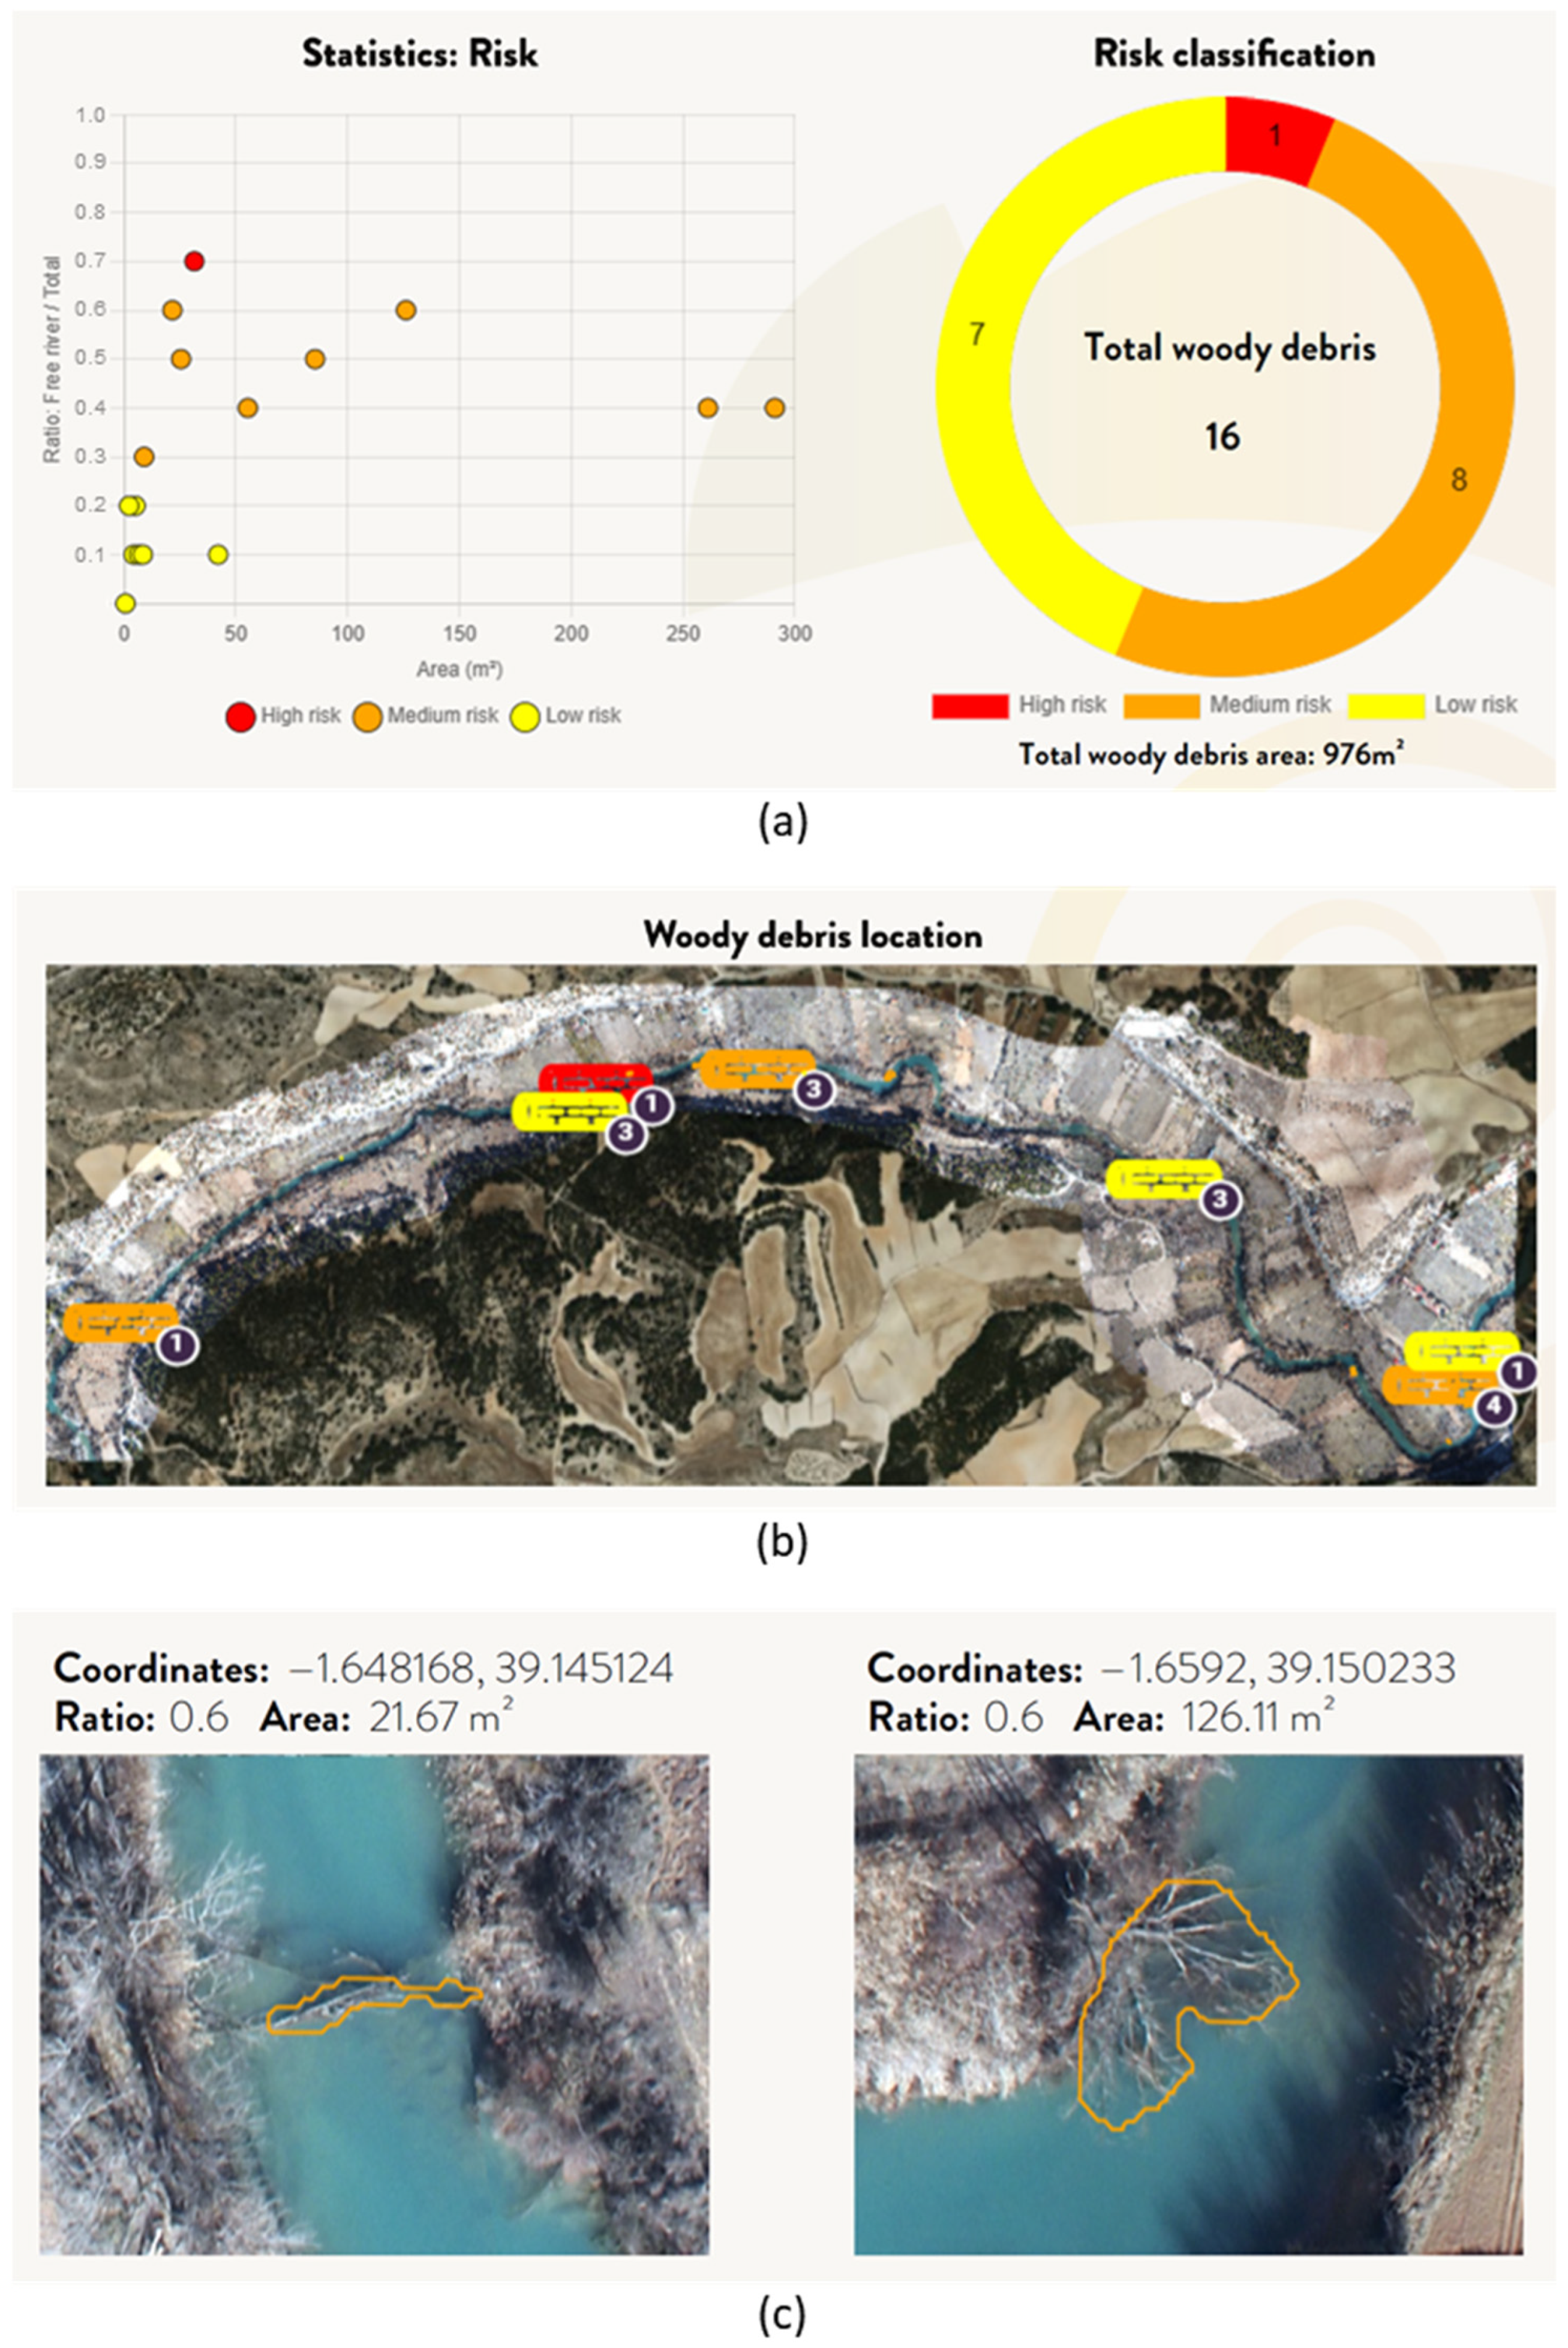
The results were obtained for each of the orthoimages. The generated report and its sections are presented in
Figure 11. The report consists of several sections; in the first place, the statistical analysis of the results is presented, including the number of detections for each risk category and a graph showing the risk and size for each element (
Figure 11a). The area of study with the detected elements is visible (
Figure 11b). Finally, the report shows individual information on each detection including geolocation, area, and a full-resolution image of the detection (
Figure 11c).
The assessment of the results was conducted manually and is presented below (
Table 4). The orthoimages were treated here as a single unified dataset, with no distinctions made between individual images.
The ground truth was created by manual identification of the woody debris elements on the orthoimages. The classification of the debris in the different risk categories was also carried out manually following the criteria of the automatic methodology.
A high variability of the obtained results can be appreciated, with recall and accuracy depending greatly on the level of importance of the debris. For debris considered of high risk, a 0.71 recall was obtained, while this value was considerably lower for small debris assigned with medium and low risk.
A similar conclusion can be derived for the precision results: while outcomes are acceptable for high-risk woody debris, precision drops for elements with lower risk.
Obtained results present the methodology as a valuable tool to identify, geolocate, and categorise large elements of woody debris that occupy considerable fragments of the river; however, for smaller elements located at the edges or submerged, the obtained results were less valuable.
4. Discussion
The developed tool overcomes limitations of the traditional river monitoring methodologies, such as the lack of visibility caused by dense vegetation or challenging terrain. In contrast, drones can easily access these areas faster and without personal risks.
The fixed-wing drone used in this study efficiently covers extensive river sections within a short timeframe, as demonstrated by the rapid data acquisition during the experimental data acquisition. This efficiency not only reduces operational costs but also enables more frequent monitoring, enhancing the ability to detect changes in flood risk over time.
The automatic risk assessment methodology plays an important role in the model. It is not affected by scale, allowing it to be used in future developments of the tool, with higher-resolution images. It could also be applied to assess the associated risk of other elements, such as ice dams or plastic residuals.
In terms of accuracy, the lack of similar works complicates an appropriate comparison with other methodologies. Backpack LiDAR has been tested for the detection of forest woody debris with performance varying depending on forest type, with an F1 score of 0.668, similar to the present study, for natural environments. However, data acquisition is time-consuming, requires substantial logistical efforts, and can be limited by line-of-sight issues [
22]. Ghaffarian et al. [
25] achieved a higher performance with an F1 score of 0.85 in a much more favourable environment with static cameras recording a fixed point of the river. However, this methodology is limited to fixed locations. Aarnink et al. [
39] employed a convolutional neural network to detect woody debris from terrestrial video, obtaining an average precision ranging from 67% to 74%, depending on image resolution. As in the previous case, static cameras are required. Liang et al. [
40] used drone images and XGBoost for the detection. However, only the total debris volume was considered for validation.
Although the proposed drone-based aerial tool offers significant advantages for flood risk assessment, it is important to recognise its limitations to ensure a balanced evaluation of its performance. One of the primary limitations concerns the training dataset for woody debris detection. Due to the high variability in debris characteristics, generating an adequate dataset proved to be a challenging task. To enhance performance in specific locations or under particular conditions, it is advisable to incorporate additional training data. Furthermore, due to the training data, the model can only detect woody debris elements larger than 25 cm in GSD. While this threshold helps filter out smaller or non-woody elements, it may also result in missing smaller logs.
Regarding detection problems, branches hanging over the river are one of the main issues encountered. Although the model typically disregards most of these, some instances lead to false positives. This difficulty in detection occurs because distinguishing these branches can be challenging, even for a human operator reviewing the images.
The utility of the tool is linked to the possibility of integrating the obtained data into hydraulic models, with the final objective of improving river management and flood prevention strategies. Woody debris significantly affects river hydraulics by altering flow patterns and modifying channel morphology. Incorporating accurate debris data into these models will result in more reliable predictions.
To this end, two integration approaches should be considered in the future: (i) embedding hydraulic/hydrological models [
41] within the WebGIS, or (ii) exporting debris data to specialised modelling tools [
42]. While the first approach entails greater complexity, the second approach involves exporting the data generated by the tool for its use with hydraulic/hydrological modelling tools. The presented platform would provide the generated data as 2D polygons in formats compatible with external modelling software. Some of the tools that could be used are HEC-RAS (Hydrologic Engineering Center—River Analysis System) or Iber [
43]. HEC-RAS is capable of measuring water flow and simulating the effect of obstructions such as woody debris. Iber is a two-dimensional model designed to simulate free surface flows in rivers and estuaries. The tool integrates the “Iber-wood” module, developed specifically for integrating woody debris data into flood prevention modelling.
Overall, this study demonstrates the effectiveness of combining aerial drone technology with AI-driven detection algorithms and WebGIS platforms for assessing flood risks associated with woody debris in rivers. The developed tool offers significant advantages over traditional monitoring methods, including enhanced accessibility, reduced operational costs, and more frequent assessments.
5. Conclusions
This study presents a novel aerial-drone-based tool that integrates AI-driven detection algorithms and a WebGIS platform to assess flood risks associated with woody debris in rivers. By enhancing detection efficiency and automating risk assessment, the tool provides a scalable and cost-effective alternative to traditional monitoring methods, supporting river management agencies in decision-making and maintenance.
The results demonstrate that the developed system effectively detects woody debris and evaluates its potential impact on flood risks. However, the accuracy of the model is influenced by the variability of debris characteristics, highlighting the need for more extensive and diverse training datasets. Additionally, the possibility of integration with hydraulic models shows great potential for improving flood risk predictions.
Future work should focus on refining the detection algorithms to reduce false positives, particularly in challenging scenarios such as branches overhanging the river. Moreover, expanding the training dataset and exploring integration with advanced hydrological models would further enhance the tool’s accuracy and applicability. This development represents a significant step toward more efficient and reliable flood risk management, paving the way for future advancements in river monitoring technologies.


 ,
, 


