Article

Inland Water Quality Monitoring Using Airborne Small Cameras: Enhancing Suspended Sediment Retrieval and Mitigating Sun Glint Effects

by
Diogo Olivetti
1,2,*,
Henrique L. Roig
2,
Jean-Michel Martinez
2,3,
Alexandre M. R. Ferreira
2,
Rogério R. Marinho
4,
Ronaldo L. Mincato
1 and
Eduardo Sávio P. R. Martins
5
1
Institute of Natural Sciences, Federal University of Alfenas, Av. Jovino Fernandes Sales, 2600, Alfenas 37133-840, Brazil
2
Institute of Geosciences, University of Brasília, Campus Darcy Ribeiro, ICC-Ala Central, Brasília 70910-900, Brazil
3
Géosciences Environment Toulouse (GET), UMR5563, Institut de Recherche Pour le Développement (IRD), Centre National de la Recherche Scientifique (CNRS), Université Toulouse 3, 14 Avenue Edouard Belin, 31400 Toulouse, France
4
Postgraduation Program of Geography, Federal University of Amazonas, Manaus 69077-000, Brazil
5
Research Institute for Meteorology and Water Resources—Ceará State (Funceme), Avenida Rui Barbosa, 1246-Aldeota, Fortaleza 60115-221, Brazil
*
Author to whom correspondence should be addressed.
Drones 2025, 9(3), 173; https://doi.org/10.3390/drones9030173
Submission received: 13 December 2024 / Revised: 12 February 2025 / Accepted: 12 February 2025 / Published: 26 February 2025
(This article belongs to the Special Issue Applications of UVs in Digital Photogrammetry and Image Processing)

Abstract

:
The ongoing advancement of unmanned aerial vehicles (UAVs) and the evolution of small-scale cameras have bridged the gap between traditional ground-based surveys and orbital sensors. However, these systems present challenges, including limited coverage area, image stabilization constraints, and complex image processing. In water quality monitoring, these difficulties are further compounded by sun glint effects, which hinder the construction of accurate orthomosaics in homogeneous water surfaces and affect radiometric accuracy. This study focuses on evaluating these challenges by comparing two distinct airborne imaging platforms with different spectral resolutions, emphasizing Total Suspended Solids (TSS) monitoring. Hyperspectral airborne surveys were undertaken utilizing a pushbroom system comprising 276 bands, whereas multispectral airborne surveys were conducted employing a global shutter frame with 4 bands. Fifteen aerial survey campaigns were carried out over water bodies from two biomes in Brazil (Amazon and Savanna), at varying concentrations of TSS (0.6–130.7 mg L−1, N: 53). Empirical models using near-infrared channels were applied to accurately monitor TSS in all areas (Hyperspectral camera—RMSE = 3.6 mg L−1, Multispectral camera—RMSE = 9.8 mg L−1). Furthermore, a key contribution of this research is the development and application of Sun Glint mitigation techniques, which significantly improve the reliability of airborne reflectance measurements. By addressing these radiometric challenges, this study provides critical insights into the optimal UAV platform for TSS monitoring in inland waters, enhancing the accuracy and applicability of airborne remote sensing in aquatic environments.

1. Introduction

Total Suspended Solids (TSS) encompass both inorganic and organic particles suspended within water, quantified in units of mass per volume of water [1]. This parameter holds considerable significance as a fundamental indicator of water quality, primarily due to its frequent correlation with sediment transportation and water transparency [2]. Furthermore, TSS assumes a key role within the aquatic ecosystem, functioning as transporters of diverse substances, such as nutrients and pollutants. These substances may originate from soil erosion, runoff from adjacent watersheds, and the breakdown of organic matter and phytoplankton [3].
Remote sensing techniques have found extensive application in the monitoring of TSS and other pivotal water quality parameters, particularly those categorized as Optically Active Components (OACs), which encompass Phytoplankton and Colored Dissolved Organic Matter, alongside TSS [4,5]. The spectral behavior of waters with TSS is complex and varies based on the specific characteristics of the water body. This behavior is influenced by the absorption and scattering of both organic and inorganic particles within the water column. Due to this complexity, TSS estimation models are typically developed for specific sites. Several bio-optical models have been applied to continental waters with varying TSS concentrations, utilizing a range of radiometric data sources, including orbital, airborne, and in situ sensors [3].
Orbital remote sensing offers notable advantages, primarily in its ability to gather data across spatially distributed areas, in contrast to singular point observations. Additionally, it facilitates the establishment of historical data series through records obtained from sensors [1,5,6]. Nevertheless, inherent limitations related to the spatial, temporal, and spectral resolution of orbital sensors can curtail the comprehension of variability within the hydrological and limnological dynamics of aquatic systems [7]. Furthermore, the frequent occurrence of cloud cover, undermines the efficacy of monitoring precisely, mainly in rainy periods, when the accumulation of sediment in water bodies becomes more pronounced.
Manned airborne surveys employing high spectral resolution cameras provide an alternative approach capable of surmounting the inherent constraints associated with orbital sensors. This platform offers enhanced spatial, temporal, and spectral resolutions, and effectively mitigates disruptions caused by cloud cover interference [8,9]. Nonetheless, this approach necessitates a significant investment in terms of both financial resources and the establishment of appropriate infrastructure.
Simultaneously, the advancement of unmanned aerial systems coupled with compact cameras has spurred the emergence of a novel generation of remote sensing platforms. This platform is characterized by their reduced weight, enhanced affordability, heightened operational adaptability, and superior spatial resolution in comparison to manned aircraft. Given this technological framework, there exists a diverse array of applications for remote sensing methodologies utilizing unmanned aerial systems. These applications span various domains, including but not limited to agriculture [10,11], forestry [12,13], urbanism [14,15,16], and more, as well as water quality [17,18,19,20,21].
Although UAV platforms present viable and promising solutions for bridging the gap between in situ and orbital remote sensing systems, they also entail noteworthy limitations. These constraints encompass decreased image acquisition stability, higher complexity in image processing, and diminished coverage area in comparison to orbital platforms [4]. An additional constraining element is the susceptibility of airborne platforms to the adverse impacts of reflected sun glint on water surfaces. Sun Glint effects are unfavorable for remote sensing purposes, leading to sensor response saturation and obscuration of the spectral signatures of aquatic constituents, as the TSS [22]. Furthermore, the ongoing progress in the development of UAVs and compact cameras introduces additional complexities, encompassing aspects such as flight autonomy, camera stability, variations in image acquisition geometry and in spectral resolutions [23,24]. These factors can exert both positive and negative influences on the monitoring of inland water quality.
In this context, the present study aims to evaluate the effectiveness of two distinct UAV, differing in terms of image acquisition geometry and spectral resolutions. We integrate empirical data from airborne and in situ surveys, alongside existing literature, to identify the optimal UAV/sensor configuration for TSS monitoring. This includes a comprehensive examination of small camera characteristics for water imaging, georeferencing challenges, and the innovative application of sun glint mitigation techniques.

2. Materials and Methods
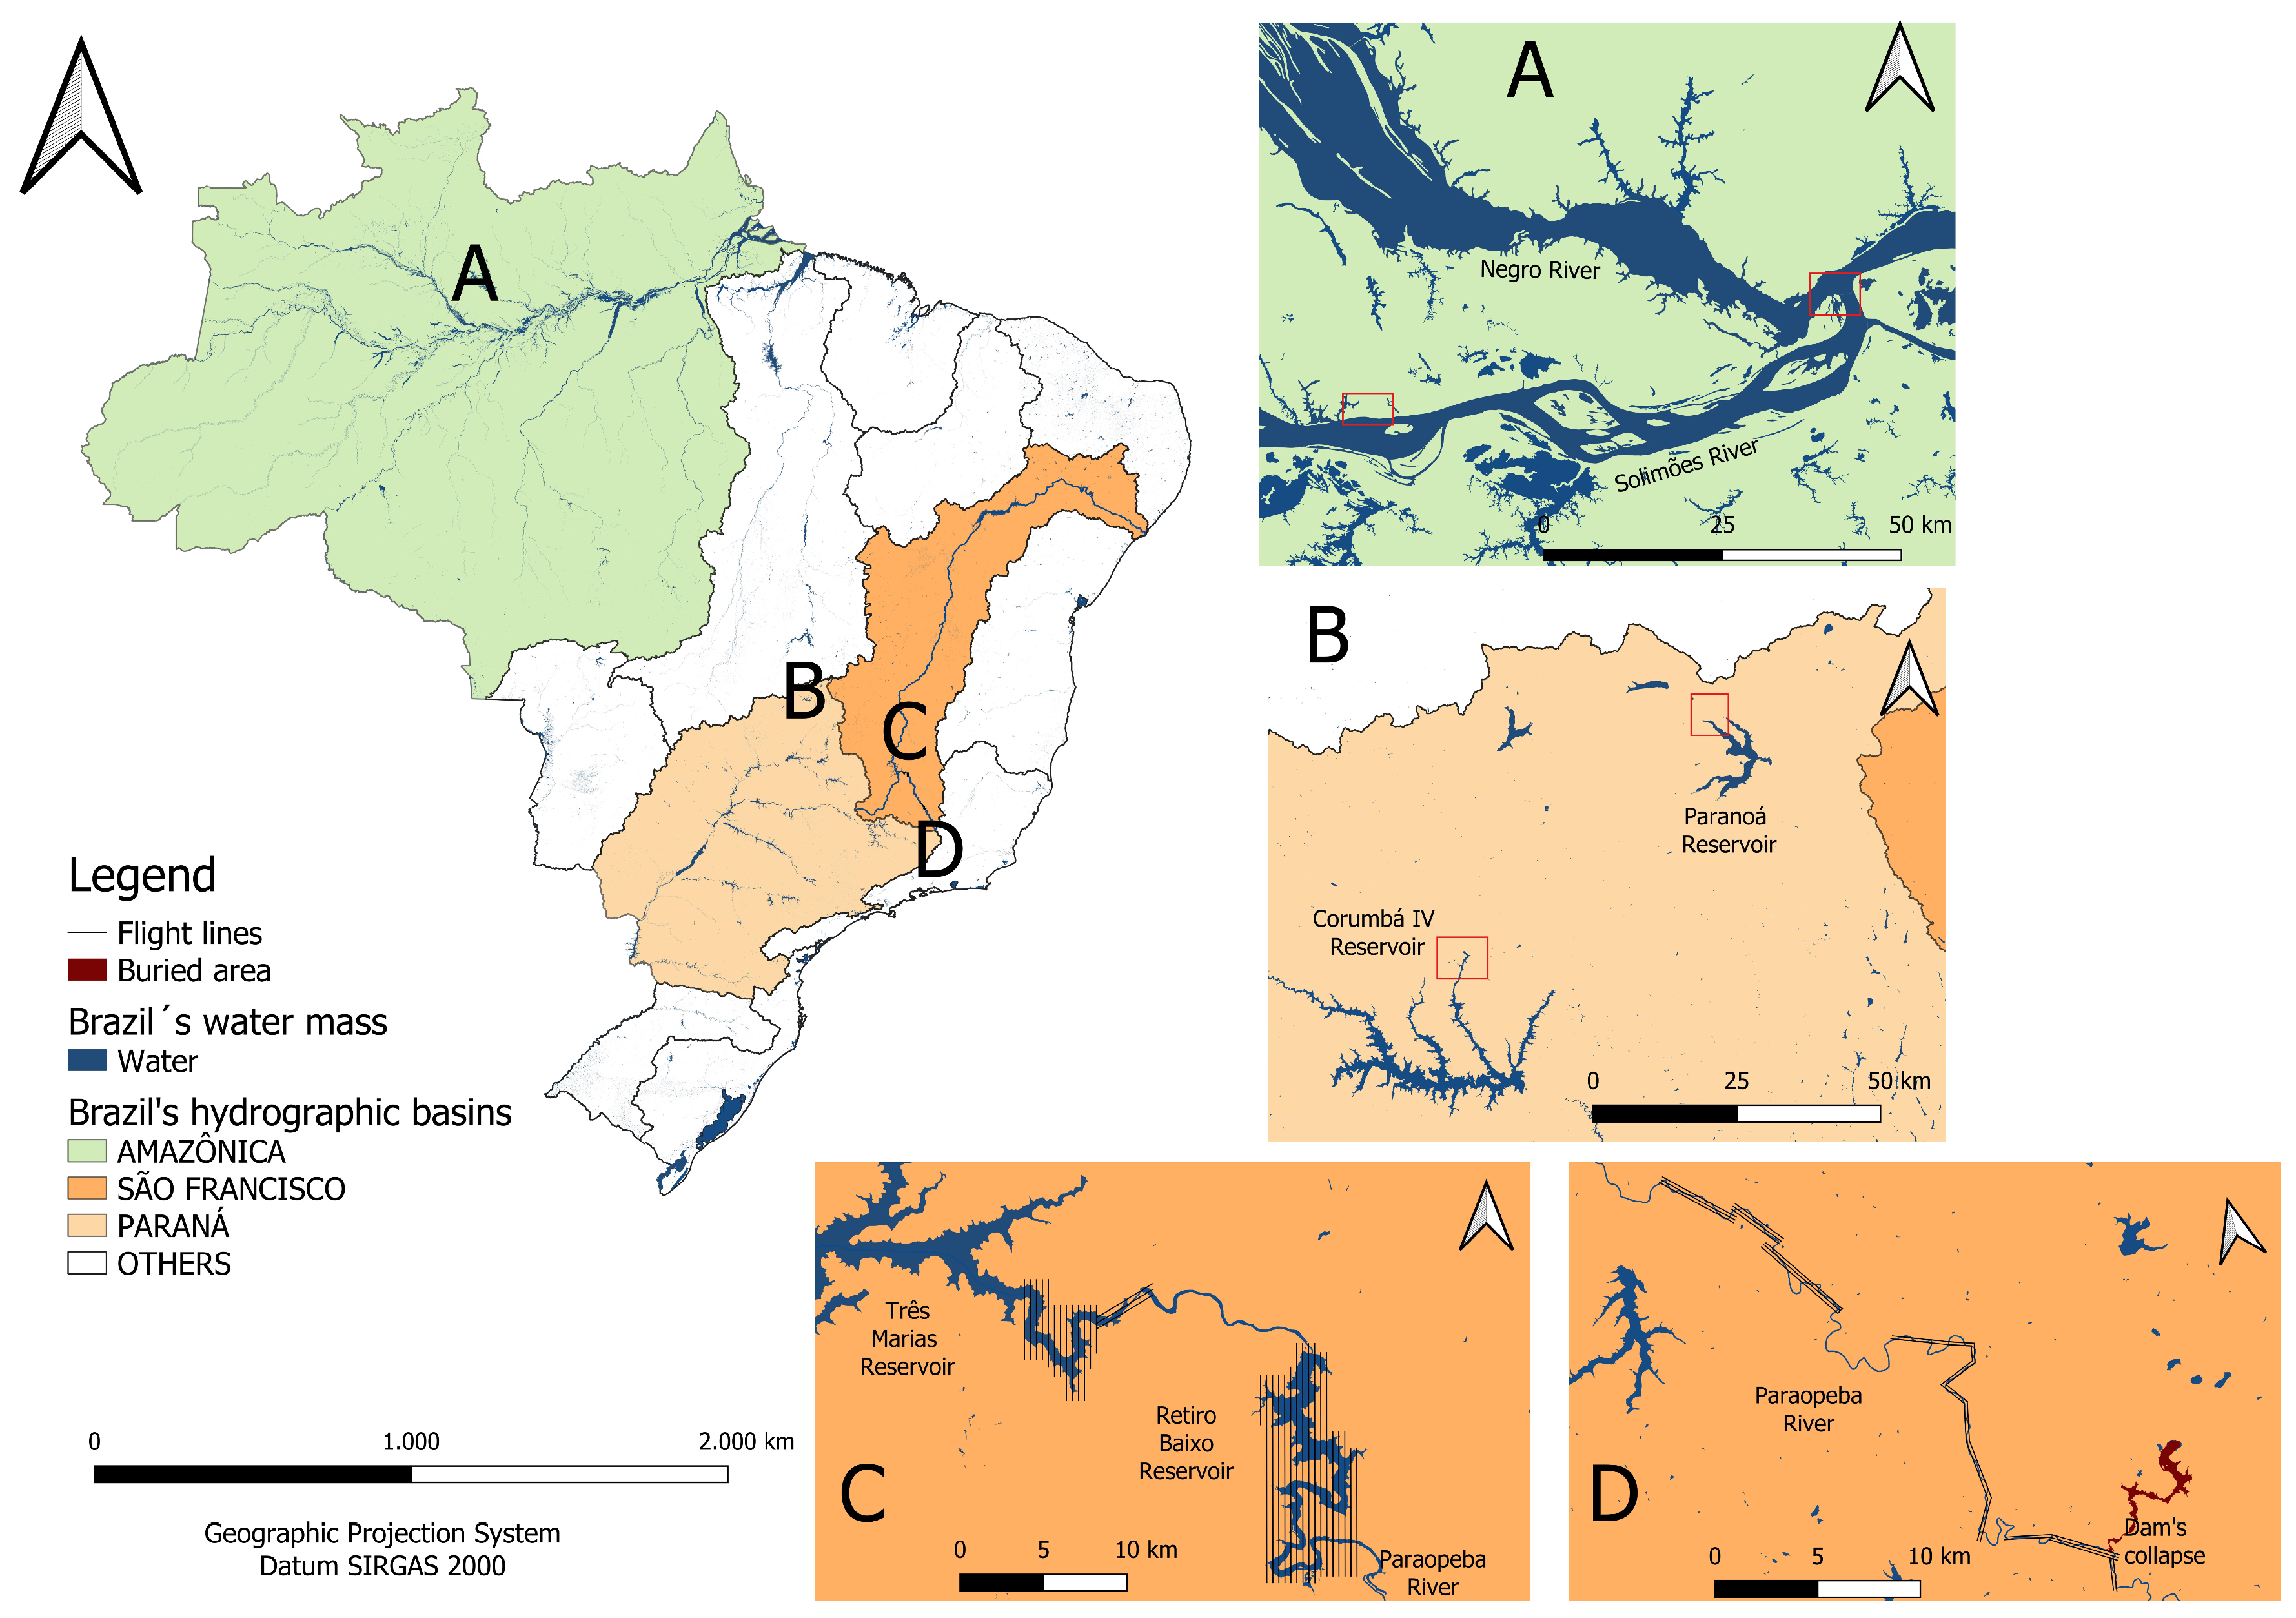
2.1. Study Area

This study is based on several experimental aerial surveys over various regions, biomes, and river basins in Brazil (Figure 1). A 4-band multispectral camera and a 276-band hyperspectral camera were used. In-situ water optical properties and TSS data were collected concurrently with the aerial surveys to calibrate and assess camera radiometric accuracy and to generate retrieved TSS.
In the Amazon region, distinct experimental areas were delineated, showcasing significant OACs variations. These areas included the confluence of the Solimões River’s turbid waters with the dark waters of the Negro River, as well as the contrast between the Solimões River’s turbid waters and the dark waters of igarapés, along with water bodies containing algae and sediments found in fishponds (Figure 1A).
Within the Paraná basin in the Cerrado (Savanna) biome, specific study areas encompassed the inflow and confluence zones of tributary rivers into the Paranoá and Corumbá IV reservoirs. Where water velocity and suspended sediment levels decrease during the transition from river to lake. Consequently, notable deposition of suspended materials takes place, involving both inorganic elements and nutrients, as well as heavy metals (Figure 1B).
While the primary emphasis of this study is on unmanned platforms, a distinctive manned helicopter survey with a hyperspectral camera was incorporated. This addition was motivated by the exclusive opportunity to detect the movement of tailings slurry into water bodies, especially considering the dramatic environmental incident that occurred in Brumadinho district (São Francisco Basin), in 2019. The rupture of a tailings dam at a stream iron ore mine in Brumadinho resulted in the discharge of approximately 12 million cubic meters of tailings containing high levels of heavy metals [25]. The tailings advanced along the Feijão stream, eventually reaching the downstream Paraopeba River, leading to significant harm to aquatic biota and various water uses [26]. The extent of this damage prompted increased efforts by Brazilian environmental agencies for control and inspection. They intensively measured the environmental consequences of the dam collapse and closely monitored the tailings’ progression. A primary concern was to determine if the tailings would reach the São Francisco River, a vital water source for over 1 million people across 255 municipalities in the arid northeastern region of Brazil [27]. To address this question, a manned airborne remote sensing survey was conducted aboard a helicopter to mapping map TSS across key stretches of the Paraopeba River (Figure 1D) and the upstream reservoirs (Retiro Baixo and Três MariasFigure 1C) leading to the São Francisco River, covering approximately 200 km.

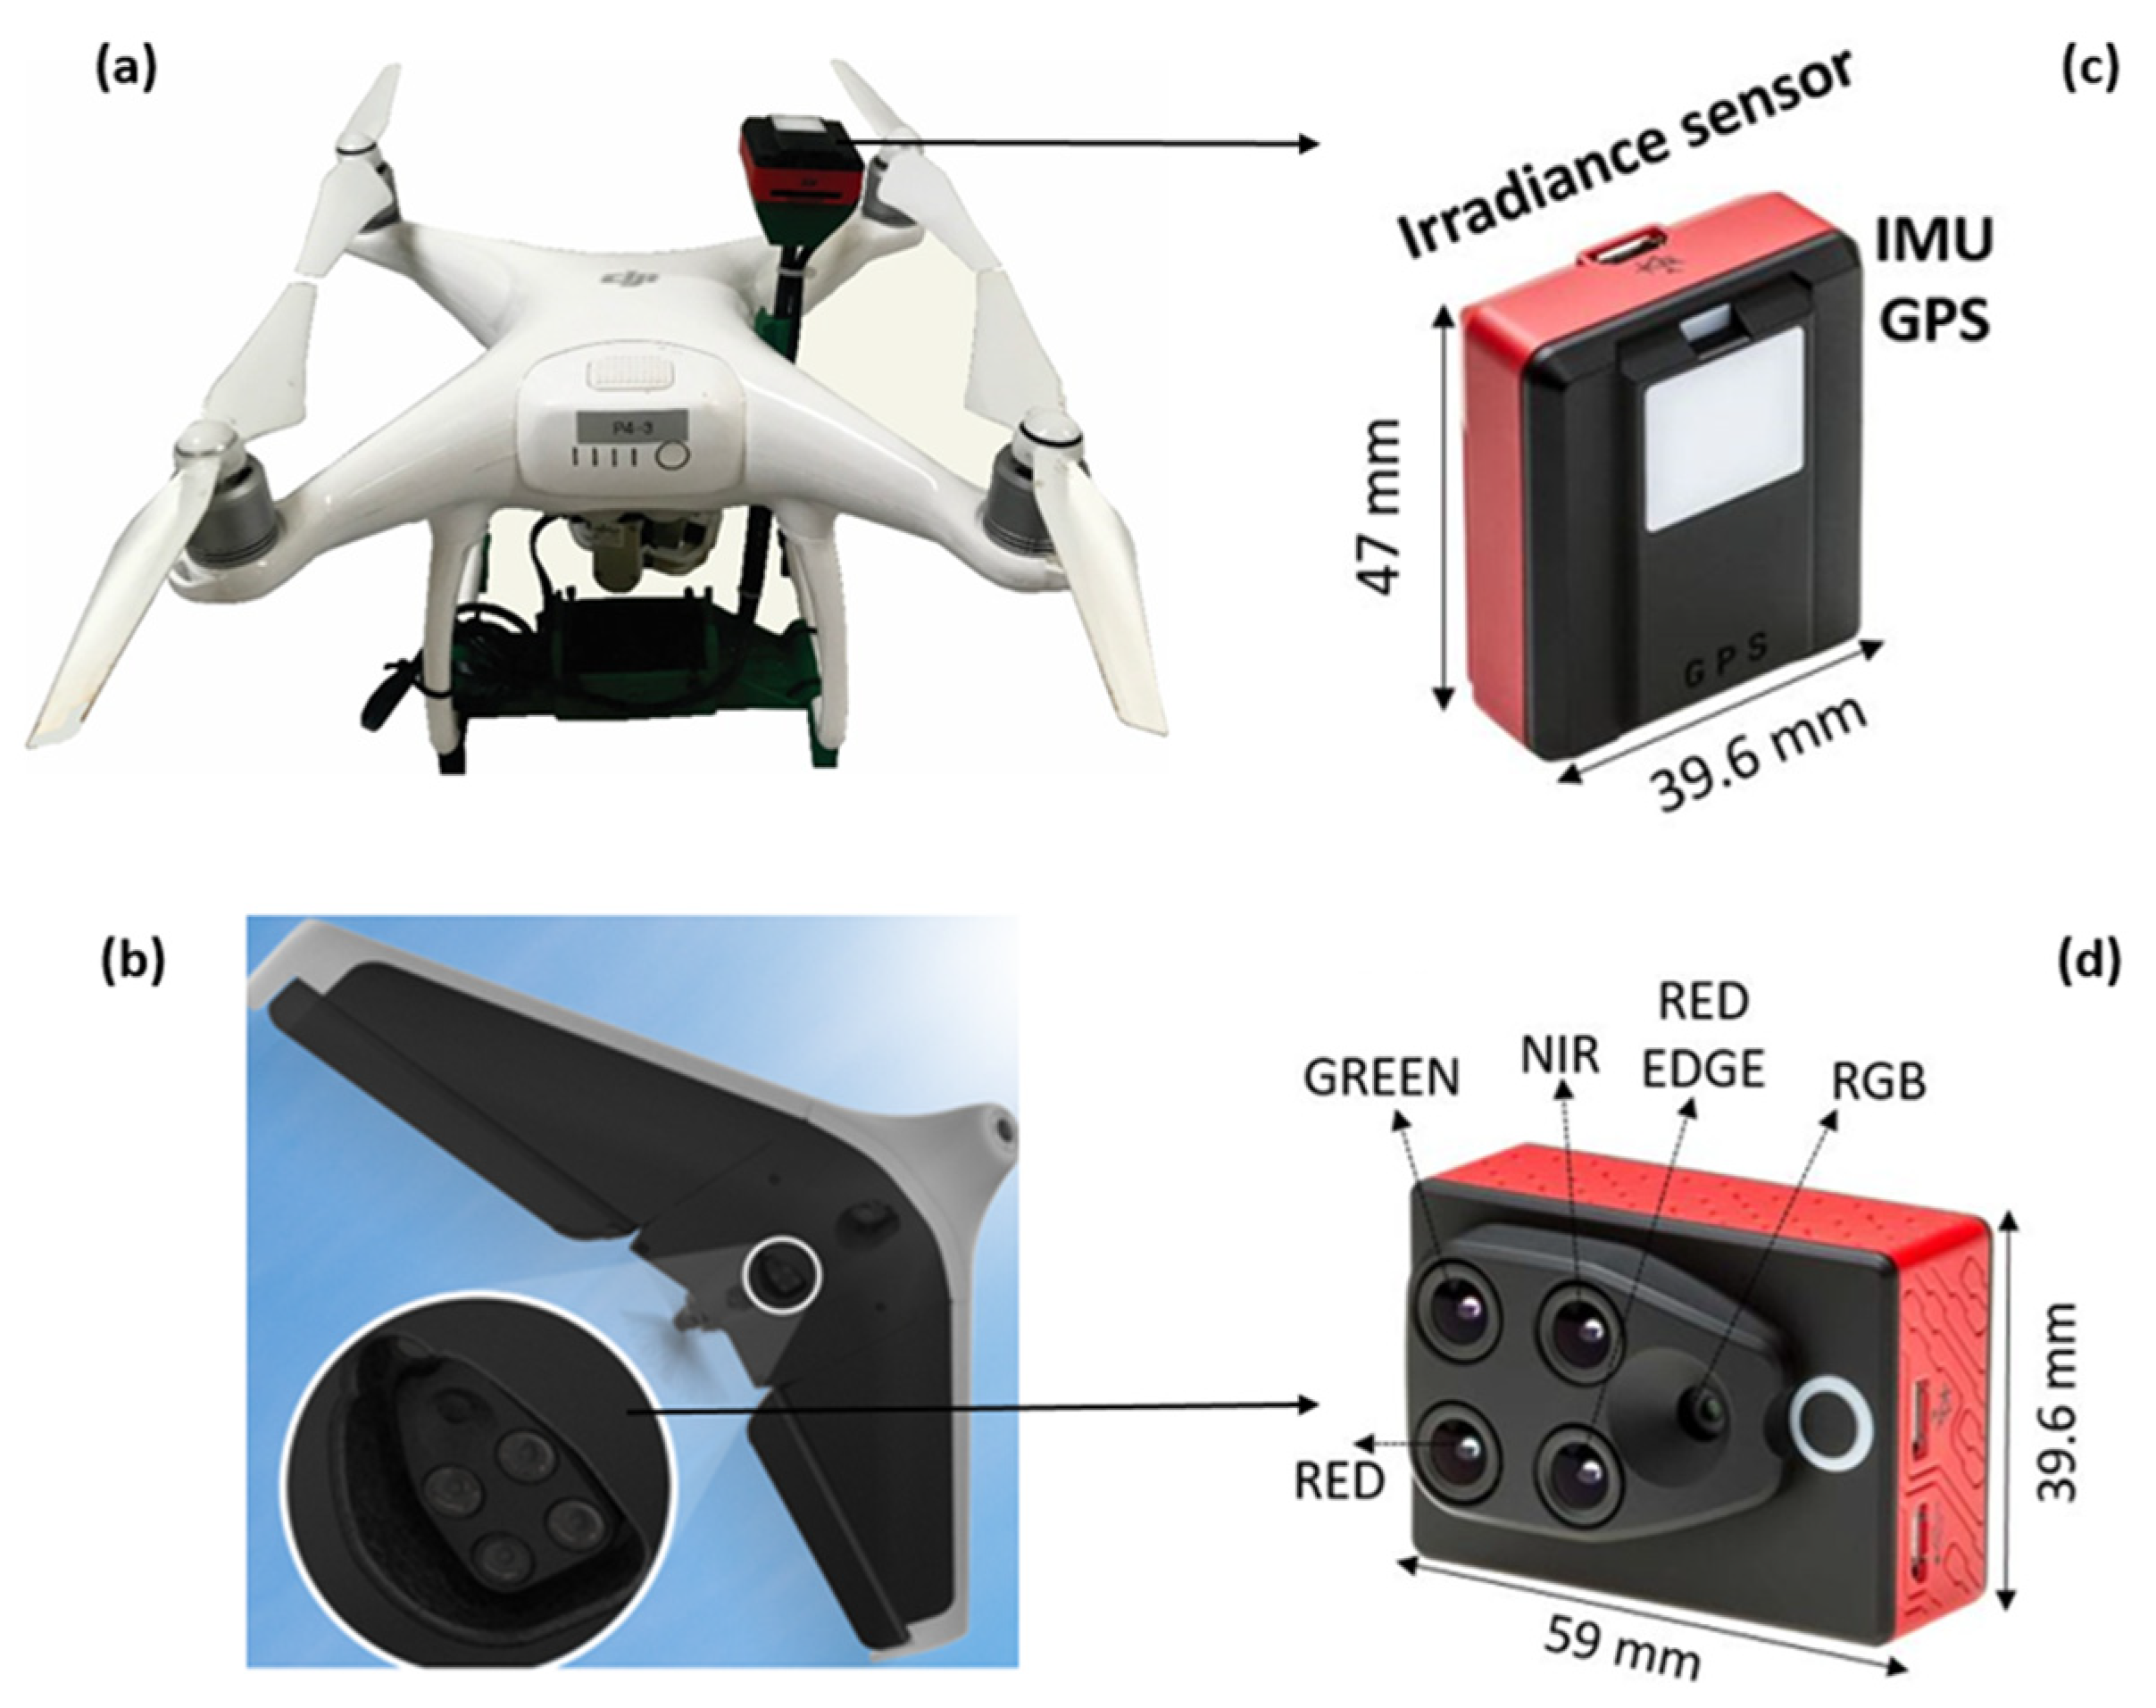
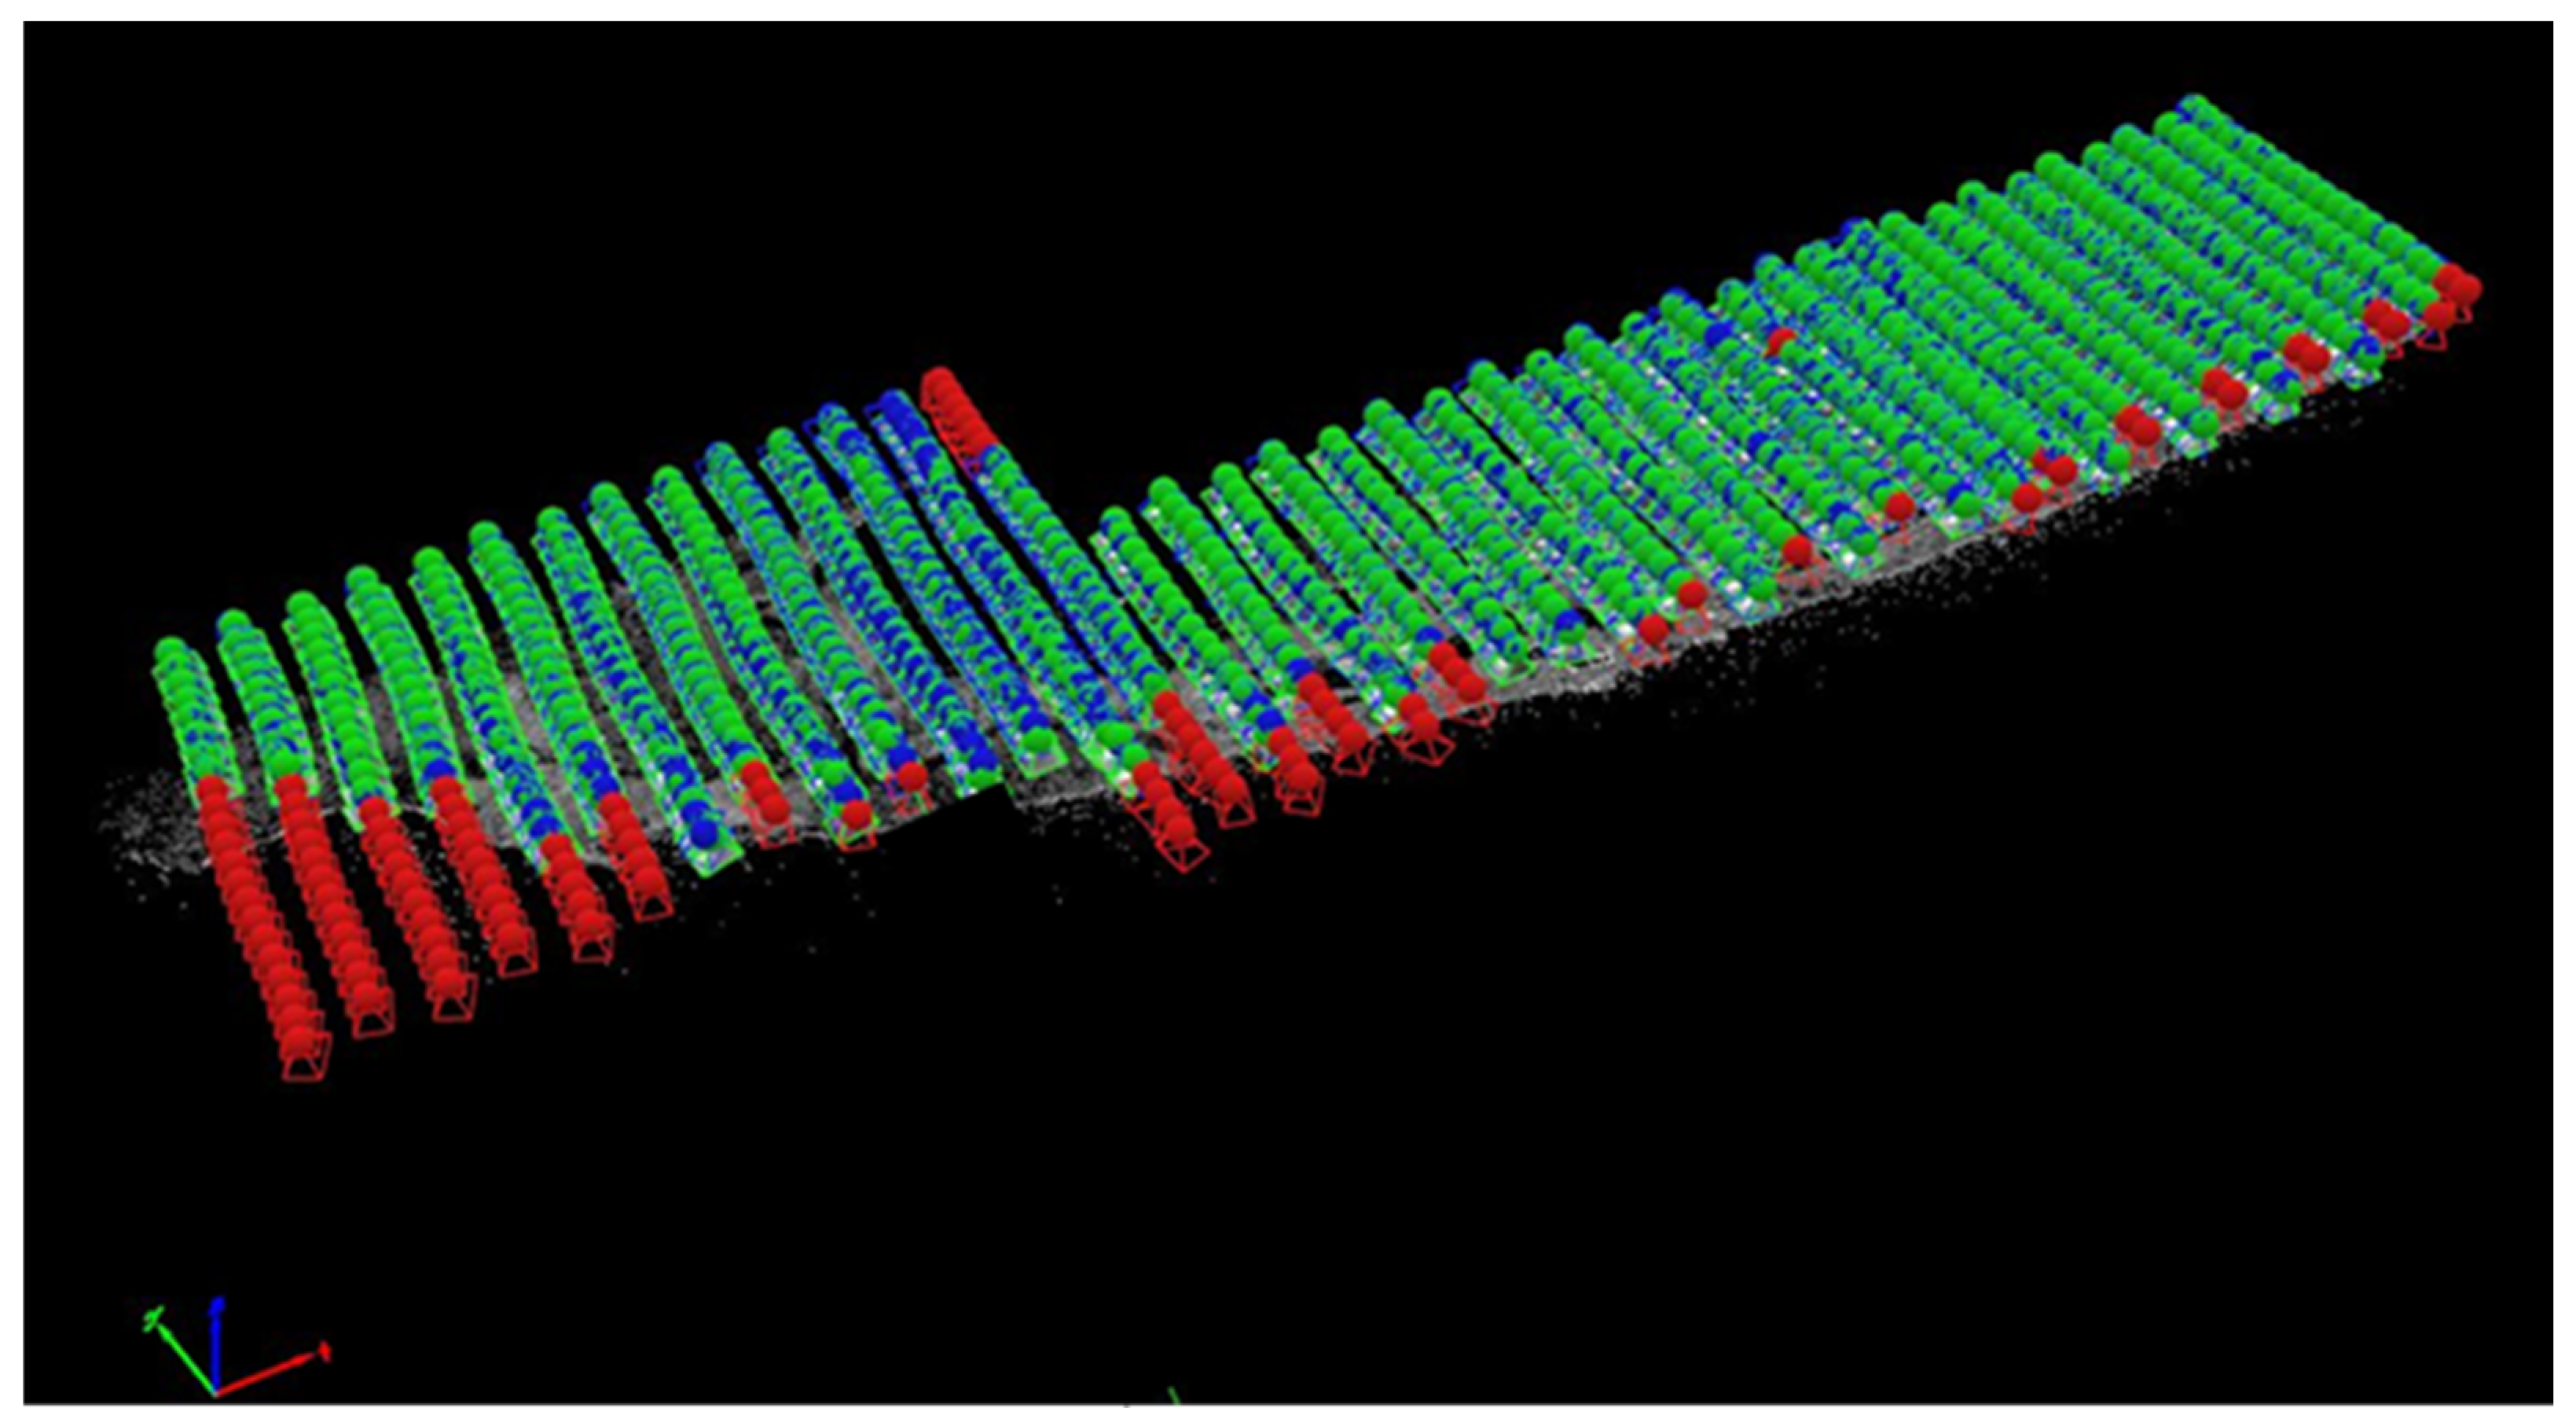
2.2. Multispectral Platform: Data Collection and Processing

The Parrot Sequoia was the chosen multispectral camera. Weighing just 135 g with a compact size, it offers adaptability to a range of UAV models. Despite its original agricultural focus, the Sequoia camera underwent tests tailored for water quality monitoring. This is due to its inclusion of four sensors covering the spectral ranges of green (530–570 nm), red (640–880 nm), red-edge (730 to 740 nm), and near-infrared (NIR: 770–810 nm). Additionally, an RGB camera module complements the Sequoia camera (Figure 2d).
A significant advantage is the incorporation of a GPS/IMU/magnetometer system, and an irradiance sensor equipped with filters matching the spectral range of the Sequoia camera (Figure 2c). This integrated system simultaneously captures positional data, camera parameters, and irradiance sensor readings. This synergy streamlines the process of generating orthomosaics of multispectral bands, transformed into surface reflectance, referred to as at sensor Surface Reflectance (asSR).
The Sequoia camera’s versatility led to its installation on two distinct UAVs platforms for this study. The Parrot Disco Pro AG (Figure 2b), a fixed-wing aircraft pre-integrated with the camera, was utilized, along with the DJI Phantom 4 multi-rotor UAV. The latter was adapted to accommodate the camera using a 3D-designed and printed bracket (as depicted in Figure 2a).
For autonomous flight planning, the DroneDeploy app was employed for Phantom 4, while Pix4D Capture was used for the Disco Pro AG. Both flight plans were configured to operate at an altitude of 120 m above ground, with a maximum speed of 10 m/s. Frontal and lateral overlaps of 80% and 70%, respectively, were selected. These parameters were chosen to ensure accurate alignment of captured images and subsequently generate orthomosaics with a spatial resolution of detail (GSD) of 13 cm.
The processing of the multispectral images was performed using Pix4D Mapper software (version 3.0). The resulting orthomosaics, containing asSR values, were generated through the digital photogrammetry technique called Structure from Motion (SfM). The SfM process automates the identification of corresponding points across a set of overlapping images using bundle adjustment [28]. This forms the foundation for constructing the orthomosaic in Pix4D Mapper. The sequential process includes image alignment, 3D points cloud creation, triangular mesh generation, and digital terrain modeling. During image overlay, Pix4D Mapper computes asSR values using radiance data from the camera bands and the irradiance sensor. This method accounts for all images covering a specific pixel, assigning greater weight to those where the pixel is more centrally positioned (Pix4D S.A.).

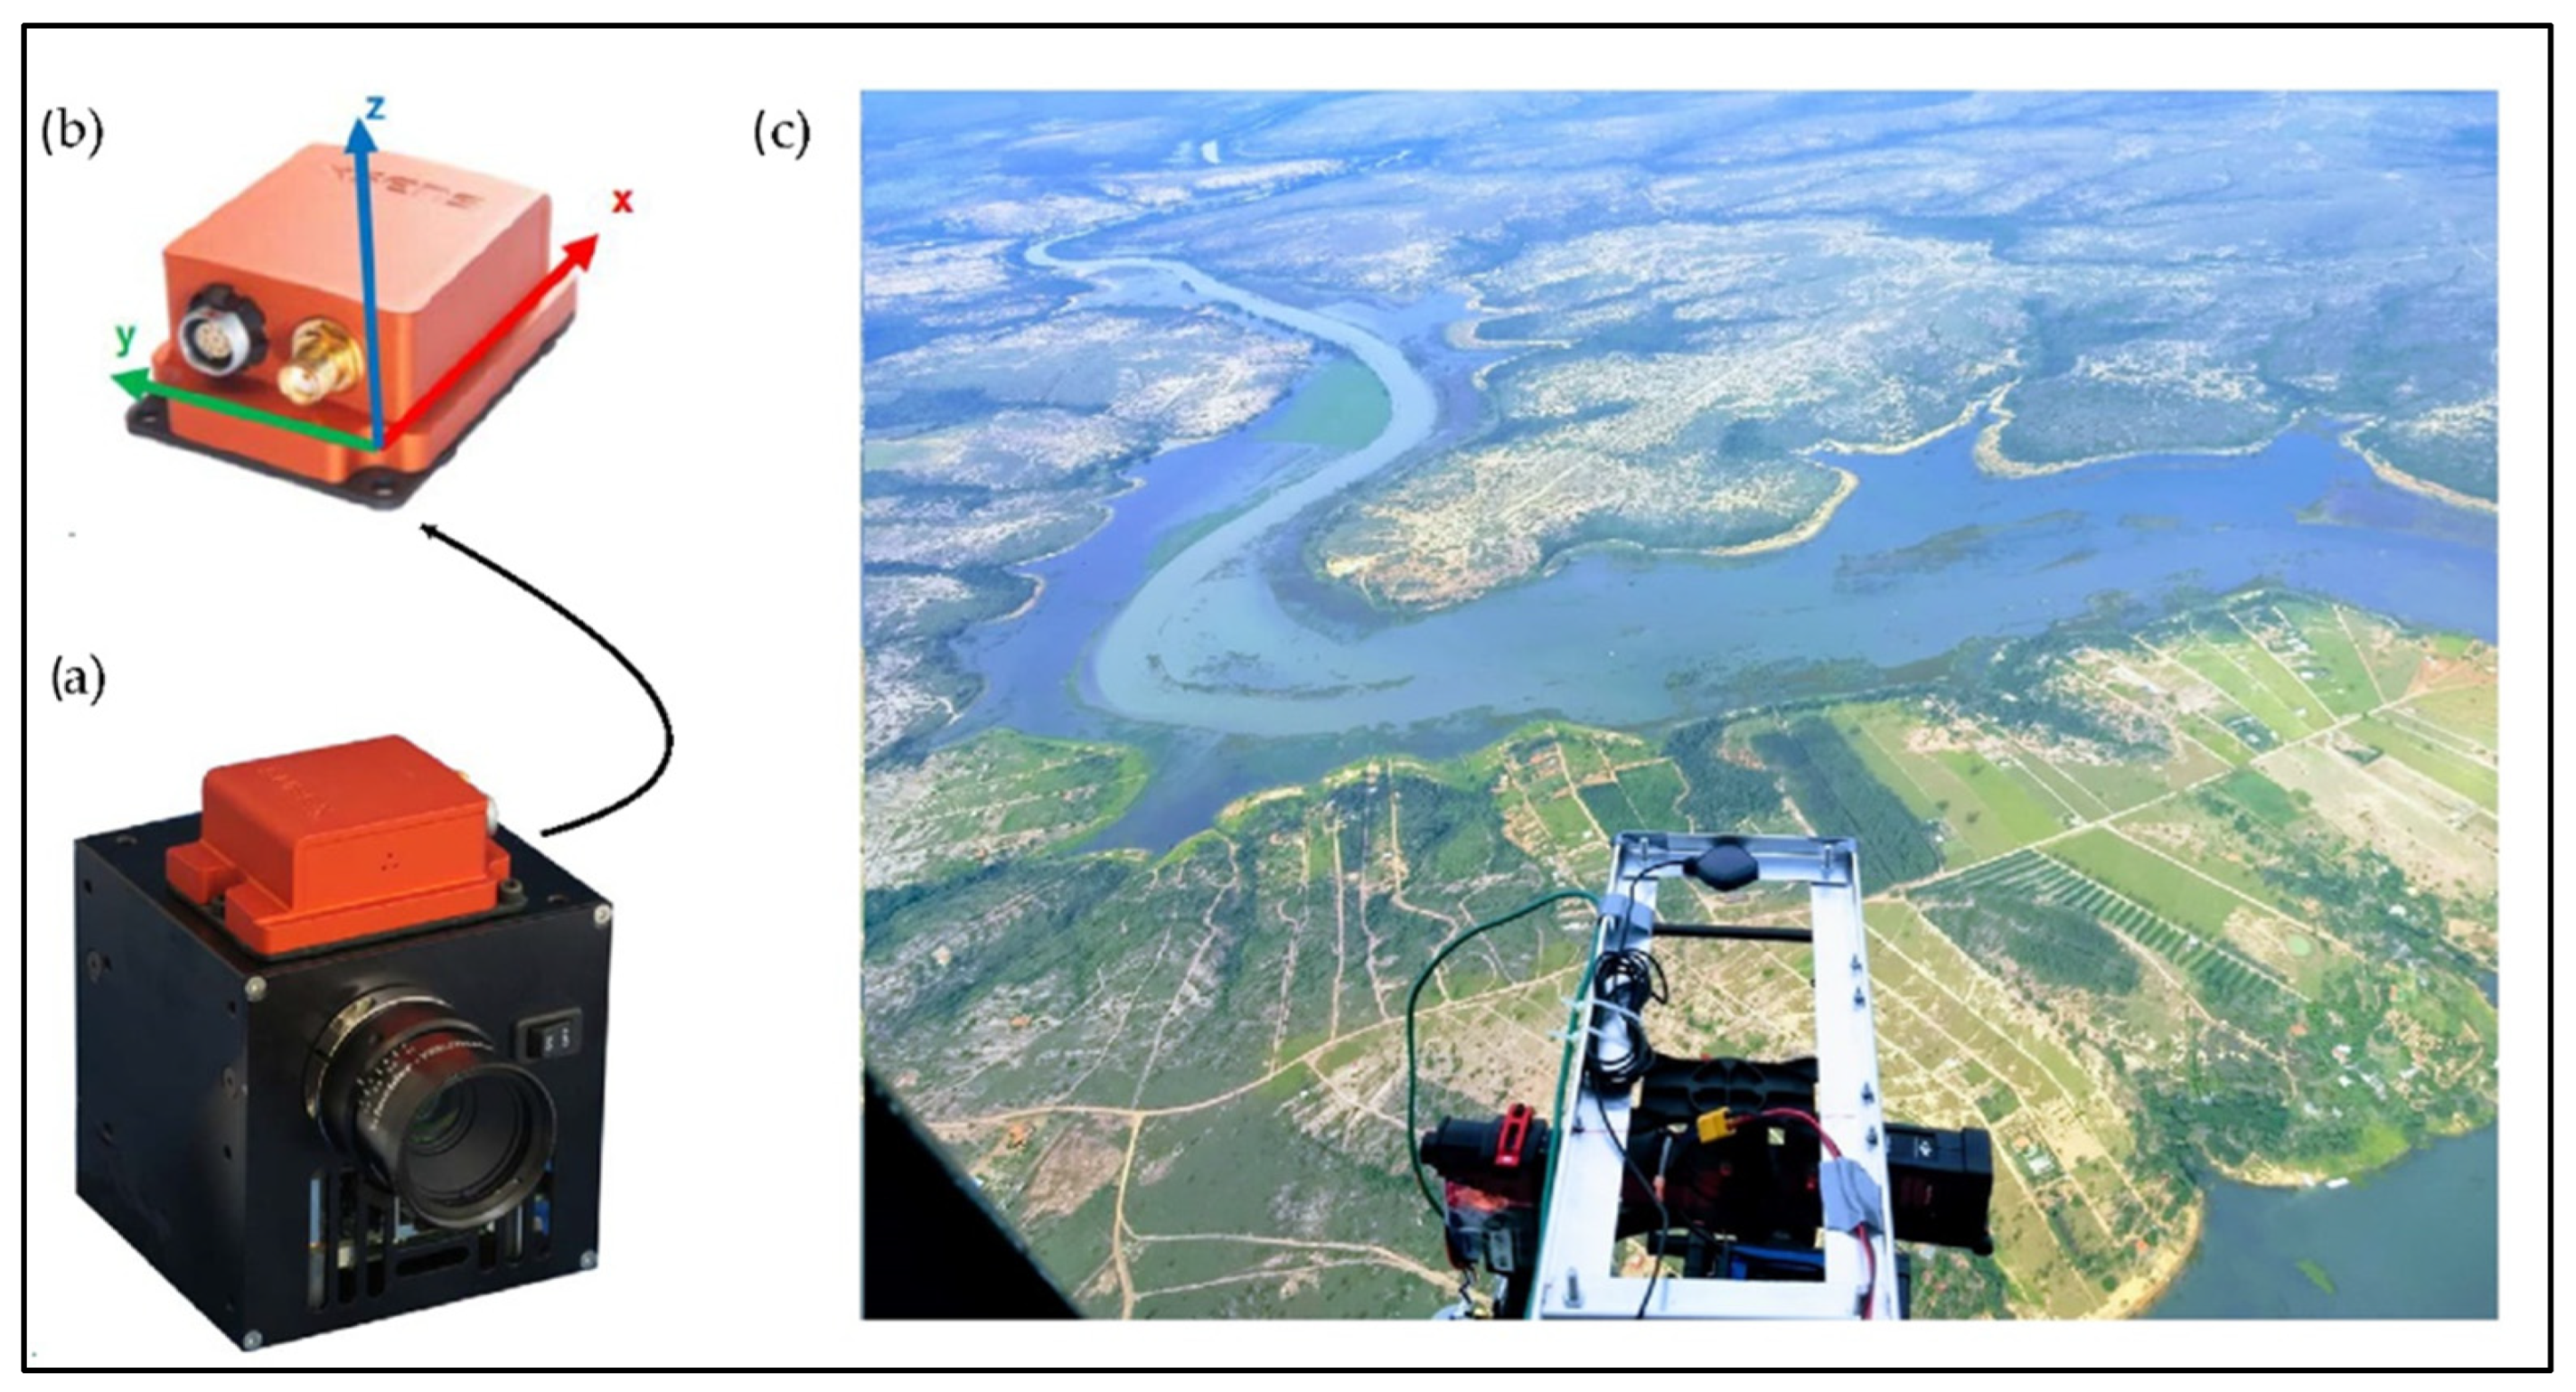
2.3. Hyperspectral Platform: Data Collection and Processing

The camera used is the Headwall Nano-Hyperspec sensor which weighed 680 g, with 276 bands and 2.2 nm spectral resolution covering a spectrum range from 400 to 1000 nm (Figure 3a). This camera has a sensor field of view (FOV) of 28.1° using a 12-mm lens with a complementary metal-oxide-semiconductor sensor. A subsystem can store 480 GB of the 12-bit radiometric resolution images. The images are acquired by the pushbroom scanning system for scanning pixel lines (Headwall Photonics Inc., Boston, MA, USA). This type of sensor acquires the entire line of the image at once and captures the image continuously with the motion of vehicle [29]. The Nano-Hyperspec is integrated with a GPS/IMU system that, with a GPS antenna and an internal magnetometer, generates the X, Y, and Z coordinate information through the inertial navigation system (Figure 3b).
The Nano-Hyperspec camera was affixed to a Brazilian Federal Police helicopter (Figure 3c), enabling coverage of expansive regions along the Paraopeba River, encompassing the entirety of the Retiro Baixo Reservoir, and a section of the Três Marias Reservoir upstream from the São Francisco River (Figure 1C,D). An adaptation using aluminum components was constructed to secure the camera onto the helicopter, and a Gimbal (DJI RONIN MX) coupled with 3D support for optimal fitting (Figure 3c) was employed to stabilize the Nano-Hyperspec at the nadir angle (90°) during image acquisition. Flight plans were configured in line with the camera’s FOV and the chosen flight altitude (1200 and 1500 m above the ground). In the GIS (Geographic Information System) environment, spaced lines were delineated at 380 m for 1200 m flight altitude, and 515 m for 1500 m flight altitude, ensuring a 20% lateral overlap (Figure 1C,D). These measures were taken to produce orthomosaics with a Ground Sampling Distance (GSD) of 17 cm. During flight execution, GPS navigation tools were utilized by the pilots to guide the helicopter along the designated flight lines as closely as possible.
Three software components are integrated into the Nano-Hyperspec package for configuration and data processing (Headwall Photonics Inc., Boston, MA, USA). XSENS is employed for calibrating the GPS/IMU system. Signal processing, in conjunction with sensor fusion algorithms, ensures the effective capture of platform dynamics under sustained vibrations, prolonged accelerations, and magnetic disturbances, providing necessary corrections ([30]). Hyperspec III offers various functional configurations, including radiometric, geometric, GPS, and automatic trigger settings for flight planning. Spectral View facilitates the processing of acquired images, including orthorectification using information from the GPS/IMU system, conversion of digital numbers to radiance and reflectance, and visualization of spectra generated by the scan.
Spectral View was used for the orthorectification of the scanner images and the construction of orthomosaics. However, in the calibration process, the hyperspectral orthomosaics from the Nano-Hyperspec camera underwent conversion from Digital Number (DN) to asSR using the Empirical Line Method [31]. This conversion involved establishing a direct relationship with in-situ Rrs values obtained by TriOS RAMSES hyperspectral spectroradiometer (Section 2.3).

2.4. Data Collection and Analysis

The entire methodology was as follows: (a) planning and execution of airborne surveys, (b) field collection of in situ data generally simultaneous to UAV surveys, (c) image processing to generate asSR orthomosaics, (d) analysis of the statistical performances of TSS models, and (e) TSS mapping using the most robust models for both multi and hyperspectral platforms.
The asSR pixel values, a sample of eight pixels, from the multi- and hyper-spectral orthomosaics, were extracted at the same geographic positions of the water sampling points for application of TSS models.
Considering the challenges posed by adverse sun glint effects and the complexities associated with constructing orthomosaics in homogeneous areas encountered during aerial surveys and image processing, this study aimed to identify alternative solutions through a comprehensive literature review. The objective was to determine the most suitable type of airborne platform for effectively monitoring TSS in continental waters, for small and large water bodies. Figure 4 presents the flowchart illustrating the sequential steps of the methodological procedures employed.
Field water quality and radiometric data sampling campaigns were conducted simultaneously with the flights. Spectroradiometric data were collected using the TriOS RAMSES, which offers a spectral resolution of approximately 2 nm across spectrum bands ranging from 320 to 950 nm. Remote Sensing Reflectance-Rrs data (Equation (1)) was derived using the method outlined by [32] for above water measurements. The installation structure and geometry of this equipment were implemented in accordance with the approach described by [33].
R rs   ( λ ) = L u ( λ ) L d ( λ ) p     E d
where: Lu is the upwelling radiance (W m−2 nm−1 sr−1) of the surface water; Ld is the atmospheric radiance (W m−2 nm−1 sr−1) used to correct the scattering effects of electromagnetic radiation in air-water interface; and Ed is the downwelling irradiance (W m−2 nm−1 sr−1) above the water surface conditions; p is a proportional factor depended on sky, wind speed, zenithal sun angle, and viewing geometry conditions. For p, the 0.028 value was used, ref. [32] estimated the p variability in relation to different influent factors, their results showed 0.028 value presented low variability when the Lu factor was acquired with a 40° off-nadir angle and a 135° azimuth direction from sun in a clear sky condition, wind speed lower than 4 m s−1, and a sun zenith angle variation varying from 0° to 60°.
Water surface samples, taken at a depth of approximately 20 cm, were gathered at the designated sampling points. These samples were then processed at the Geochemistry Laboratory of the University of Brasília to determine TSS concentrations. The water samples underwent filtration using a low vacuum millipore membrane filter with a porosity of 0.45 µm. The filters were drying at 105 °C for 1 h, weighed, filtered with the water sampled and finally redrying and reweighed with the filter “dirty”. TSS values (Table 1) were estimated employing the methodology detailed in [34].
Regression analysis was used to create and to evaluate the performance of the bio-optical models. Root mean square error (RMSE, Equation (1)) was employed to quantify the accuracy of the estimated TSS values relative to the in situ TSS data.
The reflectance and model’s effectiveness were evaluated using regression analysis and root mean square error (RMSE). The equations are as follows:
R 2 =   1 i = 1 N [ X X   ] 2 i = 1 N [ X X   ] 2
R M S E = 1 N i = 1 N X X 2
where X′ is the estimated values and X is the measured values (Rrs and TSS), with N being the number of data points.
RMSE was considered a key validation parameter because it represents the average difference between the observed values and the values predicted by the regression model. It provides an estimate of the magnitude of prediction errors and is used to evaluate the performance of the model in absolute terms. The R-squared (R2) was calculated to assess the explanatory power of the model in relation to the variation in the observed data.
Table 1 displays radiometric data gathered from diverse remote sensing platforms and corresponding TSS data acquired across various regions of Brazil. The extensive sample range enables comprehensive spectral insights into distinct TSS concentrations.

3. Results and Discussion

3.1. Acquisition Geometry Systems of Small Cameras: Insights into Monitoring Inland Water Quality

Various types of sensors adapted for UAVs have been developed, encompassing cameras capturing visible color images (RGB), as well as multispectral and hyperspectral systems, thermal, laser, and synthetic aperture radar (SAR) devices. A review by [23] on spectral sensors in optical systems available in the market categorizes these devices based on their distinct mechanisms for acquiring spectral information:
1. Airborne spectroradiometers: these are utilized to capture point-spectral information. While their spatial resolution may be limited, they stand out for their high spectral resolution and lightweight design. An application example involves their use in calibrating the MODIS orbital sensor for spatial monitoring of phytoplankton proliferation in Taiwan’s estuaries [35].
2. Pushbroom sensors: these function as scanning systems enabling the extraction of spectral information from the target. In this system, the sensor instantly records a spectral line with each exposure, and repetition of this process enables the generation of continuous spectral scanning. Pushbroom sensors are extensively used in satellites such, as Landsat 8 OLI and Sentinel II MSI, and they have also been adapted for crewed aerial surveys. Compact cameras utilizing this system are being designed for UAV applications.
3. 2D imaging sensors (Frame): in contrast to pushbroom, capture a spectral frame with each exposure. However, frame capture methods can vary, including the rolling shutter system, where frame recording occurs line by line during exposure, and the global shutter system, where the entire frame is captured during exposure. Despite being two-dimensional, frontal, and lateral overlaps allow the creation of three-dimensional models through the principle of image spectroscopy. This can be executed by software utilizing algorithms based on computer vision.
The imaging mechanism plays a crucial role in covering expansive water bodies, particularly in regions with homogeneity. This aspect becomes particularly relevant in situations where the camera’s FOV predominantly identifies water areas, devoid of the presence of other types of objects or distinct elements.
Frame cameras are programmed to capture images at specific time intervals and/or positions, with the ability to determine frontal and lateral overlaps between each image. The construction of orthomosaics from frame camera images is viable through photogrammetry software like Pix4D Mapper (Pix4D), Metashape (AGISOFT), APS (MENCI), and Graphos [36]. These programs employ computer vision technologies based on the Structure From Motion (SfM) method [36] for this process. Despite variations among these software tools, they all follow a procedural scheme involving image alignment, followed by the generation of sparse and dense point clouds. These points are used to create digital terrain and surface models through stereoscopy, which leverages the frontal and lateral overlaps between images. Moreover, the technique is also applied in constructing the orthomosaic, enabling the representation of a flat image.
The alignment process carried out by the SfM method involves converting image pixels into three-dimensional points, which are then used to align the images through the recognition of homologous points—these are identifiable points present in multiple images that the SfM can detect and correlate. However, in areas with visual homogeneity. such as forests, snow, deserts, and water bodies, recognizing these homologous points can be challenging, leading to difficulties in generating alignment for overlapping images. Additionally, the low textural variation in these areas hinders point matching algorithms, leading to alignment errors or deformations in the final orthomosaic. Water surfaces or areas with high brightness exhibit solar reflections and illumination variations, further complicating the consistent identification of correspondences between images. These challenges are further accentuated in turbulent flow environments, such as rivers. In such cases, the constant movement of water can result in the displacement of points between one image and another [37,38].
Figure 5 illustrates the process of generating an orthomosaic using Pix4D Mapper software, utilizing multispectral images obtained from the Sequoia camera. The images capture was focused on the Solimões riverbank, igarapés, and fishponds (Figure 1A), in the Amazon region. Upon visual analysis, it becomes apparent that images with the FOV exclusively over the water surface of the Solimões River (indicated by red dots) did not achieve accurate alignment with adjacent images. Conversely, images in which the FOV encompassed both water and terrain (indicated by green and blue dots), demonstrated suitable alignment with neighboring images.
The mentioned issues are absent in pushbroom cameras due to their distinct imaging system, which continuously generates a scanner as the sensor moves, thereby forming images along the flight lines. Unlike frame cameras, extensive overlapping of images in frontal and lateral directions is not necessary for mapping water bodies using pushbroom cameras. Rather, a few scanning flight lines with low lateral overlap are sufficient. However, operating pushbroom cameras is more intricate. For instance, with the Headwall Nano-Hyperspec camera, acquiring high-quality images requires careful synchronization of flight speed and altitude with the camera scanner’s trigger setting. measured in frames per second.
Figure 6 shows successfully acquired scanners at each flight line using the Nano-Hyperspec camera mounted on a helicopter, effectively covering extensive water bodies, including the entire Retiro Baixo reservoir and a portion of the Três Marias reservoir within the São Francisco River Basin (Figure 1C,D). Occasional failures between consecutive lines arose due to the helicopter’s deviation from the intended flight path, as the flights were not autonomous. Nevertheless, these failures are deemed negligible, given that most of the reservoirs were encompassed by the acquired scanners.
Despite their limitations in homogeneous water body coverage, frame cameras remain valuable tools for inland water monitoring, particularly in smaller-scale regions. They prove useful in areas where captured images encompass both water bodies and land, featuring identifiable homologous points within the images. This applicability extends to region such as river and tributary confluences with water reservoirs, as seen in the study areas of this work in the Paranoá and Corumbá IV reservoirs. Such regions hold significant importance for water quality monitoring, enabling quantification and control of constituent loads reaching the reservoirs. Furthermore, it’s noteworthy that medium and low spatial resolution (>10 m) satellite images are unsuitable for monitoring these areas due to limitations in obtaining pure water pixels in such specific contexts.

3.2. Sun Glint: Definition and Correction Approaches

Sunglint (Figure 7) is a physical phenomenon characterized by the reflected sunlight’s beam on water surfaces, as well as on other specular materials like ice and metal. It emerges when the zenith angle of sunlight’s equals the viewing angle of the camera [39]. This effect is undoubtedly undesirable for water quality monitoring via remote sensing methods, as it disrupts the authentic spectral response of both the surface and water column, particularly its components.
Issues stemming from sun glint have been observed and studied since the inception of remote sensing with satellite imagery in oceanic environments in the 1950s [40], they remain a contemporary concern across oceanic, coastal, and continental settings [41,42]. Sun glint presents a pervasive challenge affecting various forms of satellite imagery, regardless of spatial resolution. Neglecting its correction can significantly threaten the accuracy of outcomes in water quality-related applications [43]. It’s important to note that sun glint also impacts airborne imagery, thought to a lesser extent, thanks to the greater operational adaptability of these platforms. Manned airborne surveys, characterized by higher autonomy and potential for operation at elevated altitudes, tend to be less vulnerable to these effects compared to UAV airborne surveys.
Numerous satellites, particularly those intended for water quality-related purposes like SeaWiFS. Ocean Colour Sensor (OCTS), Coastal Zone Color Scanner (CZCS), and Sentinel-3, implement tilt strategies to mitigate Sun Glint impacts [44,45]. Tilted orbital sensors, adjusted by approximately 20° relative to the nadir direction, have demonstrated the capacity to prevent or substantially diminish these undesirable effects [41].
Within the field of manned airborne platforms, strategies to mitigate sun glint effects primarily revolve around flight path design and image acquisition timing. Investigations like those conducted by [45,46] have showcased effective Sun Glint mitigation by employing flight lines directed away from the sun and by tilting the sensor at angles ranging from 30 to 60°. Alternatively, flying with the camera at nadir but under a high solar zenith angle has also proven successful in countering sun glint. Regarding UAVs, adhering to these protocols has led to the acquisition of high-quality images with the Sequoia camera, exhibiting minimal sun glint, particularly under medium to high solar zenith angles (θ). The study by [47] demonstrated that aerial surveys with θ > 46° were effective in generating orthomosaics devoid of sun glint.
Figure 7 displays RGB and NIR images from the Sequoia camera acquired at θ = 17°, depicting sun glint at the confluence of the Negro and Solimões Rivers (left, A and B). Conversely, Figure 7 (right, C and D) showcases images from the same camera captured at θ = 72°, along flight lines in both frontal and opposing directions to the sun within the Paranoá reservoir, revealing the absence of sun glint. These observations confirm the potential of acquisition strategies during higher solar angle conditions in minimizing sun glint impact on UAV-obtained images, thereby enhancing the accuracy and reliability of acquired data.
Ref. [41] categorized sun glint correction methods into two distinct groups. The first category pertains to oceanic waters and involves low spatial resolution images. This class employs radiative transfer models, such as [40], while incorporating wind speed and swell as variables in the correction process. The second category focuses on high spatial resolution imagery. In this second class, many methods utilize NIR bands for sun glint correction, employing a similar principle as atmospheric corrections for oceanic waters. Given that the reflectance is null in this wavelength for oceanic waters, sun glint can be detected and rectified through high reflectance values, as demonstrated in models developed by [47,48].
Correction models that rely on NIR spectrum for high spatial resolution imagery. while proven accurate in certain scenarios like clean water river bathymetry [49], pose practical challenges for water quality monitoring in most inland environments. These models become less feasible in such contexts, particularly with turbid waters since the spectral response at NIR is not null as elevated concentrations of TSS lead to stronger light scattering and subsequently increased reflectance values. Alternative strategies to mitigate sun glint effects have been explored, such as the approach proposed by [42]. This method harnesses the shortwave infrared (SWIR) band, leveraging principles akin to those of NIR. In the SWIR band, reflectance is inherently suppressed in waters, irrespective of elevated concentrations of TSS. Nevertheless, this approach is not applicable to the cameras utilized in this study, as they lack SWIR bands within their spectral range.
The mask application method proves to be the most suitable approach for correcting sun glint in the multispectral images obtained in this study. While [39] automated mask application through computer programming, image processing software like Pix4D Mapper and Metashape provide flexible tools for mask implementation. In this study, the Mosaic Editor tool in Pix4D Mapper was employed, enabling the manipulation of the resulting orthomosaic. This tool allows users to delineate a polygon over an area affected by sun glint. Subsequently, the tool presents an alternative set of images covering the same region, enabling the selection of an image unaffected by sun glint (Figure 8).
Figure 9 displays orthomosaics of the Sequoia camera’s NIR band, depicting the study area, with one image prior to mask application (A) and another image post-mask application (B), leading to the removal of the sun glint effect. The efficiency of this effect’s removal is evident in the post-processed orthomosaic, where images have been replaced, notably seen in the elimination of linear sun glint patterns extending from south to north, as observed in Figure 9A.
The sun glint deletion method utilizing masks is not applicable to pushbroom cameras due to the absence of an alignment process for overlapping images and the generation of point clouds during orthomosaic construction, as seen in frame cameras. Additionally, for Nano-Hyperspec, SWIR correction methods are not viable due to the absence of bands within this spectrum range on the camera. However, an alternative approach involves utilizing the bands around 950 to 1000 nm, as present in the camera. For those spectral bands, it is reasonable to assume that reflectance values remain negligible for turbid water presenting lower TSS concentration than 50 mg L−1.
Although this work presents a method for eliminating the effects of sun glint on the orthomosaic through masking, it is important to highlight other correction methods available in the literature. Ref. [50] tested four conventional methods commonly used for correcting sun glint in multispectral drone imagery for monitoring water transparency, with model correlations ranging from 0.65 to 0.92. In addition, innovative approaches have been proposed, particularly those utilizing machine learning techniques. For instance, ref. [51] compared the effectiveness of traditional methods with deep learning methods in the context of high-resolution UAV imagery. The results indicated that while traditional methods face challenges when applied to UAV imagery, deep learning methods show considerable promise. Finally, it is worth noting the methodology proposed by [52], which introduce a novel sun glint correction pipeline. This approach integrates a semantic segmentation network based on foreground attention (FANet) with pixel propagation based on optical flow. However, these methodologies have primarily been applied to water or UAV imagery.

3.3. Radiometric Accuracy and TSS Monitoring by Multispectral and Hyperspectral Cameras

In this section we provide an overview of the insights gained from the remote sensing data surveys conducted using both in situ and airborne platforms equipped with multi and hyperspectral cameras. The primary goal of these efforts was to assess the accuracy of these approaches in monitoring TSS. In situ radiometric data are regarded as the benchmark for field reference, as they are acquired following rigorous acquisition protocols that minimize atmospheric interferences and sun glint effects. Consequently, these measurements serve as a dependable tool for evaluating the precision of orbital and airborne platforms across a range of applications.
Figure 10 illustrates Rrs in situ spectra captured in the field using the TriOS Ramses spectroradiometer. It also presents correlation coefficient (r) and determination correlation and determination coefficients (R2 and r) values for each band concerning TSS concentrations. These r and R2 values signify the strength of the connection between the reflectance spectra and TSS levels, offering a quantitative evaluation of the spectral bands’ TSS estimation accuracy. Notably, the NIR region exhibits the most significant correlation. Coefficient values above 0.9 across a wide range of NIR and red-edge (750 nm to 950 nm) indicate a robust relationship between the Rrs spectra in these bands and TSS concentrations.
The reflectance values in waters containing TSS are complex and highly dependent on the specific characteristics of the water body. The spectral behavior of TSS is influenced by the scattering and absorption of phytoplankton particulates, the absorption of organic particulates, and the scattering of inorganic minerals. The scattering process itself is further influenced by several factors, including the size, shape, and mineralogical properties of the particles. Due to these complexities, developing a universal equation to estimate TSS remains a challenging task [7,53].
Reflectance within the NIR range is primarily influenced by TSS backscattering, as light absorption process by OACs is generally absent at thoses wavelengths [54]. Earlier studies involving field spectra, such as [55], have already showcased a robust correlation between reflectance within the 700 to 800 nm and TSS concentrations in reservoirs within the Mississippi region. Furthermore, [56] conducted research indicating a significant correlation between reflectance at 810 nm and TSS concentration in boreal lakes across Europe, encompassing TSS values ranging from 0 to 64 mg/L. Manned aerial surveys employing hyperspectral cameras have also proven effective in TSS monitoring through NIR bands, as demonstrated by [56,57] in river and lake settings. These findings emphasize the NIR’s crucial role as a valuable tool for accurate TSS estimation in aquatic environments.
Despite the high correlation between NIR and TSS for in situ and airborne spectra, it is a significant challenge for orbital platforms, which often encounter issues with adjacency effects and atmospheric correction residues due to the water low albedo [2]. Numerous investigations have indicated diminished radiometric accuracy in the NIR bands of satellite images above continental waters. For instance, studies conducted by [58] (in the Amazon and by [59] in Paranoá reservoir have highlighted this concern.
While the NIR region is commonly utilized for TSS monitoring, it’s crucial to emphasize its limitations in situations of extremely high or low concentrations. At elevated concentrations, reflectance saturation occurs. A study by [33] examined TSS (5–620 mg L−1) and Rrs data at 279 stations across the Amazon basin. The comprehensive analysis revealed that levels surpassing 600 mg L−1 lead to NIR saturation, indicating that the NIR/RED band ratio is more suitable for addressing this scenario. In the context of low concentrations, a recent study by [47] demonstrated that algorithms employing visible spectrum bands were more effective in estimating concentrations below 20 mg L−1, particularly in high spatial resolution settings.

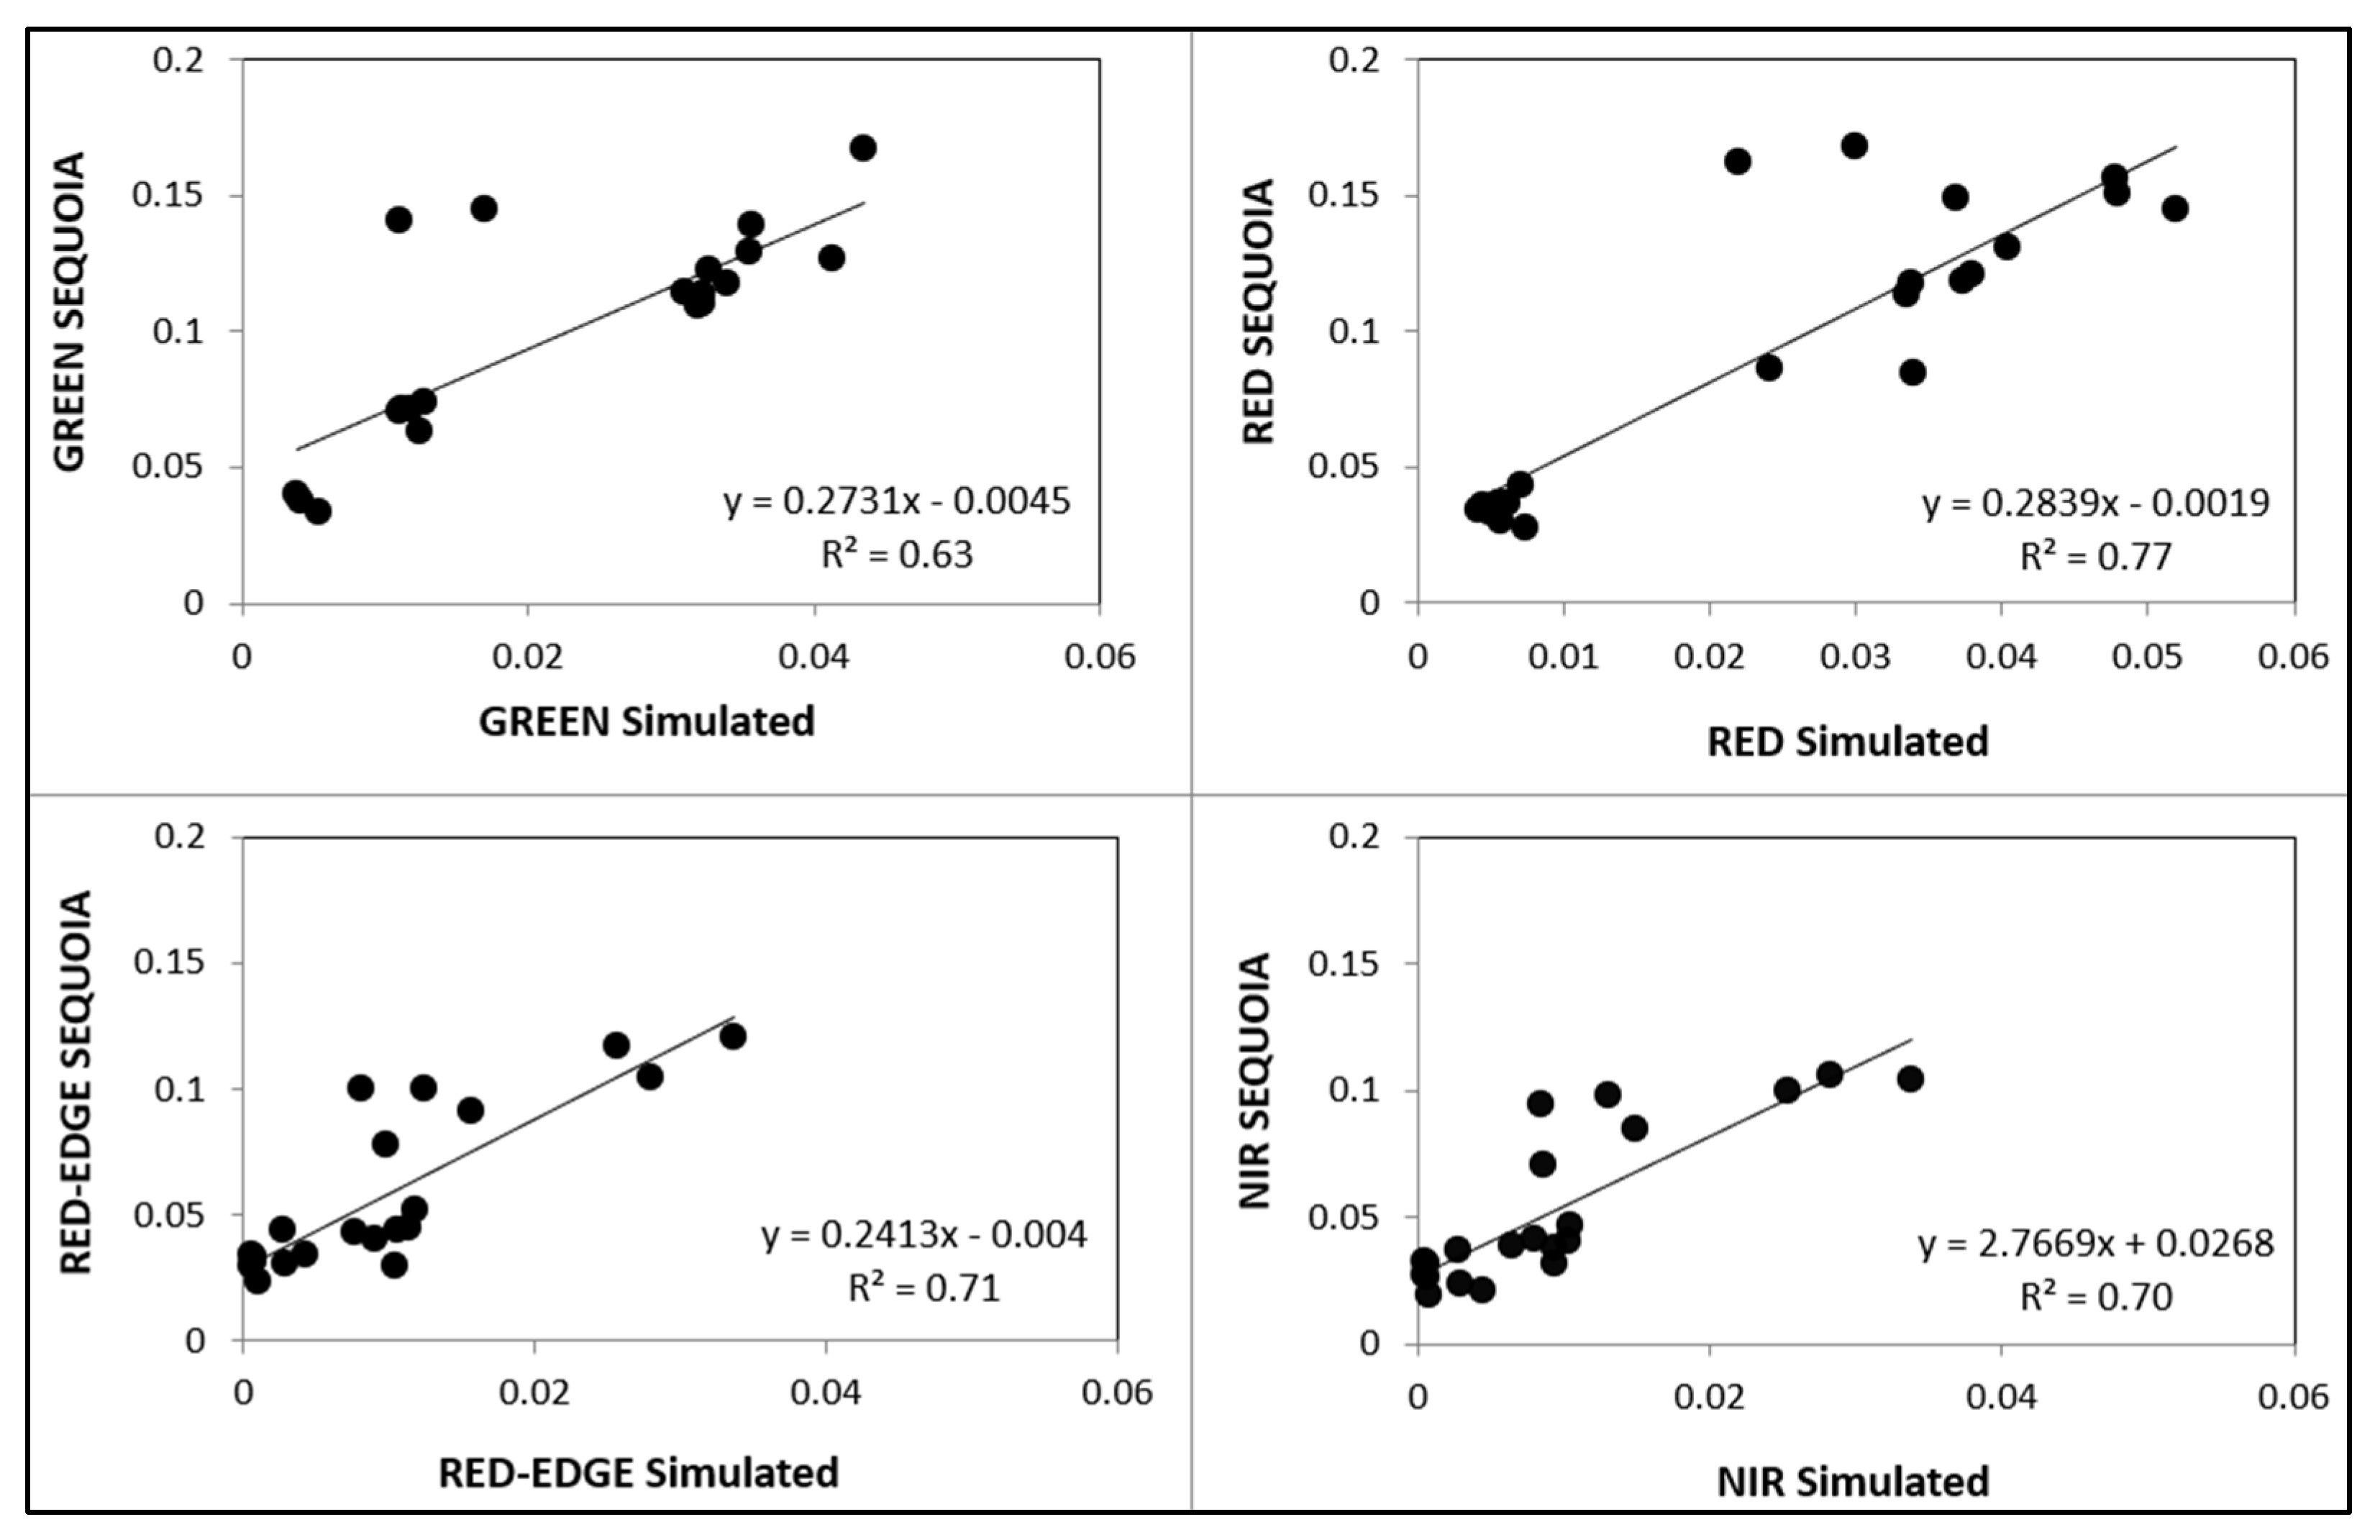
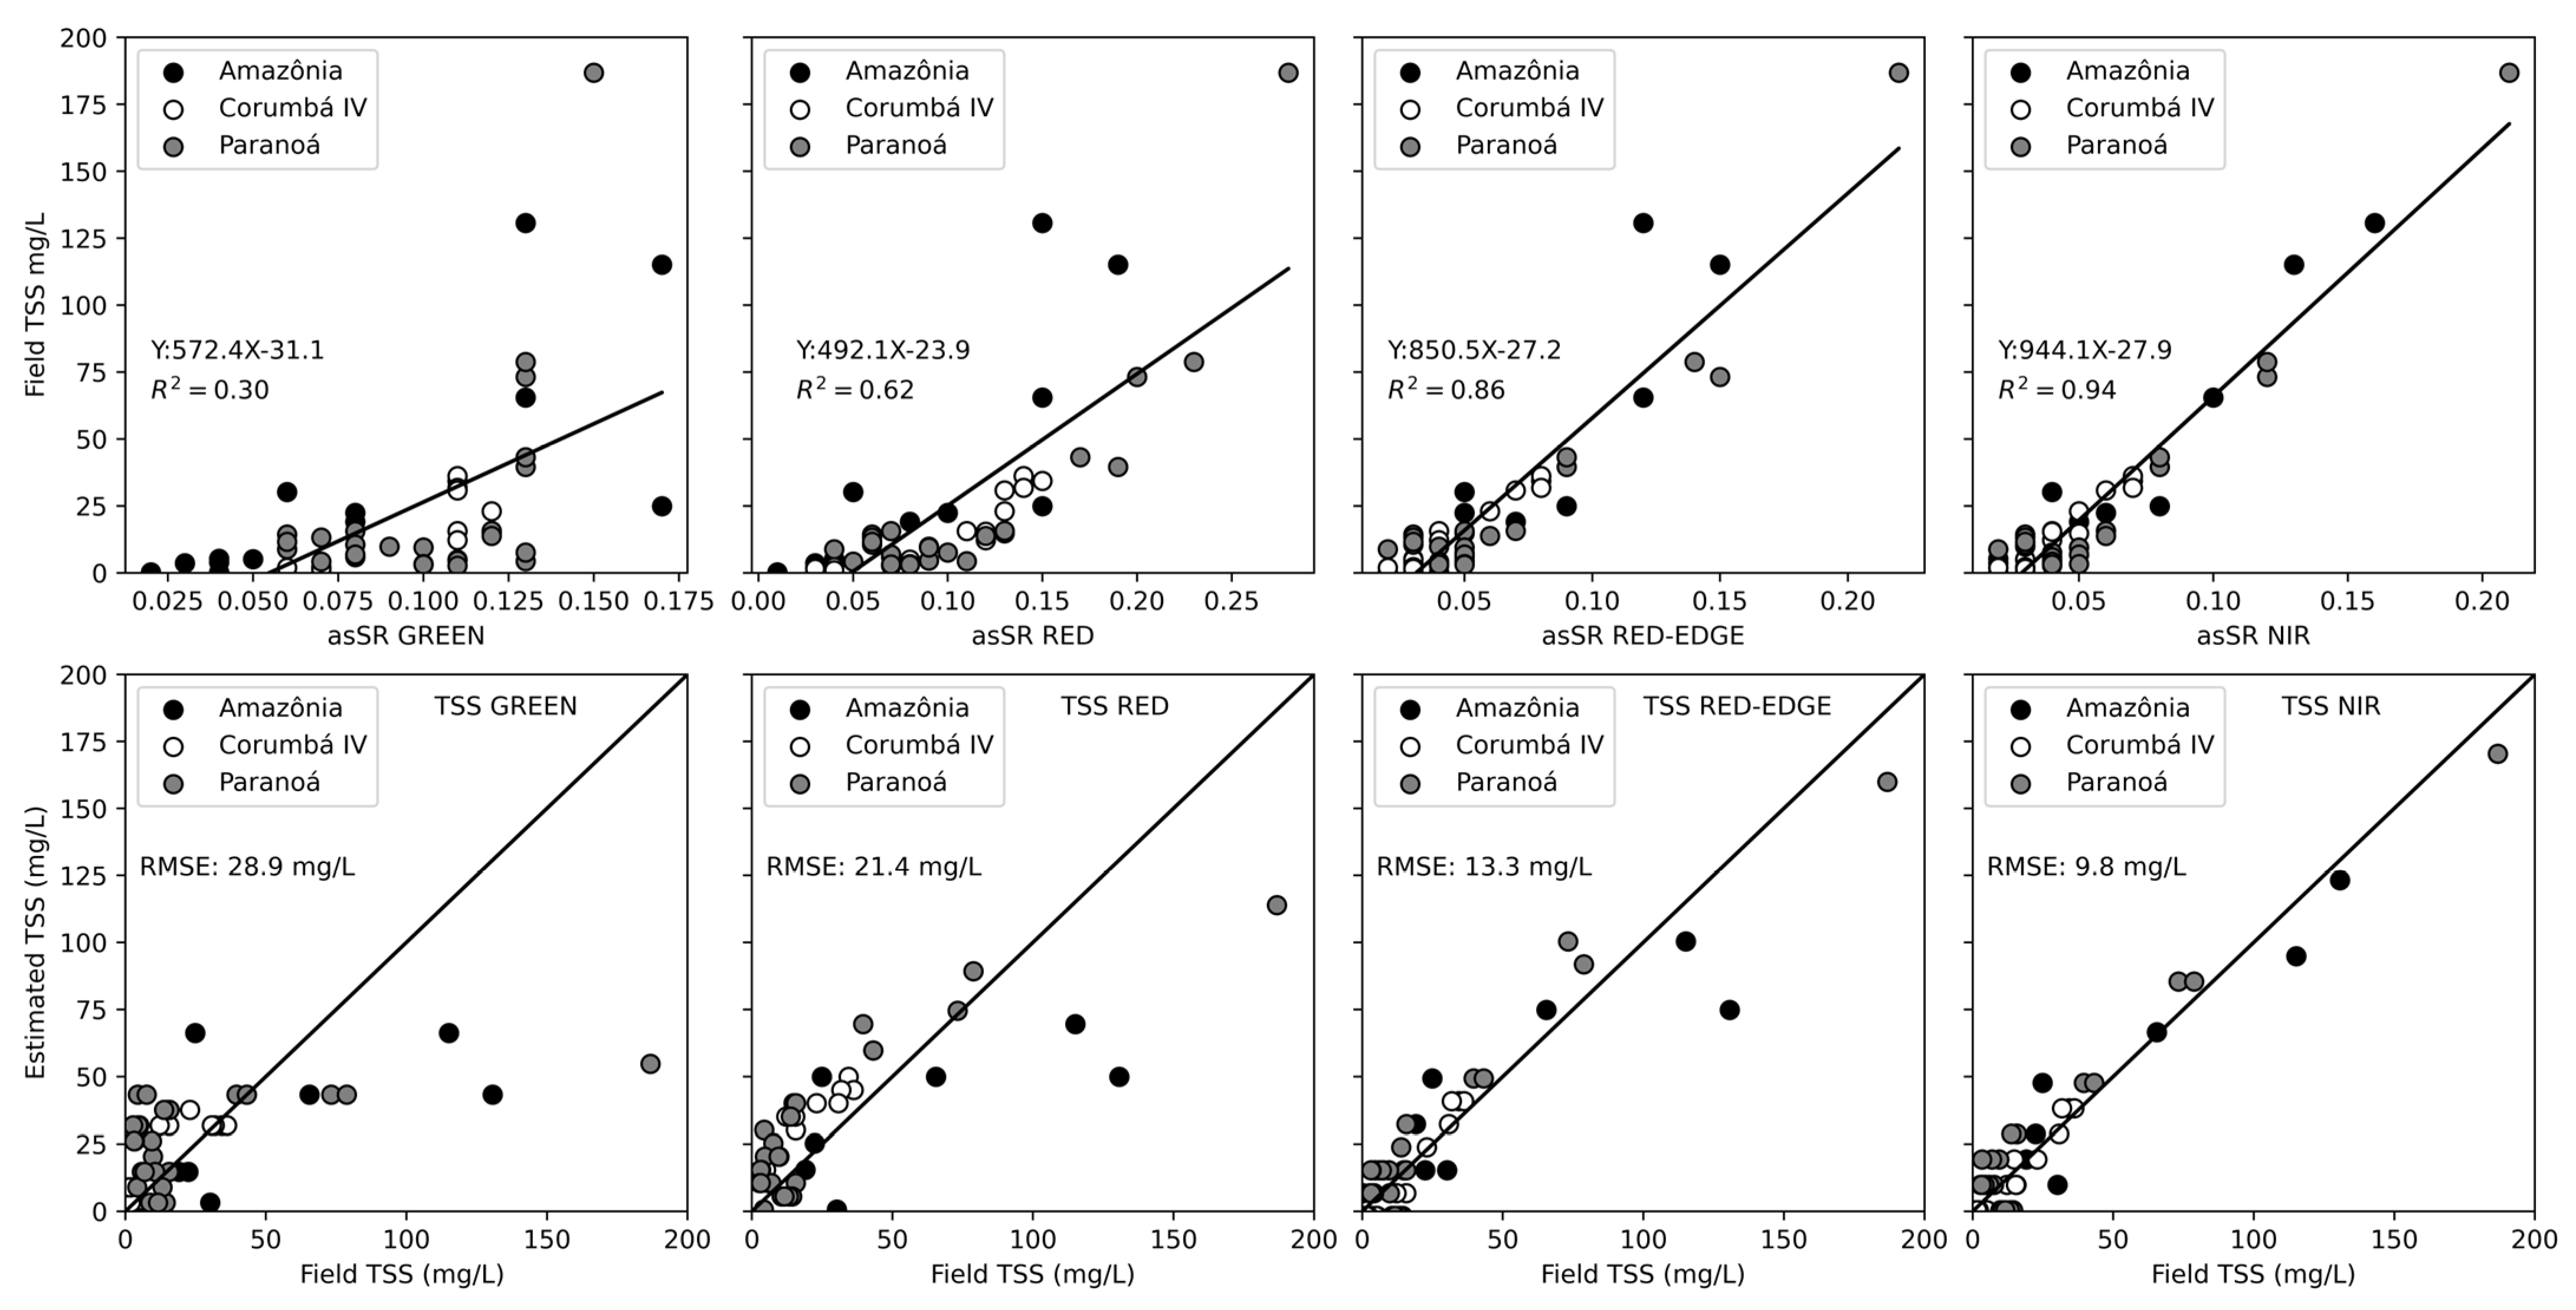
3.3.1. Multispectral Camera

Incorporating in situ Rrs data obtained during campaigns in Corumbá IV reservoir, in the Amazon, and the São Francisco Basin (Table 1) facilitated the assessment of asSR data accuracy from the utilized cameras. For the Sequoia camera, a comparison was conducted between asSR values and band values simulated from Rrs data, illustrated in Figure 11. The dispersion across values reveals robust radiometric consistency, particularly within the RED-EDGE and NIR bands, which typically present challenges for orbital sensors. This outcome reflects positively on the Sequoia camera’s capability to deliver reliable TSS estimation information.
Figure 12 highlights an even stronger correlation between NIR and TSS. In all instancesthe correlations exhibit R2 values surpassing 0.9 (RMSE: 9.8 mg L−1). As a result, the subsequent step involved the implementation of predictive models employing solely the NIR band for TSS mapping utilizing multispectral camera.
Figure 13 illustrates TSS mapping generated using the Sequoia camera across distinct biomes—the Cerrado (A and B) and the Amazon (C and D). The visual depiction accentuates fluctuations in TSS concentration, notably showcasing significant distinctions at the confluence point of the Solimões River’s turbid waters with the darker waters of the Negro River (C). Correspondingly, regions where turbid waters from the Solimões River intersect with dark waters from igarapés and fishponds are also highlighted (D), along with the capability to identify suspended sediment inputs from tributaries into reservoirs, potentially influencing the siltation process (A and B).

3.3.2. Hyperspectral Camera

Regarding the Nano-Hyperspec camera, Figure 14 compares in situ Rrs spectra with the Nano asSR values post empirical line calibration. Taking the Rrs (top graph) as a reference, the similarity between the two graphs demonstrates the efficiency of the calibration of the Nano-Hyperspec camera using the empirical line method.
The observation that the most substantial correlations with TSS occur in the NIR wavelengths concurs with earlier findings, underscoring the pivotal role of this spectral range in accurately gauging TSS concentrations R2 values increased from the blue bands to the NIR bands. At shorter wavelengths, a saturation of reflectance was observed, which does not effectively discriminate between varying concentrations of TSS. The relationship between TSS and reflectance becomes better adjusted (R2 > 0.8) in the NIR bands, where Rrs or asSR is primarily influenced by the backscattering of suspended particles [54].
Following the correlation analyses with the spectral data, the estimated TSS was calculated using a semi-empirical model derived from the linear regression equation applied to the Rrs832 nm (RMSE: 3.5 mg L−1). TSS maps for a long stretch of the Paraopeba River (~38 km), the entire Retiro Baixo reservoir (~86 km2), and an initial part of the Três Marias reservoir (~31 km2) are presented in Figure 15 and Figure 16. These maps illustrate a consistent distribution of TSS within the study area. For instance, Figure 15 highlights the increase in TSS levels in the Paraopeba River following the confluence with the tailing’s intake, attributed to the high sediment load from the dam breach, where the river flows in an easterly direction. Additionally, TSS levels decrease along the Paraopeba River downstream toward the Retiro Baixo and Três Marias reservoirs (Figure 16).
As reiterated from Section 2.4, the analysis of these TSS maps serves as pivotal guidance for comprehending and addressing pertinent matters. The increase in TSS levels downstream of the Paraopeba River following the confluence with the impacted stream signifies the presence of tailings along the river’s course. Conversely, the observed low TSS levels in the Retiro Baixo and Três Marias Reservoirs indicates that the tailings did not extend to the São Francisco River until the time of monitoring.

4. Final Considerations: Guidance for Mitigating Sun Glint Effects and Optimizing UAV Platforms in TSS Monitoring

This study demonstrates the effectiveness of small airborne cameras in monitoring TSS in inland waters, with a particular focus on improving radiometric accuracy through sun glint mask techniques. The proposed methodology integrates feasible masking approaches to mitigate sun glint effects, ensuring more reliable retrieval of reflectance values. The results underscore the importance of tailored correction techniques in aquatic remote sensing, paving the way for more accurate and consistent monitoring of TSS dynamics in diverse inland water systems. Sun glint distorts the true spectral response of water column, compromising data accuracy when monitoring TSS or other in-water components. High viewing angles and careful flight planning—such as aligning flight paths against the sun or using sensor angles between 30° and 60°—are effective strategies to mitigate sun glint effects, particularly when the solar zenith angle exceeds 46°. If avoidance is not possible, applying masks or performing sun glint correction is a feasible alternative. Common correction techniques use NIR band as a reference; however, these methods are less effective in turbid waters where NIR reflectance influenced by TSS. In such cases, SWIR band may offer a viable solution. Masks to exclude sun glint-affected regions during orthomosaic construction provide an additional corrective approach, though this is primarily applicable to frame cameras. Beyond traditional methods, emerging techniques such as machine learning and neural networks for semantic segmentation demonstrate significant potential for enhancing sun glint correction in UAV-acquired imagery.
Cameras adapted for UAVs exhibit distinct characteristics that can be both advantageous and challenging for monitoring TSS, as any OAC, depending on the conditions. Frame cameras provide a practical solution for monitoring smaller areas but encounter significant difficulties in regions of high visual homogeneity, where image alignment and orthomosaic generation become problematic. The presence of solar reflections and lighting variations, particularly in turbulent flow environments, exacerbates alignment errors. In contrast, pushbroom cameras do not require extensive image overlaps, making them more effective for covering large aquatic areas. However, their operation is more complex and necessitates precise alignment between flight speed and camera trigger settings to ensure optimal performance.
Multispectral and hyperspectral cameras have proven effective for monitoring total suspended solids (TSS), with the near-infrared (NIR) band playing a pivotal role in concentration estimation. Calibration and the application of semi-empirical models enable accurate assessments in regions where rivers and reservoirs converge, areas of high contrast in the Amazon, and zones impacted by events such as the Brumadinho dam collapse. However, challenges remain, particularly with reflectance saturation at very high TSS concentrations and in areas with low sediment levels, which can hinder precise monitoring.
Based on the theoretical foundation, conducted tests and presented outcomes, the recommendation for an optimal small camera suited for airborne TSS monitoring in inland waters, in terms of spectral resolution, is as follows:
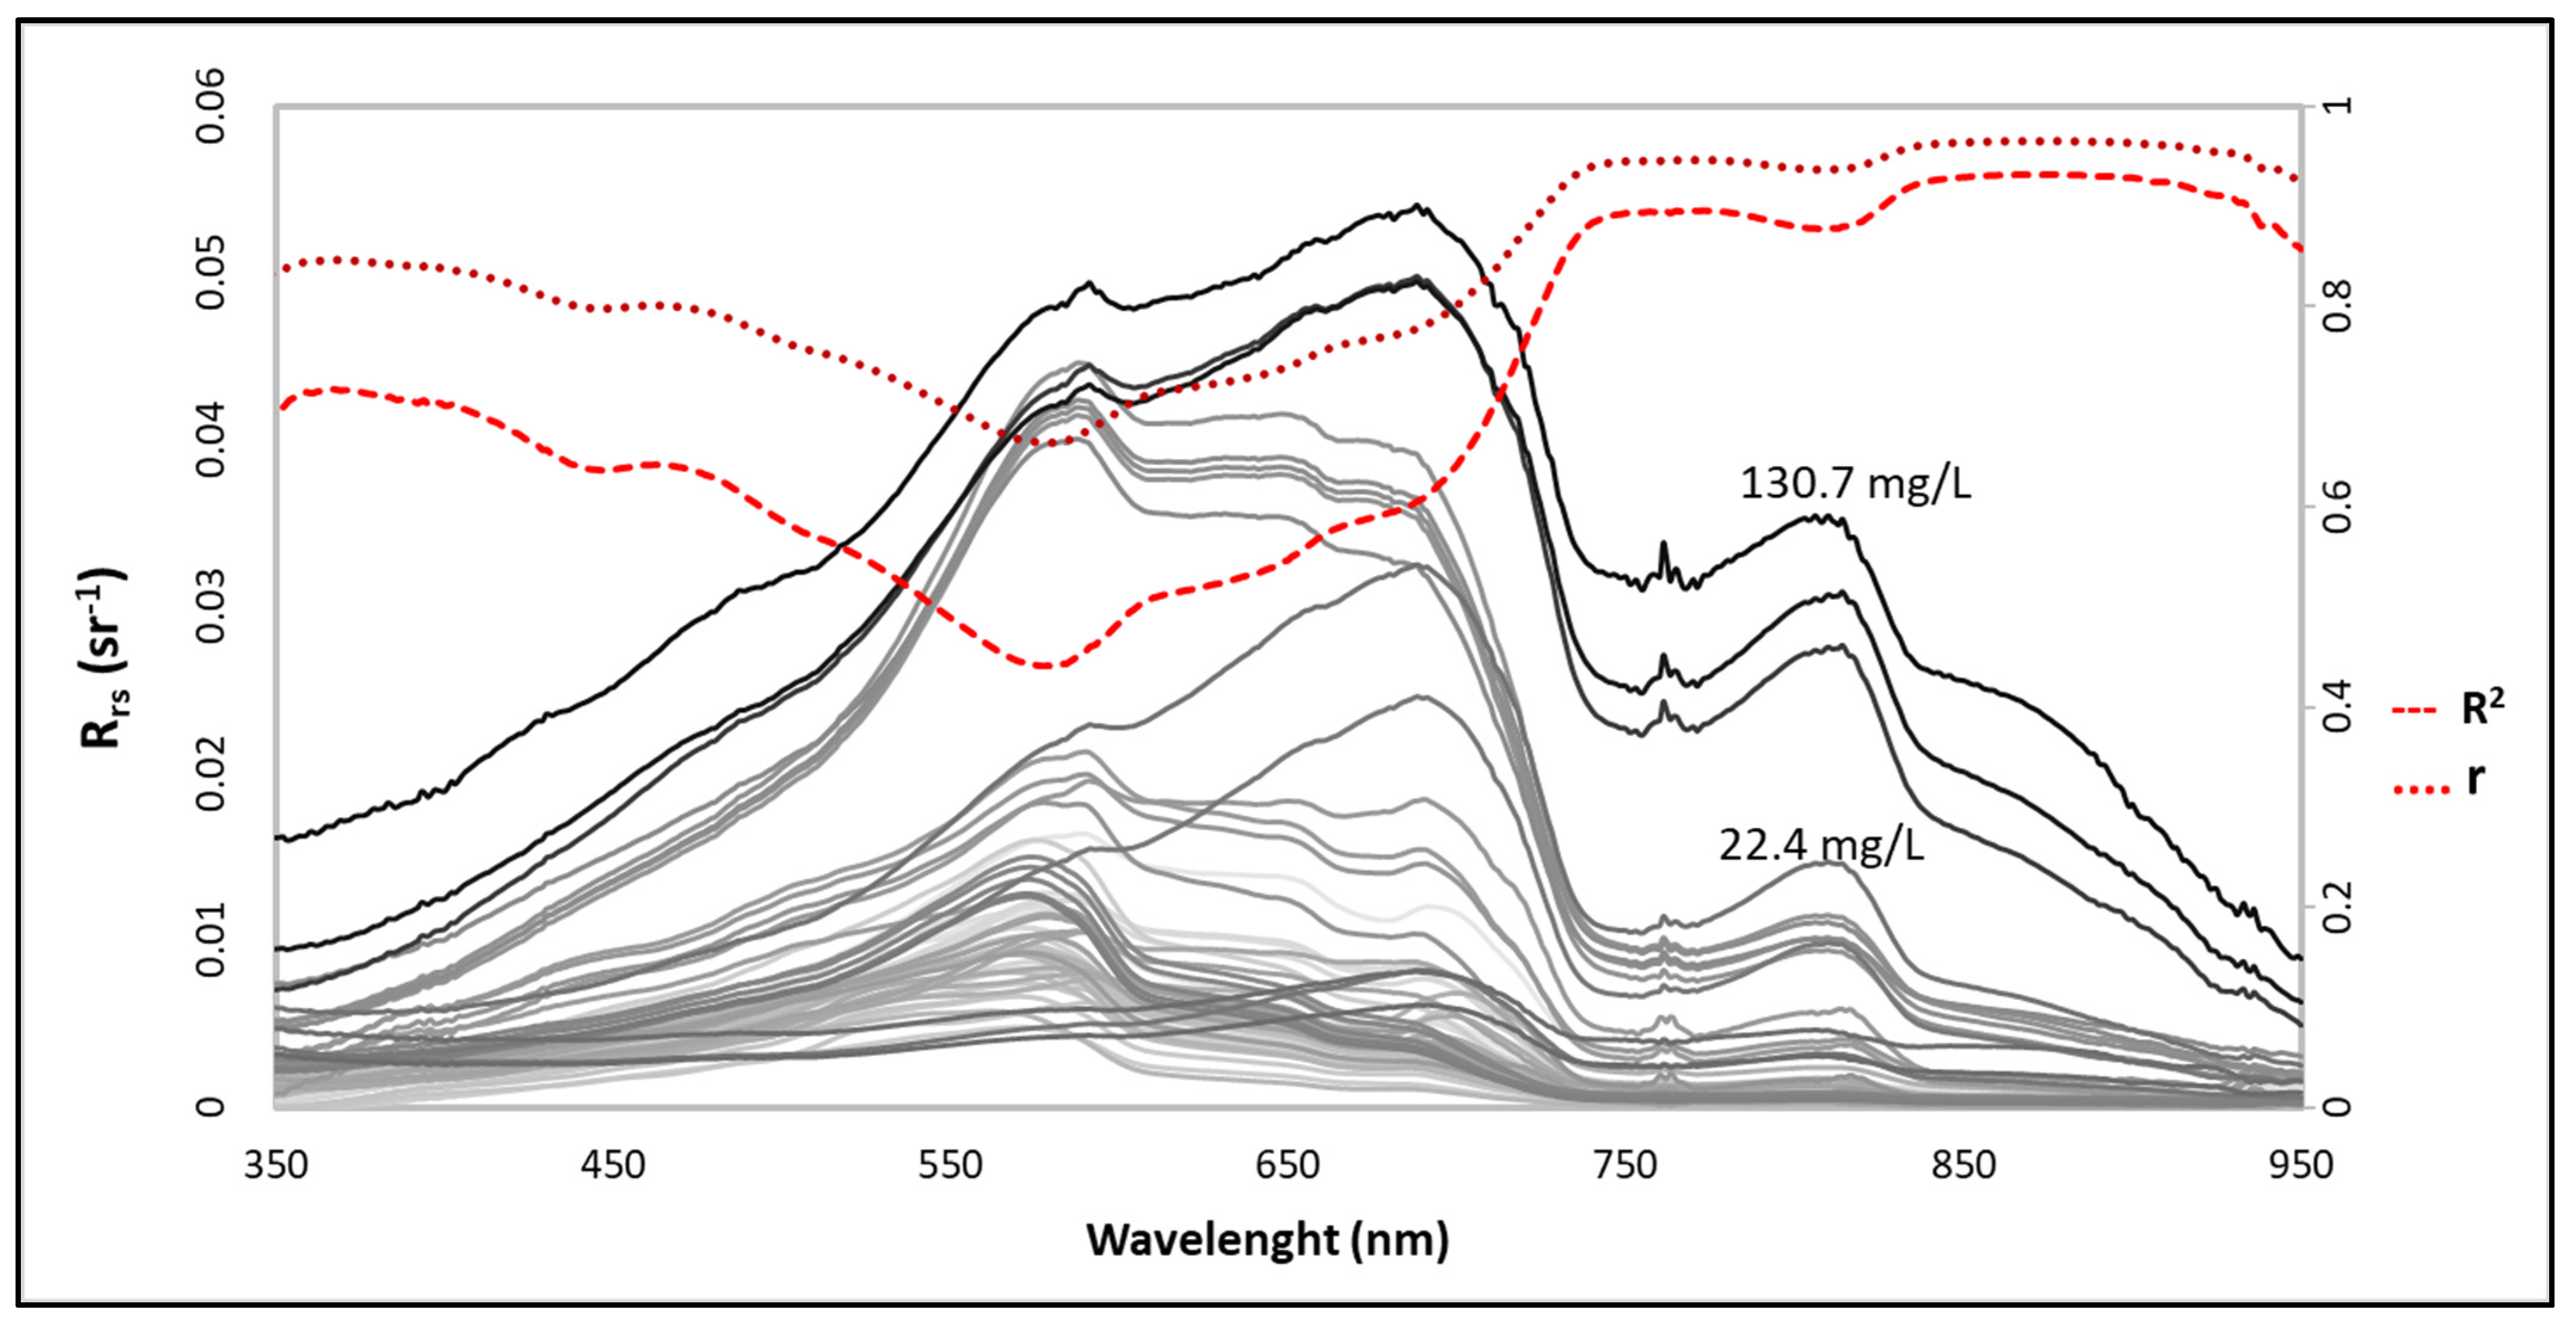
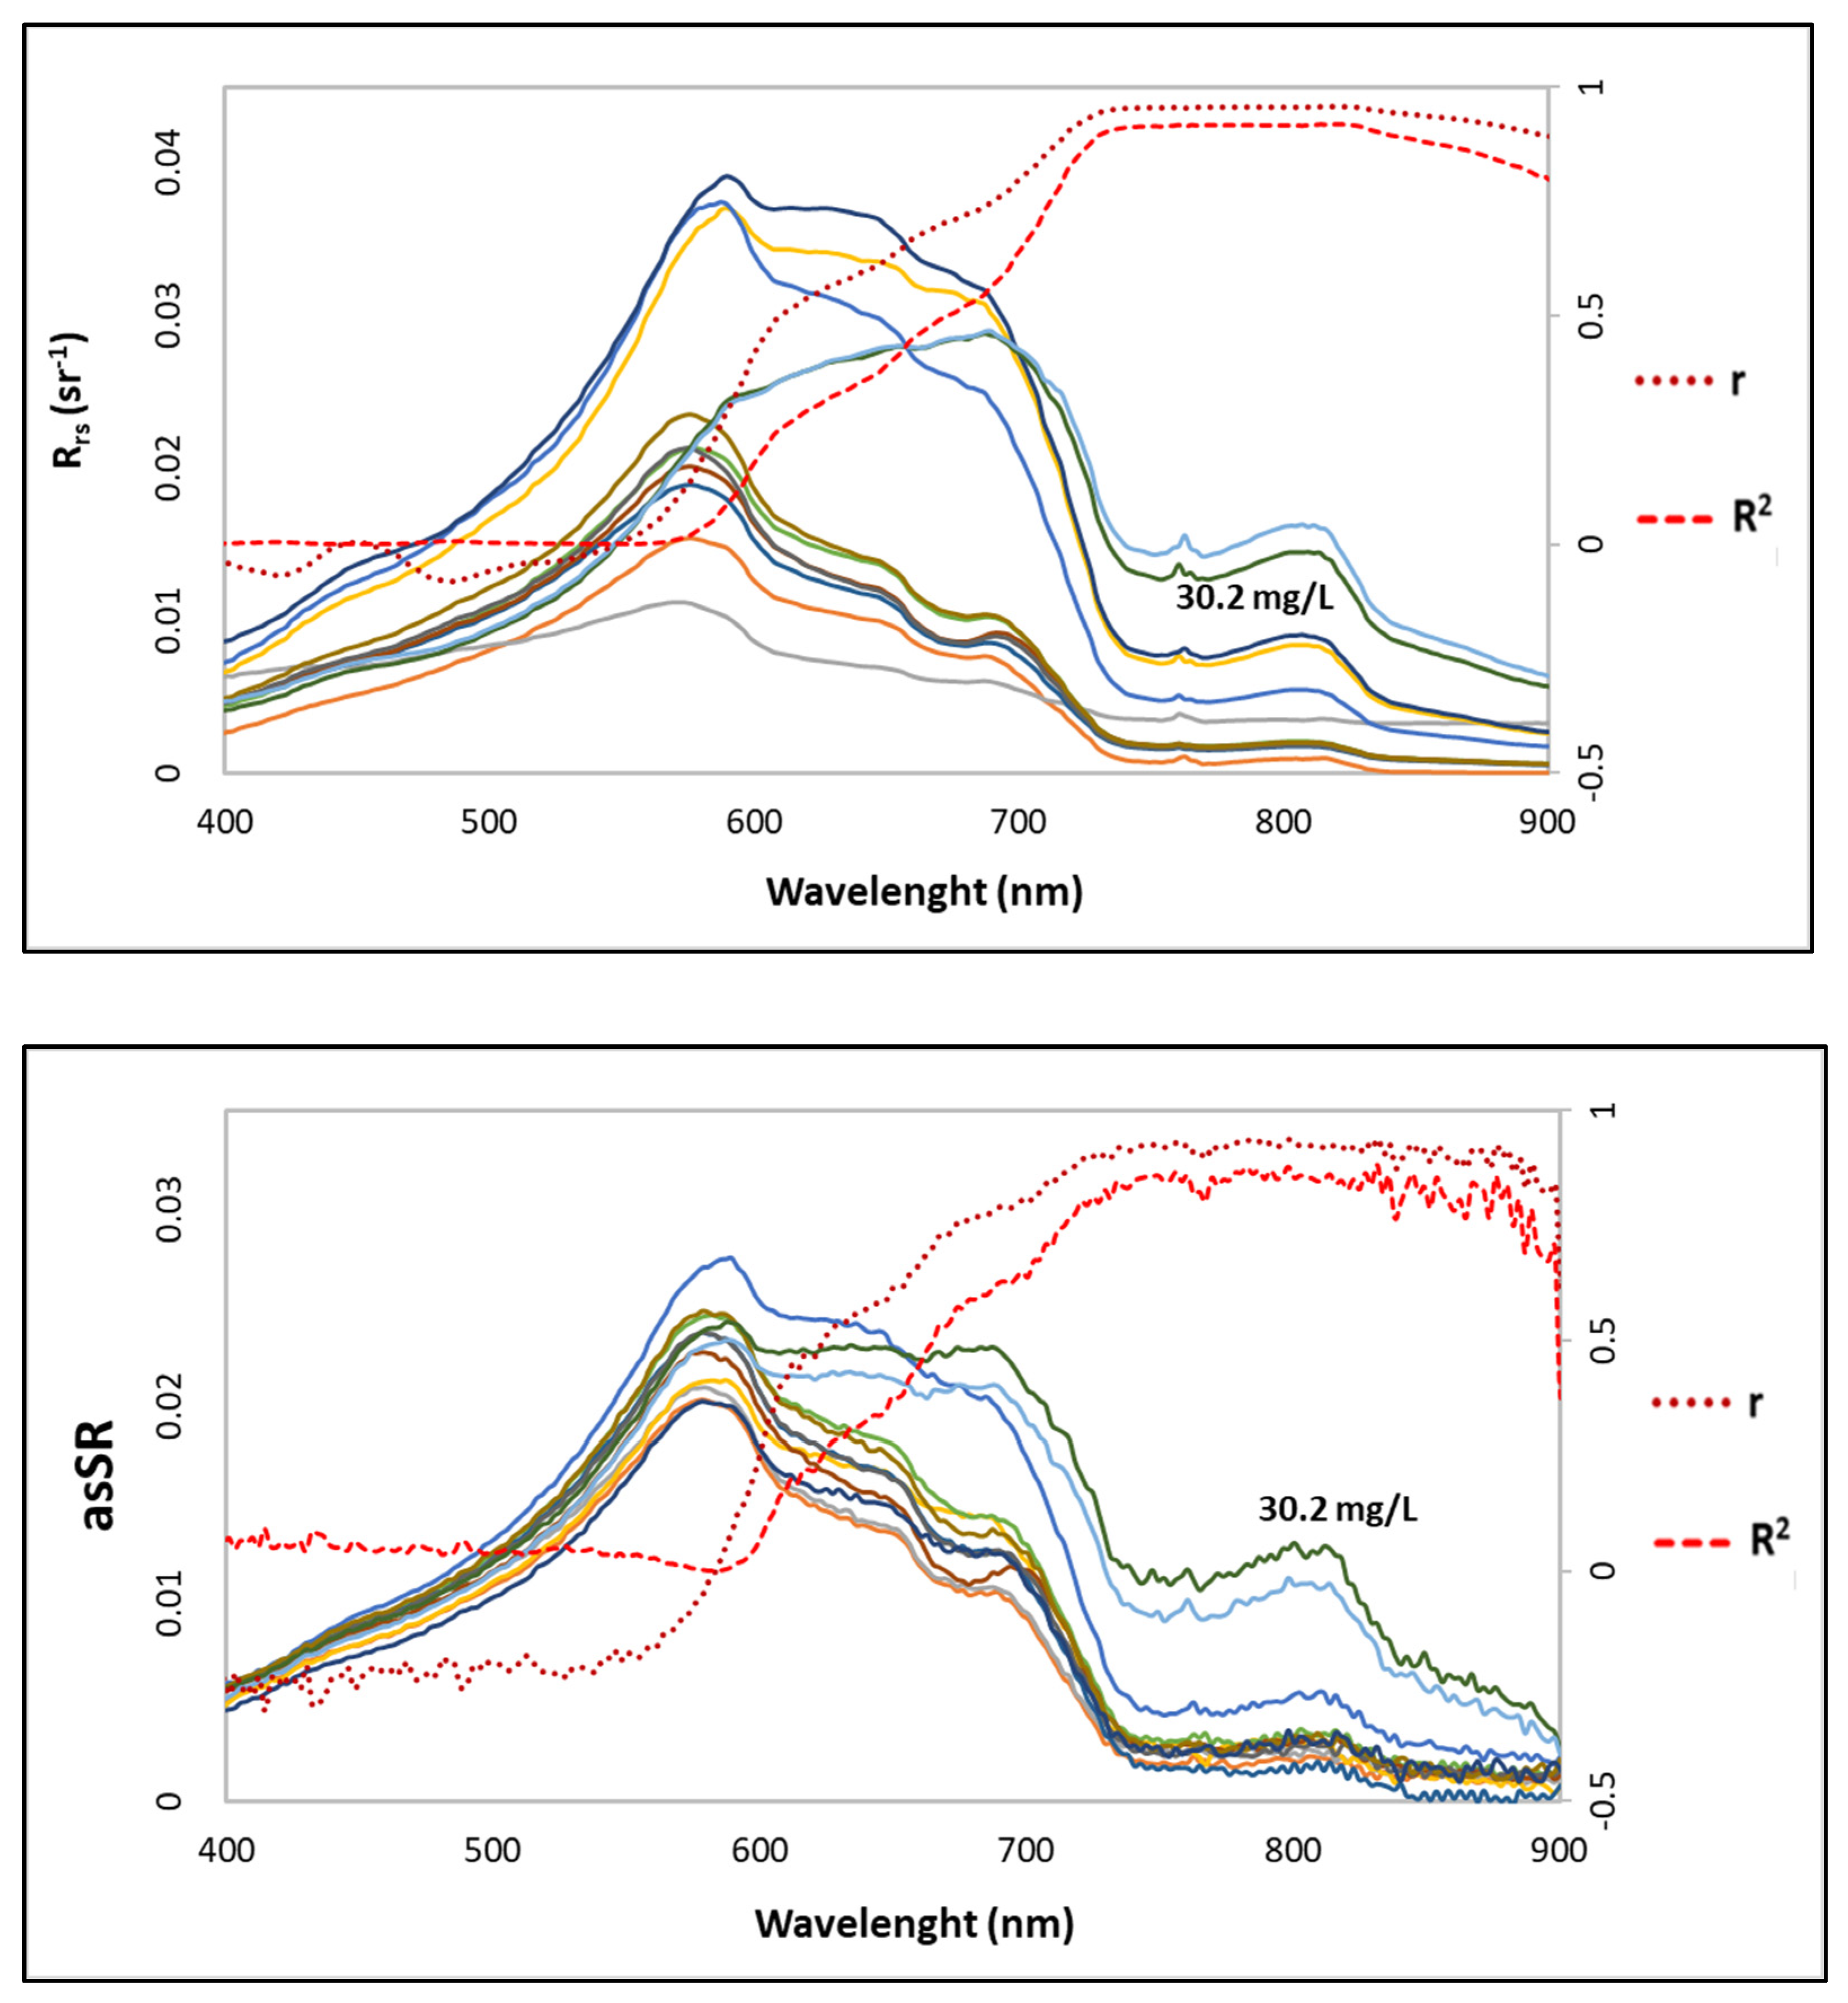
  • Significant coverage of the NIR region (approximately 700–900 nm) due to its strong correlation with TSS concentrations. More precisely narrower spectral bands between 830 and 870 nm are advisable due to the high robust correlation with TSS;
  • Adequate coverage of the visible spectrum, including the RED and GREEN bands, to effectively address low TSS concentrations (below 20 mg/L−1);
  • Consideration of spectral bands and resolutions that address the saturation issue in cases of extremely high TSS concentrations (above 600 mg/L−1).
This camera configuration would facilitate reliable and comprehensive TSS monitoring in continental waters, encompassing a wide range of concentration levels.
Regarding sun glint correction procedures, certain bands are not recommended for frame cameras due to the possibility of addressing this phenomenon through mask application. However, such correction via masks is impractical for pushbroom cameras. Thus, the recommendation is to employ bands within SWIR or NIR wavelengths, specifically above 950 nm. This recommendation is based on the presumption that the impact of OACs effects on the reflectance spectra is negligible within these wavelength ranges.
The objective of this study was to establish an optimal selection of UAV platforms for monitoring TSS in inland waters. Considering the intricate nature of the cameras’ image acquisition geometry systems and the diverse range of UAV types, encompassing factors such as flight autonomy, stability, and safety during take-off and landing over various water body sizes. The identification of ideal platform combinations is tailored for two distinct hypothetical scenarios based on the area of inland water bodies:
(1)
Small water bodies, primarily encompassing small to medium-sized rivers, fishponds, small water reservoirs or lakes, and specific portions of larger lakes and reservoirs like confluence areas with tributary rivers, an optimal setup involves:
  • UAV Type: Multi-rotor UAVs due to their enhanced stability and safer take-off and landing capabilities over water.
  • Camera Type: frame cameras are better adapted, preferably with a global shutter imaging mechanism. This choice is facilitated by the capability of digital photogrammetry software to construct orthomosaics from images captured in heterogeneous environments.
(2)
Large water bodies, encompassing significant rivers like the main rivers within Brazilian hydrographic basins, as well as complete or partial sections of medium to large lakes and reservoirs. The following approach is recommended:
  • UAV Type: Fixed-wing UAVs provide superior autonomy compared to electric multirotor. However, they come with trade-offs such as lower stability and reduced safety during take-off and landing. Vertical Take-Off and Landing (VTOL) UAVs offer the advantage of both high flight autonomy and safe take-off and landing in multi-rotor mode. While their fixed-wing mode may have lower stability, it ensures longer flight autonomy.
  • Camera Type: In cases where the camera’s FOV captures homogeneous water areas exclusively, such as those described above, the use of frame camera images with digital photogrammetry software to construct orthomosaics is not feasible. Instead, pushbroom cameras coupled with high-flying UAVs present a viable solution.

Author Contributions

D.O.: conceptualized the work (methodology, data acquisition, analysis, and validation) and wrote the original draft manuscript. H.L.R.: participated in the project administration, funding acquisition, supervision, writing, and review. J.-M.M.: participated in the planning of the work and the article manuscript, field campaigns, data analysis, validation, data curation, writing, review, and editing. A.M.R.F.: participated in the construction of the airborne multispectral platform, flight planning, and image processing. R.R.M.: participated in the field of data acquisition, data analysis, and visualization. R.L.M.: participated in funding acquisition, writing, and review. E.S.P.R.M.: participated in the project administration, funding acquisition and supervision. All authors have read and agreed to the published version of the manuscript.

Funding

This research was funded by Financiadora de Estudos e Projetos (FINEP), grant number: 01.14.0114.00; by the Fundação de Amparo a Pesquisa do Distrito Federal (FAPDF), grant numbers: 23547.93.27555.30052018, 17457.78.36995.26042017, and 00193.00001143/2021-15; and by the Coordenação de Aperfeiçoamento de Pessoal de Nível Superior, Brasil (CAPES), Finance Code 001.

Data Availability Statement

The original contributions presented in the study are included in the article, further inquiries can be directed to the corresponding author.

Acknowledgments

The public institutions (Brazilian National Water Agency and Mineral Resources Research Company) for their technical support. In particular, the Brazilian Federal Police for all the infrastructure provided and the availability of a helicopter for the aerial surveys. We also acknowledge the partner institutions that integrate the AQUASENSE research group (http://aquasense.igd.unb.br/ (accessed on 22 November 2024)). The AQUASENSE group is formed by management and research institutions from Brazil and France that contemplate a water quality monitoring network using multiscale remote sensing techniques.

Conflicts of Interest

The authors declare no conflicts of interest.

References

  1. Matthews, M.W. A Current Review of Empirical Procedures of Remote Sensing in Inland and Near-Coastal Transitional Waters. Int. J. Remote Sens. 2011, 32, 6855–6899. [Google Scholar] [CrossRef]
  2. Dekker, A.G.; Vos, R.J.; Peters, S.W.M. Analytical Algorithms for Lake Water TSM Estimation for Retrospective Analyses of TM and SPOT Sensor Data. Int. J. Remote Sens. 2002, 23, 15–35. [Google Scholar] [CrossRef]
  3. Giardino, C.; Bresciani, M.; Braga, F.; Cazzaniga, I.; De Keukelaere, L.; Knaeps, E.; Brando, V.E. Bio-Optical Modeling of Total Suspended Solids. In Bio-Optical Modeling and Remote Sensing of Inland Waters; Elsevier: Amsterdam, The Netherlands, 2017; pp. 129–156. [Google Scholar]
  4. Gholizadeh, M.H.; Melesse, A.M.; Reddi, L. A Comprehensive Review on Water Quality Parameters Estimation Using Remote Sensing Techniques. Sensors 2016, 16, 1298. [Google Scholar] [CrossRef] [PubMed]
  5. Dörnhöfer, K.; Oppelt, N. Remote Sensing for Lake Research and Monitoring—Recent Advances. Ecol. Indic. 2016, 64, 105–122. [Google Scholar] [CrossRef]
  6. Palmer, S.C.J.; Kutser, T.; Hunter, P.D. Remote Sensing of Inland Waters: Challenges, Progress and Future Directions. Remote Sens. Environ. 2015, 157, 1–8. [Google Scholar] [CrossRef]
  7. Olmanson, L.G.; Brezonik, P.L.; Bauer, M.E. Remote Sensing for Regional Lake Water Quality Assessment: Capabilities and Limitations of Current and Upcoming Satellite Systems. In Advances in Watershed Science and Assessment; The Handbook of Environmental Chemistry Series; Springer: Cham, Switzerland, 2015; Volume 33, pp. 111–140. [Google Scholar] [CrossRef]
  8. Olmanson, L.G.; Brezonik, P.L.; Bauer, M.E. Geospatial and Temporal Analysis of a 20-Year Record of Landsat-Based Water Clarity in Minnesota’s 10,000 Lakes. J. Am. Water Resour. Assoc. 2014, 50, 748–761. [Google Scholar] [CrossRef]
  9. Giardino, C.; Bresciani, M.; Cazzaniga, I.; Schenk, K.; Rieger, P.; Braga, F.; Matta, E.; Brando, V.E. Evaluation of Multi-Resolution Satellite Sensors for Assessing Water Quality and Bottom Depth of Lake Garda. Sensors 2014, 14, 24116–24131. [Google Scholar] [CrossRef] [PubMed]
  10. Maes, W.H.; Steppe, K. Perspectives for Remote Sensing with Unmanned Aerial Vehicles in Precision Agriculture. Trends Plant Sci. 2019, 24, 152–164. [Google Scholar] [CrossRef]
  11. Olson, D.; Anderson, J. Review on Unmanned Aerial Vehicles, Remote Sensors, Imagery Processing, and Their Applications in Agriculture. Agron. J. 2021, 113, 971–992. [Google Scholar] [CrossRef]
  12. Ecke, S.; Dempewolf, J.; Frey, J.; Schwaller, A.; Endres, E.; Klemmt, H.J.; Tiede, D.; Seifert, T. UAV-Based Forest Health Monitoring: A Systematic Review. Remote Sens. 2022, 14, 3205. [Google Scholar] [CrossRef]
  13. Guimarães, N.; Pádua, L.; Marques, P.; Silva, N.; Peres, E.; Sousa, J.J. Forestry Remote Sensing from Unmanned Aerial Vehicles: A Review Focusing on the Data, Processing and Potentialities. Remote Sens. 2020, 12, 1046. [Google Scholar] [CrossRef]
  14. Ramón, A.; Adán, A.; Javier Castilla, F. Thermal Point Clouds of Buildings: A Review. Energy Build. 2022, 274, 112425. [Google Scholar] [CrossRef]
  15. Videras Rodríguez, M.; Melgar, S.G.; Cordero, A.S.; Márquez, J.M.A. A Critical Review of Unmanned Aerial Vehicles (UAVs) Use in Architecture and Urbanism: Scientometric and Bibliometric Analysis. Appl. Sci. 2021, 11, 9966. [Google Scholar] [CrossRef]
  16. Stilla, U.; Xu, Y. Change Detection of Urban Objects Using 3D Point Clouds: A Review. ISPRS J. Photogramm. Remote Sens. 2023, 197, 228–255. [Google Scholar] [CrossRef]
  17. Dronova, I.; Kislik, C.; Dinh, Z.; Kelly, M. A Review of Unoccupied Aerial Vehicle Use in Wetland Applications: Emerging Opportunities in Approach, Technology, and Data. Drones 2021, 5, 45. [Google Scholar] [CrossRef]
  18. Kislik, C.; Dronova, I.; Kelly, M. UAVs in Support of Algal Bloom Research: A Review of Current Applications and Future Opportunities. Drones 2018, 2, 35. [Google Scholar] [CrossRef]
  19. Rhee, D.S.; Kim, Y.D.; Kang, B.; Kim, D. Applications of Unmanned Aerial Vehicles in Fluvial Remote Sensing: An Overview of Recent Achievements. KSCE J. Civ. Eng. 2018, 22, 588–602. [Google Scholar] [CrossRef]
  20. Sibanda, M.; Mutanga, O.; Chimonyo, V.G.P.; Clulow, A.D.; Shoko, C.; Mazvimavi, D.; Dube, T.; Mabhaudhi, T. Correction: Sibanda et al. Application of Drone Technologies in Surface Water Resources Monitoring and Assessment: A Systematic Review of Progress, Challenges, and Opportunities in the Global South. Drones 2021, 5, 84. Drones 2022, 6, 131. [Google Scholar] [CrossRef]
  21. Windle, A.E.; Silsbe, G.M.; Moses, W. Evaluation of unoccupied aircraft system (UAS) remote sensing reflectance retrievals for water quality monitoring in coastal waters. Front. Environ. Sci. 2021, 9, 674247. [Google Scholar] [CrossRef]
  22. Zeng, C.; Richardson, M.; King, D.J. The Impacts of Environmental Variables on Water Reflectance Measured Using a Lightweight Unmanned Aerial Vehicle (UAV)-Based Spectrometer System. ISPRS J. Photogramm. Remote Sens. 2017, 130, 217–230. [Google Scholar] [CrossRef]
  23. Aasen, H.; Honkavaara, E.; Lucieer, A.; Zarco-Tejada, P.J. Quantitative Remote Sensing at Ultra-High Resolution with UAV Spectroscopy: A Review of Sensor Technology, Measurement Procedures, and Data Correctionworkflows. Remote Sens. 2018, 10, 1091. [Google Scholar] [CrossRef]
  24. Yao, H.; Qin, R.; Chen, X. Unmanned Aerial Vehicle for Remote Sensing Applications—A Review. Remote Sens. 2019, 11, 1443. [Google Scholar] [CrossRef]
  25. dos S. Vergilio, C.; Lacerda, D.; de Oliveira, B.C.V.; Sartori, E.; Campos, G.M.; de S. Pereira, A.L.; de Aguiar, D.B.; da S. Souza, T.; de Almeida, M.G.; Thompson, F.; et al. Metal Concentrations and Biological Effects from One of the Largest Mining Disasters in the World (Brumadinho, Minas Gerais, Brazil). Sci. Rep. 2020, 10, 5936. [Google Scholar] [CrossRef]
  26. Thompson, F.; de Oliveira, B.C.; Cordeiro, M.C.; Masi, B.P.; Rangel, T.P.; Paz, P.; Freitas, T.; Lopes, G.; Silva, B.S.; Cabral, A.S.; et al. Severe Impacts of the Brumadinho Dam Failure (Minas Gerais, Brazil) on the Water Quality of the Paraopeba River. Sci. Total Environ. 2020, 705, 135914. [Google Scholar] [CrossRef] [PubMed]
  27. Favre, T.C.; Fernandez, M.A.; Christina, L.; Holsbach, N.; José, R.; Souza, D.P.; Pieri, O.S.; Aparecida, S.; Thiengo, C. Assessment of schistosomiasis in the semi-arid Northeast region of Brazil: The São Francisco River large-scale water transposition project. Rev. Soc. Bras. Med. Trop. 2016, 49, 252–257. [Google Scholar] [CrossRef] [PubMed]
  28. Westoby, M.J.; Brasington, J.; Glasser, N.F.; Hambrey, M.J.; Reynolds, J.M. ‘Structure-from-Motion’ Photogrammetry: A Low-Cost, Effective Tool for geoscience Applications. Geomorphology 2012, 179, 300–314. [Google Scholar] [CrossRef]
  29. Kwon, Y.S.; Pyo, J.C.; Kwon, Y.H.; Duan, H.; Cho, K.H.; Park, Y. Drone-Based Hyperspectral Remote Sensing of Cyanobacteria Using Vertical Cumulative Pigment Concentration in a Deep Reservoir. Remote Sens. Environ. 2020, 236, 111517. [Google Scholar] [CrossRef]
  30. Vydhyanathan, A.; Bellusci, G. XSens Mti-G White Paper: The Next Generation Xsens Motion Trackers for Industrial Applications. Xsens: Enschede, The Netherlands, 2018; pp. 1–10. [Google Scholar]
  31. Smith, G.M.; Milton, E.J. The Use of the Empirical Line Method to Calibrate Remotely Sensed Data to Reflectance. Int. J. Remote Sens. 1999, 20, 2653–2662. [Google Scholar] [CrossRef]
  32. Mobley, C.D. Estimation of the Remote-Sensing Reflectance from above-Surface Measurements. Appl. Opt. 1999, 38, 7442–7455. [Google Scholar] [CrossRef]
  33. Martinez, J.; Espinoza-Villar, R.; Armijos, E.; Moreira, L.S. The optical properties of river and floodplain waters in the Amazon River Basin: Implications for satellite-based measurements of suspended particulate matter. J. Geophys. Res. Earth Surf. 2015, 120, 1274–1287. [Google Scholar] [CrossRef]
  34. APHA—Association American Public Health. Standard Methods for the Examination of Water and Wastewater; Rice, E.W., Bridgewater, L., American Public Health Association, Eds.; American Public Health Association: Washington, DC, USA, 2012. [Google Scholar]
  35. Shang, S.; Lee, Z.; Lin, G.; Hu, C.; Shi, L.; Zhang, Y.; Li, X.; Wu, J.; Yan, J. Sensing an Intense Phytoplankton Bloom in the Western Taiwan Strait from Radiometric Measurements on a UAV. Remote Sens. Environ. 2017, 198, 85–94. [Google Scholar] [CrossRef]
  36. Gonzalez-Aguilera, D.; López-Fernández, L.; Rodriguez-Gonzalvez, P.; Hernandez-Lopez, D.; Guerrero, D.; Remondino, F.; Menna, F.; Nocerino, E.; Toschi, I.; Ballabeni, A.; et al. GRAPHOS—Open-Source Software for Photogrammetric Applications. Photogramm. Rec. 2018, 33, 11–29. [Google Scholar] [CrossRef]
  37. Byrne, D.J.; Laefer, D. Variables Effecting Photomosaic Reconstruction and Ortho-Rectification from Aerial Survey Datasets. arXiv 2016, arXiv:1611.03318. [Google Scholar]
  38. Varshosaz, M.; Sajadian, M.; Pirasteh, S.; Moghimi, A. Automated Two-Step Seamline Detection for Generating Large-Scale Orthophoto Mosaics from Drone Images. Remote Sens. 2024, 16, 903. [Google Scholar] [CrossRef]
  39. Ortega-Terol, D.; Hernandez-Lopez, D.; Ballesteros, R.; Gonzalez-Aguilera, D. Automatic Hotspot and Sun Glint Detection in UAV Multispectral Images. Sensors 2017, 17, 2352. [Google Scholar] [CrossRef] [PubMed]
  40. Cox, C.; Munk, W. Measurement of the Roughness of the Sea Surface from Photographs of the Sun’s Glitter. J. Opt. Soc. Am. 1954, 44, 838–850. [Google Scholar] [CrossRef]
  41. Kay, S.; Hedley, J.D.; Lavender, S. Sun Glint Correction of High and Low Spatial Resolution Images of Aquatic Scenes: A Review of Methods for Visible and near-Infrared Wavelengths. Remote Sens. 2009, 1, 697–730. [Google Scholar] [CrossRef]
  42. Harmel, T.; Chami, M.; Tormos, T.; Reynaud, N.; Danis, P.A. Sunglint Correction of the Multi-Spectral Instrument (MSI)-SENTINEL-2 Imagery over Inland and Sea Waters from SWIR Bands. Remote Sens. Environ. 2018, 204, 308–321. [Google Scholar] [CrossRef]
  43. Goodman, J.A.; Lee, Z.; Ustin, S.L. Influence of Atmospheric and Sea-Surface Corrections on Retrieval of Bottom Depth and Reflectance Using a Semi-Analytical Model: A Case Study in Kaneohe Bay, Hawaii. Appl. Opt. 2008, 47, F1–F11. [Google Scholar] [CrossRef]
  44. Wang, M.; Bailey, S.W. Correction of Sun Glint Contamination on the SeaWiFS Ocean and Atmosphere Products. Appl. Opt. 2001, 40, 4790–4798. [Google Scholar] [CrossRef] [PubMed]
  45. Wang, M.; Isaacman, A.; Franz, B.A.; McClain, C.R. Ocean-Color Optical Property Data Derived from the Japanese Ocean Color and Temperature Scanner and the French Polarization and Directionality of the Earth’s Reflectances: A Comparison Study. Appl. Opt. 2002, 41, 974–990. [Google Scholar] [CrossRef] [PubMed]
  46. Mustard, J.F.; Staid, M.I.; Fripp, W.J. A Semianalytical Approach to the Calibration of AVIRIS Data to Reflectance over Water Application in a Temperate Estuary. Remote Sens. Environ. 2001, 75, 335–349. [Google Scholar] [CrossRef]
  47. Olivetti, D.; Roig, H.; Martinez, J.-M.; Borges, H.; Ferreira, A.; Casari, R.; Salles, L.; Malta, E. Low-Cost Unmanned Aerial Multispectral Imagery for Siltation Monitoring in Reservoirs. Remote Sens. 2020, 12, 1855. [Google Scholar] [CrossRef]
  48. Hedley, J.D.; Harborne, A.R.; Mumby, P.J. Simple and Robust Removal of Sun Glint for Mapping Shallow-Water Benthos. Int. J. Remote Sens. 2005, 26, 2107–2112. [Google Scholar] [CrossRef]
  49. Overstreet, B.T.; Legleiter, C.J. Removing Sun Glint from Optical Remote Sensing Images of Shallow Rivers. Earth Surf. Process. Landf. 2017, 42, 318–333. [Google Scholar] [CrossRef]
  50. Tiškus, E.; Bučas, M.; Vaičiūtė, D.; Gintauskas, J.; Babrauskienė, I. An Evaluation of Sun-Glint Correction Methods for UAV-Derived Secchi Depth Estimations in Inland Water Bodies. Drones 2023, 7, 546. [Google Scholar] [CrossRef]
  51. Qin, J.; Li, M.; Gruen, A.; Li, D.; Gong, J.; Liao, X. Assessment of Sun Glint Correction Methods in Unmanned Aerial Vehicle-Based Ocean Optical Remote Sensing. In Proceedings of the IGARSS 2024—2024 IEEE International Geoscience and Remote Sensing Symposium, Athens, Greece, 7–12 July 2024; pp. 6034–6038. [Google Scholar]
  52. Qin, J.; Li, M.; Zhao, J.; Zhong, J.; Zhang, H. Revolutionize the Oceanic Drone RGB Imagery with Pioneering Sun Glint Detection and Removal Techniques. In Proceedings of the 2024 IEEE/CVF Winter Conference on Applications of Computer Vision (WACV), Waikoloa, HI, USA, 3–8 January 2024; pp. 8311–8320. [Google Scholar]
  53. Kirk, J.T.O. (Ed.) Light and Photosyntesis in Aquatic Ecosystems; Cambridge University Press: Cambridge, UK, 2011; ISBN 978-0-521-15175-7. [Google Scholar]
  54. Ruddick, K.G.; De Cauwer, V.; Park, Y.-J.; Moore, G.F. Seaborne Measurements of near Infrared Water-Leaving Reflectance: The Similarity Spectrum for Turbid Waters. Limnol. Oceanogr. 2006, 51, 1167–1179. [Google Scholar] [CrossRef]
  55. Ritchie, J.C.; Schiebe, F.R.; McHenry, J.R. Remote Sensing of Suspended Sediments in Surface Waters. Photogramm. Remote Sens 1976, 42, 1539–1545. [Google Scholar]
  56. Kutser, T.; Paavel, B.; Verpoorter, C.; Ligi, M.; Soomets, T.; Toming, K.; Casal, G. Remote Sensing of Black Lakes and Using 810 nm Reflectance Peak for Retrieving Water Quality Parameters of Optically Complex Waters. Remote Sens. 2016, 8, 497. [Google Scholar] [CrossRef]
  57. Kallio, K.; Kutser, T.; Hannonen, T.; Koponen, S.; Pulliainen, J.; Pyhalahti, T. Retrieval of Water Quality from Airborne Imaging Spectrometry of Various Lake Types in Different Seasons. Sci. Total Environ. 2001, 268, 59–77. [Google Scholar] [CrossRef] [PubMed]
  58. Martins, V.S.; Barbosa, C.C.F.; de Carvalho, L.A.S.; Jorge, D.S.F.; de L. Lobo, F.; de Moraes Novo, E.M.L. Assessment of Atmospheric Correction Methods for Sentinel-2 MSI Images Applied to Amazon Floodplain Lakes. Remote Sens. 2017, 9, 322. [Google Scholar] [CrossRef]
  59. Borges, H.D.; Cicerelli, R.E.; De Almeida, T.; Roig, H.L.; Olivetti, D. Monitoring Cyanobacteria Occurrence in Freshwater Reservoirs Using Semi-Analytical Algorithms and Orbital Remote Sensing. Mar. Freshw. Res. 2020, 71, 569–578. [Google Scholar] [CrossRef]
Figure 1. Study areas across various basins and biomes in Brazil. (A) turbid and dark waters in the Amazon basin; (B) small inflows and river confluences into urban (Paranoá) and rural (Corumbá IV) reservoirs in the Paraná basin; (C) inflow area of a large reservoir (Três marias) and the entire open water area of a medium reservoir (Retiro Baixo) in the São Francisco basin; and (D) stretches of the Paraopeba river under the influence of sediment originating from a tailing dam collapse during the Brumadinho disaster in 2019.
Drones 09 00173 g001
Figure 2. Depiction of the Sequoia (c,d) camera affixed to the Parrot Disco Pro AG (b) and DJI Phantom 4 (a) UAVs, facilitated by the utilization of a bracket and 3D printing. Source: Parrot 2020.
Drones 09 00173 g002
Figure 3. Hedawall Nano-Hyperspec camera (a) and its IMU (b) installed on a helicopter using a metal bracket and supported by the DJI RONIM MX gimbal. (c): image captured during the flight over the Três Marias reservoir (Figure 1C).
Drones 09 00173 g003
Figure 4. Flowchart of methodological procedures for TSS mapping from the multispectral and hyperspectral airborne platforms and the indication of an ideal platform for effectively monitoring TSS for small and large inland water bodies.
Drones 09 00173 g004
Figure 5. Image excerpt extracted from the orthomosaic generation process using Pix4D Mapper software. Sequoia images were acquired in Amazon. The red annotations signify images that did not align with adjacent overlapping images, particularly those acquired farther inland along the Solimões River. The green/blue dots represent images that have been successfully aligned with their neighboring images in heterogeneous areas.
Drones 09 00173 g005
Figure 6. Scanned images captured by the Nano-Hyperspec camera during helicopter flights over the Três Marias reservoir (left) and the Retiro Baixo reservoir (right).
Drones 09 00173 g006
Figure 7. Example of Sequoia camera images affected and unaffected by the sun glint effect. At the confluence of the Negro and Solimões rivers (A: RGB lens, B: NIR band), sun glint is visible in images acquired at a solar angle of 0.17°. In contrast, images from the Paranoá Reservoir (C: RGB lens, D: NIR band) show no sun glint, as they were captured at a solar angle of 0.72°. All images were captured with the camera angle at 90°.
Drones 09 00173 g007
Figure 8. Dense point cloud depiction, created using the Pix4D Mapper software, originating from the Sequoia camera images in Amazon. The frame (A) emphasizes a randomly selected point within the mapped region, with all corresponding covering images marked by the green line. In frame (B), various images covering this point are showcased, both with and without sun glint presence.
Drones 09 00173 g008
Figure 9. Orthomosaic comparison of NIR asSR from the Sequoia camera in Amazon, depicting (A) the pre-processed state and (B) the post-processed condition removing images presenting sun glint.
Drones 09 00173 g009
Figure 10. In situ water remote sensing reflectance and the associated r and R2 values in relation to the TSS concentrations for each band (~2 nm). Grayscale variations correspond to TSS levels. TSS range: 0.6–130.7 mg L−1, N: 88.
Drones 09 00173 g010
Figure 11. Scatter plot illustrates the correlation between simulated and empirical individual bands of the Sequoia camera (Table 1).
Drones 09 00173 g011
Figure 12. Scatter plot depicting the relationship between asSR values of the Sequoia camera bands and TSS concentrations (Table 1).
Drones 09 00173 g012
Figure 13. TSS maps depicting different areas, including: (A,B) confluence area between tributary rivers and the Corumbá IV and Paranoá reservoirs, emphasizing the sediment plume from urban drainage; (C) high concentrations in the Solimões River and low concentrations in the Negro River, and the mingling of waters between the two rivers (C); (D) Contrast between the turbid waters of the Solimões River and certain artificial ponds, juxtaposed with the clear waters of igarapés and other artificial ponds.
Drones 09 00173 g013
Figure 14. (above): Rrs in situ spectra (Equation (1)) acquired by the Ramses spectroradiometer during the field campaign in Brumadinho. (below): asSR spectra of the Nano-Hyperspec camera (Section 2.2) acquired during the helicopter aerosurveys in Brumadinho. Both graphs also include the plotted r and R2 values concerning TSS concentrations for each respective band. TSS: 0.6–30.2, N: 18. The Rrs spectra (above) are taken as a reference. Therefore, it can be concluded that the asSR spectra (below) were consistently calibrated, as indicated by their similarity to the upper graph.
Drones 09 00173 g014
Figure 15. TSS map of the Paraopeba River, accentuating the confluence area with the tailing’s slurry.
Drones 09 00173 g015
Figure 16. TSS map of the Três Marias and Retiro Baixo reservoirs, indicating low concentrations and confirming that the tailings sludge did not reach the reservoirs or the São Francisco River.
Drones 09 00173 g016
Table 1. In situ and airborne data collected during the field campaigns.
DateLocalIn Situ DataAerosurveysRS * Platform
N *OAP *TSS (mg/L)Multi.Hyper.
08/05/2015Paranoá6Rrs2.8–12.4--In situ
28/05/2015Paranoá7Rrs1.6–4.1--In situ
17/06/2015Paranoá5Rrs0.6–7.8--In situ
21/08/2015Paranoá10Rrs0.2–3.1--In situ
29/06/2016Paranoá6Rrs2.1–5.9--In situ
03/10/2016Paranoá6Rrs0.7–37.5--In situ
05/05/2017Paranoá14Rrs0.6–3.4--In situ
14/06/2017Paranoá6Rrs0.9–1.8--In situ
25/10/2017Paranoá8Rrs0.6–12.6--In situ
02/03/2018Paranoá5-23–36.2Sequoia-UAV/Multirotor
29/03/2018Corumbá IV5Rrs5.0–15.6Sequoia-UAV/Fixed Wing
24/04/2018Manacapuru1Rrs130.7Sequoia-UAV/Fixed Wing
25/04/2018Manaus7Rrs3.6–115.1Sequoia-UAV/Multirotor
18/05/2018Corumbá IV5Rrs1.0–2.2Sequoia-UAV/Fixed Wing
12/09/2018Paranoá7-8.8–15.6Sequoia-UAV/Multirotor
31/10/2018Paranoá1-186.8Sequoia-UAV/Multirotor
02/11/2018Paranoá12-2.7–43.2Sequoia-UAV/Multirotor
09/11/2018Paranoá1-73.2Sequoia-UAV/Multirotor
11/11/2018Paranoá1-78.8Sequoia-UAV/Multirotor
05/12/2018Paranoá1-68.2Sequoia-UAV/Multirotor
11/05/2019Três Marias2Rrs0.6–2.8-NanoHelicopter
12/05/2019Retiro Baixo6Rrs0.6–11.2 NanoHelicopter
13/05/2019Retiro Baixo6Rrs- NanoHelicopter
14/05/2019Paraopeba2Rrs29.6–31.2 NanoHelicopter
* N: number of samples; OAP: Optical Active Properties; RS: Remote Sensing.
Disclaimer/Publisher’s Note: The statements, opinions and data contained in all publications are solely those of the individual author(s) and contributor(s) and not of MDPI and/or the editor(s). MDPI and/or the editor(s) disclaim responsibility for any injury to people or property resulting from any ideas, methods, instructions or products referred to in the content.

