1. Introduction
Unmanned aerial vehicles (UAVs), particularly quadrotor drones, have become indispensable across industries such as aerial surveillance, delivery logistics, and environmental monitoring, as well as search and rescue operations [
1,
2,
3]. Their ability to perform complex tasks in challenging conditions has solidified their significance in civilian, commercial, and military applications. With the growing reliance on UAVs, maintaining their operational safety and efficiency becomes critical. One of the key challenges in UAV maintenance is addressing rotor imbalances caused by misalignment, structural wear, or damage [
4]. These imbalances generate abnormal vibration patterns, compromising flight stability, increasing maintenance needs, and reducing overall operational effectiveness [
5,
6].
Traditional vibration analysis methods, including Fast Fourier Transform (FFT), wavelet analysis, and power spectral density (PSD), have been widely used to detect rotor imbalances [
7,
8]. These techniques decompose vibration signals into frequency components, enabling engineers to identify anomalies indicative of mechanical faults. However, their effectiveness is often limited in dynamic UAV operating environments characterized by non-stationary signals, real-time processing demands, and external factors, including wind turbulence and environmental noise. Such limitations necessitate the development of more advanced and automated solutions for real-time fault detection and analysis [
7]. Moreover, environmental factors like wind and turbulence introduce noise, further complicating accurate imbalance detection [
9].
This study focuses on addressing these challenges by adopting machine-learning techniques, specifically Multi-Layer Perceptron (MLP) neural networks, for rotor imbalance detection in UAVs. By building on existing research and integrating advanced data processing methods, this work aims to provide a reliable and scalable solution for enhancing UAV performance and operational efficiency.
2. Related Work
Machine-learning approaches, particularly artificial neural networks (ANNs), have shown great promise in automating feature extraction and enabling accurate, real-time fault detection. Among ANN architectures, MLP networks stand out as particularly well-suited for UAV applications. Unlike convolutional neural networks (CNNs), which are optimized for image and spatial data, or recurrent neural networks (RNNs) suitable for sequential data processing, MLPs are highly effective at analyzing high-dimensional, non-sequential data like vibration signals [
10,
11]. Their simplicity and adaptability make MLPs an ideal choice for capturing the complex, non-linear relationships present in UAV rotor imbalance scenarios. Additionally, their lower computational requirements make them suitable for real-time onboard implementation in resource-constrained UAV systems [
12].
Recent studies underscore the potential of combining MLP with vibration analysis. Gohari et al., (2022) developed an ANN model to identify key unbalanced parameters, such as mass, radius, and the location of eccentric masses, using vibration data [
13]. Their model achieved prediction accuracies of 96% for disc number, 96% for eccentric radius, and 94% for eccentric mass values, highlighting the precision of ANN-based diagnostics. Similarly, Mey et al., (2020) investigated machine learning-based unbalance detection using vibration data, comparing several models, including fully connected neural networks, CNNs, hidden Markov models, and random forest classifiers [
14]. Among these, the fully connected neural network, which used scaled FFT-transformed vibration data, achieved a prediction accuracy of 98.6%, demonstrating the robustness of ANN-based approaches.
Despite significant advancements in the field of ANNs, the application of MLP for rotor imbalance detection in quadrotor UAVs remains underexplored. Current research mainly focuses on general rotating machinery, such as turbines, motors, and industrial equipment, where vibration analysis has been extensively studied [
15,
16,
17]. These studies often utilize other neural network architectures, such as CNN or RNN, which, while effective for certain applications, are not always optimized for the unique characteristics of vibration data. MLPs, with their capacity to model non-linear relationships and process high-dimensional datasets, are particularly promising for UAV-specific scenarios, but their full potential has yet to be realized.
Additionally, Wilson et al., (2021) highlighted the importance of integrating lightweight sensors with advanced ML algorithms to address UAV diagnostics but noted the need for further research in real-time implementations [
18]. However, they also identified challenges in real-time implementation, including computational constraints, the need for diverse and robust datasets, and the difficulty of integrating such solutions with existing UAV architectures. These limitations underscore the need for further research to optimize ML models and develop lightweight processing frameworks that are compatible with onboard systems. A summary of related works on machine learning-based fault detection methods is presented in
Table 1.
MLP neural networks have distinct advantages that make them particularly well-suited for rotor imbalance detection in quadrotor UAVs compared to the methods outlined in the literature table. First, MLPs are simple yet highly flexible, capable of modeling nonlinear relationships between inputs such as vibration signals and outputs like imbalance parameters. Their architecture is easily customizable, allowing adjustments to the number of layers and neurons to match the complexity of the problem. In contrast to deep learning models such as CNNs or ResNet, MLPs typically require fewer computational resources, making them ideal for real-time applications in quadrotor UAVs, where onboard processing power is often limited.
Furthermore, MLPs excel in scenarios with small to medium-sized datasets, a common challenge in UAV rotor imbalance detection where extensive real-world data collection can be difficult. Their relatively straightforward structure also makes them more interpretable than complex models like LSTMs or hybrid approaches, facilitating easier debugging and understanding of system behavior. While hybrid models or CNN-based architectures may achieve slightly higher accuracy, they often come with increased complexity and computational overhead. MLPs strike a balance between performance and simplicity, making them a practical choice for rapid deployment and efficient operation.
Studies have demonstrated the effectiveness of MLPs in fault detection, with accuracy often exceeding 90% for tasks such as rotor imbalance prediction. This reliability, combined with their adaptability to various data types (time-domain or frequency-domain), positions MLPs as an excellent starting point for rotor imbalance detection before exploring more advanced techniques. Given these insights, quadrotor UAVs emerge as a particularly intriguing case for applying MLP due to their unique challenges that distinguish them from general rotating machinery. Their rapid changes in flight conditions, variable payloads, and exposure to dynamic environmental factors such as wind turbulence and temperature fluctuations create highly non-stationary vibration signals [
27,
28,
29]. These operational dynamics necessitate the development of robust algorithms to handle such complexities. Expanding research in this area can bridge the gap between traditional methods and advanced machine-learning techniques, ensuring more reliable and efficient UAV monitoring systems. These advancements are critical for enhancing UAV operational safety and minimizing downtime, especially in scenarios where consistent performance and dependability are crucial.
The novelty of this work lies in developing an integrated framework for UAV rotor imbalance detection. It combines Micro-Electro-Mechanical Systems (MEMS) (sensor-based data acquisition, advanced preprocessing techniques (noise filtering, feature extraction, and normalization)) and an optimized MLP architecture for high-dimensional vibration data. Tailored for UAV applications, the framework addresses challenges like non-stationary signals, dynamic flight conditions, and real-time performance requirements. Bridging the gap between traditional analytical methods and ML-based diagnostics enhances UAV safety and maintenance efficiency. This research also emphasizes real-time detection of rotor imbalances in quadrotor UAVs using a machine learning-based system. Vibration analysis with an MLP-based model allows for accurate differentiation between balanced and imbalanced rotor conditions. This real-time capability provides immediate feedback, supporting rapid interventions and reducing downtime while advancing UAV reliability and scalable maintenance strategies.
3. Materials and Methods
3.1. Research Workflow Overview
Figure 1 illustrates the systematic research workflow for developing a machine learning-based system, specifically an MLP, designed for vibration analysis and rotor imbalance detection in UAVs.
The workflow begins with the UAV component assembly, where essential components such as MEMS sensors, motors, and propellers are installed on the quadrotor UAV. This is followed by the UAV-based vibration data acquisition stage, in which vibration data is collected under controlled flight conditions for both balanced and imbalanced rotor scenarios. The imbalanced conditions are systematically introduced to create a comprehensive dataset. The next step, data processing, involves preparing the collected data by removing noise using filtering techniques, normalizing the data, segmenting it into time intervals, and extracting key features such as amplitude and frequency. Once the data is processed, the MLP design development stage is initiated. Here, the neural network architecture is designed by configuring the number of layers, neurons, and activation functions to model the vibration data effectively.
Subsequently, hyperparameter tuning is performed to optimize the model by adjusting parameters such as learning rate, regularization, and network complexity to improve performance while preventing overfitting or underfitting. The model is then trained utilizing the processed data during the data training stage, with the dataset split into training, validation, and testing subsets. After that, the model performance evaluation step assesses the model using metrics such as accuracy, RMSE, R2, and confusion matrices. If the model achieves the required performance threshold (over 75% accuracy), it progresses to the next stage. Otherwise, it loops back to the hyperparameter tuning step for further refinement. Once the performance criteria are met, the model is integrated into the UAV system in the system-integration phase, enabling real-time rotor imbalance detection.
3.2. Quadrotor UAV Configuration
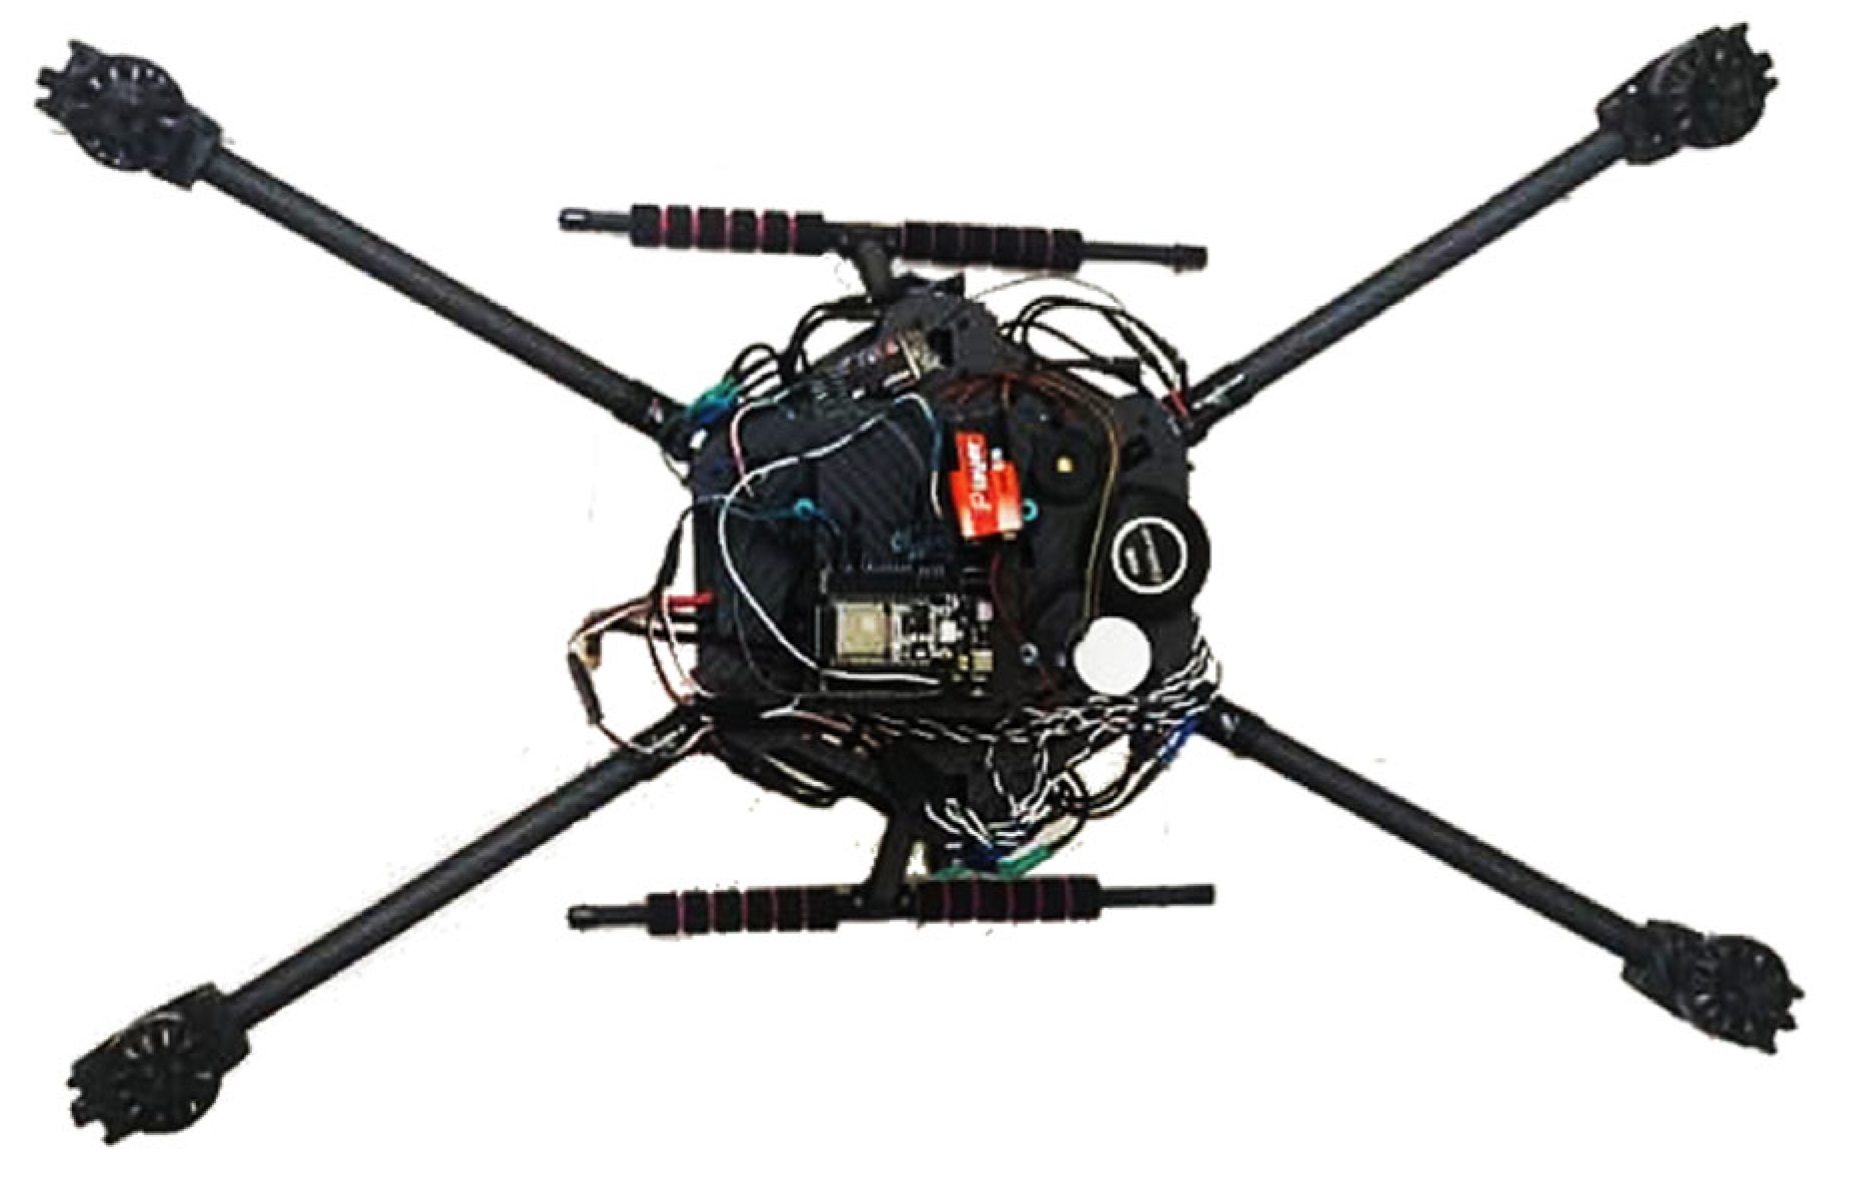
The quadrotor UAV system configuration in this study includes several key components designed to ensure functionality and operational efficiency, particularly for the machine learning-based vibration analysis system. The UAV frame is constructed from lightweight yet durable carbon fiber composites, which provide a high strength-to-weight ratio essential for stability and flight endurance. Following an X-configuration design, as shown in
Figure 2, the frame enhances flight control and stability while maintaining modularity for easy assembly, maintenance, and component replacement. The propulsion system features 720 KV brushless motors paired with carbon-fiber propellers to generate efficient lift and minimize aerodynamic drag. These are regulated by a 40A Electronic Speed Controller (ESC) without a Battery Eliminator Circuit (BEC), ensuring precise motor speed control critical for stable flight.
The UAV is powered by a high-capacity 6000 mAh Lithium Polymer (LiPo) battery that promotes extended flight durations. A power module tracks voltage and current, providing alerts for low battery levels to maintain consistent energy delivery. The flight control system is managed by the Pixhawk 2.4.8 controller, which integrates gyroscopes and accelerometers for real-time stability and navigation adjustments. Vibrations affecting the flight controller are minimized using a damping board, ensuring accurate data collection during operation. Navigation is facilitated by a u-blox M7N GPS module, which delivers location and orientation data for autonomous flight and waypoint navigation.
3.3. UAV Experimental Setup
The ground test was conducted to evaluate the performance and reliability of the UAV vibration analysis system under controlled conditions. The testing was performed in an outdoor environment to expose the UAV to external factors such as wind turbulence and temperature variations. During the test, the UAV was securely mounted on a stationary test rig to ensure stability and prevent unintended movement. The layout of the quadcopter’s arms and the positioning of the MEMS sensor, located in the middle of the quadcopter, is illustrated in
Figure 3. The MEMS accelerometer used for vibration data acquisition was the MPU6050. This sensor features an accelerometer frequency range of up to 260 Hz and a gyroscope frequency range of up to 8000 Hz. It offers adjustable accelerometer sensitivity settings of ±2 g, ±4 g, ±8 g, and ±16 g, corresponding to sensitivity values of 16,384 LSB/g, 8192 LSB/g, 4096 LSB/g, and 2048 LSB/g, respectively. The noise level is less than 0.01 g RMS. Additionally, the MPU6050 integrates a gyroscope with a range of ±250 to ±2000 °/s, making it highly suitable for UAV applications.
The sensor’s frequency range aligns well with the typical rotor speeds and the induced vibrations of quadrotor UAVs. Rotor imbalances typically generate vibrations in the range of 10–100 Hz, which falls comfortably within the accelerometer’s range of up to 260 Hz. This ensures that the sensor can detect the primary vibration signals (fundamental frequencies) and their harmonics. The sensor’s range also supports capturing transient vibrations during rotor startup, shutdown, or rapid speed changes, as well as steady-state vibrations during sustained flight. Furthermore, the upper limit of 260 Hz aids the detection of higher-order vibrations and harmonics that may arise from structural resonances or aerodynamics. These capabilities enhance diagnostic effectiveness by providing comprehensive data across all UAV operational phases. Since rotor vibrations are well within the sensor’s operational range, the MPU6050 can reliably record and transmit data for real-time analysis, ensuring prompt diagnosis and prevention of failures during flight. The versatility of the MPU6050, with its wide frequency range and high sensitivity, makes it adaptable to various UAV configurations, ensuring compatibility with different rotor designs, sizes, and operating conditions.
These sensors were strategically placed to capture uniform data with the sensor positioned in the middle, enabling the system to monitor vibration patterns comprehensively. Controlled imbalances were systematically introduced by loosening one of the blade screws to create specific test conditions. These controlled changes generated distinctive vibration patterns, which were recorded using a MEMS sensor. The vibration acceleration data were collected under various imbalance scenarios to capture a comprehensive set of test conditions. The experimental setup also included UAVs equipped with 12 × 5.5 propellers, where accelerations exceeding ±1.5 g were noted as a key threshold for further analysis.
3.4. Data Processing
The dataset used in this study was carefully curated to ensure a comprehensive representation of both balanced and imbalanced rotor conditions. A total of 800 data samples were collected. Of these, 442 samples represented balanced rotor conditions, while the remaining 358 samples were collected under controlled imbalanced scenarios. Each data sample consisted of vibration signals recorded over a 1 s interval, segmented into windows to capture both transient and steady-state vibration patterns.
The dataset was split into training, validation, and testing subsets in a ratio of 70:15:15 to ensure that each subset maintained the same class distribution. The training set contained a total of 560 samples, the validation set included 120 samples, and the testing set comprised 120 samples. This stratified splitting approach preserved the proportions of Class 0 (balanced) and Class 1 (imbalanced) samples across all subsets, ensuring that the model was exposed to a representative distribution of both classes during training and evaluation. The balanced composition of the dataset, along with the diverse scenarios represented, ensured that the machine-learning model could effectively generalize to new, unseen data while maintaining high accuracy in detecting rotor imbalances.
The raw vibration data collected from the MEMS sensors underwent a detailed preprocessing stage to ensure the quality and reliability of the inputs for the machine-learning model. Initially, noise removal was performed using a low-pass Butterworth filter with a cutoff frequency of 50 Hz, chosen to preserve the essential vibration signals while filtering out high-frequency noise, such as electrical interference or environmental disturbances, which could interfere with the clarity of the diagnostic features. The cutoff frequency of 50 Hz aligns well with the operational characteristics of the quadrotor UAV’s rotor vibrations, which predominantly fall within the range of 10–100 Hz. As most significant vibration data is concentrated below 50 Hz, this frequency ensures that the essential signals related to rotor imbalances are captured without distortion. Simultaneously, higher-frequency noise, which is not relevant to rotor dynamics, is effectively attenuated, improving the signal-to-noise ratio.
The Butterworth filter was chosen for its flat frequency response in the passband, which provides minimal amplitude distortion of the retained signals. This property is particularly beneficial for machine-learning models, as it ensures that the input data remains representative of the actual vibrations experienced by the UAV. By using this filter configuration, the preprocessing step guarantees the integrity and reliability of the vibration data, facilitating accurate rotor imbalance detection and analysis. Additionally, a moving average filter was applied to smooth short-term fluctuations and improve the clarity of the data trends. To address outliers, the z-score method was employed, identifying and removing data points with a z-score exceeding ±3 to prevent extreme values from skewing the analysis.
Following noise reduction, min–max normalization was applied to standardize the vibration data, with scaling values between 0 and 1. This step affirmed that all features contributed equally to the machine-learning model, preventing larger magnitude features from dominating the learning process. The data was then segmented into fixed-length windows of one second, with a 50% overlap between consecutive windows, to capture transient and steady-state vibration patterns. Each segment was labeled as balanced or imbalanced based on the rotor condition during data collection to create a structured and labeled dataset. Key features, including vibration amplitude, frequency, and kurtosis, were subsequently extracted from the cleaned and normalized data. These features were chosen for their relevance to rotor imbalance detection and their ability to capture time-domain and frequency-domain characteristics. To ensure the dataset was diverse and representative, a quality assessment was conducted to check for class balance. When necessary, additional data were collected to address imbalances. This preprocessing pipeline, comprising noise removal, normalization, segmentation, feature extraction, and quality assessment, prepared the vibration data for robust and accurate rotor imbalance detection under real-world UAV operating conditions. The overall flowchart for the data processing process is illustrated in
Figure 4, and the pseudocode for data processing is shown in
Table 2.
3.5. Artificial Neural Network Architecture
An MLP was employed to develop a robust classification model. The labeled vibration data was used to train the MLP model, focusing on optimizing its ability to accurately classify rotor conditions. Hyperparameters such as learning rate, number of neurons, and hidden layers were carefully tuned to achieve optimal performance. A grid search method was employed to systematically explore a range of hyperparameter combinations, including the number of neurons in each layer, the learning rate, the number of hidden layers, and the regularization parameter. This approach enabled the identification of configurations that maximized the model’s predictive accuracy while avoiding overfitting. Once the model had been trained, its performance was validated using a separate test dataset. The model was required to meet a minimum accuracy threshold of 75% to proceed to the next stage. If this criterion was not met, the model underwent iterative refinement, which may include adjusting its architecture, improving preprocessing techniques, or incorporating additional data.
The network architecture for the MLP model, as illustrated in
Figure 5, consists of an input layer, five hidden layers, and an output layer. These layers are interconnected, allowing the network to learn complex patterns and relationships from the input data.
The input layer serves as the entry point for the data, consisting of neurons corresponding to the features extracted from the vibration data, such as amplitude, frequency, and other relevant indicators of rotor condition. If the input data has
features, the input layer consists of
neurons. Each feature
in the input data is fed into the network and passed to the first hidden layer. The network includes five hidden layers, as shown in
Figure 5, each containing multiple neurons. These neurons are fully connected, meaning every neuron in one layer is connected to every neuron in the next layer. The output of a single neuron
in a hidden layer is computed as follows in Equation (1):
where
is the input from the previous layer (or the input layer for the first hidden layer),
is the weight between neuron
in the previous layer and neuron
,
bias for neuron
, and
is the linear combination of inputs for neuron
. Each neuron applies a non-linear activation function
to introduce non-linearity, enabling the network to model complex relationships. A commonly used activation function is the ReLU (Rectified Linear Unit), expressed as follows in Equation (2):
ReLU introduces sparsity into the network, allowing it to focus on significant patterns and improving its ability to generalize across different vibration conditions. The output layer consists of a single neuron that provides the final classification of the rotor condition. A sigmoid activation function is applied to the weighted sum of inputs, producing a probability score that indicates the likelihood of the rotor being imbalanced. If the output probability exceeds 1.5, the rotor is classified as imbalanced. Otherwise, it is classified as balanced. The ANN is trained using a dataset that includes balanced and imbalanced rotor scenarios. The training process involves forward propagation, where the network computes predictions, and backpropagation, where the loss is minimized. The loss is calculated using the Mean Squared Error (MSE), expressed as follows in Equation (3):
where
is the actual rotor condition,
is the predicted condition, and
is the number of data points. To evaluate the model’s performance, the Root Mean Squared Error (RMSE) is used as defined in Equation (4):
RMSE provides an interpretable measure of the model’s predictive accuracy, as it is expressed in the same units as the original data. This ANN architecture, with its five hidden layers, allows the system to model the complex relationships inherent in vibration data. The combination of forward propagation, backpropagation, gradient-based optimization, and the use of RMSE for performance evaluation ensures a robust and reliable classification of rotor conditions, enhancing the UAV’s operational safety and maintenance efficiency. The pseudocode of Algorithm 2 of the MLP architecture for binary classification is shown in
Table 3.
4. Results
This section presents the experimental results and analysis of the vibration pattern observed in the quadcopter UAV. The results focus on the application of an ANN to detect rotor imbalances through vibration analysis.
4.1. Vibration Patterns of Balanced and Imbalanced Rotors
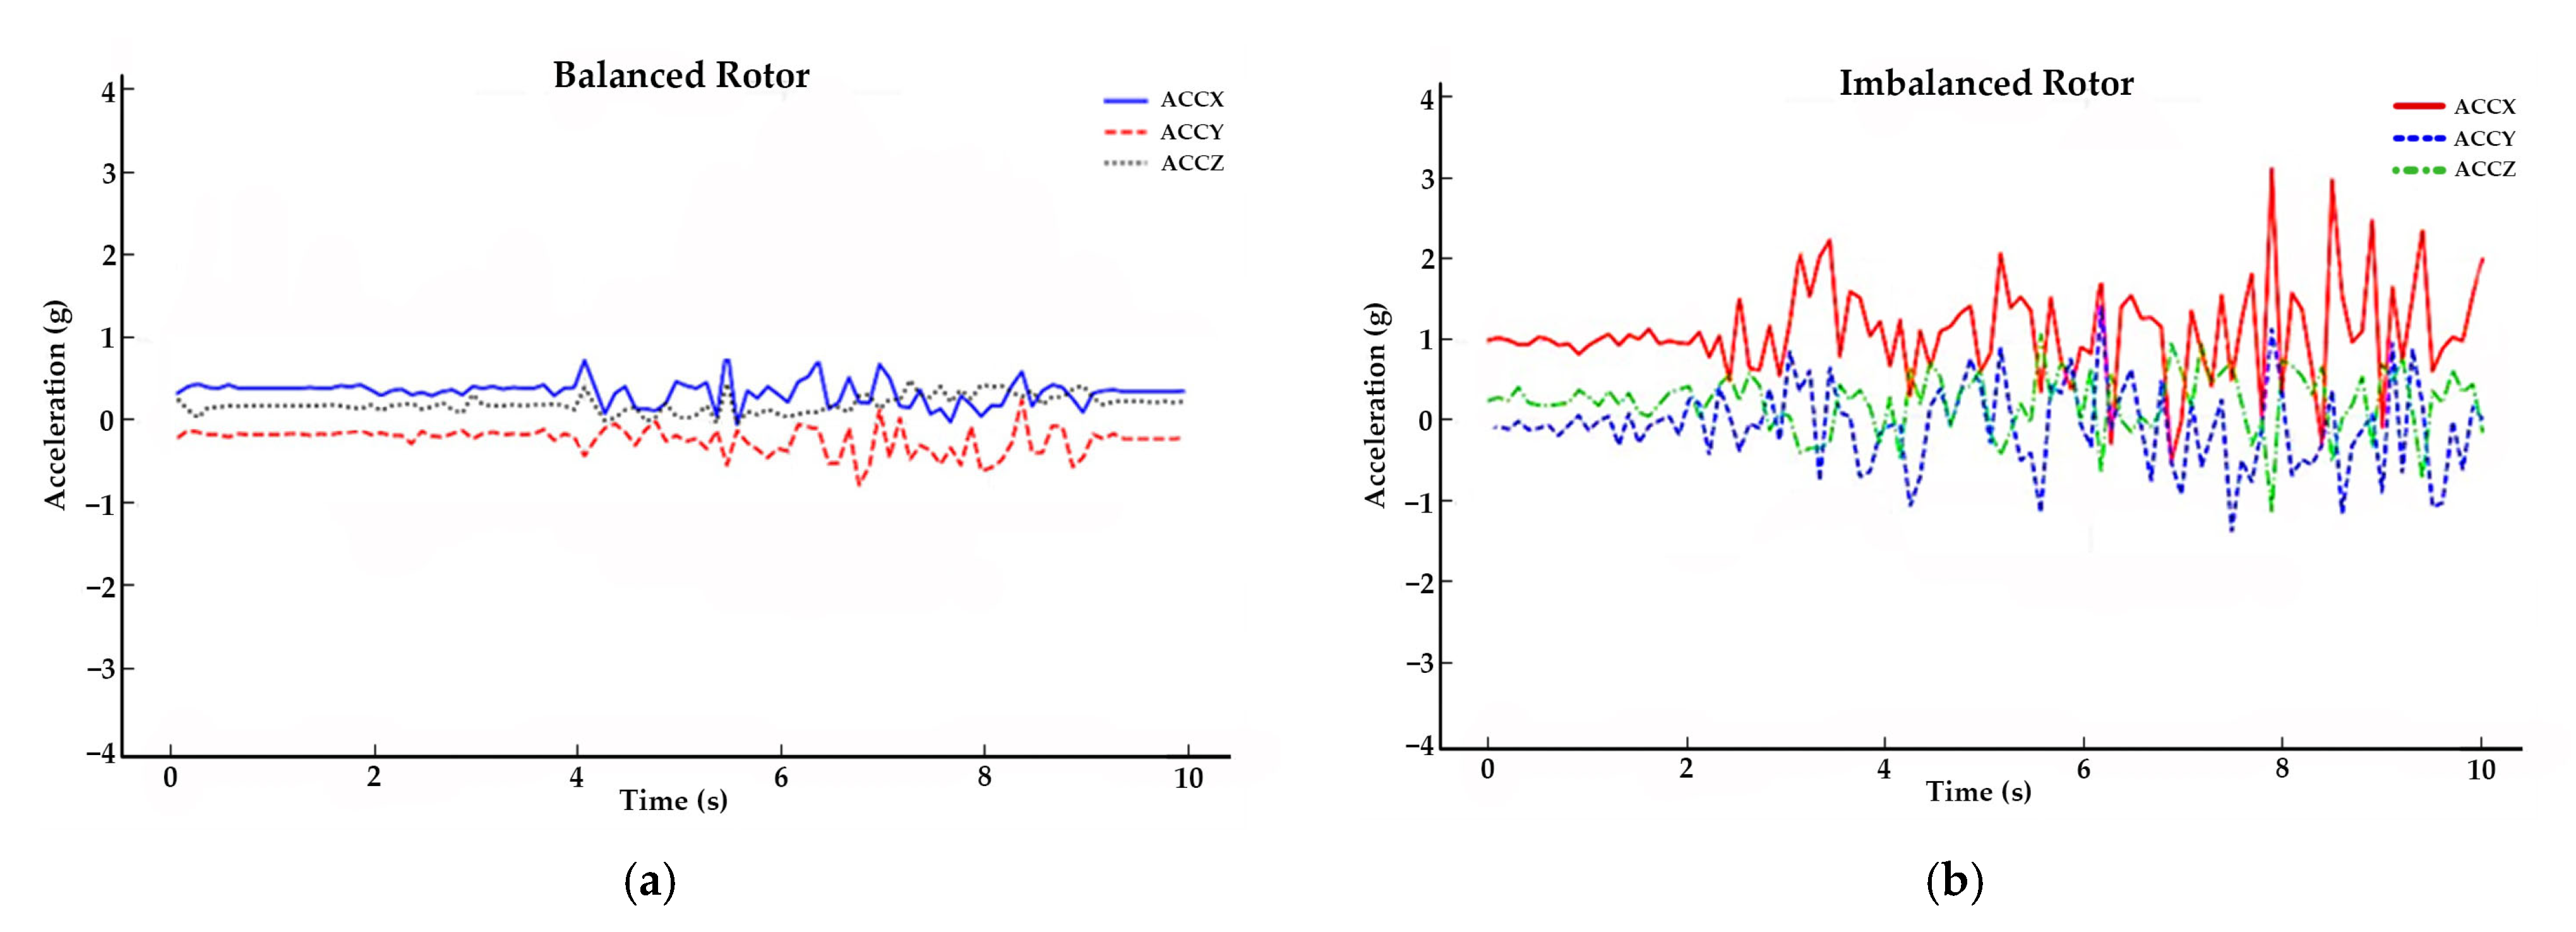
The vibration data from the Quadcopter Measurement experiment revealed significant differences between balanced and imbalanced rotor conditions. The graphs in
Figure 6 compare the vibration acceleration of balanced and imbalanced rotors over a 10 s time interval, measured along the X, Y, and Z axes (ACCX, ACCY, and ACCZ) for arm 1.
Figure 6a illustrates the vibration profile for a balanced rotor. The acceleration values for all three axes remained consistent and within a narrow range, demonstrating minimal fluctuation. This stability indicates that the rotor was properly aligned and that the forces generated during the operation were evenly distributed. The absence of spikes or irregularities in the acceleration data further confirmed the structural integrity of the balanced rotor.
While
Figure 6b represents the vibration profile for an imbalanced rotor, unlike the balanced rotor, the acceleration values demonstrated significant variability, with noticeable spikes and oscillations across all three axes. The ACCX axis exhibited the most pronounced deviations, with peaks exceeding 2 g, indicating that the rotor imbalance primarily affects the
X axis. The irregular patterns observed on the Y and Z axes suggest that the imbalance induced secondary vibrations propagating throughout the system. These fluctuations could not only compromise the UAV’s stability but also increase the risk of mechanical failure if left unaddressed.
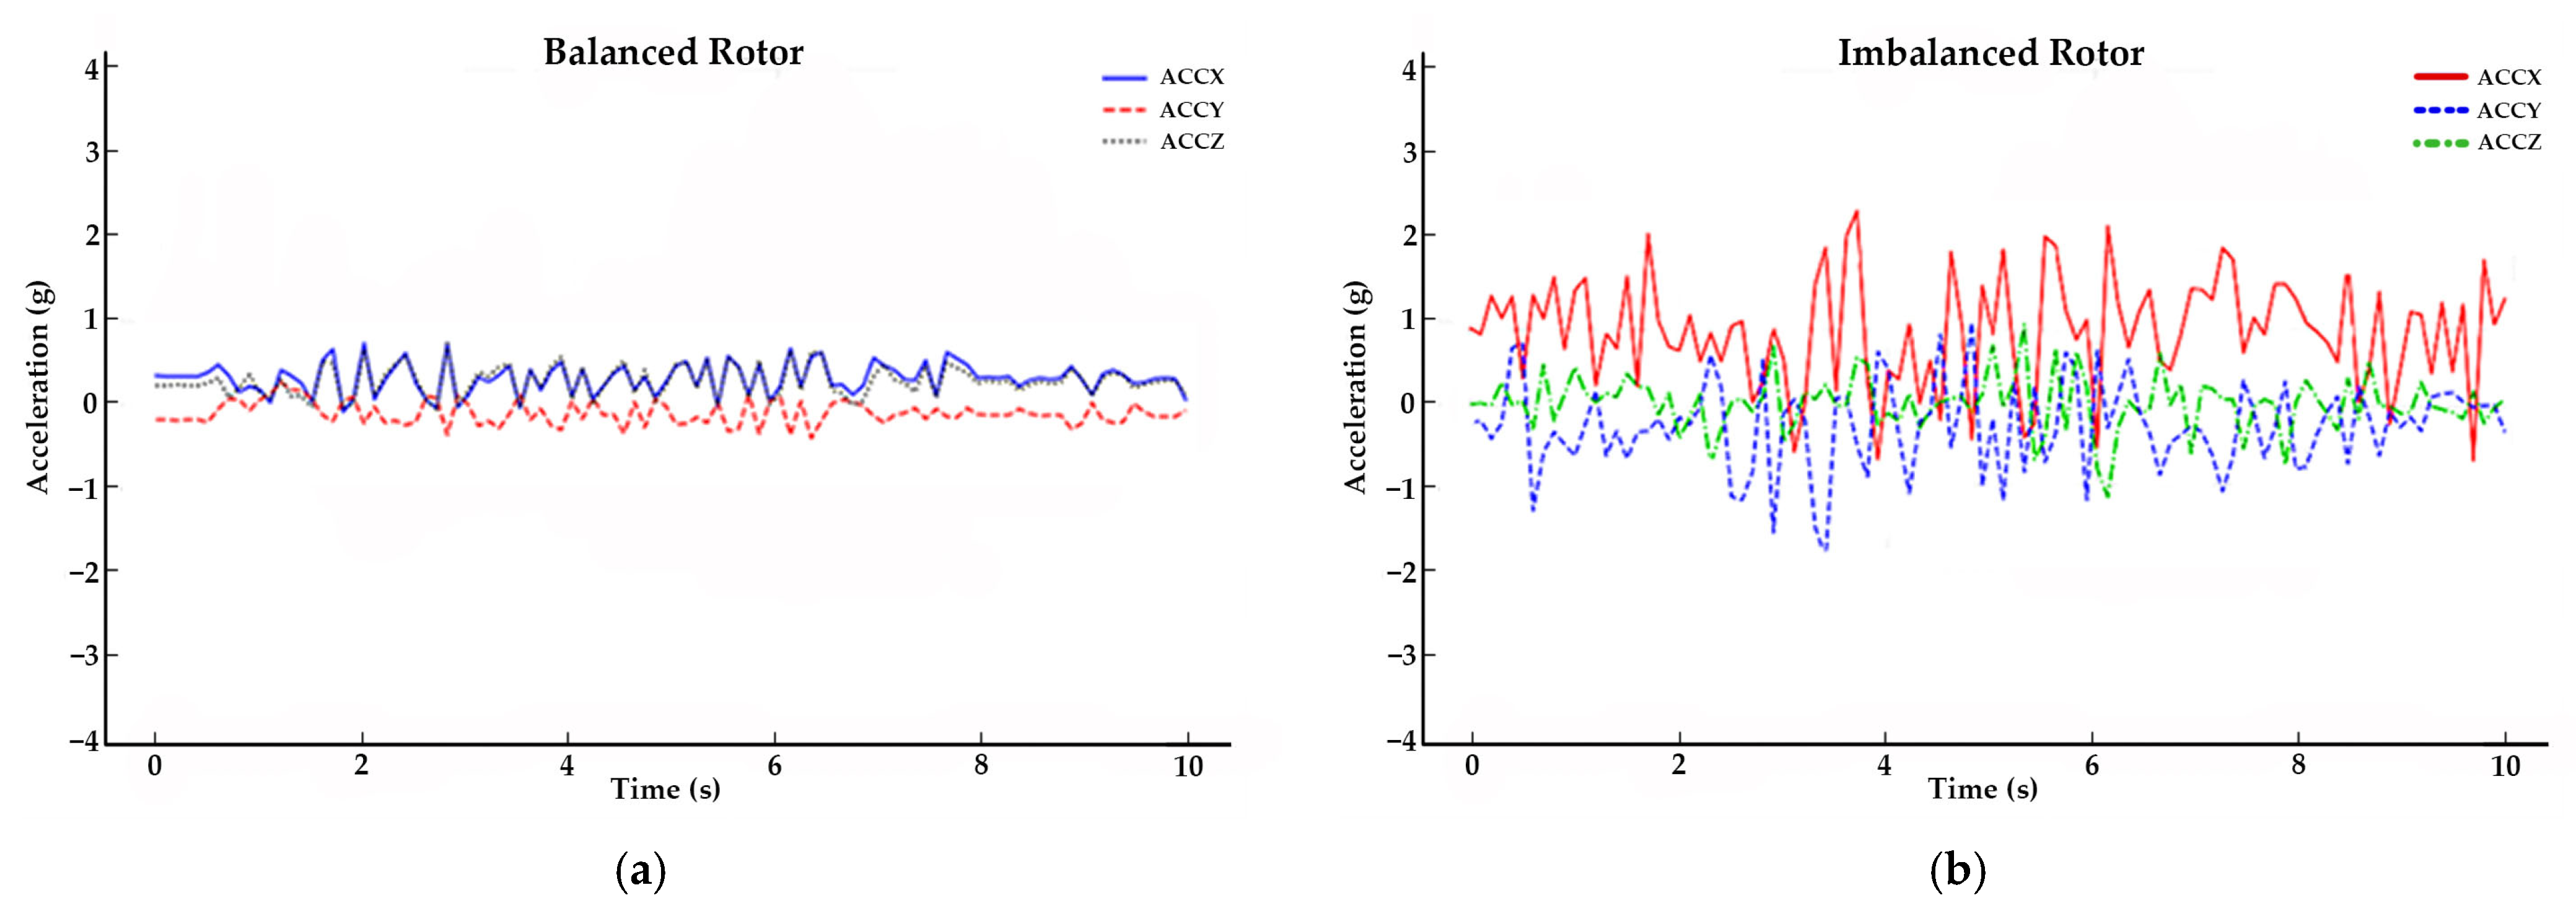
In
Figure 7a, the balanced rotor for arm 2 exhibited stable and consistent acceleration values across all three axes, remaining within a range of ±1 g. The stability across the axes indicates proper rotor alignment and minimal disturbances. Conversely, the imbalanced rotor in
Figure 7b showed significant fluctuations, particularly along the ACCX axis, where peaks exceeded ±2 g. The ACCY and ACCZ axes also displayed irregular oscillations, though with lower magnitudes. This indicates that the imbalance primarily affected the
X axis while propagating secondary disturbances to the Y and Z axes.
Figure 8 focuses on the vibration acceleration for arm 3. In
Figure 8a, the balanced rotor exhibited similar stability to arm 2, with minimal fluctuations across the ACCX, ACCY, and ACCZ axes. However, the imbalanced rotor in
Figure 8b demonstrated distinct spikes and oscillations, particularly along the ACCX axis. The acceleration values frequently exceeded ±2 g, and the disturbances were more pronounced compared to arm 2. This could indicate that the imbalance has a more significant effect on the dynamics of arm 3, possibly due to variations in the structural configuration or loading of the arm.
In
Figure 9, referring to arm 4, the balanced rotor
Figure 9a again illustrated stable and predictable acceleration profiles across all three axes, confirming the rotor’s alignment. The imbalanced rotor in
Figure 9b, however, exhibited severe oscillations, with all three axes, ACCX, ACCY, and ACCZ, showing notable disturbances. The ACCX axis experienced the most significant fluctuations, with peaks exceeding ±3 g, while the ACCY and ACCZ axes also showed increased variability. The severity of these vibrations suggests that arm 4 was highly sensitive to rotor imbalances, possibly due to its structural dynamics or interaction with the UAV’s overall stability.
In
Figure 6,
Figure 7,
Figure 8 and
Figure 9, a consistent pattern emerged in which balanced rotors maintained stability across all axes with minimal fluctuations, while imbalanced rotors induced significant and erratic vibrations, particularly on the ACCX axis. For instance, one of the arms exhibited a vibration reading of −2.45 g, which was well beyond the acceptable range for stable rotor operation. These large deviations are clear indicators of rotor imbalance, which typically leads to flight instability and increased wear on the UAV’s components.
4.2. ANN Model Performance Evaluation
The ANN architecture in this research is specifically designed to classify rotor conditions as balanced or imbalanced based on vibration data. The first hidden layer employs the hyperbolic tangent sigmoid (tanh) transfer function, which maps input values to a range between −1 and 1, enabling the effective learning of complex patterns in the vibration data. The second hidden layer utilizes a standard sigmoid function, mapping values to a range between 0 and 1 to capture non-linear relationships between features. The final output layer applies a pure linear transfer function to produce an output that is subsequently used for classification.
In this system, a rotor is classified as imbalanced if the vibration acceleration exceeds 1.5 g, while it is classified as balanced if the vibration acceleration is below or equal to 1.5 g. To optimize the training process, the network incorporated variable learning rates () to adapt dynamically to the convergence behavior. Furthermore, variable regularization parameters () were employed to mitigate overfitting by penalizing excessively large weights. These configurations ensure that the ANN is capable of accurately distinguishing between balanced and imbalanced rotor conditions, making it highly effective for UAV vibration analysis.
Table 4 presents the results of the 10 best network configurations, showing variations in the number of neurons across five hidden layers and their corresponding performance metrics, including MSE, RMSE, correlation coefficient (R), coefficient of determination (R
2), and the learning rate.
Among the configurations, the network with hidden layer sizes of 18, 7, 10, 6, and 12 achieved the best performance. It recorded the lowest MSE of 0.02, the smallest RMSE of 0.1414, and the highest R-value of 0.9604, indicating a strong correlation between predicted and actual values. Additionally, this configuration exhibited the highest R2 value of 0.9224, reflecting excellent predictive accuracy. Furthermore, configurations with fewer neurons in certain layers tended to have a higher RMSE and lower R2, suggesting that increasing network complexity improves performance to a certain extent. These results demonstrated that this specific configuration optimally balanced the complexity of the model and its ability to generalize effectively to the given data.
The selection of hidden layer sizes is crucial in defining the capacity of an MLP to model complex relationships within data. Larger initial layers can capture a broad spectrum of features, while subsequent smaller layers refine these features into pertinent patterns for classification tasks. This hierarchical structuring aligns with findings in neural network design, where the number and size of hidden layers significantly impact model performance [
30]. The optimal MLP configuration effectively balances model complexity and generalization capability, leading to high accuracy in rotor imbalance detection. This balance is critical, as insufficient complexity can hinder learning, while excessive complexity may result in overfitting, as noted in neural network optimization studies [
31].
The training results of the ANN are summarized in
Table 5, highlighting key metrics such as epochs, elapsed time, performance, gradient, and validation checks.
The training process began at epoch 0 and terminated at epoch 258, well before the target of 2400 epochs, as shown in
Figure 10. This early stopping indicates that the convergence criteria were met before reaching the maximum allowed epochs and that further training would not lead to significant improvements. The training process was completed in just two seconds, demonstrating the computational efficiency of the ANN. The short-elapsed time reflects the well-designed architecture and the effectiveness of the chosen optimization parameters.
The performance metric, which represents the Mean Squared Error (MSE), improved significantly during training, dropping from an initial value of 1.09 to a stopping value of 0.103. While the target performance value was set to 0, the achieved result demonstrated substantial learning of the input data patterns. This reduction in performance error confirmed the ANN’s ability to effectively capture the underlying relationships in the training dataset. The gradient, which measures the rate of change of the loss function, decreased from an initial value of 1.29 to 0.0728 by the time training stopped. Although the target gradient was , the significant reduction achieved indicates that the optimization process effectively minimized the loss. The stopping gradient value suggests that while the model converged, further adjustments to learning parameters may yield even better results. The validation process played a crucial role in preventing overfitting. The validation checks reached the maximum limit of 100, indicating that training was halted due to a lack of significant improvement in validation performance over consecutive epochs. This mechanism ensured that the model remained generalizable and did not overfit the training data, preserving its ability to perform well on unseen data.
4.3. Confusion Matrix Analysis
Figure 11 presents confusion matrices for the training, validation, testing, and combined datasets, providing a comprehensive evaluation of the ANN’s performance in classifying balanced and imbalanced rotor conditions. These matrices reveal the model’s classification accuracy, precision, and the extent of misclassifications across different datasets. The training confusion matrix indicated that the ANN achieved a high level of accuracy in classifying the training data. The model correctly classified 284 balanced samples (true negatives) and 246 imbalanced samples (true positives), resulting in a classification accuracy of 94.6%. Misclassifications were minimal, with only 28 balanced samples and two imbalanced samples misclassified. These results demonstrate the model’s ability to effectively learn patterns from the training data while maintaining a low error rate.
While the validation confusion matrix evaluates the model’s performance on unseen data during training, the ANN achieved an accuracy of 89.2%, correctly identifying 54 balanced samples and 53 imbalanced samples, with slight increases in misclassification compared to the training dataset. A total of 12 balanced samples and one imbalanced sample were misclassified, highlighting the model’s generalization capability. Despite the slight drop in accuracy, the results showed that the ANN generalizes well to validation data, ensuring its robustness. Meanwhile, the test confusion matrix assessed the ANN’s performance on completely unseen data to simulate real-world scenarios. The model achieved an accuracy of 92.5% in correctly classifying 57 balanced samples and 54 imbalanced samples. The misclassification rates were low, with seven balanced samples and two imbalanced samples incorrectly classified.
The overall confusion matrix aggregated the results from the training, validation, and testing datasets. The ANN achieved an accuracy of 93.5% across all datasets, correctly identifying 395 balanced samples and 353 imbalanced samples while misclassifying 47 balanced samples and five imbalanced samples. The ANN consistently performed well across all datasets, with accuracy exceeding 89%, peaking at 94.6% for the training dataset and maintaining 92.5% on the test dataset. The model exhibited strong generalization from training to validation and testing, with only slight decreases in accuracy due to increased complexity in unseen data. Furthermore, misclassification rates remained below 12% across all datasets, indicating the ANN’s sensitivity to both balanced and imbalanced rotor conditions.
4.4. Regression and Prediction Accuracy
Figure 12 presents the regression plots for the training, validation, testing, and overall datasets, illustrating the relationship between the network’s predicted outputs and the actual target values.
The regression plot for the training dataset highlights a strong linear correlation between the predicted outputs and target values, with a correlation coefficient (R2) of 0.96. The blue regression line closely aligns with the ideal dashed line (y = x), indicating that the ANN effectively learned the patterns in the training data. The clustering of data points near the regression line demonstrates minimal error and high accuracy in predictions.
The validation dataset regression plot also shows a high correlation coefficient of 0.95, indicating that the ANN generalized well to unseen data during the training process. The regression plot for the test dataset presents a slightly lower correlation coefficient (R = 0.87) compared to the training and validation datasets. While the blue regression line remains close to the ideal dashed line, there is a noticeable increase in the spread of data points around the line. This indicates slightly higher prediction errors in the test dataset, which is expected due to the unseen nature of the data. Despite this, the R = 0.87 value still demonstrates that the model retained a reasonable level of accuracy and generalization when applied to new data. The regression plot for all datasets combined shows an overall correlation coefficient of 0.95, highlighting the model’s consistent performance across all data splits. The blue regression line aligns well with the ideal dashed line, and the clustering of data points near the line indicates robust prediction accuracy.
In addition,
Figure 13 displays the training dynamics of the ANN through two subplots, namely the gradient values over epochs and the validation checks. The top subplot illustrates the gradient values over 258 epochs. The gradient starts at a relatively high value and exhibits significant fluctuations during the initial epochs, indicating the network’s adjustments as it began optimizing the loss function. Over time, the gradient values decreased and stabilized, converging to a value of 0.072772 by epoch 258. This reduction in gradient magnitude reflects the progressive improvement in the network’s parameters as the optimization process approached a local minimum.
The bottom subplot tracks the validation checks over the 258 epochs. The validation checks increased steadily, reaching the maximum allowable value of 100, which triggered the early stopping mechanism. This indicates that no further improvements in validation performance were observed, prompting the training to halt to prevent overfitting. The consistent increase in validation checks after approximately 150 epochs suggests that the model reached its optimal performance relatively early, with subsequent epochs showing diminishing returns.
5. Conclusions
This research highlights the effectiveness of the proposed system, which integrates MEMS sensor-based data acquisition, advanced preprocessing techniques, and an optimized MLP architecture. The preprocessing pipeline included noise filtering, feature extraction, and data normalization, ensuring high-quality inputs for the MLP model. Experimental results reveal the system’s remarkable diagnostic capabilities, achieving an RMSE of 0.1414 and a correlation coefficient of 0.9224 on test datasets. These metrics underscore the system’s accuracy and reliability in distinguishing between balanced and imbalanced rotor conditions.
Moreover, the MLP architecture demonstrated its ability to model complex, non-linear relationships in high-dimensional vibration data, offering significant advantages over traditional analytical methods. Highlights from this research include the demonstration of MLP neural networks as a powerful tool for UAV diagnostics, particularly for handling complex vibration signatures in dynamic operating environments. This study also emphasizes the importance of tailored machine-learning architectures in addressing domain-specific challenges, bridging the gap between theoretical advancements and practical applications. The findings pave the way for enhanced UAV operational safety, reduced downtime, and more efficient maintenance workflows.
Future research can build on this foundation by exploring hybrid machine-learning models and integrating convolutional or recurrent architectures to further improve predictive accuracy and scalability. Additionally, expanding the application to different UAV configurations and operational scenarios will help validate the system’s adaptability and robustness. These advancements will ensure broader applicability, addressing the growing demand for reliable UAV diagnostics across industrial, commercial, and military sectors. Another promising direction for future work is the integration of explainable AI (XAI) techniques to enhance the transparency and trust of the proposed UAV diagnostic framework. Methods like SHAP (SHapley Additive exPlanations) and LIME (Local Interpretable Model-agnostic Explanations) can provide insights into feature contributions, such as vibration amplitude and frequency, enabling maintenance personnel to better understand imbalances and prioritize corrective actions.


 ,
, 


