1. Introduction
Uncrewed space vehicles (USVs) are reusable spacecraft capable of multiple missions, including rapid payload deployment, long-duration orbital operations, and safe return and landing [
1,
2]. The terminal area energy management (TAEM) phase serves as the transitional segment between the initial re-entry (IRE) phase and final approach and landing (
) phase. During this phase, the USV total energy must be properly regulated to ensure arrival at the desired approach and landing interface (ALI) under design constraints. As propulsion is unavailable during atmospheric glide and environmental disturbances cause considerable state variations, the initial conditions at TAEM entry often deviate from the nominal profile. Furthermore, as the USV is generally unpowered, it cannot perform another pull-up or go-around under abnormal conditions. Therefore, a reliable and robust TAEM guidance scheme is crucial for safely completing a flight mission.
The early TAEM guidance framework employed in the Space Shuttle program was primarily based on pre-computed reference trajectories, which limits its ability to adapt amid large uncertainties [
3]. To address this issue, several efforts have been made to develop TAEM guidance strategies that better handle large state dispersions and uncertain conditions. For instance, Kluever [
4] established a rapid trajectory planning algorithm to iterate the heading alignment circle (HAC) radius and location to produce a feasible path. A predictor–corrector scheme is used onboard to adjust the ground track, thus ensuring that the trajectory terminates at the desired down-track position. Moreover, Kluever [
5] also developed a TAEM guidance scheme to deal with the bank magnitude limitations. By following the lower bound of dynamic pressure and widening the turn radius, the scheme bolsters the USV’s limited turning capability. Furthermore, Baek et al. [
6] proposed that the optimum-path-to-go reference trajectory algorithm achieves sufficient energy dissipation by implementing two HACs. Referencing the energy-tube concept, De Ridder & Mooij [
7,
8] presented an onboard HAC planning algorithm that calculates the optimal HAC position. The algorithm is combined with a variable longitudinal strategy based on an energy estimator to ensure safe returns in off-nominal conditions. Morani et al. [
9] proposed an onboard guidance strategy in which the long-term module plans the reference trajectory, while the short-term module derives the corresponding control actions to enhance adaptability under off-nominal conditions. Similarly, Jiang & Yang [
10] presented a guidance scheme based on the energy-range ratio to cope with excessive-energy conditions and introduced an alternative lateral approach pattern. Furthermore, Lan et al. [
11] proposed an online trajectory planner taking dynamic-pressure variation as the shaping parameter and introduced a redesigned ground track layout to dissipate surplus energy.
The aforementioned TAEM guidance strategies have increased the adaptability of the guidance system. Nevertheless, to further improve guidance precision and flexibility, many scholars have evaluated three-dimensional (3D) guidance methods that explicitly consider the interaction between longitudinal and lateral dynamics. For example, Morio et al. [
12,
13] proposed a guidance scheme based on flatness theory and nonlinear dynamic inversion. They designed an onboard 3D path planner and formulated a convex optimal control problem using the flatness approach. Likewise, Mu et al. [
14] established a 3D trajectory generating approach coupled with a downrange correction process, where the HAC parameters are optimized through numerical propagation of the motion equations. In light of the above, in this study, Mu et al. [
15] modified their previous approach and proposed an onboard guidance system. The system stores a dataset containing dynamic pressure data as a function of altitude. Based on the remaining range derived from the onboard ground track predictor (GTP), it selects reference longitudinal trajectories and generates guidance commands online. Additionally, Mu et al. [
16] developed a robust 3D guidance framework for the TAEM phase that integrates trajectory generation based on sliding-mode principles with a shrinking-horizon adjustment process to enhance guidance precision and robustness. Lan et al. [
17] proposed a TAEM guidance scheme, featuring online 3D profile reconstruction for bank-constrained scenarios. Similarly, Kluever [
18] proposed a TAEM guidance approach that applies geometric analysis techniques to tune the HAC radius and estimate the wings-level glide distance corresponding to the current and target energy states, ensuring that the vehicle arrives at the ALI with an appropriate energy level. Mu et al. [
19] developed a guidance approach built upon trajectory optimization, consisting of pseudospectral-based rapid trajectory planning and an onboard flatness-based tracking law.
Previous studies have shown that some optimization-based algorithms can yield trajectories that satisfy flight constraints and achieve high terminal accuracy. However, these algorithms are computationally intensive and time-consuming in real-time onboard applications. To balance computational efficiency and guidance performance, existing TAEM guidance approaches can be broadly classified into optimization-based and geometric predictor-based categories. While the former, such as those employing pseudospectral or flatness techniques [
13,
19], provide high accuracy, the latter [
3,
10,
15,
18,
20,
21] offer a more computationally efficient alternative by predicting the range-to-go and generating guidance commands through real-time interpolation. A key component of these geometric methods is the GTP, which estimates the remaining range to the ALI and uses it as an index for retrieving reference states via lookup tables. However, most existing geometric GTPs compute range-to-go as a piecewise sum of segmented ground tracks, leading to discontinuities at subphase transitions and resulting in abrupt command variations that degrade longitudinal tracking stability.
To overcome the limitations of purely geometric GTP methods and achieve smooth guidance command generation, this study develops a TAEM guidance system incorporating a continuously updated online GTP. Unlike the static piecewise approach, the proposed method integrates the USV’s current state and transition logic to maintain continuous range-to-go change across all subphases. The developed scheme considers flight constraints in designing the longitudinal profile and generates guidance commands through interpolation of the real-time range-to-go. Thus, the proposed system achieves smooth, reliable, and real-time guidance performance suitable for onboard implementation. Differently from previous studies, our study makes the following primary contributions.
A new real-time range-to-go computation algorithm is developed within the proposed GTP. Unlike previous piecewise geometric GTP methods, this algorithm integrates status flags and an integrated range to ensure continuous and smooth variation in the predicted range-to-go across all subphases. This design eliminates discontinuities at subphase transitions, preventing abrupt jumps in interpolated guidance commands and improving longitudinal command smoothness and tracking stability.
A low-energy reference trajectory tracking strategy is proposed for insufficient initial energy scenarios. While previous studies have focused on excessive-energy scenarios, the proposed method is devised to track a predetermined low-energy reference trajectory under low initial energy conditions, attempting to capitalize on the available control margin. This approach enables effective longitudinal tracking and ensures that the USV reaches the ALI with sufficient energy.
Flight validation under real conditions is conducted. The proposed guidance scheme was implemented onboard and successfully flight-tested in July 2024. The flight results confirm its engineering feasibility and robustness, validating the online GTP framework in practical flight environments.
The paper is structured as follows.
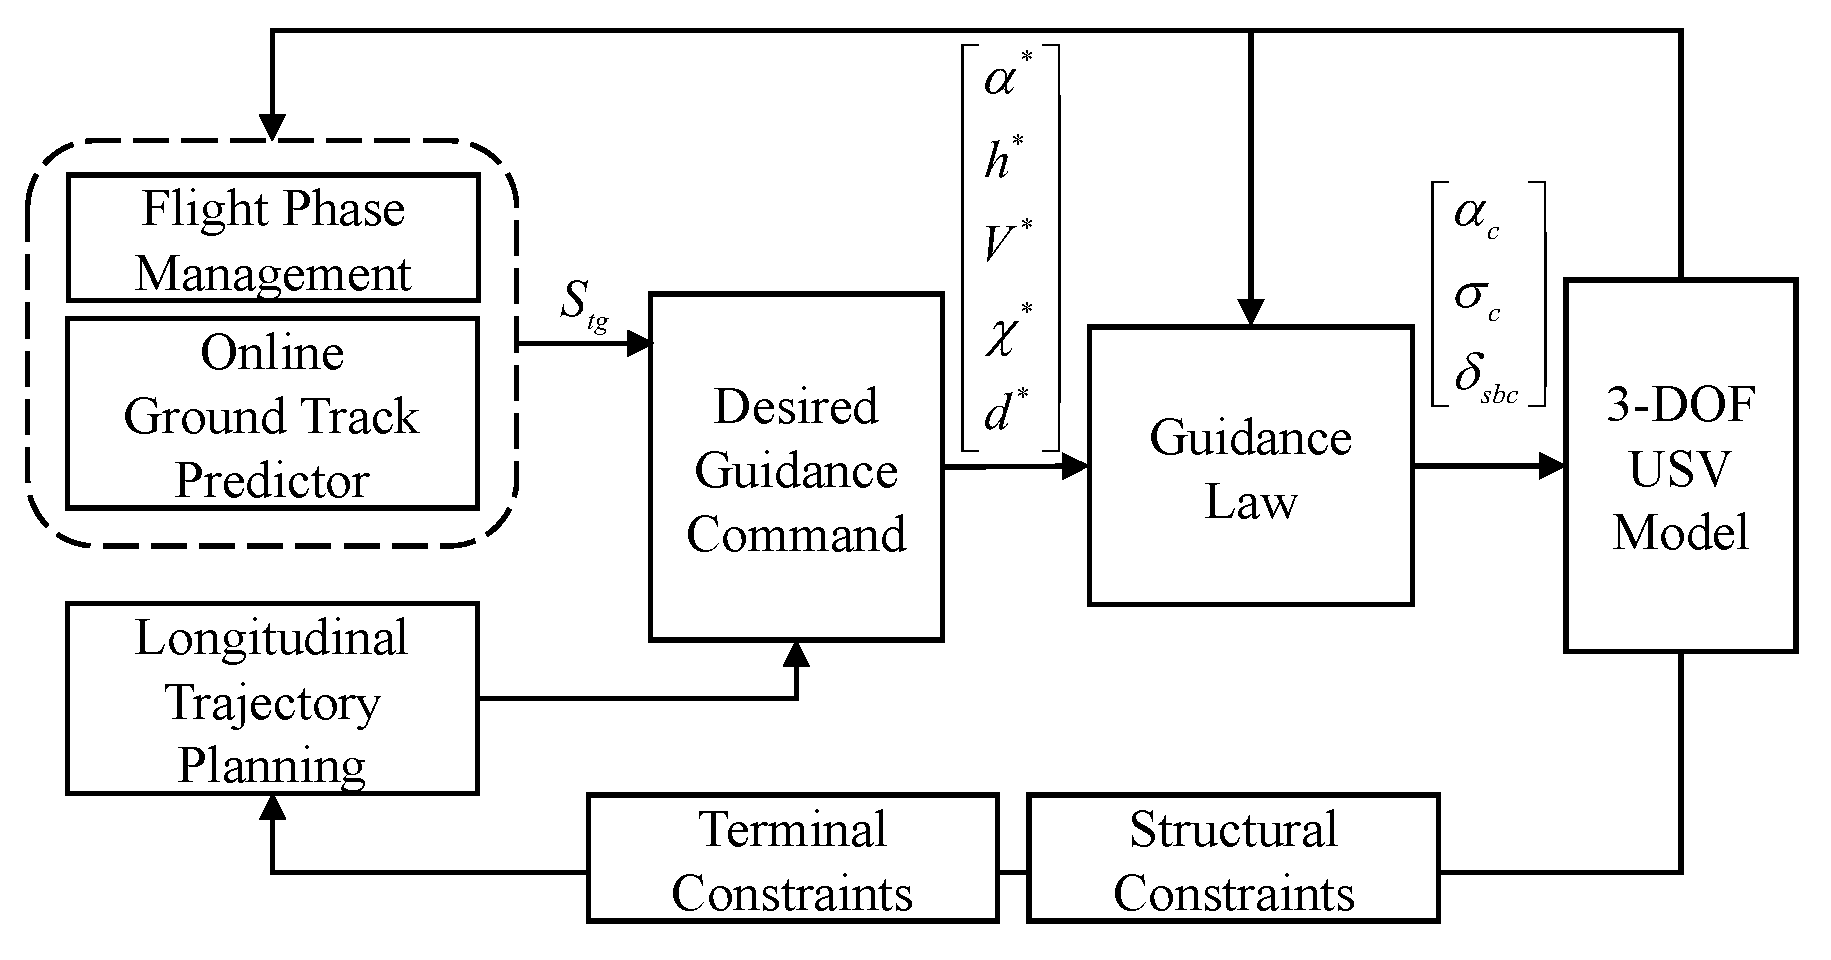
Section 2 introduces the motion equations, describes the TAEM guidance constraints, and provides a brief summary of the proposed guidance system. In
Section 3, an online GTP is proposed.
Section 4 details the longitudinal trajectory design, employing a pseudospectral approach.
Section 5 develops the longitudinal and lateral guidance laws.
Section 6 presents the numerical simulation results under various scenarios.
Section 7 reports the flight test results. Finally,
Section 8 provides our conclusions.
3. Online Ground Track Predictor
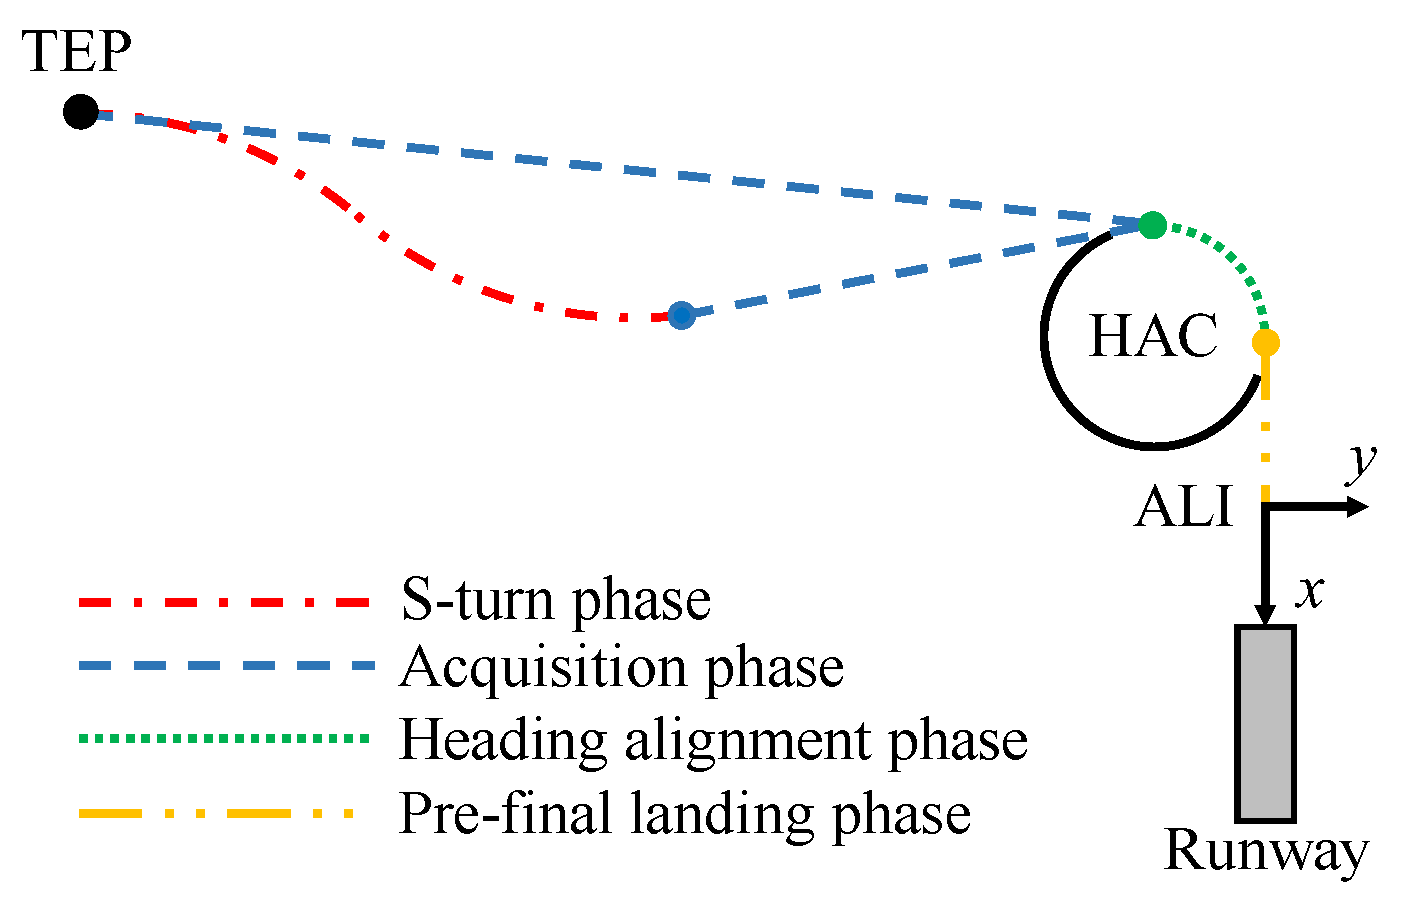
The ground track path is depicted in
Figure 4 and consists of four different parts: the S-turn phase, acquisition phase, heading alignment phase, and pre-final landing phase. An S-turn maneuver is unnecessary in the TAEM phase unless the vehicle possesses excess energy at the terminal entry point. In such cases, it performs an S-turn maneuver to alter course, increase flight range, and dissipate surplus energy. If the USV’s initial energy falls within the nominal low-energy range, it first adjusts its heading to coincide with the tangent of the planned HAC and then proceeds along a straight-line ground track. After reaching the point of tangency with the HAC, the heading alignment phase starts, where the USV performs banking maneuvers to track the HAC. Once the HAC turn is completed, the pre-final landing phase begins, during which the USV follows the extended centerline of the runway and alters its heading and lateral position to ensure alignment accuracy upon entering the ALI.
The online GTP computes the range-to-go in real time based on the established ground track path and performs the following functions. First, at the initial point of the TAEM, the range-to-go and initial energy of the USV act as crucial indicators for determining whether to enter the S-turn phase. Second, during flight, the desired guidance commands are found by interpolating the reference trajectory based on the real-time range-to-go. Therefore, the predicted range-to-go must change continuously throughout the flight to avoid abrupt changes in the interpolated guidance commands. The range-to-go detailed calculations for the ground track path are described below for two cases: with and without the S-turn.
3.1. Ground Track Path Without S-Turn
If the USV begins with the acquisition phase in the TAEM, the total range-to-go
is deconstructed into three distinct trajectory segments, as illustrated in
Figure 5:
where
,
, and
represent the predicted ground track ranges for acquisition, heading alignment, and pre-final landing phases, respectively.
Because the pre-final landing phase involves a straight-line flight path and its trajectory is predefined within the the phase, the ground track range is known. The ALI position can therefore be determined from the runway geometry and the ground track distance associated with the phase, which in turn enables the calculation of the tangency point . The HAC radius is set as a constant based on the nominal velocity at the beginning of the heading alignment phase. Therefore, the HAC center position can thus be obtained.
With the USV’s current position A and the HAC center position O, the straight-line flight range
can be obtained as follows:
where
consists of a small circular arc and a long straight-line, as depicted in
Figure 5. Because of the USV’s high velocity and small bank angle in the acquisition phase, the turning radius of the circular arc is similarly large, enabling the circular arc to be approximated as a straight line. Thus, to simplify the calculations, we employ a straight-line ground track to approximate the actual circular-arc ground track.
An auxiliary line DN is then drawn through point A parallel to the x-axis. Based on the lengths of
,
and
, the angles
and
are first assessed, from which
is obtained as follows:
Then, the HAC turn angle
can be derived, and the HAC turn range-to-go
is computed as follows:
3.2. Ground Track Path with S-Turn
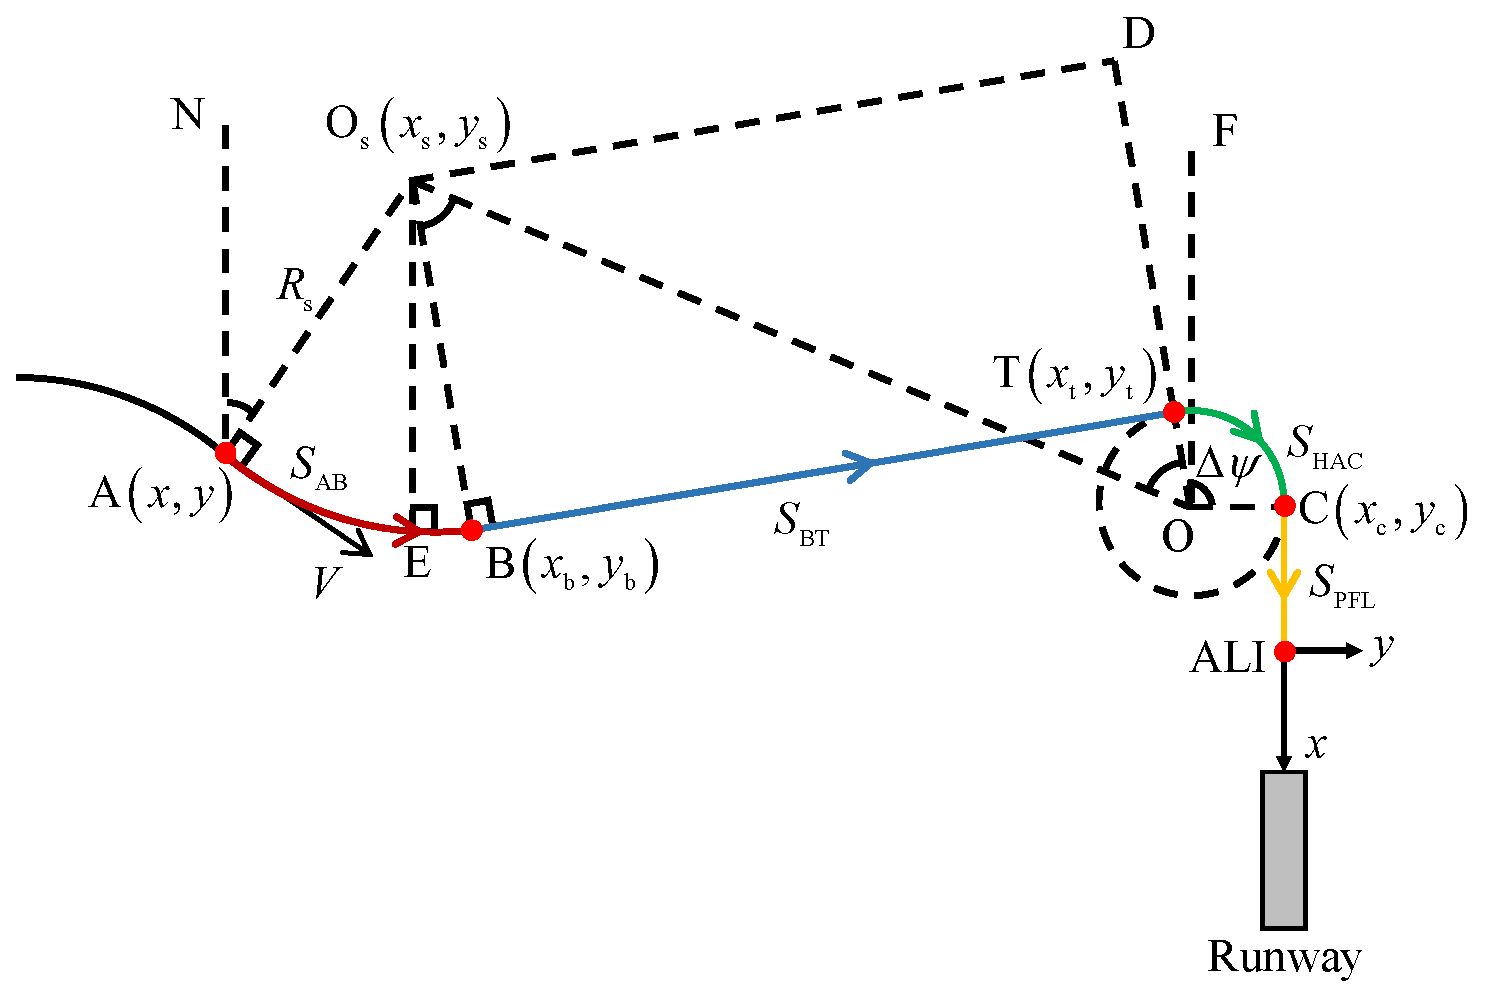
The ground track path with an S-turn is illustrated in
Figure 6, and the total range-to-go
is the sum of four geometric segments:
where
and
are the predicted ground track ranges for the S-turn and acquisition phase, respectively.
During the S-turn phase, the USV keeps a constant bank angle
, producing a circular arc track. To calculate the arc length of the S-turn, one must determine the position of the arc’s center
and the tangency point B. The radius of the S-turn arc is as follows:
An auxiliary line AN is then drawn through point A parallel to the x-axis. Defining
as the angle between line segments
and
, we can obtain the position of
as follows:
According to the geometric relationship of
, the magnitude of
can be achieved as follows:
By drawing line segment
through point O parallel to the x-axis, we can determine the angle
. Afterward,
is obtained as follows:
Therefore, the position of the tangency point
is calculated as follows:
With the obtained position of the circle center
and the tangency point B, we can obtain the arc length of the S-turn
as follows:
By drawing the line segment OF through point O parallel to the x-axis, and given that the magnitudes of
and
are known, we can determine the angle
.
Then, the position of the tangency point
can be achieved as follows:
With tangency points B and T determined, the straight-line flight range
in the acquisition phase can be computed as follows:
The ground track range for the HAC turn is calculated using the same geometric methods used previously.
3.3. Real-Time Range-to-Go Calculation
As shown in the previous two subsections, geometric calculation methods are used to assess the ground track range in each flight subphase. During flight, the real-time range-to-go is calculated by integrating the USV’s current position with the corresponding geometric calculation methods. This computational process is given in Algorithm 1.
Within this algorithm, the status flags represent the current flight subphase of the USV. Specifically, denotes the initiation of the S-turn phase, and denotes the beginning of the acquisition phase. Additionally, corresponds to the start of the HAC turn, and marks the entry into the pre-final landing phase. The ground track path ranges , , , and are computed online using the USV’s present position.
Upon initialization, the integrated range and the status flags ( and ) are set to 0. Then, if the USV begins the S-turn phase, the flag is set to 1, and the range-to-go is computed based on the USV’s current position A and the position of tangency points B and T. The total range-to-go has four parts: , , , and . If , the USV is considered to have reached tangency point B, representing the end of the S-turn phase and the transition into the acquisition phase. The straight-line flight range transitions to the remaining flight range , which is ascertained by the current positions A and the tangency point T.
If the USV directly begins the acquisition phase, then
, and the total range-to-go is the sum of
,
, and
. When
, the USV passes the tangency point T, the heading alignment phase starts, and tangency point T ceases to update simultaneously. At this point, the computation of
begins according to Equation (
38). Correspondingly, the ground track path range
is reduced to zero, and
becomes a constant value.
The range-to-go
is derived by subtracting the integrated range
from the sum of
and
. Similarly, the pre-final landing phase uses the same range-to-go calculation method as the heading alignment phase. Moreover, as the integrated range increases, the range-to-go continuously decreases. Finally, when the USV meets the conditions for entering the
phase, the real-time range-to-go calculation algorithm terminates. It should be noted that
is one of the criteria for entering the
phase.
| Algorithm 1 Real-time calculation of the range-to-go. |
Input: Status flags: , , ,
ground track path ranges: , , , , , integrated range . Output: Range-to-go .
Initialization. , , if then if then else end if else if then else if then else if then end if return |
Remark 1. The integrated range is assessed by integrating the horizontal velocity provided by the navigation system. Let the USV’s velocity in the geographic coordinate system be ; then, the horizontal velocity is given as follows:The integrated range is then computed via the trapezoidal rule:where is the integration time step, and k represents the current computation step. The calculated result of the range-to-go and the ground track path ranges for each flight subphase are shown in
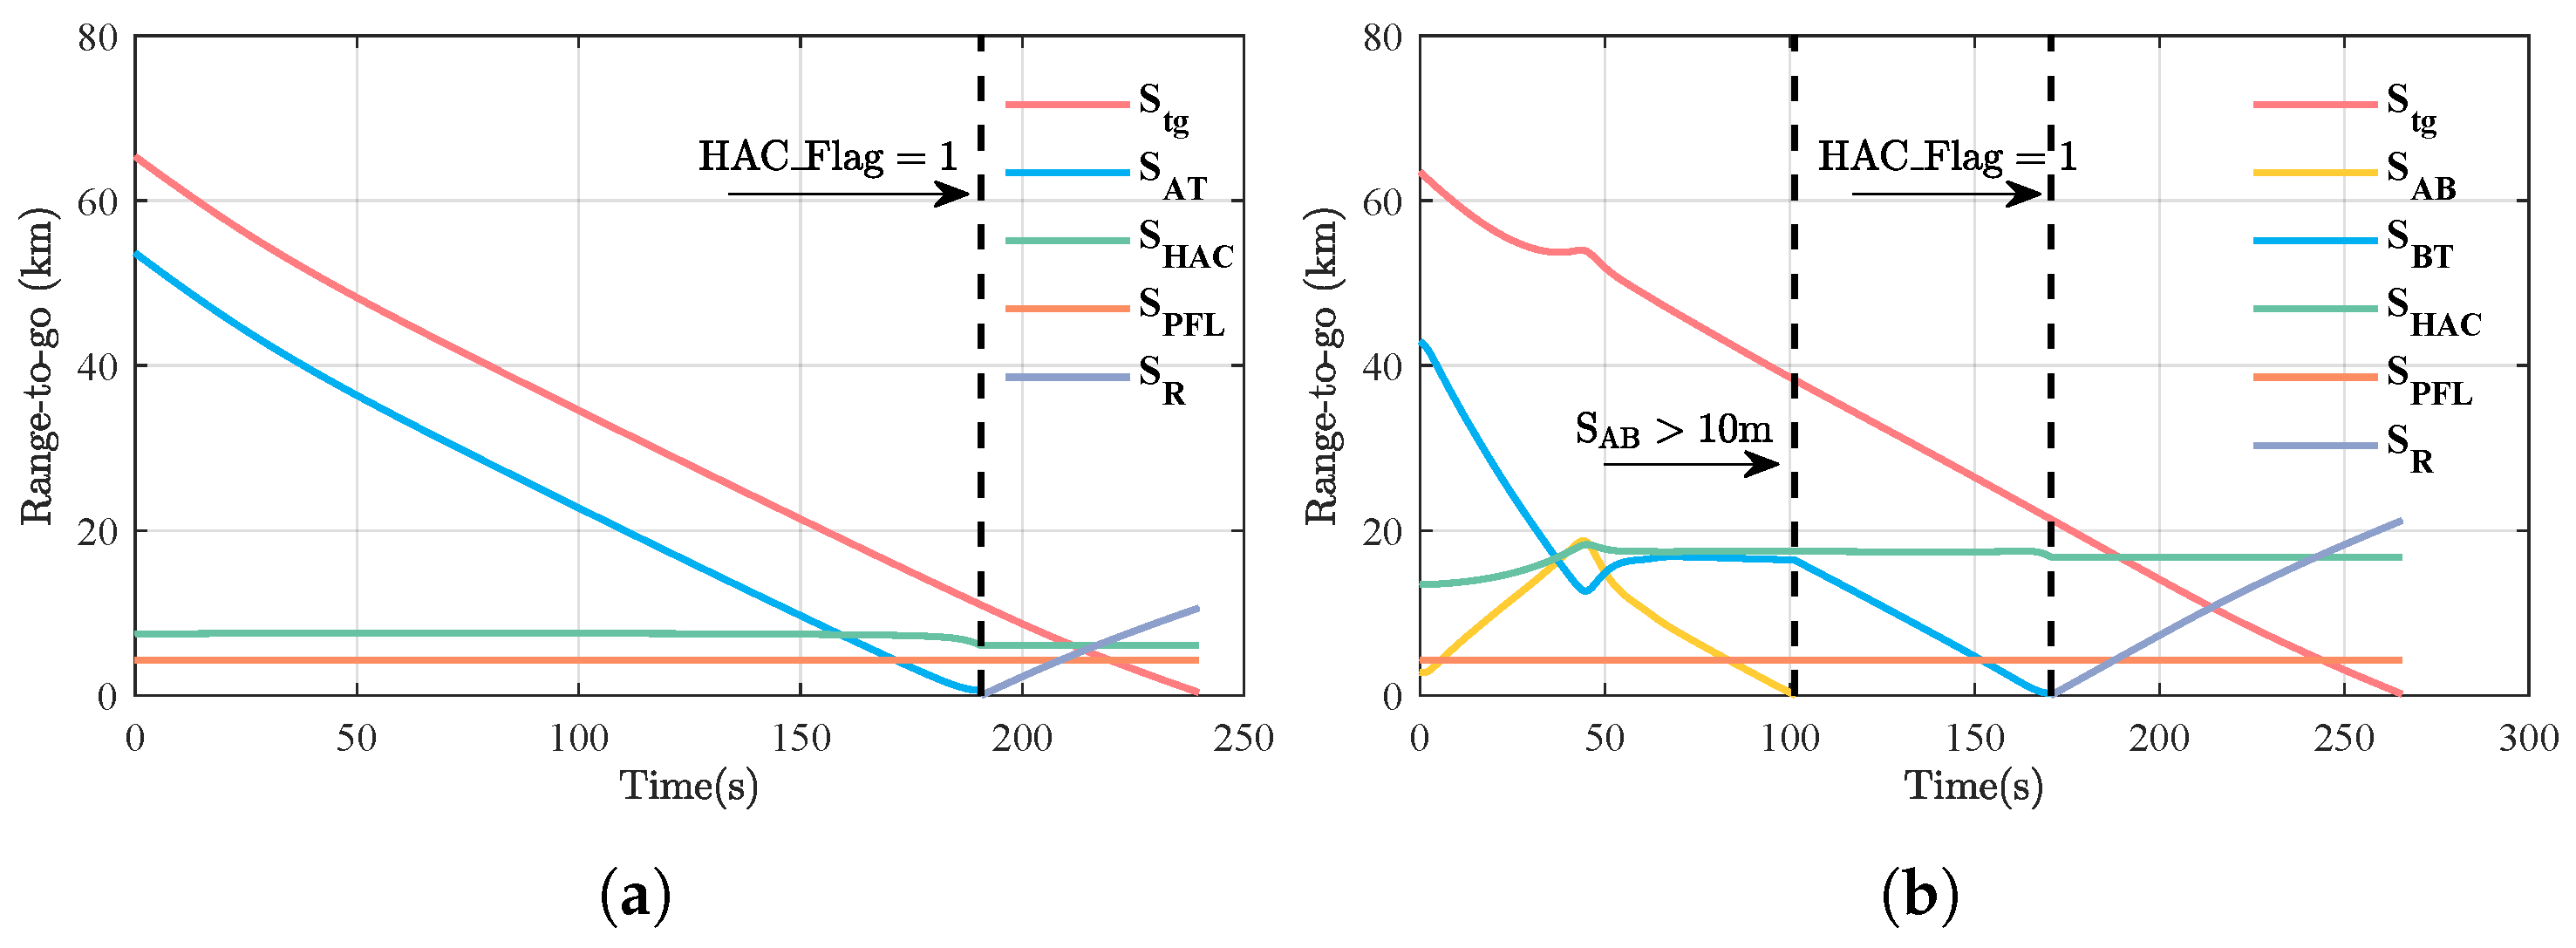
Figure 7. Specifically, the calculation results for
and
are illustrated in
Figure 7a,b. As depicted in
Figure 7a, as
continually decreases,
is simultaneously updated. When
,
approaches zero and
stops updating; then,
starts to increase, while
continues to decrease. It also can be seen in
Figure 7b that the ground track path ranges show similar variations, beyond the additional arc length
introduced by the S-turn. Moreover, the range-to-go increases because of the S-turn maneuver during the first 50 s. The ground track path ranges for each flight subphase are continuously updated in real time based on the changes in the status flags, as illustrated in
Figure 7a,b. This continuous variation in the range-to-go throughout the computational process ensures the continuity of the longitudinal guidance commands.
6. Results and Discussion
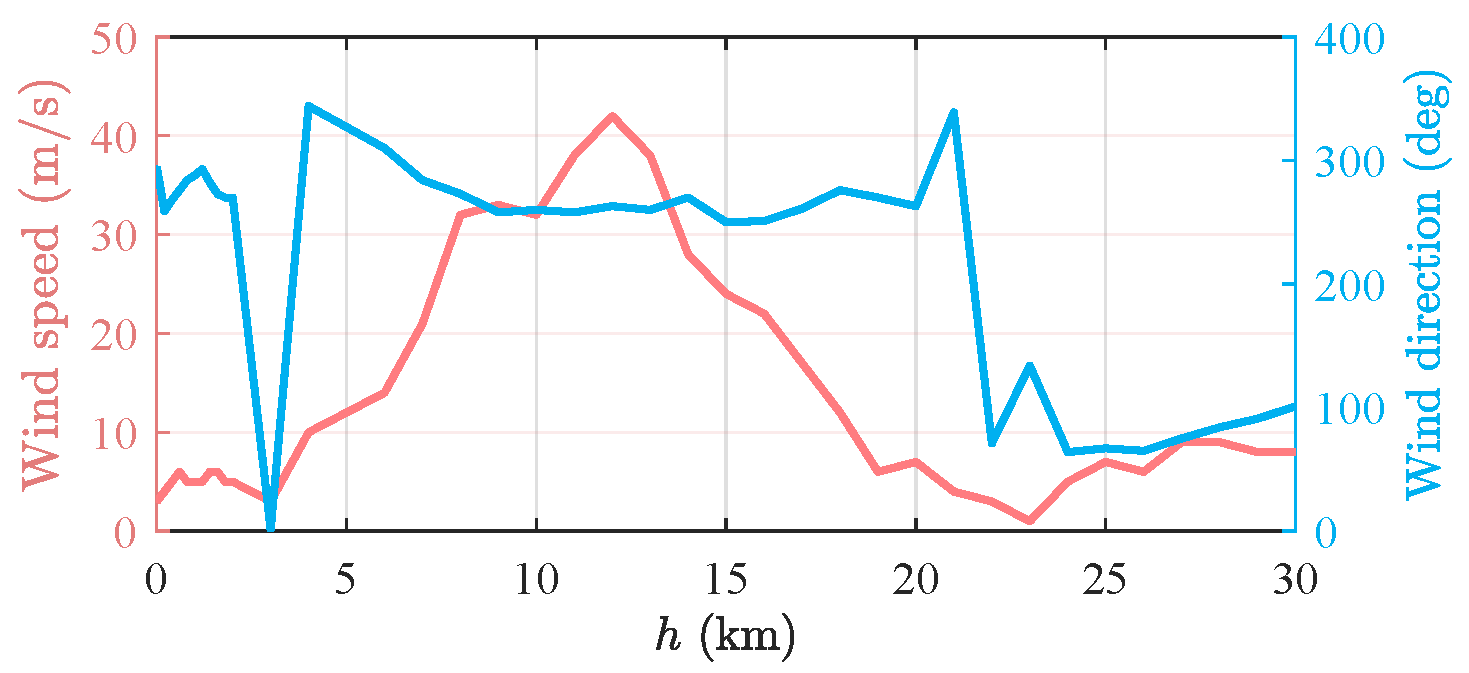
This section presents three simulation cases conducted to assess the performance and adaptability of the TAEM guidance scheme. In the first two cases, we evaluated system performance under different initial energy conditions, while in the third case, we evaluated it under a variety of initial state dispersions and model deviations. In all three cases, we adopted the wind disturbance profile shown in
Figure 8, which was the actual wind profile measured on the test day itself.
6.1. Trials with Initial Low Energy
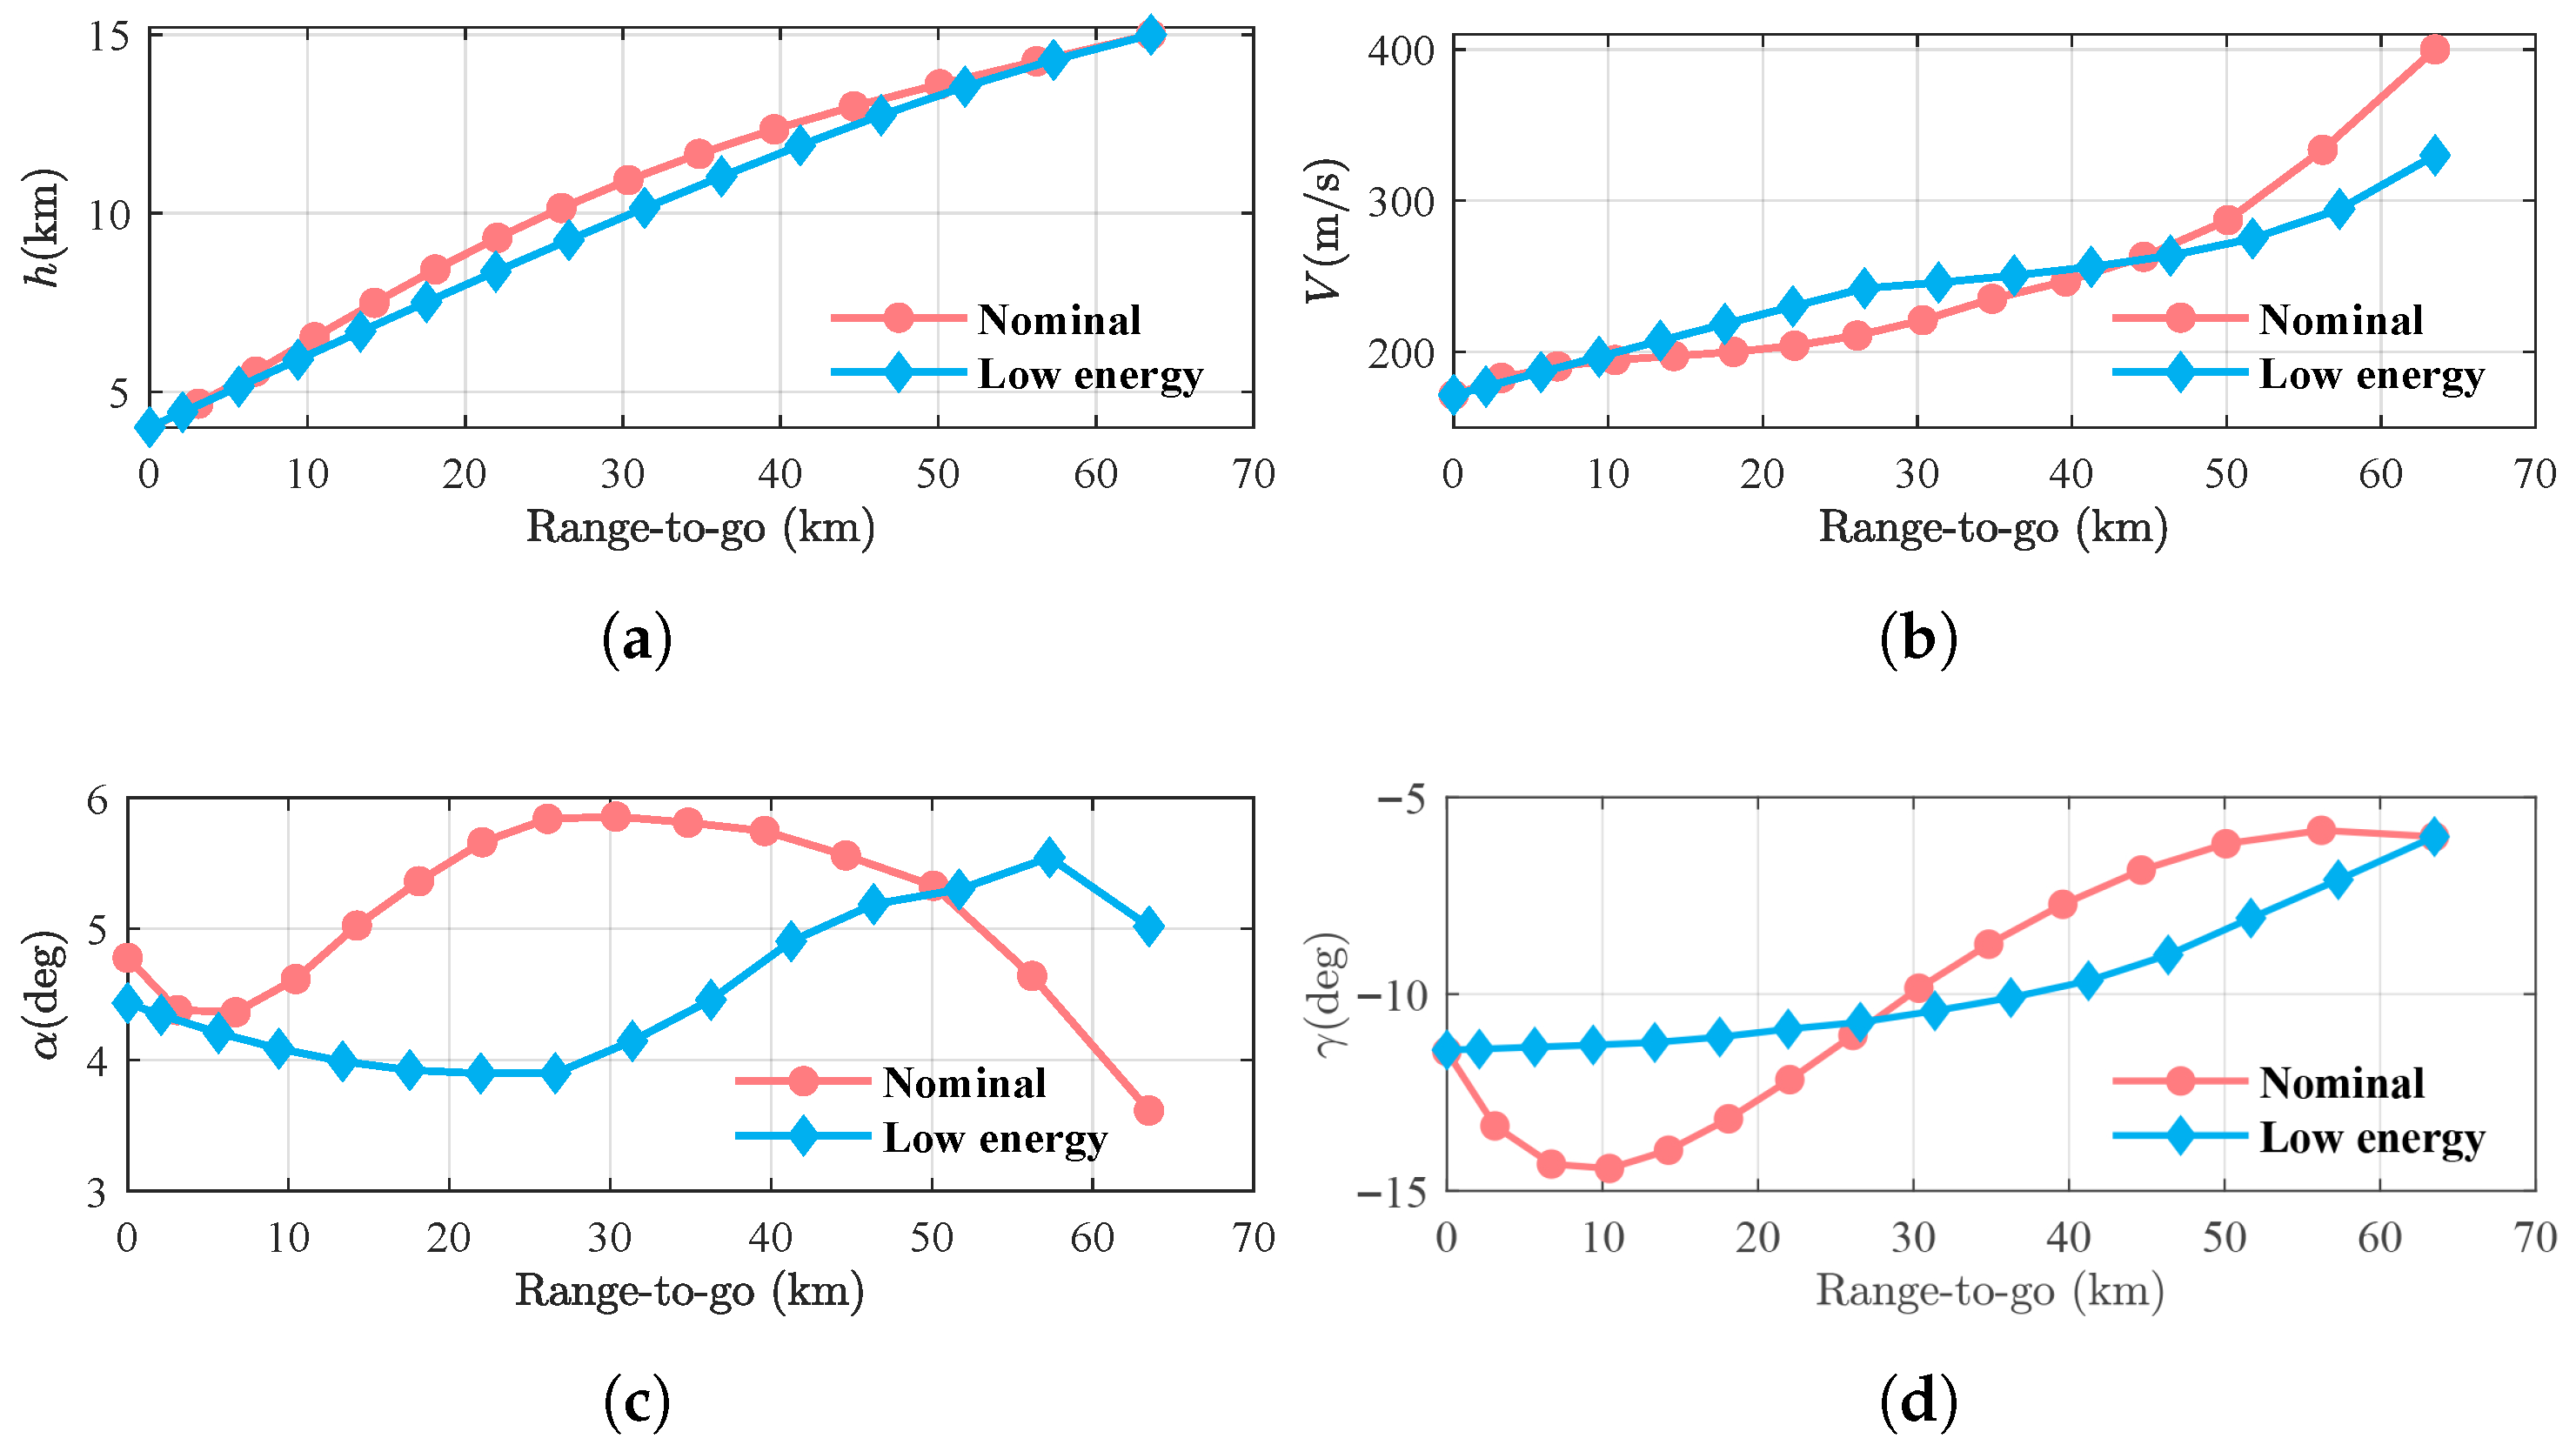
If the USV starts the TAEM phase with an initial energy that diverges significantly from that of the reference trajectory, and considering aerodynamic deviations, the tracking performance is often reduced, leading to an insufficient terminal energy state or a failure to reach the ALI. To evaluate the effectiveness of the low-energy trajectory tracking guidance strategy under such initial conditions and aerodynamic uncertainties, we performed comparative simulations under identical initial conditions while tracking both the nominal and low-energy trajectories illustrated in
Figure 8.
The TAEM phase starts in a low-energy state with
and
. During the simulation process, considering a
deviation in the axial force coefficient
, a
deviation in the normal force coefficient
, and atmospheric dispersion in terms of wind direction and wind speed, the results are based on the data visualized in
Figure 10.
When tracking the low-energy trajectory, the angle of attack remained around
. The altitude tracking error stayed within 100 m, and the final velocity reached 162.1 m/s, as depicted in
Figure 11b and
Figure 12. Conversely, in the simulation of tracking the nominal trajectory with higher initial energy, the angle of attack slowly increases and exceeds
after 192 s, as depicted in
Figure 12a. At high angles of attack, the drag coefficient increases significantly. Attempting to maintain lift by further increasing the angle of attack only exacerbates the drag. This causes the USV to deviate from the reference trajectory. As illustrated in
Figure 11a, the altitude tracking was poor, yielding a maximum error of 600 m and a terminal error of 297 m. The corresponding terminal velocity, shown in
Figure 12b, was only 135.9 m/s and failed to satisfy the terminal constraint. Compared with the simulation of tracking the low-energy trajectory, the terminal velocity differs by 26.2 m/s.
The simulation results above demonstrate that, under conditions of low initial energy, a reduced lift-to-drag ratio, and headwind environment, tracking the low-energy reference trajectory effectively maintains smaller variations in the angle of attack, thereby preserving a sufficient L/D control margin. In contrast, when tracking the nominal trajectory, the guidance system commands an increase in the angle of attack to maintain the reference altitude profile. This, however, leads to a significant rise in drag, which further exacerbates energy dissipation and ultimately results in a failure to meet the terminal velocity constraints. This indicates that, under low-energy conditions, selecting a reference trajectory with a greater control margin is key to enhancing the robustness of the system.
6.2. Trials with Initial High Energy
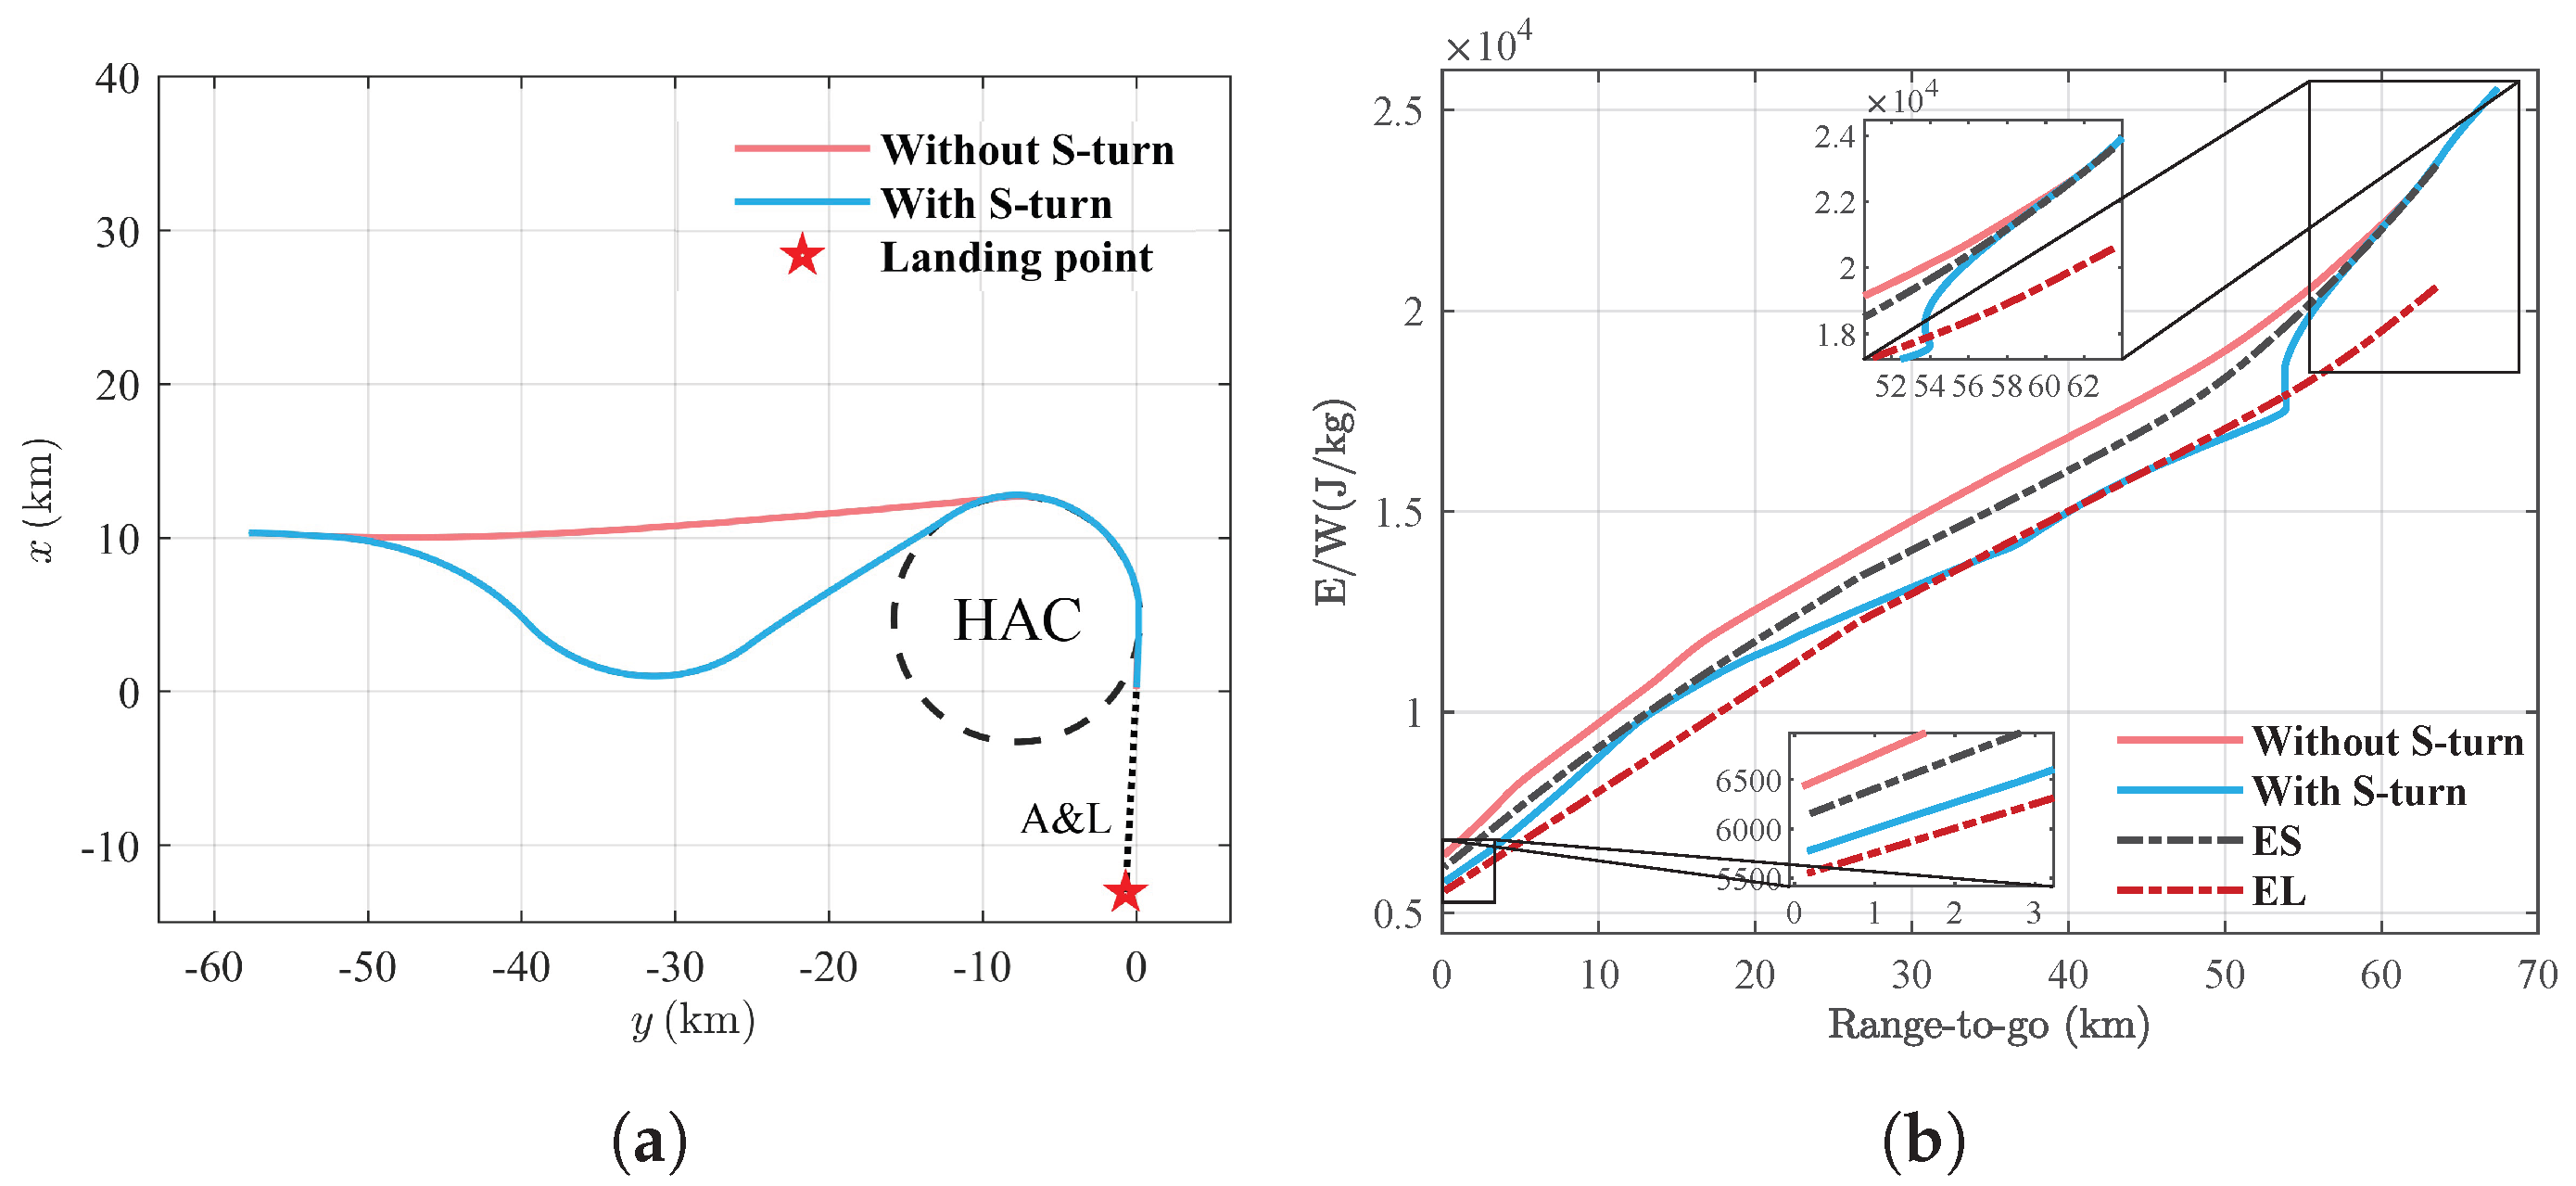
If the USV begins the TAEM phase with high energy, it initiates an S-turn maneuver to dissipate energy by extending the flight range. Thus, we performed simulations with and without the S-turn under the same initial high-energy condition to compare the terminal energy states and validate the effectiveness of the S-turn strategy.
The TAEM phase starts in a high-energy state with
and
. During the simulation process, considering a
deviation in the axial force coefficient
, there is a
deviation in the normal force coefficient
, with the wind direction and wind speed referenced from the data shown in
Figure 10.
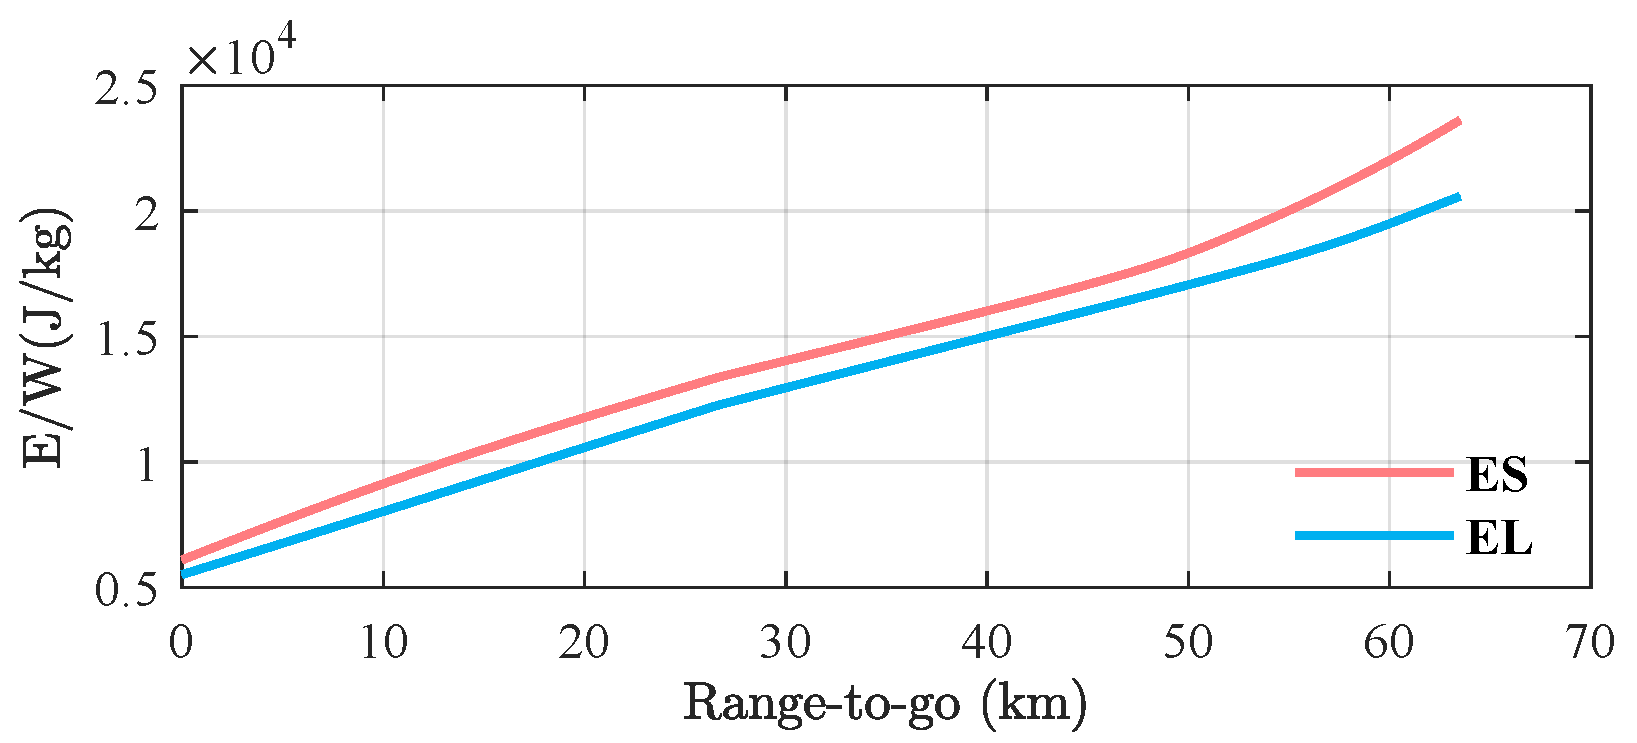
The variation in energy height with respect to the range-to-go is illustrated in
Figure 13b. The USV’s energy surpasses the upper energy boundary (ES) at the initial moment, thereby entering the S-turn phase. In contrast, in the comparison simulation, the USV directly enters the acquisition phase without an S-turn maneuver, as shown by the ground tracks in
Figure 13a. As observed in
Figure 14, the terminal velocities for the two simulations are 186.5 m/s and 218.4 m/s, with corresponding flight ranges of 72.8 km and 67.4 km, respectively. By employing the S-turn maneuver, the flight range is increased by 5.4 km, and the terminal velocity is reduced by 31.9 m/s. Furthermore, as shown in
Figure 13b, in the simulation with the S-turn maneuver, the terminal energy state declines within the energy corridor. However, without the S-turn, the terminal energy state lies outside the energy corridor. The above results demonstrate that the S-turn guidance strategy effectively dissipates energy by extending the flight range, thereby adjusting the USV’s energy state within the energy corridor.
The bank-angle profiles in
Figure 15b evidence that the USV makes an S-turn with a bank angle of
until the energy decreases below the lower energy boundary (EL); at this point, the bank angle gradually reverses to
. Once the heading has become tangential to the HAC, the bank angle gradually returns to zero, and the USV continues flying along a linear flight segment toward the HAC tangency point. Upon reaching this point, the USV banks to commence the HAC maneuver, eventually reaching the pre-final landing phase. The angle-of-attack-curve in
Figure 15a varies between
and
, remaining within the acceptable limits of the USV. Noticeable variations in the angle of attack primarily result from corresponding changes in the bank angle.
By extending the flight range, the S-turn strategy successfully dissipates the surplus energy, which is critical for meeting the terminal state constraints. As a result, the terminal energy is corrected to lie within the energy corridor, enabling the vehicle to achieve both the target altitude and a safe terminal velocity of 186.5 m/s. Furthermore, although the angle of attack exhibits variations during the maneuver, its magnitude remains within a manageable range. This demonstrates that the system maintains effective control stability throughout the energy-management maneuver.
6.3. Trials with Initial State Dispersions and Model Deviations
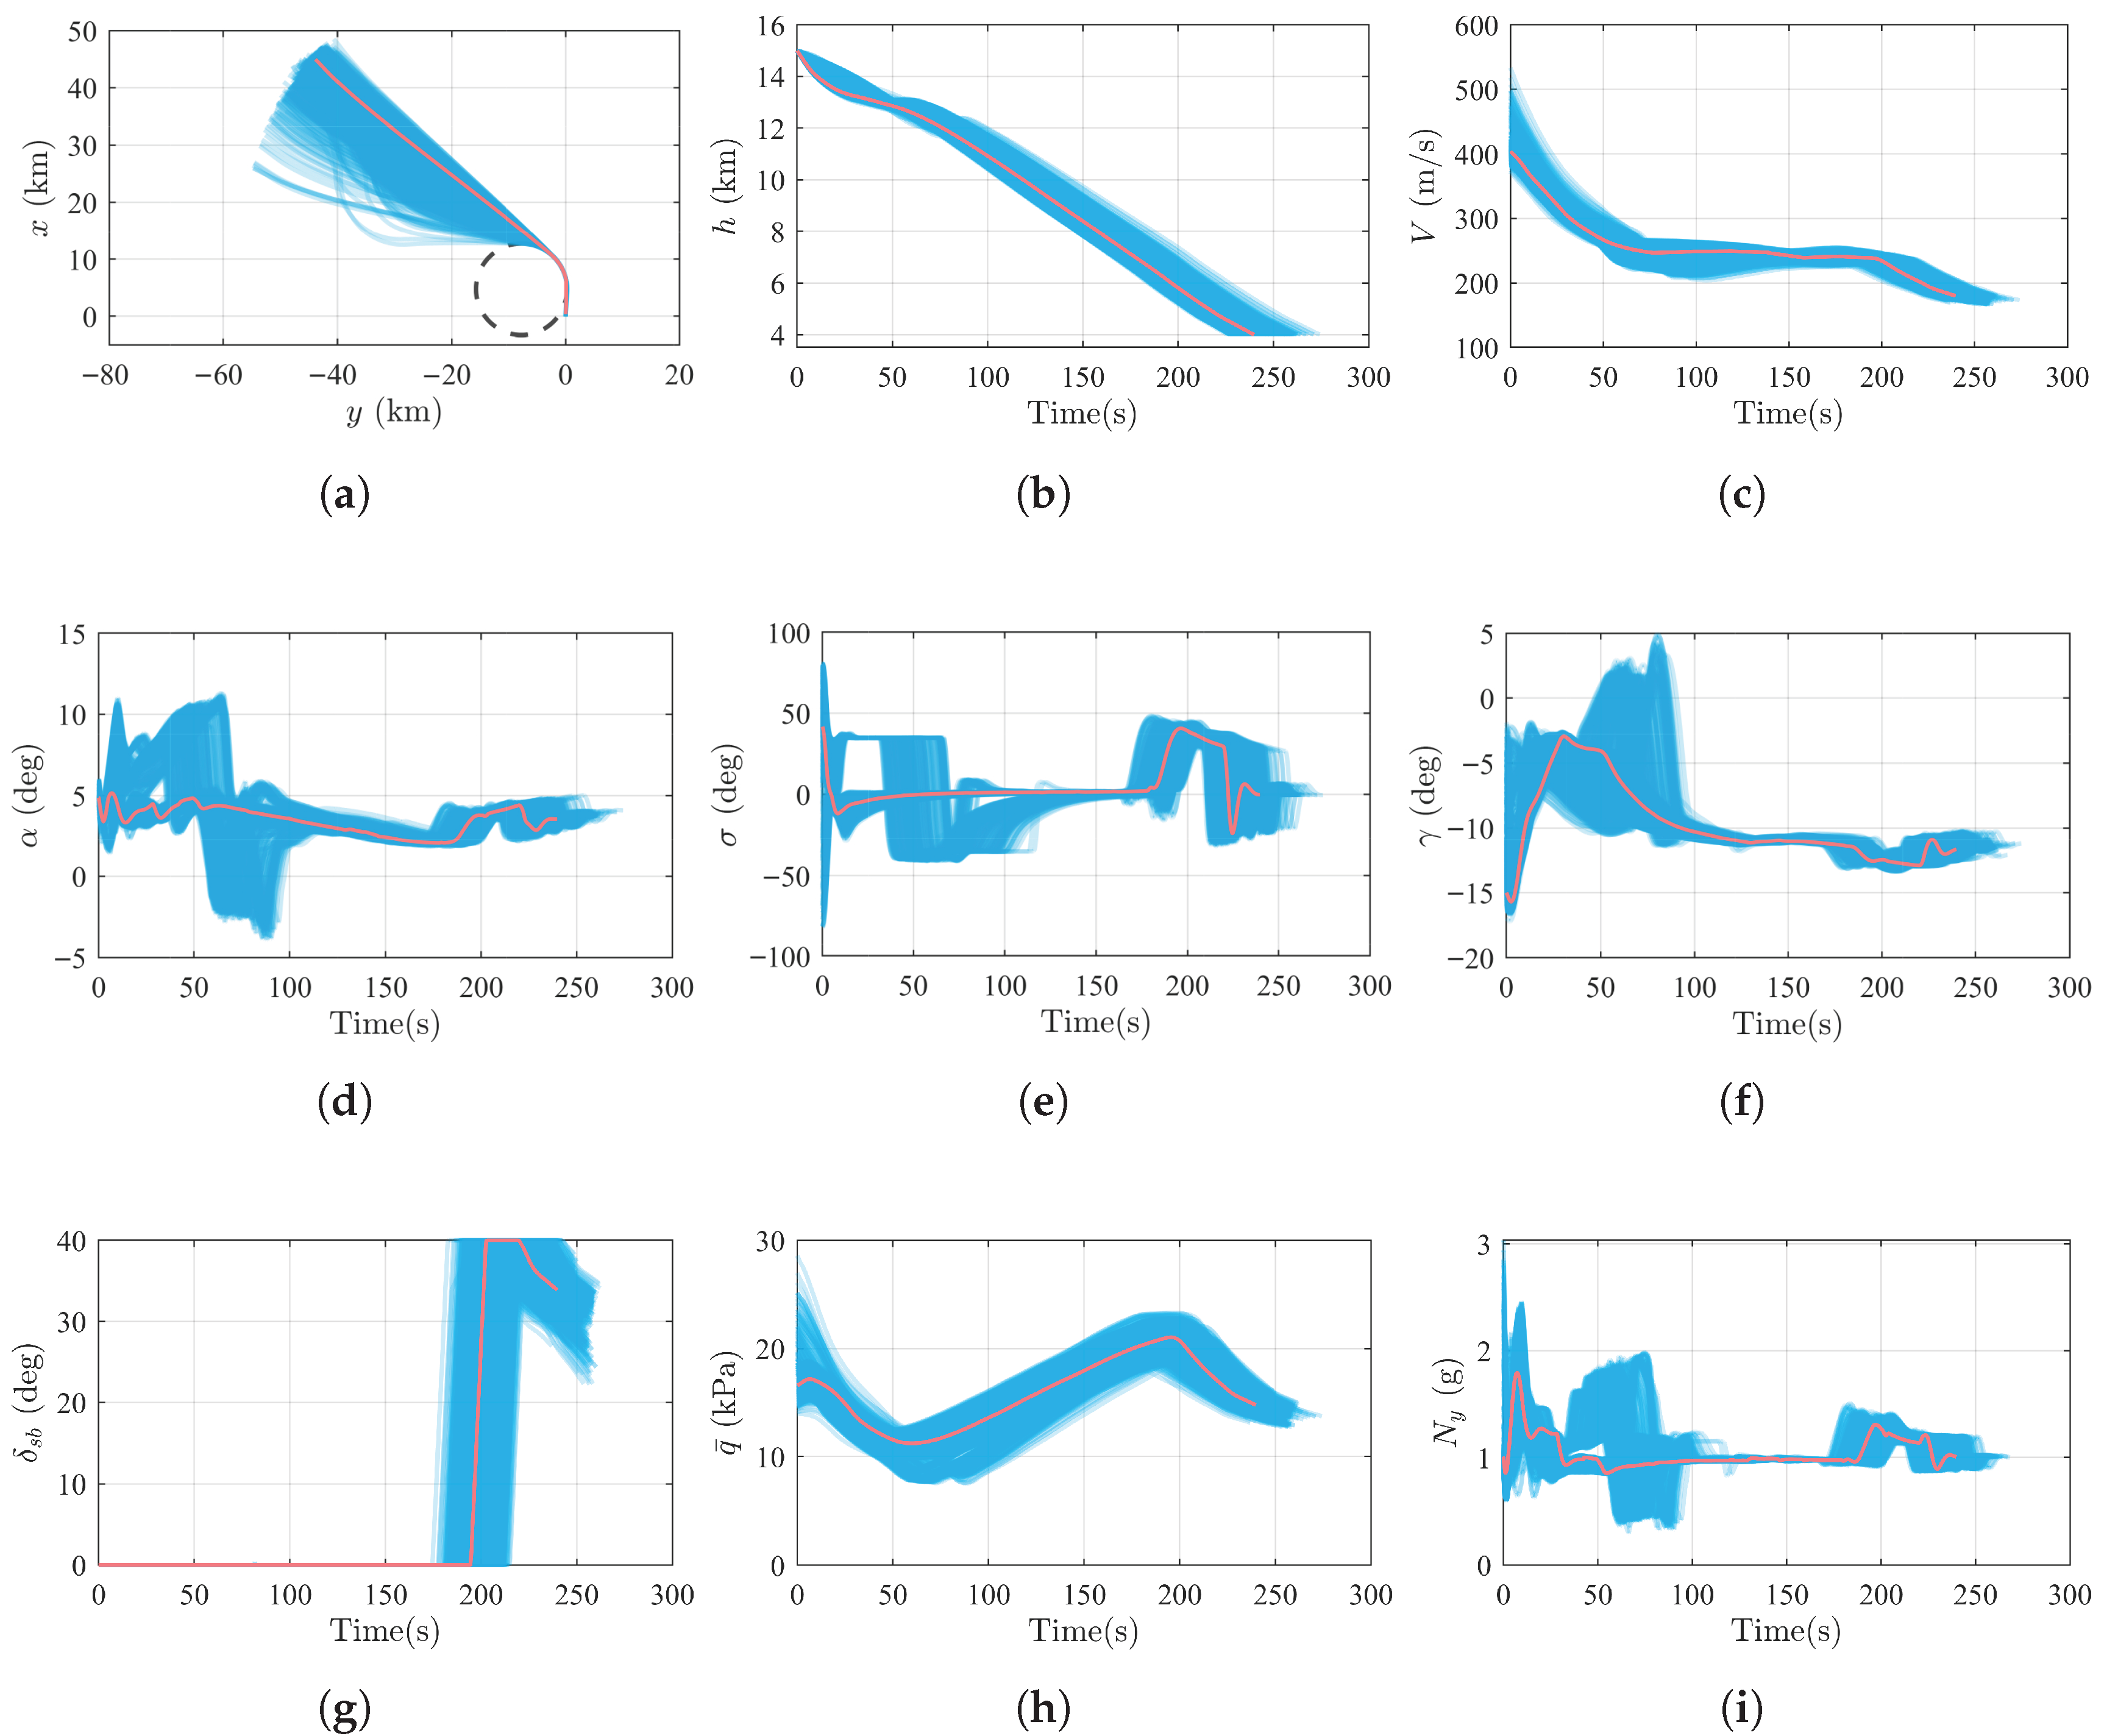
Next, we conducted a 3000-run Monte Carlo simulation with dispersions in initial states, aerodynamic coefficients, atmospheric density, and vehicle mass, all following Gaussian distributions as given in
Table 4. The wind disturbance was also considered, with the wind speed and direction referencing those in
Figure 10.
The time-history curves of several important states in the Monte Carlo simulation tests are shown in
Figure 16. The red curves represent the nominal simulation results, while the blue curves represent the Monte Carlo simulation results. From the ground track paths shown in
Figure 16a, it can be observed that the USV begins the TAEM phase from distinct initial positions and heading angles, and that all end at the designated terminal location after the HAC turn. The altitude and velocity variations are depicted in
Figure 16b,c. The time histories of the angle of attack, bank angle, and flight-path angle are presented in
Figure 16d–f, with all parameters staying within a reasonable range. From
Figure 16g, the speedbrake is activated when
to adjust the USV’s velocity. As shown in
Figure 16h,i, the dynamic pressure together with the load factor adheres to the prescribed structural constraints, with the dynamic pressure being at most
and the normal load factor being below
.
The terminal guidance performance is shown in
Figure 17, and
Table 5 summarizes the statistical results of the terminal states for the Monte Carlo simulation. The terminal deviations in down-track and cross-track positions are within
and
, respectively, as illustrated in
Figure 17a. The terminal heading angle errors are shown in
Figure 17b, with values ranging from
to
. As shown in
Figure 17c, the terminal velocities range from
to
, with the terminal flight-path angle varying between
and
.
The results show that all simulation cases satisfy the predefined terminal and structural constraints, thereby verifying the robustness and reliability of the proposed guidance system under initial state dispersions, aerodynamic deviations, and atmospheric uncertainties. In particular, the distributions of the terminal position and heading errors indicate strong convergence capability of the proposed guidance law, while the variations in velocity and flight-path angle confirm the stable longitudinal performance achieved by the online ground track predictor.
To further validate the effectiveness of the proposed guidance system, we compared its performance with that of the method reported in [
18] under identical dispersion settings. With an additional
initial velocity perturbation, a Monte Carlo simulation with 1000 runs was carried out again. Based on the results in
Table 6, it is clear that both the velocity and energy errors at the terminal point are significantly reduced. The velocity error range falls from [−14.21, 12.10] m/s to [−7.47, 2.86] m/s, while the energy error span narrows from [−223.57, 174.10] J/kg to [−127.80, 50.44] J/kg. Additionally, the standard deviations decrease by
and
, indicating a more concentrated distribution. These results indicate that the proposed guidance scheme achieves improved terminal energy precision.
7. Flight Test Results
Beyond the simulations completed in the
Section 6, a flight test was conducted in July 2024 to validate the proposed guidance system. The proposed online ground track predictor ensured that the computed range-to-go varied continuously throughout the flight. Correspondingly, as shown in
Figure 18, both the desired altitude and angle-of-attack guidance commands maintain continuity, achieving favorable tracking performance.
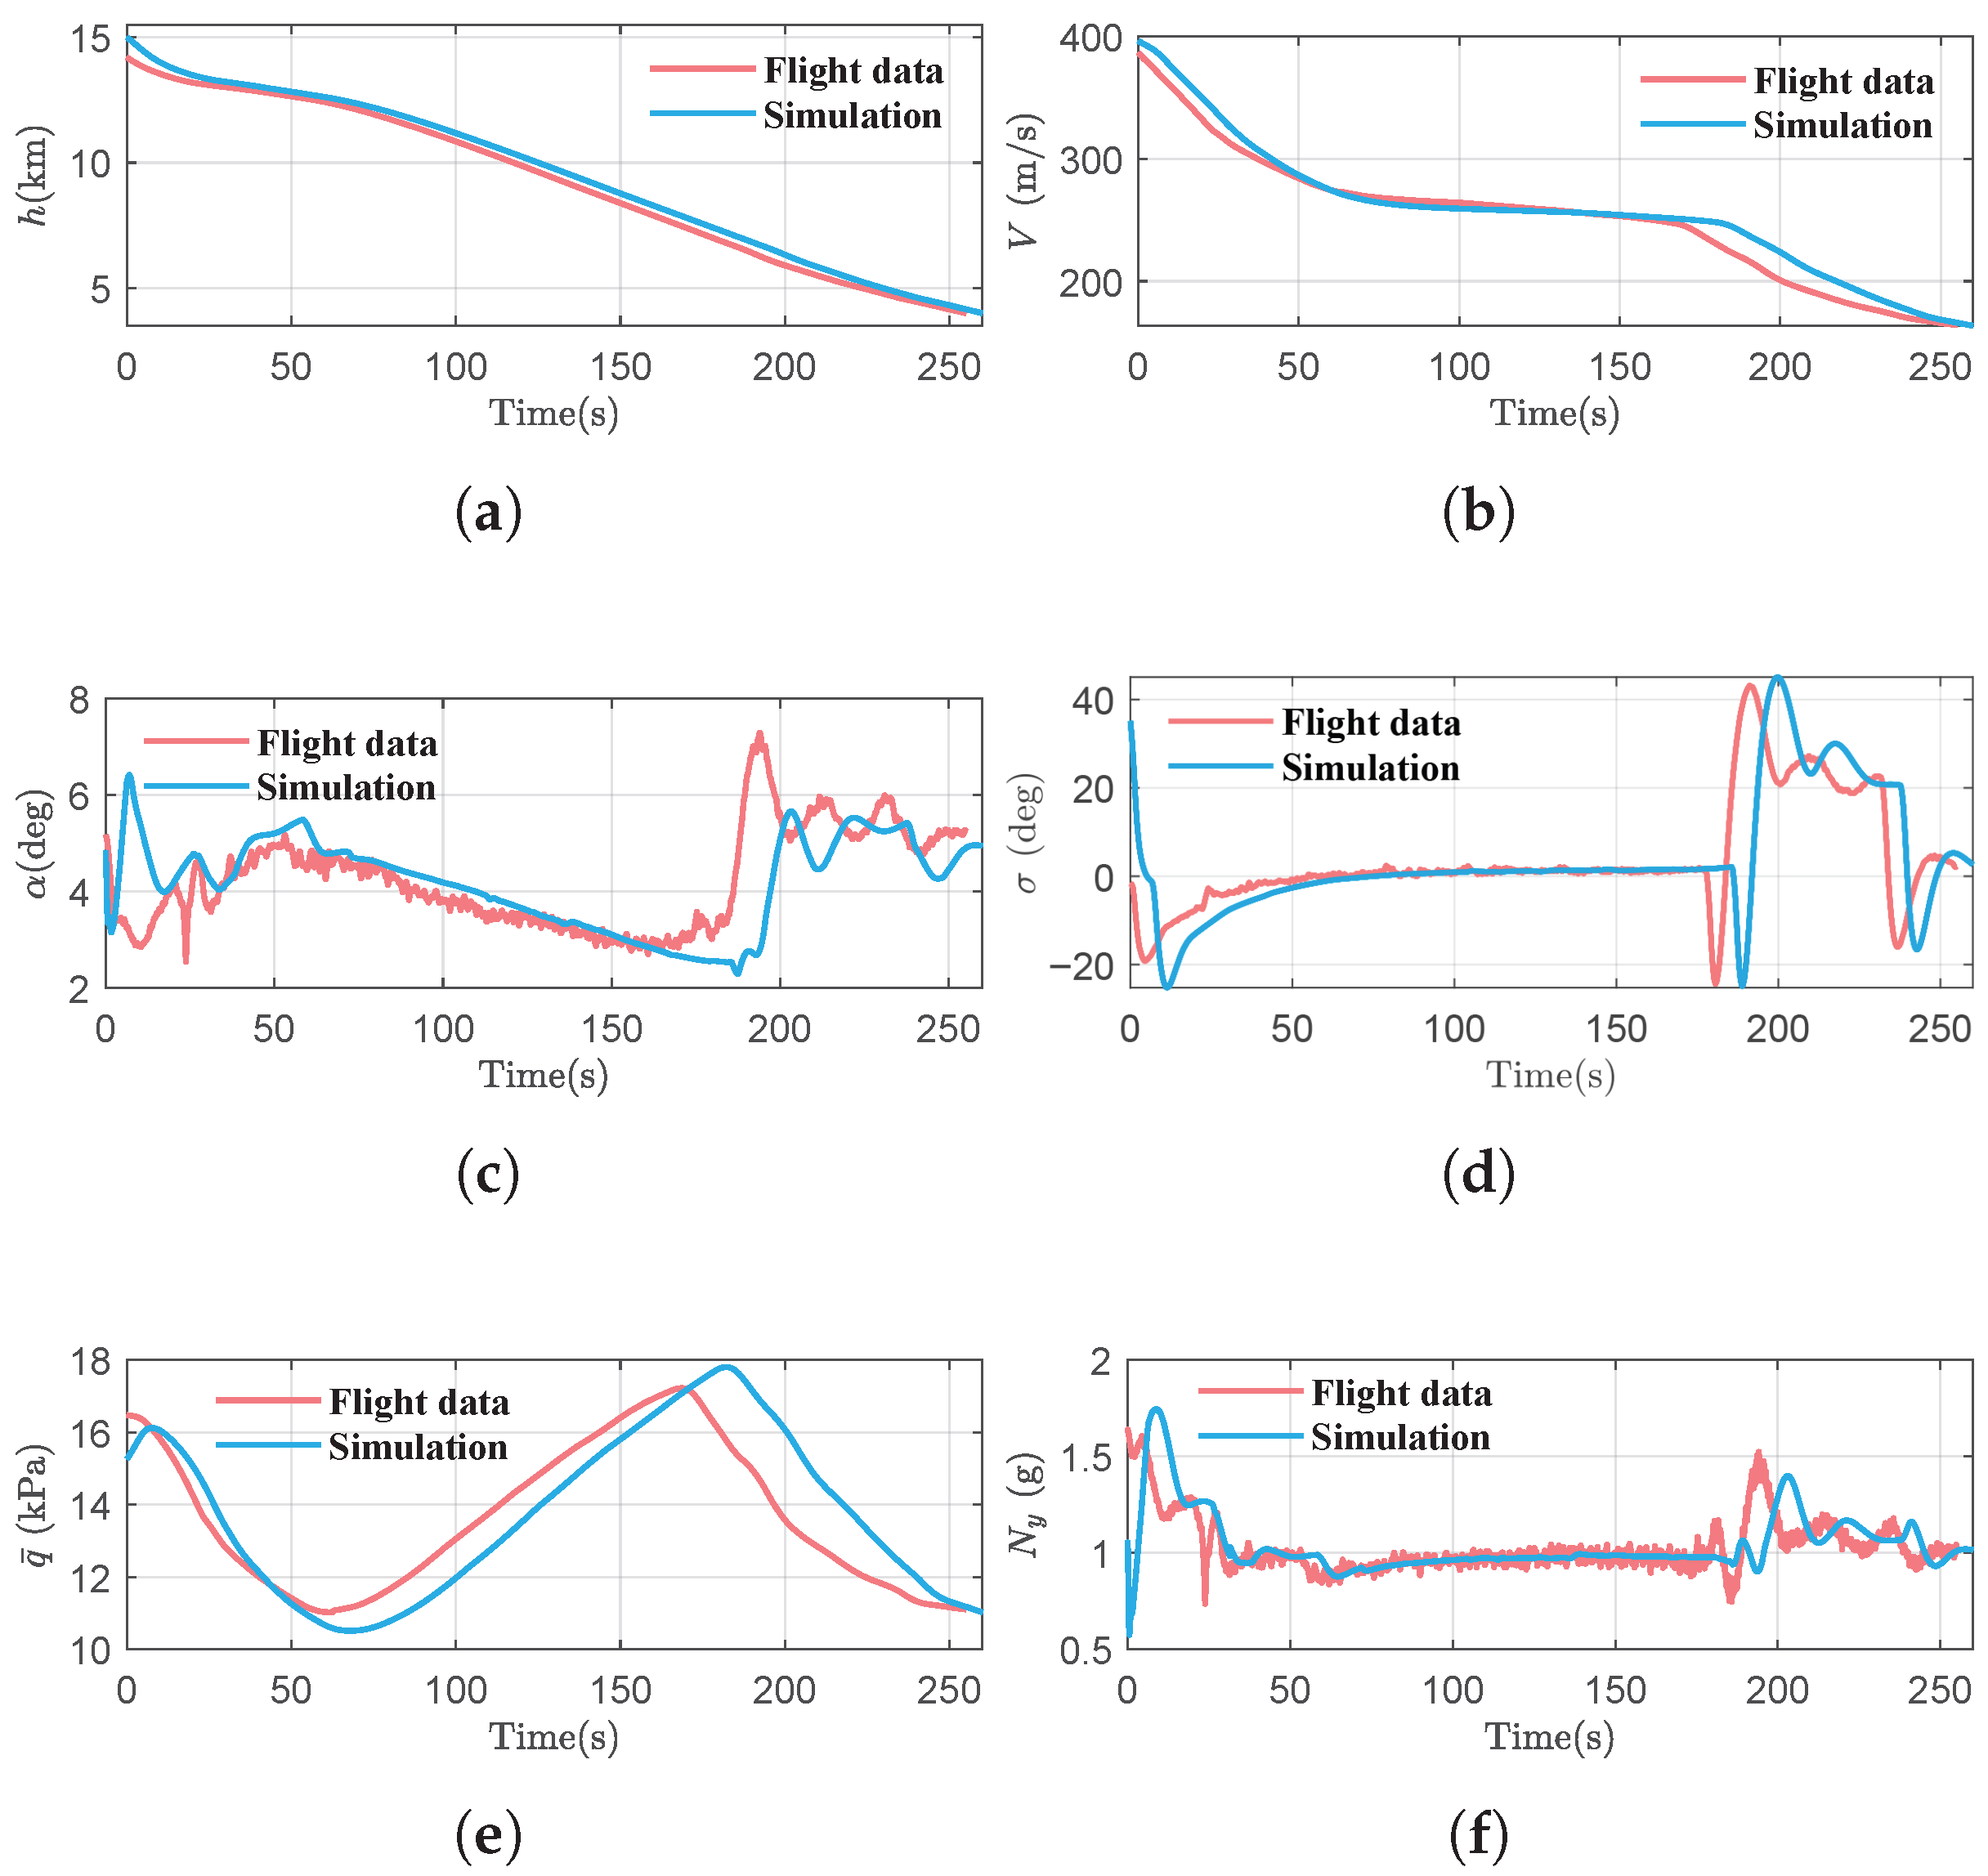
After the flight test, a simulation reconstruction was conducted. The flight data and simulation outcomes are provided in
Figure 19. From the comparison, it is clear that the measured flight data and the simulation outcomes exhibit overall consistency. Based on the deviation settings in the simulation, it is estimated that, during the supersonic flight phase, the axial force deviation is approximately
, and the normal force deviation is
. In the subsonic phase, the axial force deviation rises to about
. Throughout the entire flight, the atmospheric density deviation is estimated to be around
.
As shown in
Figure 19a,b, the USV starts with
and
, and ends at
and
.
Figure 19d shows the bank angle gradually returning to zero, confirming a direct flight path to the HAC tangency point without an S-turn. Meanwhile,
Figure 19c demonstrates that the angle-of-attack profile remained within a reasonable range.
As shown in
Figure 19e,f, during the flight test, the maximum dynamic pressure reaches
, and the maximum normal load factor is
, with both remaining within safe limits. As depicted in
Figure 20, the down-track and cross-track positions at the terminal point are 52 and 1.9 m, respectively, and the heading angle error is
.
As evidenced above, the flight test results are in good agreement with the simulation reconstruction: the trends of state parameters were consistent, and all terminal constraints were satisfied. This consistency demonstrates that the system’s performance is not coincidental but is representative of its stability and effectiveness within the simulated conditions. Although based on a single test, this outcome provides effective validation of the proposed guidance system and serves as final validation of our extensive pre-flight simulation work.
8. Conclusions
This paper has proposed a TAEM guidance scheme to meet the reliability and safety requirements for USV flight tests. The proposed system employs the GTP to achieve continuous range-to-go prediction, effectively eliminating discontinuities at subphase transitions and thereby enhancing longitudinal tracking stability. Longitudinal reference trajectories are generated offline using the pseudospectral method, considering boundary conditions and path constraints. During flight, the online GTP calculates the real-time range-to-go along the predefined ground track path, which is then used to interpolate longitudinal guidance commands from the reference trajectory via a lookup table. For lateral control, the guidance law is specifically designed according to the characteristics of different subphases to track the desired ground track.
Extensive Monte Carlo simulations that incorporate initial state dispersions, model deviations, and wind disturbances verify the system’s robustness and guidance accuracy. The results show that all terminal states consistently satisfy the predefined constraints with high precision. Furthermore, the successful flight test conducted in July 2024 validates the feasibility and effectiveness of the proposed guidance system under real-world conditions, establishing its suitability for onboard applications. However, to further improve robustness and tolerance to larger dispersions, future work could explore more advanced guidance algorithms, such as an onboard trajectory planner capable of real-time reference trajectory adjustment based on the vehicle’s current state, thereby reducing reliance on pre-computed profiles.
