Article

Towards Efficient Object Detection in Large-Scale UAV Aerial Imagery via Multi-Task Classification

1
School of Computer Science and Information Engineering, Hefei University of Technology, Hefei 230601, China
2
CETC Key Laboratory of Aerospace Information Applications, Shijiazhuang 050081, China
3
School of Electrical and Information Engineering, Tianjin University, Tianjin 300072, China
*
Author to whom correspondence should be addressed.
Drones 2025, 9(1), 29; https://doi.org/10.3390/drones9010029
Submission received: 24 November 2024 / Revised: 1 January 2025 / Accepted: 3 January 2025 / Published: 5 January 2025

Abstract

:
Achieving rapid and effective object detection in large-scale unmanned aerial vehicle (UAV) images presents a challenge. Existing methods typically split the original large UAV image into overlapping patches and perform object detection on each image patch. However, the extensive object-free background areas in large-scale aerial imagery reduce detection efficiency. To address this issue, we propose an efficient object detection approach for large-scale UAV aerial imagery via multi-task classification. Specifically, we develop a lightweight multi-task classification (MTC) network to efficiently identify background areas. Our method leverages bounding box label information to construct a salient region generation branch. Then, to improve the training process of the classification network, we design a multi-task loss function to optimize the parameters of the multi-branch network. Furthermore, we introduce an optimal classification threshold strategy to balance detection speed and accuracy. Our proposed MTC network can rapidly and accurately determine whether an aerial image patch contains objects, and it can be seamlessly integrated with existing detectors without the need for retraining. We conduct experiments on three datasets to verify the effectiveness and efficiency of our classification-driven detection method, including the DOTA v1.0, DOTA v2.0, and ASDD datasets. In the large-scale UAV images and ASDD dataset, our proposed method increases the detection speed by more than 30% and 130%, respectively, while maintaining good object detection performance.

1. Introduction

Optical aerial image object detection involves locating and classifying typical ground objects, such as vehicles, airplanes, and ships, providing important references for decision making in areas like smart cities [1,2] and maritime monitoring [3]. With the increasing number of unmanned aerial vehicles (UAVs) and improvements in image quality, the volume of acquired aerial image data has been growing exponentially. It holds practical value to leverage computer vision technologies to search, detect, and identify various typical objects.
Driven by massive datasets, deep convolutional neural networks (DCNNs) have been widely applied to aerial object detection [4,5]. The utilization of large images as input for training deep models requires substantial memory and GPU resources, increasing training time and reducing efficiency [
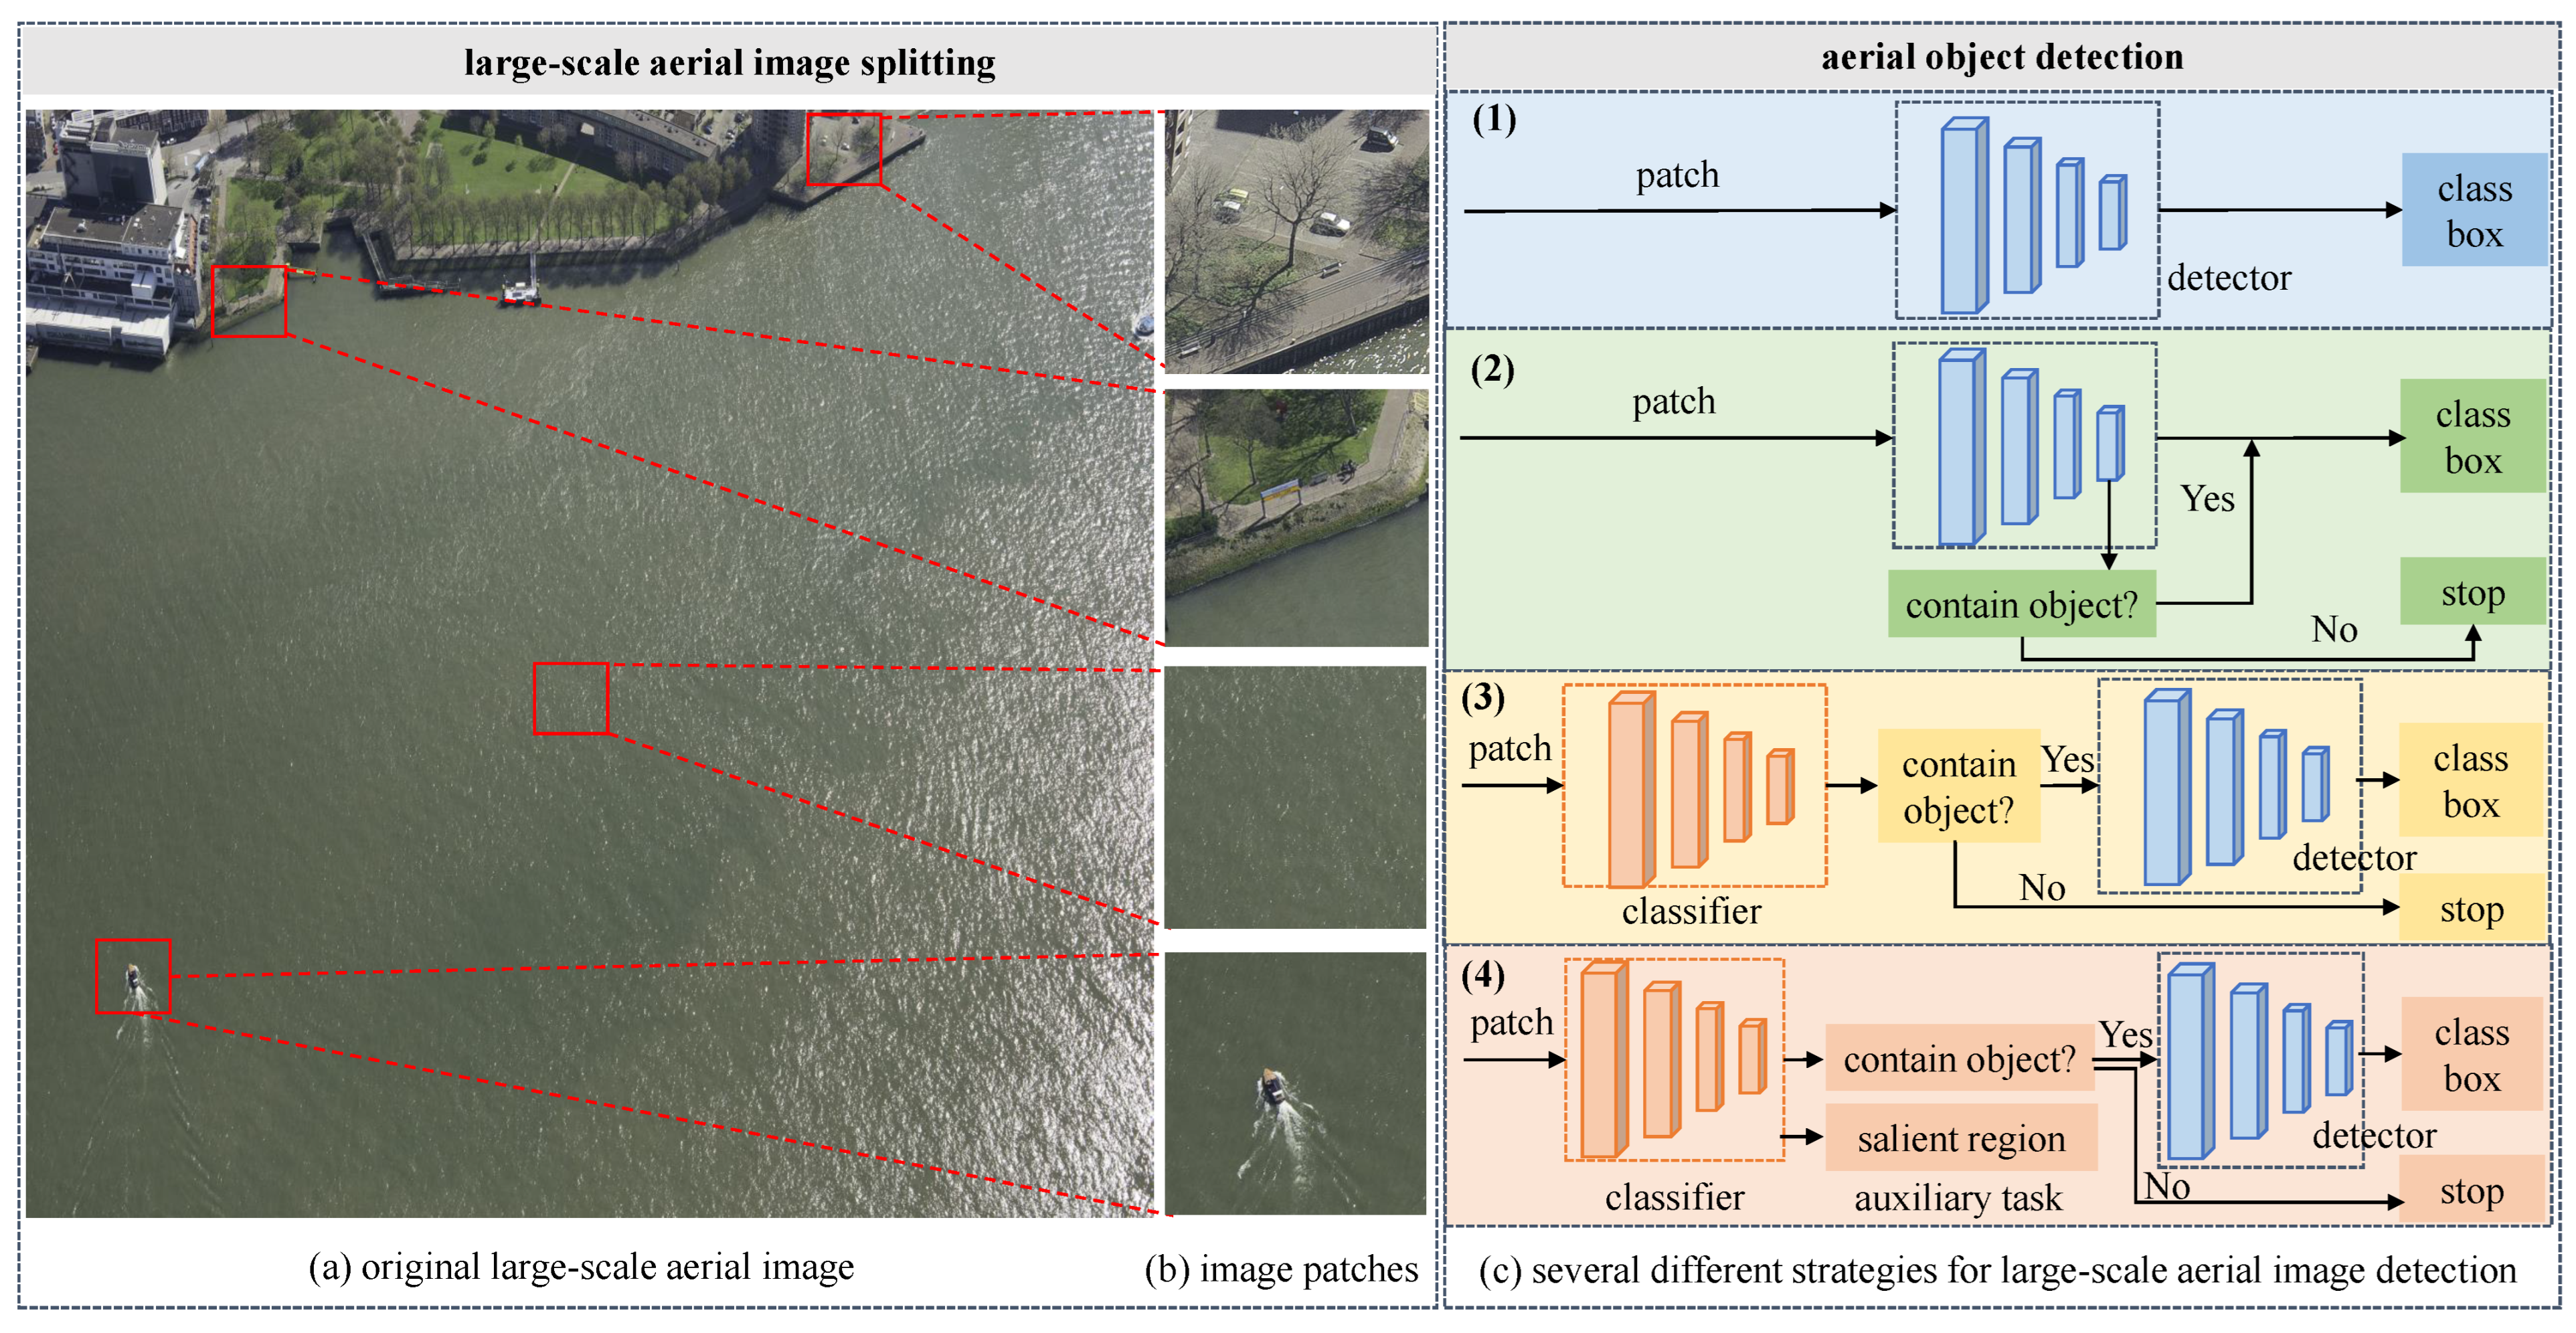
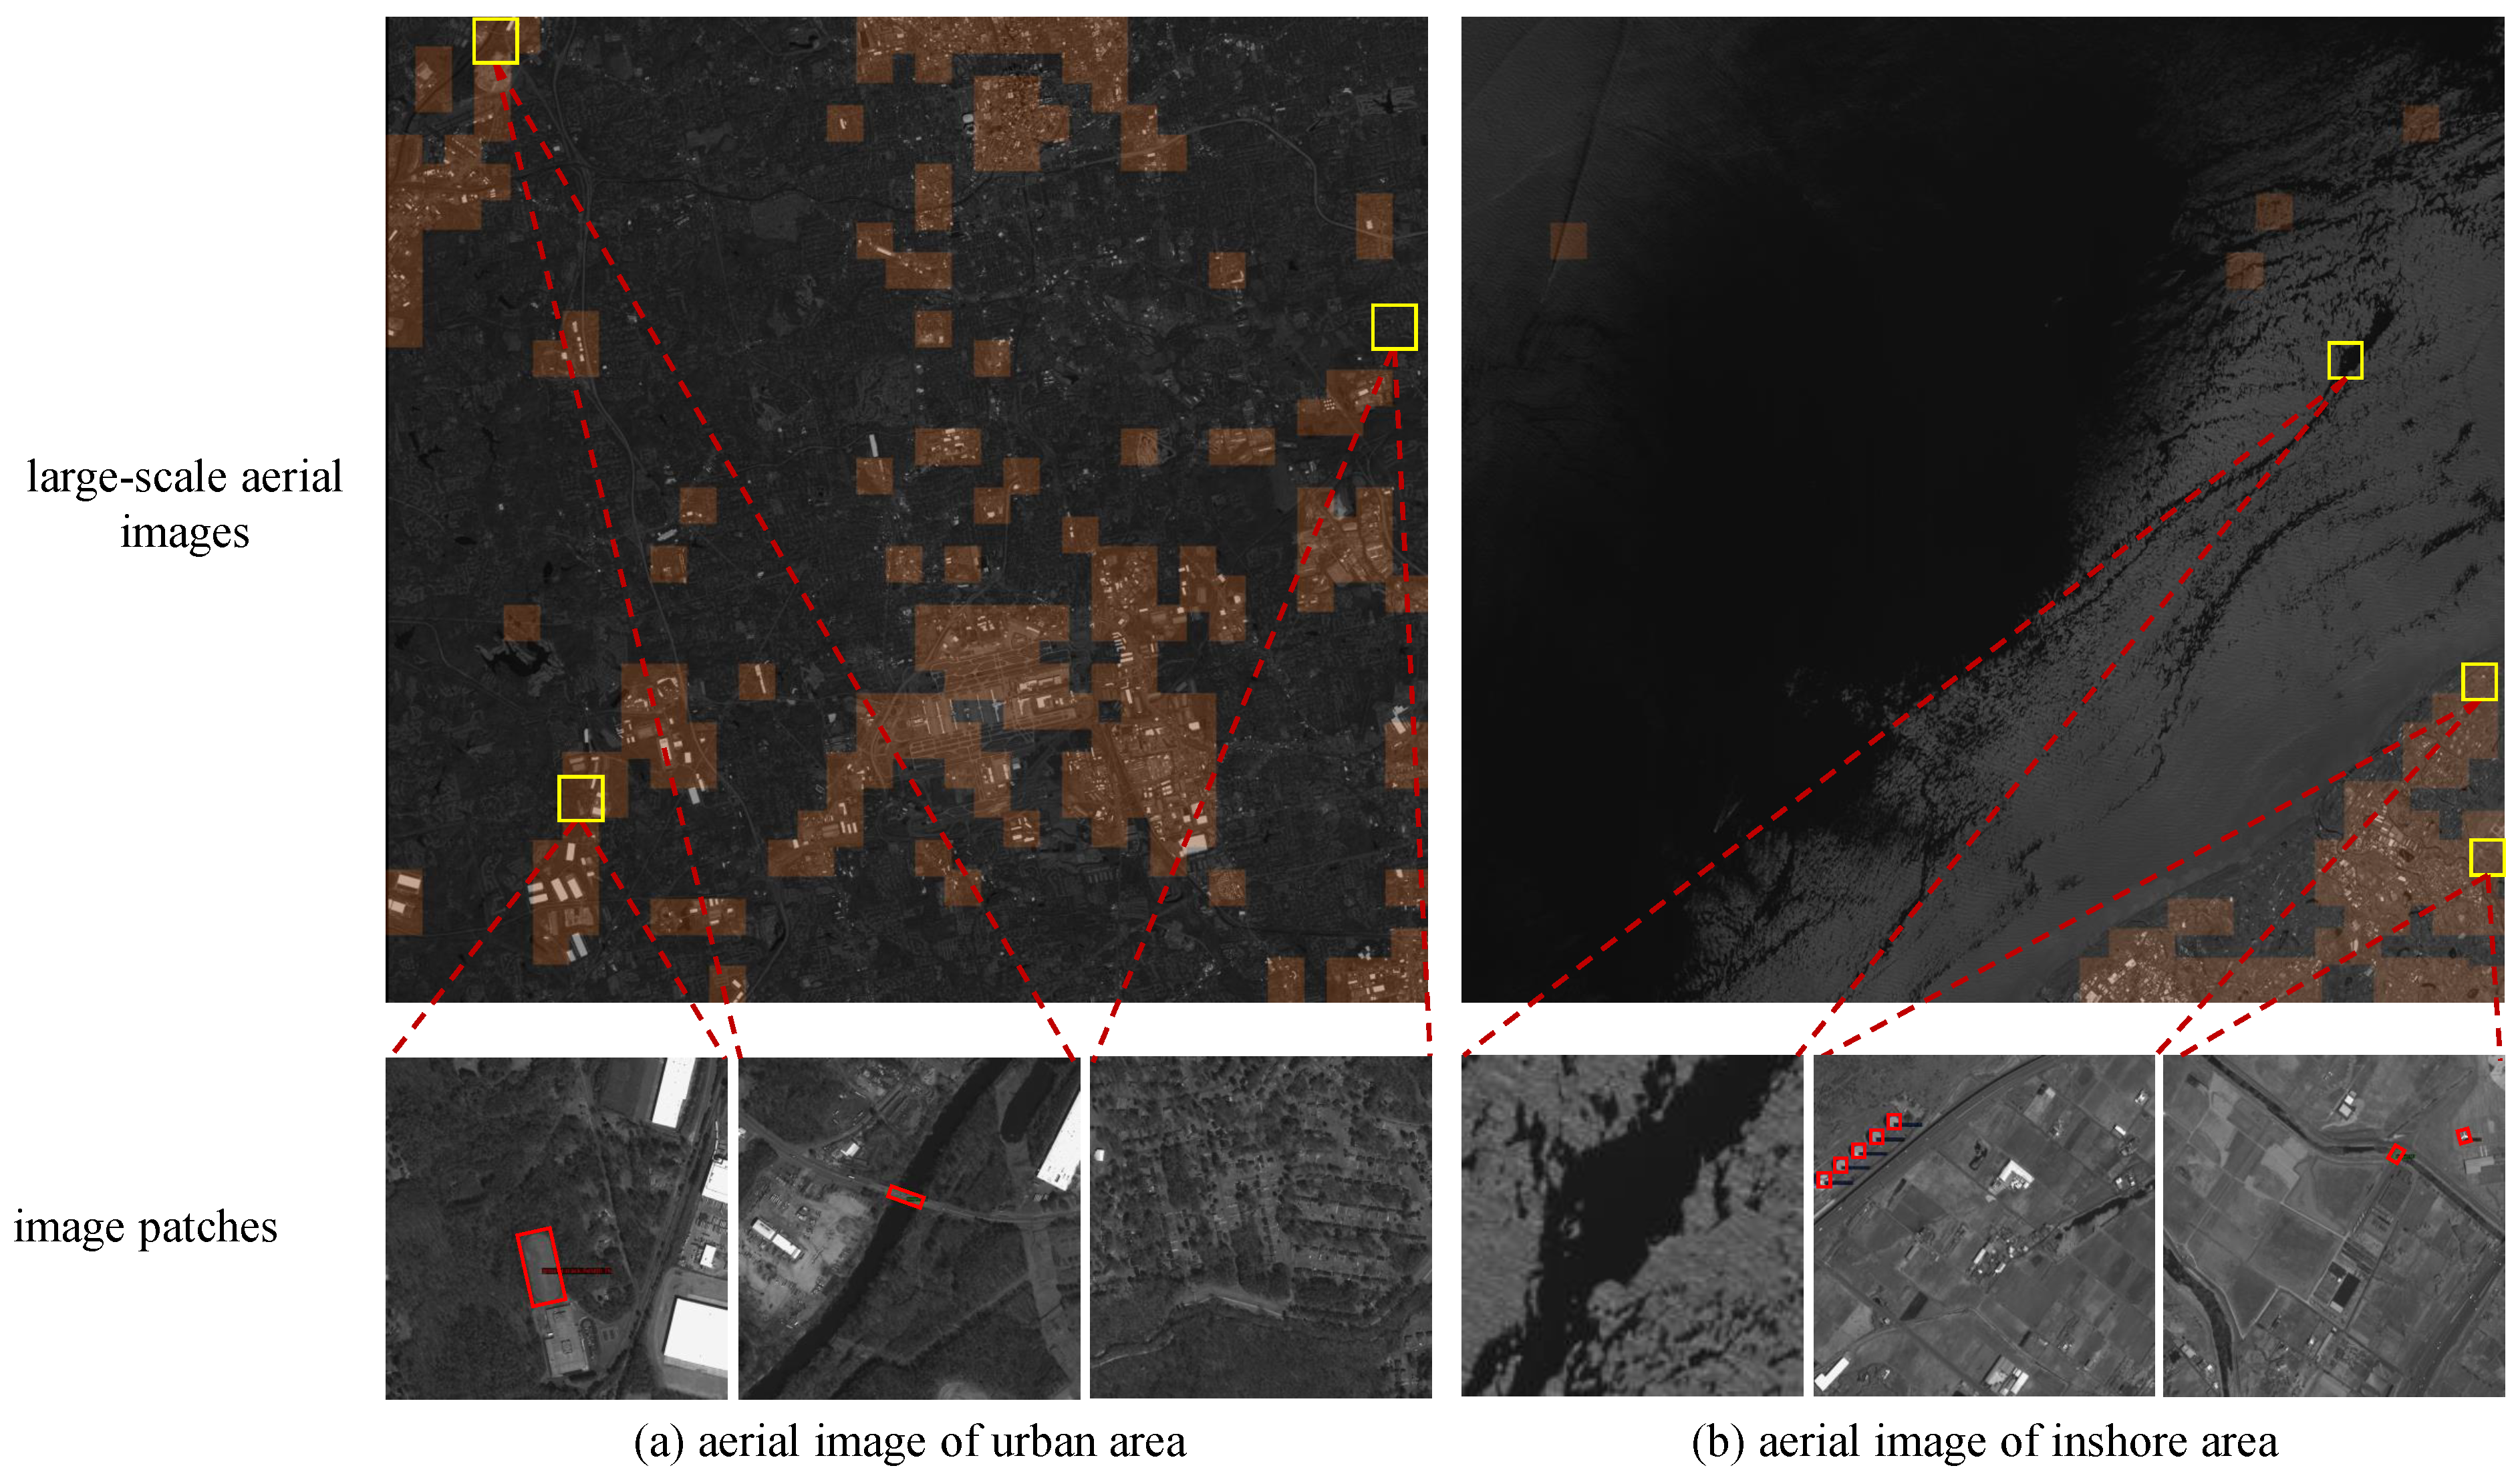
6]. The input size of deep learning-based aerial object detection models is typically limited to 800 × 800 pixels or smaller. However, images captured by UAV cameras are sometimes extremely large. As shown in Figure 1a, the released DOTA v2.0 aerial image dataset [7] contains images approximately 7000 × 5000 pixels in size.
As shown in Figure 1, given a large-scale UAV image, our research aims to achieve efficient detection of typical objects, balancing both detection speed and accuracy. The objects detected are determined by the categories included in the dataset used to train the model. For example, the DOTA v2.0 dataset contains 18 categories, including planes, ships, storage tanks, and other common objects in aerial imagery.
For object detection in large-scale UAV aerial imagery, an adopted approach is to split the original image into overlapping patches. An object detection method is applied on each patch, and the detection results across all patches are merged to achieve detection for the entire image, as illustrated in Figure 1c(1). To ensure complete coverage of all regions, the YOLT algorithm [8] segments images with a 15% overlap and uses non-maximum suppression to merge the detection results. For specific tasks such as aircraft and ship detection, domain knowledge can be utilized to improve the processing efficiency of wide-swath aerial images [9,10]. For example, aircraft are always distributed around airports, and ships are generally docked at ports or along shorelines. However, these detection methods using prior knowledge are only applicable to objects with distinct distribution characteristics.
As shown in Figure 1a, large-scale UAV aerial images usually contain a large amount of background areas, with sparsely distributed objects. To address this characteristic, some studies propose a strategy of determining whether objects are present in each image patch before performing object detection. This strategy mainly has two types of network frameworks. The first type involves adding a classification branch to the detector to identify and filter out patches without objects, as illustrated in Figure 1c(2). Xie et al. [6] developed an Object Activation Network (OAN) on the final feature map of the detector, while Cao et al. [11] integrated simple and lightweight object presence detectors into the feature maps at various stages of the backbone network. These methods improve classification accuracy through joint optimization of the classification branch and the detector. The second strategy is to construct a separate binary classifier to determine whether objects are present in the image patch, as depicted in Figure 1c(3). Pang et al. [12] designed a lightweight Tiny-Net, using a global attention mechanism to classify image patches. However, due to the independent optimization of the binary classification network and the relatively weakly supervised information, these methods tend to have lower classification accuracy, thereby impacting the detection performance.
To address the challenge of efficient object detection in large-scale UAV aerial imagery, we propose a classification-driven efficient object detection method and design a lightweight multi-task learning classification (MTC) network, as shown in Figure 1c(4). The UAV cameras are oriented with their optical axes pointing downward, capturing images from a bird’s-eye view. This unique perspective results in objects with varying orientations and arbitrary directions. Most aerial image object detection tasks use oriented bounding boxes for dataset annotation, which compactly enclose the objects. We fully utilize the information embedded in these oriented bounding boxes by using an improved Gaussian function to generate salient regions. Through joint training of a classification network with a salient region generation branch, we improve the discriminative ability of the classification network. Moreover, the salient region generation branch only assists in network training without reducing the inference speed. Without retraining the detector, the constructed MTC performs classification on image patches before detection and is well suited as a preprocessing step for detection models. Additionally, we design a dynamic classification threshold (DCT) setting strategy for the inference, which can balance precision and recall by incorporating the classification confidence score. The proposed method shows strong potential for application in large-scale UAV images with sparse and single-type object distributions, which can achieve real-time detection while maintaining high detection performance. The main contributions of this paper are summarized as follows:
(1)
We propose a lightweight multi-task learning classification network to rapidly determine the presence or absence of objects in aerial image patches.
(2)
We construct a salient region generation branch, which is trained jointly with the network as an auxiliary branch to enhance feature learning ability.
(3)
We propose an optimal threshold generation strategy incorporating confidence scores, which effectively filters backgrounds while maintaining a high object recall rate.
(4)
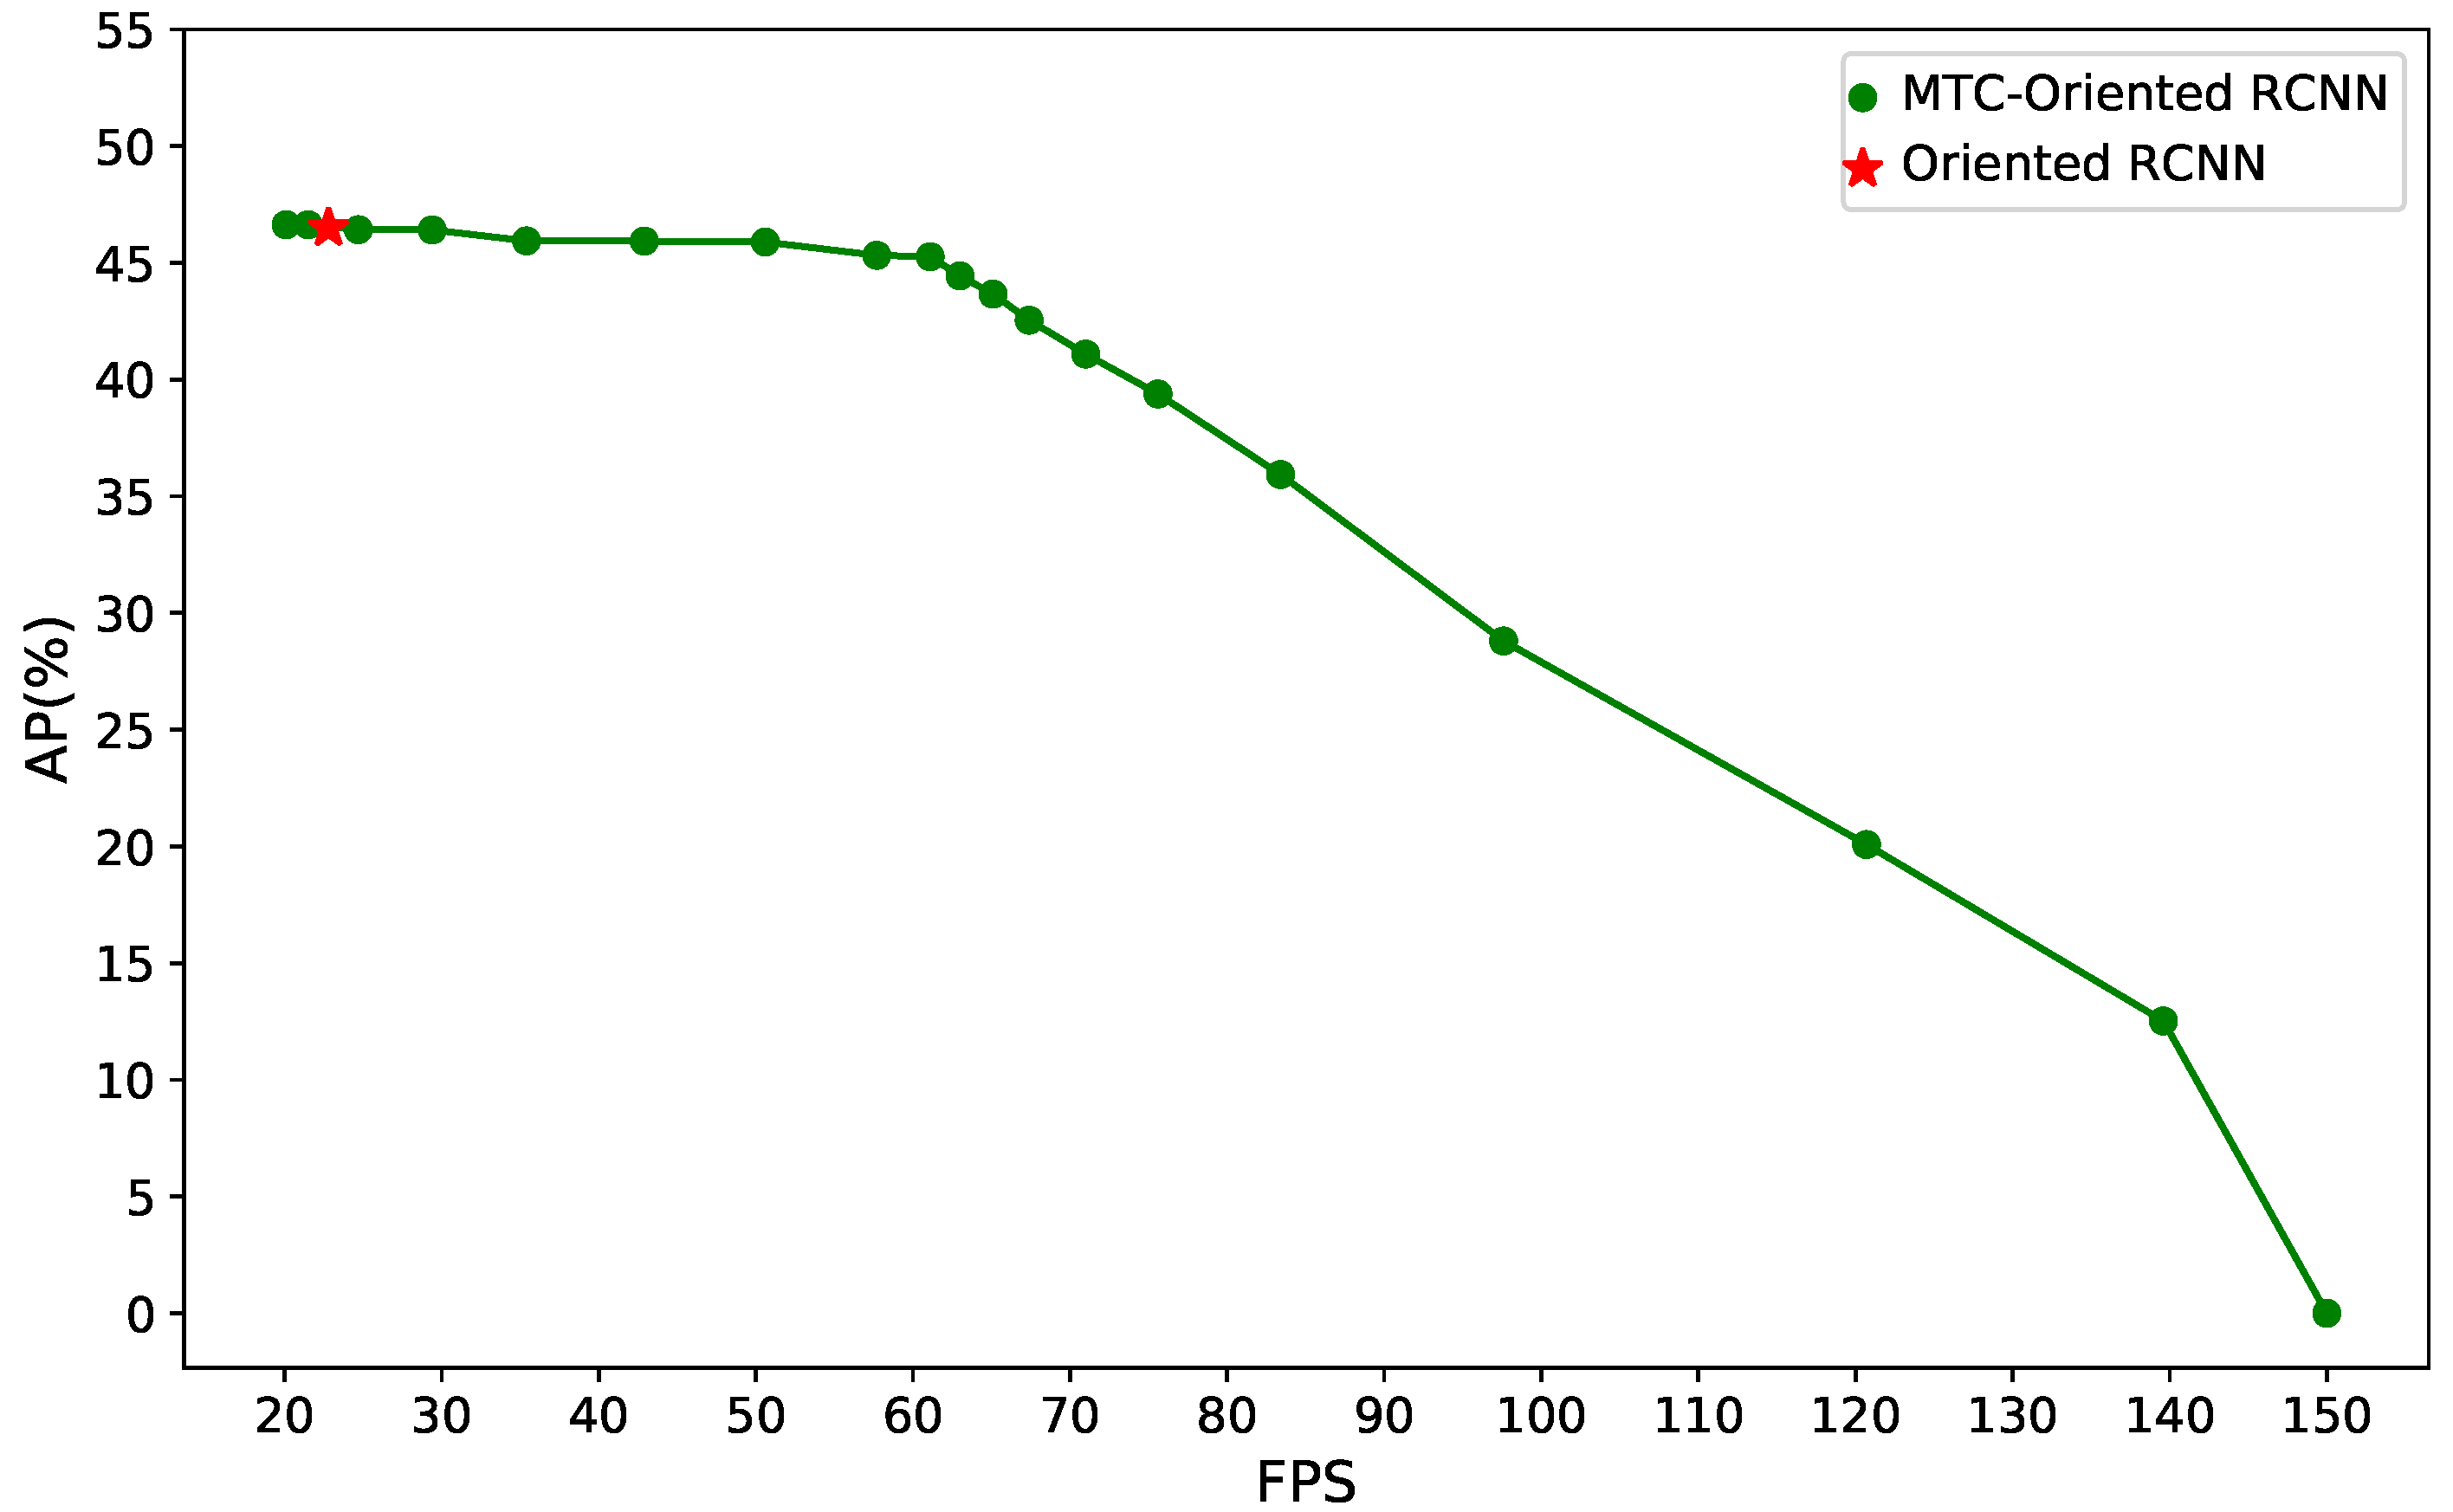
We validate the effectiveness and efficiency of the proposed method for processing large-scale UAV aerial images on three public datasets. On the ASDD dataset [13], the object detection speed of our proposed method increases by more than 130%, with only a 0.9% decrease in detection performance.
The remainder of this article is structured as follows: Section 2 provides a review of related works. Section 3 outlines the overall framework of a classification-driven object detection method and its inference process. Section 4 presents experimental details and results analysis. Finally, Section 5 provides the conclusion.

2. Related Works

2.1. Object Detection in Aerial Images

UAV aerial image objects are characterized by scale variation [14,15] and diverse directional distributions [16,17]. When the orientation of the object changes, the size of the horizontal bounding box also changes. In contrast, the size of the oriented bounding box remains constant, with only the orientation changing. Given these characteristics, the parameter representation of oriented bounding boxes [18], rotation-invariant feature learning networks [19,20], and loss function design [21] have become research hotspots in aerial object detection.
Some methods for representing oriented bounding boxes include rotated rectangles and quadrilateral annotations. Xu et al. [22] first detected horizontal bounding boxes and then learned corner point offsets to obtain quadrilaterals, restricting the offsets to one side of the horizontal bounding box, and avoid marking the four vertices in a particular order. Qian et al. [23] used a cross-product approach to sort four corner points and design an eight-parameter rotation loss to alleviate discontinuities caused by boundary regression.
In terms of network design, Ding et al. [24] propose a detection network that performs spatial transformations to obtain rotated RoIs and extract rotation-invariant features through rotation position-sensitive alignment. Han et al. [25] designed S2ANet, which uses an aligned convolution module to adaptively align anchor features and employs active rotating filters to encode directional information. The feature selection module constructed by Pan et al. [26] adjusts the receptive field based on the characteristic of the object. To address the misalignment between classification and localization tasks, Qi et al. [27] propose TIOEDet to integrate posterior localization into the classification task. These methods strengthen rotation-invariant feature learning through deep network design, improving the robustness of object detection models to changes in orientation.
The regression of the rotation angle in rotated bounding boxes can lead to abrupt boundary changes, which is caused by the definition of the rotation angle [28,29,30]. To avoid directly predicting angles, an indirect approach can be used to determine the rotation angle of a bounding box. Zhu et al. [31] propose the adaptive period embedding method, using two-dimensional vectors with different periods to represent angles. To address characteristics such as scale variations and dense distributions of small objects, model construction optimization is achieved by adding modules for multi-scale feature information fusion and attention mechanisms. Zheng et al. [32] propose HyNet, which learns hyper-scale feature representations to mitigate extreme scale variations in objects. Li et al. [33] propose the lightweight LSK-Net, which dynamically adjusts larger receptive fields to extract contextual information. Fu et al. [34] constructed a feature fusion network to aggregate shallow low-level information and deep semantic feature information through multiple top–down and bottom–up paths.
Recently, Transformer-based detection frameworks have also been applied to aerial object detection [35]. Zhao et al. [36] used points and axes to represent an object and propose a DETR-based model to predict corresponding results. To address the high complexity of Transformers, Zhang et al. [37] propose an efficient dual-path encoding Transformer framework to reduce computational costs without compromising the accuracy of object detection.
These object detection methods are designed to improve detection accuracy for image patches, without considering how to enhance detection speed when processing large-scale UAV aerial images.

2.2. Efficient Object Detection in Large-Scale Images

Current research improves the detection speed of large-scale aerial imagery through three approaches: domain knowledge-based specific object detection, lightweight detection model construction, and multi-stage detector development.
For specific tasks, such as aircraft and ship detection, domain knowledge can be leveraged to achieve the high processing efficiency of large UAV images. Gao et al. [10] used clustering methods to crop images and group adjacent aircraft into the same region to generate a new sample annotation set for training a background filtering network. During inference, regions that contain aircraft are selected first. Chen et al. [38] utilized multi-spectral images for rapid sea–land segmentation, leveraging discrete wavelet transform (DWT) technology to obtain ship regions and achieving a balance between detection performance and speed. While these methods achieve rapid background filtering, their generalizability is limited. These methods are suitable for detecting objects with distinct distribution characteristics.
Lightweight object detection networks with fewer parameters and reduced computation enhance the inference speed for large-scale aerial images [39]. Single-stage object detection models have fast image processing ability to generate prediction boxes [40]. YOLO-based models, in particular, have been widely applied for rapid interpretation. Si et al. [41] introduced an improved bidirectional feature pyramid network into the feature fusion stage of YOLOv5, improving the detection speed of small vessels while maintaining high detection accuracy. LAI-YOLOv5s [42] combines features from large-scale detection heads with those from the backbone network to extract deep semantic information. Li et al. [43] used a lightweight MobileNet as the backbone and designed an efficient deep learning hardware architecture composed of multiple neural processing units, improving computational efficiency from both the network design and hardware architecture levels. These methods improve the processing speed by optimizing the network structure. However, these approaches do not fully consider the characteristics of large-scale aerial imagery and object distribution.
An increasing number of studies focus on object distribution characteristics in UAV images and apply multi-stage strategies to accelerate the processing of large-scale aerial images. These methods often first extract candidate regions that may contain objects and then perform detection within these regions [44]. It is inefficient to divide large-scale UAV images into patches for detection. Density maps are used to identify object presence and guide image segmentation [45,46]. The Grid Activation Module proposed by Zhang et al. [47] filters out regions without targets, reducing redundant computation. Hua et al. [48] designed a pre-screening fully convolutional network to guide the extraction of potential object regions in large-scale scenes. Additionally, some studies add classification branches to object detection networks to identify and filter image patches without objects [6,11]. These methods improve performance by jointly optimizing parameters for object discrimination and detection branches. However, it is necessary to retrain the entire network when applied to a new object detection model. Our proposed classification-driven detection approach can serve as a preprocessing step for object detection without retraining the detector.

3. Method

3.1. Overall Architecture
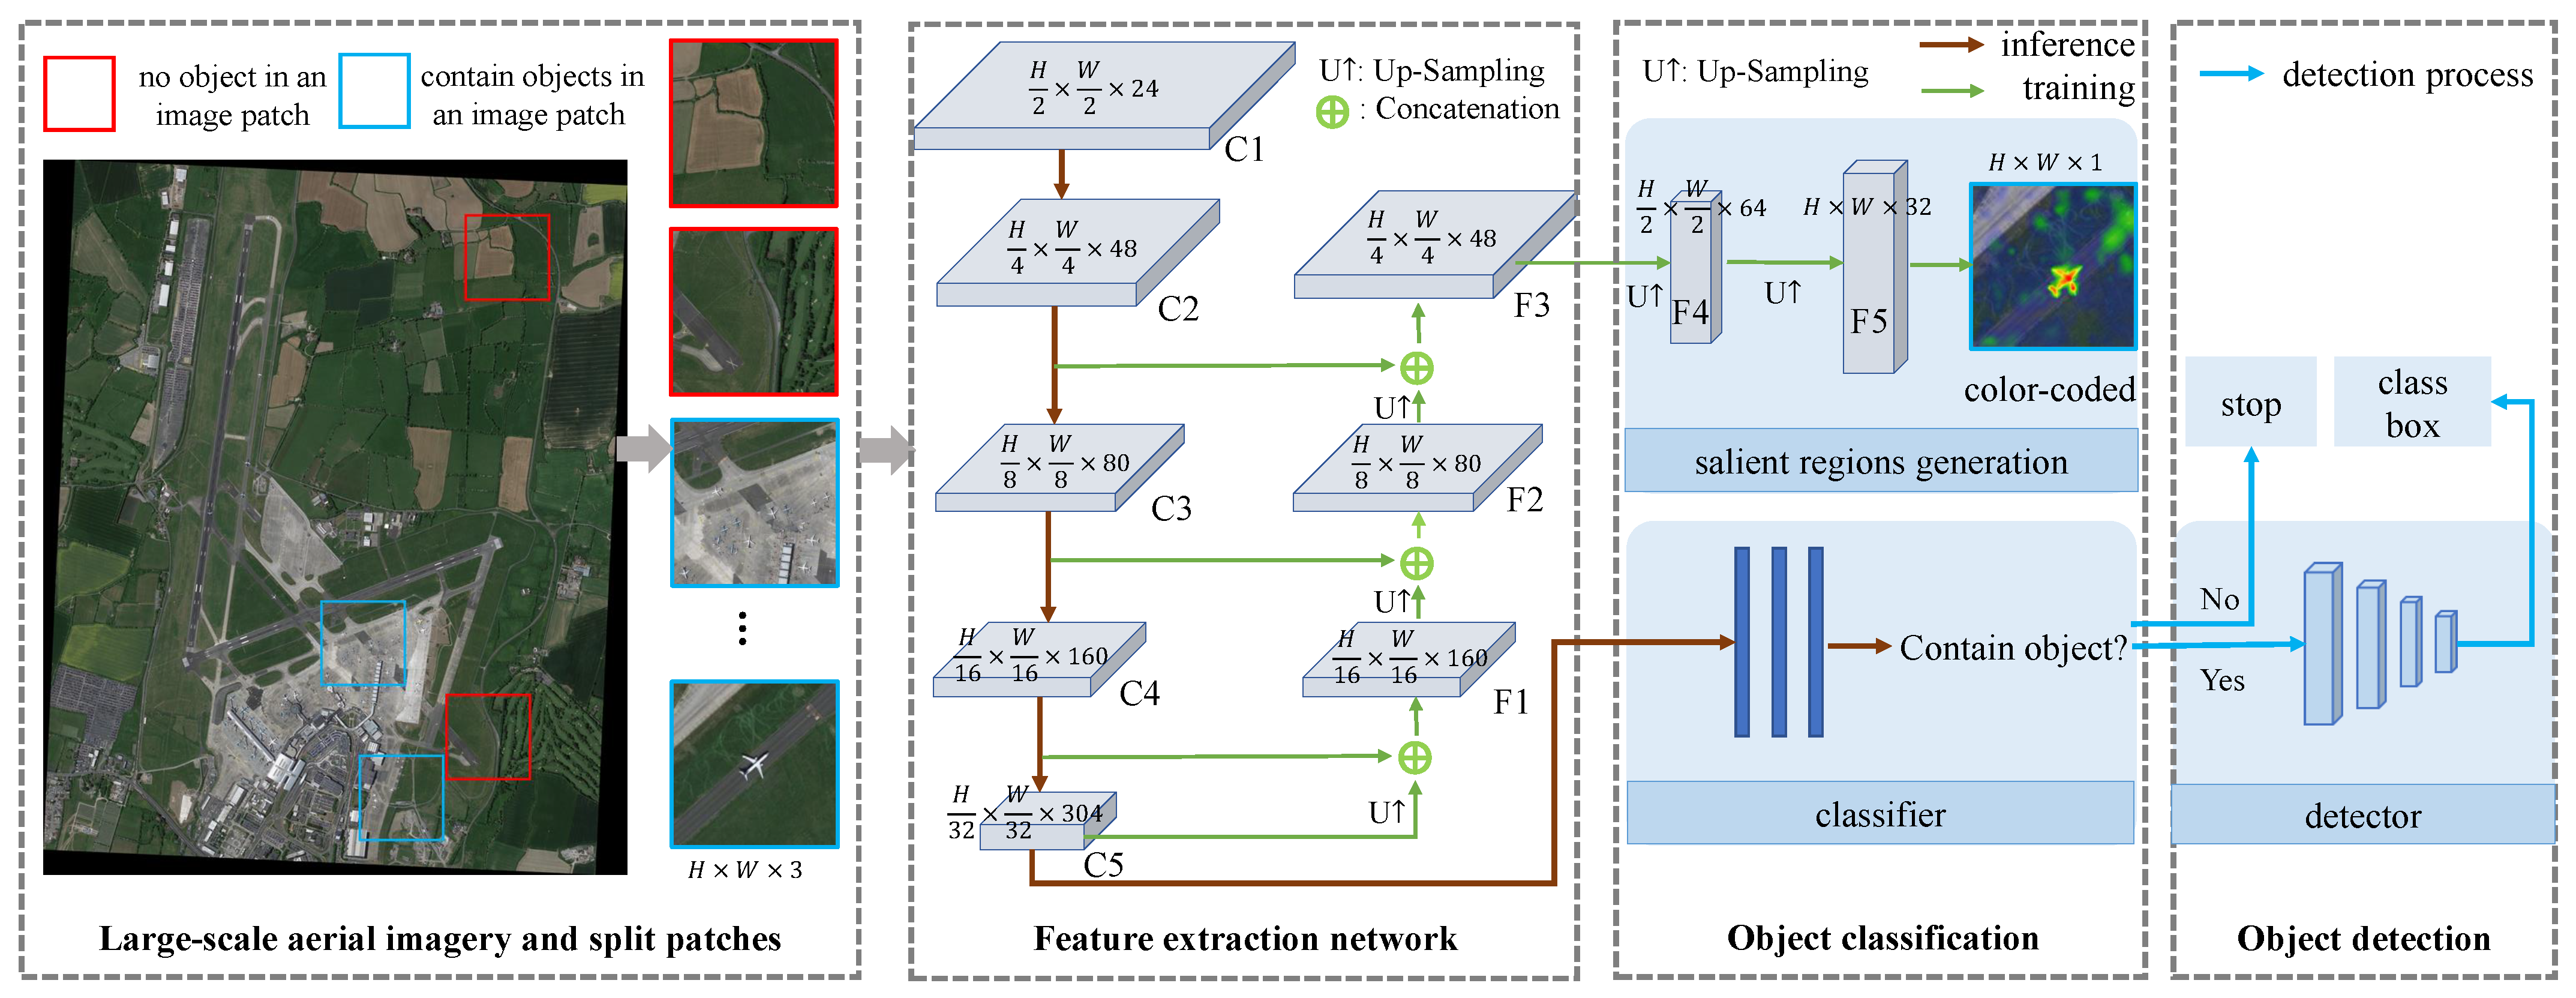
As shown in Figure 2, the classification-driven MTC-based object detection framework mainly consists of three components: splitting a large-scale image into patches, feature extraction, and object classification. First, the original large-scale aerial image is split into smaller patches with an overlap ratio. Then, based on the information from the labeled bounding boxes, a salient region generation module is constructed as a network branch and jointly trained with the classification branch to improve the feature learning capability. Next, to improve the classification and recognition performance of small objects, a feature fusion module is added to the salient region generation branch. During training, the parameters of the salient region generation branch and the classification branch are optimized jointly. During the inference stage, only the parameters of the classification branch are used, improving classification accuracy while maintaining inference speed.
The lightweight EfficientNetV2 [49] is used as the backbone for feature extraction. Given an input image of size H × W × 3 , the feature maps C1 ( H 2 × W 2 × 24 ), C2 ( H 4 × W 4 × 48 ), C3 ( H 8 × W 8 × 80 ), C4 ( H 16 × W 16 × 160 ), and C5 ( H 32 × W 32 × 304 ) are obtained after five convolutional layers. In the classification branch, the feature map C5 is the input for the fully connected network, and the corresponding output indicates whether an object is present. To improve the discriminative ability of the feature extraction network, a salient region generation branch with a multi-scale feature pyramid is constructed. Specifically, the feature map C5 is upsampled and aggregated with the feature map C4 to obtain the fused feature map F1 ( H 16 × W 16 × 160 ). Similarly, F2 ( H 8 × W 8 × 80 ) and F3 ( H 4 × W 4 × 48 ) are obtained. The feature map F3 is passed through two convolutional layers to generate the salient region result S (
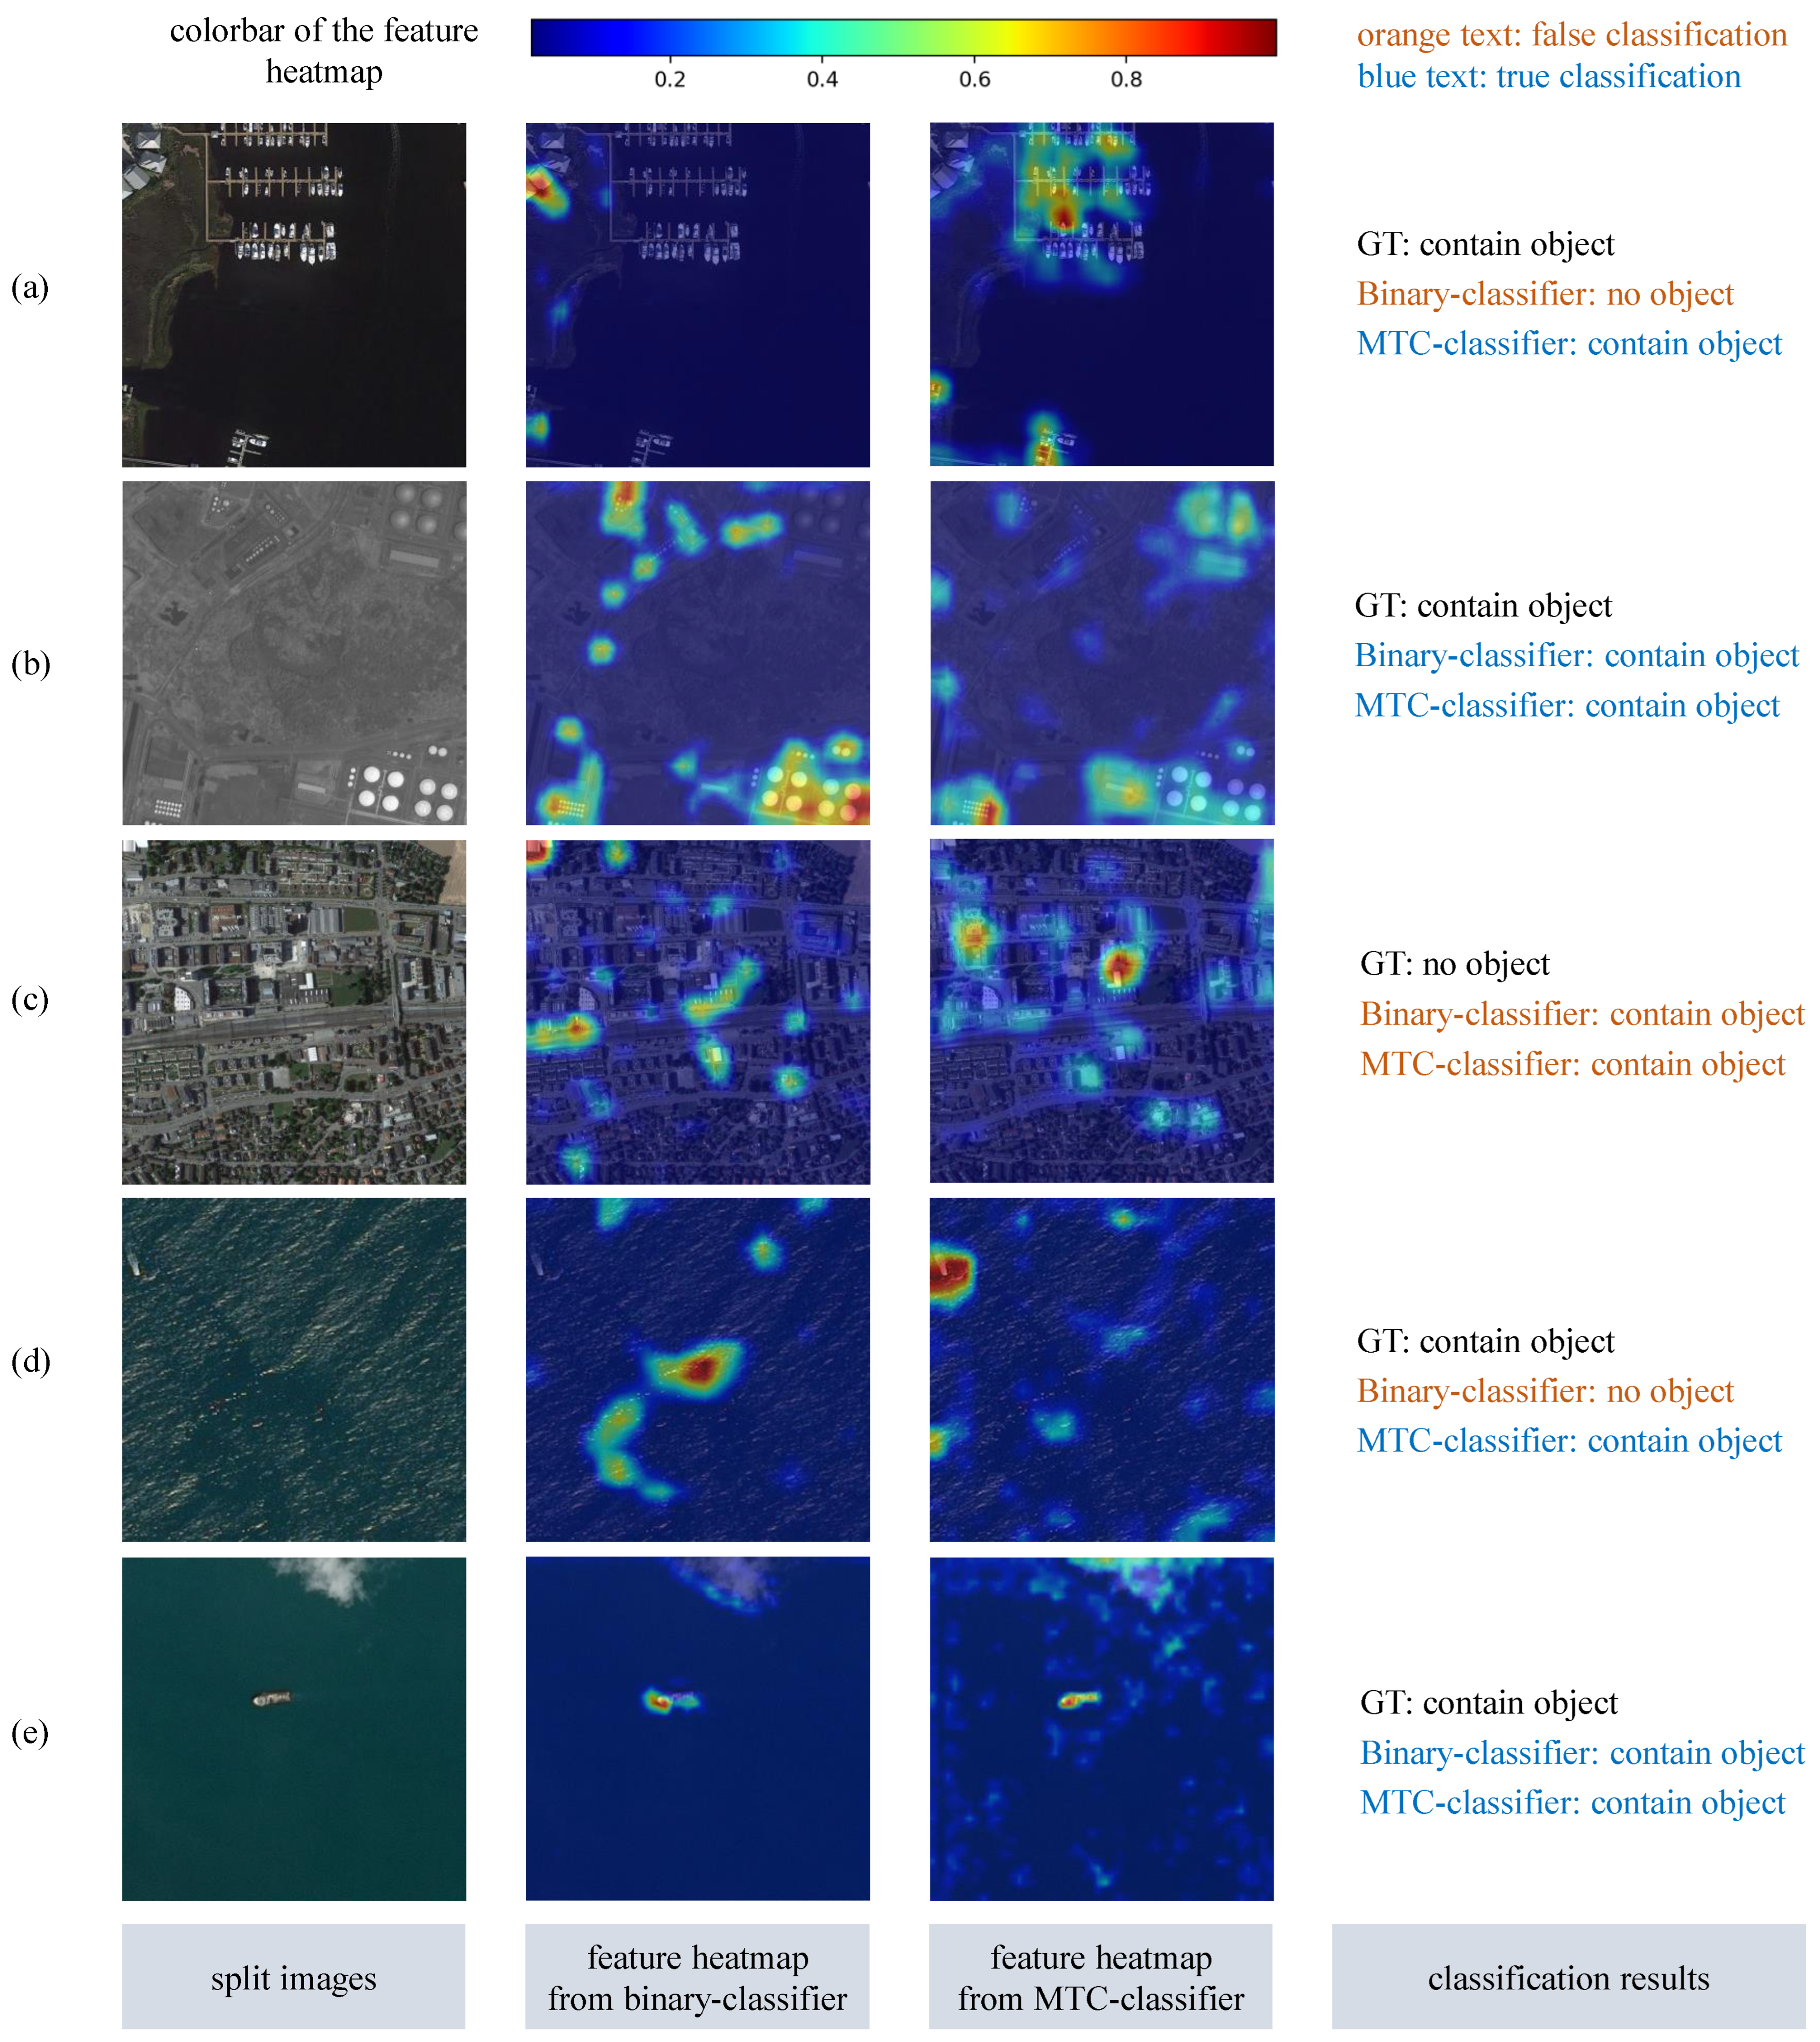
 H × W × 1 ). In Figure 2, we visualize the salient region using a color-coded map.

3.2. Salient Region Enhancement Branch

In a previous research, Pang et al. [12] used a lightweight binary classification network to determine whether an image patch contains an object. However, weak classification label supervision results in poor classification performance. To enhance the feature extraction capabilities, we add a salient region generation branch to assist in training the classification network. As shown in Figure 2, during the upsampling process of the feature map C5, it is fused with the feature map from the previous layer. This fusion helps capture high-level semantic information while also enhancing local detail information. After five upsampling steps and multi-level information fusion, we obtain a mask that is the same size as the original input image. To train the salient region branch, mask supervision information is required. Since the object detection dataset does not provide mask annotations, we generate pseudo-mask supervision information using the object bounding boxes.
As shown in Figure 3, the labeled bounding boxes used in an aerial object detection task closely enclose the objects, containing information about both the location and the category. We fully explore and utilize this annotation information to generate object salient regions within the oriented bounding box using an improved Gaussian distribution function.
Although the labeled bounding box encloses the object, it is unavailable to use the box region as a segmentation mask, which may result in pixel mislabeling. To represent the differences in salient regions within the oriented bounding box, we use an improved Gaussian-based mask to ensure that the object center has the highest confidence. The confidence values in the remaining regions of the labeled bounding box gradually decrease according to an improved Gaussian distribution. The salient region generation process for objects in UAV aerial images is shown in Figure 3. First, the oriented bounding box of an object is transformed into a horizontal box by applying an angle rotation, defining the longer and shorter sides as height h and width w. Then, around the center of the horizontal box, a confidence value for each pixel within the bounding box is generated using an improved Gaussian distribution function. Finally, the generated confidence distribution map is rotated back by the specified angle to obtain the salient region mask for the original image. The confidence value for each pixel is calculated as follows:
G ( x , y ) = exp { μ w · ( x b x ) 2 2 σ w 2 + μ h · ( y b y ) 2 2 σ h 2 }
where b x and b y represent the coordinates of the center point of an object, while μ w and μ h are control factors determined by the aspect ratio of the labeled bounding box. The parameters σ w and σ h are proportional to the width and height of an object, respectively. In our experiments, the parameters σ w and σ h are all set to 0.5. The designed Gaussian-based mask effectively mitigates pixel mislabeling issues and allows the inference of pixel position information based on confidence values.
The designed salient region generation branch leverages additional supervision information (Gaussian-based masks) and integrates multi-level feature map information, which enhances the feature extraction capability of the backbone in the classification network, particularly for discriminative features of small objects.

3.3. Multi-Task Optimization Loss Function

Our proposed classification-driven MTC network contains two learning tasks: image classification and salient region generation. The overall loss function is defined as follows:
L = L class + λ L region
where L class and L region are the classification loss and salient region generation loss, respectively. λ is the balancing factor between the two loss functions.
During the preprocessing of large-scale aerial image patches, we categorize all images into two classes: images that contain objects or not. Considering the imbalance between positive and negative samples in large-scale aerial imagery, we employ focal loss to optimize the classification branch, balancing the impact of different samples on model training.
L class = α t · ( 1 p t ) γ · L BCE ( p , y )
L BCE ( p , y ) = [ y · log ( p ) + ( 1 y ) · ( 1 log ( p ) ) ]
p t = y · p + ( 1 y ) · ( 1 p )
Here, y is the true label, and p denotes the predicted probability. L BCE ( p , y ) is the Binary Cross Entropy (BCE) loss, α t is designed to balance positive and negative image patches, and p t is the predicted probability of the correct class. γ is the focusing factor, which adjusts the contribution of easily classified samples to the loss.
In the salient region generation branch, we apply BCE loss as the optimization objective. We utilize more comprehensive label information for joint optimization of the MTC network. The salient region generation branch contributes to improving the feature learning capability of the backbone.

3.4. Dynamic Classification Threshold During Inference

During inference, whether an image patch contains an object depends on a hyperparameter: the classification confidence threshold. The setting of this threshold affects the object detection performance. If the confidence threshold is set too low, the MTC network tends to identify more potential objects and will increase the recall rate. However, this also leads to redundant detections, which can slow down subsequent processing. Conversely, if the confidence threshold is set too high, only image patches with high confidence will be further detected. This reduces false positives and redundant detections, improving object detection speed. However, a high confidence threshold may also miss some low-confidence yet valid objects.
In conventional object classification tasks, the threshold is typically set at a fixed value of 0.5. Such a fixed threshold is not well suited for complex and dynamic real-world environments. Therefore, we propose a dynamic classification threshold generation strategy based on the confidence-F1 ( c F 1 ) score [50]. Specifically, c P r e c i s i o n , c R e c a l l , and c F 1 share the same mathematical formulas as P r e c i s i o n , R e c a l l , and F 1 , respectively. The difference is that they use continuous (rather than binary) positive and negative values, defined based on the confidence scores generated by the MTC network. In the evaluation metrics for classification tasks, T P denotes the number of object images correctly classified, F N represents the number of object images incorrectly classified as background, and F P denotes the number of background images incorrectly identified as objects. The confidence-based T P ( c T P ) and confidence-based F P ( c F P ) are defined as follows:
c T P = P ( x i , C obj ) · I C obj = y i
c F P = P ( x i , C obj ) · I C obj y i
I X =         1   if   X   is   true         0   if   X   is   false  
where P ( x i , C obj ) denotes the confidence score output by the MTC network, I C obj represents the image patch class, and y i is the prediction class.
Based on the definitions of c T P and c F P , we calculate c P r e c i s i o n , c R e c a l l , and c F 1 using the following formulas:
c P r e c i s i o n = c T P c T P + c F P
c R e c a l l = c T P T P + F N
c F 1 = 2 · c P r e c i s i o n · c R e c a l l c P r e c i s i o n + c R e c a l l
It can be seen that the denominator of c R e c a l l remains the same as that of standard R e c a l l without incorporating the probabilistic extensions of F P and F N , as T P + F N represents the total number of image patches. Based on the c F 1 scores calculated at different threshold settings on a validation dataset, we select the threshold corresponding to the highest c F 1 score as the optimal classification threshold for the inference stage. This strategy dynamically adjusts the confidence threshold by analyzing the data distribution characteristics in practical applications. The classification-driven detection model can adaptively balance the object recall rate and detection speed under different conditions.

3.5. Model Training and Inference

During the training stage, we jointly optimize the classification and the salient region generation branches using the loss function defined in Section 3.3, promoting mutual enhancement through shared learning objectives. The additional supervision information provided by the salient region generation branch strengthens the feature extraction capability of the classification branch, improving the classification performance and robustness of the entire network.
In the inference stage, we only use the classification branch to determine whether the image patch contains an object. Additionally, we prune the parameters of the salient region generation branch to reduce the computational complexity and memory usage, which improves inference speed and overall object detection efficiency. In practical large-scale UAV application scenarios, our classification-driven method can achieve rapid and effective aerial object detection.

4. Experiments and Results

4.1. Datasets and Metrics

The DOTA dataset [7,51] is a large-scale aerial object detection dataset. Each image ranges in size from 800 × 800 to 20,000 × 20,000 pixels, and the objects have a wide variety of scales, orientations, and shapes. Specifically, DOTA v1.0 [51] includes 15 common categories, including plane (PL), ship (SH), storage tank (ST), baseball diamond (BD), tennis court (TC), basketball court (BC), ground track field (GTF), harbor (HA), bridge (BR), large vehicle (LV), small vehicle (SV), helicopter (HC), roundabout (RA), swimming pool (SP), and soccer ball field (SBF). DOTA v2.0 [7] expands the dataset with additional images from other UAV aerial sources. Compared with DOTA v1.0, DOTA v2.0 introduces three additional object categories: airport, container crane, and helipad, bringing the total to 18 object categories. The newly added aerial images typically have dimensions of 29,200 × 27,620 pixels, providing a robust basis for evaluating the efficiency of detection algorithms. The objects are annotated by aerial image experts using rotated bounding boxes in the form of arbitrary quadrilaterals, allowing for 8 degrees of freedom. We train the proposed MTC network using the DOTA v1.0 training set and evaluate the model’s performance on the DOTA v1.0 test set and the large-scale aerial images in DOTA v2.0 dataset.
ASDD [13] is a large-scale ship detection dataset released through a Kaggle competition. The image samples are captured from UAVs. The ASDD dataset contains over 100,000 images at a resolution of 768 × 768 pixels. It encompasses a broad range of environments and scenarios, including coastal areas and open sea under various conditions such as clear skies, cloudy weather, and fog. Many images contain no ships, while those with ships may include multiple vessels that vary significantly in size and location, from open water to docks and marinas. In our experiments, we split the released ASDD datasets into training, validation, and test sets at a 7:1:2 ratio. The ASDD dataset contains a large number of images without ships, which can be used to evaluate the inference speed of our proposed classification-driven detection method.
For the DOTA dataset, we evaluate detection performance using the mAP metric. The average precision (AP) is calculated across multiple intersection over union (IoU) thresholds (from 0.50 to 0.95 in increments of 0.05), taking into account both precision and recall across all object categories. Specifically, the precision and recall are computed as follows:
P r e c i s i o n = T P d T P d + F P d
R e c a l l = T P d T P d + F N d
The prediction is considered True Positive ( T P d ) if its IoU with the ground truth bounding box exceeds a threshold. Otherwise, it is classified as False Positive ( F P d ). False Negative ( F N d ) denotes an actual object that is not detected. The area under the precision–recall curve (PRC) is computed as AP. The mean AP across all categories is the mAP score, which is a widely used metric to evaluate the accuracy of object detection models. In the ASDD dataset, we also evaluate AP50 and AP75, representing AP values at corresponding fixed IoU thresholds of 0.5 and 0.75.
The Frames per Second ( F P S ) measures the speed of an object detection model, indicating how many frames (image patches) it can process per second, defined as follows:
F P S = N images T time
where N images is the number of image patches processed, and T time is the total time taken for processing all image patches. The unit of F P S is fps, which stands for frames per second. The evaluation metric F P S is a critical measure of real-time capability, providing insight into the efficiency of different detection strategies on large-scale UAV aerial imagery.

4.2. Implementation Details

In the proposed MTC network, we use the lightweight EfficientNetV2 as the backbone. For the aerial DOTA v1.0 and DOTA v2.0 datasets, we split the large images into small patches of 1024 × 1024 pixels. The overlap size is 200 pixels in both horizontal and vertical directions, ensuring that objects near the edges of the patches are not missed. We further resize them to 512 × 512 pixels for input into the classification model. In the ASDD dataset, the original image size is 768 × 768 pixels. To enhance classification speed, we resize these images to 384 × 384 pixels as input. The MTC network is trained for 200 epochs with a batch size of 16 and an initial learning rate of 0.001, using the SGD optimizer. During inference, we set the classification threshold for DOTA to 0.36 and for ASDD to 0.5, based on the c F 1 score calculated from the validation set. In the loss function parameter settings, the hyperparameters α t and γ are set to 0.25 and 1.5, respectively. The balance factor λ between the classification loss and the salient region generation loss is set to 0.05. All training and inference are conducted on a computer equipped with an NVIDIA 3090 Ti GPU. Specifically, for consistency and fair comparison, we process all image patches and then calculate the average inference speed. We implement the proposed method using the PyTorch 1.7 library in Python. The code is available at https://github.com/OrientSama/MTC-Detection (accessed on 12 November 2024).

4.3. Ablation Study

The proposed MTC network plays a key role in accelerating the detection of large-scale UAV aerial images. During inference, the MTC network first classifies image patches to determine whether they contain objects. Based on the classification results, each image patch is determined whether to pass to the subsequent detector. This classification-driven detection effectively reduces computational costs for non-object regions and increases overall detection speed. To verify the effectiveness of the designed MTC network, we conduct a series of ablation experiments to analyze the improvements introduced by the MTC-based detection method. Unlike conventional binary classifiers, the MTC network incorporates two important elements. First, a salient region generation branch is added and jointly trained with the classification branch to better focus on potential object regions. Second, an optimal classification threshold determination strategy dynamically adjusts the classification threshold. We evaluate the performance of the MTC-based object detection model on the DOTA v1.0 and ASDD datasets, using the single-stage RetinaNet-O and two-stage Oriented RCNN detectors.
The evaluation results on the DOTA v1.0 dataset are shown in Table 1. Compared with regarding all image patches as inputs of RetinaNet-O for detection, the combination of a binary classifier and RetinaNet-O (with a fixed threshold T = 0.5) results in a 22.5% drop in mAP. This indicates that the binary classifier suffers from missed detections when classifying object-containing and object-free images. When we introduce the saliency region generation branch into the classification network and use a fixed threshold (T = 0.5), mAP increases by 3.7% (from 45.9% to 49.6%), demonstrating that the salient region generation branch improves classification accuracy and reduces the missed detection rate for object-containing images. Furthermore, when the DCT strategy is applied to optimize the classification threshold, our proposed method achieves a mAP value of 65.1. Additionally, the F P S is 23.9 fps, which improves detection speed by about 4%. The results validate the effectiveness of the DCT strategy, which enhances inference speed while maintaining high detection accuracy. For the Oriented RCNN detector, adding the salient region generation branch to the binary classification network increases the mAP from 53.8% to 55.4%. When the DCT strategy is further applied, the mAP significantly improves to 72.0%. These experimental results demonstrate the effectiveness of the proposed salient region generation branch and optimal classification threshold determination strategy.
The evaluation results on the ASDD dataset are shown in Table 2. The optimal classification threshold determined by the DCT strategy is also set to 0.5 (indicated as a single row in the table). For the RetinaNet-O detector, although the F P S of the MTC-based detector is slightly reduced compared with the binary classifier, its AP value improves from 34.4% to 35.9%. Compared with detecting all image patches, the MTC-based detector shows slight performance difference in the metrics AP and AP75. The detection speed increases by more than 130% (from 29.8 fps to 71.0 fps with the RetinaNet-O detector and from 22.8 fps to 61.1 fps with the Oriented RCNN detector). This demonstrates that the salient region generation branch effectively improves classification performance and detection speed in scenarios with sparsely distributed objects.

4.4. Quantitative Results Analysis

We evaluate the effectiveness and efficiency of the proposed method in combination with different object detectors on three datasets: the DOTA v1.0, DOTA v2.0, and ASDD datasets.

4.4.1. Results on Aerial DOTA v1.0 Dataset

As shown in Table 3 and Table 4, we select eight single-stage object detection algorithms (DRN [26], PIoU [52], DAL [20], R3Det [29], DCL [53], GWD [30], RetinaNet-O [40], and S2ANet [25]) and four two-stage object detection algorithms (SCRDet [28], Faster RCNN-O [54], Gliding Vertex [22], and Oriented RCNN [55]). Compared with performing detection on all image patches, the MTC-based Oriented RCNN [55] shows a 3.71% (from 75.69% to 71.98%) drop in mAP, while achieving an average processing speed improvement of nearly 4.42% (from 22.6 to 23.6 fps). The performance difference of object detection is mainly due to the trade-off between processing efficiency and detection accuracy.
Specifically, the mAP reduction is mainly concentrated in four object categories: GTF (ground track field), BD (baseball diamond), BR (bridge), and RA (roundabout). Poor detection performance for these categories could be attributed to factors such as complex image backgrounds, unique object shape characteristics, and the classification generalization capability. In panchromatic aerial images, baseball diamonds, ground track fields, and roundabouts are easily confused with the surrounding background, leading to misclassifications. For bridges with larger aspect ratios, existing classification models struggle to identify their features, resulting in decreased detection accuracy. It is worth noting that for the remaining 11 object categories, the MTC-based method achieves a detection accuracy comparable to the original detectors. This indicates that our MTC-based detector effectively improves processing efficiency while maintaining high detection performance for most object categories. Experimental results demonstrate the potential of our method in specific scenarios, particularly for tasks that require a balance between accuracy and speed.
Moreover, more than 80% of the split images in the aerial DOTA v1.0 dataset are classified as containing objects. Therefore, the speed improvement in this dataset is relatively limited. This suggests that while the proposed method shows a slight speed increase in densely distributed object scenes, the gain may not be sufficient to improve overall performance. In practical applications where objects are sparsely distributed or the images contain large areas without objects, the classification-driven detection method can provide a more pronounced speed advantage.

4.4.2. Results on Large-Scale UAV Aerial Images from DOTA v2.0 Dataset

In practical remote sensing applications, it is essential to process entire large-scale scenes quickly. To evaluate the efficiency of the MTC-based detection method on large UAV aerial images, we conduct experiments using six high-resolution aerial images (resolution: 29,200 × 27,620 pixels) from the DOTA v2.0 validation set. Table 5 shows the performance of two representative single-stage object detection algorithms (RetinaNet-O and S2ANet) and two representative two-stage object detection algorithms (Faster RCNN-O and Oriented RCNN) on the GF-2 images.
As shown in Table 5, the mAP values are lower than those in the DOTA v1.0 dataset. This discrepancy is due to the complex and various background environments in the six large-scale aerial images in the DOTA v2.0 dataset. The object categories are numerous and densely distributed, increasing detection difficulty. Under these conditions, the MTC-based detection method achieves an average 1.6% reduction in mAP, but processing speed improves by over 7.3 fps (+30%), verifying the speed optimization achieved for real-world applications. Results suggest that, with only a minor sacrifice in accuracy, the MTC-based method can considerably improve efficiency in detection tasks for large-scale UAV aerial images. The proposed classification-driven method is particularly valuable in applications that require rapid processing of large volumes of aerial images, such as disaster monitoring and urban change detection.

4.4.3. Results on ASDD Dataset

As shown in Table 6, we evaluate the performance of two representative single-stage object detection algorithms (RetinaNet-O and S2ANet) and two representative two-stage object detection algorithms (RoI Transformer and Oriented RCNN) in the ASDD dataset. Results indicate that the MTC-based detection method achieves only an average 0.9% reduction in AP, while processing speed achieves an average increase of 38.4 fps (over 130%). The improvement of detection speed is valuable in real-time applications.
The ASDD dataset contains only one object category (ship), allowing the generated mask to enclose ship contours and ensure accurate detection areas. During multi-task optimization, the MTC-based method effectively leverages salient region information to enhance the feature extraction capability, resulting in minimal reduction in AP. Additionally, the ASDD dataset contains a large number of background images with no objects. The proposed classification-driven detection method can quickly identify these object-free images, avoiding unnecessary subsequent detection. Experimental results demonstrate that the MTC-based object detection method has a clear efficiency advantage in UAV aerial images with sparsely distributed objects.

4.4.4. Analysis of Performance Differences Across Various Datasets

We conduct an in-depth analysis of the performance differences across different datasets using an MCT-based RetinaNet-O detector, considering factors such as the categories included in the dataset and the proportion of image patches without objects. The analysis results are shown in Table 7. As observed, DOTA v1.0 includes 15 target classes, covering a variety of typical ground objects across different scenes. The salient region branch struggles to generate good Gaussian-based masks for all classes, resulting in increased classification difficulty. As a result, the proposed MTC-based detection method leads to a 3.3% decrease in mAP. In the ASDD dataset that contains only one object class (ship), the designed Gaussian-based mask effectively represents the ship regions, and the performance of the MTC-based detector slightly decreases by 0.9% in mAP.
Detection speed is related to the proportion of objects in large-scale UAV aerial images. In the DOTA v1.0, DOTA v2.0, and ASDD datasets, the proportion of image patches without objects in the split images is 19.1%, 41.1%, and 77.9%, respectively. As the object distribution becomes sparser and the proportion of image patches without targets increases, fewer images are processed by the detector, which results in faster overall detection speed. The analysis results show that the MTC-based detection approach has significant application advantages in scenarios with a single-category object and sparse distribution.

4.4.5. Performance Analysis of Different Backbone Networks on ASDD Dataset

To better evaluate the impact of different backbone networks on detection performance, we further assess four distinct backbones on the ASDD dataset: ResNet50 [56], MobileNetV3 [57], ShuffleNetV2 [58], and EfficientNetV2 [49]. In addition to the AP and FPS metrics, we also employ Giga Floating Point Operations per Second (GFLOPs) to quantify the computational cost required for network inference. The experimental results are presented in Table 8. Compared with ResNet50, the other three lightweight networks maintain similar detection accuracy while significantly improving detection speed. This improvement can be attributed to the integration of a salient region generation branch, which enhances the feature extraction capability of the backbone. Among the lightweight networks, EfficientNetV2 achieves the highest values for AP, AP50, and AP75, though it exhibited a slight decrease in detection speed compared with MobileNetV3 and ShuffleNetV2. Therefore, we select EfficientNetV2 as the backbone in the MTC network for feature extraction.

4.5. Qualitative Analysis

4.5.1. Results on DOTA v1.0 and ASDD Datasets

We conduct a visual analysis of the detection results for both the conventional binary classification-based model and our MTC-based model. The corresponding detection results are shown in Figure 4. In the DOTA v1.0 dataset, for densely distributed object scenes, such as ports with small boats and areas with clustered oil tanks, both the binary classifier and the MTC network effectively identify these objects. However, for the two high-resolution aerial images in Figure 4a, the binary classifier fails to detect the objects within the images. The MTC network successfully identifies them, which suggests that the MTC network can adapt to more complex scenarios. With the use of a salient region generation branch, multi-task learning improves the discriminative capability of a classification branch, making it more effective to recognize images containing objects. However, for elongated objects, both the binary classifier and the MTC model struggle to achieve accurate detection. Results show that the MTC model has a limitation in handling high-aspect-ratio objects, where classification accuracy may decline.
In the ASDD dataset, as shown in the second to fourth images of Figure 4b, the binary classifier tends to misclassify smaller ships or ships with features that closely resemble the background. In contrast, the present MTC-based detection model can identify these object ships, verifying its stronger discriminative power. The MTC-based detector performs particularly well in scenarios where object features are weak or have low contrast with the background, demonstrating its advantage in complex background conditions.
Overall, these visual analysis results indicate that the MTC network offers notable advantages in classification capability and adaptability to complex scenes. Its discriminative power is superior to that of the conventional binary classifier. However, it remains challenging to detect elongated objects.

4.5.2. Results on Large-Scale Aerial Images

To demonstrate the performance of the proposed classification-driven detector on large-scale aerial images, we visualize the classification results on two typical high-resolution aerial images. As shown in Figure 5, the orange regions represent areas identified as containing objects, while the other parts are non-object areas. Below Figure 5, the detection results of selected image patches are presented.
The image on the left is a large-scale urban area, with a number of detected object regions, covering approximately 20% of the entire image. This object distribution demonstrates the strong capability of an MTC network to detect typical objects within complex urban environments, especially in areas with tall buildings and infrastructure. In these regions, the MTC network can rapidly identify object areas, achieving efficient detection. The image on the right is a coastal aerial image. Most of the areas are open sea areas without objects. The MTC network effectively identifies and excludes blank areas from further processing, reducing the need for subsequent detection. Compared with traditional methods, the MTC network classifies most non-object areas as empty, increasing the processing speed of the entire large-scale aerial image.

4.5.3. Visualization of Feature Maps

We conduct a visual analysis of feature maps generated by different classification methods on images from various datasets and scenarios. The role of feature map visualization is to provide an intuitive understanding of how the network processes and interprets input data. For a classifier, visualization of feature maps helps to identify key regions and features that the network considers critical for classification. As shown in Figure 6, the MTC classifier demonstrates stronger feature extraction capabilities when handling aerial images with small-scale objects. For example, in Figure 6a, which contains small boats, and Figure 6d, which contains a small ship, the activation areas of a binary classifier are primarily focused on the background, failing to recognize small-scale objects and leading to missed detections. In contrast, the proposed MTC network accurately extracts the features of small boats or ships, achieving precise object identification. Visualization results demonstrate that with the integration of a salient region generation branch, the MTC network is better at focusing on extracting object features.
As shown in Figure 6c, both classifiers mistakenly identify images without objects as containing objects. This is attributed to the interference caused by certain areas in the complex urban background that resemble the objects, which disrupts the feature extraction process of the classifiers.
As shown in Figure 6b,e, both classifiers have comparable discriminative capabilities to process large objects. In these scenes, the objects are large with prominent features. Both the binary and MTC classifiers can identify these object areas. The experimental results show that the MTC network can not only detect large objects but also effectively identify small objects, validating the effectiveness of a multi-scale feature fusion design in a salient region generation branch.

4.6. Trade-Off Between Speed and Accuracy

By adjusting the classification threshold of the MTC network, we can control the number of UAV aerial image patches passed to subsequent detectors. An optimal threshold can achieve a balance between speed and accuracy for large-scale aerial detection tasks. As shown in Table 9, the detection speed and accuracy of RetinaNet-O in the ASDD dataset are obtained under different classification thresholds. Figure 7 further visually illustrates these results. The oriented RCNN is applied to detect all image patches, and its AP and FPS are fixed values, as they are not influenced by the classification threshold. In contrast, MTC-Oriented RCNN exhibits varying detection performances and speeds at different threshold levels.
From the results in Table 6 and Figure 7, we observe that when the threshold is set low, the AP value is highest at 46.4%. However, the inference speed is slow. Due to the low threshold, a large number of image patches are passed to the detector, increasing computational load. As the threshold gradually increases to 0.5, the AP value slightly decreases and detection speed increases by more than 200%. This demonstrates that with an appropriate threshold setting, processing speed can be improved while maintaining detection accuracy. When the threshold is increased further, detection speed continues to improve. However, the detection accuracy drops noticeably. The MTC classifier misclassifies many object-containing images as background, leading to an increase in missed detections. It is suitable to select a high threshold for scenarios that require rapid scanning over large areas. In our experiments, with the use of DCL, the classification threshold is set to 0.5. Results show that our proposed DCL threshold selection strategy allows for flexible threshold adjustments, achieving a balance between speed and accuracy.

5. Conclusions

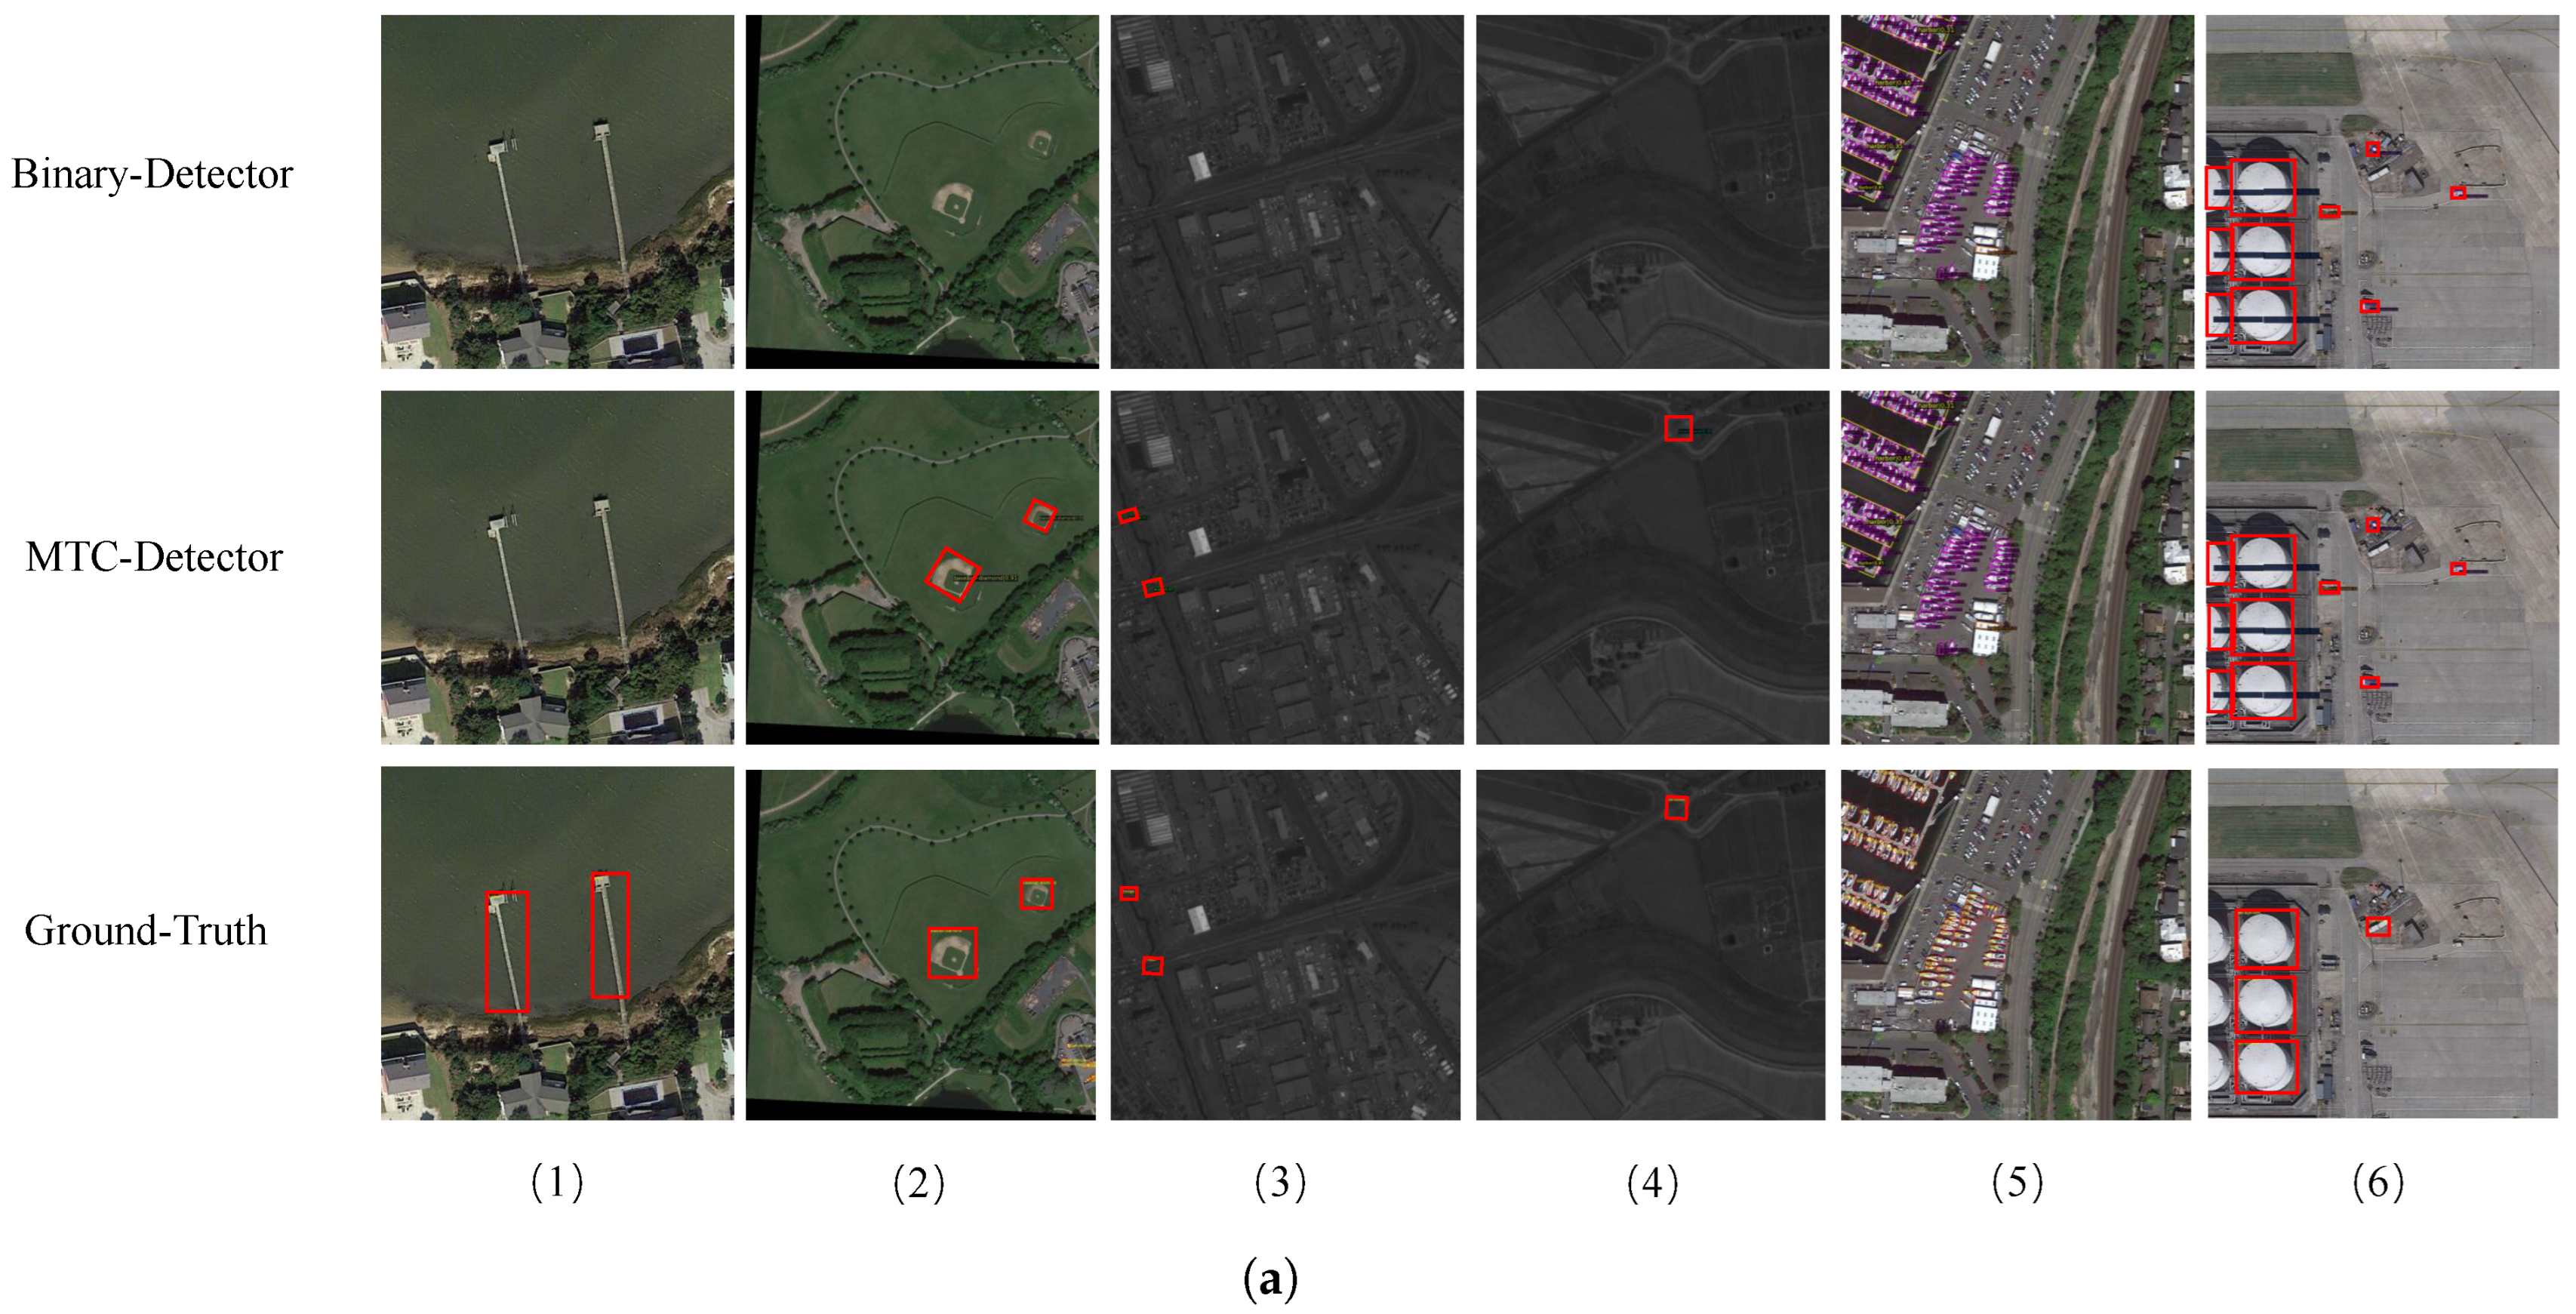
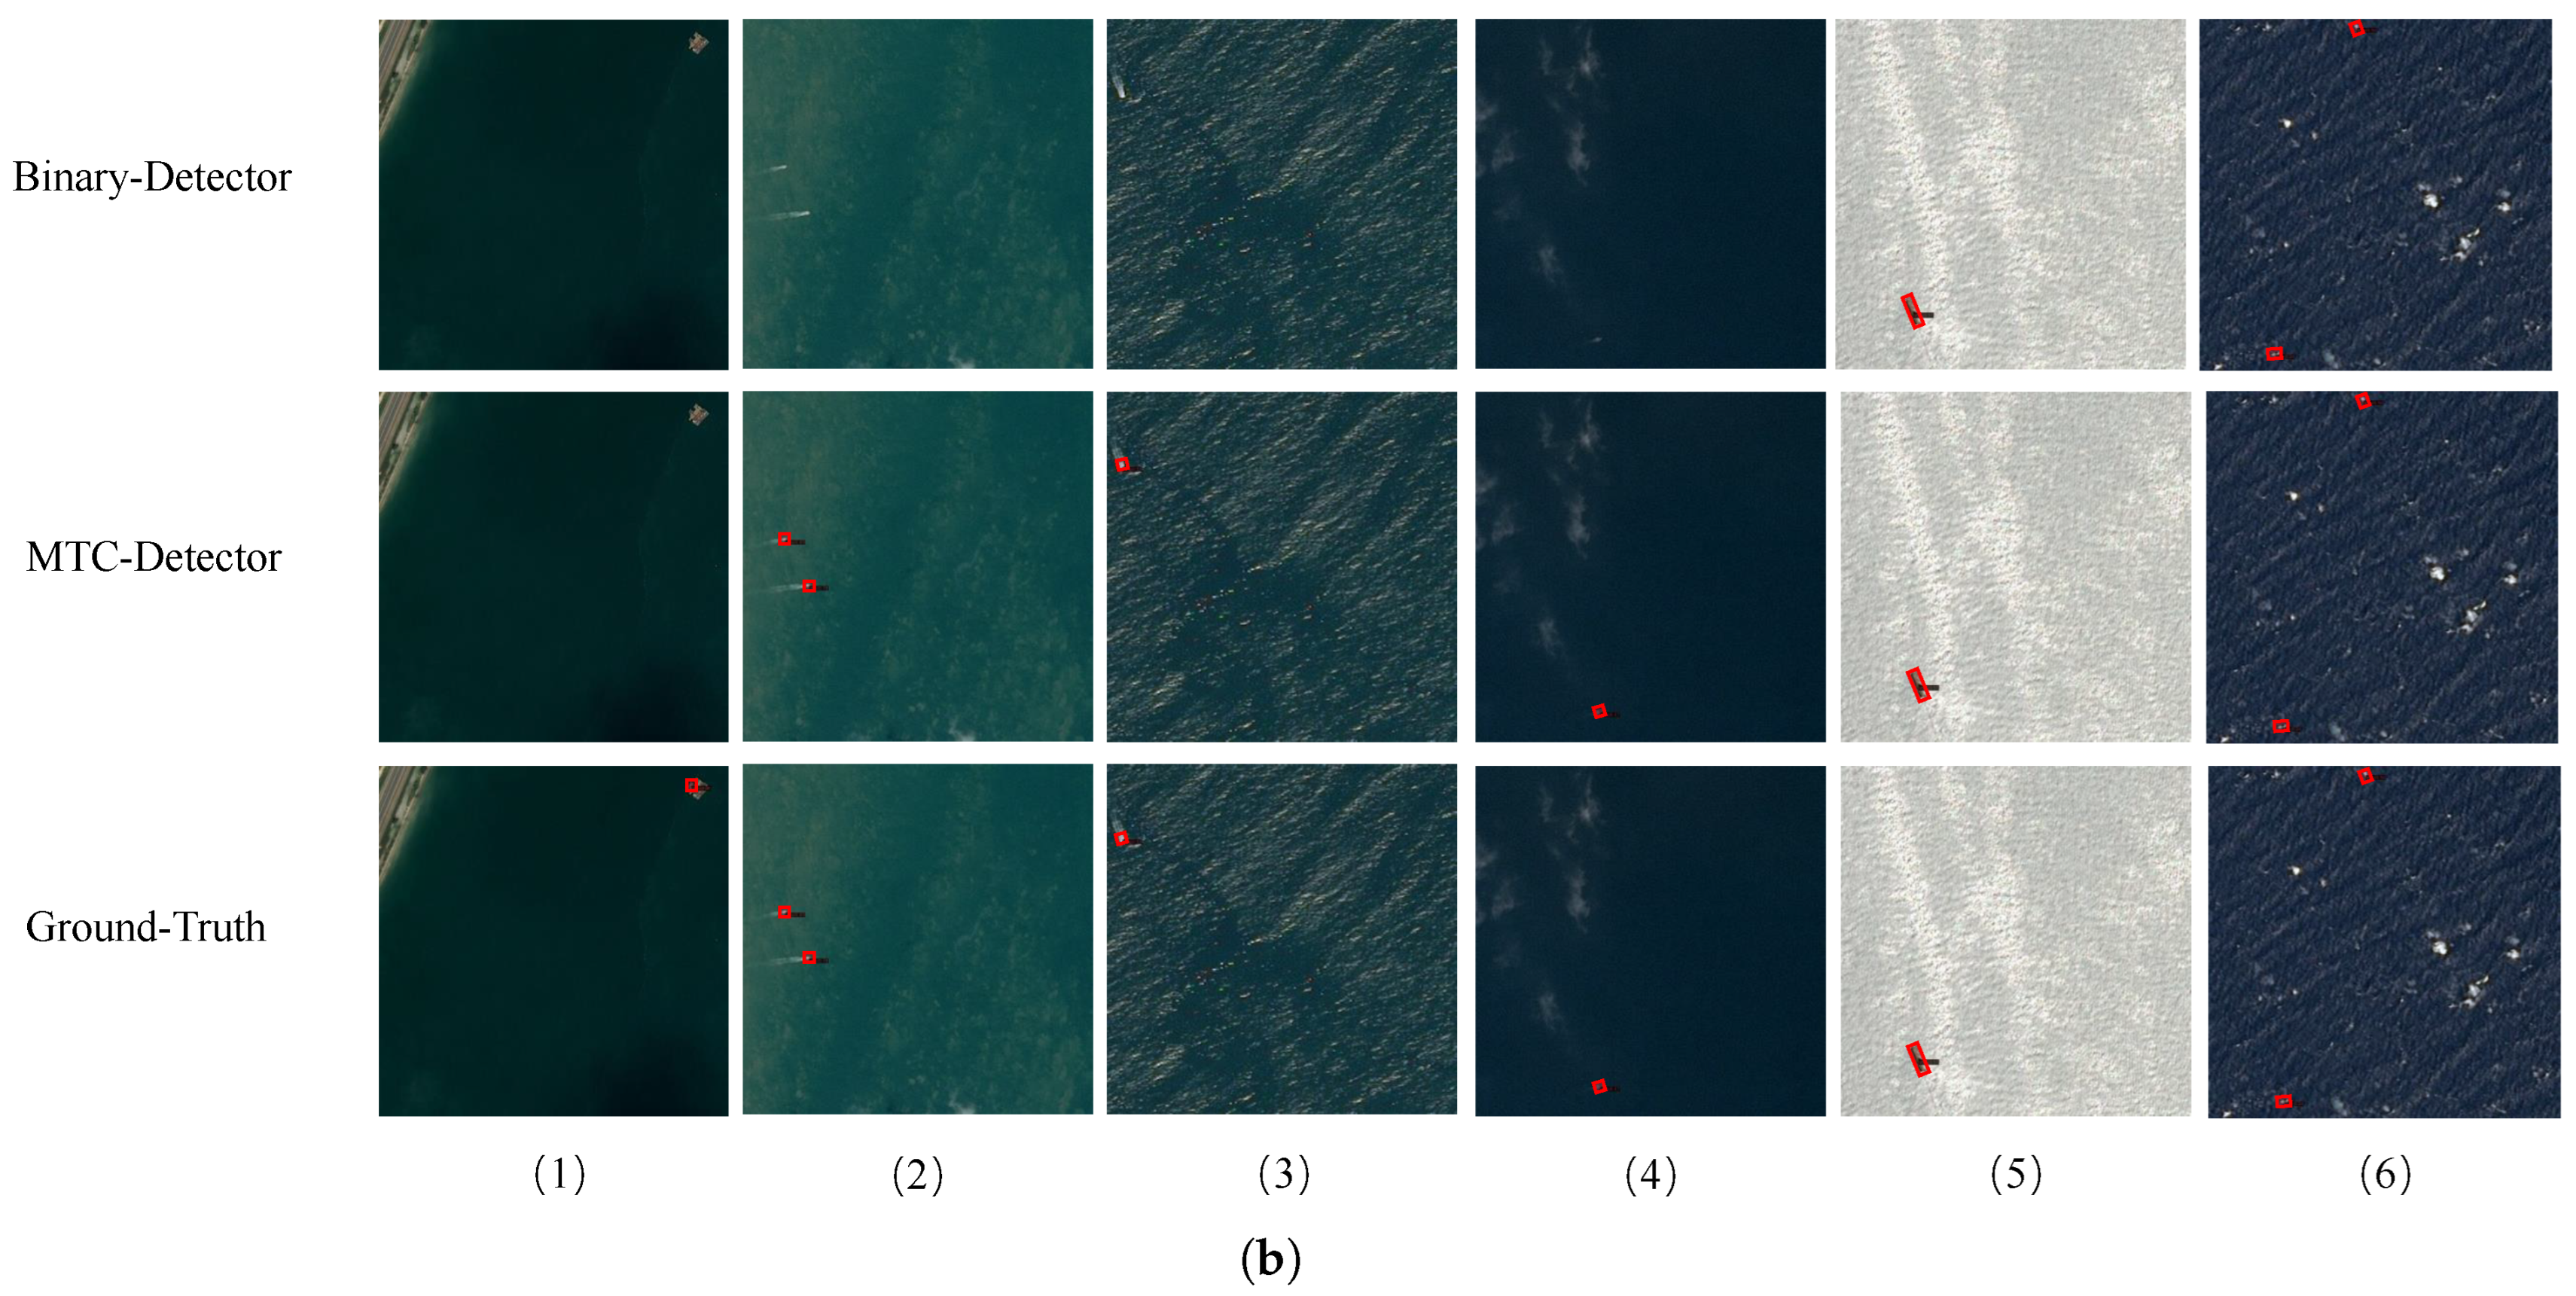
In this study, we propose a multi-task classification-driven object detection method to achieve fast and effective processing of large-scale UAV aerial images. We design a lightweight classification network with a salient region generation branch. By incorporating additional supervisory information and leveraging multi-task learning, our approach improves the classification accuracy in identifying whether aerial image patches contain objects. In addition, we develop a DCL strategy that allows flexible threshold adjustment during inference. Our proposed MTC network can be combined with various detectors without the need for retraining, improving the adaptability and applicability of the detectors. Our MTC-based detector can rapidly identify object-containing regions, focusing computational resources on these areas for further detection. Specifically, the proposed detection method is well suited for scenarios requiring rapid, efficient processing of large-scale UAV aerial imagery with extensive non-object areas. Experimental results demonstrate the effectiveness and efficiency of our proposed method, with detection performance for large aerial images from the DOTA v2.0 dataset slightly decreased while achieving an improvement of over 30% in detection speed. In future research, we will explore combining the proposed MTC with lightweight detectors to enable real-time processing on UAVs.

Author Contributions

Conceptualization, Y.H.; methodology, S.Z.; data curation, Y.H.; writing—original draft preparation, S.Z. and Y.H.; writing—review and editing, D.W.; funding acquisition, S.Z. All authors have read and agreed to the published version of the manuscript.

Funding

This research was funded by the National Natural Science Foundation of China under Grant 62201191 and the Fundamental Research Funds for the Central Universities under Grant JZ2024HGTB0213.

Institutional Review Board Statement

Not applicable.

Informed Consent Statement

Not applicable.

Data Availability Statement

The original data presented in this study are openly available in the DOTA dataset at https://captain-whu.github.io/DOTA/dataset.html (accessed on 20 August 2023) and the ASDD dataset at https://kaggle.com/competitions/airbus-ship-detection (accessed on 10 October 2023).

Acknowledgments

We would like to thank Wuhan University and the Huazhong University of Science and Technology for providing the DOTA dataset and Kaggle for providing the ASDD dataset. We would like to express our sincere gratitude to Gang Wang from the CETC Key Laboratory of Aerospace Information Applications for his valuable contributions to the revisions of this paper.

Conflicts of Interest

The authors declare no conflicts of interest.

References

  1. Zhao, C.; Liu, R.W.; Qu, J.; Gao, R. Deep learning-based object detection in maritime unmanned aerial vehicle imagery: Review and experimental comparisons. Eng. Appl. Artif. Intell. 2024, 128, 107513. [Google Scholar] [CrossRef]
  2. Hu, X.; Zhuang, S. Large-Scale Spatial–Temporal Identification of Urban Vacant Land and Informal Green Spaces Using Semantic Segmentation. Remote Sens. 2024, 16, 216. [Google Scholar] [CrossRef]
  3. Wen, L.; Cheng, Y.; Fang, Y.; Li, X. A comprehensive survey of oriented object detection in remote sensing images. Expert Syst. Appl. 2023, 224, 119960. [Google Scholar] [CrossRef]
  4. Li, K.; Wan, G.; Cheng, G.; Meng, L.; Han, J. Object detection in optical remote sensing images: A survey and a new benchmark. ISPRS J. Photogramm. Remote Sens. 2020, 159, 296–307. [Google Scholar] [CrossRef]
  5. Zhao, X.; Chen, Y. YOLO-DroneMS: Multi-Scale Object Detection Network for Unmanned Aerial Vehicle (UAV) Images. Drones 2024, 8, 609. [Google Scholar] [CrossRef]
  6. Xie, X.; Cheng, G.; Li, Q.; Miao, S.; Li, K.; Han, J. Fewer is more: Efficient object detection in large aerial images. Sci. China Inf. Sci. 2024, 67, 112106. [Google Scholar] [CrossRef]
  7. Ding, J.; Xue, N.; Xia, G.S.; Bai, X.; Yang, W.; Yang, M.Y.; Belongie, S.; Luo, J.; Datcu, M.; Pelillo, M.; et al. Object detection in aerial images: A large-scale benchmark and challenges. IEEE Trans. Pattern Anal. Mach. Intell. 2021, 44, 7778–7796. [Google Scholar] [CrossRef]
  8. Van Etten, A. You only look twice: Rapid multi-scale object detection in satellite imagery. arXiv 2018, arXiv:1805.09512. [Google Scholar]
  9. Jia, H.; Pu, X.; Liu, Q.; Wang, H.; Xu, F. A fast progressive ship detection method for very large full-scene SAR images. IEEE Trans. Geosci. Remote Sens. 2024, 62, 1–15. [Google Scholar] [CrossRef]
  10. Gao, J.; Li, H.; Han, Z.; Wang, S.; Hu, X. Aircraft detection in remote sensing images based on background filtering and scale prediction. In Proceedings of the PRICAI 2018: Trends in Artificial Intelligence: 15th Pacific Rim International Conference on Artificial Intelligence, Nanjing, China, 28–31 August 2018; Springer: Cham, Switzerland, 2018; pp. 604–616. [Google Scholar]
  11. Cao, W.; Xu, G.; Feng, Y.; Wang, H.; Hu, S.; Li, M. Step-by-step: Efficient ship detection in large-scale remote sensing images. IEEE J. Sel. Top. Appl. Earth Obs. Remote Sens. 2024, 17, 13426–13438. [Google Scholar] [CrossRef]
  12. Pang, J.; Li, C.; Shi, J.; Xu, Z.; Feng, H. R2-CNN: Fast Tiny object detection in large-scale remote sensing images. IEEE Trans. Geosci. Remote Sens. 2019, 57, 5512–5524. [Google Scholar] [CrossRef]
  13. Airbus. Airbus Ship Detection Challenge. 2019. Available online: https://www.kaggle.com/c/airbus-ship-detection (accessed on 10 October 2023).
  14. Zhang, G.; Lu, S.; Zhang, W. CAD-Net: A context-aware detection network for objects in remote sensing imagery. IEEE Trans. Geosci. Remote Sens. 2019, 57, 10015–10024. [Google Scholar] [CrossRef]
  15. Wang, C.; Bai, X.; Wang, S.; Zhou, J.; Ren, P. Multiscale visual attention networks for object detection in VHR remote sensing images. IEEE Geosci. Remote Sens. Lett. 2018, 16, 310–314. [Google Scholar] [CrossRef]
  16. Yu, Y.; Yang, X.; Li, J.; Gao, X. A cascade rotated anchor-aided detector for ship detection in remote sensing images. IEEE Trans. Geosci. Remote Sens. 2020, 60, 1–14. [Google Scholar] [CrossRef]
  17. Schilling, H.; Bulatov, D.; Niessner, R.; Middelmann, W.; Soergel, U. Detection of vehicles in multisensor data via multibranch convolutional neural networks. IEEE J. Sel. Top. Appl. Earth Obs. Remote Sens. 2018, 11, 4299–4316. [Google Scholar] [CrossRef]
  18. Liu, S.; Zhang, L.; Lu, H.; He, Y. Center-boundary dual attention for oriented object detection in remote sensing images. IEEE Trans. Geosci. Remote Sens. 2021, 60, 1–14. [Google Scholar] [CrossRef]
  19. Wei, C.; Ni, W.; Qin, Y.; Wu, J.; Zhang, H.; Liu, Q.; Cheng, K.; Bian, H. Ridop: A rotation-invariant detector with simple oriented proposals in remote sensing images. Remote Sens. 2023, 15, 594. [Google Scholar] [CrossRef]
  20. Ming, Q.; Zhou, Z.; Miao, L.; Zhang, H.; Li, L. Dynamic anchor learning for arbitrary-oriented object detection. In Proceedings of the AAAI Conference on Artificial Intelligence, Virtual, 2–9 February 2021; Volume 35, pp. 2355–2363. [Google Scholar]
  21. Qian, X.; Zhang, N.; Wang, W. Smooth giou loss for oriented object detection in remote sensing images. Remote Sens. 2023, 15, 1259. [Google Scholar] [CrossRef]
  22. Xu, Y.; Fu, M.; Wang, Q.; Wang, Y.; Chen, K.; Xia, G.S.; Bai, X. Gliding vertex on the horizontal bounding box for multi-oriented object detection. IEEE Trans. Pattern Anal. Mach. Intell. 2020, 43, 1452–1459. [Google Scholar] [CrossRef]
  23. Qian, W.; Yang, X.; Peng, S.; Yan, J.; Guo, Y. Learning modulated loss for rotated object detection. In Proceedings of the AAAI Conference on Artificial Intelligence, Virtual, 2–9 February 2021; Volume 35, pp. 2458–2466. [Google Scholar]
  24. Ding, J.; Xue, N.; Long, Y.; Xia, G.S.; Lu, Q. Learning RoI transformer for oriented object detection in aerial images. In Proceedings of the IEEE/CVF Conference on Computer Vision and Pattern Recognition, Long Beach, CA, USA, 15–20 June 2019; pp. 2849–2858. [Google Scholar]
  25. Han, J.; Ding, J.; Li, J.; Xia, G.S. Align deep features for oriented object detection. IEEE Trans. Geosci. Remote Sens. 2021, 60, 1–11. [Google Scholar] [CrossRef]
  26. Pan, X.; Ren, Y.; Sheng, K.; Dong, W.; Yuan, H.; Guo, X.; Ma, C.; Xu, C. Dynamic refinement network for oriented and densely packed object detection. In Proceedings of the IEEE/CVF Conference on Computer Vision and Pattern Recognition, Seattle, WA, USA, 13–19 June 2020; pp. 11207–11216. [Google Scholar]
  27. Ming, Q.; Miao, L.; Zhou, Z.; Song, J.; Dong, Y.; Yang, X. Task interleaving and orientation estimation for high-precision oriented object detection in aerial images. ISPRS J. Photogramm. Remote Sens. 2023, 196, 241–255. [Google Scholar] [CrossRef]
  28. Yang, X.; Yang, J.; Yan, J.; Zhang, Y.; Zhang, T.; Guo, Z.; Sun, X.; Fu, K. Scrdet: Towards more robust detection for small, cluttered and rotated objects. In Proceedings of the IEEE/CVF International Conference on Computer Vision, Seoul, Republic of Korea, 27 October–2 November 2019; pp. 8232–8241. [Google Scholar]
  29. Yang, X.; Yan, J.; Feng, Z.; He, T. R3det: Refined single-stage detector with feature refinement for rotating object. In Proceedings of the AAAI Conference on Artificial Intelligence, Virtual, 2–9 February 2021; Volume 35, pp. 3163–3171. [Google Scholar]
  30. Yang, X.; Yan, J.; Ming, Q.; Wang, W.; Zhang, X.; Tian, Q. Rethinking rotated object detection with gaussian wasserstein distance loss. In Proceedings of the International Conference on Machine Learning, Virtual, 18–24 July 2021; pp. 11830–11841. [Google Scholar]
  31. Zhu, Y.; Du, J.; Wu, X. Adaptive period embedding for representing oriented objects in aerial images. IEEE Trans. Geosci. Remote Sens. 2020, 58, 7247–7257. [Google Scholar] [CrossRef]
  32. Zheng, Z.; Zhong, Y.; Ma, A.; Han, X.; Zhao, J.; Liu, Y.; Zhang, L. HyNet: Hyper-scale object detection network framework for multiple spatial resolution remote sensing imagery. ISPRS J. Photogramm. Remote Sens. 2020, 166, 1–14. [Google Scholar] [CrossRef]
  33. Li, Y.; Hou, Q.; Zheng, Z.; Cheng, M.M.; Yang, J.; Li, X. Large selective kernel network for remote sensing object detection. In Proceedings of the IEEE/CVF International Conference on Computer Vision, Paris, France, 1–6 October 2023; pp. 16794–16805. [Google Scholar]
  34. Fu, K.; Chang, Z.; Zhang, Y.; Xu, G.; Zhang, K.; Sun, X. Rotation-aware and multi-scale convolutional neural network for object detection in remote sensing images. ISPRS J. Photogramm. Remote Sens. 2020, 161, 294–308. [Google Scholar] [CrossRef]
  35. Wang, S.; Jiang, H.; Yang, J.; Ma, X.; Chen, J. AMFEF-DETR: An End-to-End Adaptive Multi-Scale Feature Extraction and Fusion Object Detection Network Based on UAV Aerial Images. Drones 2024, 8, 523. [Google Scholar] [CrossRef]
  36. Zhao, Z.; Xue, Q.; He, Y.; Bai, Y.; Wei, X.; Gong, Y. Projecting Points to Axes: Oriented Object Detection via Point-Axis Representation. arXiv 2024, arXiv:2407.08489. [Google Scholar]
  37. Zhang, C.; Su, J.; Ju, Y.; Lam, K.M.; Wang, Q. Efficient inductive vision transformer for oriented object detection in remote sensing imagery. IEEE Trans. Geosci. Remote Sens. 2023. [Google Scholar] [CrossRef]
  38. Chen, L.; Shi, W.; Fan, C.; Zou, L.; Deng, D. A novel coarse-to-fine method of ship detection in optical remote sensing images based on a deep residual dense network. Remote Sens. 2020, 12, 3115. [Google Scholar] [CrossRef]
  39. Li, Y.; Yuan, H.; Wang, Y.; Xiao, C. GGT-YOLO: A novel object detection algorithm for drone-based maritime cruising. Drones 2022, 6, 335. [Google Scholar] [CrossRef]
  40. Ross, T.Y.; Dollar, G. Focal loss for dense object detection. In Proceedings of the IEEE Conference on Computer Vision and Pattern Recognition, Honolulu, HI, USA, 21–26 July 2017; pp. 2980–2988. [Google Scholar]
  41. Si, J.; Song, B.; Wu, J.; Lin, W.; Huang, W.; Chen, S. Maritime ship detection method for satellite images based on multiscale feature fusion. IEEE J. Sel. Top. Appl. Earth Obs. Remote Sens. 2023. [Google Scholar] [CrossRef]
  42. Deng, L.; Bi, L.; Li, H.; Chen, H.; Duan, X.; Lou, H.; Zhang, H.; Bi, J.; Liu, H. Lightweight aerial image object detection algorithm based on improved YOLOv5s. Sci. Rep. 2023, 13, 7817. [Google Scholar] [CrossRef] [PubMed]
  43. Li, L.; Zhang, S.; Wu, J. Efficient object detection framework and hardware architecture for remote sensing images. Remote Sens. 2019, 11, 2376. [Google Scholar] [CrossRef]
  44. Li, X.; Wang, S. Object detection using convolutional neural networks in a coarse-to-fine manner. IEEE Geosci. Remote Sens. Lett. 2017, 14, 2037–2041. [Google Scholar] [CrossRef]
  45. Li, C.; Yang, T.; Zhu, S.; Chen, C.; Guan, S. Density map guided object detection in aerial images. In Proceedings of the IEEE/CVF Conference on Computer Vision and Pattern Recognition Workshops, Seattle, WA, USA, 14–19 June 2020; pp. 190–191. [Google Scholar]
  46. Meethal, A.; Granger, E.; Pedersoli, M. Cascaded zoom-in detector for high resolution aerial images. In Proceedings of the IEEE/CVF Conference on Computer Vision and Pattern Recognition, Vancouver, BC, Canada, 17–24 June 2023; pp. 2046–2055. [Google Scholar]
  47. Zhang, R.; Luo, B.; Su, X.; Liu, J. GA-Net: Accurate and Efficient Object Detection on UAV Images Based on Grid Activations. Drones 2024, 8, 74. [Google Scholar] [CrossRef]
  48. Hua, X.; Wang, X.; Rui, T.; Zhang, H.; Wang, D. A fast self-attention cascaded network for object detection in large scene remote sensing images. Appl. Soft Comput. 2020, 94, 106495. [Google Scholar] [CrossRef]
  49. Tan, M.; Le, Q. Efficientnetv2: Smaller models and faster training. In Proceedings of the International Conference on Machine Learning, Virtual, 18–24 July 2021; pp. 10096–10106. [Google Scholar]
  50. Yacouby, R.; Axman, D. Probabilistic extension of precision, recall, and f1 score for more thorough evaluation of classification models. In Proceedings of the First Workshop on Evaluation and Comparison of NLP Systems, Online, 20 November 2020; pp. 79–91. [Google Scholar]
  51. Xia, G.S.; Bai, X.; Ding, J.; Zhu, Z.; Belongie, S.; Luo, J.; Datcu, M.; Pelillo, M.; Zhang, L. DOTA: A large-scale dataset for object detection in aerial images. In Proceedings of the IEEE Conference on Computer Vision and Pattern Recognition, Salt Lake City, UT, USA, 18–23 June 2018; pp. 3974–3983. [Google Scholar]
  52. Chen, Z.; Chen, K.; Lin, W.; See, J.; Yu, H.; Ke, Y.; Yang, C. Piou loss: Towards accurate oriented object detection in complex environments. In Proceedings of the Computer Vision—ECCV 2020: 16th European Conference, Glasgow, UK, 23–28 August 2020; Springer: Cham, Switzerland, 2020; pp. 195–211. [Google Scholar]
  53. Yang, X.; Hou, L.; Zhou, Y.; Wang, W.; Yan, J. Dense label encoding for boundary discontinuity free rotation detection. In Proceedings of the IEEE/CVF Conference on Computer Vision and Pattern Recognition, Nashville, TN, USA, 20–25 June 2021; pp. 15819–15829. [Google Scholar]
  54. Yang, S.; Pei, Z.; Zhou, F.; Wang, G. Rotated faster R-CNN for oriented object detection in aerial images. In Proceedings of the 2020 3rd International Conference on Robot Systems and Applications, Chengdu, China, 14–16 June 2020; pp. 35–39. [Google Scholar]
  55. Xie, X.; Cheng, G.; Wang, J.; Yao, X.; Han, J. Oriented R-CNN for object detection. In Proceedings of the IEEE/CVF International Conference on Computer Vision, Montreal, QC, Canada, 10–17 October 2021; pp. 3520–3529. [Google Scholar]
  56. He, K.; Zhang, X.; Ren, S.; Sun, J. Deep residual learning for image recognition. In Proceedings of the IEEE Conference on Computer Vision and Pattern Recognition, Las Vegas, NV, USA, 27–30 June 2016; pp. 770–778. [Google Scholar]
  57. Howard, A.; Sandler, M.; Chu, G.; Chen, L.C.; Chen, B.; Tan, M.; Wang, W.; Zhu, Y.; Pang, R.; Vasudevan, V.; et al. Searching for mobilenetv3. In Proceedings of the IEEE/CVF International Conference on Computer Vision, Seoul, Republic of Korea, 27 October–2 November 2019; pp. 1314–1324. [Google Scholar]
  58. Ma, N.; Zhang, X.; Zheng, H.T.; Sun, J. Shufflenet v2: Practical guidelines for efficient cnn architecture design. In Proceedings of the European Conference on Computer Vision (ECCV), Munich, Germany, 8–14 September 2018; pp. 116–131. [Google Scholar]
Figure 1. Different strategies’ object detection in large-scale UAV aerial imagery. (a) An original large-scale aerial image from the DOTA v2.0 dataset. (b) Image patches. (c) Four different detection strategies. (1) Detecting each image patch individually, (2) adding a classification branch to the detector to determine whether an image patch contains objects, (3) using a classifier to first determine whether the objects are present before performing detection, and (4) our proposed classification-driven detector: determining whether the objects are present before detection with multi-task optimization.
Drones 09 00029 g001
Figure 2. Overview of the proposed multi-task classification (MTC) network for efficient object detection in large-scale UAV aerial imagery.
Drones 09 00029 g002
Figure 3. The generation of Gaussian distribution-based salient regions: (a) example of salient region generation for a ship in an image patch from the ASDD dataset; (b) example of salient region generation for planes in an image patch from the DOTA v1.0 dataset.
Drones 09 00029 g003
Figure 4. Examples of detection results based on a binary classification model and a multi-task classification model: (a) detection results of different classification-based detectors in the DOTA dataset; (b) detection results of different classification-based detectors in the ASDD dataset. (1), (2), (3), (4), (5), and (6) represent different image examples. The red boxes in the images indicate the object bounding boxes.
Drones 09 00029 g004aDrones 09 00029 g004b
Figure 5. Results on large-scale aerial images. (a) An aerial image of urban areas and corresponding detection results. (b) An aerial image of inshore areas and corresponding detection results.
Drones 09 00029 g005
Figure 6. Visualization of feature maps from two different classifiers: binary classifier and MTC network. (ac) are from the DOTA v1.0 dataset. (d,e) are from the ASDD dataset. In the classification results, orange text represents false classification and blue text represents true classification.
Drones 09 00029 g006
Figure 7. The speed–accuracy trade-off curve in the ASDD dataset.
Drones 09 00029 g007
Table 1. Performance evaluation results of classifiers with different design modules on the DOTA v1.0 dataset. The value in parentheses represents an improvement/deterioration of mAP or FPS compared with the original detector.
MethodsmAP (%)FPS (fps)
RetinaNet-O (Detector)68.423.0
Binary-RetinaNet-O (T = 0.5)45.943.2
Binary-RetinaNet-O (DCT)59.129.7
MTC-RetinaNet-O (T = 0.5)49.636.3
MTC-RetinaNet-O (DCT)65.1 (−3.3)23.9 (+0.9)
Oriented RCNN (Detector)75.722.6
Binary-Oriented RCNN (T = 0.5)53.839.1
Binary-Oriented RCNN (DCT)64.729.3
MTC-Oriented RCNN (T = 0.5)55.435.0
MTC-Oriented RCNN (DCT)72.0 (−3.7)23.2 (+0.6)
Table 2. Performance evaluation results of classifiers with different design modules on the ASDD dataset. The value in parentheses represents an improvement/deterioration of AP, AP50, AP75, or FPS compared with the original detector.
MethodsAP (%)AP50 (%)AP75 (%)FPS (fps)
RetinaNet-O (Detector)36.872.433.129.8
Binary-RetinaNet-O (DCT)34.466.132.874.9
MTC-RetinaNet-O (DCT)35.9 (−0.9)66.7 (−5.7)33.3 (+0.2)71.0 (+41.2)
Oriented RCNN (Detector)46.578.049.222.8
Binary-Oriented RCNN (DCT)43.070.347.564.9
MTC-Oriented RCNN (DCT)45.3 (−1.2)77.5 (−0.5)49.0 (−0.2)61.1 (+38.3)
Table 3. Comparisons of different one-stage object detection methods on the DOTA v1.0 test set. The values in the table, except for mAP and FPS in the last two columns, represent AP.
MethodsPLBDBRGTFSVLVSHTCBC
DRN [26]88.9180.2243.5263.3573.4870.6984.9490.1483.85
PIoU [26]80.9069.7024.1060.2038.3064.4064.8090.9077.20
DAL [20]88.6876.5545.0866.8067.0076.7679.7490.8479.54
R3Det [29]88.7683.0950.9167.2776.2380.3986.7290.7884.68
DCL [53]89.1084.1350.1573.5771.4858.1378.0090.8986.64
GWD [30]88.9377.0945.8569.3072.5564.0776.3590.8779.19
RetinaNet-O [40]89.4176.8340.9167.5877.5162.6677.5390.8982.34
MTC-RetibaNet-O88.7358.7234.7858.1677.0862.4977.3290.8982.38
S2ANet [25]89.2381.1851.5771.4678.6177.3786.7690.9086.28
MTC-S2ANet88.1559.5541.9961.5978.3876.9879.9990.9086.40
MethodsSTSBFRAHASPHCmAP (%)FPS (fps)
DRN [26]84.1150.1258.4167.6268.6052.5070.70-
PIoU [26]70.4046.5037.1057.1061.9064.0060.50-
DAL [20]78.4557.7162.2769.0573.1460.1171.44-
R3Det [29]84.6861.9861.3566.9170.6353.9473.74-
DCL [53]86.7867.9767.2565.6374.0667.0574.06-
GWD [30]80.4657.6864.3863.6164.7548.2569.55-
RetinaNet-O [40]81.9958.1561.5656.4663.7038.9768.4323.0
MTC-RetibaNet-O81.2755.1653.1253.7663.7939.0165.1123.9
S2ANet [25]84.6561.2465.6766.0767.5950.1973.9220.7
MTC-S2ANet83.6556.8758.8165.5367.6050.2969.7721.8
Table 4. Comparisons of different two-stage object detection methods on the DOTA v1.0 test set. The values in the table, except for mAP and FPS in the last two columns, represent AP.
MethodsPLBDBRGTFSVLVSHTCBC
SCRDet [28]89.9880.6552.0968.3668.3660.3272.4190.8587.94
Faster RCNN-O [54]89.2582.4050.0169.3778.1773.5585.9390.9084.09
MTC-Faster RCNN-O87.7860.9241.3160.7777.9673.4879.3990.9084.22
Gliding Vertex [22]89.2175.7751.3269.5278.1075.6086.8890.9085.41
MTC-Gliding Vertex87.7459.9641.9860.4277.8575.5379.6090.9085.54
Oriented RCNN [55]89.3581.4252.7275.0379.0382.3887.8290.9086.42
MTC-Oriented RCNN88.3160.3744.2864.1778.7982.1387.7890.8986.51
MethodsSTSBFRAHASPHCmAP (%)FPS (fps)
SCRDet [28]86.8665.0266.6866.2568.2465.2172.61-
Faster RCNN-O [54]85.5057.5760.9766.2569.2357.7473.4023.0
MTC-Faster RCNN-O84.8753.6553.5266.1869.2457.7769.4623.9
Gliding Vertex [22]84.7753.4866.6566.3169.9954.4073.2223.4
MTC-Gliding Vertex84.1152.1759.4166.6070.0054.4069.7324.5
Oriented RCNN [55]85.2963.3665.6768.2770.4757.2175.6922.6
MTC-Oriented RCNN85.0258.5457.0268.2170.4857.2571.9823.6
Table 5. Comparisons of different object detection methods in 6 large-scale aerial images from the DOTA v2.0 test set. The value in parentheses represents an improvement/deterioration of mAP or FPS compared with the original detector.
MethodsmAP (%)FPS (fps)
RetinaNet-O13.523.5
RetinaNet-O + MTC11.7 (−1.8)30.9 (+7.4)
S2ANet13.321.4
S2ANet + MTC11.5 (−1.8)28.7 (+7.3)
Faster RCNN-O13.924.2
Faster RCNN-O + MTC12.3 (−1.6)31.6 (+7.4)
Oriented RCNN14.422.8
Oriented RCNN + MTC12.3 (−1.1)30.1 (+7.3)
Table 6. Comparisons of different object detection methods in the ASDD dataset. The value in parentheses represents an improvement/deterioration of AP or FPS compared with the original detector.
MethodsAP (%)AP50 (%)AP75 (%)FPS (fps)
RetinaNet-O36.872.433.129.8
RetinaNet-O + MTC35.9 (−0.9)66.733.371.0 (+41.2)
S2ANet43.178.641.320.7
S2ANet + MTC42.4 (−0.7)77.941.357.6 (+36.9)
RoI Transformer40.277.538.321.2
RoI Transformer + MTC39.3 (−0.9)70.538.058.5 (+37.3)
Oriented RCNN46.578.049.222.8
Oriented RCNN + MTC45.3 (−1.2)77.549.061.1 (+38.3)
Table 7. Analysis of performance differences across various datasets. The value in parentheses represents an improvement/deterioration of mAP/AP or FPS compared with the original RetinaNet-O detector.
DatasetNumber of Object ClassesmAP/AP (%)Number of Testing Image PatchesNumber of Image Patches Without ObjectRatio of Images Without Object (%)FPS (fps)
DOTA v1.01565.1 (−3.3)10,833207219.123.9 (+0.9)
DOTA v2.01811.7 (−1.8)7340301841.130.9 (+7.4)
ASDD135.9 (−0.9)38,51129,99077.971.0 (+41.2)
Table 8. Performance analysis of different backbone networks in the ASDD dataset.
MethodsBackboneAP (%)AP50 (%)AP75 (%)FPS (fps)GFLOPs
RetinaNet-O + MTCResNet50 [56]33.965.832.762.0184.6
RetinaNet-O + MTCMobileNetV3 [57]35.866.633.282.810.6
RetinaNet-O + MTCShuffleNetV2 [58]34.566.133.179.841.1
RetinaNet-O + MTCEfficientNetV2 [49]35.966.733.371.040.4
Table 9. Comparisons of detection performances in the ASDD dataset with different classification thresholds.
ThresholdAP (%)FPS (fps)
0.1046.420.1
0.1546.421.5
0.2046.424.7
0.2546.429.4
0.3045.935.4
0.3545.942.9
0.4045.850.6
0.4545.357.7
0.5045.361.1
0.5544.463.0
0.6043.765.1
0.6542.567.4
0.7041.171.0
0.7539.475.6
0.8035.983.4
0.8528.897.6
0.9020.1120.7
0.9512.5139.6
1.000.0150.0
Disclaimer/Publisher’s Note: The statements, opinions and data contained in all publications are solely those of the individual author(s) and contributor(s) and not of MDPI and/or the editor(s). MDPI and/or the editor(s) disclaim responsibility for any injury to people or property resulting from any ideas, methods, instructions or products referred to in the content.

