Article

Wind Tunnel Investigation of the Icing of a Drone Rotor in Forward Flight

1
Department of Applied Sciences, University of Québec in Chicoutimi, 555 Boulevard de l’Université, Chicoutimi, QC G7H2B1, Canada
2
Bell Textron Canada Limited, 12 800 rue de l’Avenir, Mirabel, QC J7J1R4, Canada
*
Author to whom correspondence should be addressed.
Drones 2024, 8(8), 380; https://doi.org/10.3390/drones8080380
Submission received: 26 June 2024 / Revised: 27 July 2024 / Accepted: 31 July 2024 / Published: 7 August 2024

Abstract

The Bell Textron APT70 is a UAV concept developed for last mile delivery and other usual applications. It performs vertical takeoff and transition into aircraft mode for forward flight. It includes four rotor each with four rotating blades. A test campaign has been performed to study the effects of ice accretion on rotor performance through a parametric study of different parameters, namely MVD, LWC, rotor speed, and pitch angle. This paper presents the last experimentations of this campaign for the drone rotor operating in forward flight under simulated icing conditions in a refrigerated, closed-loop wind tunnel. Results demonstrated that the different parameters studied greatly impacted the collection efficiency of the blades and thus, the resulting ice accretion. Smaller droplets were more easily influenced by the streamlines around the rotating blades, resulting in less droplets impacting the surface and thus slower ice accumulations. Higher rotation speeds and pitch angles generated more energetic streamlines, which again transported more droplets around the airfoils instead of them impacting on the surface, which also led to slower accumulation. Slower ice accumulation resulted in slower thrust losses, since the loss in performances can be directly linked to the amount of ice accreted. This research has not only allowed the obtainment of very insightful results on the effect of each test parameter on the ice accumulation, but it has also conducted the development of a unique test bench for UAV propellers. The new circular test sections along with the new instrumentation installed in and around the tunnel will allow the laboratory to be able to generate icing on various type of UAV in forward flight under representative atmospheric conditions.

1. Introduction

Unmanned Aerial Vehicles (UAVs) are now considered a primordial part of commercial operations, offering diverse applications across sectors such as deliveries, search and rescue, environmental monitoring, and agriculture [1,2]. Additionally, armed forces globally employ UAVs for their lightweight, ease of deployment, and operational flexibility, capitalizing on their strategic advantages [3]. In recent years, there has been a significant surge in the utilization of Unmanned Aerial Vehicles (UAVs) and drones across military, commercial, and recreational domains [4]. The majority of small-to-medium-sized UAVs rely on propellers for propulsion, driven by electric motors powered by onboard batteries [5]. Up until 2020, nearly a million drones had been registered by the FAA for both personal and commercial purposes, with continued increases anticipated [4]. More than a third of these registered drones are intended for commercial use. However, freezing atmospheric conditions pose a significant threat to their operation. In-flight icing presents a major hazard for aircraft, including rotorcraft and UAVs, prompting substantial concern among certification authorities [6]. The literature shows that icing studies have been vigorously conducted in the past for fixed-wing aircraft [7,8,9,10,11,12,13] and helicopter rotors [7,14,15,16,17,18,19,20,21]. For instance, Narducci and Kreeger developed a sophisticated method to assess ice buildup on a helicopter flying through icing clouds, both in hover [20] and forward flight [21]. Chen et al. conducted CFD simulations and optimization analyses for rotor anti-icing strategies using big data analytics [22]. These examples are just a few among numerous studies in the literature. However, research on icing and de-icing for smaller UAVs and drones remains scarce, prompting government agencies to advocate for increased investigation in this area [1,23,24]. Rotary-wing UAVs are particularly vulnerable to icing conditions compared to their fixed-wing counterparts, primarily due to their high rotational speeds, compact size, and limited battery capacity [25]. Icing affects all types of UAVs, but for those with rotors, ice accumulation directly reduces lift and thrust, increases drag and torque, induces severe rotor vibrations, and can lead to potential crashes [26,27]. When exposed to icing conditions in-flight, those UAVs are at risk of loss of control and crash. Siquig conducted one of the initial studies on UAV icing, comparing ice accumulation effects on two UAVs with different operational parameters such as altitude and range [26]. Bottyán [28] proposed a numerical technique based on the 2D Messinger icing model to predict ice accretion on UAV wing profiles, albeit not specifically for rotating blades. Szilder and McIlwain [29] introduced an analytical model for predicting glaze and rime ice formation on a NACA 0012 airfoil, tailored for fixed-wing UAV applications using CFD computations. A CFD was used for the computation of the flow field at the different Reynolds number investigated in order to calculate the Stanton number. Computation of the collection efficiency was made with a droplet trajectory solver at each of the given droplet sizes and the prediction of the ice accretion shape was obtained with a morphogenetic model. Armanini et al. [30] developed the Icing-Related Decision-Making System (IRDMS), which monitors aircraft performance changes and environmental conditions in-flight to assess icing effects and determine when ice protection systems should be activated. Liu. et al. conducted experiments in an icing wind tunnel (IWT) to study transient ice accumulation on UAV propellers, measuring changes in thrust, torque, and power consumption under various icing conditions [24]. The transient ice accumulation process was tracked for a large variety of atmospheric icing conditions, also measuring differences the thrust, torque and power consumption generated by the rotor. Their findings indicated that ice accumulation could lead to up to 70% loss in thrust and up to 250% increase in power consumption compared to pre-icing operation. They also investigated the impact of hydrophilic and superhydrophobic coatings on ice accretion and found that superhydrophobic coatings significantly reduced ice buildup, mitigated thrust loss, and required less additional power compared to hydrophilic coatings [23]. Hann, at the NTNU in Norway, has also recently started investigating the icing of drones and published on the subject with different collaborators [31,32,33]. He investigated the icing on a drone rotor with thermal ice protection, demonstrating that the system could prevent thrust penalties at warmer temperatures while limiting those penalties at lower temperatures [34]. He also developed and validated a numerical model of the ice protection system with ANSYS FENSAP-ICE [35,36].
This paper presents the final experimentation performed during the investigation of the icing of the Bell Textron APT-70 drone rotor. In this work, the icing accumulation, as well as its effect on the rotor performances, are studied in an icing wind tunnel to simulate atmospheric icing of the rotor during forward flight. Previous testing in this comprehensive investigation was mainly performed in a cold room to measure the impact of ice during takeoff of the drone and in hover flight [37,38,39,40,41]. With the objective of studying the icing effects on drone rotor in forward flight, this project will allow the understanding of the accumulation of ice, and its consequences on the rotor performances, to improve the existing testing capabilities for future work and refine the measurement methods at the laboratory.

2. Materials and Methods

2.1. Icing Wind Tunnel

Testing was conducted in AMIL’s icing wind tunnel (IWT), which is a low-speed refrigerated closed-loop system measuring 3.5 m by 9.5 m in size (Figure 1). The test section features a circular cross-section with a diameter of 0.9 m and a length of 1.2 m. The refrigeration system can regulate air temperatures ranging from −40 to 22 °C. A 50 hp motor drives the fan, enabling airspeeds of up to 40 m/s in the 0.64 m² cross-sectional area.
To simulate atmospheric icing conditions, a spraying system is used in the wind tunnel, comprising three vertically stacked spray ramps positioned upstream of the test section. The top and bottom ramps are identical, each equipped with 8 equally spaced nozzles, while the middle ramp features 9 staggered nozzles compared to those on the top and bottom ramps. This setup allows the system to achieve Liquid Water Contents (LWC) ranging from 0.2 to 8.0 g/m3 and Median Volumetric Diameters (MVD) of water droplets from 20 to 100 µm. Deionized water is supplied to the system from a pressurized refrigerated tank. The wind tunnel complies with the Society of Automotive Engineers (SAE) Aerospace Recommended Practice ARP5905 for icing wind tunnels [42] and Aerospace Information Report for droplets sizing AIR4906 [43]. A refrigerated chamber surrounds the test section, maintaining a constant temperature as low as −30 °C during and after testing. This setup enables measurements and inspections of the ice accumulation outside the wind tunnel without compromising the integrity of the accumulated ice layers.

2.2. UAV Drone Rotor Setup

The drone rotor is an 81% scaled-down replica of the Bell Textron APT70 drone rotor. It features four blades, each measuring 25.4 cm in length and utilizing a NACA 4412 aerodynamic profile. These blades are constructed from two carbon epoxy skins bonded along the midplane, enclosing a hollow core. The chord length c varies from the root to the tip and is expressed in meters by
c = 0.27 r 4 + 0.79 r 3 0.84 r 2 + 0.34 r + 0.001
with r as the adimensional radial position. The blade also has a variable twist angle for optimized lift redistribution, with the angle in degrees specified by
ϕ = 65.19 r 3 + 169.58 r 2 161.36 r + 68.50
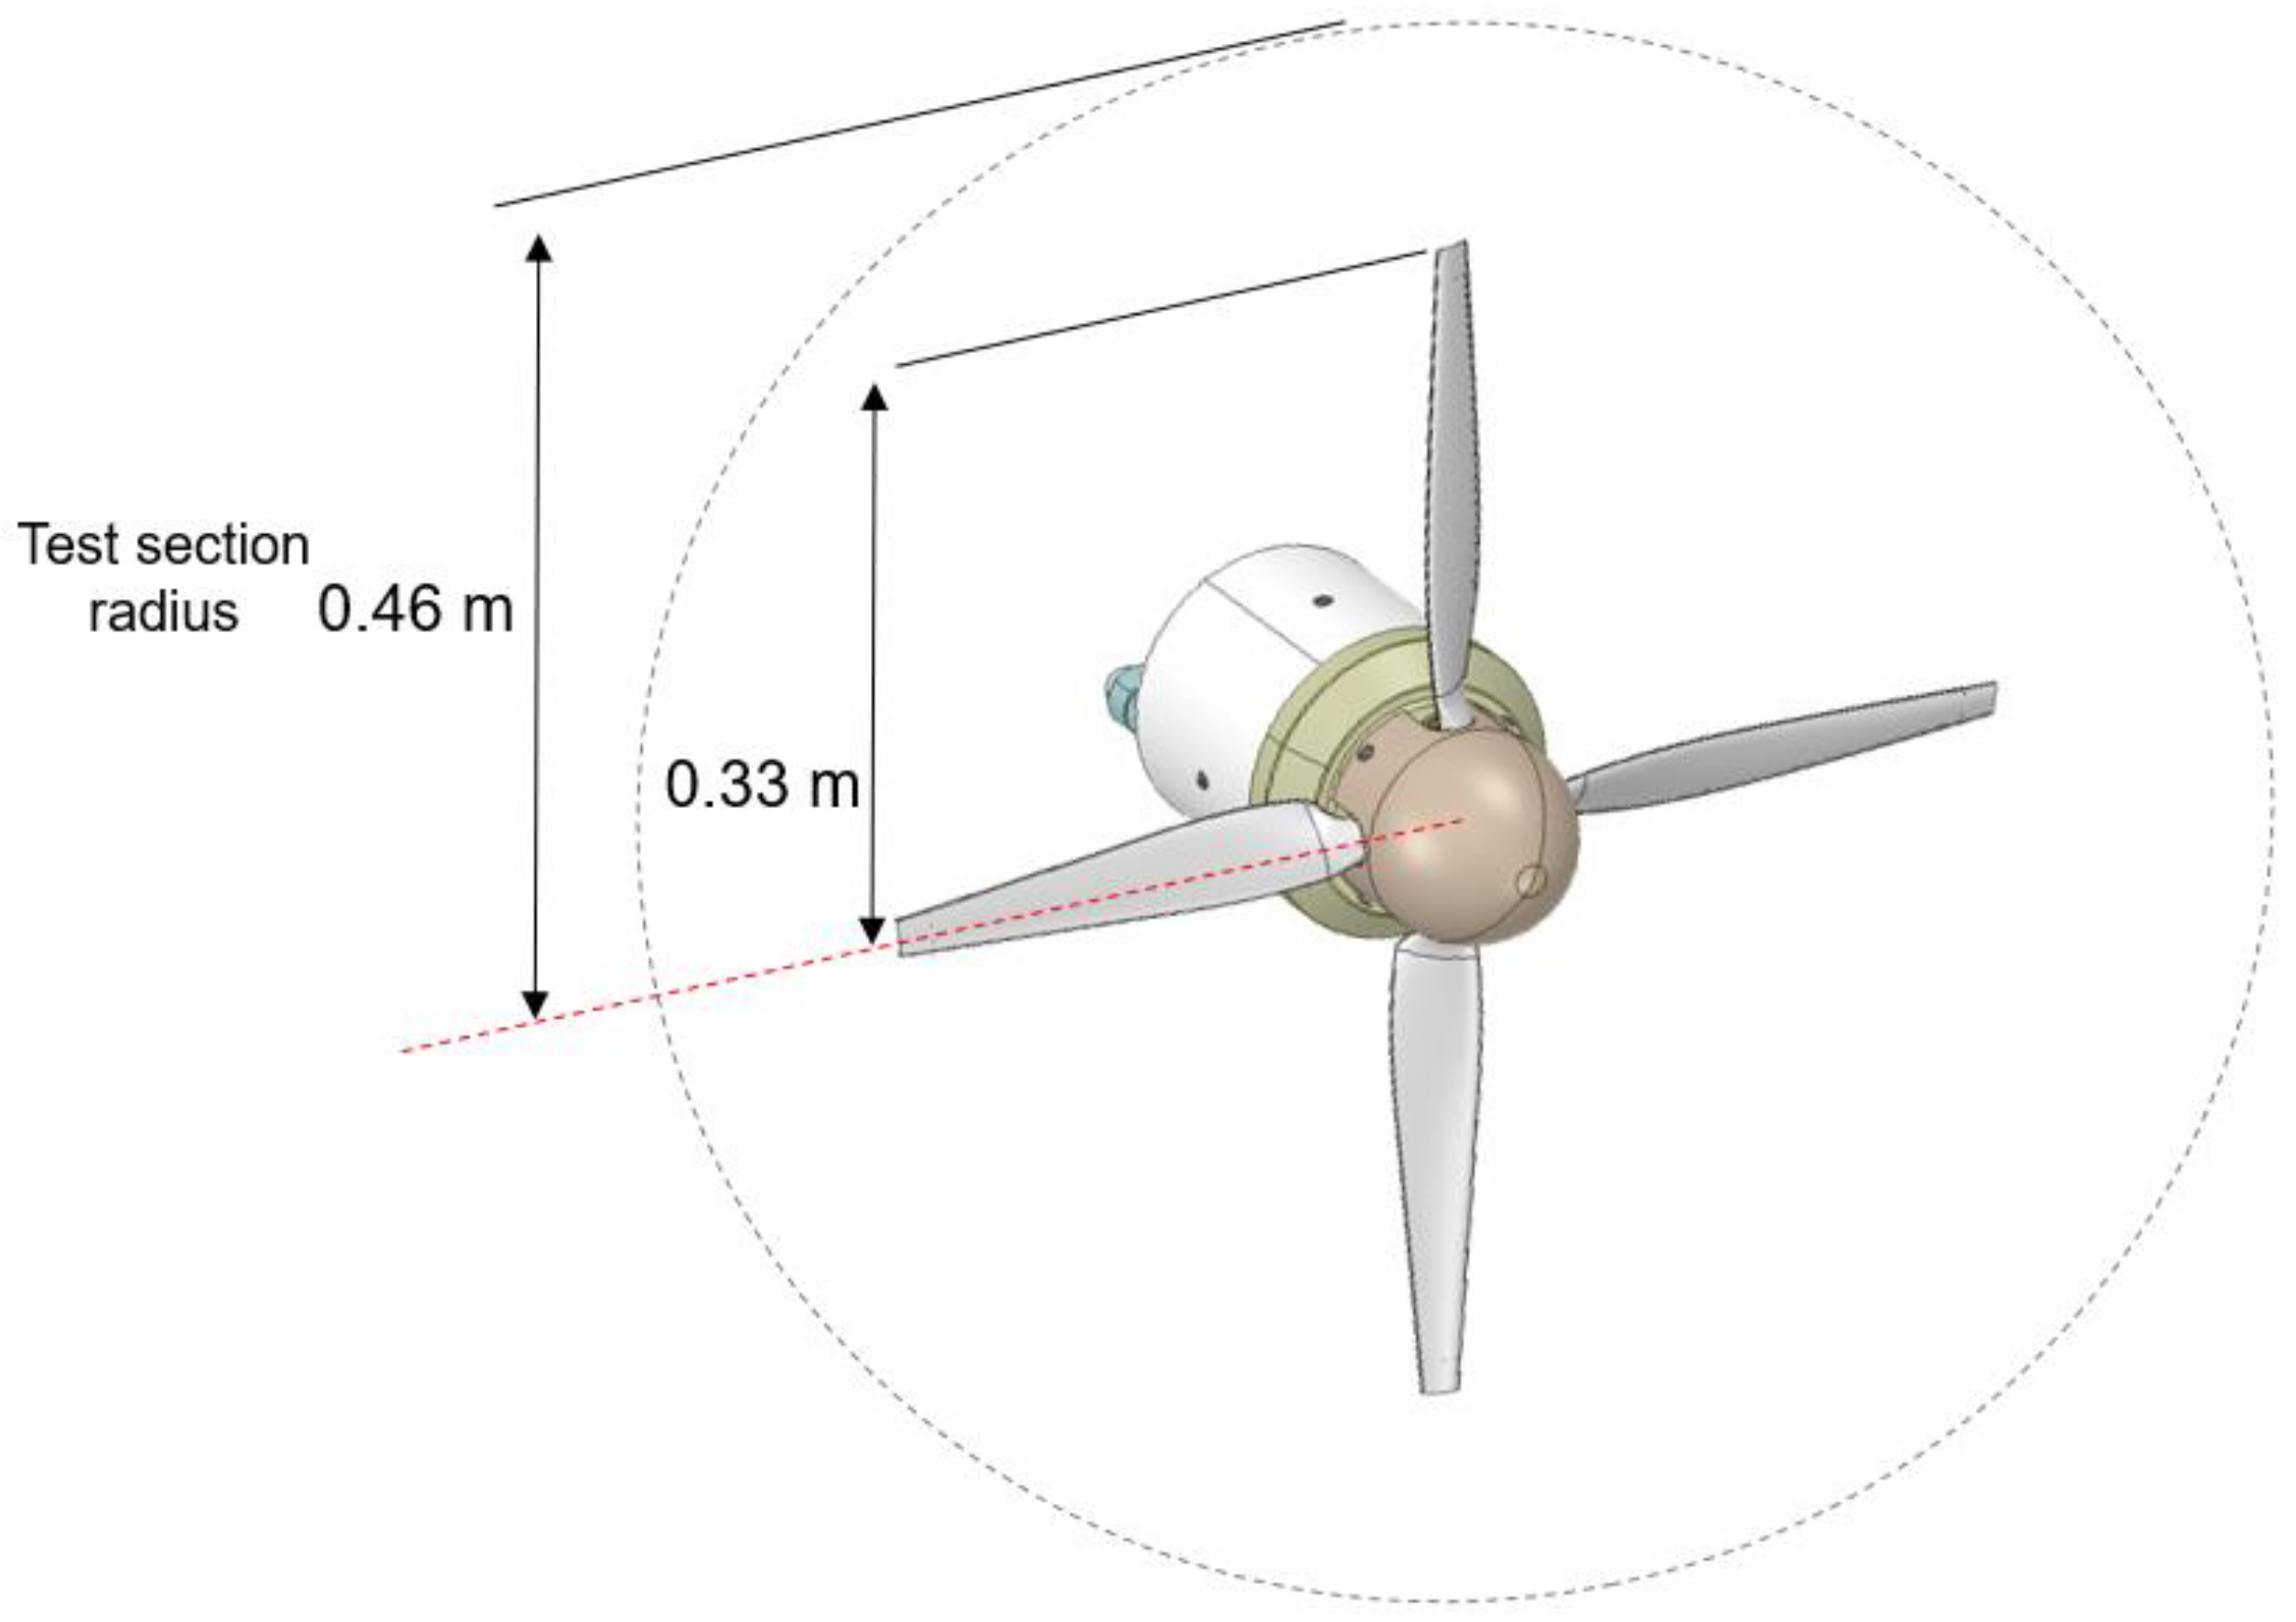
The total radius of the rotor is 0.33 m and is driven by a 12 kW Hacker Q150-45-4 brushless motor (Hacker Motor GmbH, Ergolding, Germany) installed behind the hub (Figure 2). It uses a 15 kW TDK-Lambda model GEN3U power supply (TDK-Lambda, Ilfracombe, UK) with an HBC 280120-3 electric speed controller (MGM Compro, Zlín, Czech Republic).
The rotor assembly is securely mounted at the center of the wind tunnel’s circular test section using a welded cross assembly made of ¼ inch thick steel plating, as illustrated in Figure 3. A two-axis Futek MBA-FSH04262 load cell is positioned between the support and the motor to measure thrust during test runs. An Endevco® model 7254A-100 piezoelectric accelerometer (PCB Piezotronics, Depew, NY, USA) is attached to the motor casing to monitor and measure vibration levels during operation. The rotor is controlled to maintain a constant target RPM despite external perturbations. The rotational speed is measured using Hall effect sensors, and a control program and user interface were developed in Labview™. During a test, ice affects the lift and drag generated from the rotor blades, which affect global thrust and torque. The control loop adjusts the power provided to the rotor based on feedback from the Hall effect sensors. The power consumption constantly increased during testing in order to maintain a constant RPM. Since ice accumulation steadily increased, it was more difficult to maintain the rotation speed due to the impact of the ice on the aerodynamic profile of the blades, which explains the increase in power throughout the tests.

2.3. Test Parameters

The conditions targeted for this study were taken from the continuous icing envelope between sea level and 10,000 ft described in the FAA Advisory Circular 29-2C [44] for the certification of transport category rotorcraft. The conditions were selected in the limits of the envelope to test the most severe conditions. Various conditions were also included, as detailed in Table 1, with some outside the certification envelope to perform a parametric study on the most important parameters like the MVD and the LWC. The icing cloud uniformity and the LWC values were measured over the entire cross-section using an LWC-200 hot-wire probe (Droplet Measurement Technologies, Longmont, CO, USA).
The tunnel air speed is set at 35 m/s, which is close to the tunnel maximum speed at which a temperature of −20 °C can be maintained. This speed also corresponds to the lower limit expected for the scaled cruise speed of the APT70 drone, which is expected to be between 35 and 40 m/s. The three RPM values and two pitch angles have been selected by the industrial partner to match the rotation speeds and angles expected during forward flight.

2.4. Post-Processing and Non-Dimensional Coefficients

The test protocol used for this test campaign consists of first stabilizing the air speed and air temperature in the icing wind tunnel as well as the rotation speed of the rotor at the targeted values. Once equilibrium is obtained in the tunnel, data acquisition is started and thrust is recorded for a short period of time in order to obtain the average thrust production of the clean rotor. After that period of time, the icing cloud is generated and ice starts accumulating on the rotating blades. The blades rotate at a constant RPM for the whole test duration. Thrust produced by the rotor starts to diminish due to the increasing ice layers on the blades until an ice shedding event occurs. Once ice shedding is obtained on the blade, mainly due to the centrifugal force, the test is stopped, pictures and measurements of the blades are taken, data are gathered, and the setup is cleaned and prepared for another run.
The post-processing of the results includes the use of an adimensional coefficient. The thrust coefficient C T is calculated using Equation (3), where ρ is the density of air (kg/m3), Ω is the rotor speed (rev/s), and d is the rotor diameter (m).
C T = T ρ Ω 2 d 4
The thrust coefficient is calculated at each of the time samples. To measure performance degradation, the results are expressed in terms of the percentage of loss of thrust coefficient in the function of time calculated using Equation (4).
Δ C T = C T C T     c l e a n C T   c l e a n × 100 %
C T   c l e a n is the average thrust coefficient measured during the stabilization period at the start of each run for the ice-free rotor. Once the icing cloud is initiated, the thrust diminishes due to ice accretion and the thrust coefficient at each time sample is compared to the base thrust established for clean blades until ice shedding occurs. Due to restriction effects of the rotor’s swept diameter in the tunnel cross-section, the thrust measured can be higher than the thrust, which would be measured in an unrestricted flow at the same air velocity. To account for this, the corrected air speed V′ matching the generated thrust in a closed throat tunnel can be calculated [45]:
V = 1 τ T 2 1 + 2 τ T A P A T S V
where AP is the area swept by the rotor, ATS is the area of the cross-section of the tunnel, V is the air speed measured experimentally, and τ T is
τ T = T ρ A P V 2
Figure 4 presents a schematic result of a standard test and describes the test procedure and typical thrust evolution during an icing event.

3. Results

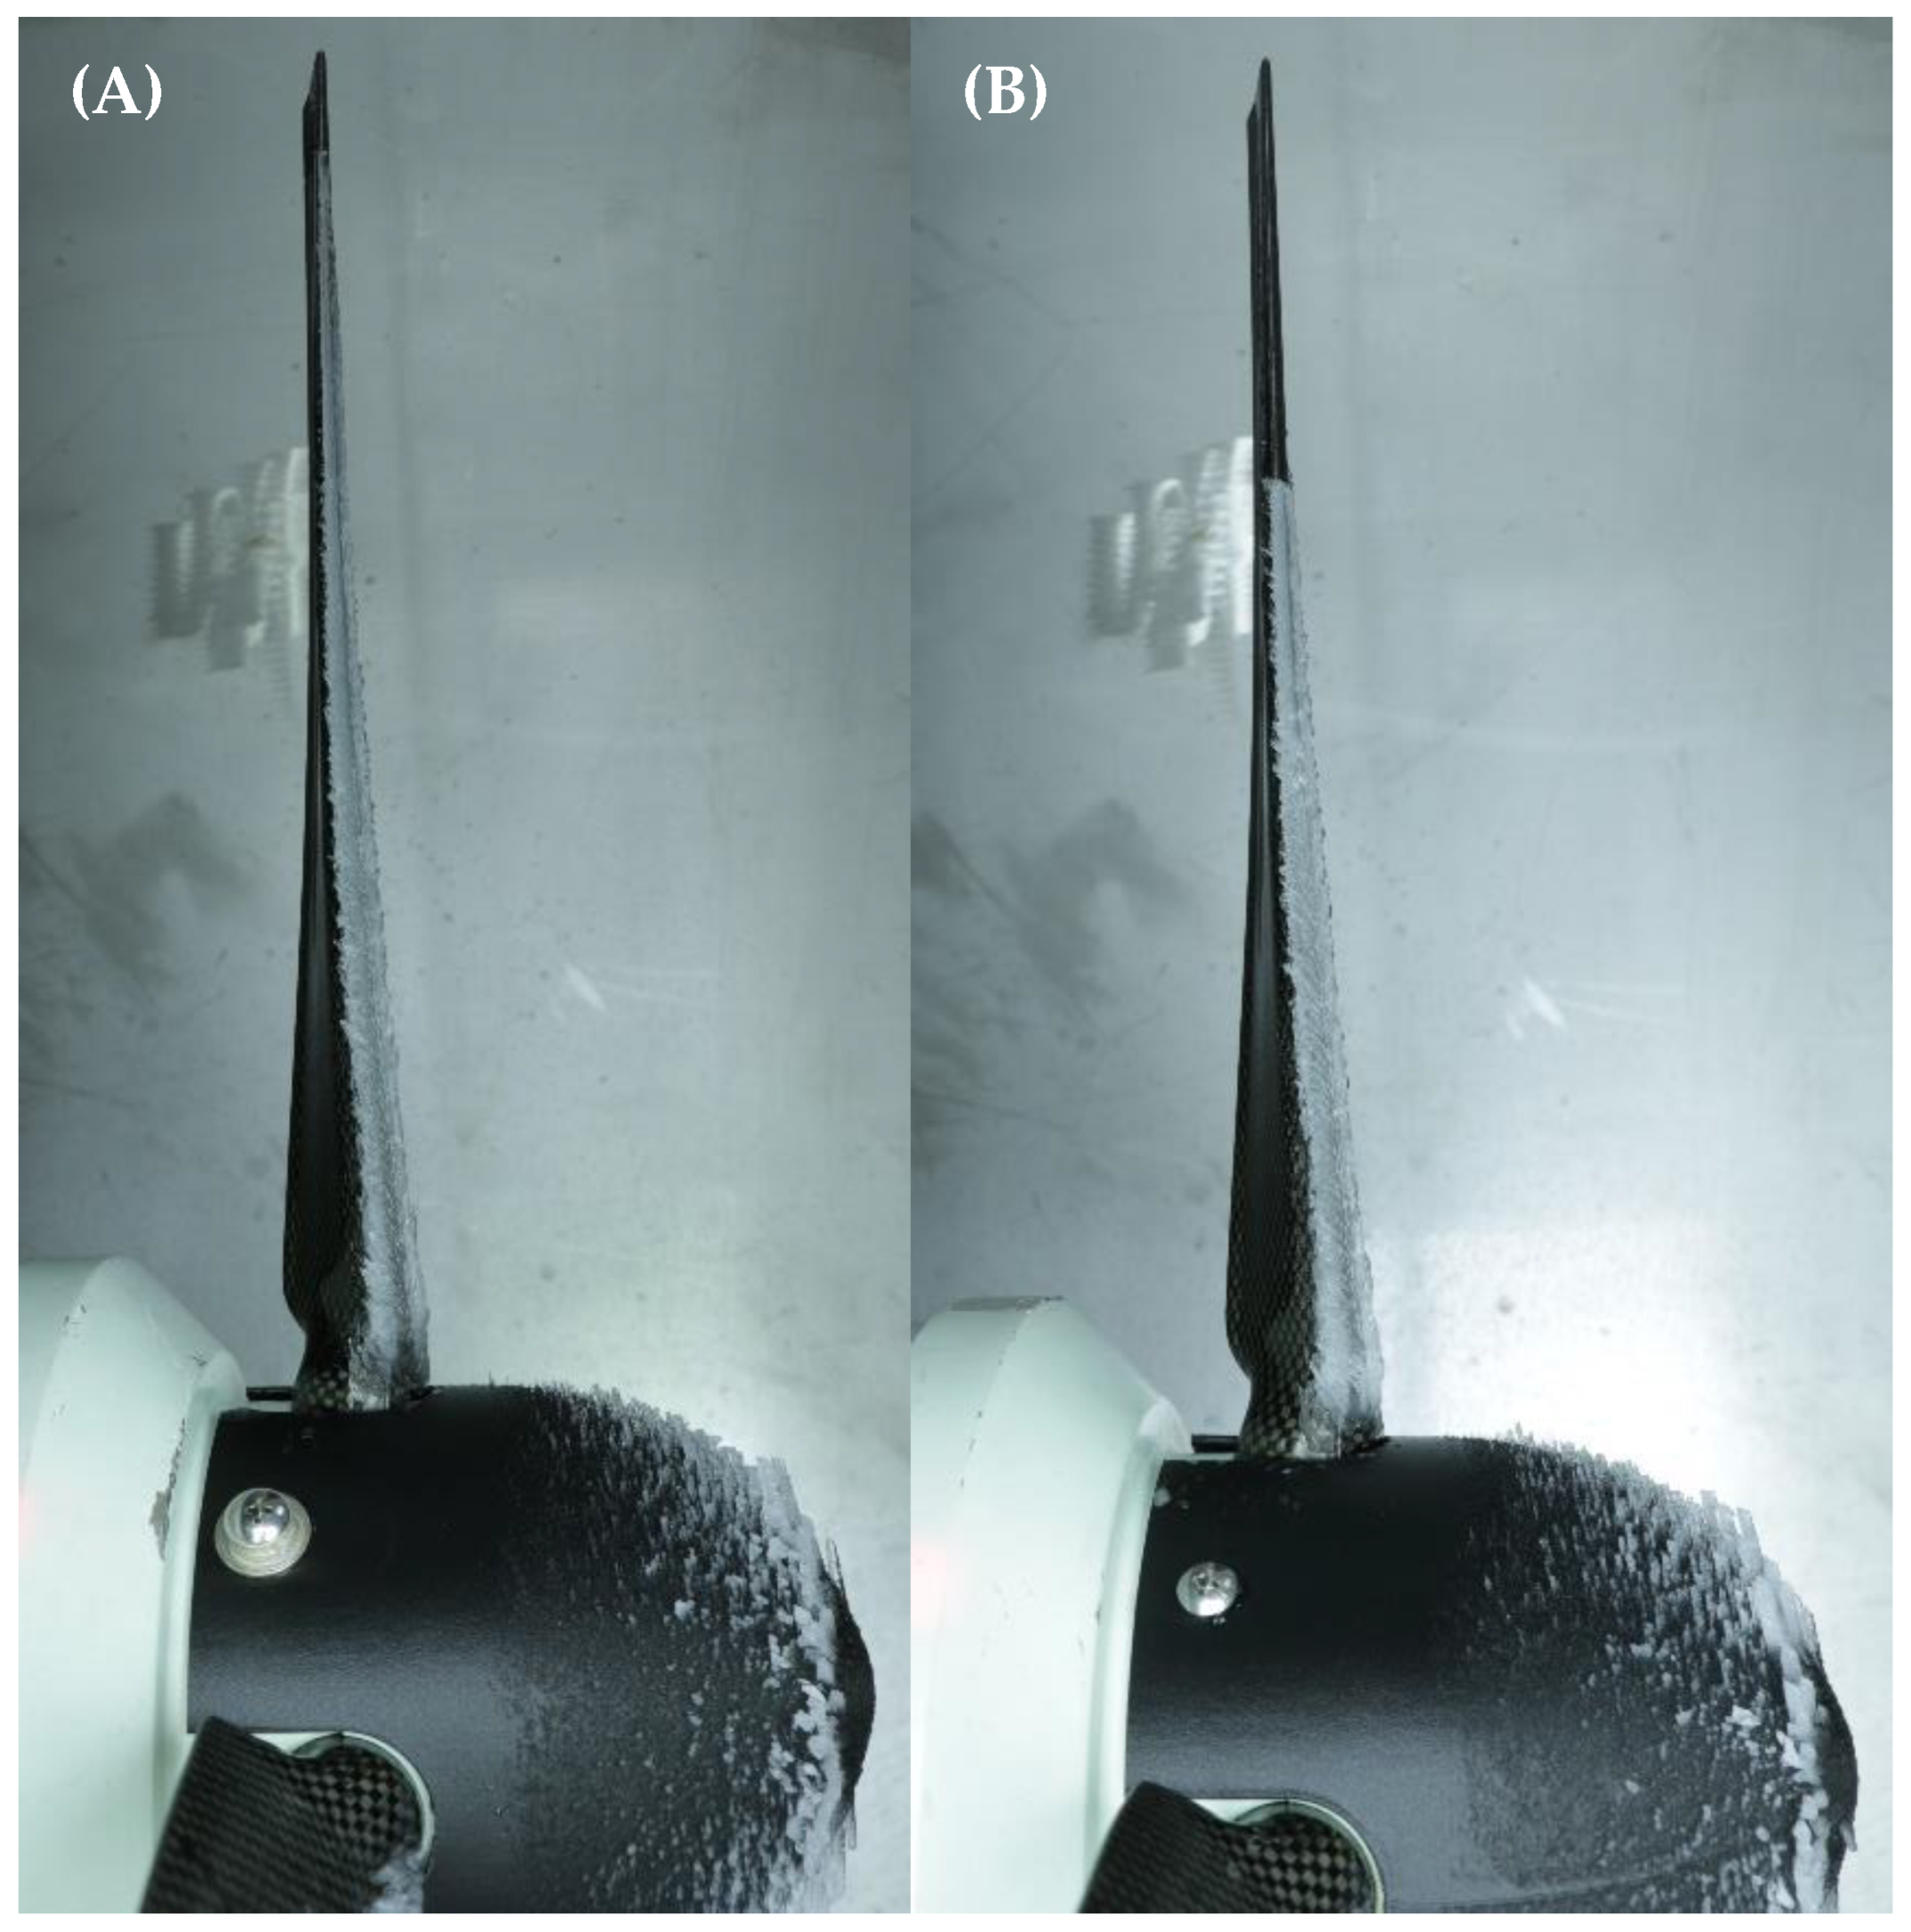
All tests in the icing wind tunnel are performed until ice shedding is obtained from one or more blades. As ice mass increases on the blade, the centrifugal force also increases since it is proportional to the mass of the object. Once the resulting force is higher than the adhesion strength of the ice on the blade, shedding is obtained. For some tests, complete shedding of the blade is obtained (Figure 5), while for others only partial shedding of the ice occurs (Figure 6). When a first shedding occurs, which can be detected by the strong noise made by the piece of ice detached from the blade hitting the wall of the tunnel and by the sudden increased in vibration levels, the test is immediately stopped. The results gathered are analyzed for each different test parameters investigated, namely the LWC, MVD, temperature, rotation speed, and pitch angle. The effect of each parameter on the thrust loss and ice accumulation is assessed. Pictures and measurements of the type, shape, and the thickness of ice accumulated are also taken and used for the analysis of each parameter.
Different types of ice were obtained depending on the icing conditions. When droplets impact on the blade, it takes a certain amount of time for it to solidify, and latent heat is liberated by this process. In a steady-state regime, an equilibrium is reached between the rate of the mass of water that impacts the blade and the resulting latent heat generated during solidification. With a combination of a high rate of mass of water, which results from higher LWCs, MVDs, and RPMs, and warmer temperatures, leading to longer solidification time and slower dissipation of latent heat, liquid water becomes trapped in the ice layer, resulting in a glaze accumulation (Figure 7A). Droplets also have time to flow on the blade, leading to less uniform shapes of ice. When a lower rate of mass of water is combined with lower temperatures, droplets freeze more rapidly, resulting in more air trapped in the ice matrix, leading to a rime ice accumulation. Also, droplets do not have time to flow on the blade since they almost immediately freeze at impact, giving a uniform ice accumulation close to the original blade profile (Figure 7B) [18,46].

3.1. Liquid Water Content

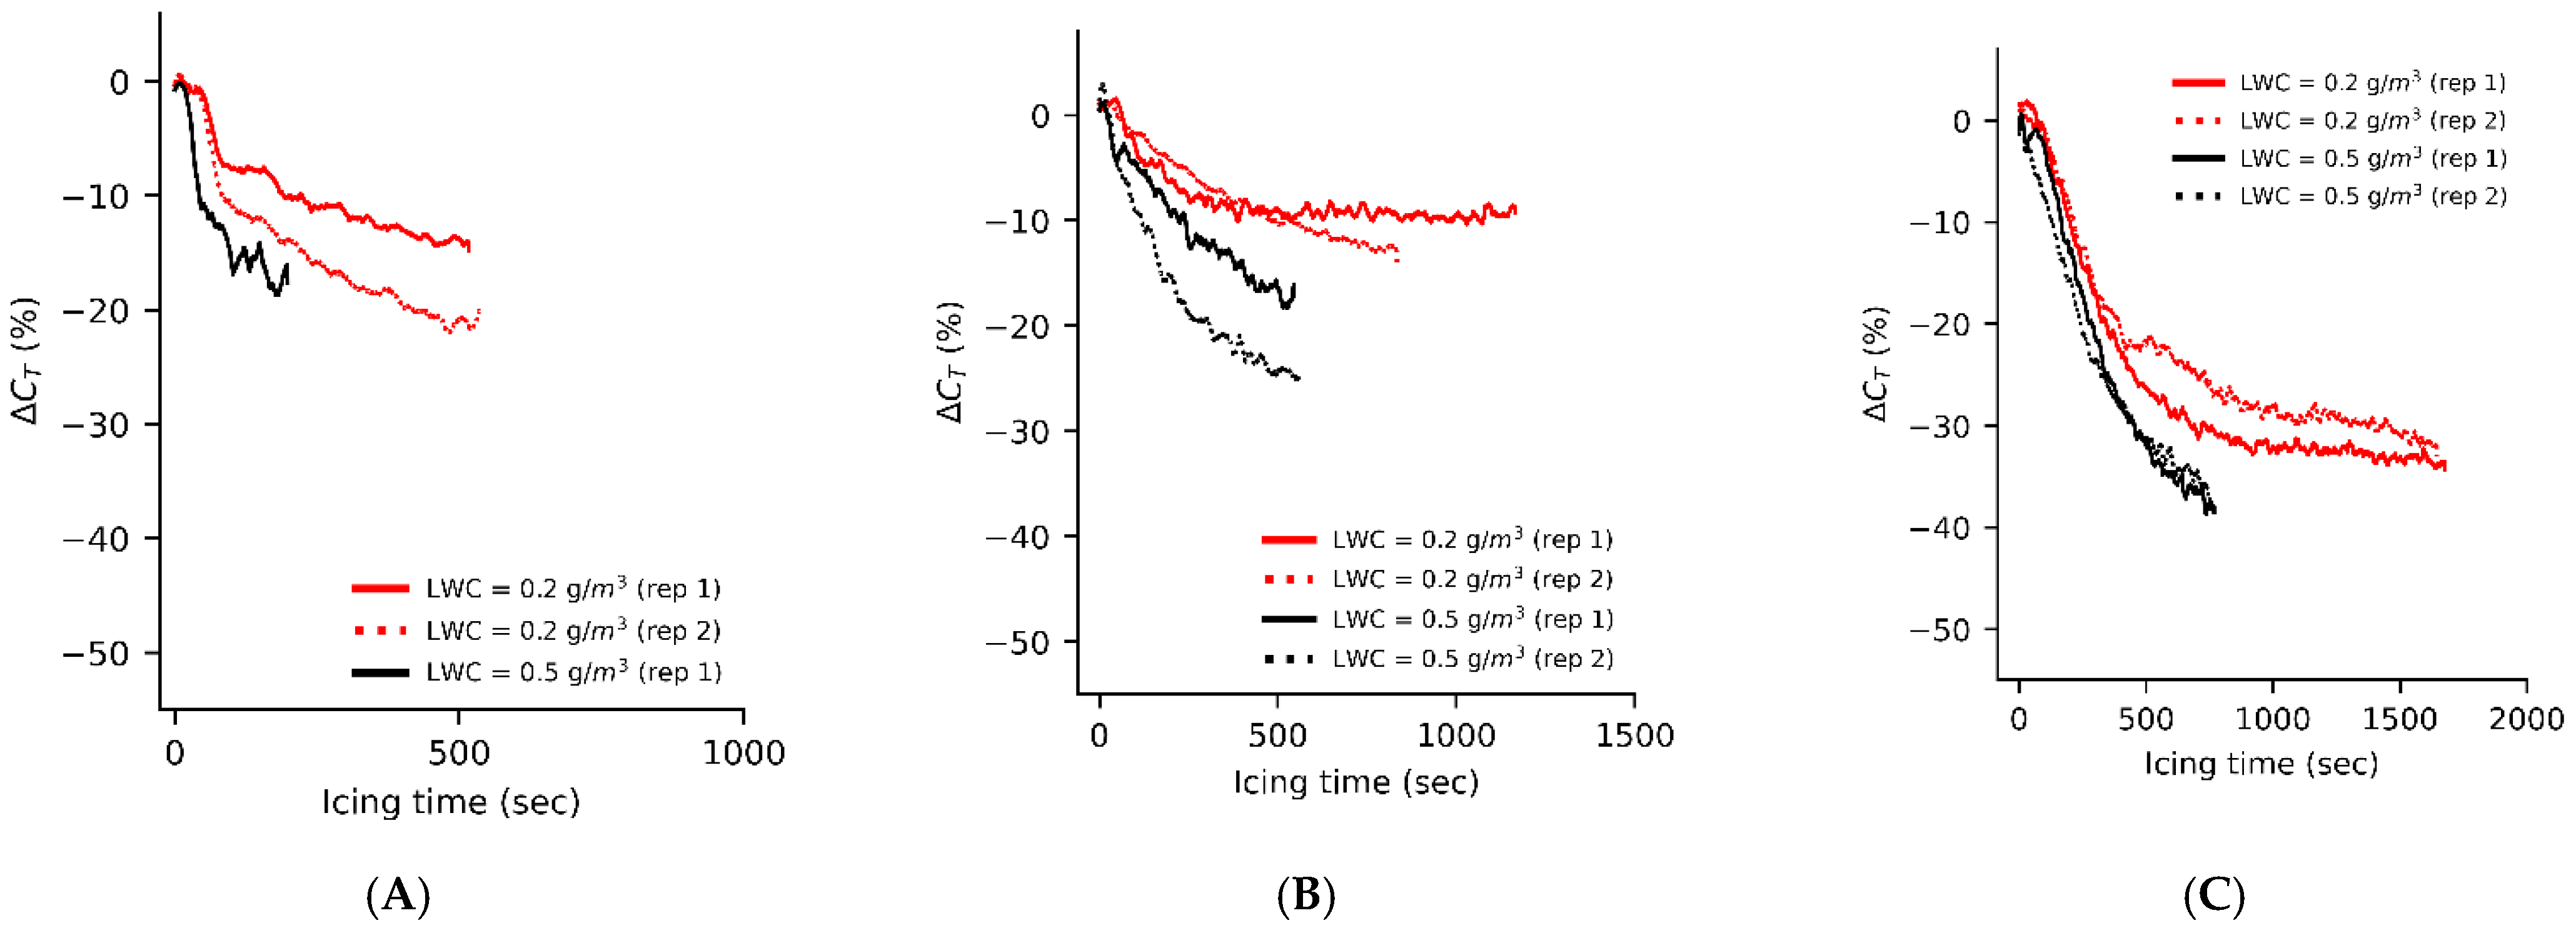
Figure 8 presents the percentage of thrust degradation in the function of accumulation time for the three different temperatures tested. All tests were performed at a MVD of 20 µm and a constant rotational speed of 5500 RPM (Table 1). As expected, a more severe and rapid degradation is obtained for a higher LWC in all test runs. With a higher water droplet count generated in the air of the wind tunnel, ice accumulates faster on the blade for all the temperatures tested. This is supported by the reduced time to ice shedding from the rotor. Since ice accretion on the blades diminishes its thrust generation, a more rapid accumulation leads to a more drastic loss in thrust produced. Some runs were repeated to verify repeatability. Although there are variations in the amount of thrust degradation for tests repeats, tests repetitions show highly similar trends and result in similar ice shedding times. The time to ice shedding increases as the temperature is lowered for all cases of LWC tested. This reflects the changes in ice type obtained as the ice transitions for glaze to rime.

3.2. Droplet Size (MVD)

To investigate the effect of the droplet size on rotor performances, testing is performed at the same LWC (0.5 g/m3), rotation speed (5500 RPM), and pitch angle (15.7°). Three droplet MVDs representative of in-flight icing conditions, namely 20, 40, and 60 µm, are investigated [44]. Thrust degradation is presented in Figure 9 for tests at −12 °C, for the three droplet sizes, and at −20 °C for the two limit sizes of 20 and 60 µm. The results show that the degradations of the performances are more severe for the larger droplets, especially at 60 µm. While a slightly more severe degradation of the thrust is observed for the 40 µm when compared with the 20 µm, the 60 µm generates a significantly more severe degradation than for the two other droplet sizes. This result is in line with the results obtained during hover flight tests [38]. As for the hover flight tests, this higher degradation is caused by the droplet collection efficiency. The collection efficiency of an object is dependent on the object geometry, particle mass, and flow streamlines [47,48]. Smaller droplets have less inertia and are more likely to follow the energetic streamlines, created by the wind and high rotation speed of the rotor, leading to reduced collection efficiency and smaller ice accretions. On the other hand, larger droplets are more difficult to deviate resulting in more droplets impacting with the blade and more important ice accumulations.
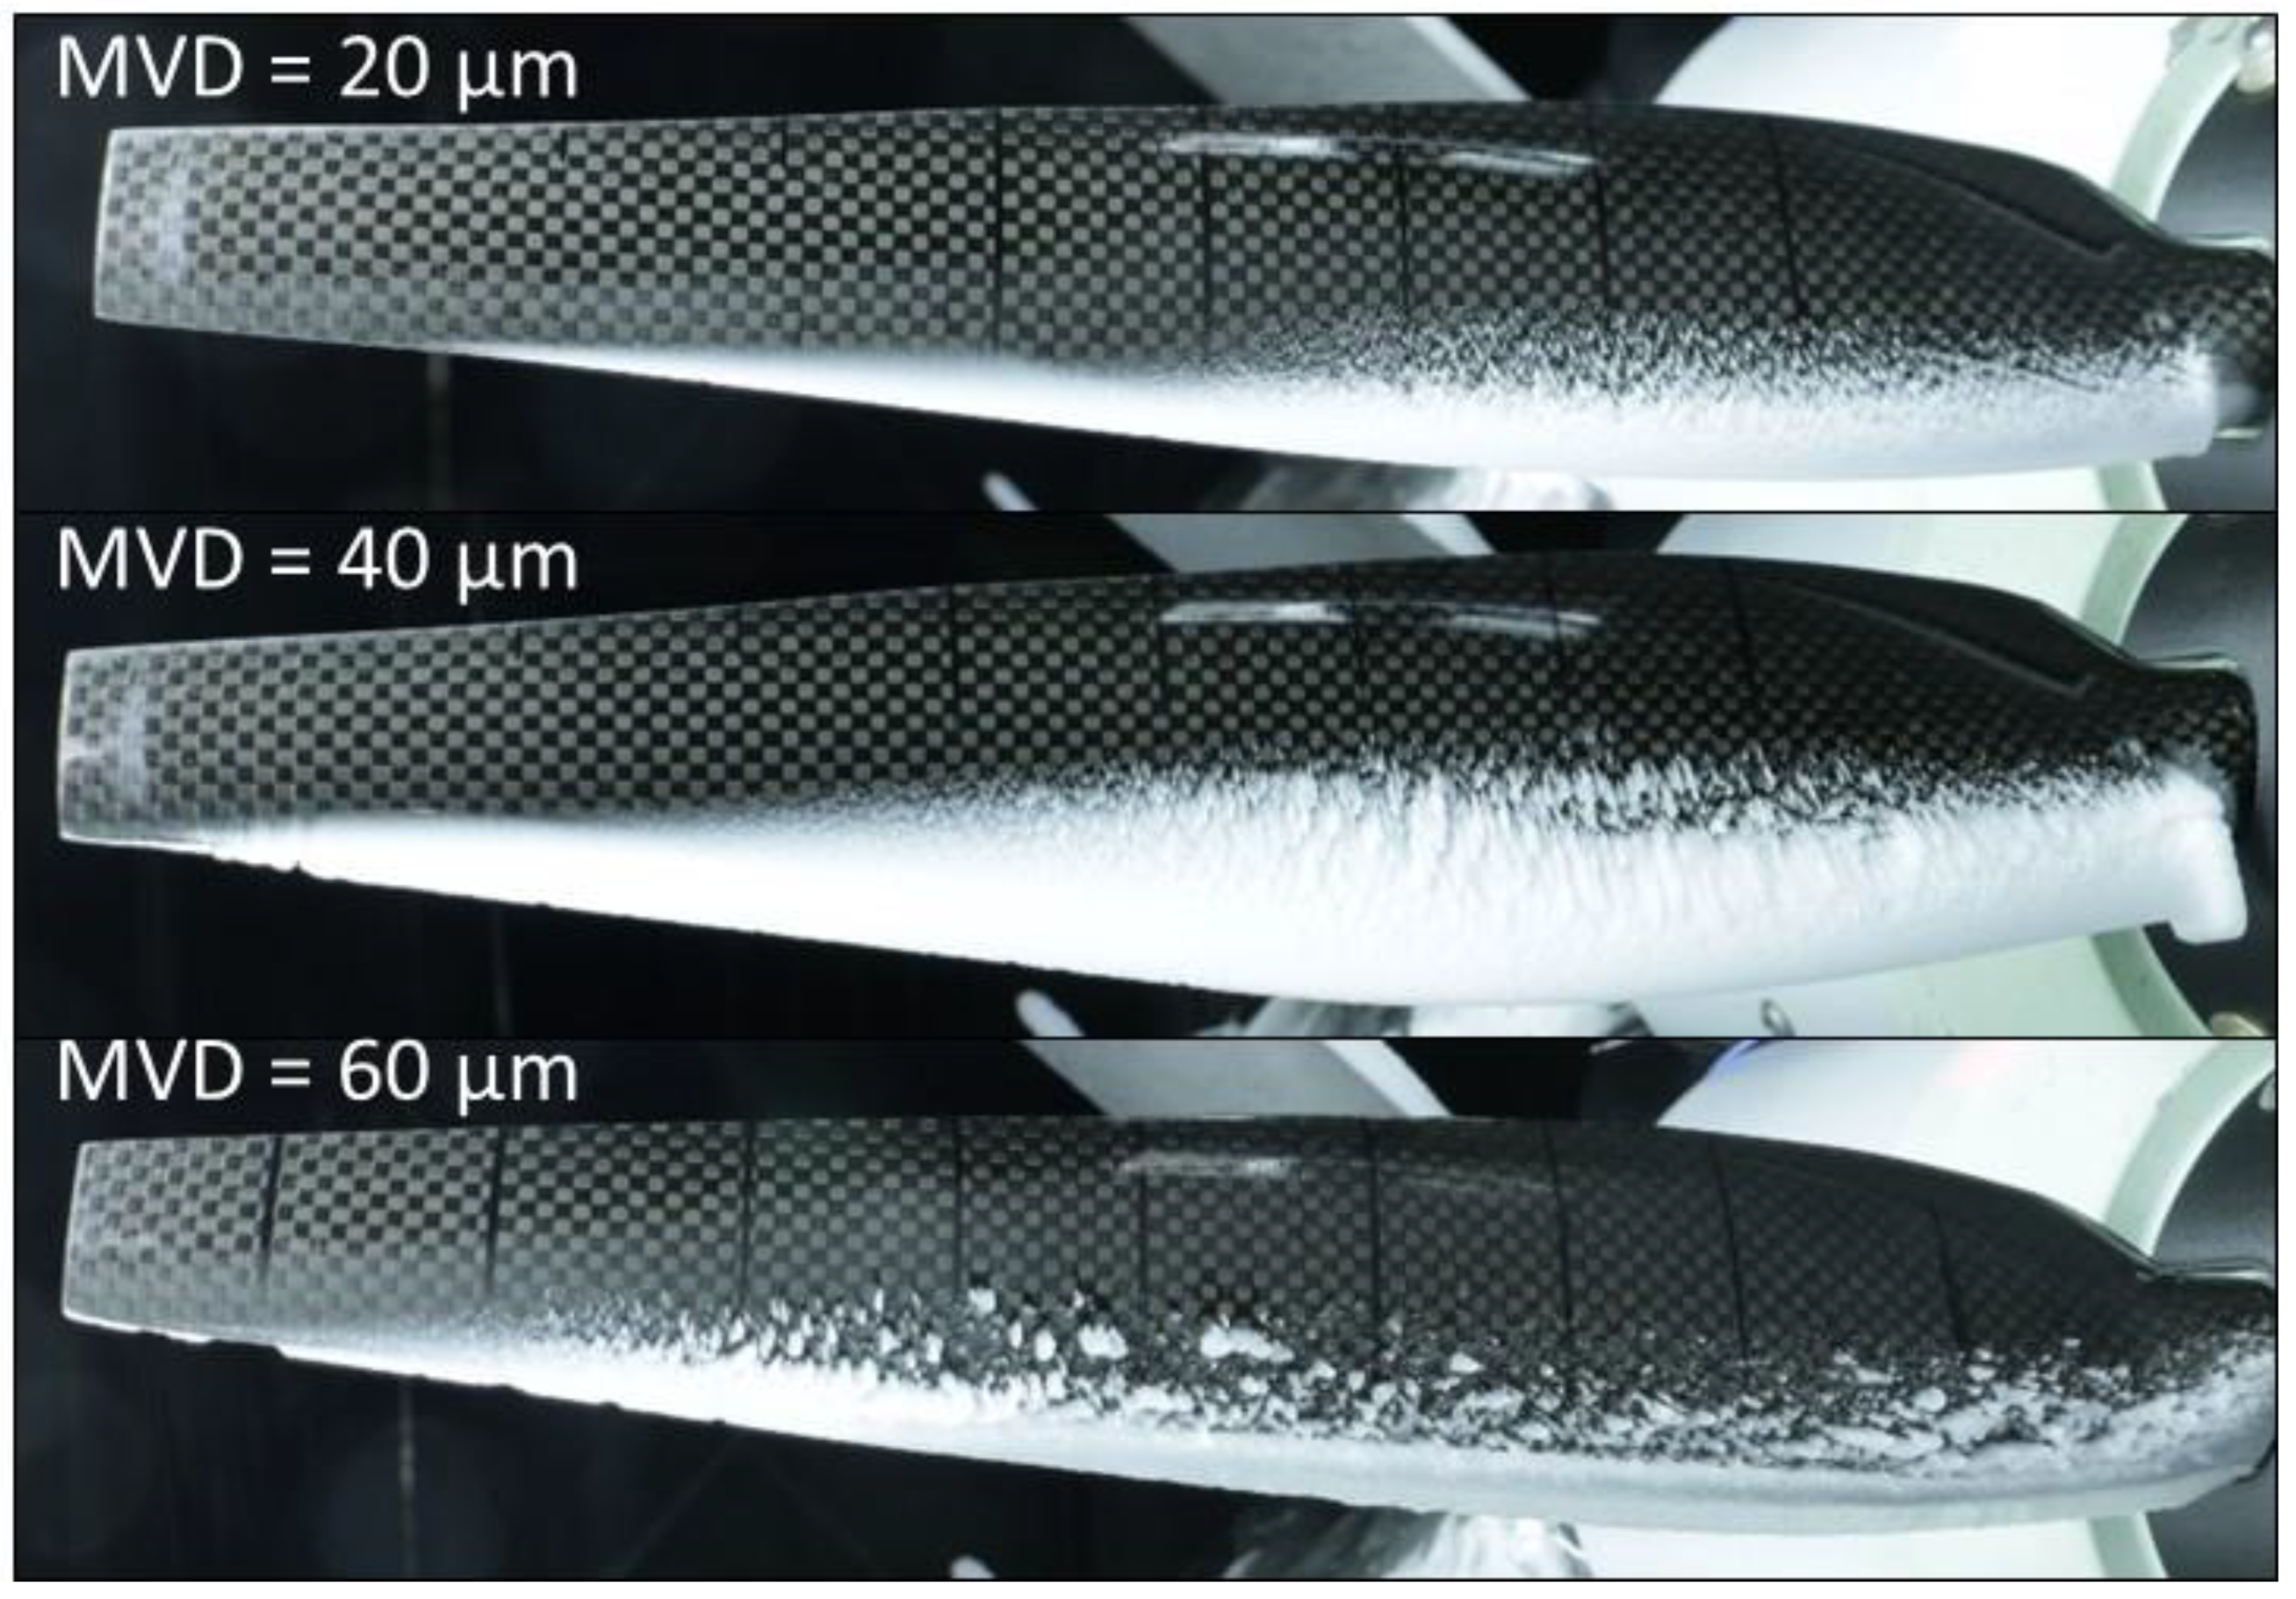
The photographs of the ice accumulation for the different droplet sizes at −12 °C are presented in Figure 10 and Figure 11. The pictures confirm the results obtained for the thrust degradation. When the droplet size is increase at 40 µm, a thicker accumulation is obtained when compared to 20 µm. When the droplet size is further increased to 60 µm, an even thicker accumulation is obtained and even a change in the accumulation regime is observed. The ratio of the time allowed for a droplet to freeze before a new droplet impacts the surface, along with the time required for the droplet to completely solidify, governs the accumulation regime and the type of ice obtained [18,49,50]. In the case of 60 µm, much more droplets with higher masses of water impact the surface per unit of time compared to lower droplet sizes. This results in less time for each droplet to freeze and a change in the type of ice accumulation from a rime ice to a mixed/glaze ice accumulation. This confirms the higher accumulation rate, thus explaining the faster performance degradation. Part of this higher degradation can also be attributed to the glaze type of accumulation, which creates a worse aerodynamic shape, as seen in Figure 10 and Figure 11.
Experimental results typically show that the accreted ice thickness increases along the blade span from the root to the tip [51]. The results obtained show an opposite effect, with a smaller accumulation at the tip, or even no accumulation at all with the smaller droplets. Those results are similar to those obtained during the hover flight investigation [38], as well as in a few other studies performed by the National Research Council of Canada (NRC) and National Aeronautics and Space Administration (NASA) [48,52]. This can possibly be explained by the specific profile used in this work, which shows a different profile than those typically investigated. The collection efficiency is highly dependent on the geometry of the blades and with a varying chord and twist along the span for the blades tested; this seems to greatly impact the collection efficiency of the different parts of the blades. The geometry changes significantly along the span, which could lead to a different collection for different parts of the blade. The absence of ice at the tip with the smaller droplets seems to confirm the impact of the collection efficiency of the blades. However, to confirm this, more testing should be performed with additional measurements allowing for collection efficiency calculations. CFD numerical simulations could also be performed to obtain more information allowing to confirm this explanation.

3.3. Rotor Speed

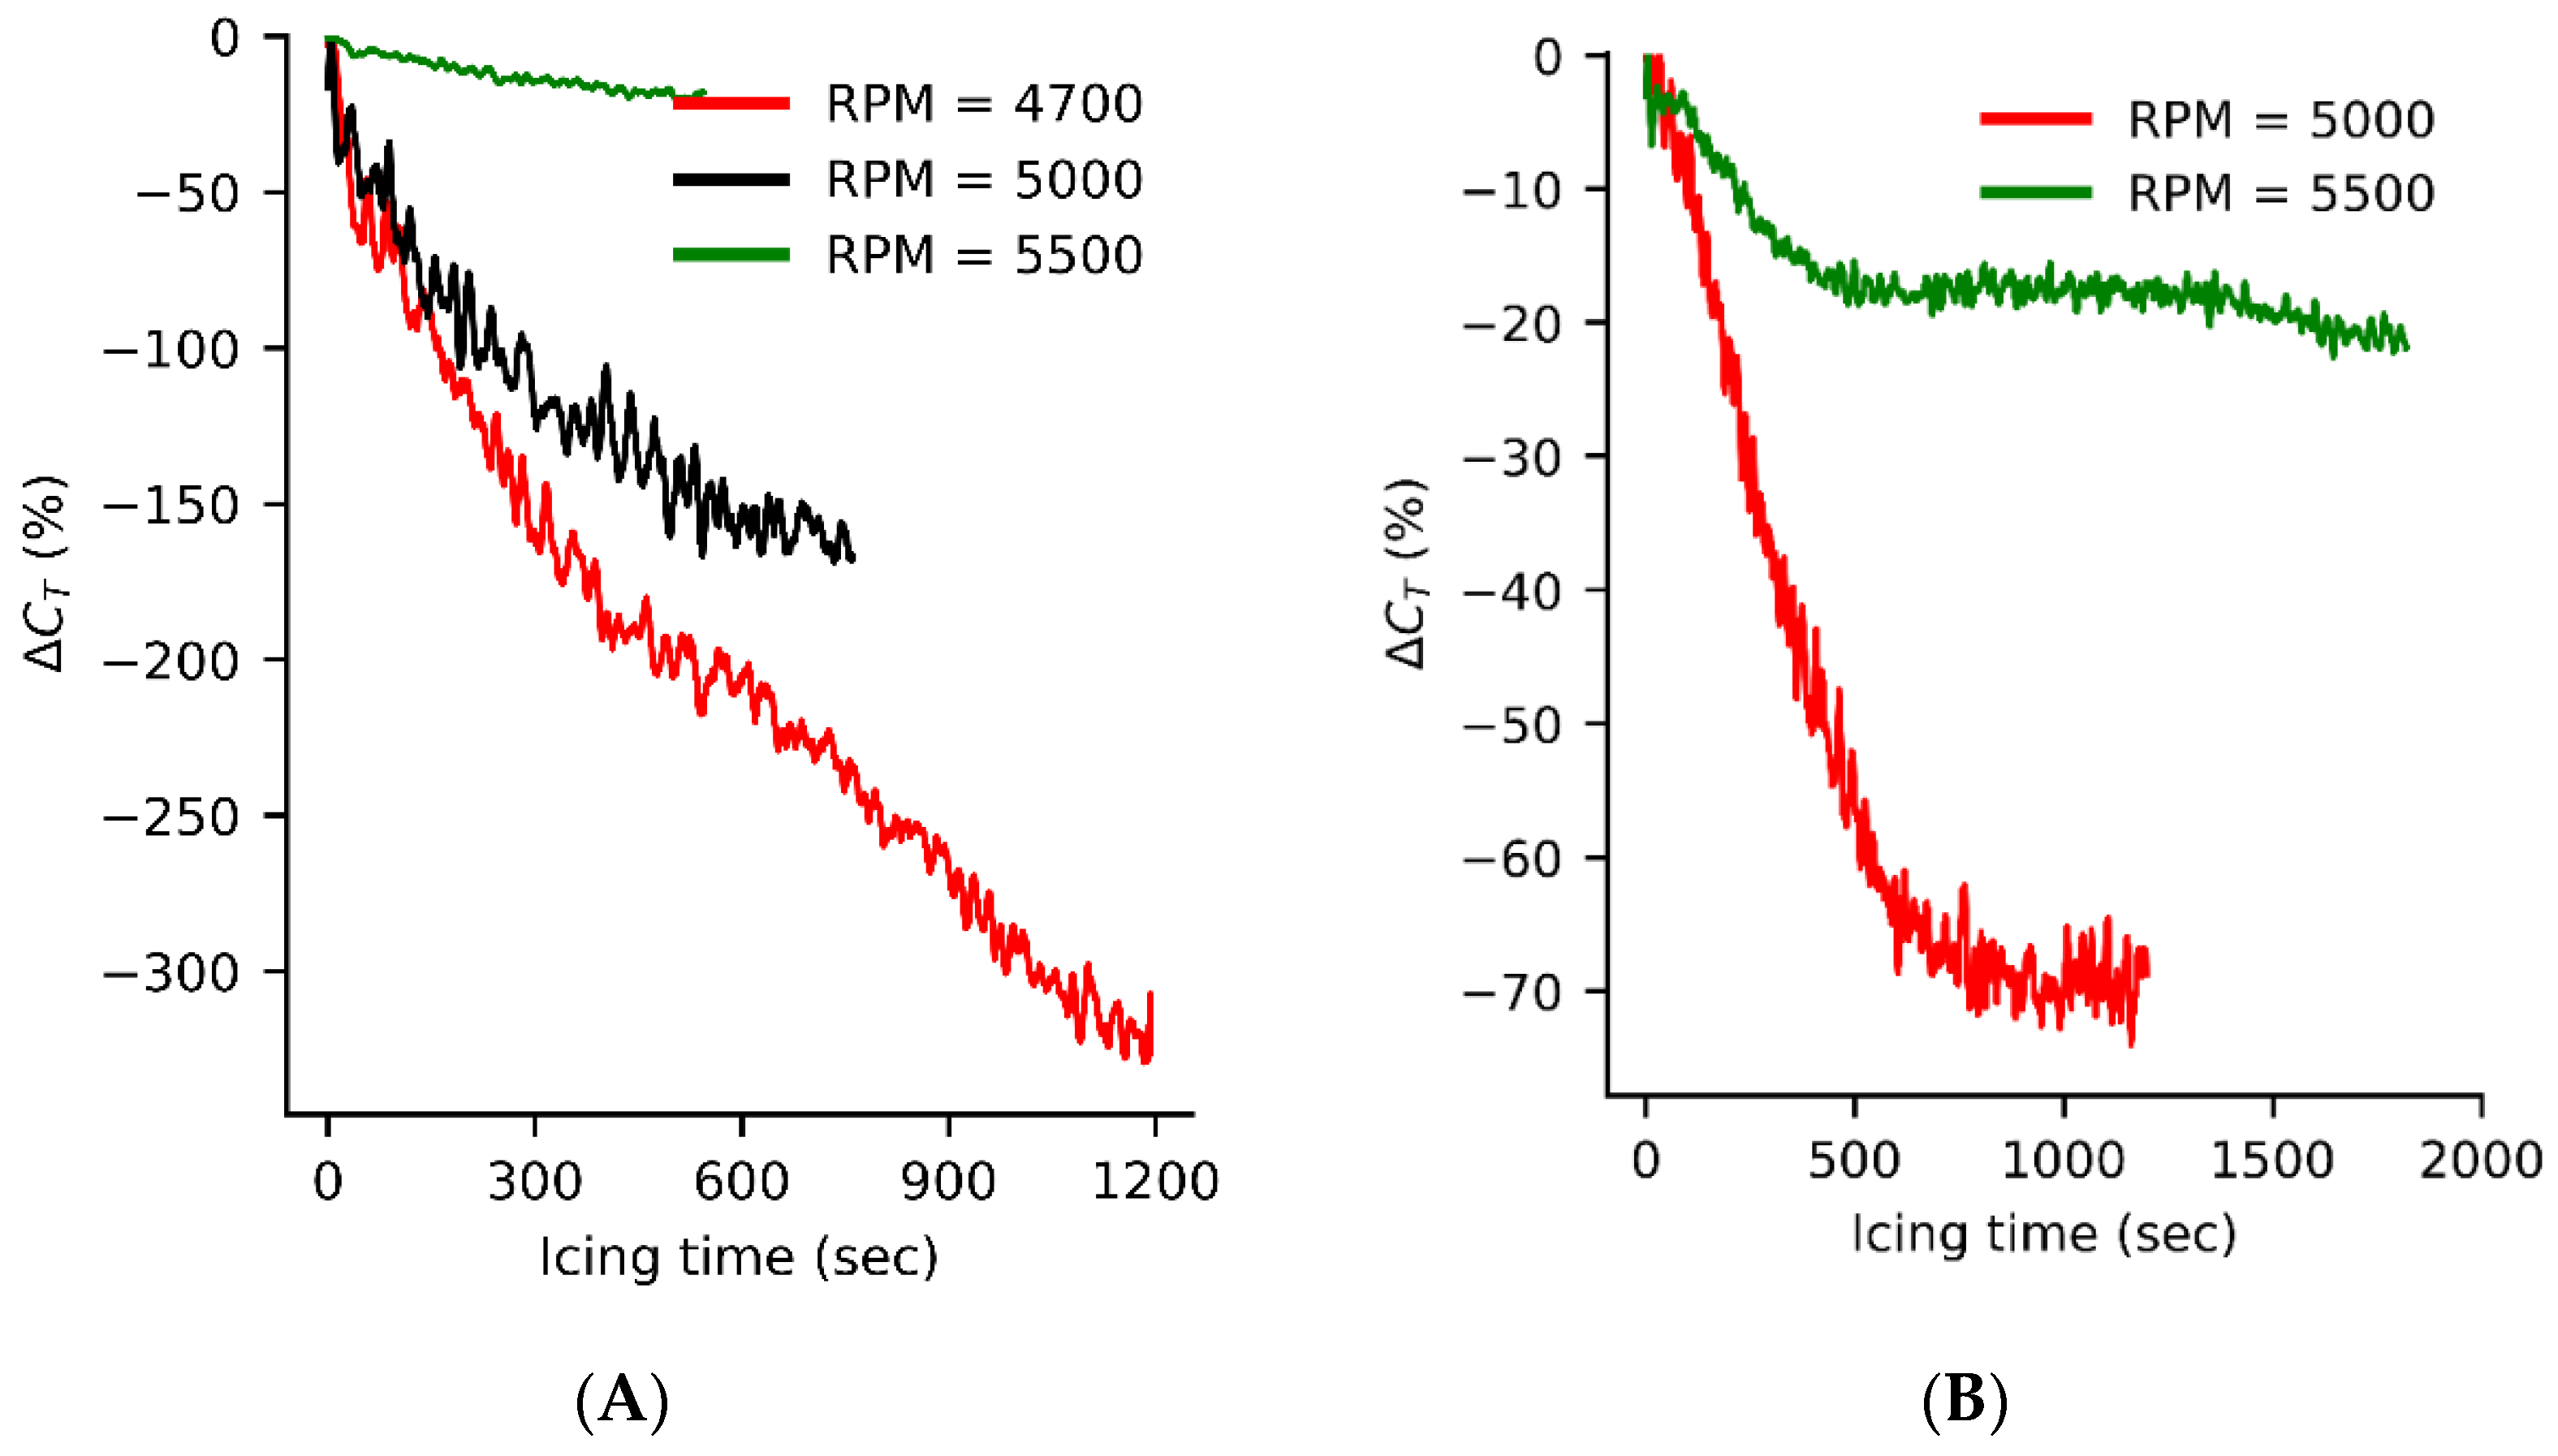
In this section, the effect of the rotation speed of the blades on the aerodynamic thrust degradation during icing is examined. The results of thrust degradation are presented at Figure 12 for the conditions tested. For each test case, the speed of rotation of the blades showed a direct effect on thrust degradation as well as on the ice accumulation rate and shape. As for the hover flight investigation [38], the degradation of the thrust occurred more rapidly for lower rotation speeds. Therefore, the more severe thrust degradation occurred when the rotor operated at the lowest speeds for all the different parameters tested.
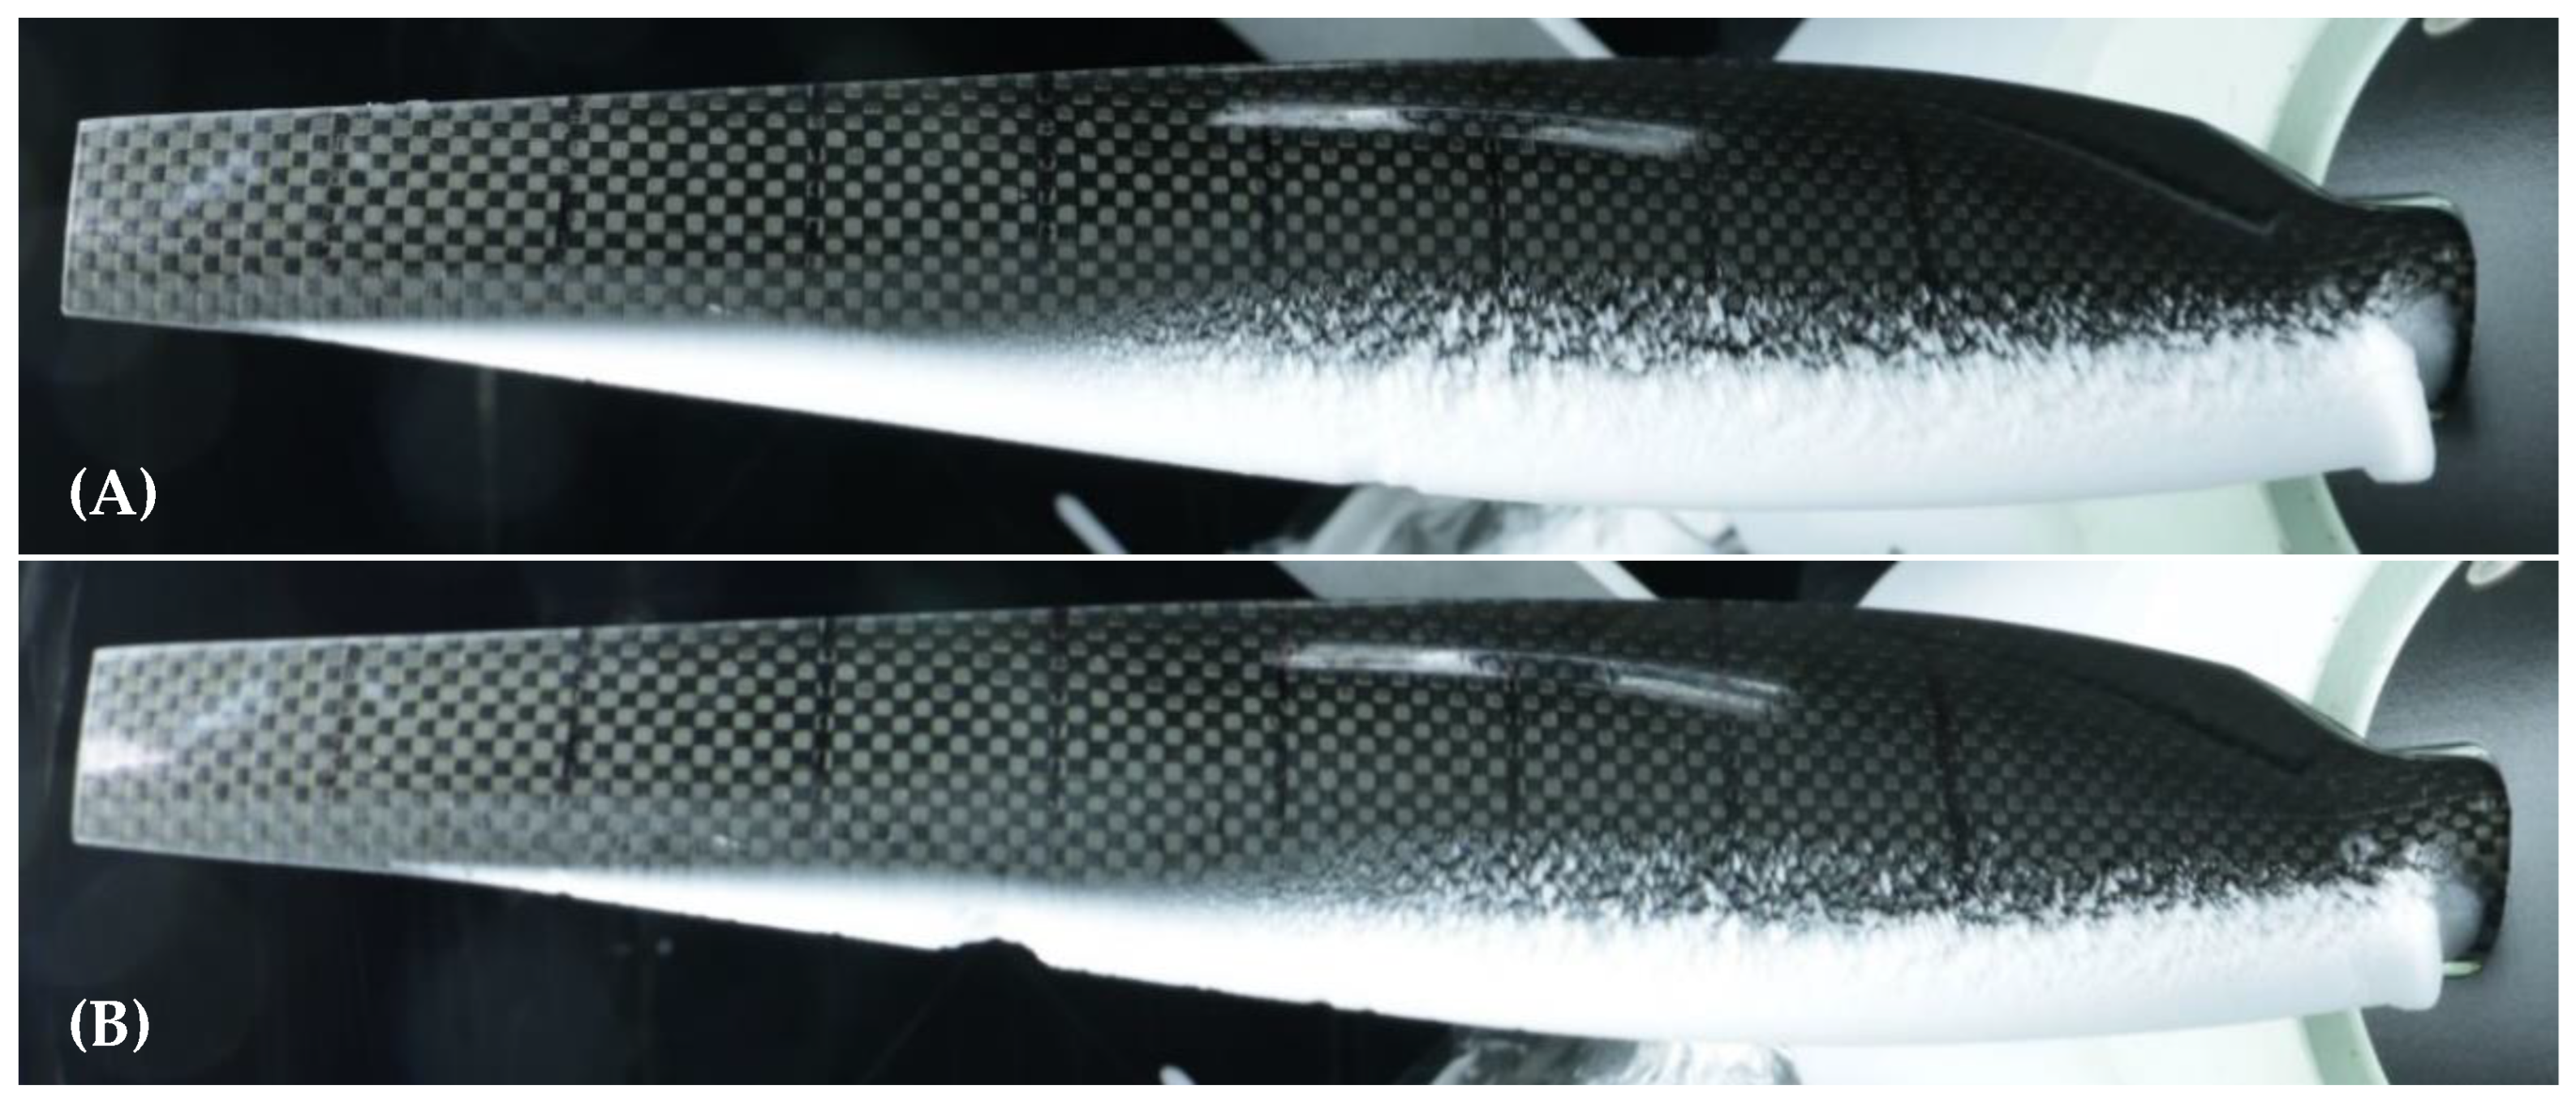
Photographs taken after testing at −12 °C and 0.5 g/m3 are presented in Figure 13. Unfortunately, no pictures are available at 4700 RPM since all the blades shed at the same time. The pictures show a larger ice accretion at 5000 RPM than at 5500 RPM. The pictures also show that ice accumulation can be found almost on the entire blade at 5000 RPM while the last 20% of the blade is free of ice at 5500 RPM. Again, it is possible to say that the faster performance degradation is caused by a faster and heavier accumulation at lower RPMs. The presence of ice close to the tip also affects more severely the thrust generation for the lower RPMs, since the tip of the blades plays a significant role in generating thrust. The collection efficiency is highly impacted by the rotation speed of the blades, since the collection efficiency is directly related to the air flow velocity [18,51]. Droplets, especially with their small MVD of 20 µm, are transported around the blades more easily by the more energetic streamlines obtained at higher RPMs. Similar observations were made by NASA [52] and by the NRC [48], which show the importance of a complete understanding of the air flow distribution and collection efficiencies for rotating blades to predict the behavior of the ice accumulations.

3.4. Pitch Angle

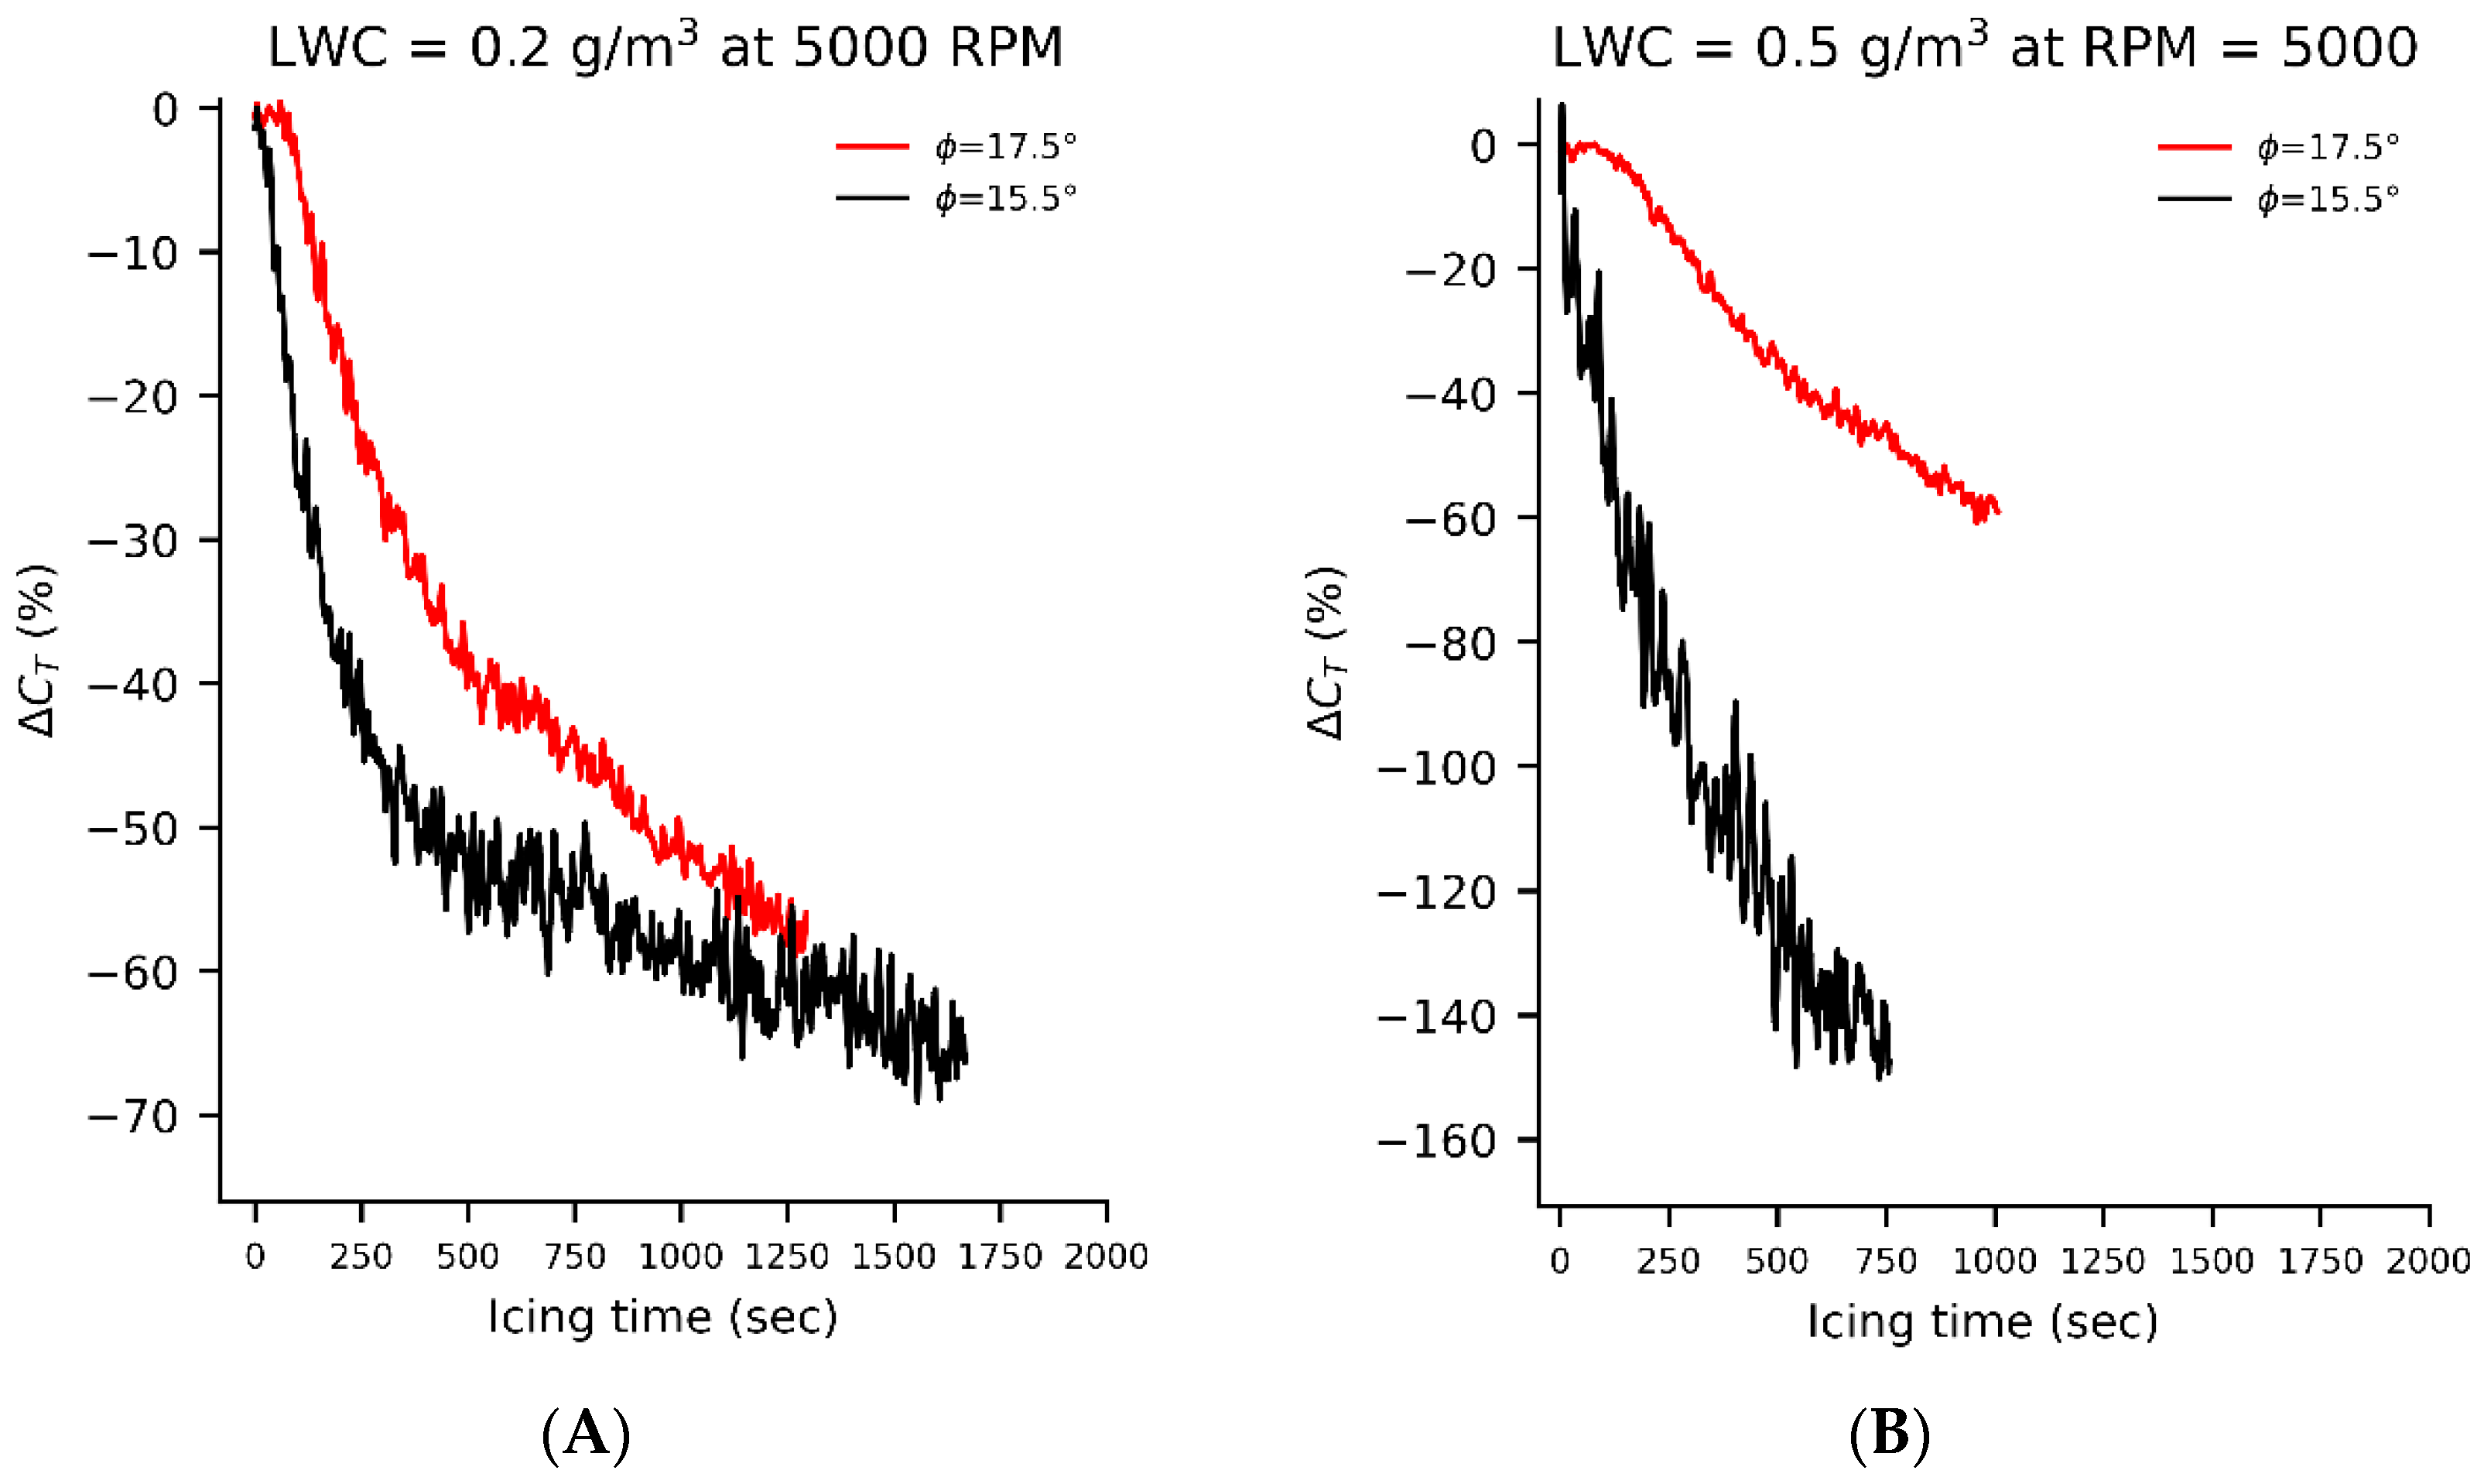
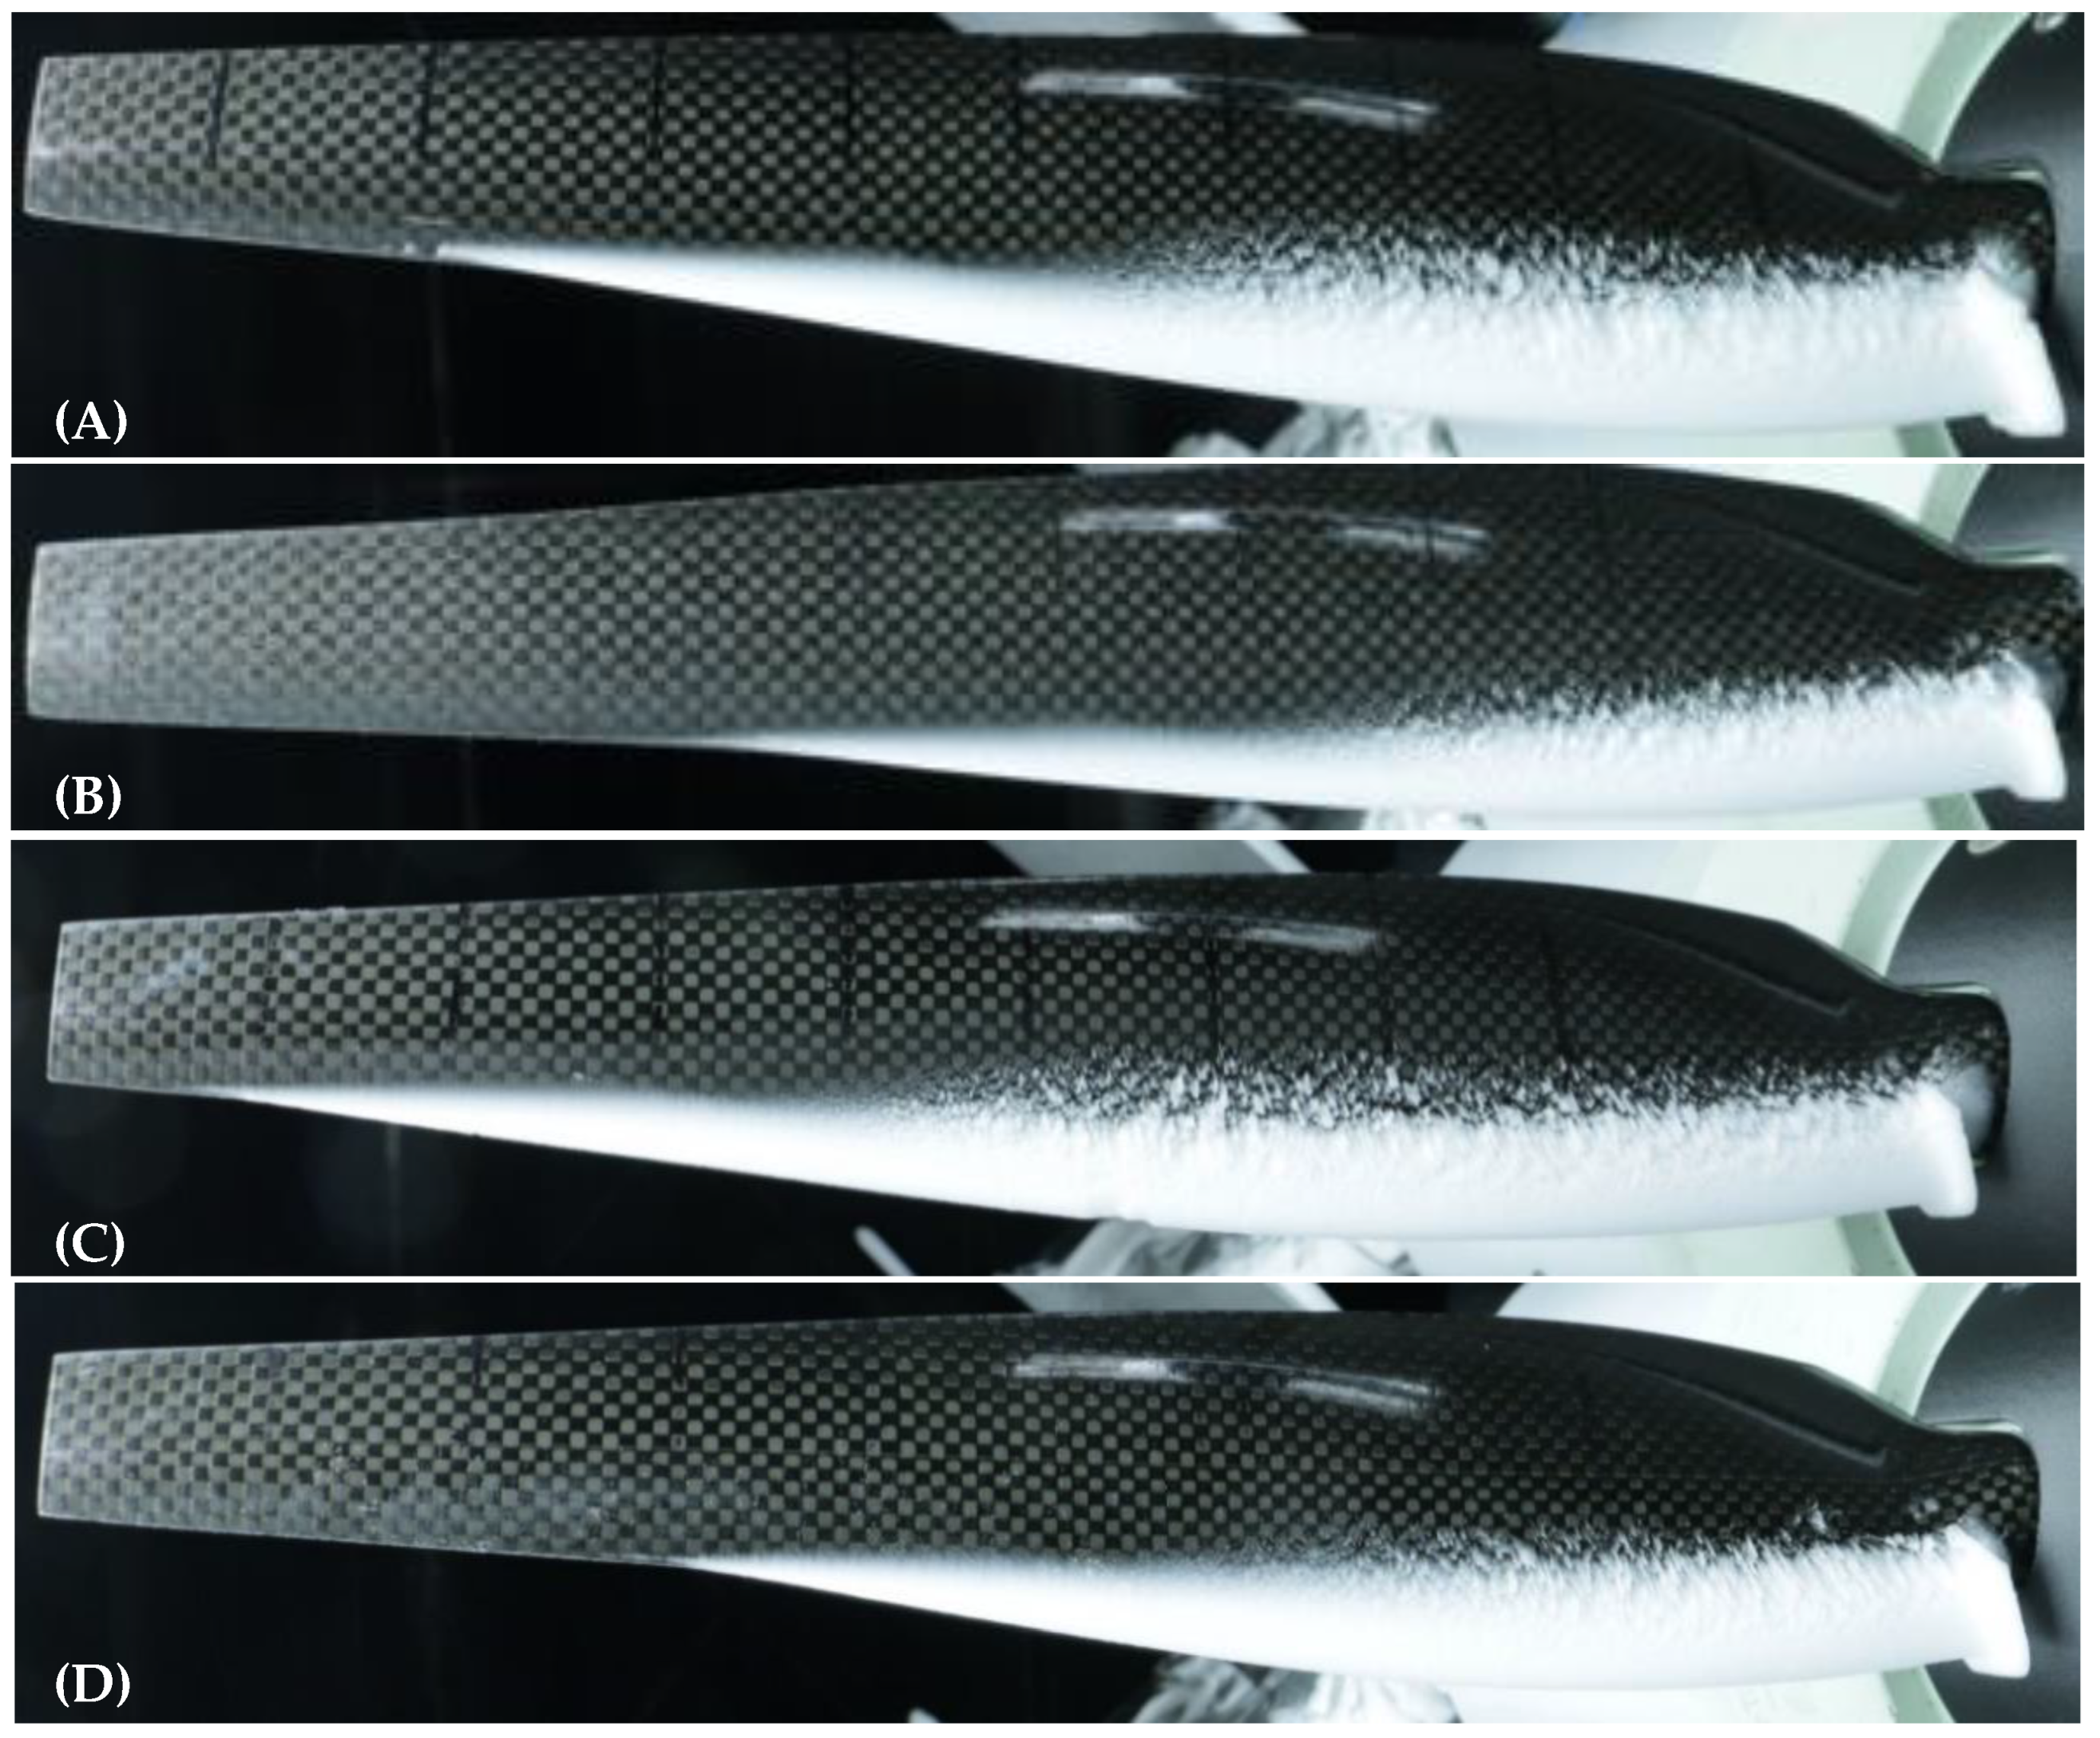
Two different pitch angles were tested, θ = 15.7° and θ = 17.7°, corresponding to the range of pitches expected for the forward flight of the APT70 UAV. The tests were performed at 5000 rpm and for two different LWC values (Table 1). The percentage of thrust degradation is presented in Figure 14. The results show that increasing the pitch angle lead to slower thrust degradation. The difference is even more significant at a LWC of 0.5 g/m3, a condition where faster ice accumulations are obtained. The pitch angle greatly influence blade tip ice accretion according to a previous study [53]. This study showed that increasing the pitch angle leads to thinner ice accumulation at the tips and less ice coverage along the span, which is also what is observed on the pictures presented in Figure 15 and in the previous testing performed in a cold room [38]. Pictures show no ice accumulation for the last third of the blades at the higher pitch angle of 17.7° while ice is accumulated almost on the whole blade at the smaller pitch angle. The results agree with the results obtained in the study of the effect of RPM, where ice accumulations closer to the tip highly accentuate the thrust degradation. The higher blade pitch induces higher axial velocity, which impacts the droplet trajectories by deviating them from the blade surface. The collection efficiency of the rotor is then affected, leading to slower accumulations with no ice at the tip.

4. Conclusions

This paper presented the last experimentations performed within the framework of a major test campaign on the study of the icing of the Bell Textron APT70 drone rotor. Previous tests were performed in a cold room to test the rotor in takeoff and hover flight mode, while for these experiments, the rotor was installed in an icing wind tunnel to simulate forward flight into icing conditions. The effect of different parameters on ice accumulation and resulting thrust performance losses was studied, including the LWC, MVD, rotational speeds, and pitch angles.
The parametrical study has shown that larger droplets, lower rotation speeds and lower pitch angles lead to more rapid and significant thrust losses. It could be observed from the pictures of the resulting ice accretion that these parameters mainly affect the collection efficiency of the rotating blades and the total spanwise coverage of the ice. Larger droplets are more difficult to deviate from their trajectory and thus have a higher tendency to hit and accrete on the blade. At the same temperature and LWC, changing the MVD also resulted in changing the ice type from rime to mixed with aggressive thrust degradations. Higher rotation speeds and pitch angles create more energetic streamlines that transport more droplets around the airfoil, leading to slower ice accumulation and thrust degradation. Pictures has allowed the observation of blade tips completely free of ice compared to blades that are fully covered with ice simply by varying the value of one of those parameters, confirming the importance of the collection efficiency on the results. The increased accumulation of ice at the blade’s tip region, as obtained at lower rotational speeds and pitch angles, resulted in significantly increased thrust degradations under the same icing conditions. These results provide interesting insights into rotor blade design and operation conditions for improved tolerance under icing conditions.
Future works should include a deeper investigation and prediction of the collection efficiency for those specific blades in order to better predict ice accumulation and performance losses for the drone rotor. Also, thermal protection should be tested to estimate the power required to protect the blades from icing during forward flight.

Author Contributions

Conceptualization, D.H. and E.V.; methodology, D.H. and E.V.; validation, D.H., E.V. and M.B.; formal analysis, D.H. and E.V.; investigation, D.H. and E.V.; resources, E.V. and M.L.; data curation, D.H., E.V. and M.B.; writing—original draft preparation, E.V. and D.H.; writing—review and editing, D.H. and E.V.; visualization, M.B.; supervision, D.H., E.V. and M.L.; project administration, E.V. and M.L.; funding acquisition, E.V. All authors have read and agreed to the published version of the manuscript.

Funding

This research was funded by Bell Textron Canada Ltd.

Data Availability Statement

Data are contained within the article.

Conflicts of Interest

The authors declare no conflicts of interest.

References

  1. Transport Canada. Transport Canada’s Drone Strategy to 2025; Transport Canada: Ottawa, ON, Canada, 2021.
  2. Villeneuve, E.; Karmouch, E.; Boulerice, X. Development of a small and transportable de-icing/anti-icing drone-mounted system. Part 1: System design. Drone Syst. Appl. 2022, 2, 28. [Google Scholar] [CrossRef]
  3. Hann, R.; Johansen, T.A. Unsettled Topics in Unmanned Aerial Vehicle Icing; SAE Technical Paper; SAE International: Warrendale, PA, USA, 2020. [Google Scholar]
  4. Federal Aviation Administration. UAS by the Numbers. 2021. Available online: https://www.faa.gov/node/54496 (accessed on 23 November 2021).
  5. Adamski, M. Analysis of propulsion systems of unmanned aerial vehicles. J. Mar. Eng. Technol. 2017, 16, 291–297. [Google Scholar] [CrossRef]
  6. Cao, Y.; Tan, W.; Wu, Z. Aircraft icing: An ongoing threat to aviation safety. Aerosp. Sci. Technol. 2018, 75, 353–385. [Google Scholar] [CrossRef]
  7. Potapczuk, M.G. Aircraft icing research at NASA Glenn research center. J. Aerosp. Eng. 2013, 26, 260–276. [Google Scholar] [CrossRef]
  8. Dukhan, N.; De Witt, K.J.; Masiulaniec, K.; Van Fossen, G.J., Jr. Experimental Frossling numbers for ice-roughened NACA 0012 airfoils. J. Aircr. 2003, 40, 1161–1167. [Google Scholar] [CrossRef]
  9. Fortin, G.; Laforte, J.-L.; Beisswenger, A. Prediction of ice shapes on NACA0012 2D airfoil. In Proceedings of the FAA In-Flight Icing/Ground De-Icing International Conference & Exhibition, Chicago, IL, USA, 16–20 June 2003; SAE International: Warrendale, PA, USA, 2003. [Google Scholar]
  10. Özgen, S.; Canıbek, M. Ice accretion simulation on multi-element airfoils using extended Messinger model. J. Heat Mass Transf. 2009, 45, 305–322. [Google Scholar] [CrossRef]
  11. Tsao, J.-C.; Lee, S. Evaluation of Icing Scaling on Swept NACA 0012 Airfoil Models; NASA Glenn Research Center: Cleveland, OH, USA, 2012.
  12. Tsao, J.-C. Further Evaluation of Swept Wing Icing Scaling with Maximum Combined Cross Section Ice Shape Profiles. In Proceedings of the 2018 Atmospheric and Space Environments Conference, Atlanta, GA, USA, 25–29 June 2018; American Institute of Aeronautics and Astronautics: Atlanta, GA, USA, 2018; p. 3183. [Google Scholar]
  13. Liu, Y.; Zhang, K.; Tian, W.; Hu, H. An experimental investigation on the dynamic ice accretion and unsteady heat transfer over an airfoil surface with embedded initial ice roughness. Int. J. Heat Mass Transf. 2020, 146, 118900. [Google Scholar] [CrossRef]
  14. Tsao, J.-C.; Kreeger, R. Further Evaluation of Scaling Methods for Rotorcraft Icing; 0148-7191; SAE Technical Paper; SAE International: Warrendale, PA, USA, 2011. [Google Scholar]
  15. Palacios, J.L.; Han, Y.; Brouwers, E.W.; Smith, E.C. Icing environment rotor test stand liquid water content measurement procedures and ice shape correlation. J. Am. Helicopter Soc. 2012, 57, 29–40. [Google Scholar] [CrossRef]
  16. Wright, J.; Aubert, R. Icing wind tunnel test of a full scale heated tail rotor model. In Proceedings of the AHS 70th Annual Forum, Montreal, QC, Canada, 20–22 May 2014; American Helicopter Society (AHS): Montreal, QC, Canada; pp. 20–22. [Google Scholar]
  17. Li, Y.; Sun, C.; Jiang, Y.; Feng, F. Scaling method of the rotating blade of a wind turbine for a rime ice wind tunnel test. Energies 2019, 12, 627. [Google Scholar] [CrossRef]
  18. Wang, Z.; Zhu, C.; Zhao, N. Experimental Study on the Effect of Different Parameters on Rotor Blade Icing in a Cold Chamber. Appl. Sci. 2020, 10, 5884. [Google Scholar] [CrossRef]
  19. Fortin, G.; Perron, J. Spinning rotor blade tests in icing wind tunnel. In Proceedings of the 1st AIAA Atmospheric and Space Environments Conference, San Antonio, TX, USA, 22–25 June 2009; American Institute Aeronautics and Astronautics: San Antonio, TX, USA, 2009; p. 4260. [Google Scholar]
  20. Narducci, R.; Kreeger, R.E. Analysis of a Hovering Rotor in Icing Conditions; NASA: Phoenix, AZ, USA, 2012.
  21. Narducci, R.; Kreeger, R.E. Application of a High-Fidelity Icing Analysis Method to a Model-Scale Rotor in Forward Flight; NASA: Virginia Beach, VA, USA, 2012.
  22. Chen, L.; Zhang, Y.; Wu, Q.; Chen, Z.; Peng, Y. Numerical simulation and optimization analysis of anti-/de-icing component of helicopter rotor based on big data analytics. In Communications in Computer and Information Science; Springer: Singapore, 2016; pp. 585–601. [Google Scholar]
  23. Liu, Y.; Li, L.; Li, H.; Hu, H. An experimental study of surface wettability effects on dynamic ice accretion process over an UAS propeller model. Aerosp. Sci. Technol. 2018, 73, 164–172. [Google Scholar] [CrossRef]
  24. Liu, Y.; Li, L.; Ning, Z.; Tian, W.; Hu, H. Experimental investigation on the dynamic icing process over a rotating propeller model. J. Propuls. Power 2018, 34, 933–946. [Google Scholar] [CrossRef]
  25. Müller, N.; Hann, R.; Lutz, T. UAV Icing: Numerical Simulation of Propeller Ice Accretion. In Proceedings of the AIAA Aviation 2021 Forum, Virtual Event, 2–6 August 2021; p. 2673. [Google Scholar]
  26. Siquig, R. Impact of Icing on Unmanned Aerial Vehicle (UAV) Operations; Naval Environmental Prediction Research Facility: Monterey, CA, USA, 1990. [Google Scholar]
  27. Yamazaki, M.; Jemcov, A.; Sakaue, H. A Review on the Current Status of Icing Physics and Mitigation in Aviation. J. Aerosp. 2021, 8, 188. [Google Scholar] [CrossRef]
  28. Bottyán, Z. In-flight icing characteristics of unmanned aerial vehicles during special atmospheric condition over the carpathian-basin. Acta Geogr. Debrecina Landsc. Environ. Ser. 2014, 7, 74–80. [Google Scholar]
  29. Szilder, K.; McIlwain, S. In-flight icing of UAVs–the influence of flight speed coupled with chord size. Can. Aeronaut. Space J. 2012, 58, 83–94. [Google Scholar] [CrossRef]
  30. Armanini, S.; Polak, M.; Gautrey, J.E.; Lucas, A.; Whidborne, J.F. Decision-making for unmanned aerial vehicle operation in icing conditions. CEAS Aeronaut. J. 2016, 7, 663–675. [Google Scholar] [CrossRef]
  31. Løw-Hansen, B.; Hann, R.; Stovner, B.N.; Johansen, T.A. UAV Icing: A Survey of Recent Developments in Ice Detection Methods. IFAC-Pap. 2023, 56, 10727–10739. [Google Scholar] [CrossRef]
  32. Enache, A.; Wallisch, J.; van Beeck, J.; Hendrick, P.; Hann, R. Ice Accretion: Image Post-Processing Measurement Techniques for 2D Ice Shapes. Aerospace 2023, 10, 451. [Google Scholar] [CrossRef]
  33. Hann, R.; Engineer, L.A. Requirements for Uav Operations in Cold Climates and Icing Conditions. 2024. Available online: https://www.ubiqaerospace.com/uav-requirements (accessed on 23 November 2021).
  34. Müller, N.C.; Løw-Hansen, B.; Borup, K.T.; Hann, R. UAV icing: Development of an ice protection system for the propeller of a small UAV. Cold Reg. Sci. Technol. 2023, 213, 103938. [Google Scholar] [CrossRef]
  35. Frey, M.; Müller, N.C.; Wallisch, J.; Hann, R. UAV Icing: Experimental Investigation and Numerical CHT Simulations of a Propeller Ice Protection System. In AIAA SCITECH 2024 Forum; American Institute of Aeronautics and Astronautics: Atlanta, GA, USA, 2024. [Google Scholar]
  36. Hann, R. Numerical Simulation of In-Flight Icing of Unmanned Aerial Vehicles. In Handbook of Numerical Simulation of In-Flight Icing; Habashi, W.G., Ed.; Springer International Publishing: Cham, Switzerland, 2020; pp. 1–44. [Google Scholar]
  37. Villeneuve, E.; Samad, A.; Volat, C.; Béland, M.; Lapalme, M. An Experimental Apparatus for Icing Tests of Low Altitude Hovering Drones. Drones 2022, 6, 19. [Google Scholar] [CrossRef]
  38. Villeneuve, E.; Samad, A.; Volat, C.; Béland, M.; Lapalme, M. Experimental Investigation of Icing Effects on a Hovering Drone Rotor Performance. Drones 2022, 6, 345. [Google Scholar] [CrossRef]
  39. Samad, A.; Villeneuve, E.; Volat, C.; Béland, M.; Lapalme, M. Experimental assessment of the ice protection effectiveness of electrothermal heating for a hovering drone rotor. Exp. Therm. Fluid Sci. 2023, 149, 110992. [Google Scholar] [CrossRef]
  40. Villeneuve, É.; Samad, A.; Volat, C.; Béland, M.; Lapalme, M. Experimental assessment of the ice protection effectiveness of icephobic coatings for a hovering drone rotor. Cold Reg. Sci. Technol. 2023, 210, 103858. [Google Scholar] [CrossRef]
  41. Harvey, D.; Villeneuve, E.; Volat, C.; Beland, M.; Lapalme, M. Experimental Evaluation of Icephobic Coatings on a UAV Propeller Operated in an Icing Wind Tunnel; SAE Technical Paper 2023-01-1443; SAE International: Warrendale, PA, USA, 2023. [Google Scholar]
  42. SAE International. Calibration and Acceptance of Icing Wind Tunnels; SAE International: Warrendale, PA, USA, 2003. [Google Scholar]
  43. SAE International. Droplet Size Instrumentation Used in Icing Facilities; SAE International: Warrendale, PA, USA, 1995. [Google Scholar]
  44. FAA. AC 29-2C Certification ofTransport Category Rotorcraft Transportation; United States Department of Transportation, Ed.; FAA: Washington, DC, USA, 2023; p. 1453.
  45. Jewel, B.; Barlow, W.H.R.; Pope, A. Low-Speed Wind Tunnel Testing, 3rd ed.; Wiley: Hoboken, NJ, USA, 1999; p. 736. [Google Scholar]
  46. Samad, A.; Villeneuve, E.; Blackburn, C.; Morency, F.; Volat, C. An experimental investigation of the convective heat transfer on a small helicopter rotor with anti-icing and de-icing test setups. Aerospace 2021, 8, 96. [Google Scholar] [CrossRef]
  47. Anttho, A.M.; Slupski, B.J.; Mohiudeen, A.; Kara, K. Determination of Water Droplet Collection Efficiency: An Empirical Model. In Proceedings of the AIAA Atmospheric Flight Mechanics Conference, Denver, CO, USA, 5–9 June 2017. [Google Scholar]
  48. Orchard, D. Investigation of Tolerance for Icing of UAV Rotors/Propellers: Phase 3 Test Results; No. LM-AL-2021-0051; Laboratory Memorandum (National Research Council of Ottawa, Canada. Aerospace. Aerodynamics Laboratory): Ottawa, ON, USA, 2021. [Google Scholar]
  49. Samad, A.; Villeneuve, E.; Morency, F.; Volat, C. A numerical and experimental investigation of the convective heat transfer on a small helicopter rotor test setup. Aerospace 2021, 8, 53. [Google Scholar] [CrossRef]
  50. Hansman Jr, R.J.; Yamaguchi, K.; Berkowitz, B.; Potapczuk, M. Modeling of surface roughness effects on glaze ice accretion. J. Thermophys. Heat Transf. 1991, 5, 54–60. [Google Scholar] [CrossRef]
  51. Chen, X.; Zhao, Q.-J. Numerical simulations for ice accretion on rotors using new three-dimensional icing model. J. Aircr. 2017, 54, 1428–1442. [Google Scholar]
  52. Lee, J.D.; Harding, R.; Palko, R.L. Documentation of Ice Shapes on the Main Rotor of a UH-1H Helicopter in Hover; Ohio State University: Columbus, OH, USA, 1984. [Google Scholar]
  53. Brouwers, E.W.; Palacios, J.L.; Smith, E.C.; Peterson, A.A. The experimental Investigation of A Rotor Hover Icing Model with Shedding. In Proceedings of the American Helicopter Society 66th Annual Forum, Phoenix, AZ, USA, 11–13 May 2010. [Google Scholar]
Figure 1. AMIL Icing Wind Tunnel.
Drones 08 00380 g001
Figure 2. Illustration of 80% scaled-down rotor assembly of the Bell APT70.
Drones 08 00380 g002
Figure 3. Experimental setup in the AMIL icing wind tunnel. The plate welded assembly ensures a rigid support for the rotor assembly while limiting airflow disturbances.
Drones 08 00380 g003
Figure 4. Example of a standard test procedure including RPM and thrust measurement.
Drones 08 00380 g004
Figure 5. A picture of the ice accumulation after an icing test for (A) the complete blade without shedding and (B) the blade with a full shedding.
Drones 08 00380 g005
Figure 6. A picture of the ice accumulation after an icing test for (A) the complete blade without shedding and (B) a blade with partial shedding (piece of ice shed but some ice still attached down to the root).
Drones 08 00380 g006
Figure 7. Picture of (A) glaze ice accumulation and (B) rime ice accumulation.
Drones 08 00380 g007
Figure 8. Percentage of thrust degradation for different LWCs at (A) −5 °C, (B) −12 °C, (C) −20 °C.
Drones 08 00380 g008
Figure 9. Thrust degradation at 5500 RPM, 0.5 g/m3, pitch of 15.7°, (A) −12 °C, and (B) −20 °C.
Drones 08 00380 g009
Figure 10. Top view pictures of the blades after an icing test at −12 °C, LWC of 0.5 g/m3, pitch of 15.7°, and 5500 RPM.
Drones 08 00380 g010
Figure 11. Front view pictures of the blades after an icing test at −12 °C, LWC of 0.5 g/m3, pitch of 15.7°, and 5500 RPM.
Drones 08 00380 g011
Figure 12. Thrust degradation at a pitch angle of 15.7°, a droplet size of 20 µm, (A) −12 °C LWC 0.5 g/m3, and (B) −20 °C LWC 0.2 g/m3.
Drones 08 00380 g012
Figure 13. Pictures of the blades after icing tests at −12 °C, 20 µm, 0.5 g/m3, (A) 5000 RPM with ice almost spread across the entire blade, and (B) 5500 RPM with no ice accumulation for about the last 20% of the blade.
Drones 08 00380 g013
Figure 14. Thrust degradation at −12 °C, a droplet size of 20 µm, (A) LWC 0.2 g/m3, and (B) LWC 0.5 g/m3.
Drones 08 00380 g014
Figure 15. Pictures of the blades after icing tests at −12 °C, 5000 rpm, MVD of 20 µm. For LWC = 0.2 g/m3, (A) pitch angle of 15.7° and (B) pitch angle of 17.7°. For LWC = 0.5 g/m3, (C) pitch angle of 15.7° and (D) a pitch angle of 17.7°. Both tests at 15.7° show that ice covers almost the entire blade span while tests at 17.7° have almost no ice accumulation for about the last third of the blade.
Drones 08 00380 g015
Table 1. Icing test parameters.
Blade PitchRotor SpeedAir VelocityTemperatureMVDLWC
(° at Tip)(103 RPM)(m/s)(°C)(µm)(g/m3)
Effect of LWC
15.75.535−5200.2, 0.5
15.75.535−12200.2, 0.5
15.75.535−20200.2, 0.5
Effect of MVD
15.75.535−1220, 40, 600.5
15.75.535−2020, 600.5
Effect of RPM
15.74.7, 5.0, 5.535−12200.5
15.75.0, 5.535−20200.2
Effect of blade pitch
15.7, 17.75.035−12200.2
15.7, 17.75.035−12200.5
Disclaimer/Publisher’s Note: The statements, opinions and data contained in all publications are solely those of the individual author(s) and contributor(s) and not of MDPI and/or the editor(s). MDPI and/or the editor(s) disclaim responsibility for any injury to people or property resulting from any ideas, methods, instructions or products referred to in the content.