Article

Feature-Enhanced Attention and Dual-GELAN Net (FEADG-Net) for UAV Infrared Small Object Detection in Traffic Surveillance

1
Department of Instrument Science and Technology, School of Automation and Electrical Engineering, University of Science and Technology Beijing, Beijing 100083, China
2
Xinjiang Vocational & Technical College of Communications, Urumqi 831401, China
3
Beijing Engineering Research Center of Industrial Spectrum Imaging, School of Automation and Electrical Engineering, University of Science and Technology Beijing, Beijing 100083, China
4
Beijing Institute of Space Launch Technology, Beijing 100076, China
*
Author to whom correspondence should be addressed.
Drones 2024, 8(7), 304; https://doi.org/10.3390/drones8070304
Submission received: 31 May 2024 / Revised: 1 July 2024 / Accepted: 2 July 2024 / Published: 8 July 2024

Abstract

:
With the rapid development of UAV and infrared imaging technology, the cost of UAV infrared imaging technology has decreased steadily. Small target detection technology in aerial infrared images has great potential for applications in many fields, especially in the field of traffic surveillance. Because of the low contrast and relatively limited feature information in infrared images compared to visible images, the difficulty involved in small road target detection in infrared aerial images has increased. To solve this problem, this study proposes a feature-enhanced attention and dual-GELAN net (FEADG-net) model. In this network model, the reliability and effectiveness of small target feature extraction is enhanced by a backbone network combined with low-frequency enhancement and a swin transformer. The multi-scale features of the target are fused using a dual-GELAN neck structure, and a detection head with the parameters of the auto-adjusted InnerIoU is constructed to improve the detection accuracy for small infrared targets. The viability of the method was proved using the HIT-UAV dataset and IRTS-AG dataset. According to a comparative experiment, the mAP50 of FEADG-net reached more than 90 percent, which was higher than that of any previous method and it met the real-time requirements. Finally, an ablation experiment was conducted to demonstrate that all three of the modules proposed in the method contributed to the improvement in the detection accuracy. This study not only designs a new algorithm for small road object detection in infrared remote sensing images from UAVs but also provides new ideas for small target detection in remote sensing images for other fields.

1. Introduction

With the rapid development of unmanned aerial vehicle (UAV) technology and infrared thermal imaging technology, UAVs with infrared thermal imaging cameras are now lightweight and miniaturized. Object detection technology based on infrared images from UAVs has shown better application potential in various fields, with advantages such as a low input cost, greater flexibility, and outstanding performance. Currently, target detection technology based on aerial images is being applied in the fields of agriculture [1,2], power transmission [3,4], rescue [5,6], security [7,8], transportation [9,10], and others. Among the object detection methods used to obtain aerial images, methods using visible and infrared image fusion have rich feature information and a relatively high target detection accuracy, but their data acquisition and processing costs are relatively high; a target detection model also has more parameters than other models, which affects its future applications. Object detection methods based on visible aerial images are affected by lighting and cannot detect objects properly under low-light conditions, whereas infrared aerial image target detection is not affected by complex environments and is not limited by light conditions. Therefore, infrared aerial target detection methods are widely used in rescue [11], firefighting [12], security [13], transportation [14,15], agriculture [16], and defense [17]. A schematic diagram of these applications is shown in Figure 1.
In Figure 1, it can be seen that researchers in different fields have carried out a number of studies that demonstrate the applications of object detection techniques using infrared aerial images, to widen the extent of their usage. For example, Sumanta Das et al. [18] proposed a method for crop disease detection and soil quality detection based on infrared images from UAVs; this method takes advantage of the flexibility and miniaturization of UAVs and combines these qualities with the anti-interference aspects of infrared images to measure the temperature characteristics of crops and soil. Using wheat as an example, they illustrated the advantages of infrared aerial image target detection in crop monitoring. Zhanchuan Cai et al. [19] proposed a wildlife observation method based on UAV infrared images. On the basis of an existing deep learning network framework, they used UAV aerial infrared images to build an ISOD wildlife detection dataset and proposed a CE (channel enhancement) module to enhance the image features, thereby improving the wildlife detection accuracy. Ziyan Liu et al. [20] proposed a road vehicle detection method based on UAV infrared images; they constructed a lightweight feature fusion network and fused the target features from the infrared images to achieve a high level of accuracy when detecting road vehicle targets. A. Polukhin et al. [21] proposed an infrared image target detection method using a YOLOv50-based framework for rescue operations; this method reduces network information redundancy and processes UAV infrared images to detect specified targets. Xiwen Chen et al. [22] proposed a fire detection method based on UAV infrared images; the method used abundant UAV infrared image data to detect wildland fires through multi-modal feature extraction, and it simplified the firefighting department’s work. Because UAV infrared image target detection technology has the advantages of flexible flight, relatively low cost, and no light limitations, it has great application potential in the field of traffic monitoring. Infrared UAV object detection is more flexible than the traditional methods and is capable of monitoring object conditions in the blind spots of fixed traffic surveillance cameras. Although infrared image object detection has been preliminarily applied to traffic surveillance, there are still some problems. Because the UAV flying altitude is higher than the installation height of ordinary traffic surveillance cameras, the distance between the target and the UAV is large, and the size of the target in the infrared image is smaller. In addition, infrared images have lower contrast, lack of color, and less textural information compared to visible images. Therefore, the accuracy of infrared aerial image-based small object detection algorithms is low, and algorithms need to be improved to achieve the expected performance in practical applications.
In order to improve the accuracy of small object detection in infrared images for traffic surveillance, researchers have referenced different fields of small target detection methods that use UAV infrared images. For example, Victor J. Hansen et al. [23] proposed a small target detection method for rescue search. They constructed a deep learning small target detection network to process UAV infrared images, to find small targets within a large field of view under poor weather conditions, so as to improve the efficiency of rescue missions. Hu, Shuming et al. [24] proposed a small object detection method based on UAV infrared images. They constructed a new lightweight model based on the YOLOv7-tiny model and verified the effectiveness of the algorithm by detecting vehicles in a traffic scene; however, the algorithm was relatively weakly focused and did not clearly detect objects. Kim Jaekyung et al. [25] proposed a small object detection method based on infrared remote sensing images. The detection network was optimized using the YOLOv5 model as a framework to detect pedestrians and vehicles, but the final detection accuracy of the method was low and was less than 70% for pedestrians and vehicles. Yasmin M. Kassim et al. [26] proposed a small bird detection method based on UAV infrared images. They processed infrared images to detect small bird targets using Mask R-CNN and transfer learning. Although the method enabled the detection of small bird targets, it was only possible to discover whether there was a bird or not, but not to classify the birds. Yan Zhang et al. [27] proposed a pedestrian detection method based on UAV images. In this method, visible infrared images were used to establish a VTUAV-det dataset and construct a QFDet model to detect pedestrians, but the method only detected pedestrians, which limits its future application and extension.
Although the researchers mentioned above carried out a lot of work on small target detection for infrared UAV aerial images, the number of classifications for small target detection was quite low. For example, only two categories of pedestrians and vehicles were detected in the study by Kim Jaekyung et al. [25], and the detection model design by Zhang et al. [27] is only for pedestrians, so it cannot meet real detection task requirements. In the study by Hu, Shuming et al. [24], the larger target size occupied relatively more pixels in an image and the object feature information was more obvious, which is generally not compatible with real small target detection application scenarios. Therefore, to solve these problems with the existing methods and make detection algorithms more suitable for real traffic monitoring tasks, this study focused on the characteristics of infrared UAV aerial images with low contrast, less color, and less texture information, and proposed a new algorithm for the detection of small road objects based on infrared UAV aerial images. In order to improve the accuracy of small object detection, feature-enhanced attention and dual-GELAN net (FEADG-net) is designed, and a swin transformer feature-extracting backbone (STFE-backbone) is used to extract small object feature information on the basis of low-frequency enhancement; in addition, multidimensional feature fusion is carried out using a dual-GELAN neck (DGneck) structure. Finally, the loss value of the detection algorithm is calculated using the parameters of auto-adjusted InnerIoU. This study promotes the further application of UAV infrared images in the field of traffic and improves on the robustness of the existing target detection methods based on aerial infrared images for the detection of small road objects. It is also informative for other object detection application fields based on aerial images.
In this study, we make some new contributions related to network structure and loss function in order to address the problem of small road target detection in the infrared remote sensing images of UAVs; our contributions are as follows:
(1) A backbone network that combines target feature enhancement and an attention mechanism is proposed. In order to effectively extract the target features of UAV infrared remote sensing images, this study constructs a feature extraction network with an image enhancement function; it enhances the low-frequency feature information of infrared images and extracts the target’s edges, textures, and other features using a swin transformer attention mechanism.
(2) A new feature fusion network is proposed. In order to avoid the problem of a vanishing gradient or weakening gradient in the deep layer of the network, this study constructs a DGneck based on the GELAN structure of yolov9 [28] to better fuse the different features of small targets in UAV infrared remote sensing images.
(3) Based on the innerIoU [29], a loss function with automatic adjustment of the parameters is proposed. To address the problem of the artificial adjustment of parameters in the existing innerIoU calculation algorithm, a calculation using the parameters of the auto-adjusted InnerIoU is proposed. The loss function is constructed using the new innerIoU, in order to improve the robustness of the detection model.
(4) The detection types are raised to eight, and the detection accuracy of six of these types reached 90%. Few of published studies detected eight types of UAV infrared image targets; this study analyzed eight types of targets, six of which were detected with more than 95% accuracy.

2. Materials and Methods

2.1. Datasets

The dimensions of the objects in UAV infrared images are different from one scene to the next in practical road target detection. In order to verify the effectiveness of the proposed algorithm for road target detection in the infrared images of different traffic scenes, we selected the HIT-UAV dataset and the IRTS-AG dataset in this study; the HIT-UAV dataset has a small number of samples, and the IRTS-AG dataset has a relatively large number of samples with relatively small instance sizes.

2.1.1. HIT-UAV Dataset

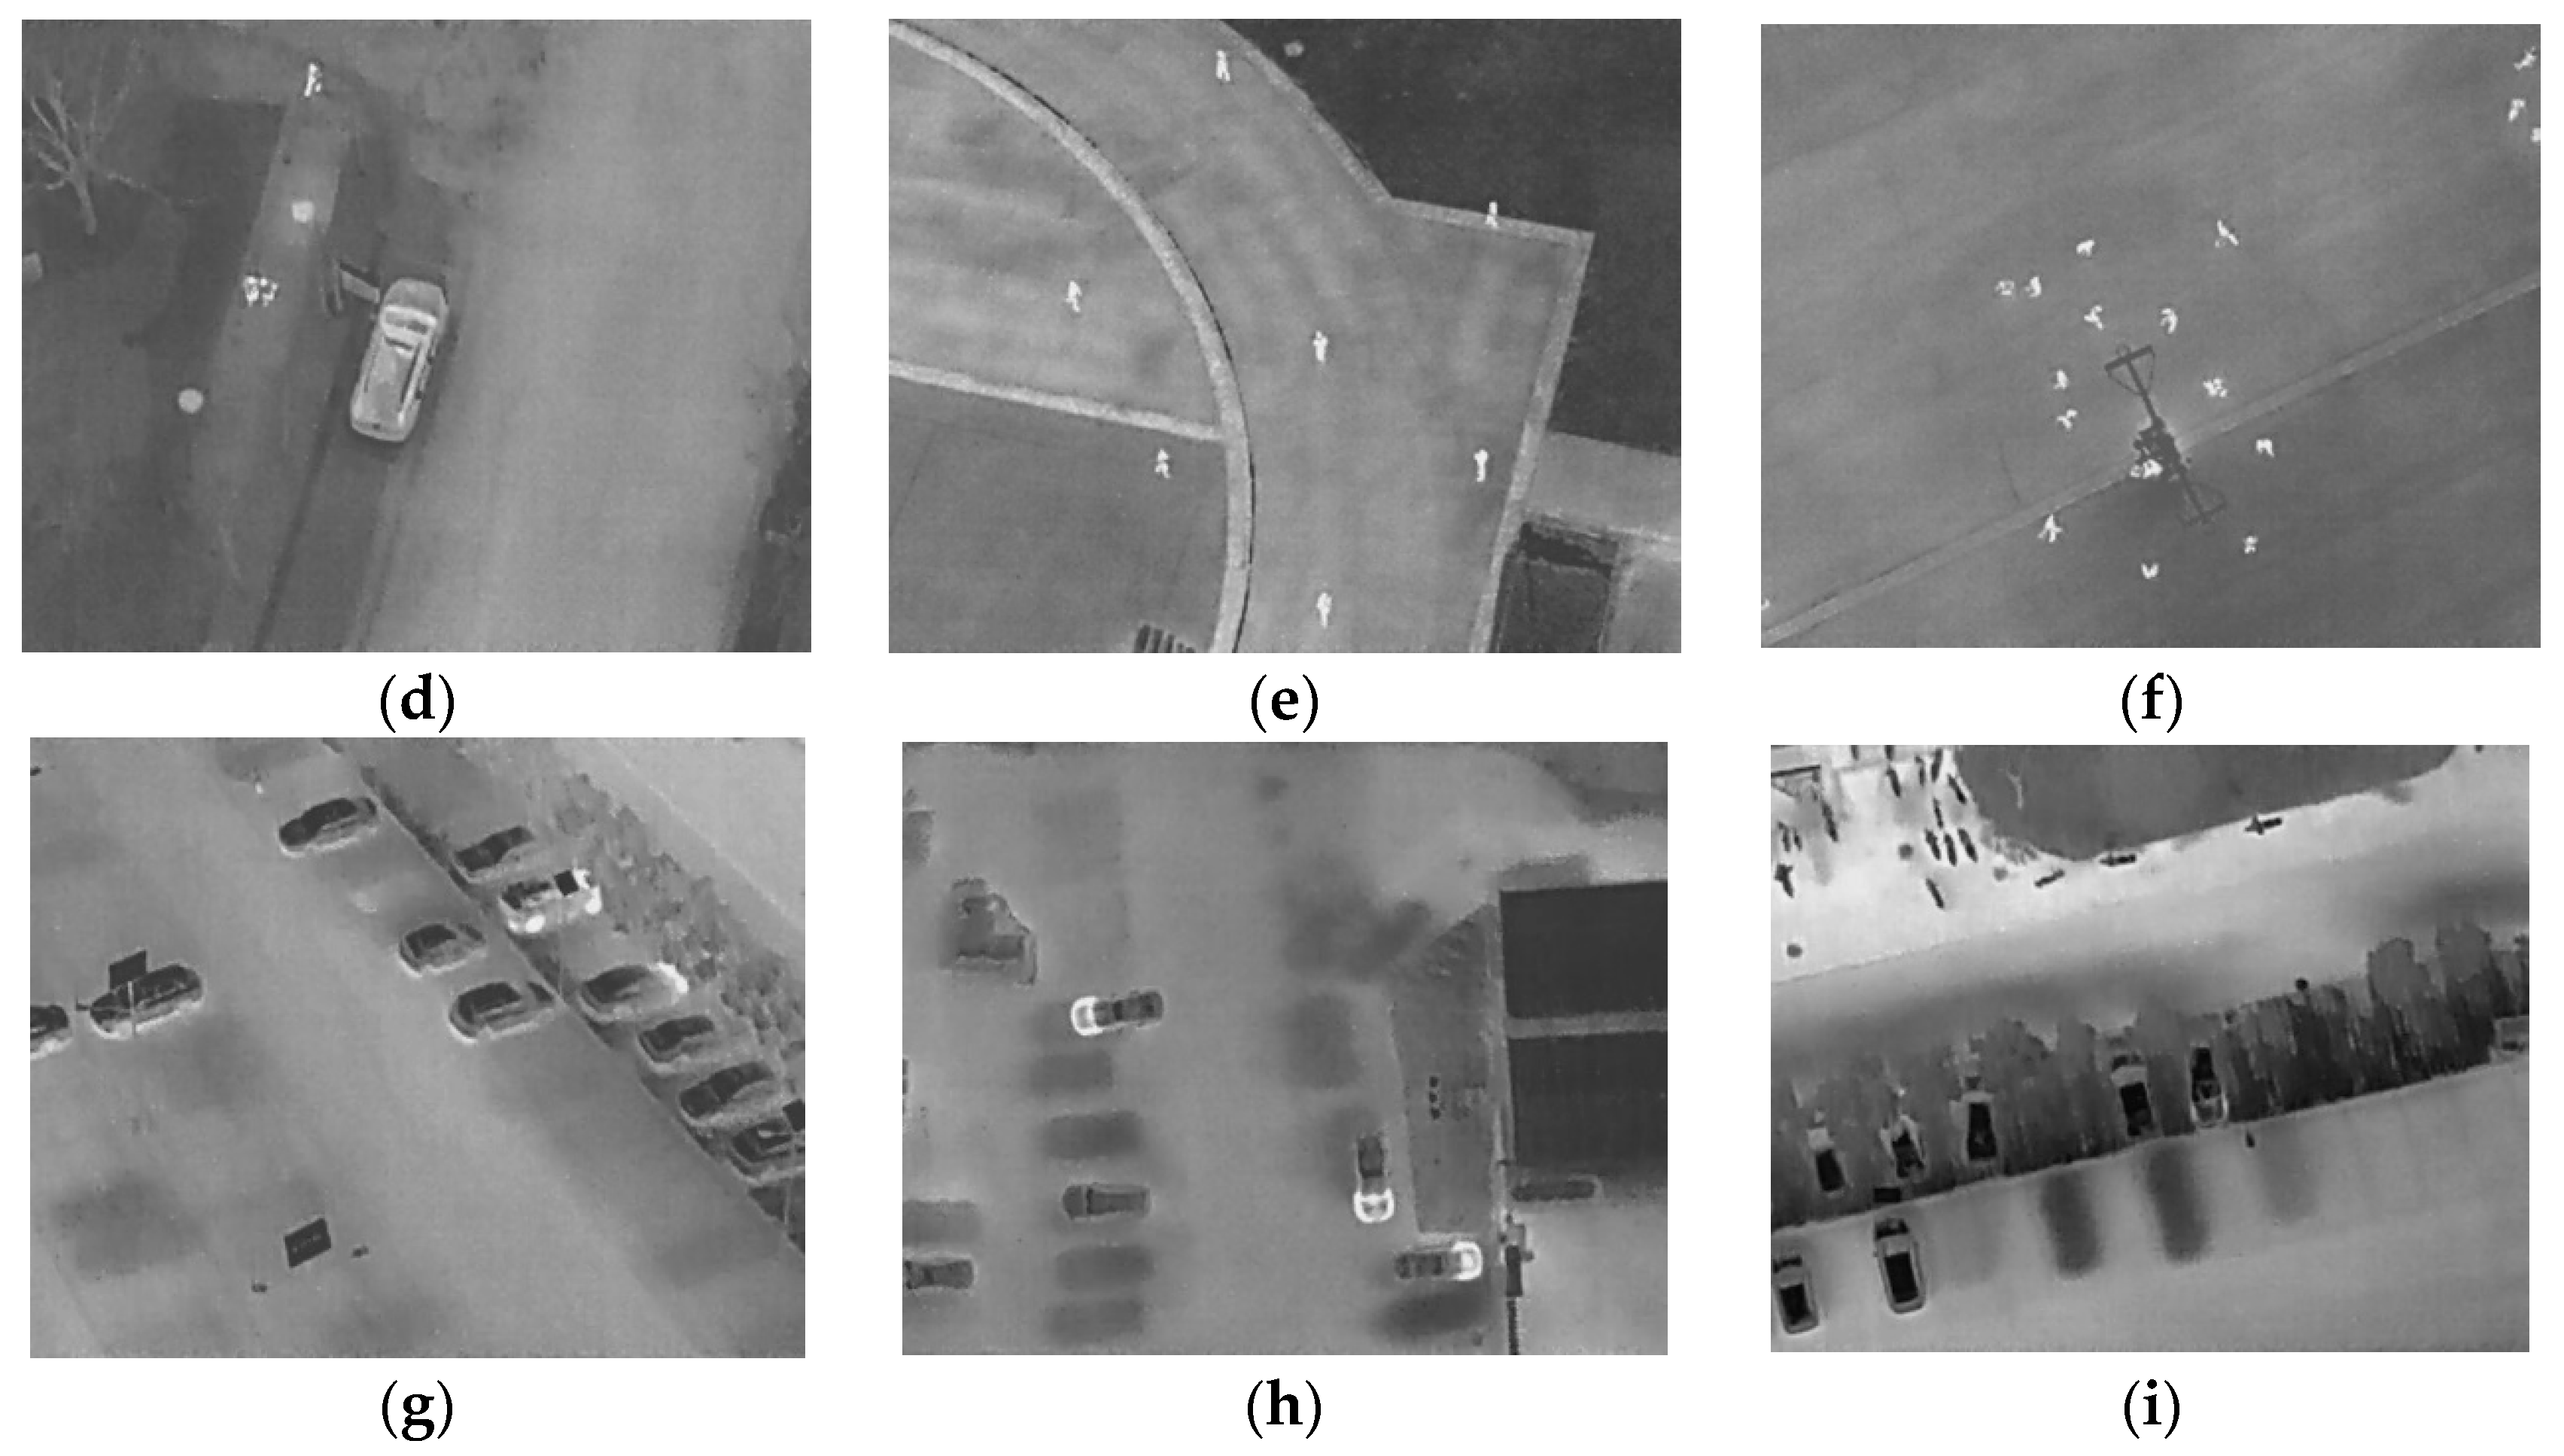
The HIT-UAV dataset was released by Zhang et al. [30] from the Chinese Academy of Sciences. It is UAV-based infrared thermal dataset for detecting persons and vehicles. In particular, it has been used to verify different models for object detection in traffic surveillance scenarios. The dataset was acquired using a DJI Matrice M210 V2 UAV with a DJI Zenmuse XT2 camera, which captured long-wave infrared images at heights ranging from 60 m to 130 m and at shooting angles ranging from 30° to 90°. The dataset contains 2898 infrared aerial remote sensing images with a resolution of 640 × 512 pixels, including 5 types of targets with 24,899 instances, such as people, cars, bicycles, other vehicles, and various others from scenes such as parks, schools, playgrounds, and roads. Some sample images from this dataset are shown in Figure 2.
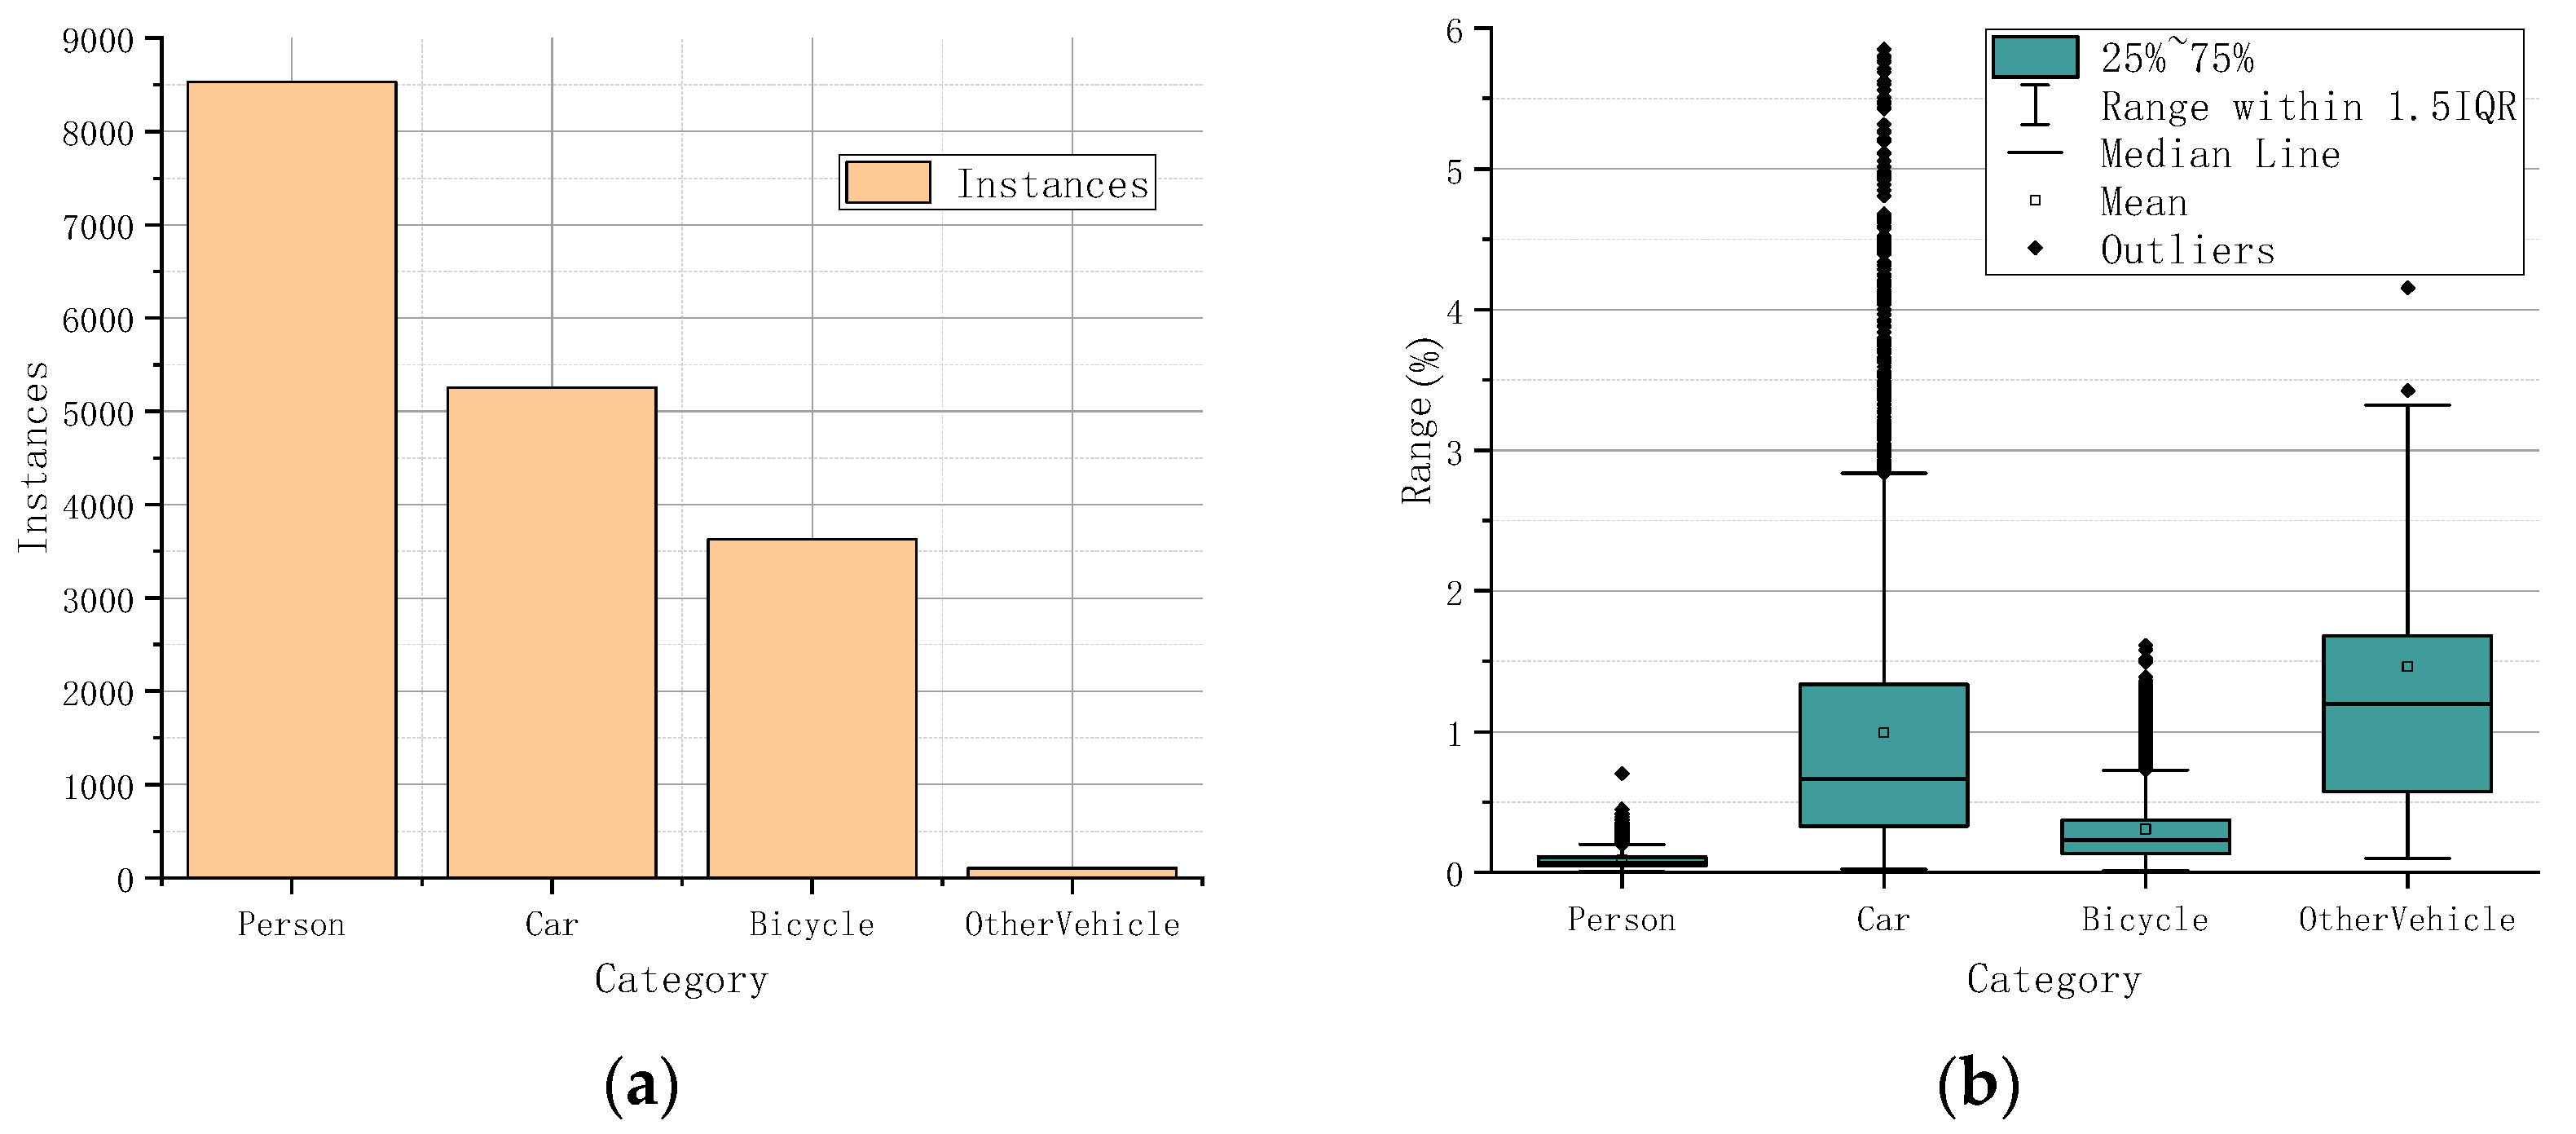
Because the “don’t care” category in the HIT-UAV dataset has no specific corresponding objects in reality and its instance number is small, the “don’t care” category was excluded from the HIT-UAV dataset to ensure the validity of the experiments related to the detection algorithm. After removing the “don’t care” category, this dataset was able to validate the specific performance of the algorithm for the detection of small sample targets. The distribution of the instance numbers of the different categories and the relative size distribution of the instances in the HIT-UAV dataset are shown in Figure 3.
As can be seen in Figure 3a, the category with the highest number of instances in this dataset is people, with more than 8000. It decreases in the order of cars, bicycles, and other vehicles, and the number of instances for vehicles is less than 1000. The relative size distribution of the target instances of the HIT-UAV dataset is given in Figure 3b. In the box plot, the horizontal axis represents the different categories, and the vertical axis represents the percentage of the instances that occupy the infrared image; this value is calculated using the label parameter corresponding to the instances, which is given as follows:
E = h × H × w × W H × W × 100
where E is the percentage of instances that occupy the image, h is the height ratio given in the label corresponding to the instance (taking a value in the range of 0–1), w is the width ratio given in the label corresponding to the instance (taking a value in the range of 0–1), H is the height of the sample infrared images (pixels), and W is the width of the sample infrared images (pixels). According to the box plots, the instance sizes of the people and bicycles categories are relatively small, and the instance sizes of the cars and other vehicles are relatively large, but all the mean values of the instance percentages for each category are less than 1.5%, which indicates that the HIT-UAV dataset instance sizes are small and could be used as a small object dataset to validate the UAV infrared small target detection algorithm.

2.1.2. IRTS-AG Dataset

The IRTS-AG dataset [31,32] was released by Hongqi Fan et al. in 2022. It was collected by UAVs with long-wave infrared cameras, which had a field of view 5.3° × 4.0°. There are 21,750 images in the IRTS-AG dataset, and each infrared image has a resolution of 640 × 480 pixels, in bmp image format. This dataset is generally used to verify a model’s effectiveness in detecting and tracking small-scale vehicles in complex traffic monitoring scenarios. Some sample images from the IRTS-AG dataset are shown in Figure 4.
The dataset has 8 different types of targets and 89,174 instances. The dataset was used for target detection and tracking, and it was divided into 87 folders according to the video sequences; however, this was not suitable for the training process of the infrared small target detection model. Therefore, this study put all the images in the same folder, and then divided them into three parts: training, value, and test, at a ratio of 6:2:2. On this basis, we carried out the training of the small target detection model for the UAV infrared remote sensing images. The distribution of the instance numbers and the sizes in the different categories in the IRTS-AG dataset are shown in Figure 5.
As can be seen in Figure 5a, the dataset does not give the names of the corresponding categories; it only gives the category ID numbers 0, 1, 2, …7, where category 0 has the highest number of target instances, at around 20,000. Category 7 has the lowest number of target instances, at less than 1000. Figure 5b gives the distribution of the relative sizes of the instances in the IRTS-AG dataset. In the box plot, the horizontal axis represents the eight different categories, and the vertical scale represents the percentage of the instances’ pixels occupying the infrared image, which is calculated according to Formula (1). From the box plot, it can be seen that the percentage of all the instances in the dataset is less than 0.35% and that the mean percentage of the instances from the different categories is less than 0.1%. Therefore, the UAV infrared image small target detection model proposed in this study could be validated with the IRTS-AG dataset.

2.2. Method

In UAV infrared remote sensing images, there is low contrast and relatively little target texture and color information, which increases the difficulty of small target detection. In order to obtain more target feature information and to improve the small target detection accuracy of infrared remote sensing images, this study proposes a feature-enhanced attention and dual-GELAN net (FEADG-net), which is based on image feature enhancement, feature fusion, and small target detection theory. FEADG-net consists of three main parts: the backbone, neck, and head; an overall structural block diagram is shown in Figure 6.
In the backbone of FEADG-net, image enhancement is performed using the feature enhancement module, before target feature extraction, and then the swin transformer framework is used to extract infrared small target feature information (Stage2 and Stage3 are omitted in Figure 6, ×2 indicates that there are two modules here, and the detailed structure can be seen in Figure 7). The small target feature information is fused and processed using a dual-GELAN [28] neck structure, which lays the foundation for subsequent small target detection and recognition. Finally, the fused features are passed through a detection head containing the parameters of the auto-adjusted loss function, to detect the corresponding target.

2.2.1. Backbone

It is well known that small targets in infrared images have low contrast and that the key features are relatively insignificant. The swin transformer’s [33] feature extraction capability is strong and is based on an attention mechanism [34]. Therefore, this study combines a feature enhancement mechanism and swin transformer to construct a feature-enhancing swin transformer backbone (FEST-backbone) for infrared small targets. An overall structural block diagram of the FEST-backbone is shown in Figure 7.
In Figure 7, it can be seen that the FEST-backbone consists of two parts: the first part is the image enhancement part based on low-frequency enhancement [35], and the second part is the small target feature extraction part for the UAV infrared remote image sensing based on the swin transformer. When the infrared images are input into the backbone network, they first go through the image enhancement module to strengthen their weak texture information and edge information. The image enhancement module filters the image using a low-frequency enhancement filter and then upsamples it to obtain an infrared image with relatively clearer features for small targets. The enhanced image is fed into a feature extraction network based on the swin transformer framework, which consists of a four-stage swin transformer block. Because the swin transformer block has a strong attention mechanism, it is able to extract the feature information of specific small targets, which provides support for improvement of the small target detection accuracy.

2.2.2. Neck

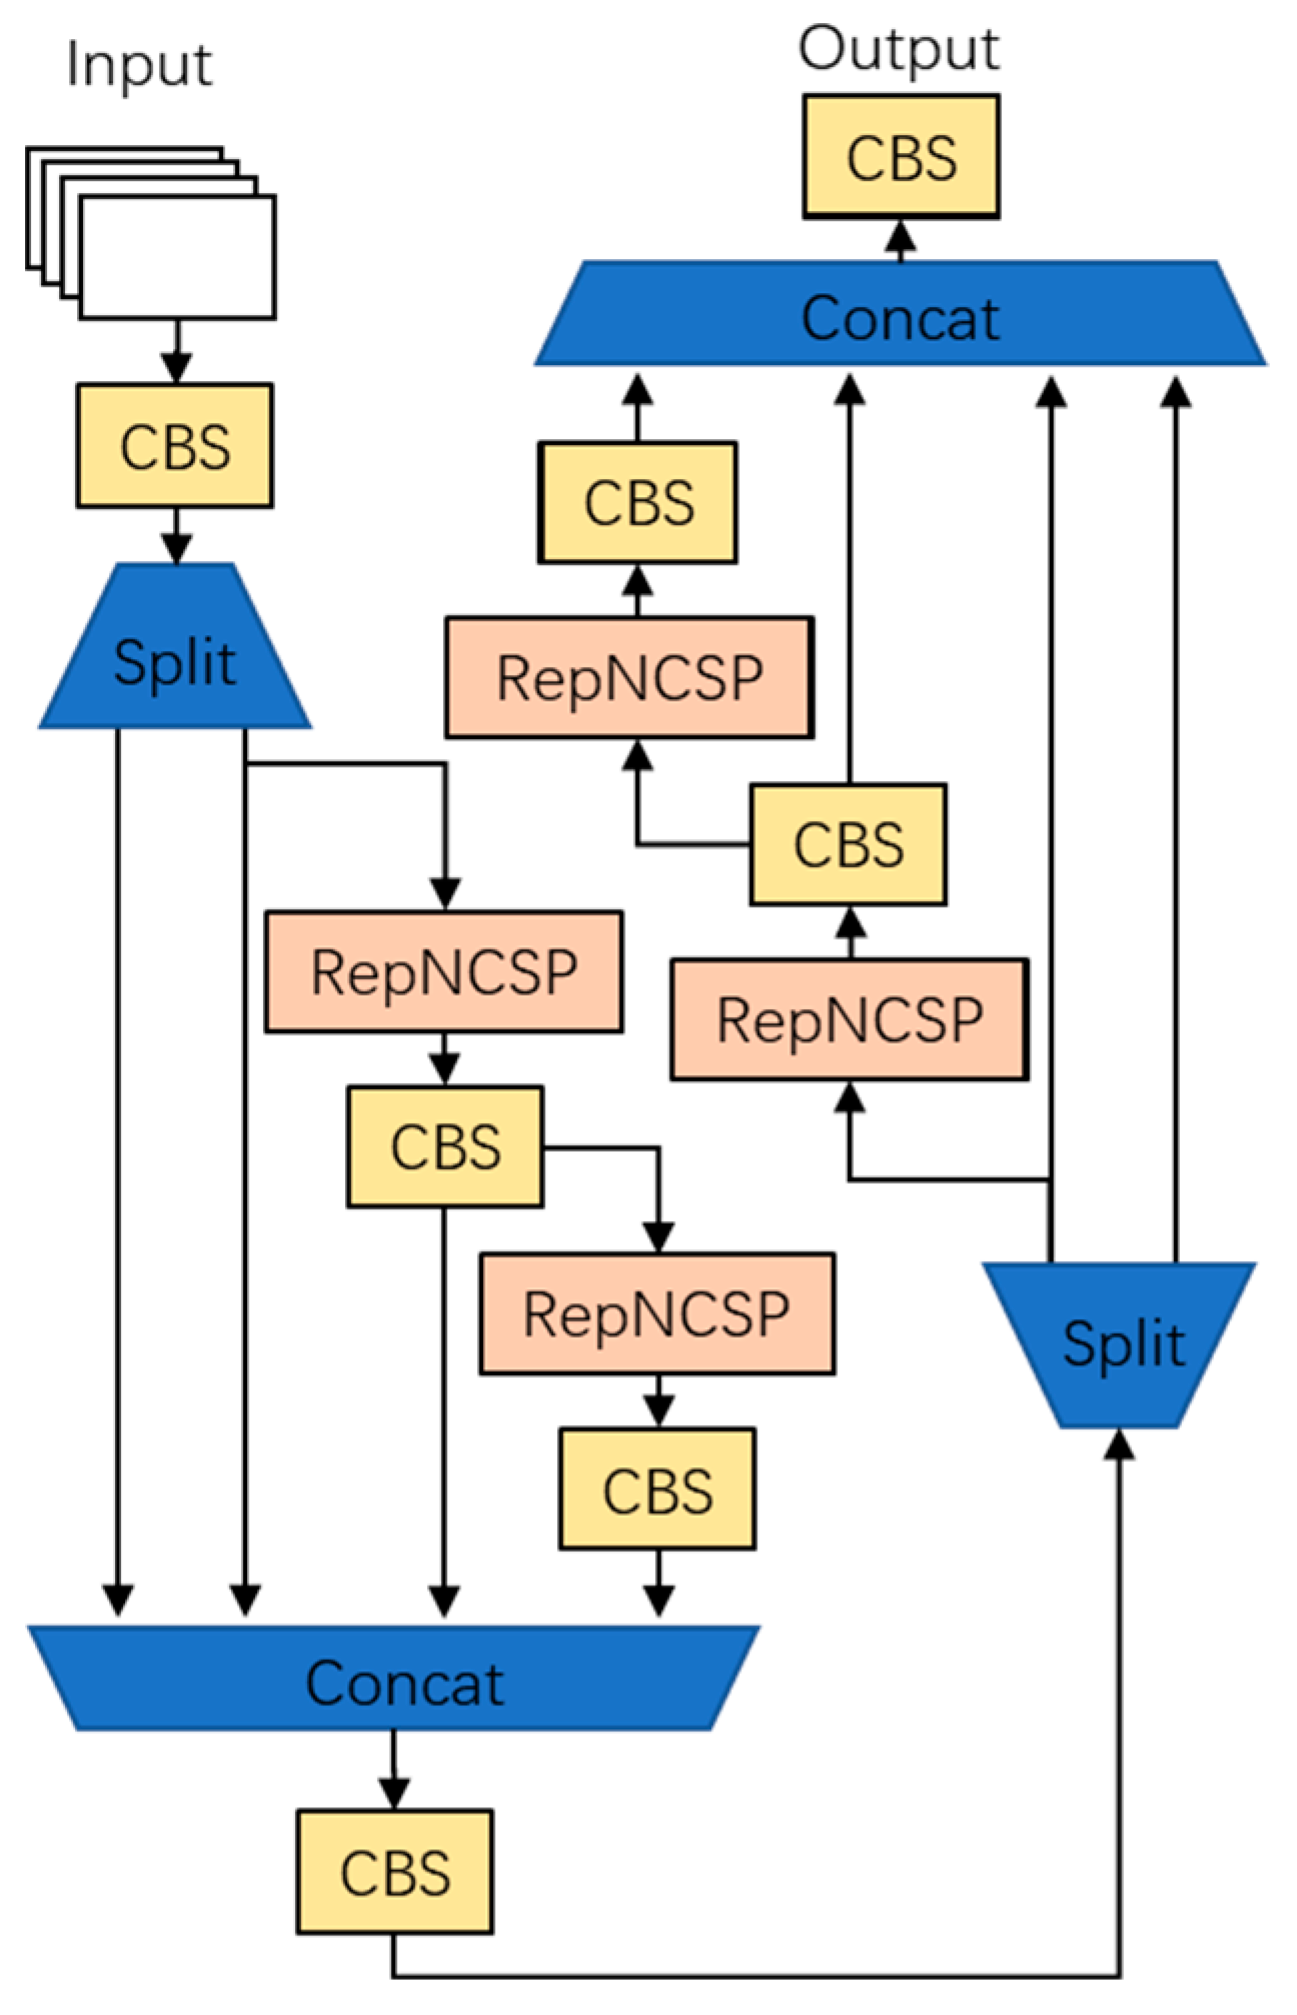
To improve the feature fusion and feature learning ability of the FEADG-net network, this study designed a dual-GELAN neck (DGneck) structure based on the RepNCSPELAN4 module from yolov9 [28]. DGneck mainly consists of two RepNCSPELAN4 networks connected in a series, which can strengthen the feature fusion capability of the neck. When designing DGneck, we considered using more RepNCSPELAN4 modules, but we found through experiments that more RepNCSPELAN4 modules did not significantly improve the model detection accuracy, and it also increased the model parameters, which consumed computational resources and reduced the robustness of detection model. Figure 8 shows a schematic diagram of the DGneck structure.
As shown in Figure 8, the features from the FEST-backbone are fed into the DGneck module, which consists of two main modules: the RepNCSP and CBS. According to research by ChienYao Wang et al., GELAN has a better multi-scale fusion ability. The multi-scale feature fusion ability of the neck structure was further enhanced by the use of a DGneck structure with dual RepNCSPELAN4 modules in this study. In the DGneck network structure, the RepNCSP and CBS structures were used to effectively transmit the gradient information of the target features; internal structure block diagrams are shown in Figure 9.
In Figure 9, it can be seen that the RepNCSP structure mainly consists of two parts, the RepNBottleneck and CBS, in which the feature data are transferred through the CBS sideways to avoid disappearance of the gradient during the learning process. The schematic diagram of the RepNBottleneck network structure shows not only its internal structure, but also the internal components of the CBS and CB; these components consist of basic modules, such as Conv2d, BatchNorm2d, and the SiLu activation functions, which take advantage of Resnet’s direct gradient passing structure to optimize the performance of the neck structure. The effectiveness of this DGneck was verified in the following sections using ablation experiments.

2.2.3. Head

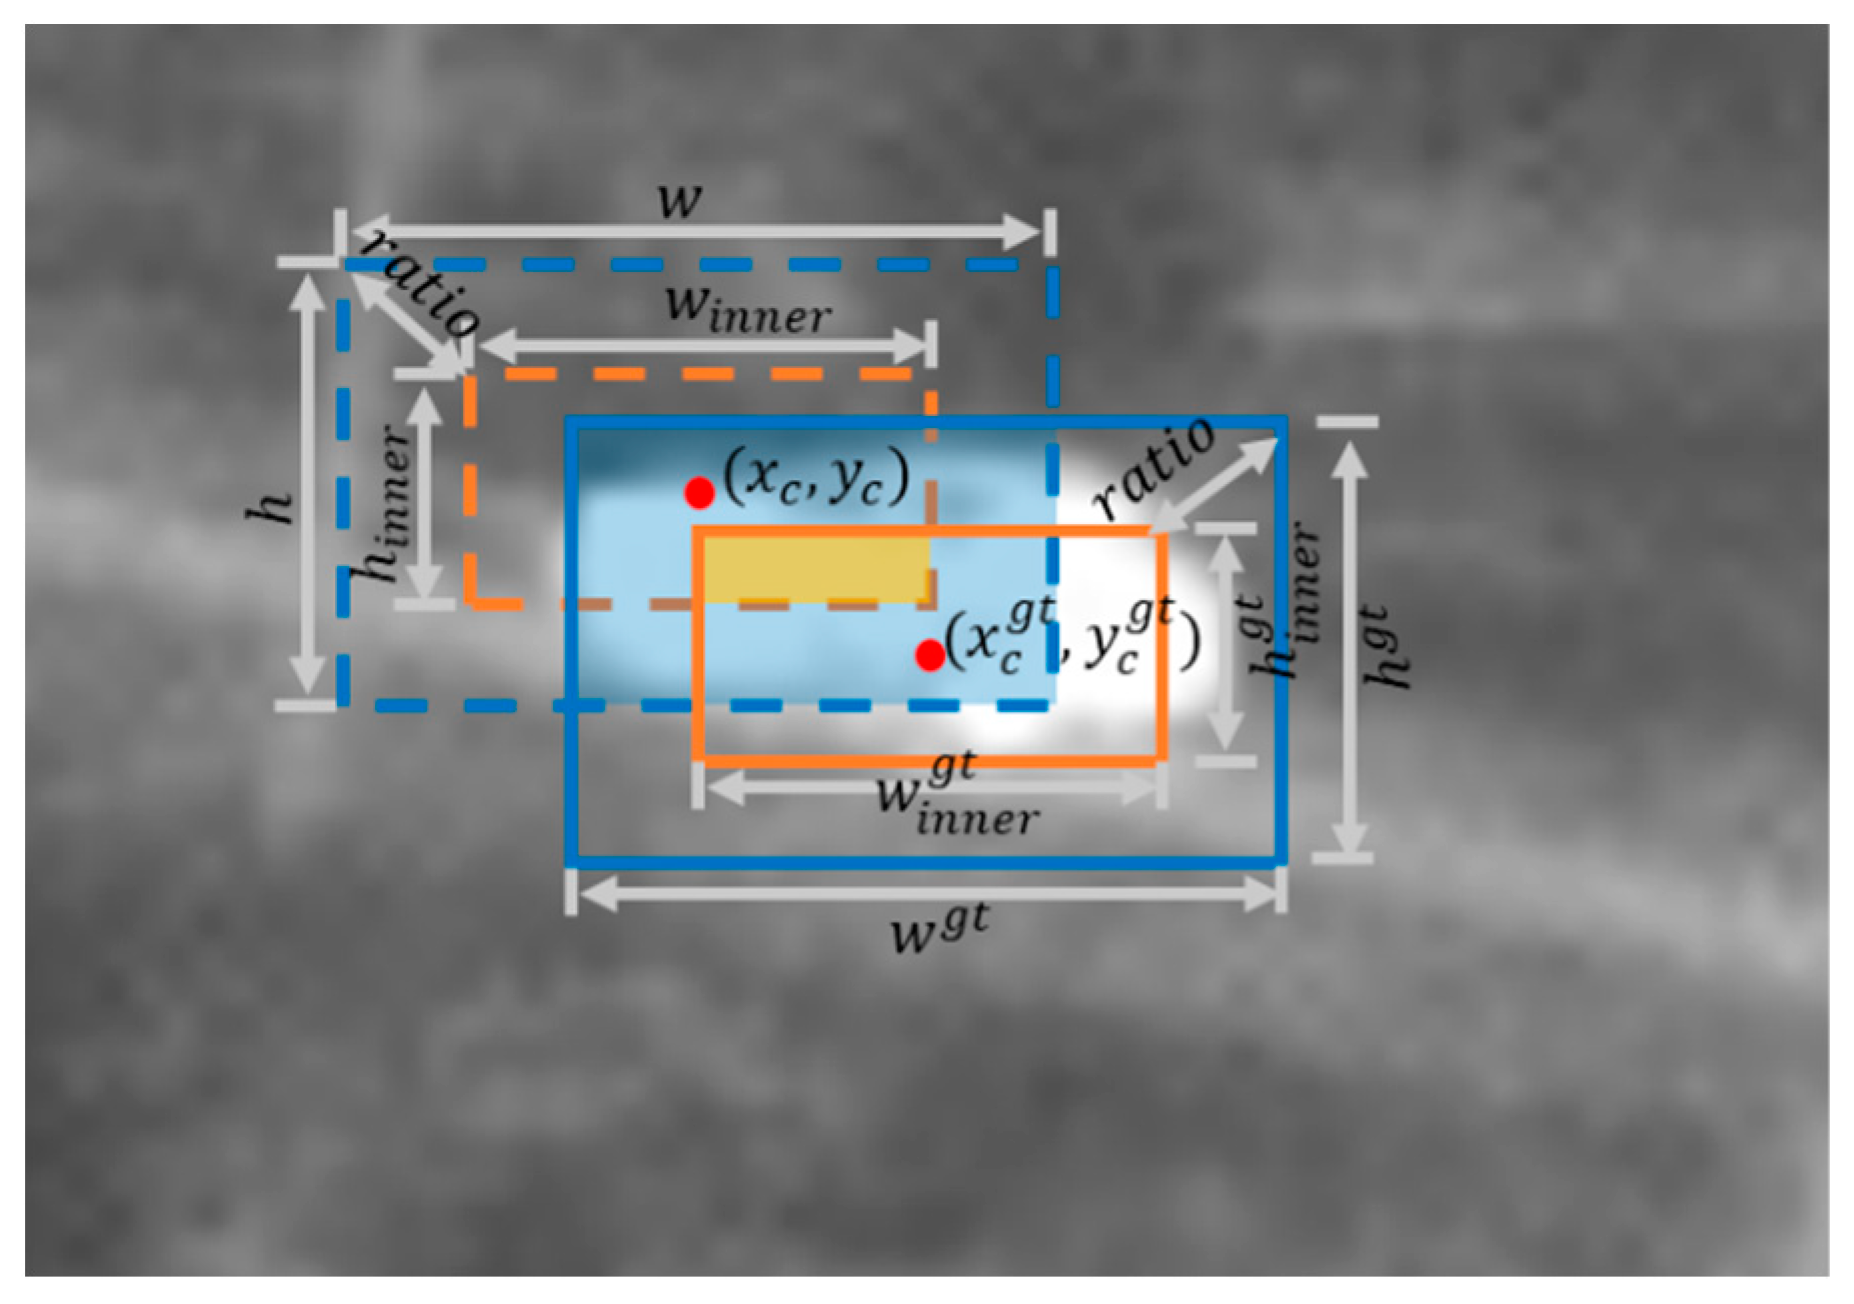
In the head of the target detection model, the calculation result of the loss function can directly affect the model training and model prediction. According to the definition of the detection model’s loss function, the process of calculating the IoU affects the result of the loss function. In small target detection using infrared remote sensing images, the target causes a large fluctuation in the calculation results in the IoU operation because it occupies a small number of pixels in the infrared image, which negatively impacts the training process and reduces the detection accuracy. Therefore, in order to improve the training efficiency and detection accuracy of the small target model, this study used the characteristics of IoU computation and optimized the computation process on the basis of innerIoU [29], using the parameters auto-adjusted InnerIoU ( I o U a u t o i n n e r ) algorithm(PAIIoU). A schematic diagram of the relevant parameters of the algorithm in the image plane is shown in Figure 10.
As shown in Figure 10, the parameters auto-adjusted InnerIoU algorithm inherited most of the parameters of the original InnerIoU algorithm [29]. The original InnerIoU method has obvious advantages over the traditional IoU in terms of improving the model training convergence speed and detection accuracy of small target detection methods. However, there is a problem with the process of InnerIoU calculation, namely the fact that the size of the inner box is determined by the parameter ratio, which is artificially specified based on the high or low sample IoU, and the ratio cannot be changed during the process. In order to solve this problem, this study proposed an InnerIoU calculation method with auto-adjusted parameters. The r a t i o a u t o is automatically adjusted in this method, and the auto-adjustment mechanism dynamically adjusts the value of r a t i o a u t o according to the sample IoU statistics of each round of training. When the number of low IoU samples is greater than 50% of the total number of samples, the initial auto is 1.4, and its value is adjusted in intervals to reduce its value. When the number of high IoU samples is greater than 50% of the total number of samples, the corresponding auto is 0.6, and the value is adjusted in intervals to reduce its value. It should be noted that the fixed ratio value ranges [0.5–1.5] according to the original InnerIoU algorithm [29] theory. In order to guarantee the stability of the algorithm, the initial ratio values were set to 1.4 and 0.6 in the auto-adjusted InnerIoU algorithm. The inner box was changed by adjusting the ratio value, which promoted the robustness of the detection model. The calculation formula for auto in this method was as follows:
r a t i o a u t o = 1.4 0.05 n                 l o w I o U > 50 % 0.6 + 0.05 n               h i g h I o U 50 %
where r a t i o a u t o is the result of the automatic tuning of the parameters, n is the number of training times, l o w I o U represents the number of low IoU samples, and h i g h I o U is the number of high IoU samples. New I o U a u t o i n n e r formulas can be derived from the r a t i o a u t o formulas, which are as follows:
b l g t = x c g t w g t × r a t i o a u t o 2 , b r g t = x c g t + w g t × r a t i o a u t o 2
b t g t = y c g t h g t × r a t i o a u t o 2 , b b g t = y c g t + h g t × r a t i o a u t o 2
b l = x c w × r a t i o a u t o 2 , b r = x c + w × r a t i o a u t o 2
b t = y c h × r a t i o a u t o 2 , b b = y c + h × r a t i o a u t o 2
i n t e r a u t o = m i n b r g t , b r m a x b l g t , b l × m i n b b g t , b b m a x b t g t , b t
u n i o n a u t o = w g t × h g t × r a t i o a u t o 2 + w × h × r a t i o a u t o 2 i n t e r a u t o
I o U a u t o i n n e r = i n t e r a u t o u n i o n a u t o
The loss function L a u t o i n n e r can be derived based on the new r a t i o a u t o , which is calculated as follows:
L a u t o i n n e r = 1 I o U a u t o i n n e r
The effectiveness of this loss function could be verified through subsequent ablation experiments, and it contributed to the improvement of small target detection accuracy.

3. Experimental Results

In order to verify the ability of FEADG-net to detect small targets in complex scenarios, this study applied FEADG-net to the HIT-UAV dataset and IRTS-AG dataset to detect small targets, and obtained the detection accuracy of the algorithm, which reaches more than 85%. In this study, the experimental hardware platform’s CPU was an Intel(R) Core(TM) i5-13400, the memory was 32 G, the GPU was NVIDIA GeForce RTX 3060, and the software operating system was Microsoft Windows 11 Professional Edition. To verify the effectiveness of FEADG-net relative to other algorithms, this study carried out comparative experiments to compare the detection accuracy of FEADG-net with that of yolov3 [36], yolov5 [37], yolov8 [38], yolov9 [28], and RTDETR [39] using the same dataset. Ablation experiments were also carried out to verify the effectiveness of the newly designed internal modules, such as FEST-backbone, DGneck, and loss function L a u t o , by replacing or eliminating three new modules in FEADG-net.

3.1. Relevant Metrics

To evaluate the performance of the deep learning road target detection algorithms for infrared images, this section briefly describes the metrics of precision, AP, mAP, and mAP50 that were used in the experiments, which were based on existing machine learning and pattern recognition theories.

3.1.1. Precision

We assume that the samples to be predicted consist of two parts: positive and negative samples. These are classified into four different types according to the prediction results: (I) TP: true positive, the number of positive samples that are correctly predicted; (II) FP: false positive, the number of negative samples that are predicted as positive; (III) TN: true negative, the number of negative samples that are correctly recognized; and (IV) FN: false negative, the number of positive samples predicted as negative. Based on these concepts, the definition of precision P can be obtained, which is equal to the ratio of the number of positive samples predicted correctly to the number of all the samples predicted as positive; the formula is as follows:
P = T P T P + F P
where P is the accuracy, T P is the number of positive samples correctly predicted, and F P is the number of negative samples incorrectly predicted.

3.1.2. Average Precision A P

Assuming that there are n samples in a category from the dataset, in which there are m positive examples, the maximum accuracy P is calculated for each positive sample; then, the mean of these m values of P is calculated to obtain the average accuracy A P . The formula for calculating the average accuracy A P is as follows:
A P = 1 m i m P i
where A P is the average precision, m is the positive samples in a category, and P i is the maximum precision corresponding to the i th positive sample.

3.1.3. m A P

There is generally more than one category in a dataset or a particular object detection task. m A P is obtained by averaging the A P s of all the categories of the dataset, which is calculated as follows:
m A P = 1 C j C A P j
where C is the number of categories of samples in the dataset, and A P j is the average accuracy corresponding to the j th category.

3.1.4. A P 50 and m A P 50

For the image classification task, m A P addresses the category prediction precision, but there is also an anchor regression objective in the target detection task, where the anchor precision is generally evaluated in terms of IoU. A P 50 is the average precision, which is calculated based on an IoU threshold greater than 0.5 for a given category. On the basis of the calculation of the A P 50 for a single category, this obtains the A P 50 for all categories of the dataset; thus, the m A P 50 is obtained for the detection model in that dataset.

3.2. Comparative Experiments

In order to verify the effectiveness of the proposed FEADG-net algorithm in different scenarios and using different sample sizes, the performance of FEADG-net was compared with popular target recognition algorithms, such as yolov3, yolov5, yolov8, yolov9, and RTDETR, using the HIT-UAV dataset and the IRTS-AG dataset. Thus, the small target detection ability of FEADG-net was compared with other algorithms to prove its effectiveness.

3.2.1. Comparative Experiments Using the HIT-UAV Dataset

In order to comprehensively verify the target detection ability of the small object detection algorithm proposed in this study, we trained and tested FEADG-net and the other algorithms using the HIT-UAV dataset, to obtain the corresponding results of the training and target detection experiments.
(1) Comparison of detection model training
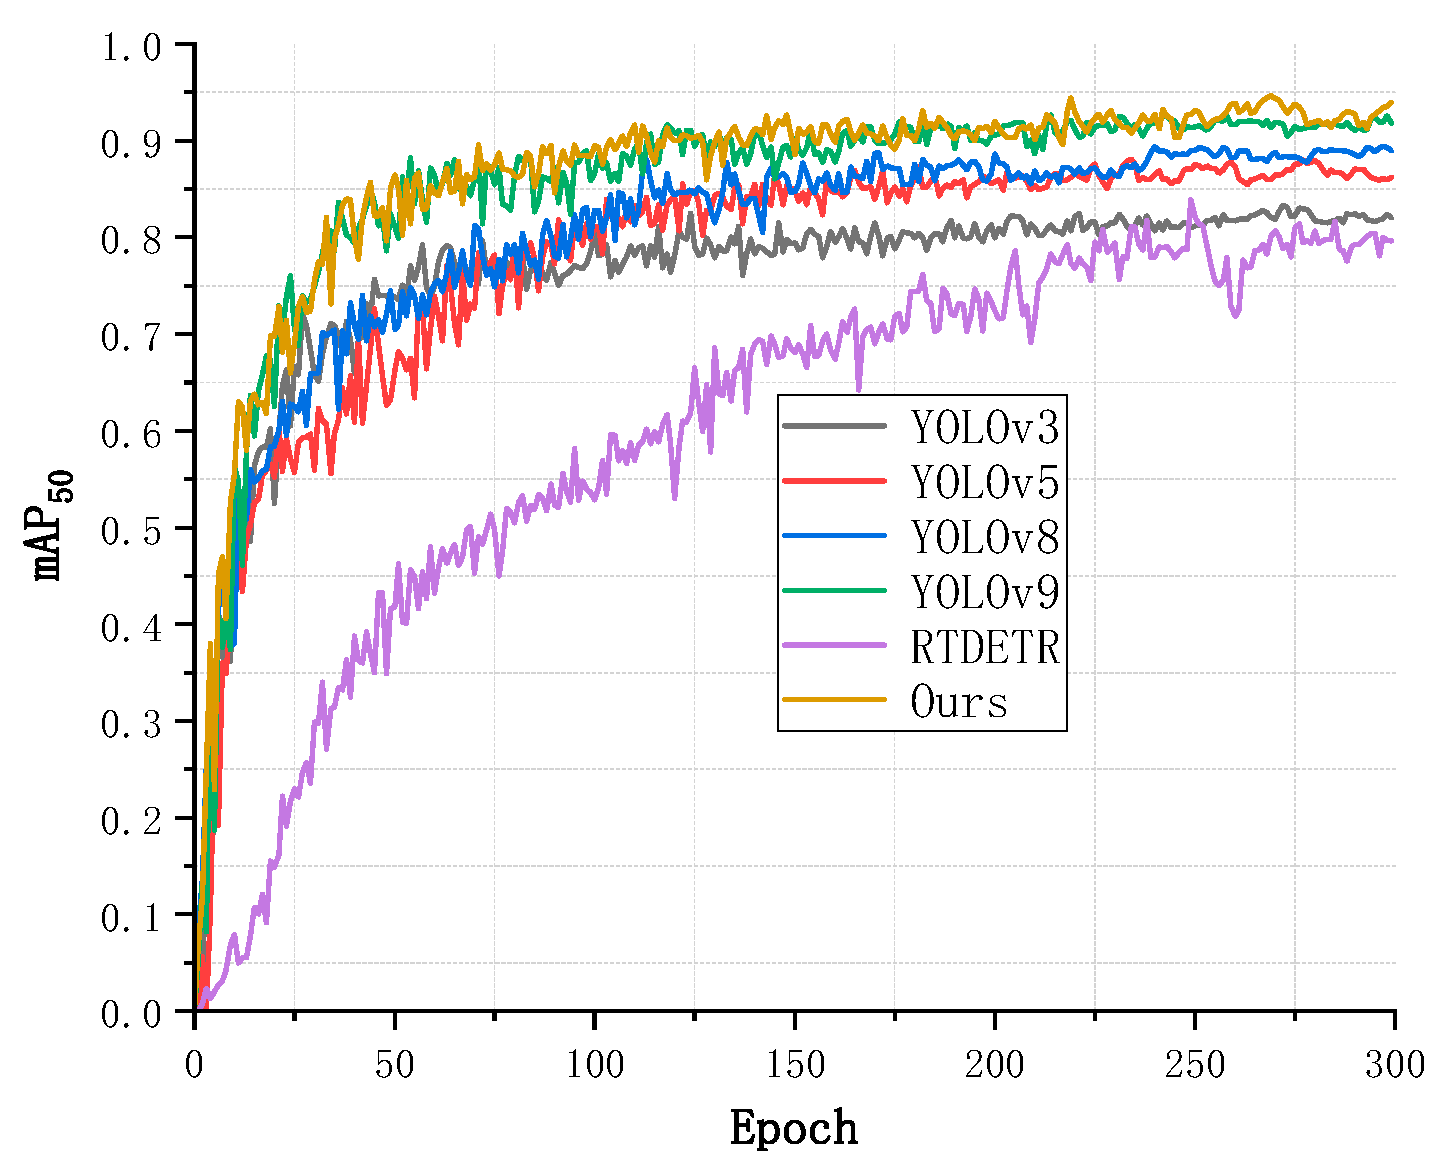
To observe the efficiency of the detection model’s training process for tasks (work) involving small samples, the algorithms FEADG-net, yolov3, yolov5, yolov8, and yolov9 were trained for 300 epochs using the HIT-AUV dataset, in which the total number of samples is small. The variation in the training accuracy curves for the different algorithms using the HIT-UAV dataset is shown in Figure 11.
In Figure 11, it can be seen that the detection accuracy of the FEADG-net method proposed in this study was significantly better than that of the other methods; it demonstrated good robustness, but there were large fluctuations in the training process. As can be seen from the change in the accuracy curve, the training accuracy of the other methods was relatively low, and the training performance using the small sample dataset was not as good as that of FEADG-net.
(2) Comparative experiment
The performances of the algorithms FEADG-net, yolov3, yolov5, yolov8, yolov9, and RTDETR were compared using the HIT-UAV dataset. As the “don’t care” category was excluded from the HIT-UAV dataset, the overall algorithm’s accuracy m A P 50 was compared by obtaining the detection accuracy A P 50 from the different categories used in the experiment, such as people, cars, bicycles, and other vehicles. The results of the comparative experiment are shown in Table 1.
In Table 1, it can be seen that the algorithm proposed in this study, the FEADG-net algorithm, had the highest detection accuracy m A P 50, which was equal to 93.8%. YOLOv3 had the lowest detection accuracy m A P 50, which was equal to 82.8%. Among the four categories in the HIT-UAV dataset, the highest detection accuracy was for cars, and the lowest detection accuracy was for other vehicles. The reason for this low accuracy was that other vehicles has a smaller number of samples, has more feature changes, and is easily affected by the interference of environmental factors. According to the model size and real-time parameters, it can be seen that the model parameters of our algorithm were fewer than those of yolov9 and RTDETR, satisfying the real-time requirements at the same time.
(3) Comparative experiment on different hardware configurations
In order to verify the performance of our algorithm on different hardware configurations, we performed comparative experiments for object detection on two different platforms using HIT-UAV dataset. The specific hardware configurations of the experimental platforms, the real-time parameters of yolov9, and our algorithm are shown in Table 2.
As can be seen from Table 2, the value of the FPS (Frame Per Second) of our algorithm on an Nvidia RTX 3080 was higher than the value of the FPS on an Nvidia RTX 3060, which indicates that our algorithm ran faster and had better real-time performance on the Nvidia RTX 3080. It can be inferred that our algorithm has better real-time performance on hardware platforms with higher computation capabilities.
(4) Visualization of target detection results
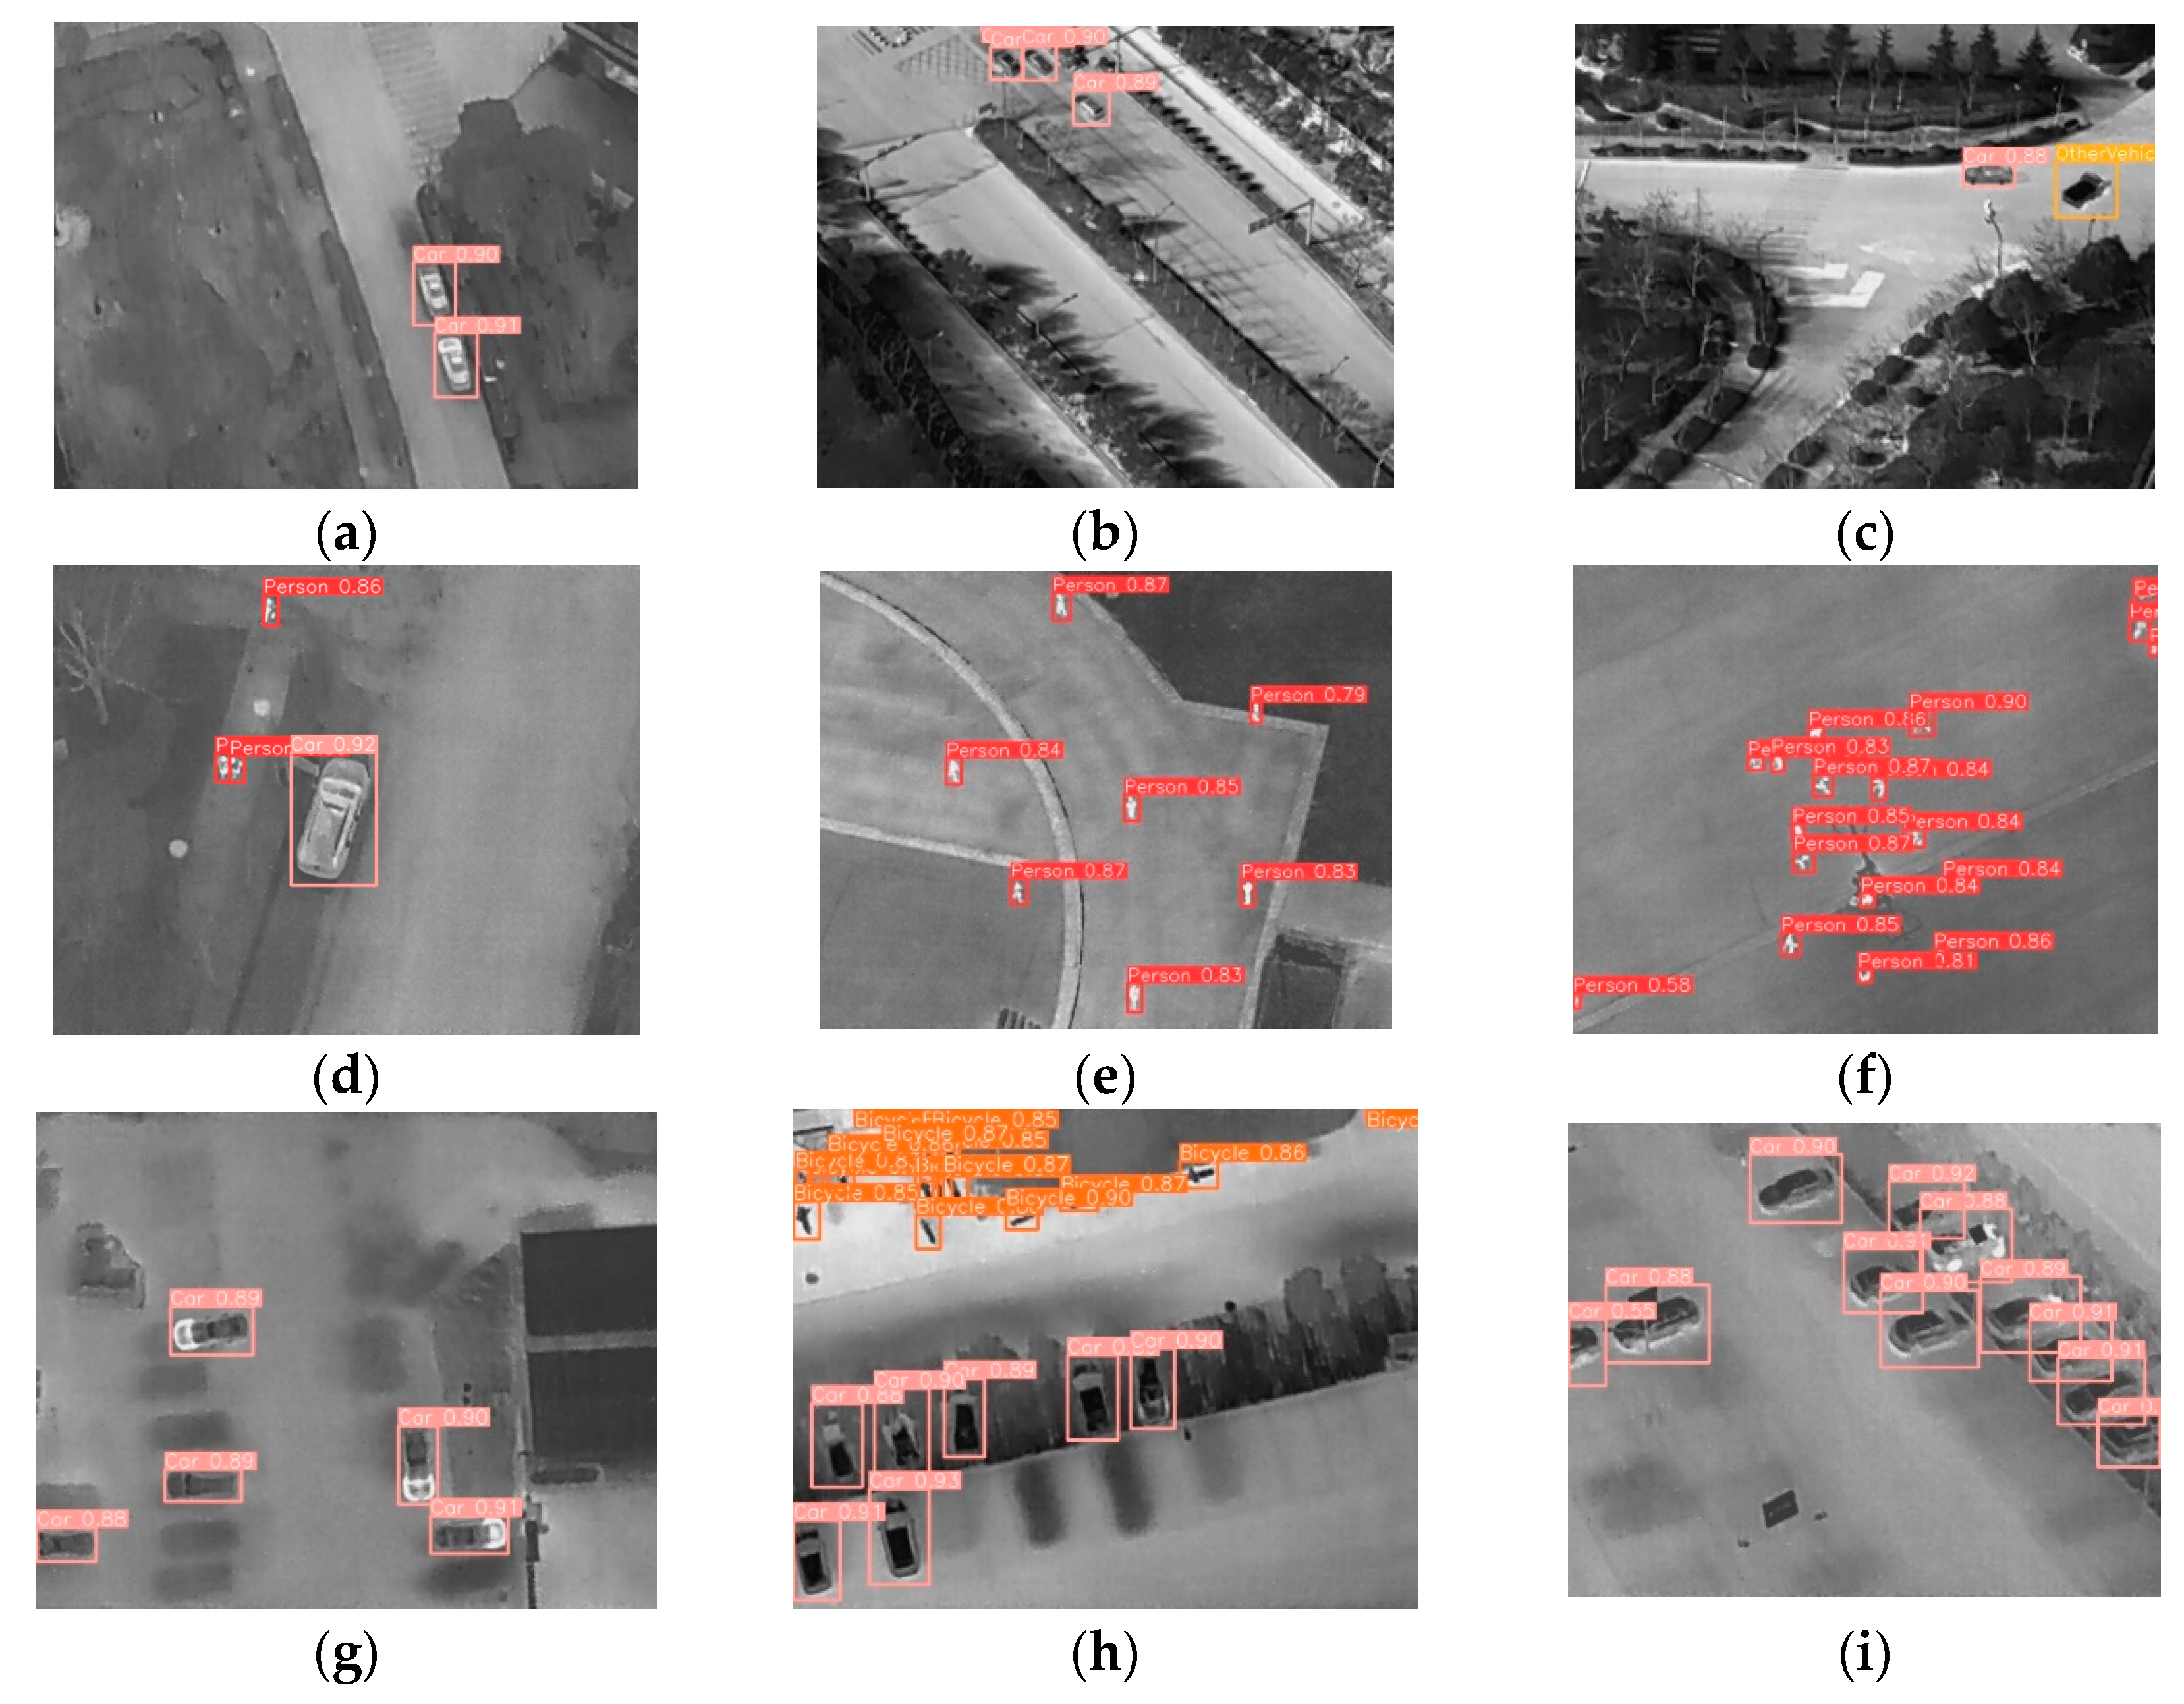
In order to verify the practical performance of the FEADG-net model for small target detection in infrared remote sensing images, this study used the trained FEADG-net model to predict targets using the test part of the HIT-UAV dataset. Some of the results of the small target prediction are shown in Figure 12.
In Figure 12, it can be seen that our FEADG-net model could accurately predict different targets using the HIT-UAV dataset and that the actual prediction performance was relatively good.

3.2.2. Comparative Experiment Using the IRTS-AG Dataset

We carried out model training and evaluation of FEADG-net and other algorithms in the IRTS-AG dataset and obtained corresponding experimental results.
(1) Comparison of detection model training
In order to observe the training performances of different algorithms using datasets with a large number of samples, the algorithms FEADG-net, yolov3, yolov5, yolov8, yolov9, and RTDETR were trained using the multi-sample IRTS-AG dataset, and the results from different algorithms using the same dataset were compared. Figure 13 gives the training results of the different algorithms using IRTS-AG.
In Figure 13, it can be seen that the FEADG-net algorithm proposed in this study had a better training performance using the IRTS-AG dataset compared with that of the other algorithms.
(2) Comparative experiment
In order to verify the performance of the algorithm using datasets with a larger number of samples, this study carried out comparative experiments using the IRTS-AG dataset with a smaller target size and a larger number of samples and obtained the detection accuracy A P 50 for eight types of targets and the overall algorithm accuracy m A P 50, so as to verify the effectiveness of the FEADG-net algorithm. The results of the comparative experiments are shown in Table 3.
In Table 3, it can be seen that compared to the other target detection methods, FEADG-net had a higher target detection accuracy m A P 50 when using the IRTS-AG dataset, with most of the eight categories having relatively high A P 50 values and only a few categories having lower A P 50 values than the others. In particular, our approach’s accuracy improvement was more obvious for category 7, and there were some improvements for the other categories, but this was less obvious, which means that our method performed better than the other algorithms in detecting categories with a smaller number of samples.
According to the comparison of model size and real-time parameters in Table 3, it can be seen that the size of our detection model was smaller than yolov9 and RTDETR, but its detection accuracy was higher and meets the real-time requirements.
(3) Visualization of target detection results
To observe the actual small road target detection performance of the FEADG-net algorithm, this study used the training weight file of the FEADG-net algorithm to predict the small road objects in the test part of the IRTS-AG dataset and visualized the prediction results, which are shown in Figure 14.
In Figure 14, it can be seen that the FEADG-net algorithm was able to detect smaller road vehicle targets in the IRTS-AG dataset and that it was also able to distinguish between different types of small road targets in infrared images with better performance.

3.3. Ablation Experiments

In order to verify the effectiveness of the three innovative modules, FEST, DGneck and L a u t o i n n e r , in the UAV infrared image small target detection algorithm FEADG-net, this study carried out ablation experiments by replacing or eliminating the corresponding modules. The results of the ablation experiments using the HIT-UAV dataset are shown in Table 4.
In Table 4, it can be seen that the three different new modules in FEADG-net promoted the improvement of target detection accuracy to different degrees; among the modules, the loss function L a u t o i n n e r promoted the detection accuracy the most, and DGneck promoted it the least. However, all of them had a positive effect on the improvement of detection accuracy, and the detection accuracy was effectively improved by the joint contribution of the three modules.

3.4. Experiments in Actual Traffic Monitoring Scenarios

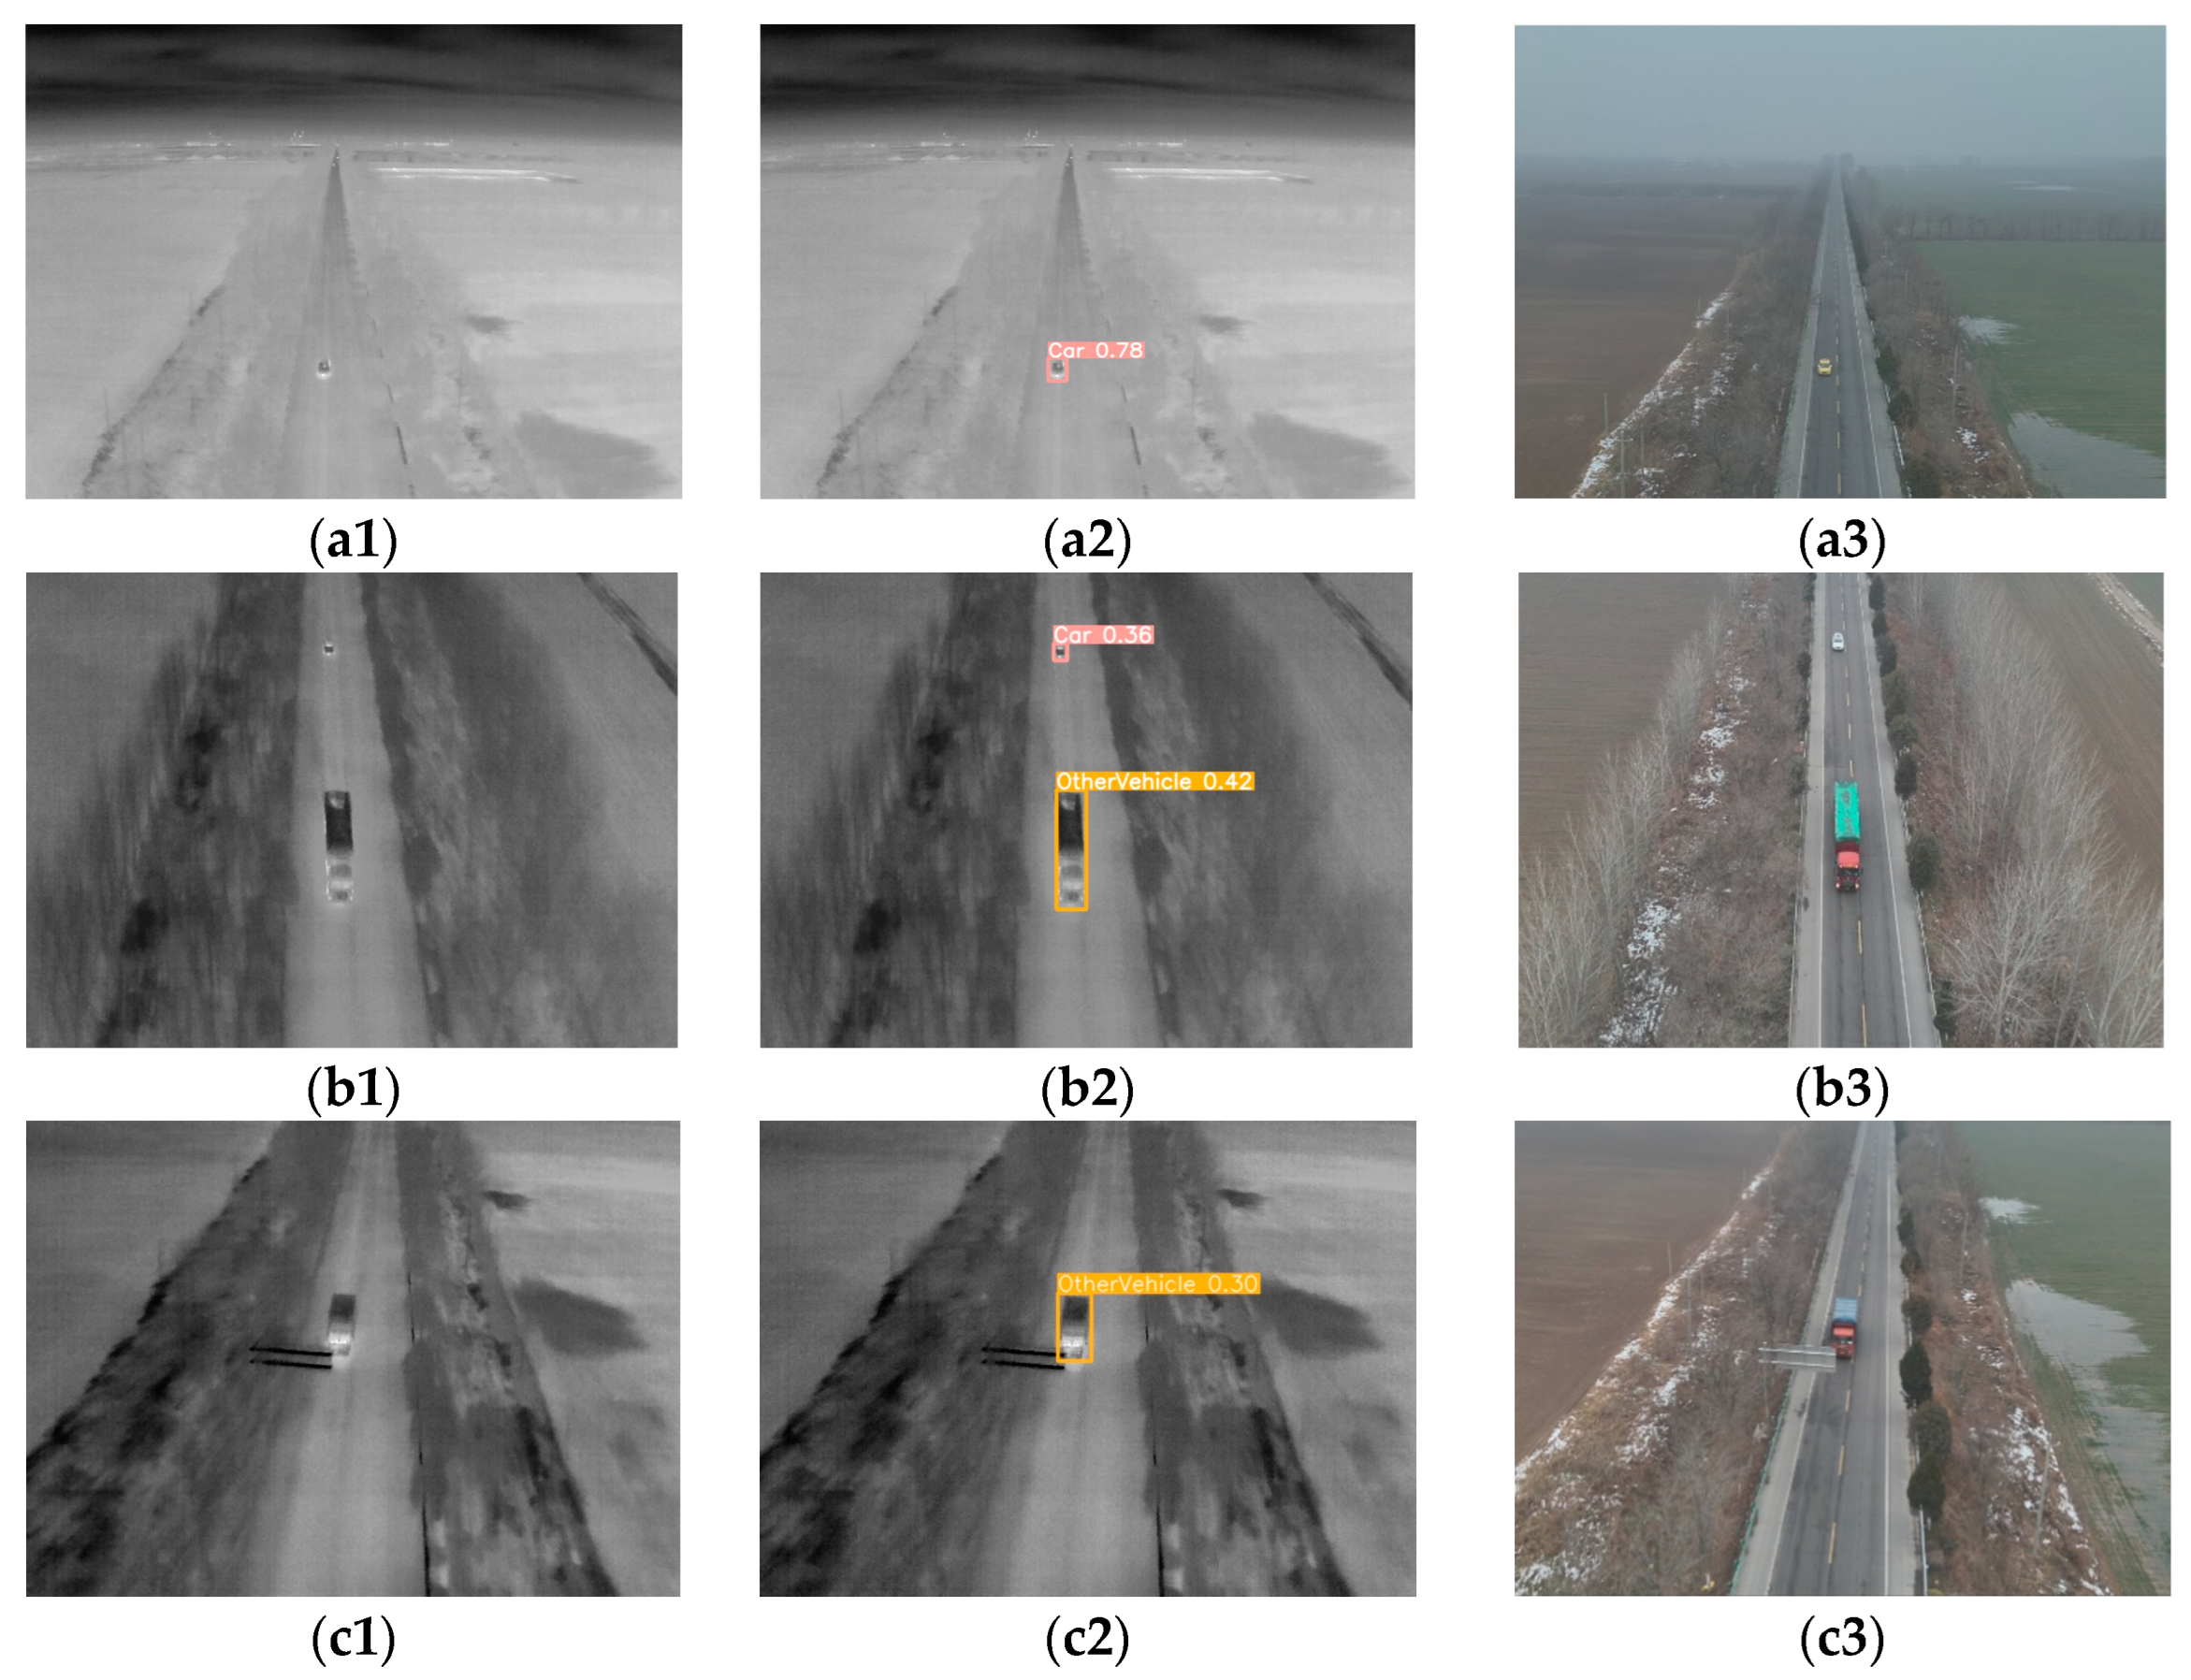
To verify the performance of our algorithm in real traffic scenarios, we detected small targets in our real UAV traffic surveillance data using the training weights of FEADG-net on the HIT-UAV dataset. Our UAV traffic surveillance data were taken on a foggy day in winter using DJI M3T. Because of the high humidity of the atmosphere at that time, the imaging quality of the infrared images was relatively poor. Some of the detection results are shown in Figure 15.
According to Figure 15, it can be seen that our FEADG-net algorithm could detect different types of small objects in real UAV traffic surveillance scenarios, and it could overcome the environmental interference to some extent. The data processing speed was 11.6 ms per image at shape (1, 3, 512, 640).

4. Discussion

This section discusses the reasons behind the results and the mutual relationships between the datasets, the detection methods, and the comparative and ablation experiments.
(1) Because the number of instances in the seventh and eighth categories in the IRTS-AG was less than the other six categories, their detection accuracy was lower, which affected the m A P 50 value of the algorithm. Therefore, to obtain better infrared small target detection accuracy, the number of samples in each category from the dataset used for training a model should not be significantly different, so that a higher m A P 50 value can be obtained.
(2) In the IRTS-AG dataset, the difference between the object grey value and the background grey value is larger, which is beneficial for target detection, while the difference between the object grey value and the background grey value in the HIT-UAV dataset is smaller. As a result, the A P 50 was higher for most of the categories (except the last two) in the IRTS-AG dataset than the A P 50 for all categories in the HIT-UAV dataset.
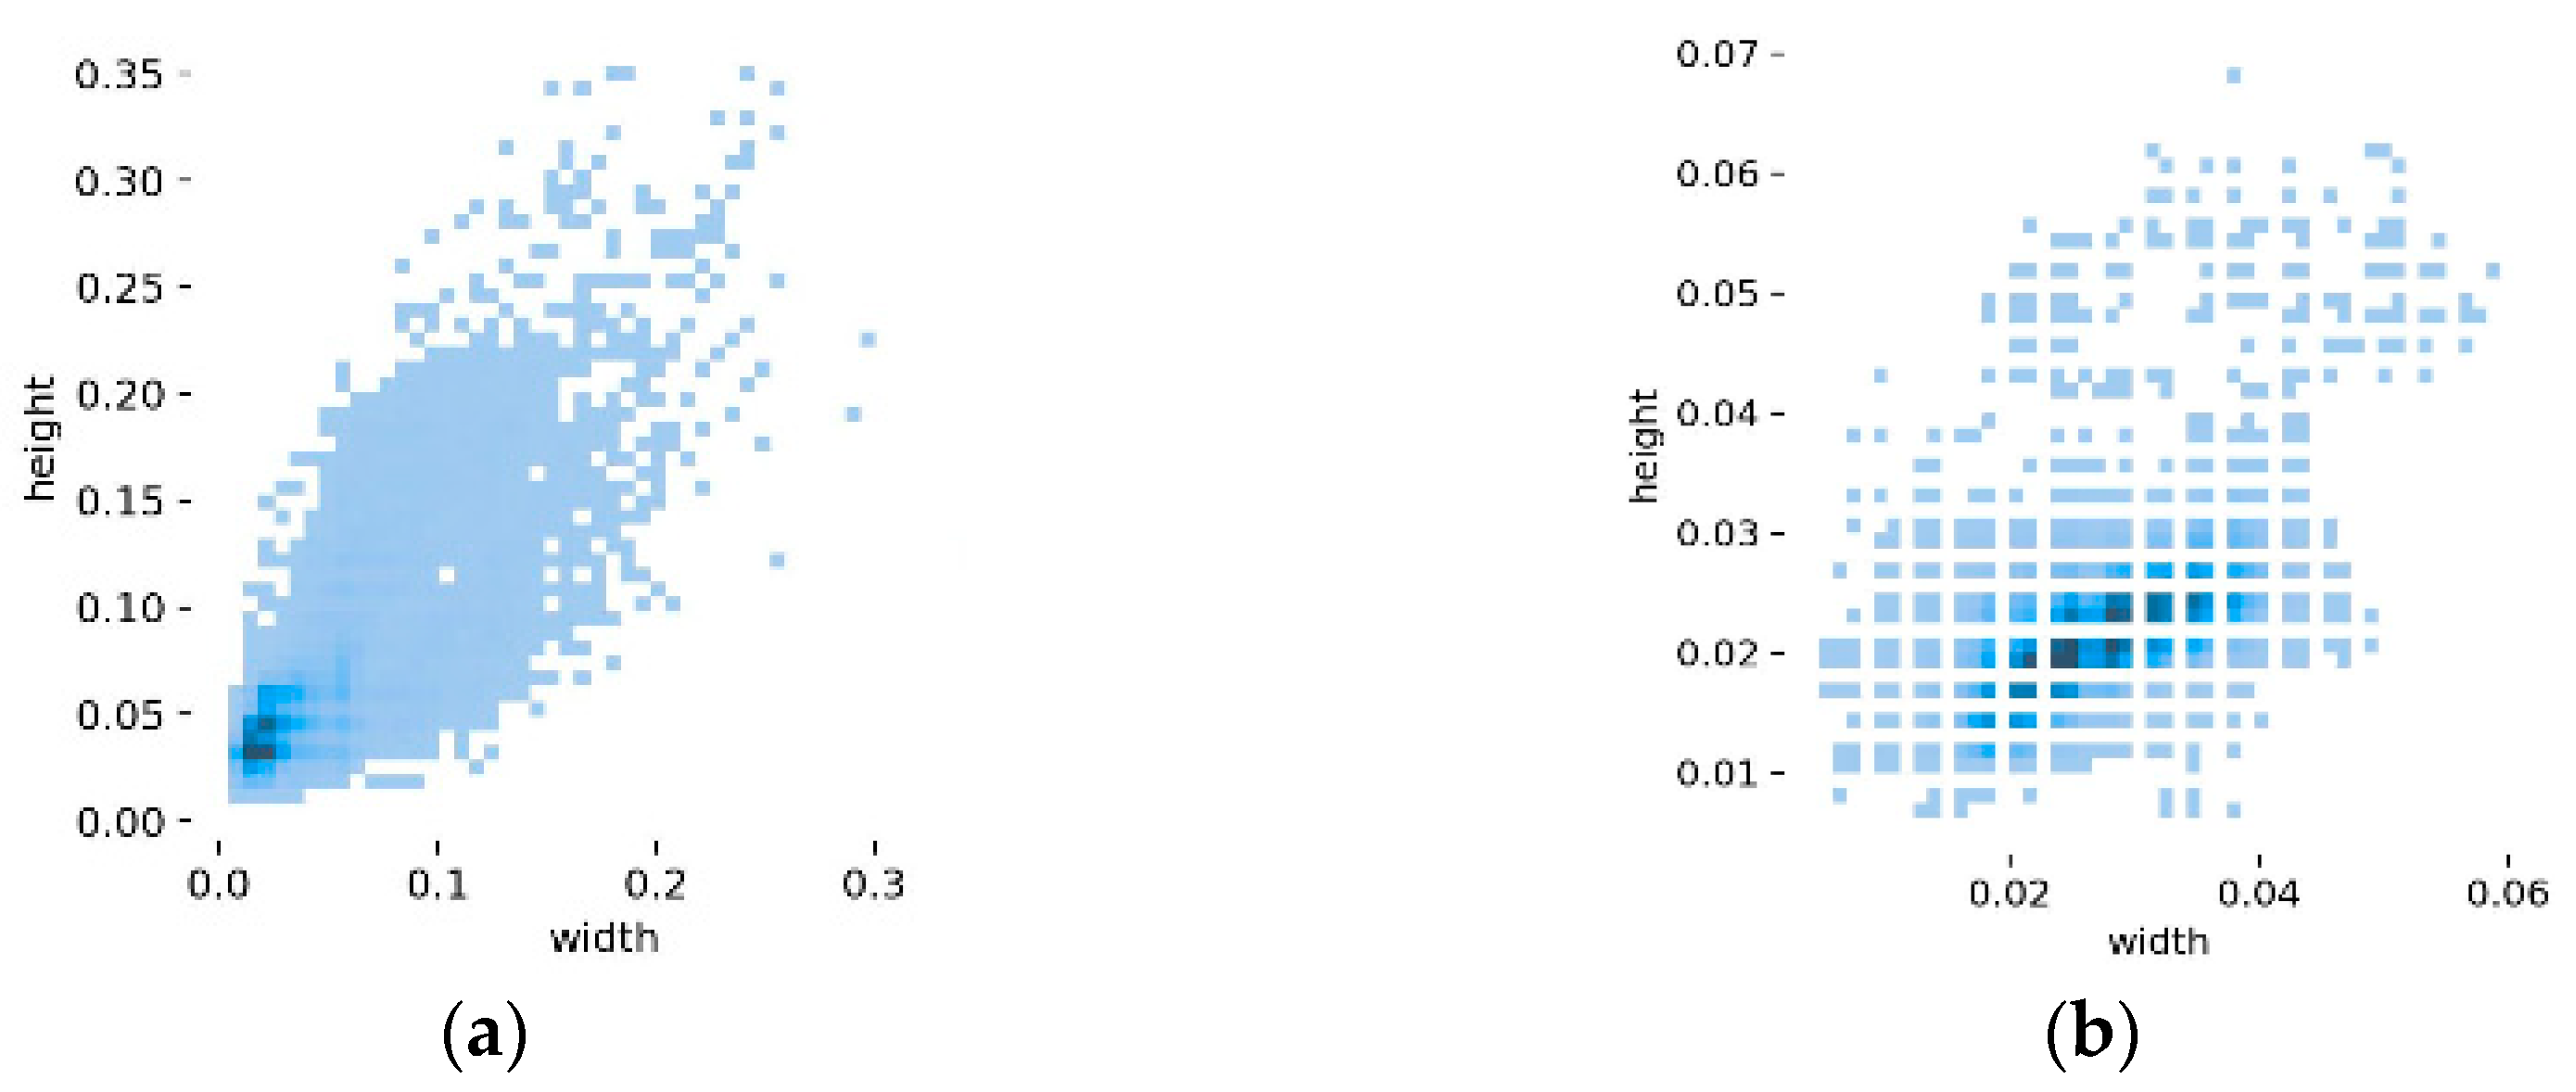
(3) The object instance size distribution is given in Figure 16, where the horizontal scale is the ratio of the instance width to the image width, and the vertical scale is the ratio of the target height to the image height; each small blue square represents a target instance. The object instance size distribution in the IRTS-AG dataset shown in Figure 16 indicates that certain sizes of instances on the horizontal and vertical axes are not available; this is because the IRTS-AG dataset consists of 87 video sequences, and many of the sample images are continuous image frames from a particular video; the size of the instances is less random than that of the HIT-UAV dataset.
(4) According to Figure 11 and Figure 13, it can be seen that the size of the dataset affected the model training process to some degree. When the model was trained on a dataset with a smaller number of sample images, its corresponding mAP50 curve showed larger fluctuations, while the curve showed smaller fluctuations when the dataset had a larger number of sample images.
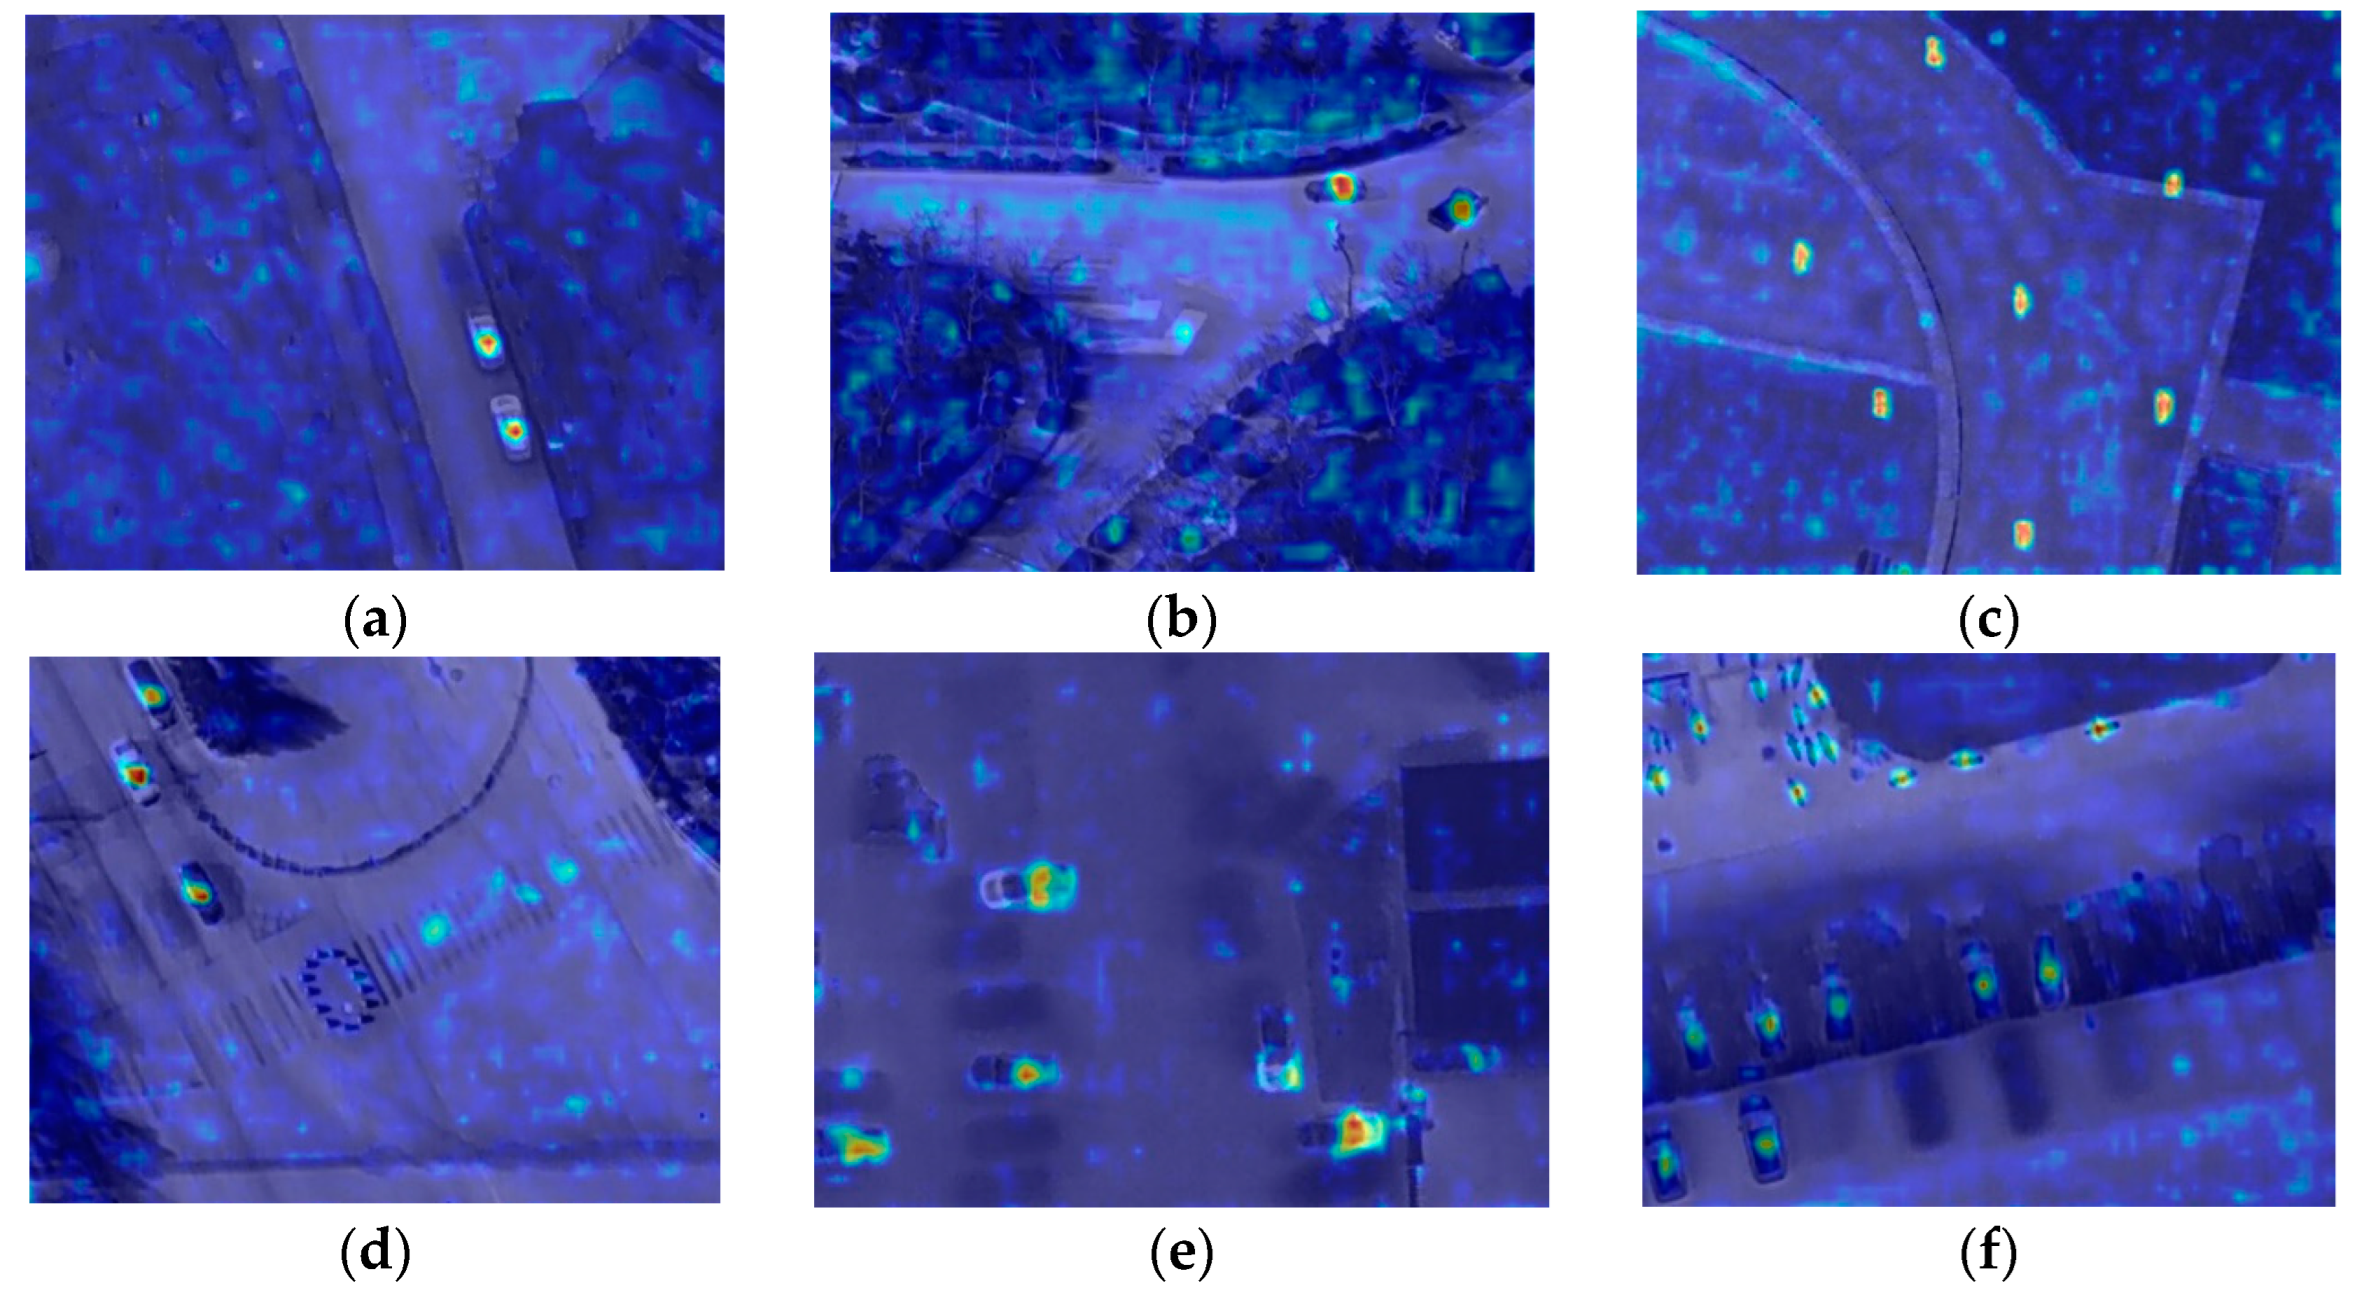
(5) To understand the target detection process of the FEADG-net network model when using different datasets, this study used a class activation map to visualize the gradient information of the object recognition algorithm, which allows us to view the gradient information of the FEADG-net model when detecting small targets on the road. The class activation map of the HIT-UAV dataset is shown in the Figure 17.
As shown in the characteristics of the class activation map, the color of the heat map is more inclined towards cooler colors (blue) as the corresponding gradient value and the probability of detecting the target become smaller. The color is more inclined towards warmer colors (yellow) as the corresponding gradient value and the probability of detecting the target become higher, as shown in Figure 17. Thus, it can be seen that the areas corresponding to the targets of the UAV infrared images have large gradient values and the background areas have small gradient values, indicating that the FEADG-net model performed better in the detection of different targets in the HIT-UAV data.

5. Conclusions

With the rapid development of UAV infrared image processing technology, small road target detection technology based on UAV infrared remote sensing images has become a hot research topic. To solve the problems of low contrast, poor edge texture information, and low exploitation of target features in UAV infrared remote sensing images of complex scenes, this study designed FEADG-net to detect small targets in UAV infrared remote sensing images, based on the network structure and feature processing advantages of YOLOv9. FEADG-net consists of three parts, namely a backbone, neck, and head. The backbone combines the advantages of a feature-enhanced network and swin transformer, which can effectively extract the feature information of small targets. The neck mainly draws upon the GELAN structure of yolov9 to construct DGneck, which avoids network deep layer gradients that are too weak and guarantees the effective fusion of different target features. Parameters of the auto-adjusted InnerIoU calculation algorithm were proposed to improve the robustness of the head loss function and to enhance the ability of FEADG-net to detect small targets on roads. Finally, comparative experiments between different algorithms and ablation experiments were carried out using the HIT-UAV dataset and IRTS-AG dataset. In these experiments, the detection accuracy was compared and analyzed between FEADG-net and other algorithms, including yolov3, yolov5, yolov8, yolov9, and RTDETR, to validate the effectiveness of the FEADG-net algorithm proposed in this study. The usefulness of FEST, DGneck, and L a u t o i n n e r from the FEADG-net algorithm was verified using ablation experiments. The experimental results showed that the small target detection accuracy of FEADG-net for UAV infrared remote sensing images was greater than 90%, which was higher than the previous methods, and it met the real-time requirements. Although the approach was able to detect eight categories of infrared road small objects and while the target size was sufficiently small, this was still not enough to meet the needs of detecting traffic targets in detailed categories. In future work, the number of categories will be increased and FEADG-net will be optimized to focus on the practical needs of traffic management departments. Currently, the FEADG-net model proposed in this study can be used for road target detection in some traffic scenarios, and it also has some reference value in the fields of search, rescue, wildlife protection, and defense.

Author Contributions

T.A. and J.L. are co-first authors with equal contributions; methodology, T.A.; investigation, W.L. and N.G.; conceptualization, T.A. and J.L.; writing, T.A. and Y.Z.; validation, Y.Z.; supervision, J.L. All authors have read and agreed to the published version of the manuscript.

Funding

This work was funded in part by the 14th Five-Year Plan Funding of China, grant number 50916040401, and in part by the Fundamental Research Program, grant number 514010503-201.

Data Availability Statement

The HIT-AUV dataset mentioned in this paper is openly and freely available at https://pegasus.ac.cn/ (accessed on 24 September 2023). The IRTS-AG dataset used in this study is freely available at https://www.scidb.cn/en/file?fid=6283d7ab25377f68493f6d6d&mode=front (accessed on 19 May 2024).

Acknowledgments

We would like to thank the editor and reviewers for their reviews, which improved the content of this paper.

Conflicts of Interest

The authors declare no conflicts of interest.

References

  1. Bouguettaya, A.; Zarzour, H.; Kechida, A.; Taberkit, A.M. Deep learning techniques to classify agricultural crops through UAV imagery: A review. Neural Comput. Appl. 2022, 34, 9511–9536. [Google Scholar] [CrossRef] [PubMed]
  2. Chin, R.; Catal, C.; Kassahun, A. Plant disease detection using drones in precision agriculture. Precis. Agric. 2023, 24, 1663–1682. [Google Scholar] [CrossRef]
  3. Xu, B.; Zhao, Y.; Wang, T.; Chen, Q. Development of power transmission line detection technology based on unmanned aerial vehicle image vision. SN Appl. Sci. 2023, 5, 72. [Google Scholar] [CrossRef]
  4. Lu, L.; Chen, Z.; Wang, R.; Liu, L.; Chi, H. Yolo-inspection: Defect detection method for power transmission lines based on enhanced YOLOv5s. J. Real-Time Image Process. 2023, 20, 104. [Google Scholar] [CrossRef]
  5. Martinez-Alpiste, I.; Golcarenarenji, G.; Wang, Q.; Alcaraz-Calero, J.M. Search and rescue operation using UAVs: A case study. Expert Syst. Appl. 2021, 178, 114937. [Google Scholar] [CrossRef]
  6. Zhao, B.; Song, R. Enhancing two-stage object detection models via data-driven anchor box optimization in UAV-based maritime SAR. Sci. Rep. 2024, 14, 4765. [Google Scholar] [CrossRef]
  7. Singh, A.; Prakash, K.; Manda, P.A.; Sona, D.R.; Das, R.R. Development of an Autonomous UAS for on Air Surveillance and Object Detection: A Real Execution. J. Electr. Eng. Technol. 2024, 19, 723–737. [Google Scholar] [CrossRef]
  8. Guettala, W.; Sayah, A.; Kahloul, L.; Tibermacine, A. Real Time Human Detection by Unmanned Aerial Vehicles. arXiv 2024, arXiv:2401.03275. [Google Scholar]
  9. Li, A.; Ni, S.; Chen, Y.; Chen, J.; Wei, X.; Zhou, L.; Guizani, M. Cross-Modal Object Detection Via UAV. IEEE Trans. Veh. Technol. 2023, 72, 10894–10905. [Google Scholar] [CrossRef]
  10. Hamzenejadi, M.H.; Mohseni, H. Fine-tuned YOLOv5 for real-time vehicle detection in UAV imagery: Architectural improvements and performance boost. Expert Syst. Appl. 2023, 231, 120845. [Google Scholar] [CrossRef]
  11. Angkhem, W.; Tantrairatn, S. Night-Time Human Detection From UAV. In Proceedings of the 2022 7th International Conference on Business and Industrial Research (ICBIR), Bangkok, Thailand, 19–20 May 2022; pp. 551–555. [Google Scholar]
  12. Yang, W.; Wei, N.; Xue, W.; Shengyu, Z.; Duo, Y. A Novel Method for Analyzing Infrared Images Taken by Unmanned Aerial Vehicles for Forest Fire Monitoring. Trait. Du Signal 2023, 40, 1219–1226. [Google Scholar]
  13. Fang, H.; Liao, Z.; Wang, X.; Chang, Y.; Yan, L. Differentiated Attention Guided Network Over Hierarchical and Aggregated Features for Intelligent UAV Surveillance. IEEE Trans. Ind. Inform. 2023, 19, 9909–9920. [Google Scholar] [CrossRef]
  14. Yu, C.; Jiang, X.; Wu, F.; Fu, Y.; Zhang, Y.; Li, X.; Fu, T.; Pei, J. Research on Vehicle Detection in Infrared Aerial Images in Complex Urban and Road Backgrounds. Electronics 2024, 13, 319. [Google Scholar] [CrossRef]
  15. Zhang, Y.; Zhang, Y.; Gu, F.; Chen, M.; Zhu, H. YOLO-CFM: Improved YOLOv5 for Vehicle Detection in Drone-captured Infrared Images. In Proceedings of the 2022 4th International Conference on Big-data Service and Intelligent Computation, Xiamen, China, 25–27 November 2023; Association for Computing Machinery: Xiamen, China, 2023; pp. 1–5. [Google Scholar]
  16. Messina, G.; Modica, G. Applications of UAV Thermal Imagery in Precision Agriculture: State of the Art and Future Research Outlook. Remote Sens. 2020, 12, 1491. [Google Scholar] [CrossRef]
  17. Zhang, Z.; Zhu, L. A Review on Unmanned Aerial Vehicle Remote Sensing: Platforms, Sensors, Data Processing Methods, and Applications. Drones 2023, 7, 398. [Google Scholar] [CrossRef]
  18. Das, S.; Chapman, S.; Christopher, J.; Choudhury, M.R.; Menzies, N.W.; Apan, A.; Dang, Y.P. UAV-thermal imaging: A technological breakthrough for monitoring and quantifying crop abiotic stress to help sustain productivity on sodic soils—A case review on wheat. Remote Sens. Appl. Soc. Environ. 2021, 23, 100583. [Google Scholar] [CrossRef]
  19. Zhang, Y.; Cai, Z. CE-RetinaNet: A Channel Enhancement Method for Infrared Wildlife Detection in UAV Images. IEEE Trans. Geosci. Remote Sens. 2023, 61, 4104012. [Google Scholar] [CrossRef]
  20. Chen, Y.; Liu, Z.; Zhang, L.; Wu, Y.; Zhang, Q.; Zheng, X. A lightweight multi-feature fusion network for unmanned aerial vehicle infrared ray image object detection. Egypt. J. Remote Sens. Space Sci. 2024, 27, 268–276. [Google Scholar] [CrossRef]
  21. Polukhin, A.; Gordienko, Y.; Jervan, G.; Stirenko, S. Object Detection for Rescue Operations by High-Altitude Infrared Thermal Imaging Collected by Unmanned Aerial Vehicles. In Pattern Recognition and Image Analysis; Springer Nature: Cham, Switzerland, 2023; pp. 490–504. [Google Scholar]
  22. Chen, X.; Hopkins, B.; Wang, H.; O’Neill, L.; Afghah, F.; Razi, A.; Fulé, P.; Coen, J.; Rowell, E.; Watts, A. Wildland Fire Detection and Monitoring Using a Drone-Collected RGB/IR Image Dataset. IEEE Access 2022, 10, 121301–121317. [Google Scholar] [CrossRef]
  23. Hansen, V.J.; Ramos, A.L.; Apolinário, J.A., Jr. A UAV-based Infrared Small Target Detection System for Search and Rescue Missions. In Proceedings of the SENSORDEVICES 2021: The Twelfth International Conference on Sensor Device Technologies and Applications, Athens, Greece, 14–18 November 2021; IARIA: Athene, Greece, 2021; pp. 25–30. [Google Scholar]
  24. Hu, S.; Zhao, F.; Lu, H.; Deng, Y.; Du, J.; Shen, X. Improving YOLOv7-Tiny for Infrared and Visible Light Image Object Detection on Drones. Remote Sens. 2023, 15, 3214. [Google Scholar] [CrossRef]
  25. Kim, J.; Huh, J.; Park, I.; Bak, J.; Kim, D.; Lee, S. Small Object Detection in Infrared Images: Learning from Imbalanced Cross-Domain Data via Domain Adaptation. Appl. Sci. 2022, 12, 11201. [Google Scholar] [CrossRef]
  26. Kassim, Y.M.; Byrne, M.E.; Burch, C.; Mote, K.; Hardin, J.; Larsen, D.R.; Palaniappan, K. Small Object Bird Detection in Infrared Drone Videos Using Mask R-CNN Deep Learning. Electron. Imaging 2020, 2020, 85-1–85-8. [Google Scholar] [CrossRef]
  27. Zhang, Y.; Xu, C.; Yang, W.; He, G.; Yu, H.; Yu, L.; Xia, G.-S. Drone-based RGBT tiny person detection. ISPRS J. Photogramm. Remote Sens. 2023, 204, 61–76. [Google Scholar] [CrossRef]
  28. Wang, C.-Y.; Yeh, I.-H.; Liao, H.-Y.M. YOLOv9: Learning What You Want to Learn Using Programmable Gradient Information. arXiv 2024, arXiv:2402.13616. [Google Scholar]
  29. Zhang, H.; Xu, C.; Zhang, S. Inner-IoU: More Effective Intersection over Union Loss with Auxiliary Bounding Box. arXiv 2023, arXiv:2311.02877. [Google Scholar]
  30. Suo, J.; Wang, T.; Zhang, X.; Chen, H.; Zhou, W.; Shi, W. HIT-UAV: A high-altitude infrared thermal dataset for Unmanned Aerial Vehicle-based object detection. Sci. Data 2023, 10, 227. [Google Scholar] [CrossRef]
  31. Fu, R.; Fan, H.; Zhu, Y.; Hui, B.; Zhang, Z.; Zhong, P.; Li, D.; Zhang, S.; Chen, G.; Wang, L. A dataset for infrared time-sensitive target detection and tracking for air-ground application. China Sci. Data 2022, 7, 206–221. [Google Scholar]
  32. Zhu, J.; Qin, C.; Choi, D. YOLO-SDLUWD: YOLOv7-based small target detection network for infrared images in complex backgrounds. Digit. Commun. Netw. 2023. [Google Scholar] [CrossRef]
  33. Liu, Z.; Lin, Y.; Cao, Y.; Hu, H.; Wei, Y.; Zhang, Z.; Lin, S.; Guo, B. Swin Transformer: Hierarchical Vision Transformer using Shifted Windows. arXiv 2021, arXiv:2103.14030. [Google Scholar]
  34. Zheng, H.; Wang, G.; Li, X. Swin-MLP: A strawberry appearance quality identification method by Swin Transformer and multi-layer perceptron. J. Food Meas. Charact. 2022, 16, 2789–2800. [Google Scholar] [CrossRef]
  35. Yin, X.; Yu, Z.; Fei, Z.; Lv, W.; Gao, X. PE-YOLO: Pyramid Enhancement Network for Dark Object Detection. arXiv 2023, arXiv:2307.10953. [Google Scholar]
  36. Redmon, J.; Farhadi, A. YOLOv3: An Incremental Improvement. arXiv 2018, arXiv:1804.02767. [Google Scholar]
  37. Terven, J.; Cordova-Esparza, D. A Comprehensive Review of YOLO Architectures in Computer Vision: From YOLOv1 to YOLOv8 and YOLO-NAS. arXiv 2023, arXiv:2304.00501. [Google Scholar] [CrossRef]
  38. Sohan, M.; Sai Ram, T.; Rami Reddy, C.V. A Review on YOLOv8 and Its Advancements. In Data Intelligence and Cognitive Informatics; Jacob, I.J., Piramuthu, S., Falkowski-Gilski, P., Eds.; Springer Nature: Singapore, 2024; pp. 529–545. [Google Scholar]
  39. Zhao, Y.; Lv, W.; Xu, S.; Wei, J.; Wang, G.; Dang, Q.; Liu, Y.; Chen, J. DETRs Beat YOLOs on Real-time Object Detection. arXiv 2023, arXiv:2304.08069. [Google Scholar]
Figure 1. The application fields of UAV infrared image target detection.
Drones 08 00304 g001
Figure 2. Some sample images from HIT-UAV dataset: (a) cars on road; (b) cars at crossroads; (c) other vehicles on road; (d) car and people on road; (e) people on the track; (f) people in playground; (g) cars in the parking lot; (h) cars in neighborhoods; (i) cars and bicycles on road.
Drones 08 00304 g002aDrones 08 00304 g002b
Figure 3. Number and size distribution of instances from HIT-UAV dataset. (a) Distribution of instance numbers in different categories; (b) size distribution of target instances.
Drones 08 00304 g003
Figure 4. Some sample images from IRTS-AG dataset: (a) objects on road; (b) object beside house; (c) objects at crossroads; (d) objects on road; (e) objects in a parking lot; (f) objects in the distance; (g) objects at night; (h) objects beside house; (i) object on field road.
Drones 08 00304 g004
Figure 5. The distribution of the instance numbers and sizes in IRTS-AG dataset: (a) distribution of instance numbers; (b) distribution of instance sizes.
Drones 08 00304 g005
Figure 6. Structural block diagram of FEADG-net.
Drones 08 00304 g006
Figure 7. Structural block diagram of FEST-backbone.
Drones 08 00304 g007
Figure 8. A schematic diagram of the DGneck structure.
Drones 08 00304 g008
Figure 9. Schematic internal structure block diagrams of RepNCSP and CBS.
Drones 08 00304 g009
Figure 10. Schematic diagram of the relevant parameters of I o U a u t o i n n e r .
Drones 08 00304 g010
Figure 11. The training accuracy curves for different algorithms.
Drones 08 00304 g011
Figure 12. Some results of FEADG-net in the prediction of objects using the HIT-UAV dataset: (a) cars parked on roadside; (b) cars at intersections; (c) vehicles at intersections; (d) person and car; (e) people in playground; (f) people playing basketball; (g) cars in neighborhoods; (h) cars and bicycles; (i) cars in parking lot.
Drones 08 00304 g012
Figure 13. The training accuracy curves of different algorithms using IRTS-AG.
Drones 08 00304 g013
Figure 14. Some results of FEADG-net prediction of objects in the IRTS-AG dataset: (a) objects on T-shaped road; (b) object beside house; (c) objects at crossroads; (d) objects in parking lot; (e) objects on road; (f) objects in the distance; (g) 7 different objects; (h) objects in parking lot; (i) objects at night.
Drones 08 00304 g014
Figure 15. Some results of FEADG-net’s prediction of objects in actual traffic monitoring scenarios: (a1) original infrared image car; (a2) results of detection; (a3) corresponding visible image; (b1) original infrared image of different vehicles; (b2) results of detection; (b3) corresponding visible image; (c1) original infrared image of other vehicle; (c2) results of detection; (c3) corresponding visible image.
Drones 08 00304 g015
Figure 16. Object instance size distribution in different datasets: (a) HIT-UAV; (b) IRTS-AG.
Drones 08 00304 g016
Figure 17. Some class activation maps of FEADG-net using the HIT-UAV dataset: (a) cars parked roadside; (b) different vehicles; (c) people in playground; (d) cars parked on roadside; (e) cars in neighborhoods; (f) cars and bicycles.
Drones 08 00304 g017
Table 1. Results of comparative experiments using the HIT-UAV dataset.
MethodsPeopleCarsBicyclesOther VehiclesmAP50ParametersGFLOPsFPS
YOLOv379.49881.572.382.812,129,72018.9213.3
YOLOv590.898.489.571.987.69,113,08423.8204.5
YOLOv891.698.190.380.390.511,127,13228.4201.1
YOLOv991.998.891.685.5927,168,63626.7196.2
RTDETR88.796.186.470.585.431,991,960103.492.4
Ours9298.792.692.193.86,630,89619.3203.8
Table 2. Results of comparative experiment on different hardware configurations.
Hardware ConfigurationsFP32 TFLOPSCPUMethodsMAP50ParametersGFLOPsFPS
Nvidia RTX 3060 (12 G)12.74Core i5-13400 2.50 GHzYOLOv9927,168,63626.7196.2
Nvidia RTX 3060 (12 G)12.74Core i5-13400 2.50 GHzOurs93.86,630,89619.3203.8
Nvidia RTX 3080 (10 G)29.77Xeon E5-2603 v4 1.70 GHzYOLOv991.87,168,63626.7207.6
Nvidia RTX 3080 (10 G)29.77Xeon E5-2603 v4 1.70 GHzOurs93.46,630,89619.3215.3
Table 3. Results of comparative experiments using IRTS-AG.
MethodsCategory 0Category 1Category 2Category 3Category 4Category 5Category 6Category 7mAP50ParametersGFLOPsFPS
YOLOv387.291.692.290.290.688.449.845.379.412,131,77618.9216.6
YOLOv599.499.499.399.299.499.455.854.388.39,114,63223.8214.5
YOLOv899.599.499.499.399.499.456.256.188.611,128,68028.5208.3
YOLOv999.499.599.599.599.599.454.650.287.77,170,18426.7210.1
RTDETR74.781.57873.47257.50.341.463.632,000,180103.596.5
Ours99.599.599.499.599.599.456.662.790.66,631,58319.3218.1
Table 4. Results of ablation experiments.
FESTDGneck L a u t o i n n e r m A P 50 on HIT-UAV
93.8
93.1
92.3
91.6
✔ means FEADG-net contains this module in the current experiment; blank means it does not.
Disclaimer/Publisher’s Note: The statements, opinions and data contained in all publications are solely those of the individual author(s) and contributor(s) and not of MDPI and/or the editor(s). MDPI and/or the editor(s) disclaim responsibility for any injury to people or property resulting from any ideas, methods, instructions or products referred to in the content.