1. Introduction
The emergence of drone technology coupled with advances in machine learning and computer vision has paved the way for innovative educational approaches in the engineering and technology disciplines. Drones, or Unmanned Aerial Vehicles (UAVs), have revolutionized various industries, including agriculture, surveillance, logistics, and environmental monitoring. Their ability to capture high-resolution images and data from inaccessible areas has made them indispensable tools in modern technology. Moreover, the integration of computer vision with drone technology has significantly enhanced autonomous navigation, object detection, and environmental mapping capabilities.
This paper builds upon the foundation of our indoor vision-based path-planning surrogate project and investigates the necessary changes required for blade inspection and automated analysis of blade health [
1]. The project aims to simulate real-world wind turbine inspections using scaled-down pedestal fans as stand-ins for actual wind turbines. This approach reduces the operational risks and costs, making it an ideal preliminary research project for educational purposes. By employing scaled-down models, students can engage in practical, hands-on learning without the logistical and safety challenges associated with full-scale wind turbines.
The educational initiative described in this paper introduces undergraduate students to the practical applications of autonomous systems. By bridging the gap between theoretical concepts taught in classrooms and real-world technological implementations, students gain valuable insights into the complexities and challenges of modern engineering problems. The project not only fosters an understanding of drone navigation and computer vision techniques, but also prepares students for subsequent large-scale projects involving professional drones and real wind turbines in wind farms.
The contributions of this work are as follows:
Deep learning classification of blade faults: Our investigation of deep learning classification algorithms, including AlexNet, VGG, Xception, ResNet, DenseNet, and ViT, presents an introduction to key novel architectures along with their contributions to the field of computer vision. This exploration lays the foundational history of deep learning, enabling those new to the field to identify architectural design patterns and key mathematical characteristics vital to visual classification.
Path planning for blade inspection: Real-time image detection and decision-making enhance drone adaptability, allowing for seamless inspection of pedestal fan blades (PFBs). This component demonstrates how drones can be programmed to navigate complex environments autonomously, avoiding obstacles and optimizing inspection routes.
Educational aspects and applications: Through detailed explanations, publicly available code, and low-cost hardware requirements, this project offers practical experience in developing drone platforms infused with machine learning and computer vision. This provides students with a real-world example to enhance comprehension and engagement with classroom materials in machine learning, controls, and autonomy. The educational impact is significant as it prepares students for careers in emerging technologies.
The remainder of this paper is organized as follows:
Section 2 provides an overview of the proposed integration into the machine learning course and the development of a new course on drone technology. This is followed by a brief literature review of existing work in this area, with gaps identified.
Section 4 presents the methodology of this study including the inspection method utilized for data generation and the deep learning classification architecture overviews. This is followed by the resulting classification performance on the PFBs dataset for each architecture in our study and a discussion on the implications and findings.
Section 6 provides a discussion on the real-world challenges and alternative data acquisition strategies. Finally, conclusions are drawn, followed by documentation of publicly available material related to the project.
2. A Hands-On Project for Machine Learning and Autonomous Drones
This research project was conducted in part as a final project for the existing Machine Learning (ECE 4850) course at the Electrical and Computer Engineering Department of Utah Valley University in Spring 2024. Based on the instructor’s evaluation and the students’ feedback at the end of the semester, the students in this course appeared to gain valuable knowledge on the autonomy of drones integrated with machine learning and computer vision. This course of Machine Learning is fully project-based, where the students are assigned five bi-weekly projects and one final project related to various subjects of machine learning, deep learning, probabilistic modeling, and real-time object detection via a low-cost drone. In the current structure, a course in Python and one in probability and statistics are the prerequisites for this course. This allows students from the Electrical Engineering, Computer Engineering, and Computer Science majors to be able to register for this course in their Junior or Senior year. In this course, the students will be exposed to several machine learning algorithms including supervised and unsupervised learning, the fundamentals of neural networks, and recent advancements and architectures in deep learning. The bi-weekly projects tend to gauge their understanding of the concepts and challenge their critical thinking to come up with solutions to solve real-world problems. For their final project, the students will work on the proposed project in this paper and its complement published in [
1]. Three lectures are dedicated to teaching the students how to work and program the Tello EDU drone using Python with a complement of 12 short video series that are currently under development.
Moving forward, this applied project will be integrated into the content of a new course in AI and Smart Systems (AISS) that is under development as an elective course. The course of AISS will contain materials related to both machine/deep learning and autonomous drones. The pre-requisite for this course will be a course on Python programming and Machine Learning. Thus, the students taking this course will be already familiar with the main concepts of machine/deep learning algorithms and architectures. In the AISS course, the students will become familiarized with drone programming through Python and Kotlin, several path-planning algorithms such as , Rapidly-exploring Random Tree (), Fast , and , as well as the implementation of machine/learning techniques for classification and object detection. The course will be fully project-based, and the students will work in groups of two.
This project is designed to provide undergraduate students with a robust foundation in both the theoretical and practical aspects of machine learning and autonomous systems, specifically focusing on drone technology. The primary objectives of this project are to introduce students to the principles of drone technology and autonomous systems, equip them with practical skills in programming, path planning, machine/deep learning, image processing, and computer vision, and provide them with a good understanding of the real-world applications and challenges in the field of drones. This project leverages computer vision and deep learning techniques to analyze and interpret visual data captured by drones, which is crucial for detecting and classifying objects and performing anomaly detection.
Path planning and image processing, leveraging machine learning and deep learning, are integral components of this project due to their pivotal roles in autonomous drone operations. Path planning entails determining an optimal route for the drone, which is vital for autonomous navigation, mission optimization, and practical applications such as search and rescue and environmental monitoring. Computer vision allows the analysis of visual data captured by the drone, which is essential for detecting and classifying objects, performing anomaly detection, and integrating AI to enhance the comprehension of autonomous systems. These technologies are deeply interconnected. For example, real-time computer vision is crucial for identifying and avoiding obstacles, a fundamental aspect of effective path planning. In target-tracking applications, computer vision supplies essential data for path-planning algorithms to dynamically adjust the drone’s trajectory. Furthermore, computer vision facilitates the creation of detailed environmental maps, which path-planning algorithms utilize to optimize navigation routes.
Students undertake various technical tasks throughout this project, including programming drones to control the behavior and maneuvers, developing and implementing path-planning and computer vision algorithms, and designing and conducting experiments to test drone capabilities. These tasks are designed to enhance problem-solving skills, technical proficiency, critical thinking, and collaboration and communication abilities. Through these activities, students gain hands-on experience with cutting-edge technologies, analyze and interpret data to make informed decisions, and work in teams to effectively present their findings. This comprehensive approach ensures that students are well prepared for careers in the field of drones and autonomous systems.
Optimizing the path planning for drone inspections of PFBs unlocks numerous advantages, crucially enhancing the inspection process. Key among these is achieving expansive inspection coverage, where path-planning algorithms guide drones on optimal routes to encompass entire wind farms thoroughly. This meticulous approach ensures a comprehensive inspection, significantly mitigating the risk of overlooked turbines and minimizing redundant coverage areas. Additionally, the strategic optimization of path planning plays a pivotal role in enhancing operational efficiency. Drones can avoid unnecessary detours by navigating paths that account for distance and prevailing weather conditions, conserving flight time and battery life. This efficiency streamlines the inspection process and considerably reduces cost, rendering wind turbine inspections more economically feasible. With the addition of computer vision, drone adaptability increases, allowing real-time flexibility during the inspection process. This ensures drones operate securely within the complex and changing airspace of wind farms. In our previous work, simulated annealing was deployed to allow efficient paths to be generated for various combinations of PFBs; Haar-cascade classifiers were leveraged for pedestal fans’ (in replacement of wind turbines) identification and positioning; the Hough transform was utilized for further vision positioning during the inspection mission [
1].
Building on this work, the investigation of deep learning for fault analysis is presented to complete the proposed surrogate project and provide a comprehensive educational approach to learning these emergent technologies. Here, the automation of wind turbine inspection is of great interest as traditional approaches are time-consuming and often dangerous. These methods include manual inspection, requiring personnel to scale turbine blades, or visual inspection using various imaging and telescopic devices. As wind turbine installations continue to scale worldwide, the need for more efficient and safe inspection is ever-present. Through imagery captured with the autonomous path-planning algorithms presented in [
1], various architectures are trained and compared on the ability to determine fault status in these PFBs. Coupled with autonomous path planning, this automated classification of faults completes the inspection system and provides an educational setting to explore these deep learning models.
3. Related Works
As we embark on exploring innovative educational methods for engineering and technology, the integration of autonomous drone technology and computer vision presents a promising frontier. This section delves into significant advancements in the application of drones and computer vision for wind turbine blade (WTB) inspection. We review advanced deep learning models and path-planning algorithms, highlighting the pivotal role these technologies play in shaping current methodologies for renewable energy maintenance. This exploration situates our work within the broader scientific discourse and underscores our commitment to optimizing renewable energy maintenance through technological innovation.
3.1. UAV Navigation Techniques
Vision-based navigation has emerged as a fundamental component in UAV applications, spanning from aerial photography to intricate rescue operations and aerial refueling. The accuracy and efficiency required for these applications reinforce the critical role of computer vision and image processing across a spectrum of UAV operations. Notable challenges include establishing robust peer-to-peer connections for coordinated missions [
2,
3,
4,
5]. Innovations have also been seen in vision-based autonomous takeoff and landing that integrate IMU, GPS data, and LiDAR, although inaccuracies in attitude determination highlight the limitations of current technologies [
6,
7,
8,
9]. Furthermore, aerial imaging and inspection have benefited from advancements in UAV performance, leveraging methods for enhanced autonomy in surveillance tasks [
10]. Innovations in vision-based systems offer robust alternatives for environments where traditional positioning signals are obstructed, utilizing Visual Simultaneous Localization And Mapping (VSLAM) and visual odometry to navigate through GPS-denied environments [
11,
12]. Extended Kalman Filter (EKF) and Particle Filter applications refine UAV positioning and orientation estimation, addressing the complexities of navigation in intricate scenarios [
13,
14,
15]. As UAV navigation evolves, the integration of heuristic searching methods for path optimization and techniques such as the Lucas–Kanade method for optical flow demonstrate innovative approaches to altitude and speed control, significantly advancing UAV autonomy [
16,
17,
18,
19,
20,
21,
22,
23,
24,
25].
3.2. WTB Computer Vision-Based Inspection Methods
As the world pivots towards renewable energy, wind turbines emerge as pivotal assets, underscoring the necessity of effective maintenance strategies. Visual inspection utilizing RGB cameras has marked a significant technological leap, enhancing the efficacy and advancement of WTB inspections [
26,
27,
28]. This exploration delves into the evolution of WTB visual inspection methodologies, accentuating the integration of data-driven frameworks, cutting-edge deep learning techniques, and drones equipped with RGB cameras for superior imaging quality [
29,
30,
31]. Emphasis is placed on innovative Convolutional Neural Networks (CNNs) for meticulous crack detection and models like You Only Look Once (YOLO) for enhanced defect localization, evaluating the performance of various CNN architectures and anomaly-detection techniques in pinpointing surface damage on WTBs [
32]. Additional research investigates model simplification to further enhance the operational efficiency and inference speed of these deep learning-powered inspection systems, allowing closer to real-time detection and deployment in computationally restrictive environments [
33,
34,
35,
36].
3.3. Educational Implementation and Surrogate Projects with Tello EDU
The Tello EDU drone, created by Ryze technology, incorporates DJI flight technology and an Intel processor allowing for a low-barrier entry into programmable drone applications. Here, the key educational benefits include an easy-to-use Python Application Programming Interface (API) for basic drone functions along with the ability to leverage abstractable block-based coding for even earlier use in programs. Here, we briefly discuss its utilization in pioneering surrogate projects that simulate real-world challenges, thereby providing students with practical experience that effectively bridges theoretical learning with hands-on application.
Pinney et al. showcased the strength of Tello EDUs in educational projects. Here, the challenges of autonomous searching, locating, and logging were investigated through the leveraging of cascading classifiers and real-time object detection. This enabled the drone to autonomously search for targets and interact with them in unique ways [
37,
38]. In the subject of machine learning, this drone allows the capture of aerial imagery, which can be leveraged for practical experience in data-gathering and training algorithms. Here, Seibi et al. and Seegmiller et al. approach the detection of wind turbines and their faults in unique ways. These projects allow for team-based optimization of challenges related to real-world engineering development, enhancing students’ technological literacy and fostering a deeper understanding of system integration and teamwork [
39,
40].
Pohudina et al. and Lane et al. used Tello EDU drones in group settings and competitive scenarios promoting an environment of active learning and innovation, demonstrating the drone’s adaptability to diverse educational needs [
41,
42]. Further studies by Lochtefeld et al., Zou et al., and Barhoush et al. emphasize the potential of these drones to enhance unmanned aerial operations and interactive learning through dynamic environments and responsive tasks [
43,
44,
45]. Future educational projects are expected to delve deeper into more advanced computer vision techniques and the integration of machine learning models, broadening the scope of drone applications in education [
46,
47,
48].
As has been shown, the Tello EDU drone serves as a pivotal educational platform that not only facilitates the exploration of cutting-edge technology, but also prepares students for the technological challenges of the future. Its continued evolution is anticipated to further revolutionize STEM education, enabling more complex, interactive, and comprehensive learning experiences.
3.4. Hardware Configuration and Alternatives
In this study, we utilized the Tello EDU drone, which is an accessible and educationally friendly platform equipped with essential features for computer vision and machine learning applications. The Tello EDU drone is configured with a 5 MP camera capable of streaming 720p video at 30 frames per second, complemented by Electronic Image Stabilization (EIS) [
49]. It also features a Vision Positioning System (VPS) [
50] to facilitate precise hovering and includes an Intel 14-Core Processor for high-quality footage. This drone offers programmability through the Tello SDK, allowing integration with Python scripts for automated control and image-processing tasks.
For regions where the Tello EDU is not available, several alternative drones offer similar capabilities. One such alternative is the Robolink CoDrone [
51], which supports visual coding options like Blockly and additional features such as a physical controller and an LED screen. The Crazyflie 2.1 [
52] is another versatile platform, suitable for advanced users with technical knowledge, offering highly customizable and programmable options. The Airblock drone [
53] is modular and fun to build, making it ideal for STEM education and creative projects. Finally, the Parrot ANAFI [
54] offers a high-quality 4K camera and versatile programming options and is suitable for professional applications.
To ensure the project can be replicated with different hardware, we recommend several specifications for replacement drones. The camera quality should have at least 720p resolution to ensure sufficient detail in captured images. The drones should also have programmability with access to a comprehensive SDK supporting Python or similar programming languages. Built-in WiFi operating at 2.4 GHz is necessary for connectivity to a local computer to execute drone commands and facilitate autonomous decision-making. Additionally, the drones should feature on-board processing capabilities to handle real-time image stabilization and processing tasks. For stabilization and control, a built-in IMU and sensors are essential to maintain flight stability and accurate height measurement.
The information about these drones in
Table 1 may vary by country and availability. Additionally, these drones might not be easily found in all regions due to security and regulatory restrictions.
Table 1 provides a detailed comparison of the different drones, highlighting their key features, programming capabilities, and additional functionalities. By carefully evaluating these factors, you can choose the drone that best aligns with your specific needs and budget. By adhering to these specifications, the project can be effectively implemented using various drones available in different regions, ensuring broader accessibility and applicability.
4. Methodology
Building on the autonomous path-planning work in [
1], the visual inspection of PFBs is investigated along with deep learning classification in which the culminating inspection solution is completed. This is accomplished in two primary tasks. First, the autonomous path-planning must be adjusted to capture images of each PFB in both front and back orientations. This allows for a dataset to be built on which the second task can begin. Here, the deep learning algorithms can be trained, tested, and compared for performance in the task of PFB anomaly detection. The methodologies for each of the primary tasks are detailed below.
4.1. Drone Path Planning
To facilitate the inspection of the PFBs, the searching algorithm deployed, first discussed in our previous work [
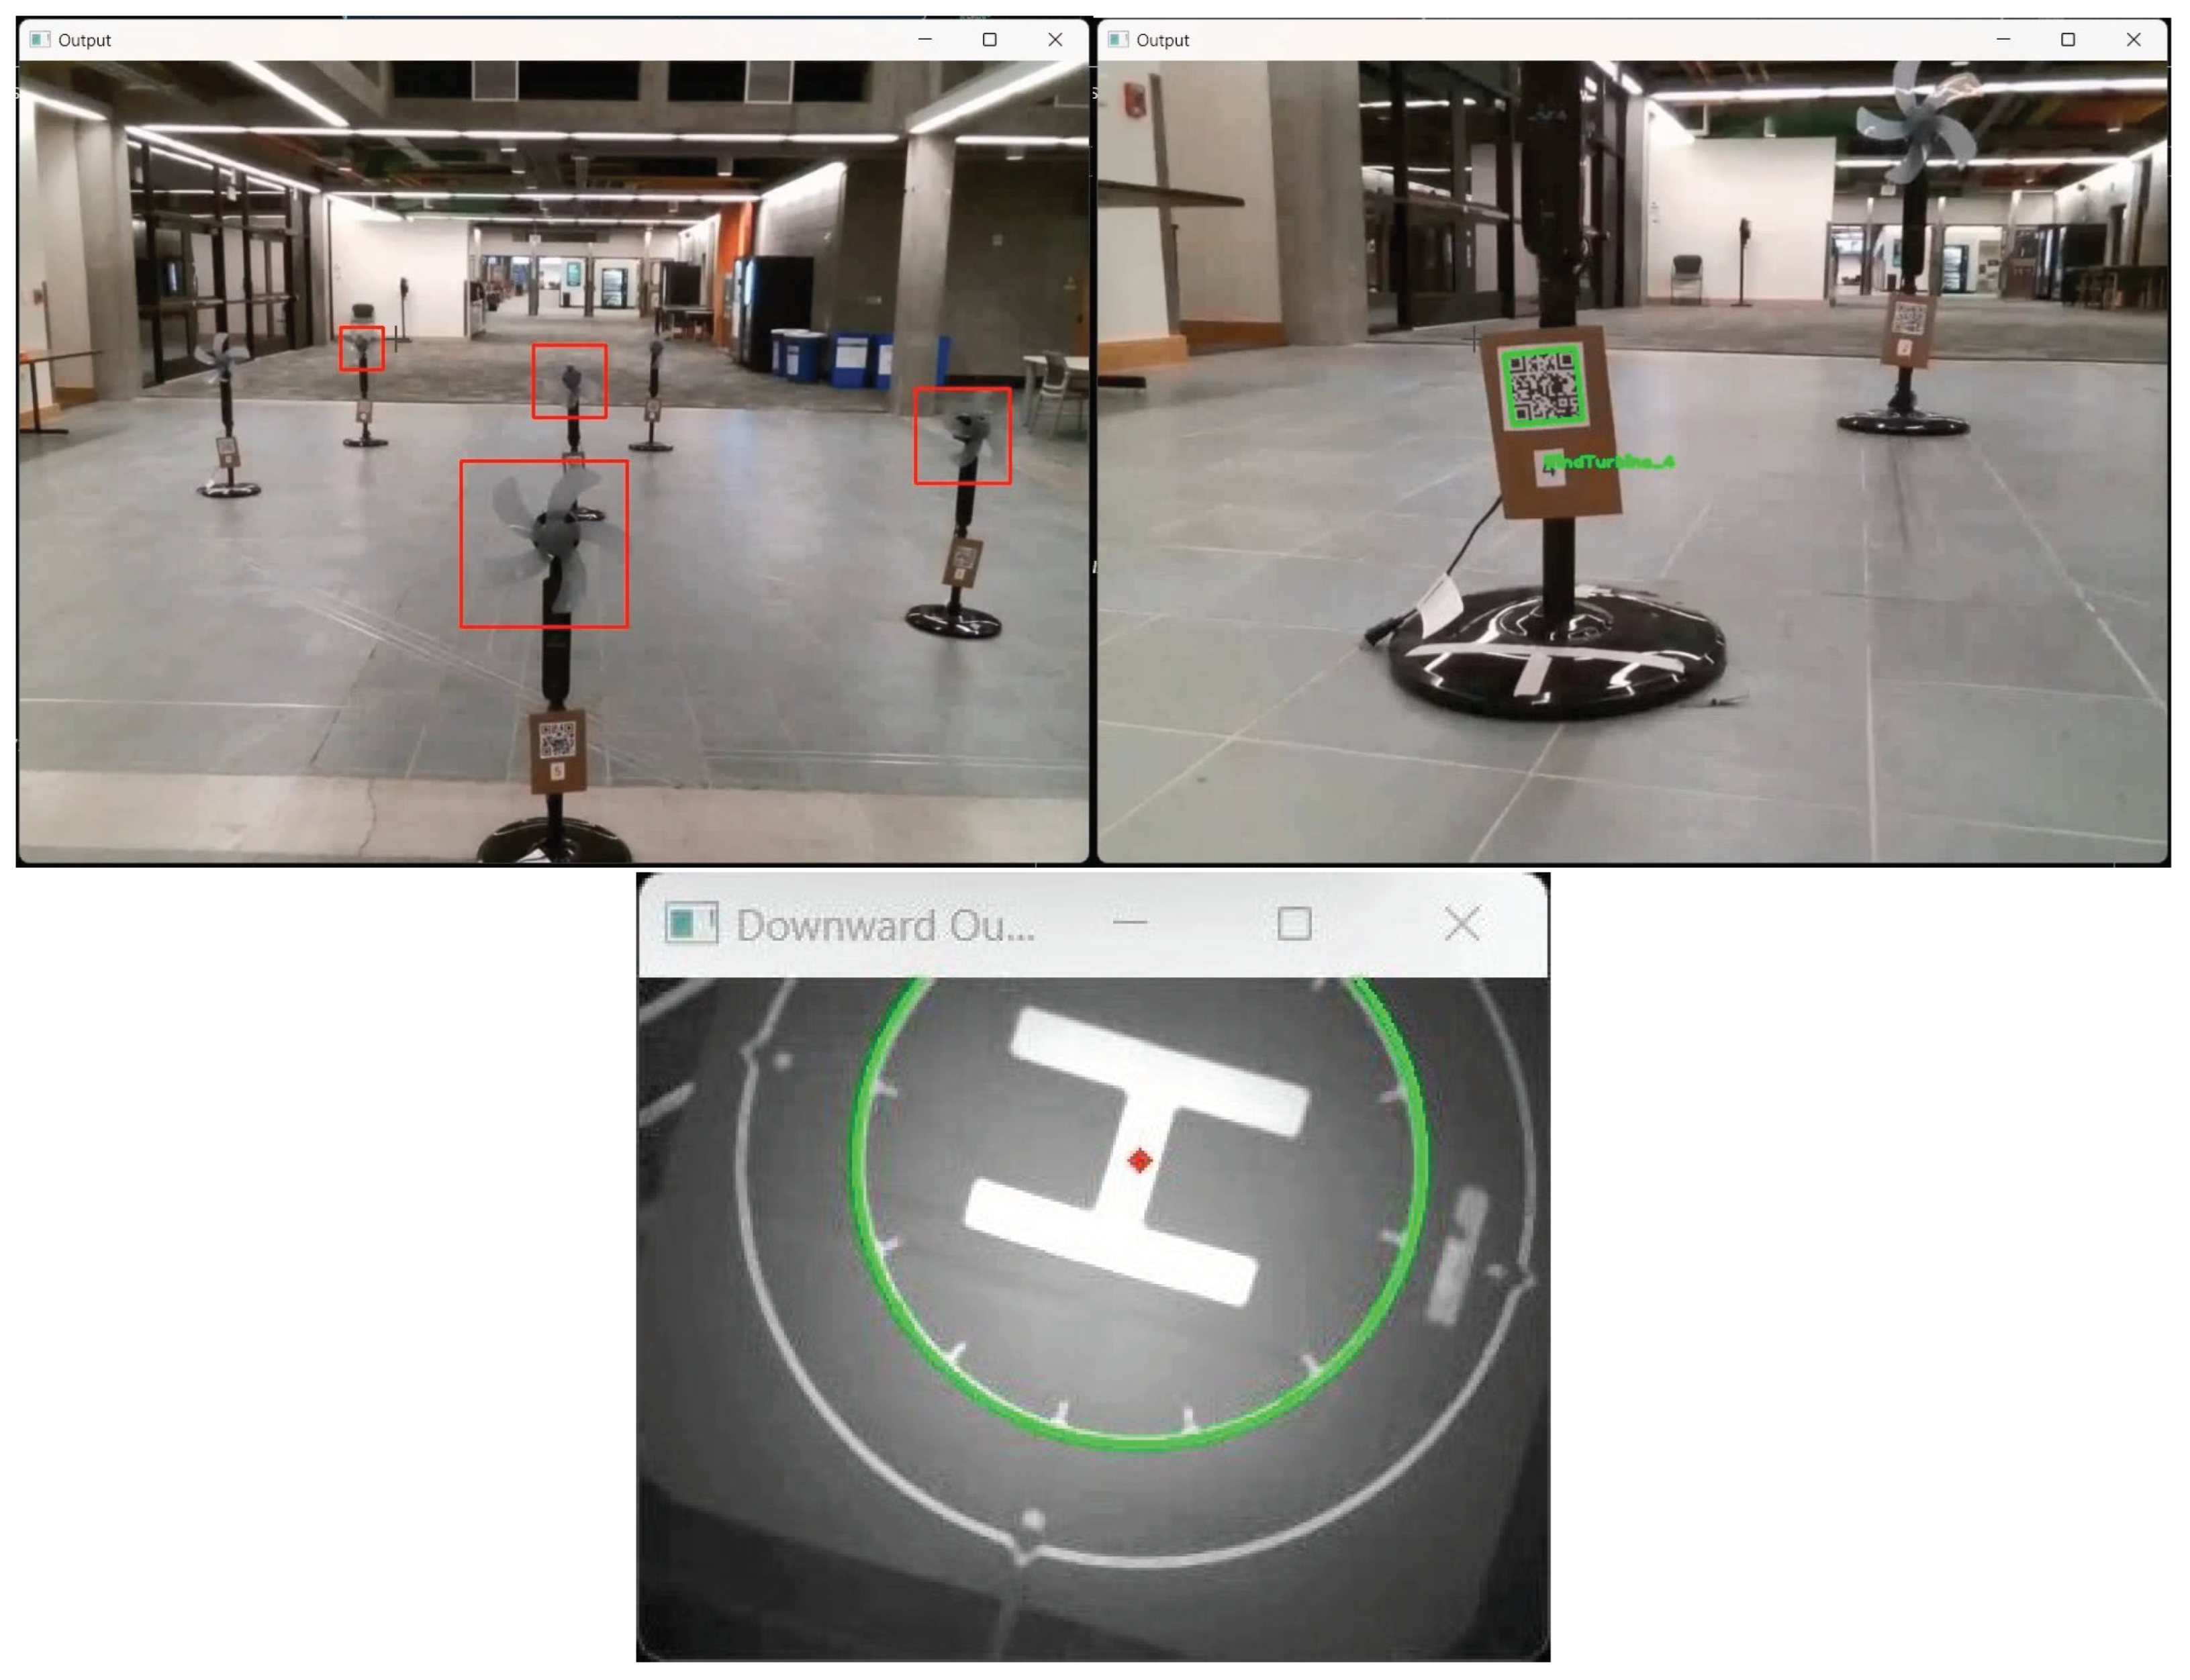
1], consists of a trained Haar-cascade classifier for PFB identification. However, to allow for precise imagery to be captured of the blades, the metal protective casings were removed here, and thus, a new model was required for this task. Additionally, the same QR code system was used to allow seamless tracking of image save locations within the application and allow for drift adjustments. Finally, the auxiliary camera present on the Tello EDU was utilized along with OpenCV’s Hough Circle transform to allow precise takeoff and landing on the designated helipad. These features of the experimental setup can be seen in
Figure 1.
Providing the software framework and backbone of the entire system, a computer running the Python scripts enables seamless integration of various components including sensor data, flight control, drone communication, and multi-threaded processing for deep learning algorithms.
Figure 2 illustrates the comprehensive system architecture integrating the DJI Tello EDU drone with a local computer, essential for executing the multifaceted components of our educational experiments. In this figure, computer vision-based path planning showcases how the drone utilizes real-time image data for navigation, including object recognition and environmental mapping. Cartesian coordinate-based path planning details the method by which the drone’s position is calculated in relation to a Cartesian grid, enabling precise movement based on the calculated coordinates. Trigonometric computations via object detection depict the integration of object detection with trigonometric calculations to determine the drone’s path by calculating the distances and angles relative to the detected objects. Crack and anomaly detection via deep learning illustrates the process of analyzing captured images using deep learning models to detect structural anomalies or damages such as cracks on the simulated turbine PFBs.
4.2. Overview of the Deep Learning Models Used for Classification
In this study, we focus on CNNs [
55] due to their proven effectiveness in image classification tasks, particularly in computer vision applications like defect detection and object recognition. CNNs are designed to automatically and adaptively learn the spatial hierarchies of features from input images, making them highly suitable for the detailed analysis required in our application. The inherent features of CNNs, such as local connectivity, weight sharing, and the use of multiple layers, allow for the extraction of both low-level and high-level features, facilitating accurate and efficient image classification.
While CNNs have demonstrated superiority over traditional Artificial Neural Networks (ANNs) [
56] in handling image data, their performance in comparison to Recurrent Neural Networks (RNNs) [
57] and Vision Transformers (ViTs) [
58] for the proposed application also merits discussion. RNNs, which are typically used for sequential data and time series analysis, are less effective in capturing spatial dependencies within an image. Therefore, they are not the optimal choice for our application, which requires the analysis of static images with complex spatial features.
Vision Transformers (ViTs), on the other hand, represent a novel approach in image classification, leveraging self-attention mechanisms to capture global context. Although ViTs have shown promising results, they often require larger datasets and more computational resources for training compared to CNNs. In our educational setting, where computational resources and labeled data may be limited, CNNs offer a more practical and accessible solution.
The choice of CNNs over ANNs and RNNs is also justified by their architectural advantages. ANNs, with their fully connected layers, lack the spatial hierarchy that CNNs exploit. This makes ANNs less effective for tasks involving image data, where spatial relationships between pixels are crucial. RNNs, designed for sequential data processing, excel in tasks such as natural language processing, but do not leverage the spatial structure of images effectively.
Furthermore, the historical development and success of CNN architectures, such as AlexNet, VGG, ResNet, DenseNet, and Xception, provide a robust foundation for our work. These architectures have been extensively validated across various image-classification benchmarks, and their design principles align well with the requirements of our defect-detection task. By employing CNNs, we leverage their strengths in feature extraction and pattern recognition, ensuring a reliable and efficient inspection process for pedestal fan blades.
In summary, the selection of CNNs is based on their superior ability to handle spatial hierarchies in image data, their proven success in numerous computer vision applications, and the practical considerations of computational resources and data availability in our educational setting.
The subsequent sections will discuss each of these models in detail, highlighting their architectures and the specific advantages they bring to our application.
4.2.1. AlexNet
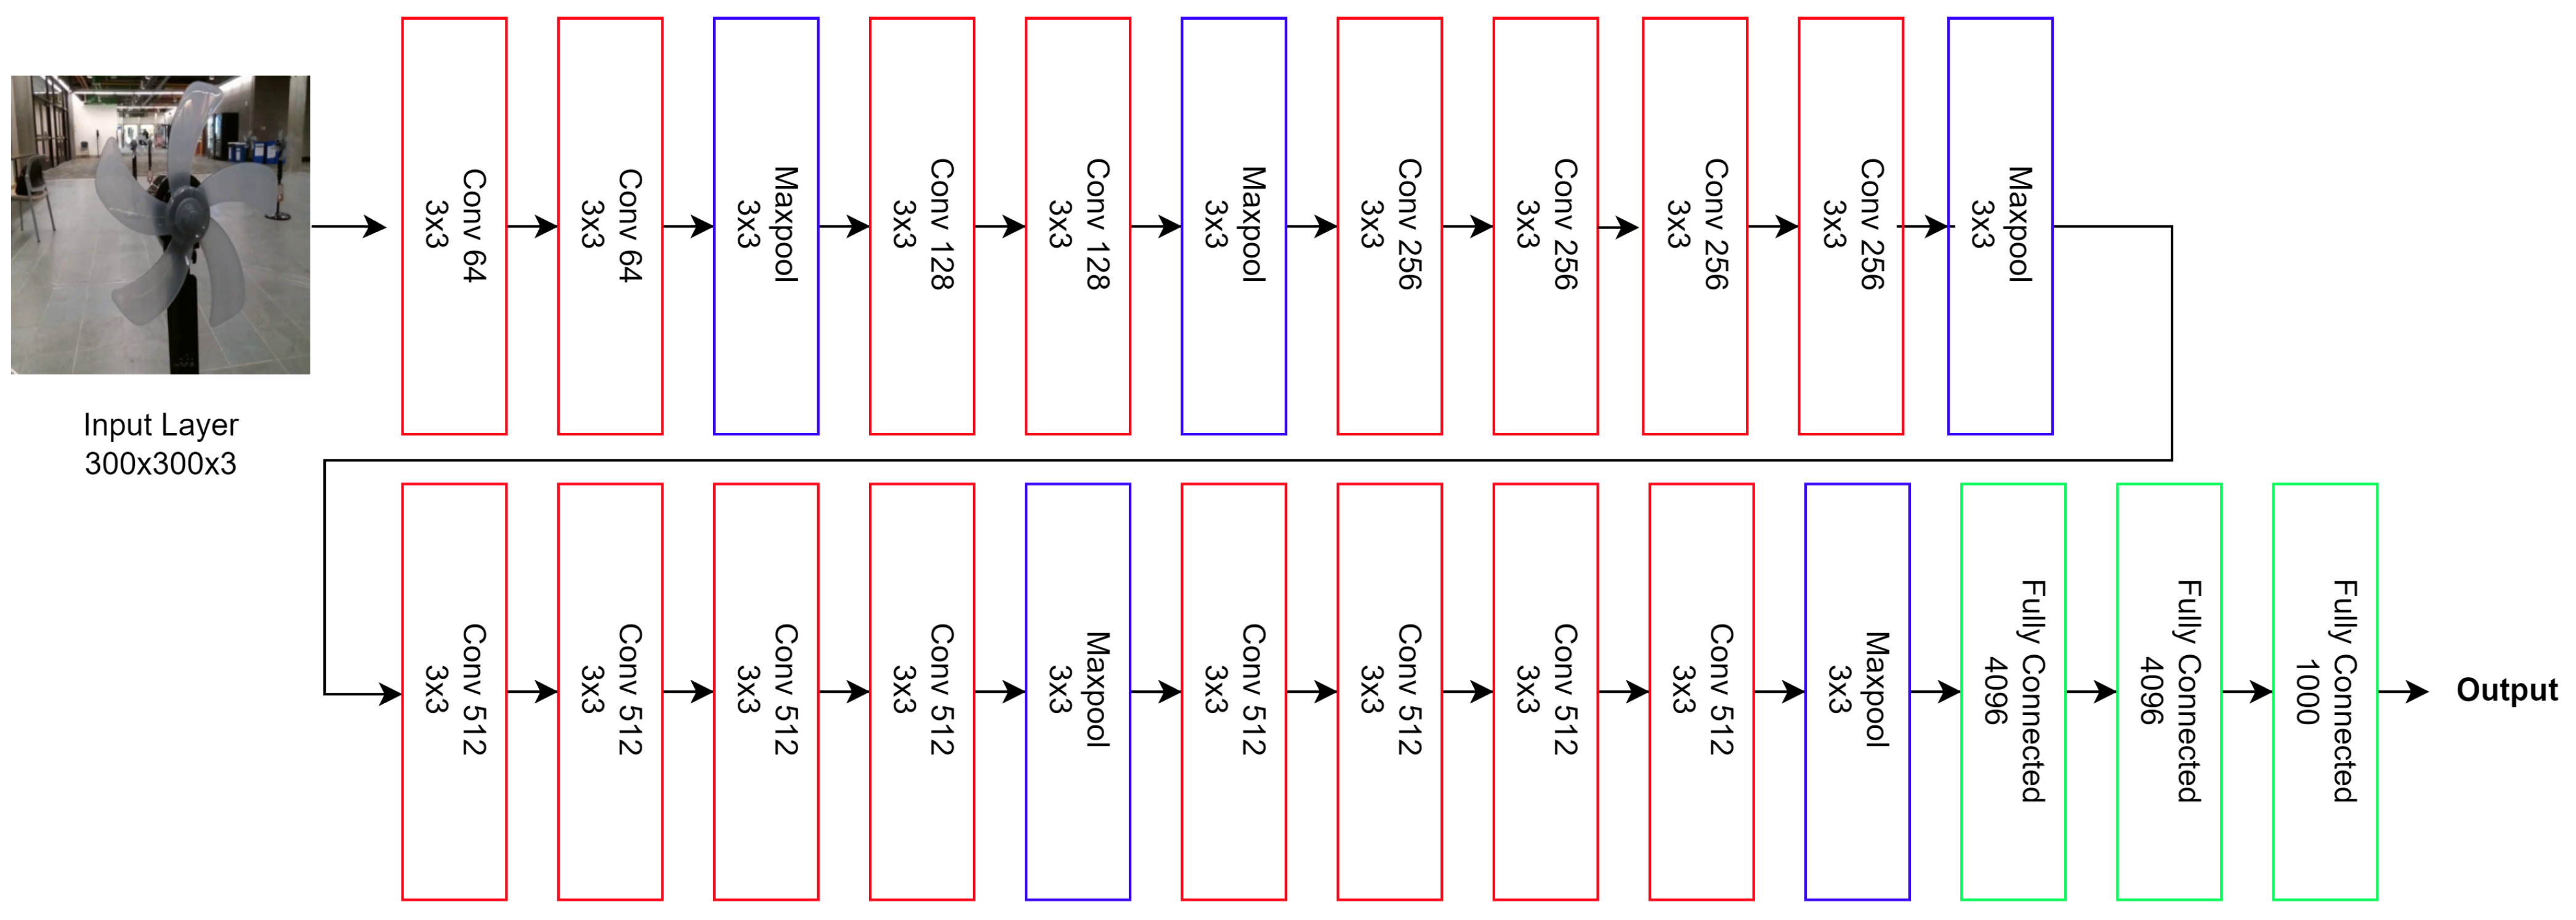
Introduced by Krizhevsky et al., AlexNet sparked a revolution in deep learning, achieving unparalleled success in the ImageNet challenge [
59]. This pioneering model, with its innovative architecture of five convolutional layers followed by three fully connected layers, demonstrated the profound capabilities of deep networks in image classification. This structure can be seen in
Figure 3 with its distinct convolutional and fully connected layers. Notably, AlexNet was one of the initial models to utilize rectified linear units (ReLUs) for faster convergence and dropout layers to combat overfitting, setting new benchmarks in training deep neural networks [
60]. Optimized for dual Nvidia GTX 580 GPUs, it showcased the significant advantages of GPU acceleration in deep learning. The AlexNet model can be mathematically described as follows: For each convolutional layer
l, the operation can be represented as:
where
is the input feature map,
is the filter kernel,
is the bias term, ∗ denotes the convolution operation, and
is the ReLU activation function defined as:
The fully connected layers can be expressed as:
where
is the input vector to the fully connected layer and
and
are the weight matrix and bias vector, respectively.
4.2.2. VGG
The VGG models, developed by the Visual Geometry Group at the University of Oxford, showcased the critical role of network depth in enhancing neural network performance [
61]. Characterized by their use of 3 × 3 convolutional filters, VGG models efficiently detect complex features while keeping parameter counts manageable. The VGG series, including VGG11, VGG13, VGG16, and VGG19, demonstrates the benefits of increasing depth for detailed feature representation, although it raises considerations regarding overfitting and computational demands. Some VGG variants incorporate batch normalization to improve training stability. Despite their intensive computational requirements, VGG models are well known for their depth and robustness in feature extraction, proving especially beneficial in transfer learning applications [
61]. The deepest network, VGG19, is visualized in
Figure 4. Here, the proposed constant kernel size of
and stride of 1 can be seen. The VGG model’s convolutional layers can be described by the following equation:
For each convolutional layer
l, the operation is:
where
is the input feature map,
is the filter kernel of size
,
is the bias term, and
is the ReLU activation function.
Batch normalization, when applied, can be represented as:
where
and
are the mean and variance of the input,
is a small constant for numerical stability, and
and
are learnable parameters.
4.2.3. Xception
The Inception architecture, renowned for its innovative Inception module, has significantly advanced neural network designs by enabling the capture of features at various scales. Developed with the goal of achieving both depth and width in networks without compromising computational efficiency, it introduced parallel pooling and convolutions of different sizes. Xception, or Extreme Inception, evolved from this model by employing depthwise separable convolutions, thereby enhancing the network’s ability to learn spatial features and channel correlations more effectively [
62]. This technique comprises two stages: depthwise convolution and pointwise convolution.
In the first stage, depthwise convolution, a single filter is applied per input channel. Mathematically, for an input
X of size
(width, height, depth), the depthwise convolution is defined as:
where
represents the output feature map,
k is the filter size,
is the filter for depth
d, and
are the spatial coordinates in the feature map. This step involves convolving each input channel separately with a corresponding filter, preserving the depth dimension, but reducing the spatial dimensions.
In the second stage, pointwise convolution, the features obtained from the depthwise convolution are combined channelwise. This is mathematically expressed as:
where
is the final output after the pointwise convolution,
D is the number of input channels, and
is the pointwise filter. This operation effectively combines the information across different channels, allowing the model to learn more complex patterns.
The Inception module’s output,
, incorporates various convolutional and pooling operations as follows:
where
,
,
, and
represent the outputs of the 1 × 1, 3 × 3, and 5 × 5 convolutions and the pooling operations, respectively. This structure allows the network to capture features at multiple scales, contributing to its robustness and effectiveness in complex image-recognition tasks.
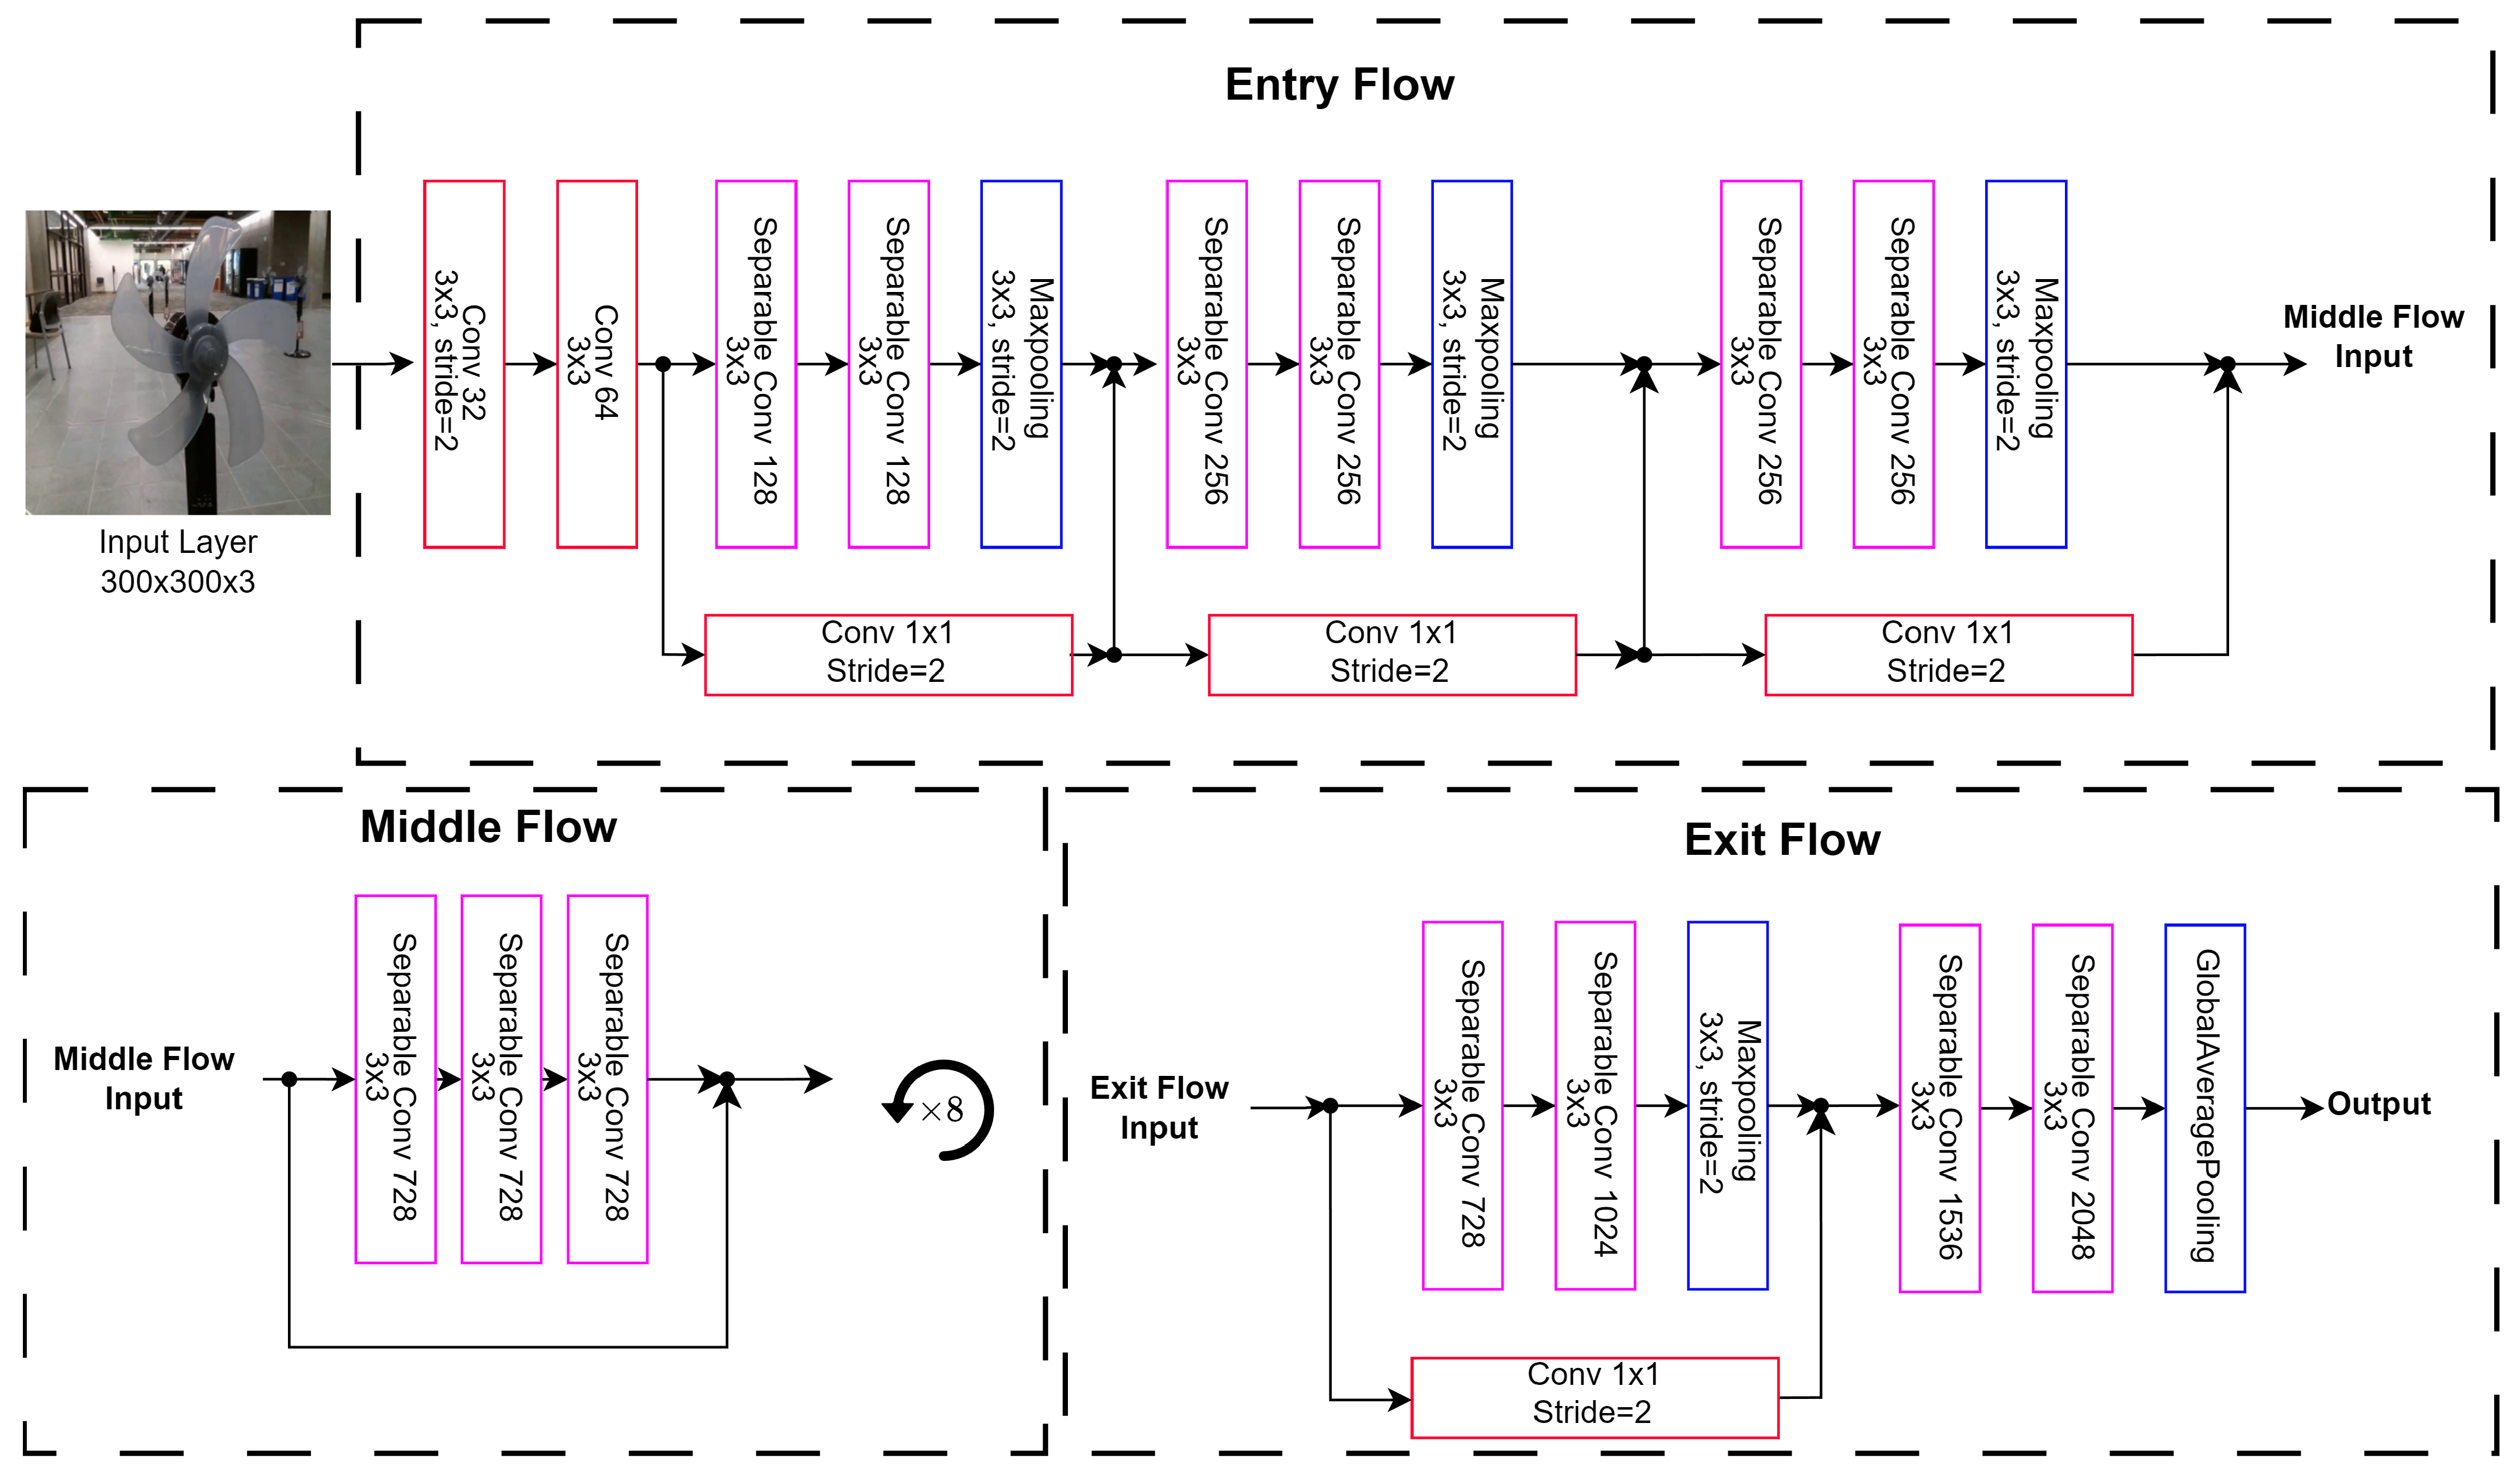
By refining the convolutional approaches, the Xception model demonstrates the power of deep learning techniques in achieving a more nuanced understanding of image data, enhancing both parameter efficiency and overall performance in various computer vision applications. The Xception architecture is comprised of 3 sections, the entry flow, middle flow, and exit flow, highlighted in
Figure 5. Here, the entry flow leverages separable convolutions and skip connections. This is followed by the middle flow, which repeats 8 times prior to the exit flow. Finally, there are another skip connection and separable convolution with a global max pooling.
4.2.4. Residual Networks
Introduced by Kaiming He and colleagues, Residual Networks (ResNets) tackled the challenge of training deeper networks effectively [
63]. At their core, ResNets employ residual blocks that aim to learn residual functions, simplifying the learning process by focusing on residual mappings. These blocks, through skip connections, allow the network to adjust identity mappings by a residual, enhancing gradient flow and addressing the vanishing gradient problem.
In a residual block, the network is tasked with learning the residual function
instead of the original function
. Mathematically, this is represented as:
where
is the residual function that the block learns,
is the desired underlying mapping, and
x is the input to the block. The output of the residual block is then given by:
where Output is essentially the original function
, with the skip connection ensuring that the input
x is directly added to the learned residual function
. This mechanism allows gradients to bypass one or more layers, thereby mitigating the vanishing gradient problem and facilitating the training of much deeper networks.
The architecture of ResNets includes various depths such as ResNet18, ResNet34, ResNet50, ResNet101, and ResNet152, each denoting the number of layers in the network. Furthermore, there are
wide ResNet versions that expand the number of filters in each layer, thereby enhancing performance at the cost of increased computational demands [
63]. The 50-layer deep ResNet model is visualized in
Figure 6. Here, the residual connections can be seen along with the variable depth layers repeated, corresponding to the depth of the architecture chosen.
ResNets have profoundly influenced subsequent deep learning models by offering a robust solution to the challenges associated with training deep networks, balancing performance with computational efficiency. The introduction of residual blocks has set a precedent for many modern architectures, underscoring the importance of efficient gradient flow and effective training of deep models.
4.2.5. DenseNets
Introduced by Huang et al., Densely Connected Convolutional Networks, or DenseNets, expand upon ResNets’ skip connection framework [
64]. DenseNets enhance network connectivity by ensuring each layer receives input from all preceding layers, facilitating maximal information flow. The hallmark
dense block sees layers incorporating feature maps from all prior layers, enhancing gradient flow and fostering feature reuse, thereby improving efficiency and accuracy, while minimizing parameter counts [
64].
In a dense block, each layer
l is connected to all previous layers. Mathematically, the output of the
l-th layer, denoted as
, is defined as:
where
represents the composite function of batch normalization (BN), followed by a rectified linear unit (ReLU) and a convolution (Conv) operation, and
denotes the concatenation of the feature maps produced by all preceding layers 0 to
. This dense connectivity pattern ensures that each layer has direct access to the gradients from the loss function and the original input signal, improving gradient flow and promoting feature reuse.
DenseNets are specified by their layer counts, such as DenseNet121 or DenseNet201, which indicate the depth of the network. Between dense blocks,
transition layers are introduced to manage feature map dimensions. A transition layer typically consists of batch normalization, a
convolution to reduce the number of feature maps, and a
average pooling operation to down-sample the feature maps. Mathematically, a transition layer can be expressed as:
where
represents the transformation applied by the batch normalization and
convolution operations on the input feature maps
and AvgPool denotes the average pooling operation.
Figure 7 illustrates the DenseNet121 architecture along with the proposed dense blocks and transition layers.
This architecture’s efficacy lies in its robust feature representation and reduced redundancy. By leveraging dense connections, DenseNets improve the parameter efficiency and enhance the learning process, resulting in models that are not only powerful, but also efficient for various deep learning tasks.
4.2.6. Vision Transformer (ViT)
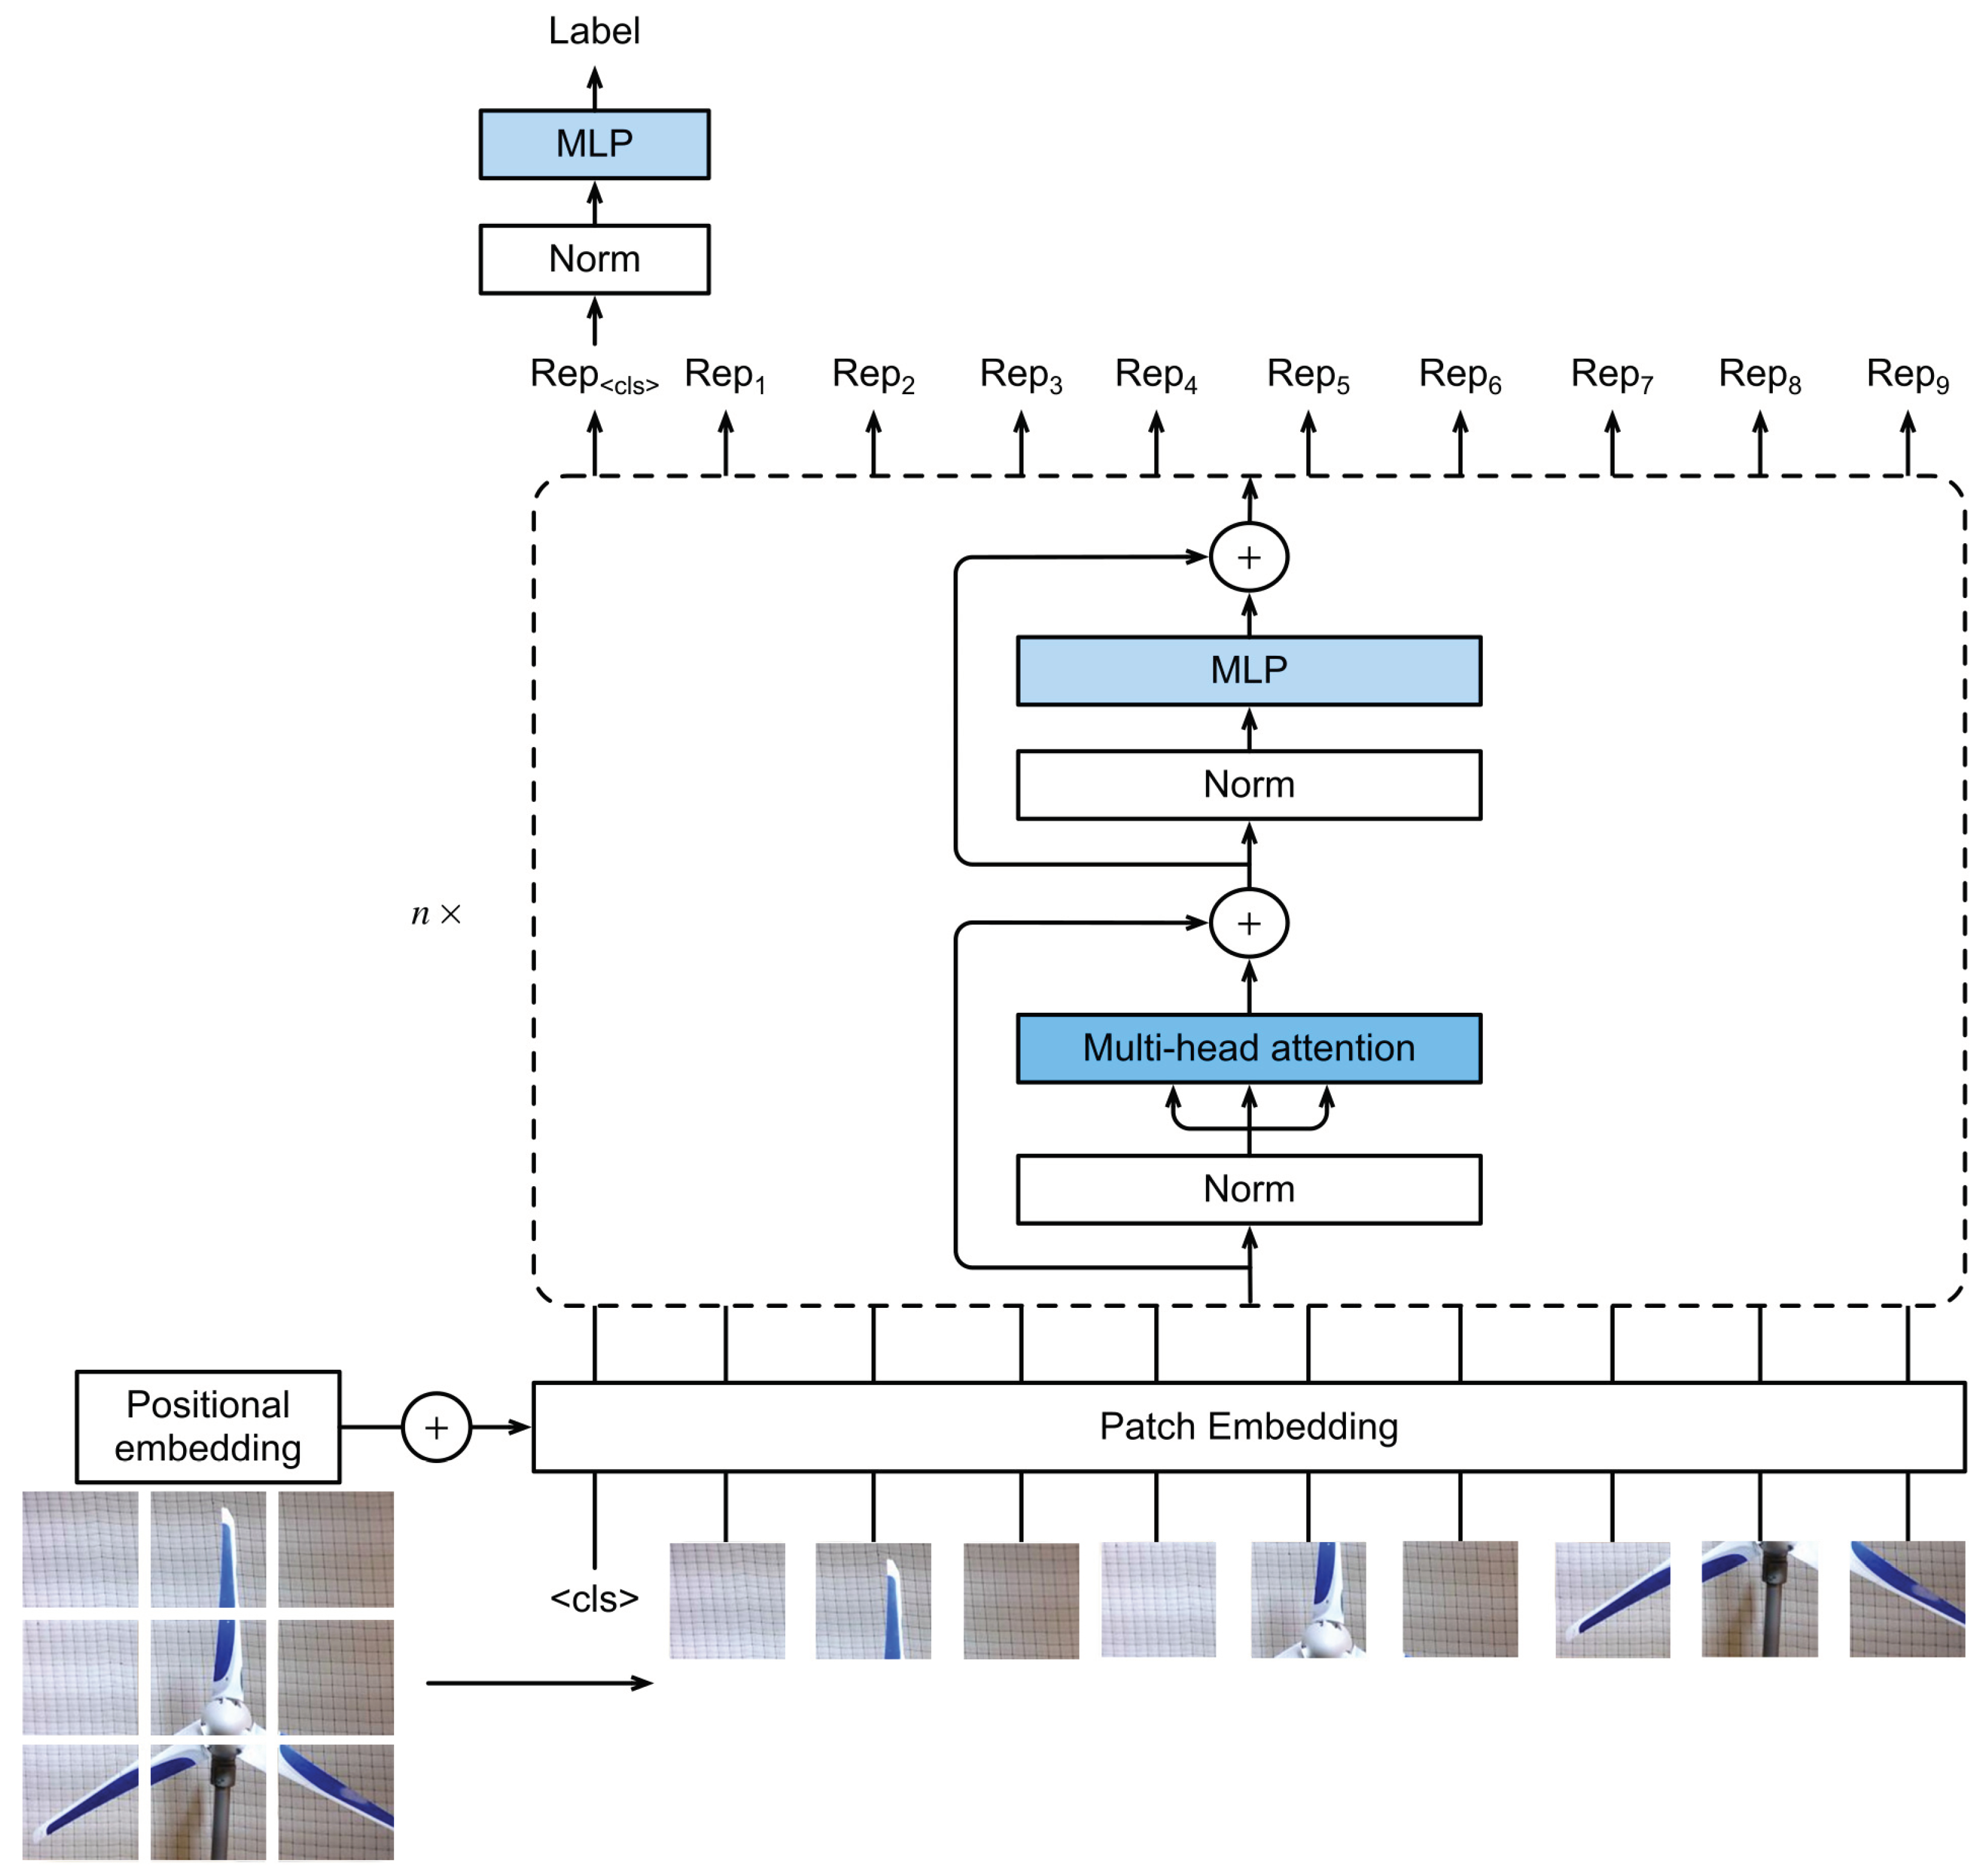
The Vision Transformer (ViT) represents a significant shift in computer vision, introducing the Transformer architecture to image classification challenges, previously dominated by CNNs [
58]. By employing the attention mechanism, ViT can concentrate on various image segments, enhancing its focus and interpretability. An image is segmented into patches, encoded as tokens, and processed through Transformer layers, allowing the model to capture both local and global contexts efficiently. Additionally, the architecture of ViT is depicted in
Figure 8.
ViT begins by dividing an image into fixed-size patches. Each patch is then flattened and linearly projected into an embedding space, resulting in a sequence of image patch embeddings. Mathematically, given an input image
(height, width, and channels), it is reshaped into a sequence of flattened 2D patches
, where
P is the patch size and
is the number of patches. Each patch is then linearly transformed into a vector of size
D using a trainable linear projection
E:
where
is the embedding of the
i-th patch.
The core component of ViT is the multi-head self-attention mechanism. For each attention head, the queries
Q, keys
K, and values
V are computed as linear transformations of the input embeddings. The attention mechanism is defined as:
where
are the query, key, and value matrices and
is the dimension of the keys. The scaled dot-product attention computes the similarity between queries and keys, followed by a softmax operation to obtain the attention weights, which are then used to weight the values.
The Transformer layer consists of multi-head self-attention and feed-forward neural networks, applied to the sequence of patch embeddings. Positional encodings are added to the patch embeddings to retain positional information:
where
Z is the output of the Transformer layer, MultiHead denotes the multi-head attention mechanism, and
P represents the positional encodings.
ViT demonstrates its versatility across different scenarios by employing the ViTForImageClassification model. In this model, the final representation from the Transformer encoder is fed into a classification head for binary or multi-class classification tasks. The ability of ViT to segment images into patches and apply an attention mechanism allows it to adeptly manage various scales of image features, capturing intricate details and broad contexts simultaneously. ViTs mark a promising direction in leveraging Transformer models beyond text, harnessing their power for intricate image-recognition tasks, and setting a new standard in computer vision.
5. Experiments and Results
In this section, the experiments conducted are introduced and the resulting performance is analyzed. First, the path-planning alterations from what is presented in [
1] are discussed to facilitate the capture of PFB imagery. Then, the simulations of deep learning classification are introduced, including the created dataset, augmentation and training parameters, and transfer learning. Finally, the necessary comparative metrics are discussed along with each of the introduced classification architectures’ performance on the proposed dataset.
5.1. Drone Path Planning for PFBs Inspection
To facilitate autonomous drone navigation and inspection, real-time object detection is deployed using Haar-cascade classifiers. The following sections discuss the benchmarks of this approach along with the necessary components for blade inspection including distance estimation, travel vector creation, and flight path optimization. The performance of each optimization and algorithm is investigated along with a culmination of these parts in the creation of a dataset, for fault classification, fully autonomously.
5.1.1. Object Detection via Haar-Cascade Object Detection
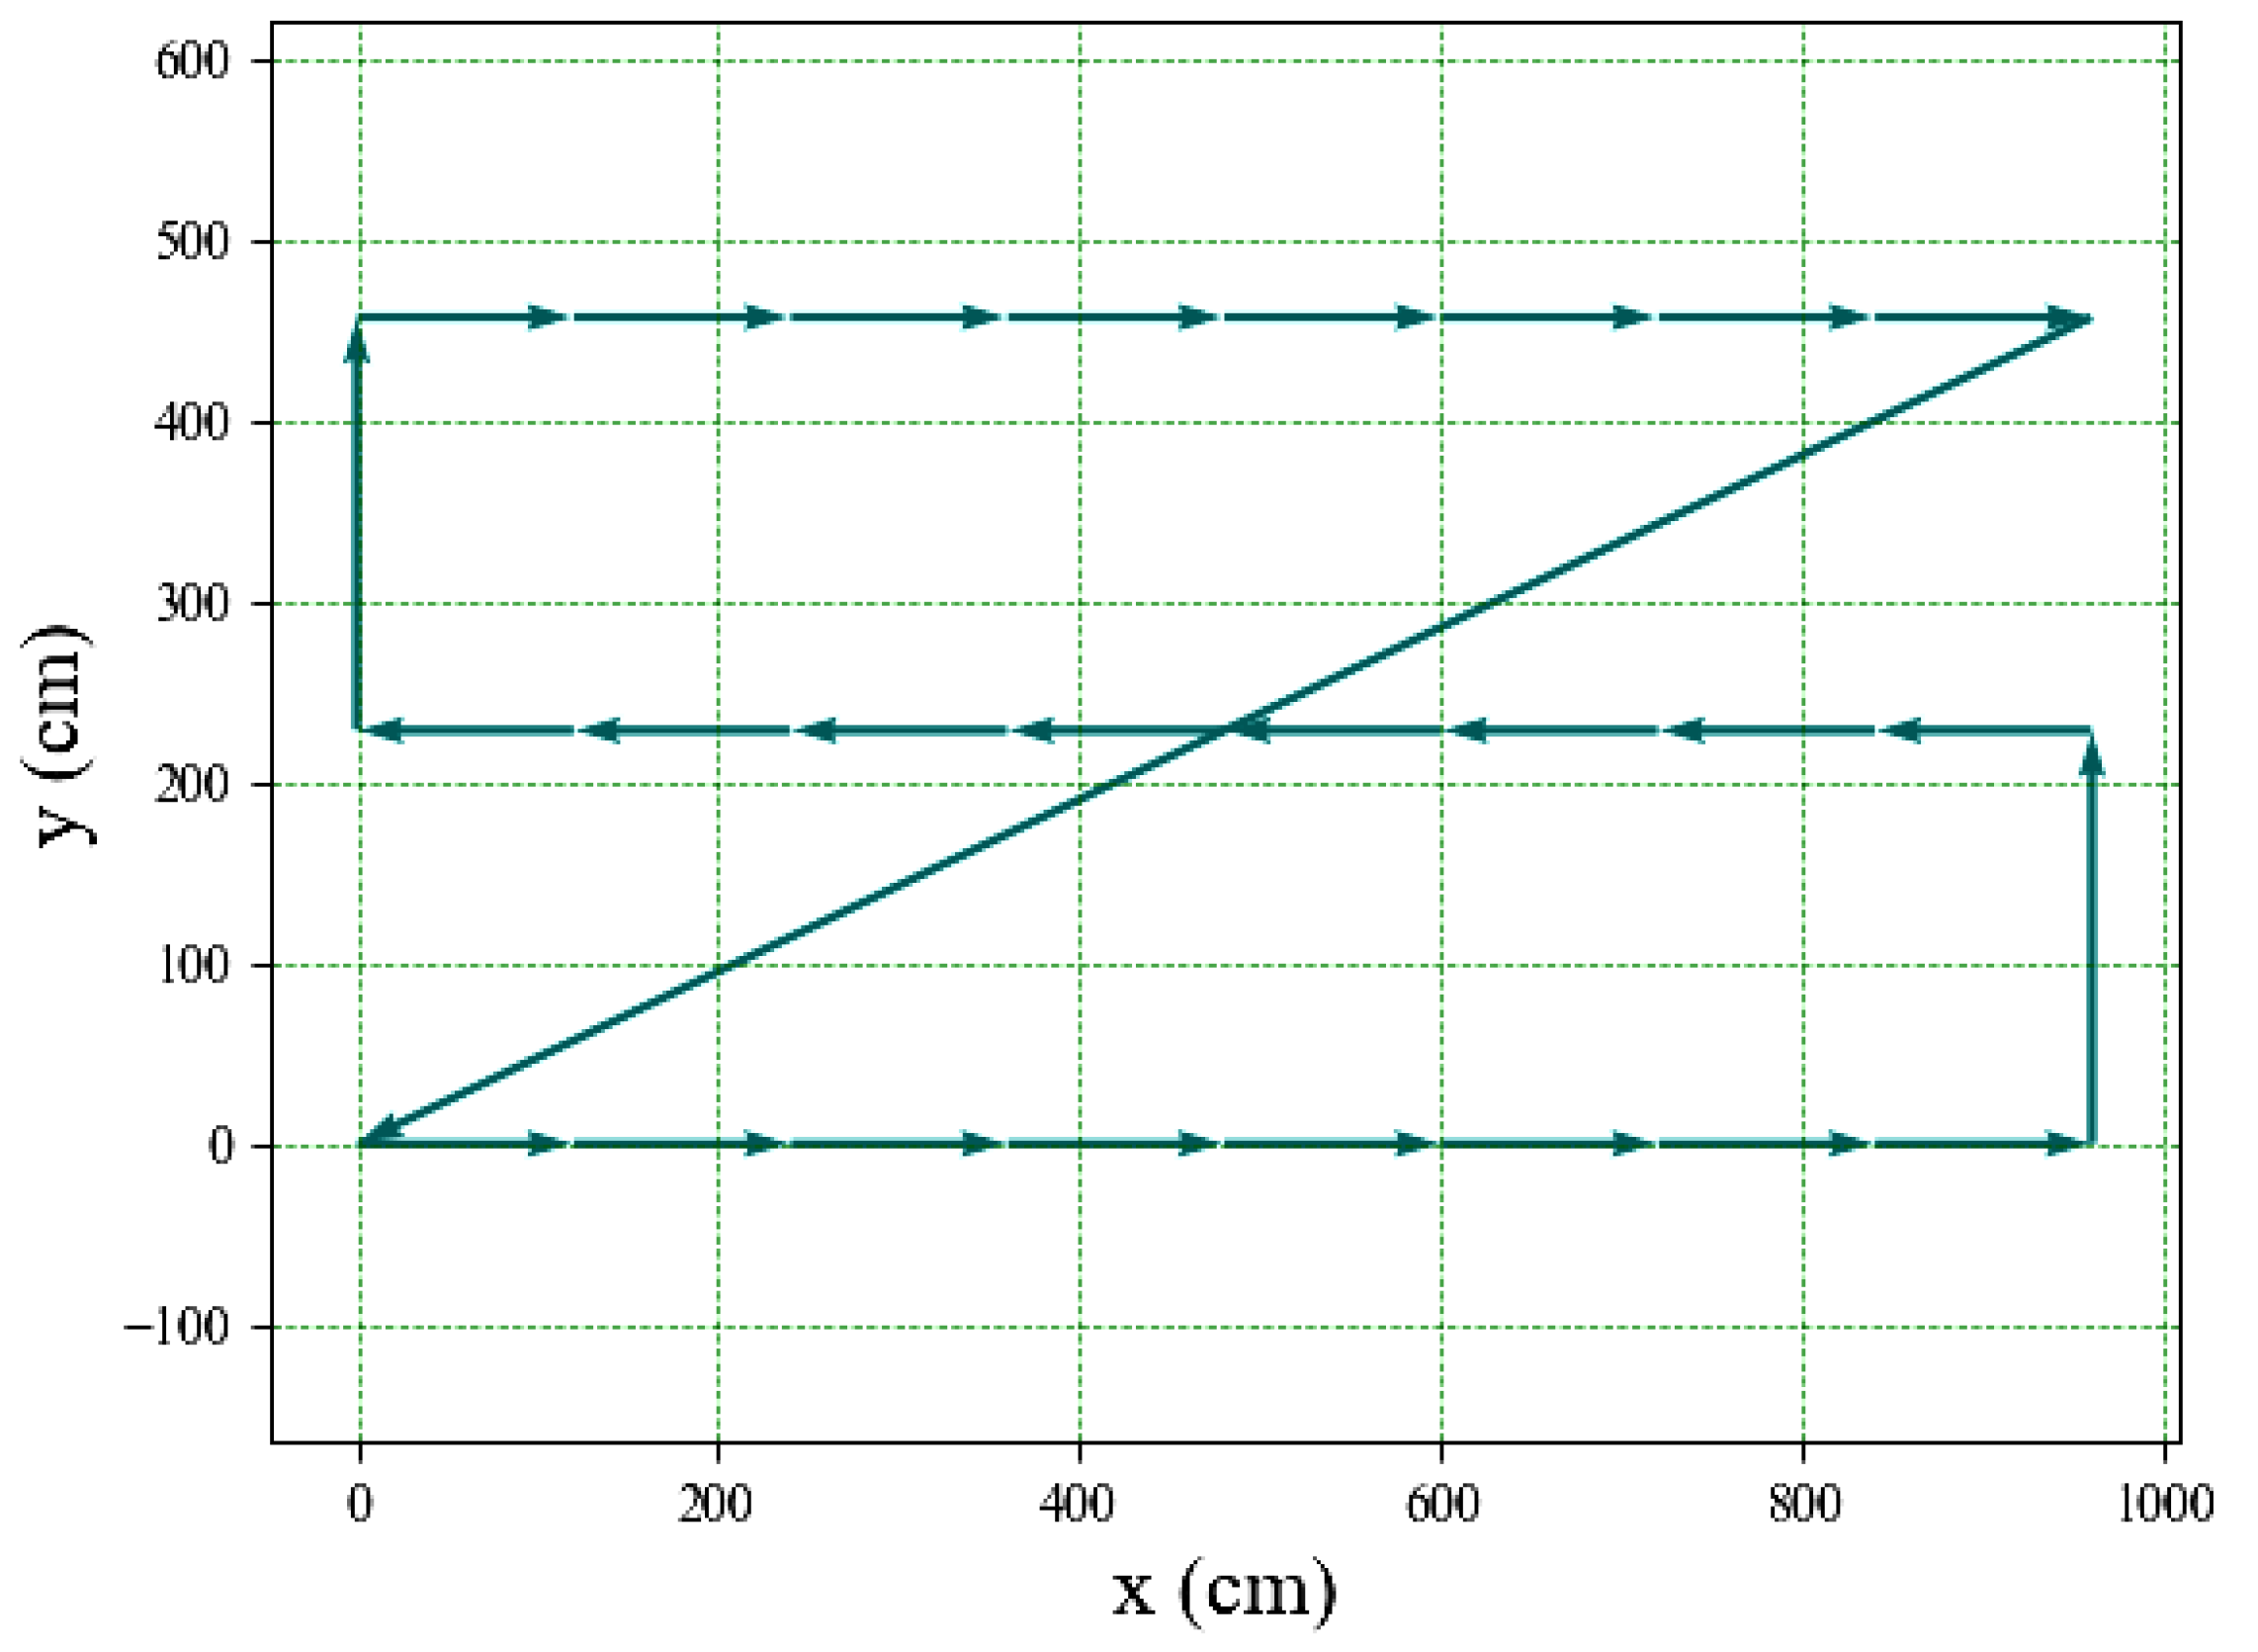
To allow a greater level of detail in the inspection images, the fans were stripped of their protective metal cages to expose the PFBs. Training a new boosted cascade of weak classifiers to detect the updated look required sets of positive and negative images. For the best accuracy in the specific scope of work, all photos were taken with the drone in the experiment environment. The drone was programmed to fly autonomously and extract frames from the camera. Python multi-threading was utilized to make the drone perform a snake path flight pattern while extracting pictures in real time. The flight path shown in
Figure 9 was performed multiple times with the turbines arranged in varied patterns.
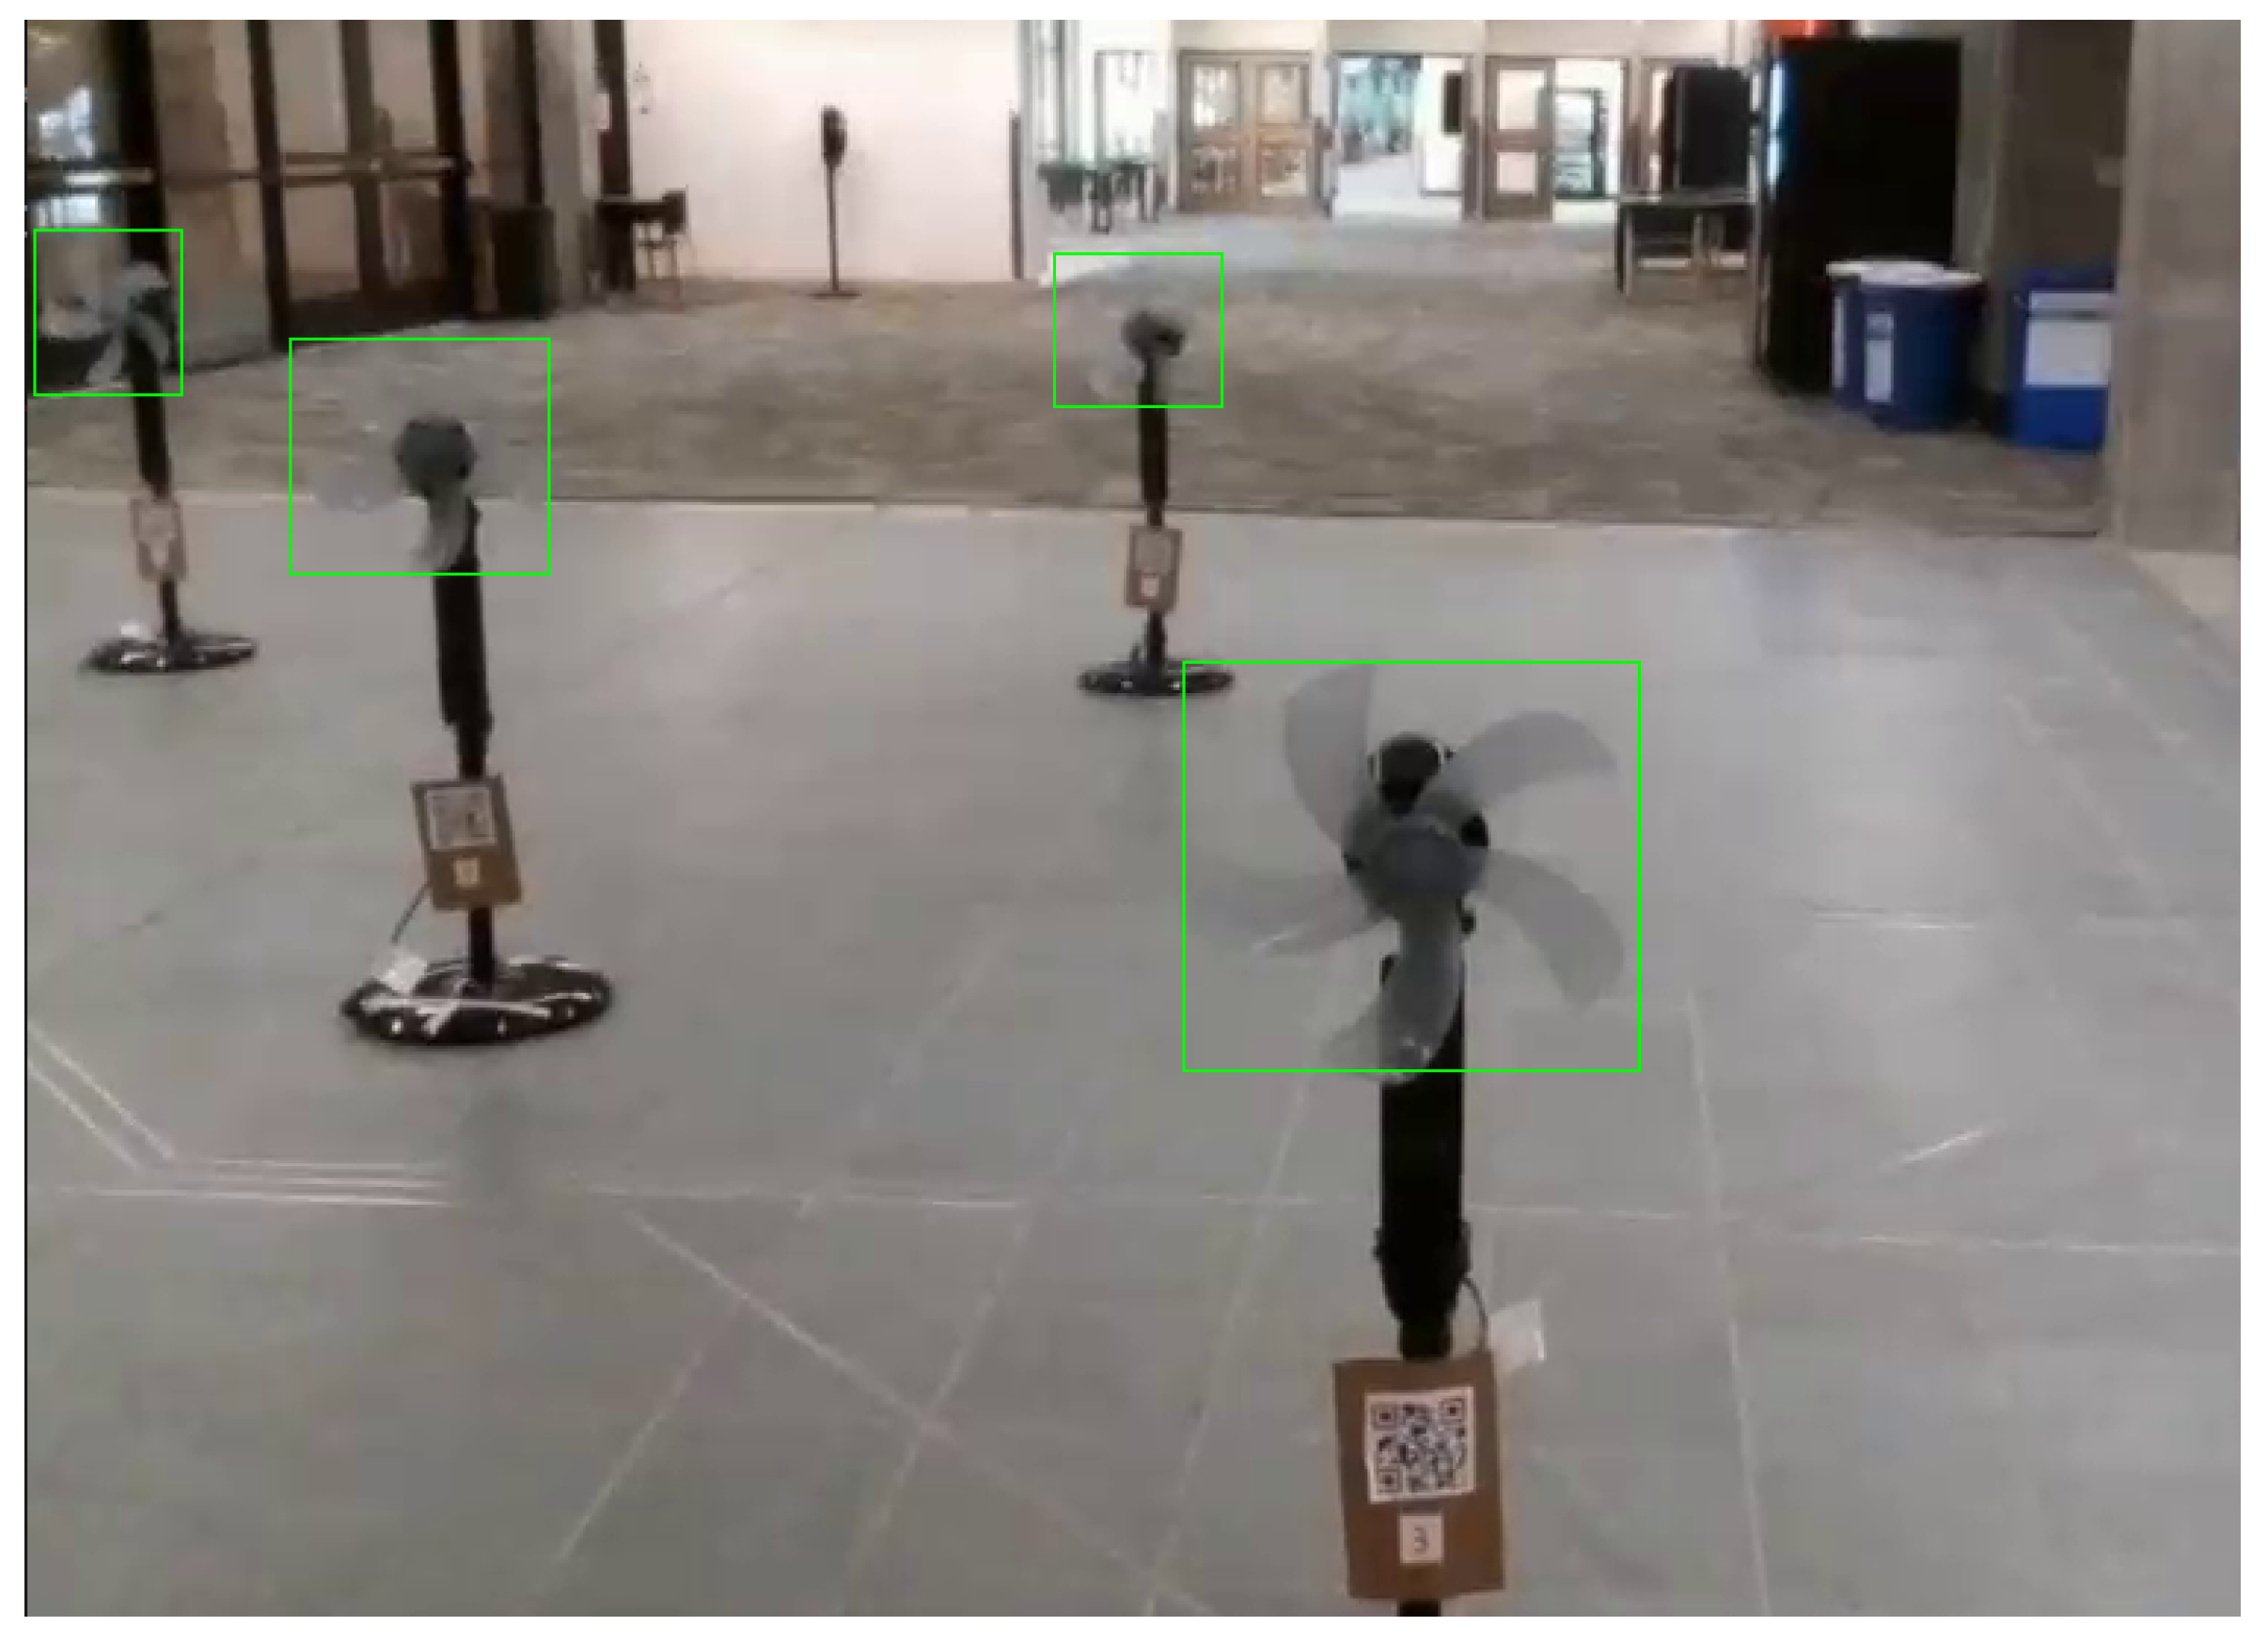
Each flight extracted hundreds of photos, many with fans and many without. The collected dataset was manually analyzed to find and eradicate unfit images due to blurriness or subpar quality. The remaining images were separated into positive and negative sets, where the negative set did not include any turbine PFBs, whole or partial. Then, leveraging OpenCV’s annotation tool, each PFB was annotated. At first, objects were given a bounding box as long as most of the object was in frame with the box tightly encompassing the fans, as shown in
Figure 10.
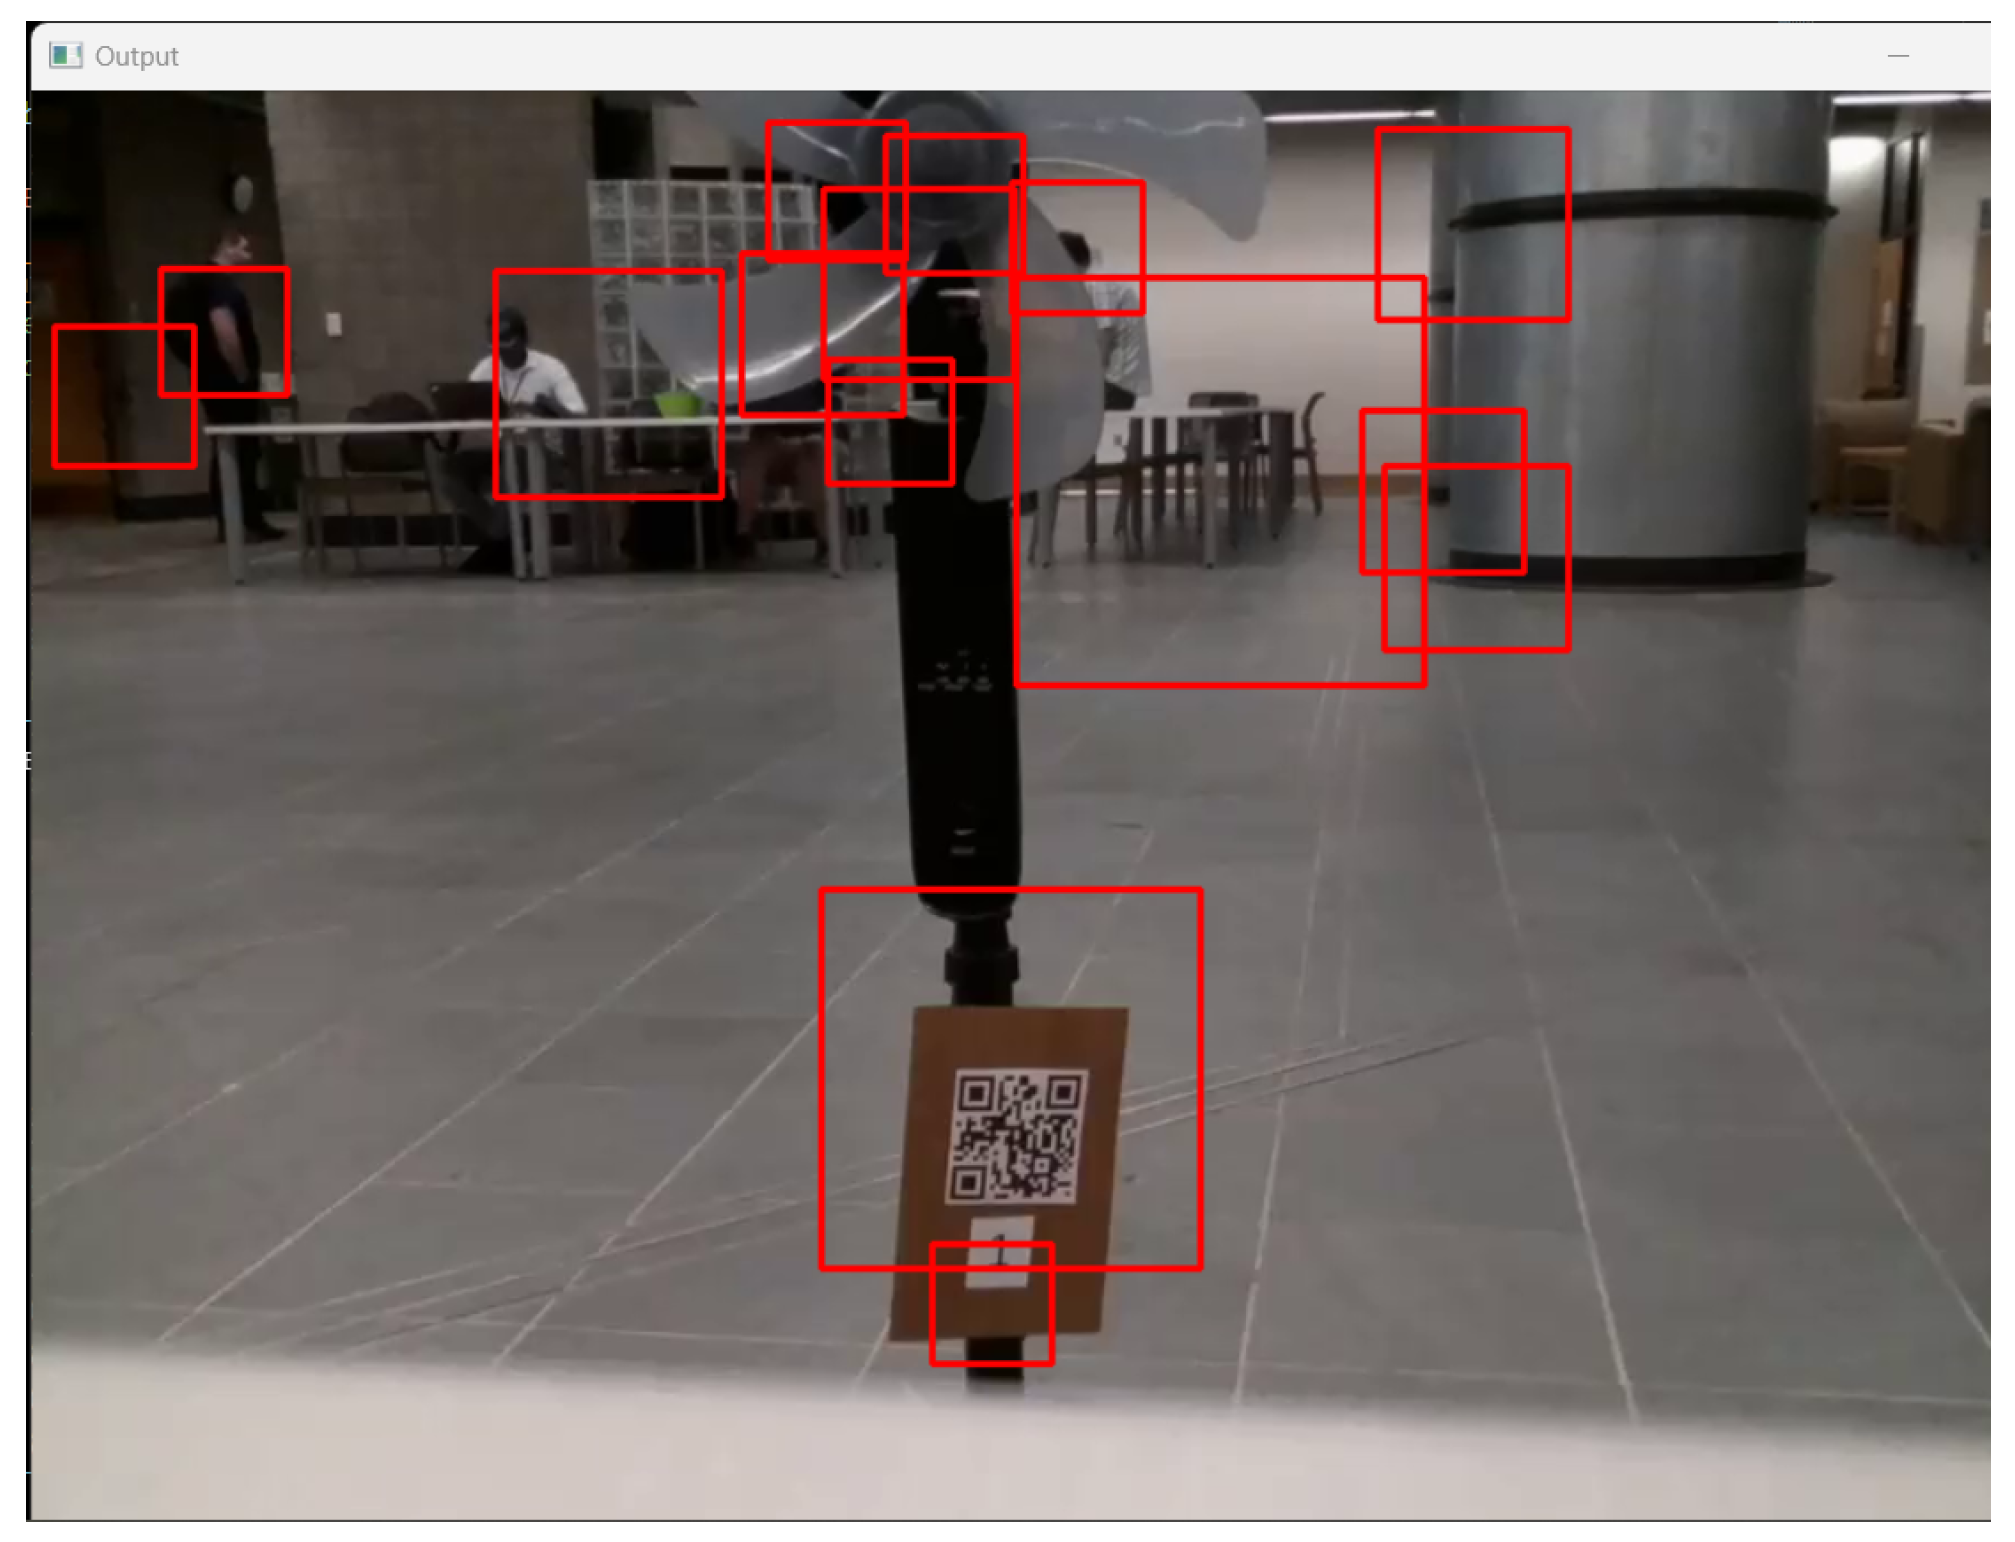
In performing this, the goal was to achieve accurate bounding boxes for precise distance calculations. Once the annotation process was completed, training began, where the machine learning (ML) model tested itself with positive and negative samples and adjusted the chosen Haar features to minimize the loss. The best way to test the model is to perform real-time detection in experimental flights. The results of initial training with a low number of stages are illustrated in
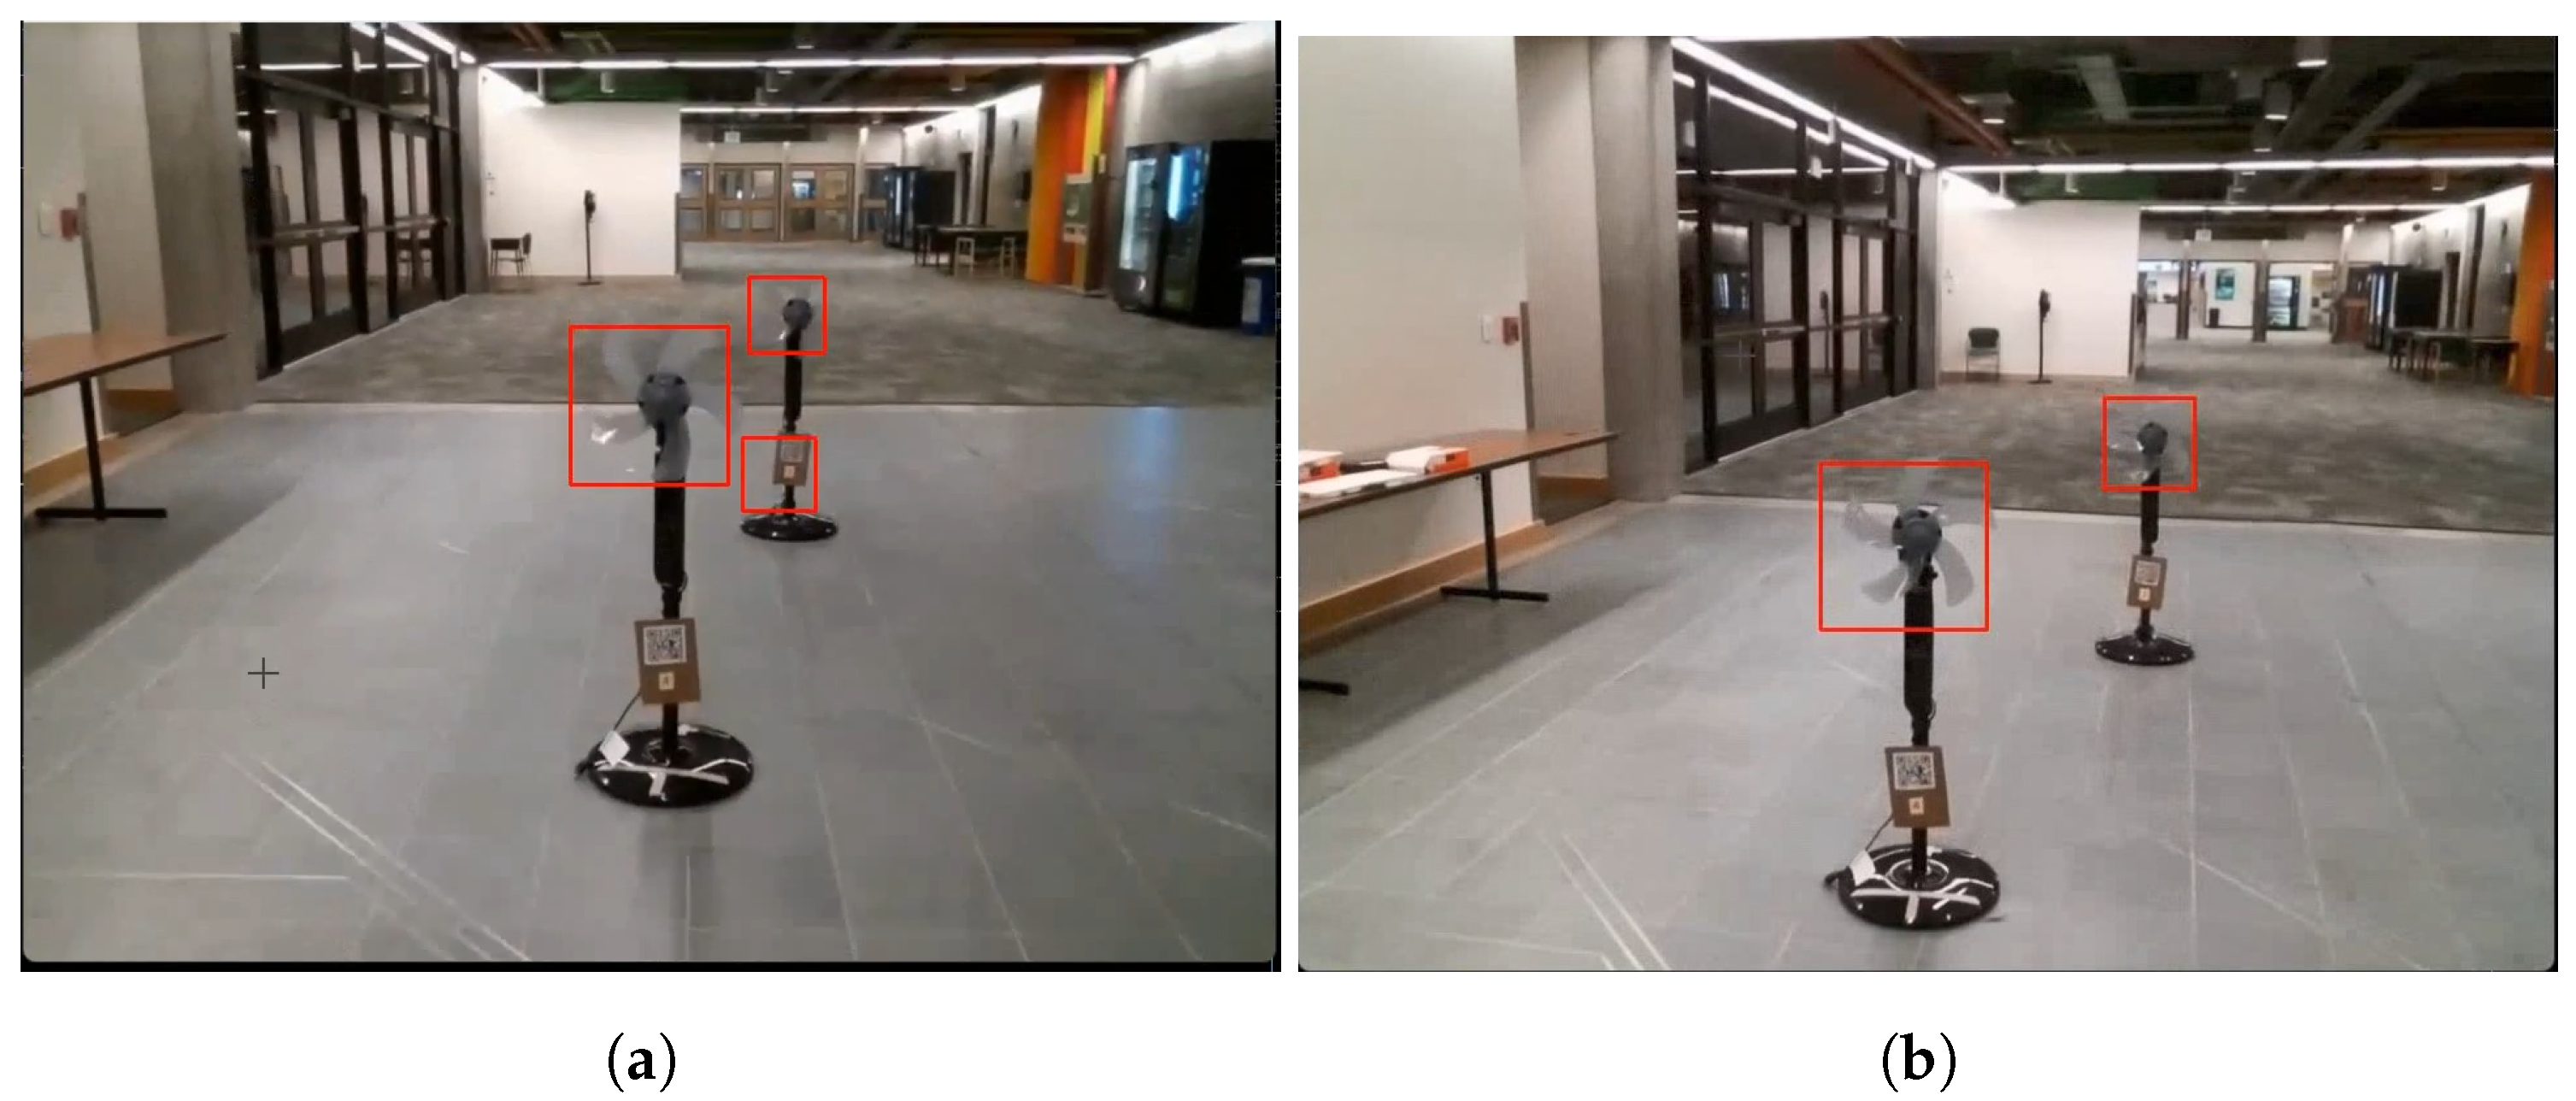
Figure 11, signaling that the model was under-fitted and unable to generalize the PFB features. After adding several stages of Haar features, the model became over-fitted, and no objects were detected where objects existed. Stages were eliminated until the object-detection model had good detection results, as shown in
Figure 12a.
In an investigation of the detection model’s performance, the detection of partial PFBs was consistent with the annotation method utilized. Here, images were annotated even if significant portions of the PFBs were cut off from the frame’s boundaries. Another issue present in the training of the detection model exists in the translucency of the PFBs, allowing them to have similar pixel densities as non-PFB backgrounds. In the experiments that followed, it was found that the partial detections and inconsistent sizes of the bounding box led to inaccuracies in the path-planning algorithms, mainly the distance computation leveraging the real-world size of the turbine and the size in pixels. The equation leveraged for distance calculations is defined as:
where
d is the approximate distance of the detected object to the drone’s camera (cm),
is the calculated focal length of the camera for a
-resolution image,
is the real-world width of the object (cm), and
is the width of the object in a frame (pixels).
To solve these issues, a new Haar-cascade model was trained, this time with a stricter standard for annotations. Here, only images where the entire PFB is present would be annotated, allowing for the generalization of the entirety of the PFB features over partials. Images that did not meet this requirement were removed from the dataset entirely. Once annotations, training, and stage additions were completed on this revised model, it was tested in real-time and deemed an improvement from the last. This model performance is further illustrated in
Figure 12b.
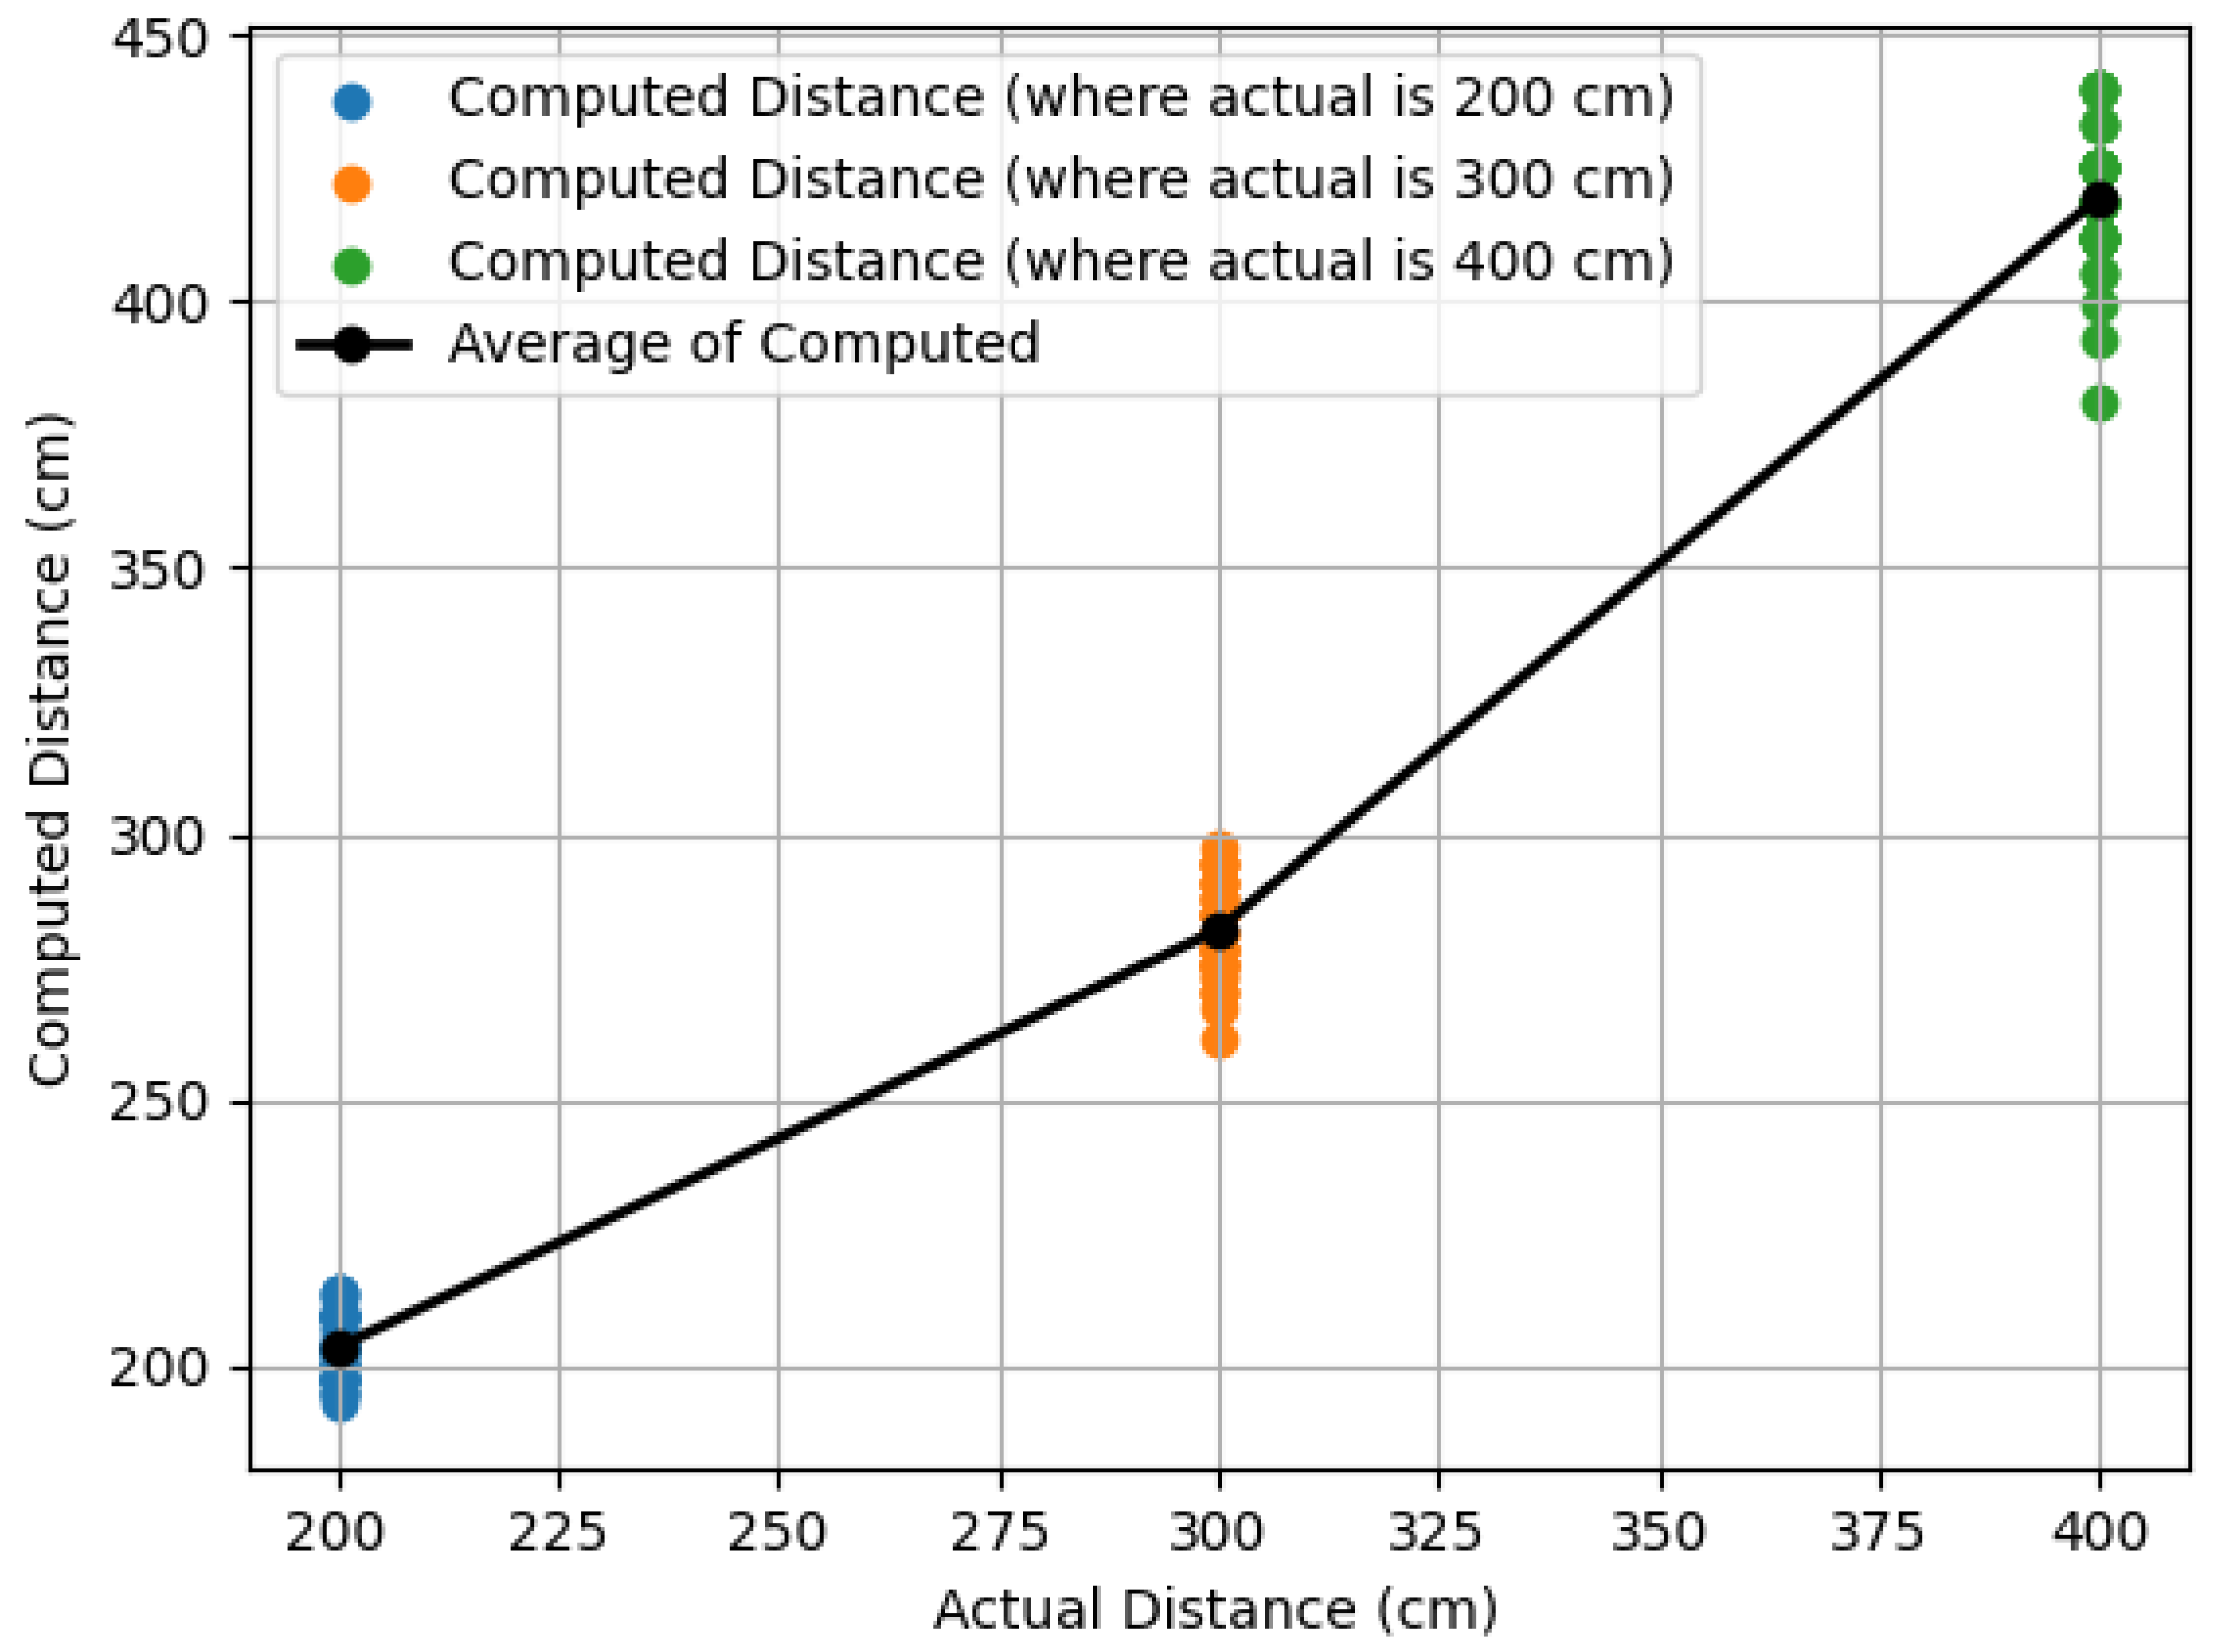
Verifying model performance for distance calculations, testing was conducted with the newly fitted model and various known PFB distances. The drone then hovered at the defined traversal altitude to avoid collision with the fans (≈140 cm), where a fan would be set at 200 cm, 300 cm, and 400 cm away from the drone. The bounding box widths were saved into a designated CSV file for 48 frames, allowing averaging in real-time detection data. In the implemented experiments, the fan was placed at exact distances from the drone camera. However, the Tello EDU drones have a moment of instability after takeoff, causing the drone to drift away from the takeoff location. The discrepancy between the calculated and actual distance in the experiments is noteworthy, as the distance may vary from pre-takeoff to post-takeoff. To mitigate this issue, a helipad was strategically positioned to align with the specified distances from the fan. After takeoff, The auxiliary camera was employed to center the drone precisely over the helipad. Following this alignment step, distance calculations commenced with the drone hovering at the specified distance from the fan. This meticulous and thorough approach ensures a consistent and accurate starting point for distance calculation testing.
Using the measured
value of 39 cm, the graphical representation of
Figure 13 compares the calculated and actual distance values. Notably, the comparison plot reveals a linear relationship, with the average computed distances closely aligning with the actual distances and an average error of less than 6% for all three scenarios. This observation suggests adequate real-time accuracy and consistency in the calculated distance measurements relative to the actual distances. Accurate estimations are vital to determine how much the drone needs to move forward and how much to shift the drone laterally to position the fan to the center of the drone’s camera frame for PFB inspection.
5.1.2. Traveling Salesman-Based Exploration
As implemented in the authors’ previous work, the inspection uses a traveling salesman approach where the drone visits all targeted locations and returns to its starting point in an efficient, planned path [
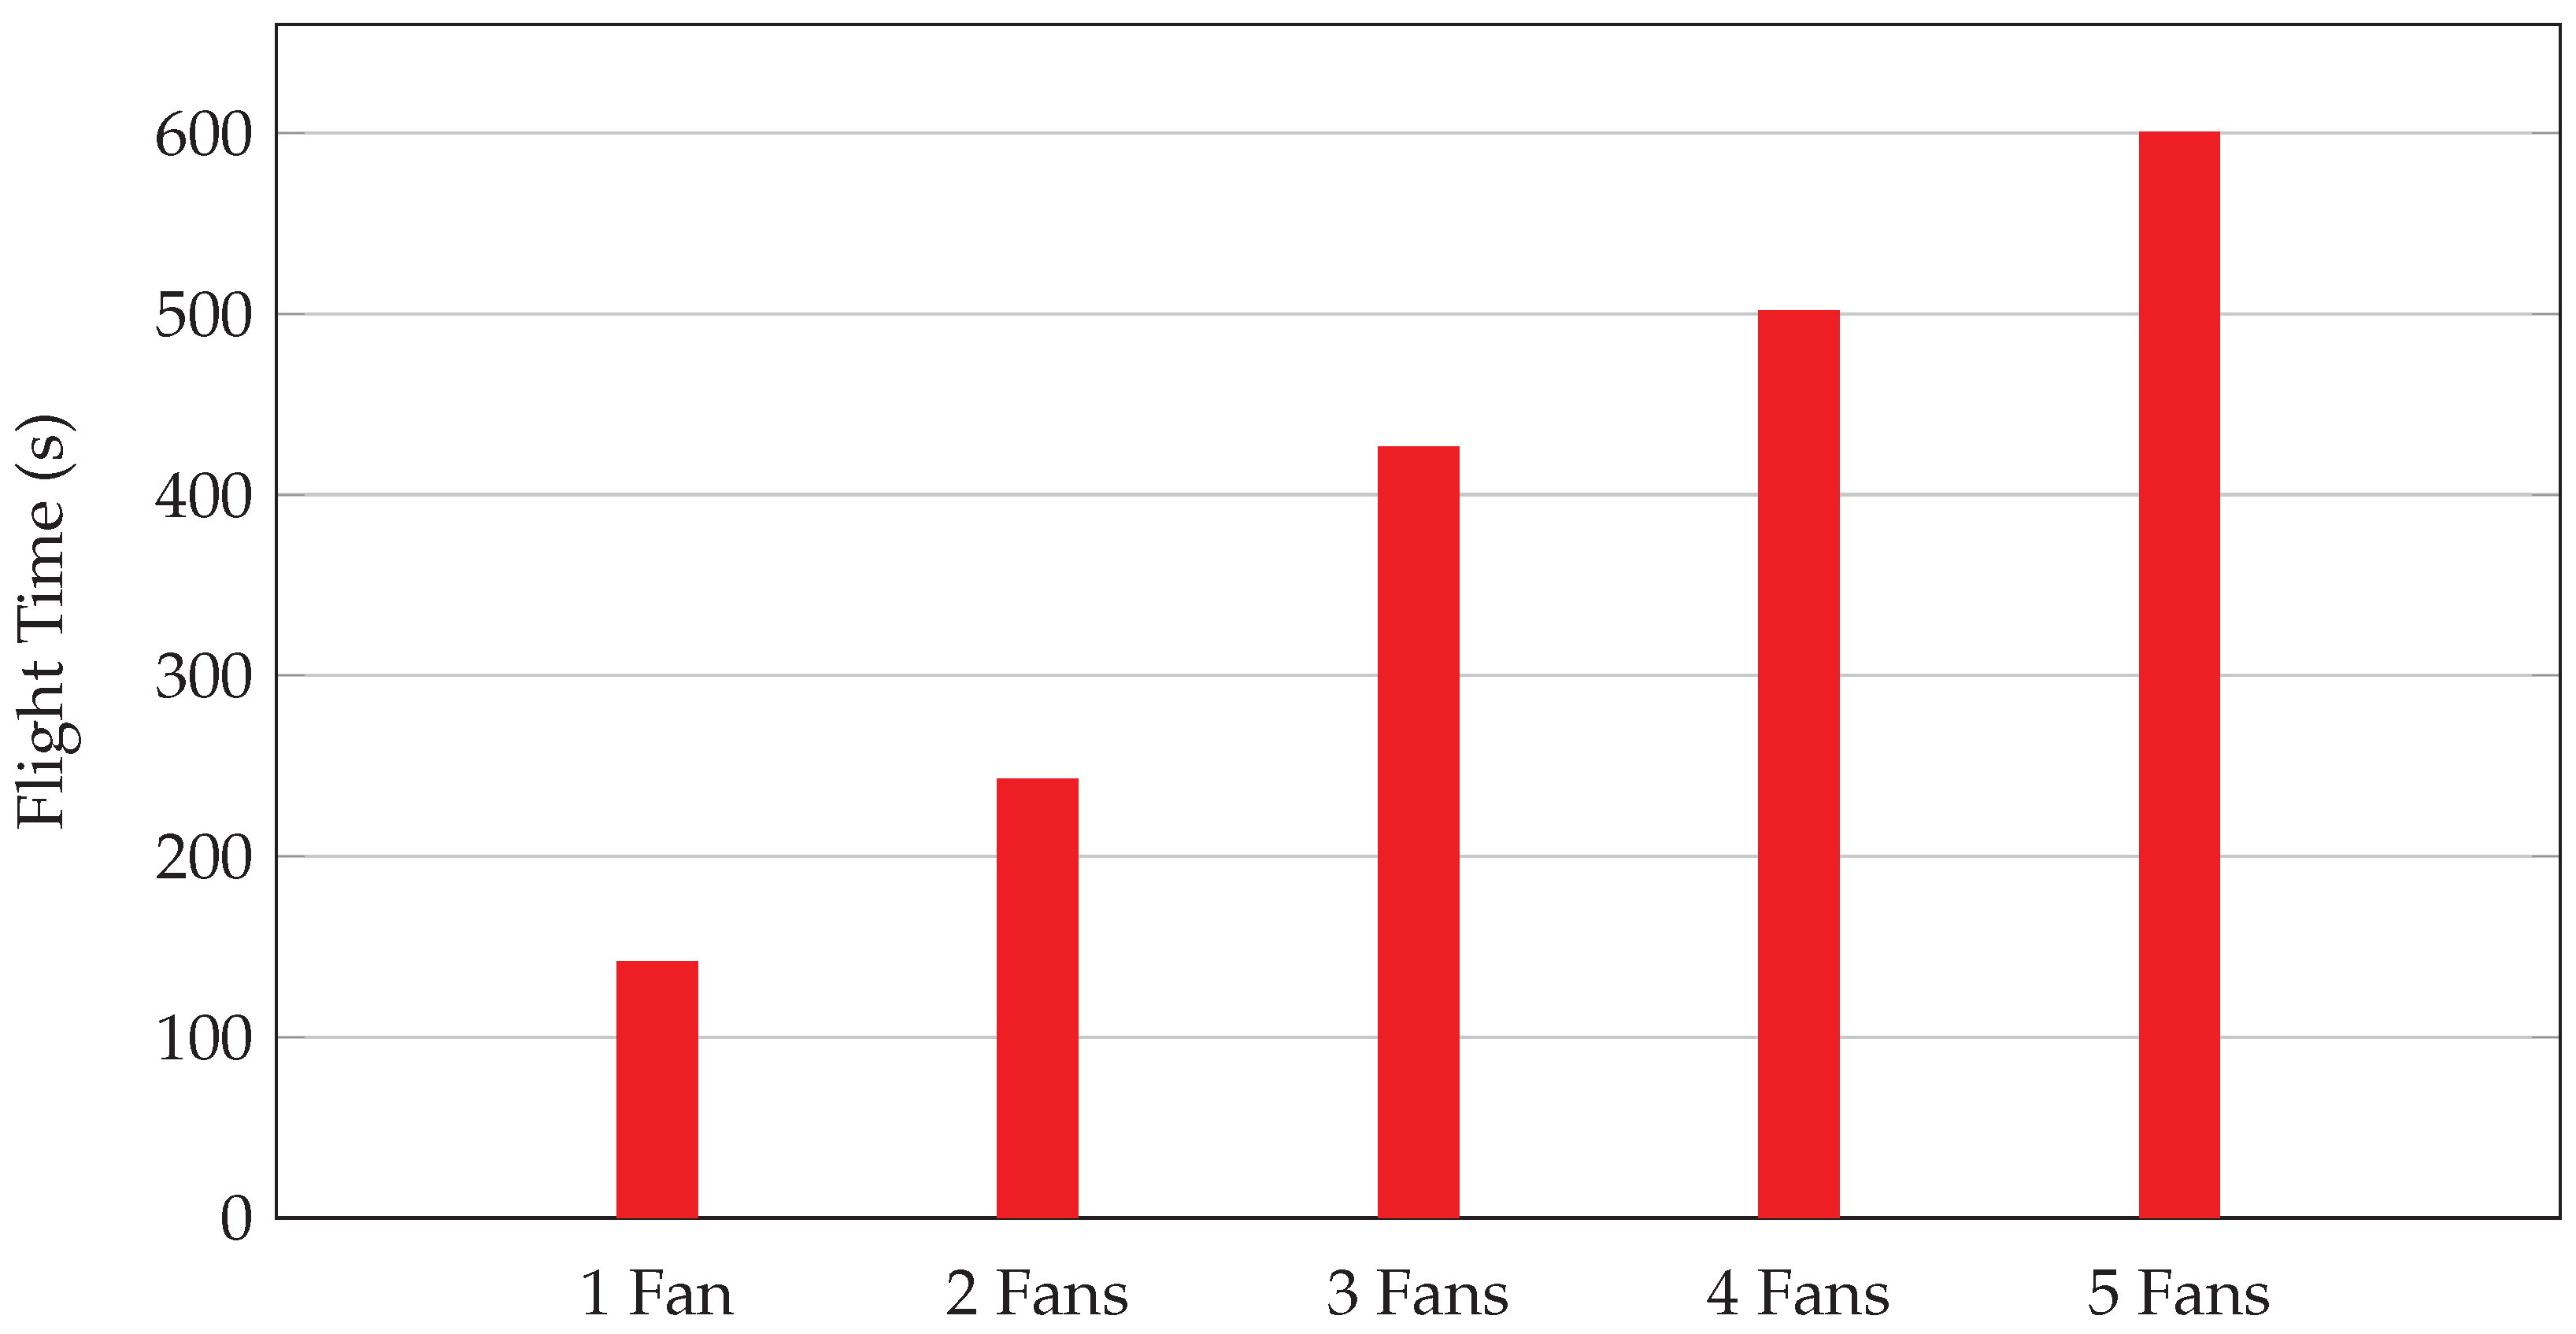
1]. The optimized route is calculated through simulated annealing, whose path is given for the drone to follow. Due to constraints of the drone’s maximum flight time, a maximum number of five fans would be visited in a single mission for final experimental results. Although there have been successfully planned flights with six or all seven fans, emergency low-voltage landing caused by insufficient battery levels would occur on many of those flights, leading to inconsistencies. For the optimized path, the drone will travel to the vicinity of an expected targeted fan location, search and detect it via Haar-cascade detection, approach to scan its QR code for target verification and calibration, rise to match the elevation of the PFBs, take images of the front of the PFBs, and fly around the fan to take pictures of the back of the PFBs.
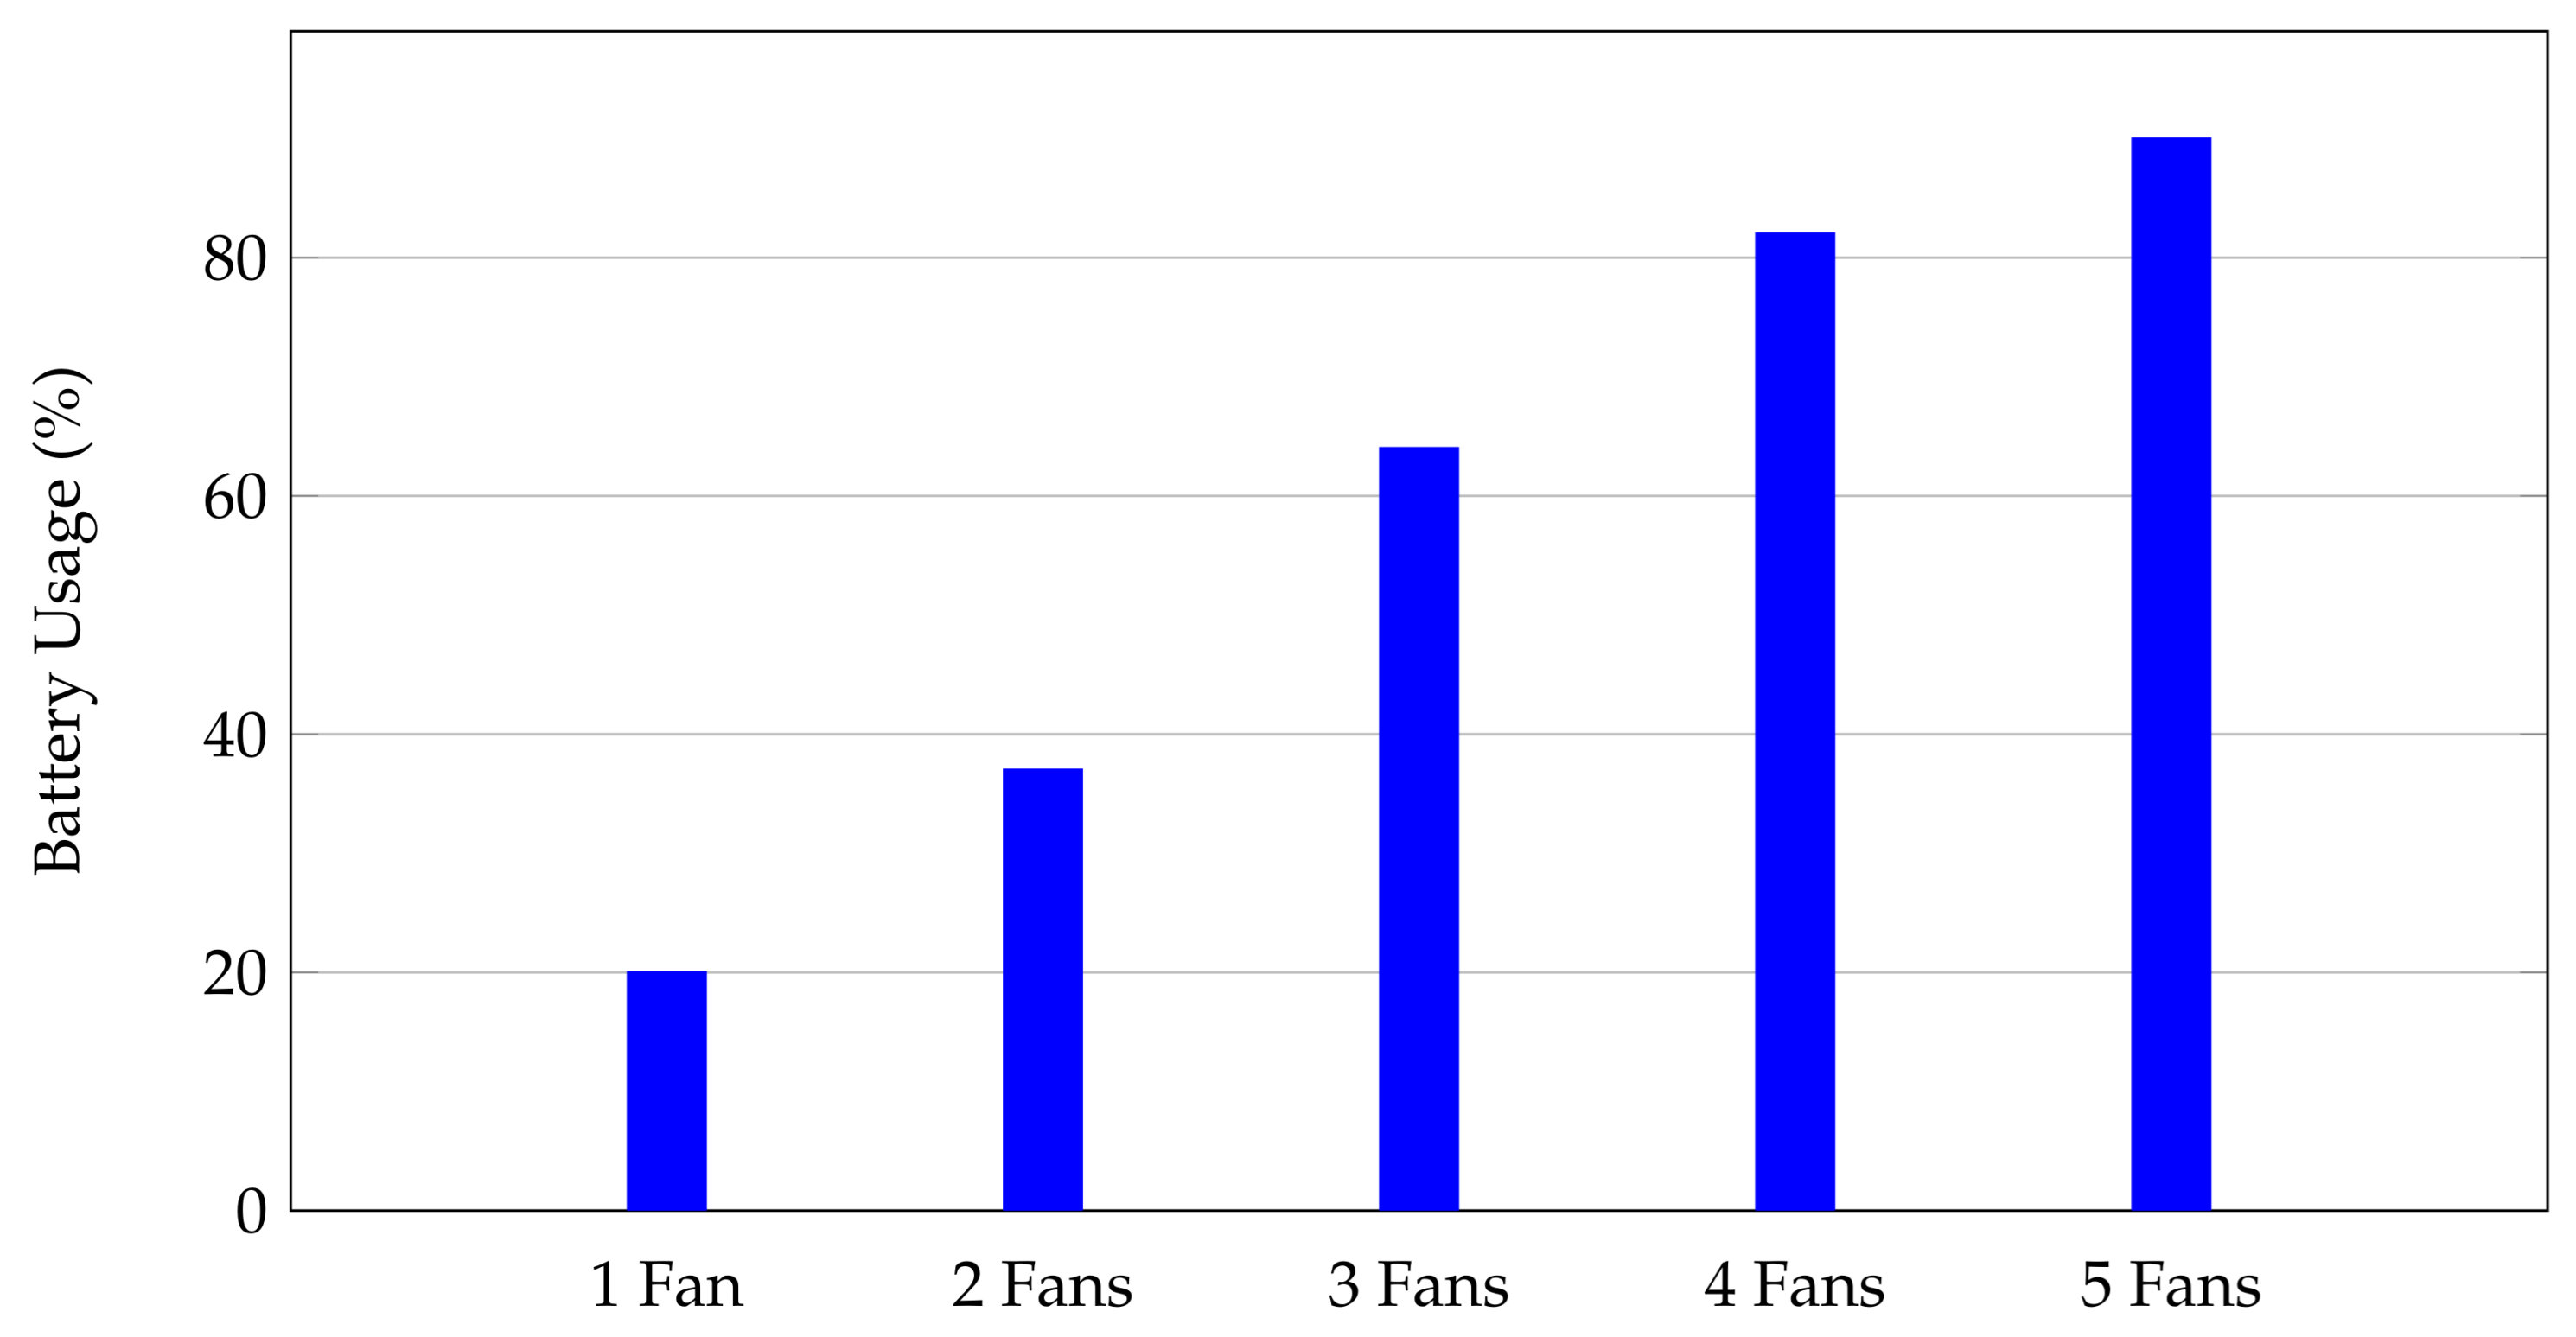
The experiments conducted aimed to assess the performance of drones with varying numbers of turbines, including a damaged turbine (ID 4). Key findings are summarized: With a single turbine (ID 4), the average battery usage per mission around the turbine ranged between 4 and 5%. For two turbines, the highest battery usage was 58%, with an average mission time of 37 s. When three turbines were included, battery usage increased up to 64%. Experiments with four turbines showed a significant battery usage up to 82%. The highest battery usage was recorded with five turbines, reaching 90%.
Figure 14 illustrates the battery usage across different experiments. As the number of turbines increases, the battery usage also increases, demonstrating the higher energy demand when multiple turbines are involved in the mission.
Figure 15 shows the correlated flight times across these different experiments. It is evident that, as the number of fans increases, the flight time also increases, reflecting the longer duration required to complete missions involving more fans.
5.1.3. Collecting Targeted PFB Images
Finally, following each of the necessary experiments to determine the PFB detection model fit, distance calculation accuracy, and battery life optimization, aerial imagery of the PFBs was collected for dataset creation. Images of the PFBs were saved into 1 of 7 directories that corresponded with the fan the images were taken of. For example, if an image was taken from the fan identified as
fan_4, the image would be saved into the folder named
fan_4. The folders were located in a One-Drive cloud to allow seamless collaboration with the DL models used for crack and anomaly detection. The QR codes scanned by the drone verify in real-time which fan is being visited and decide which folder to save the images. In these experiments,
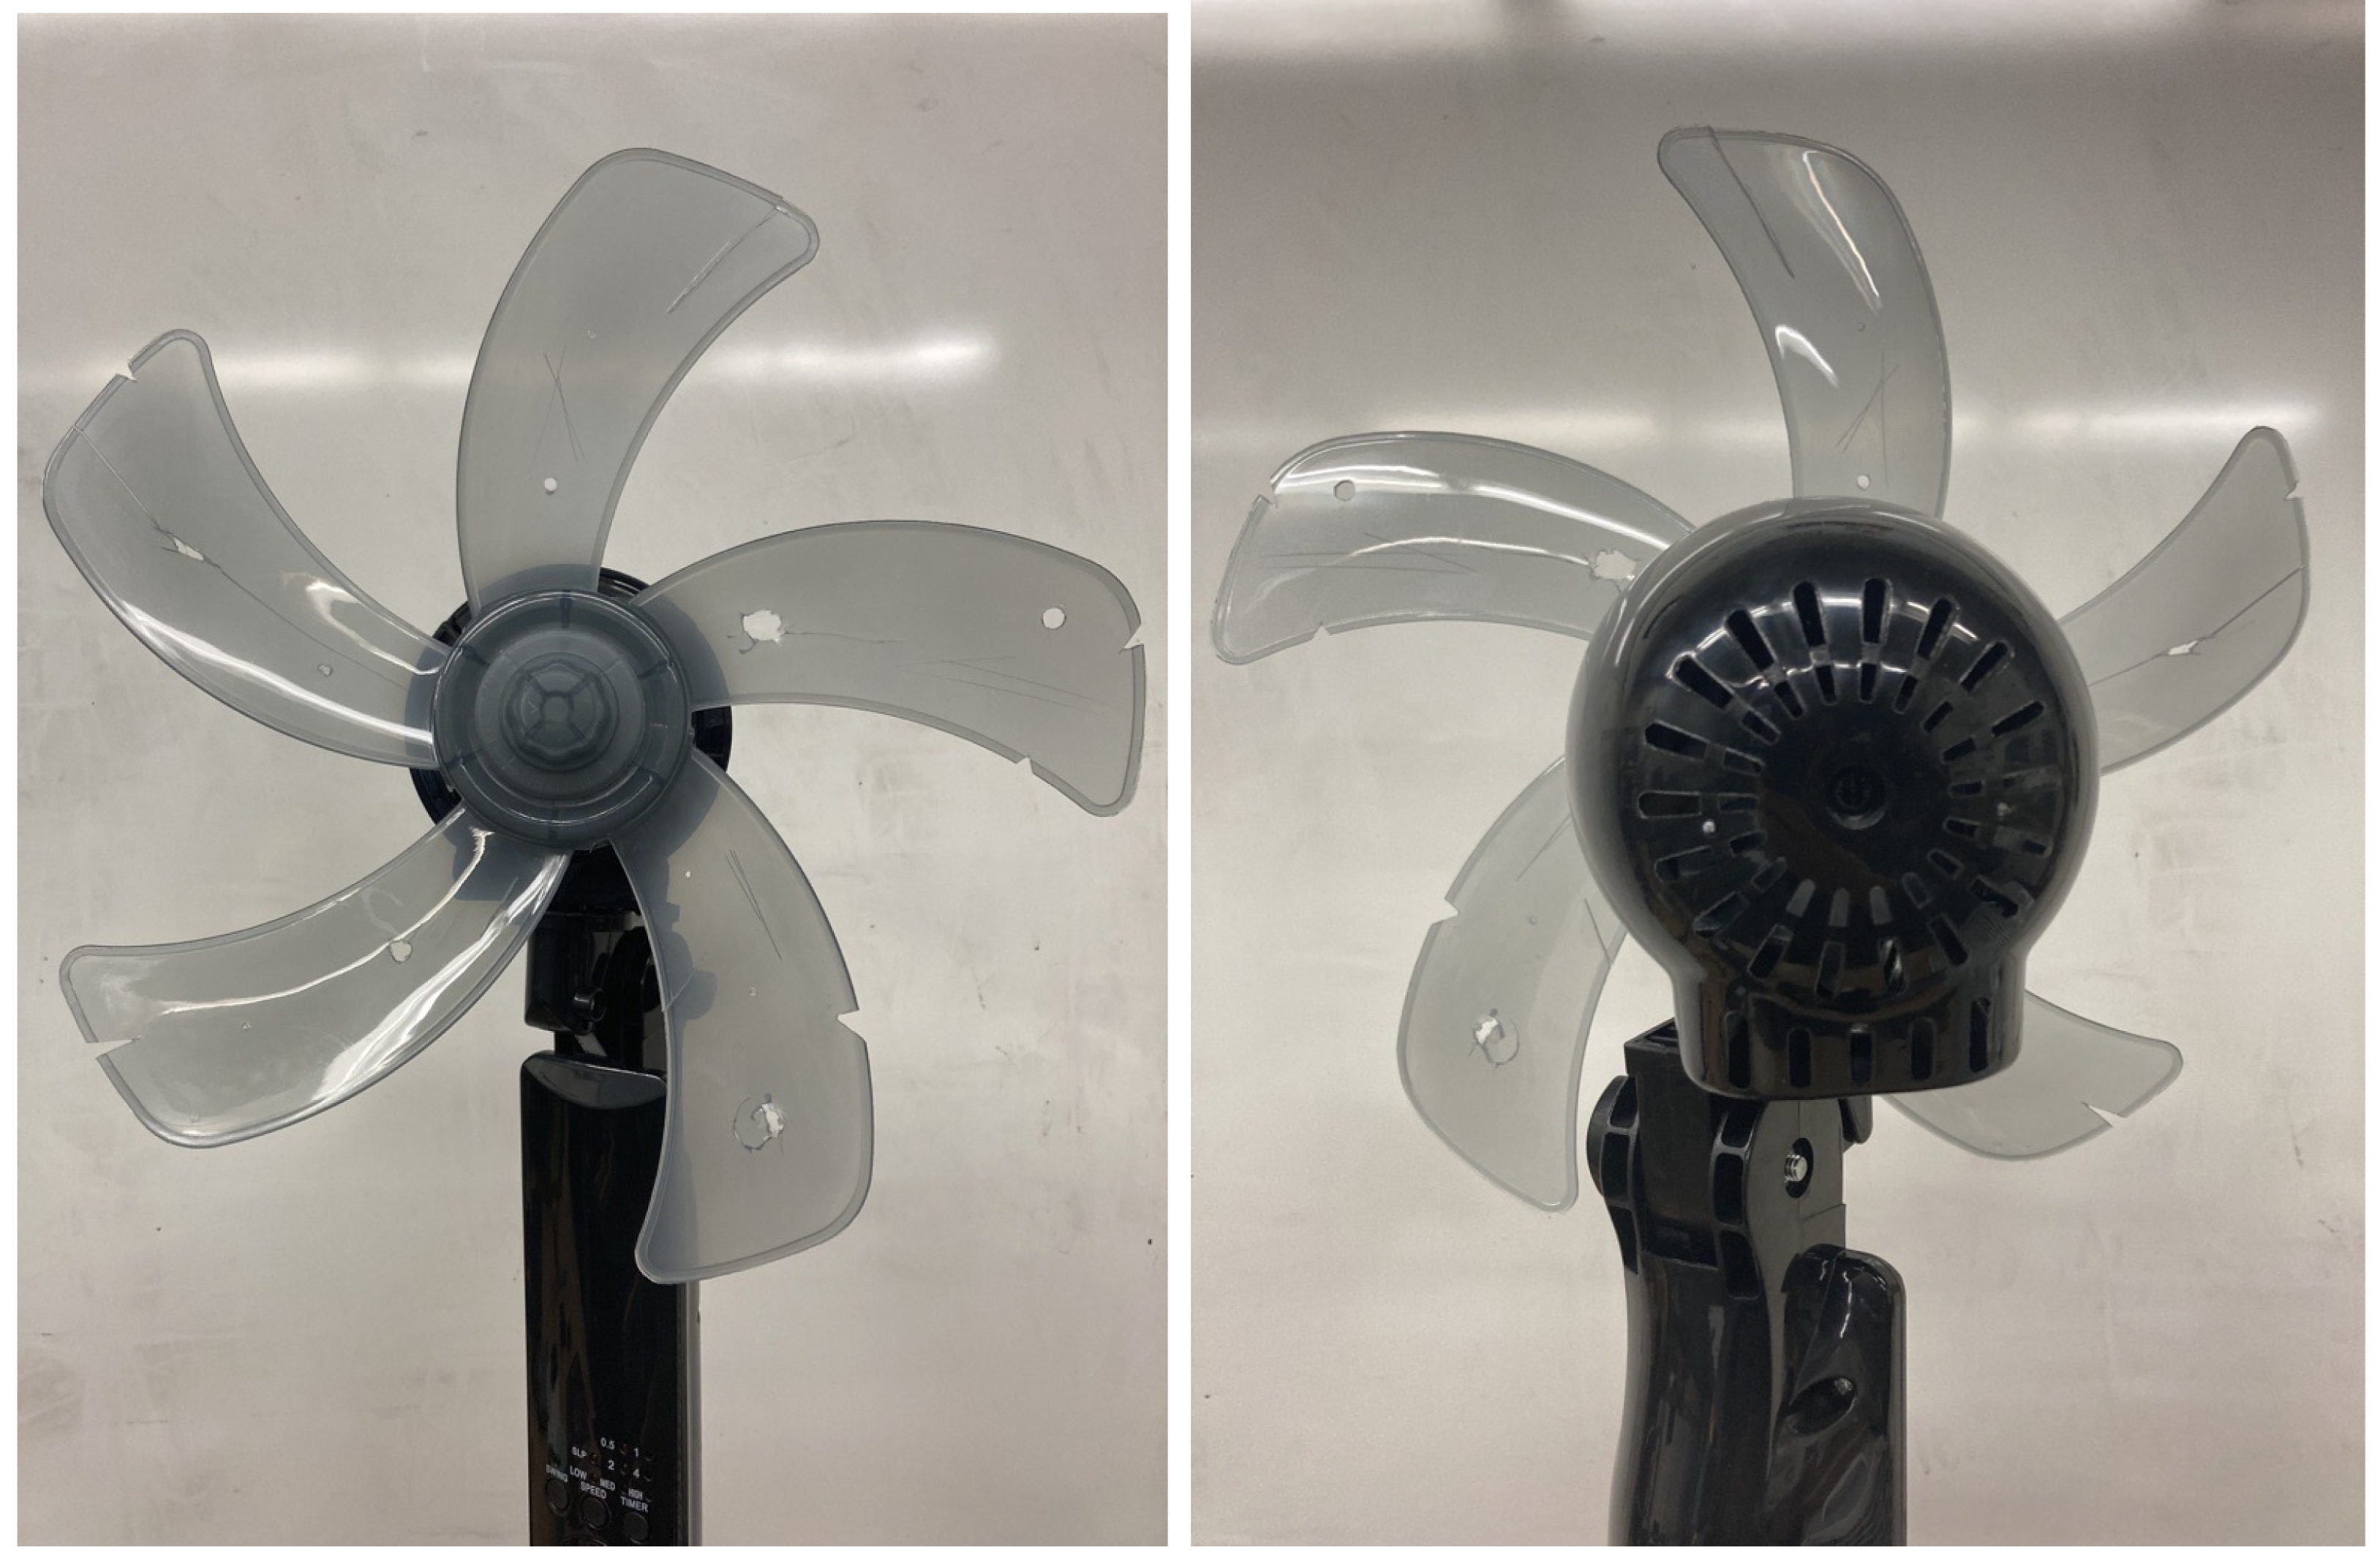
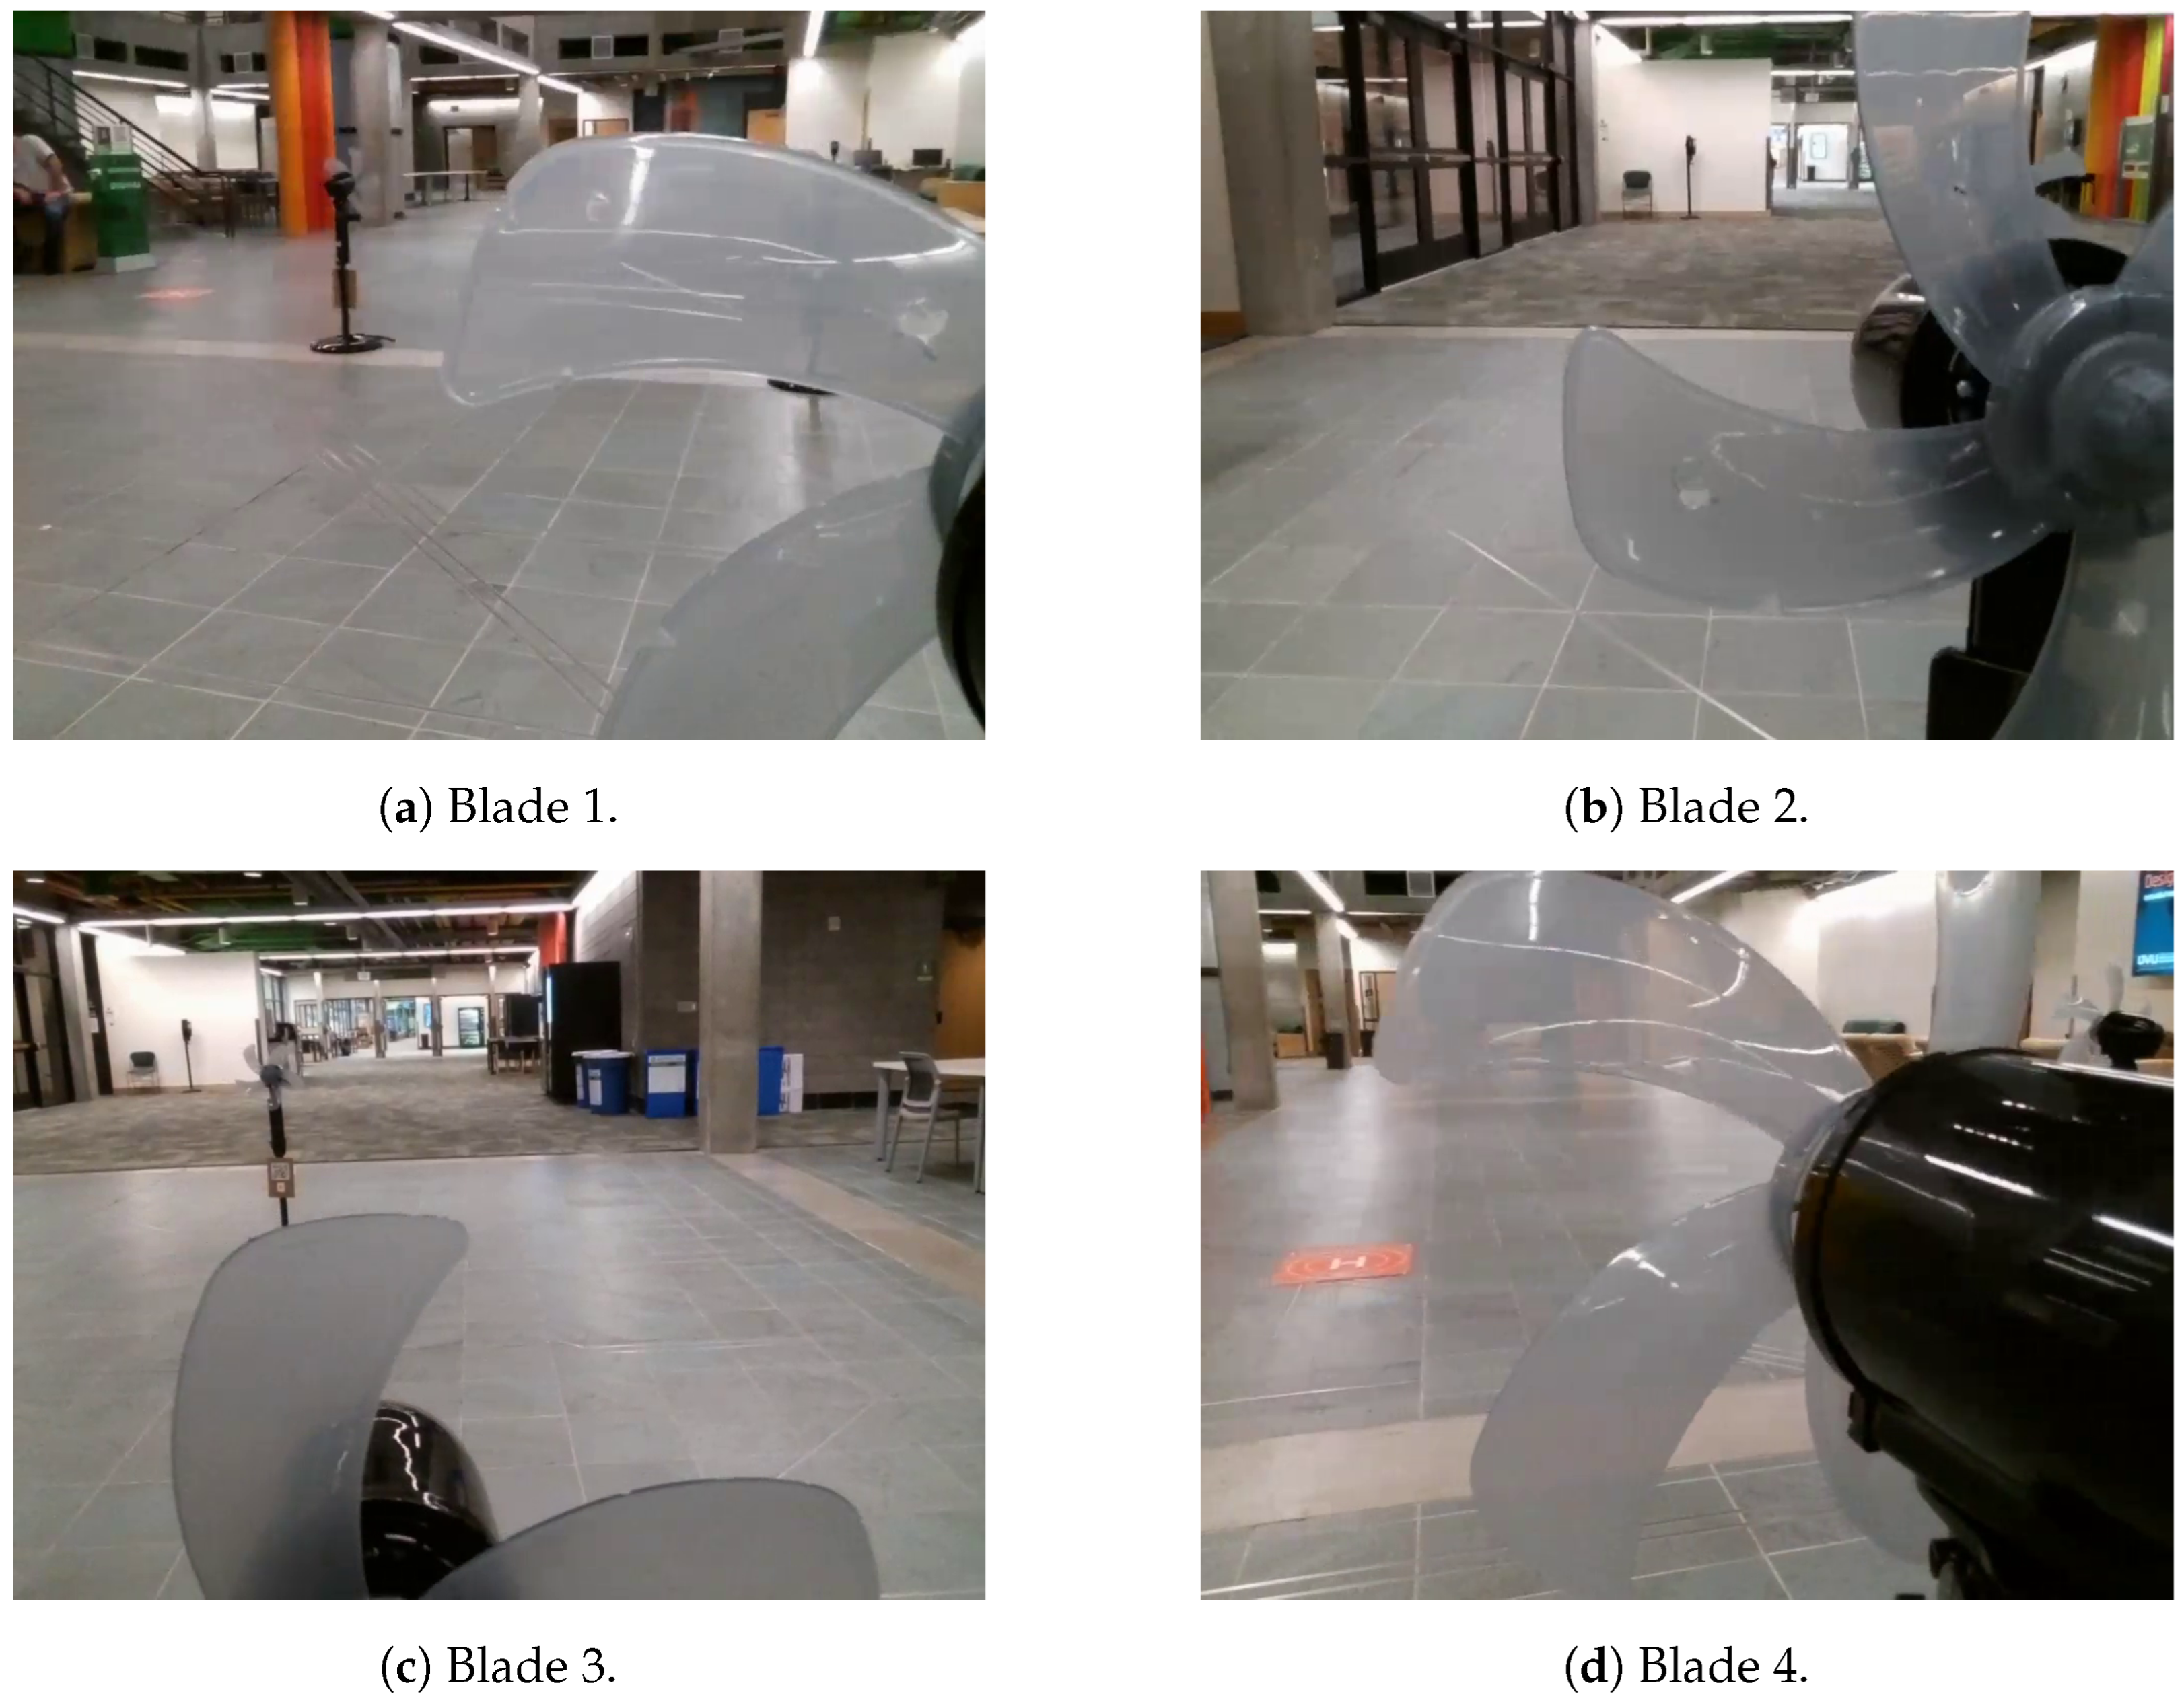
fan_4 illustrated in
Figure 16 is the only fan with faulty PFBs, while all the PFBs of the six other fans are healthy.
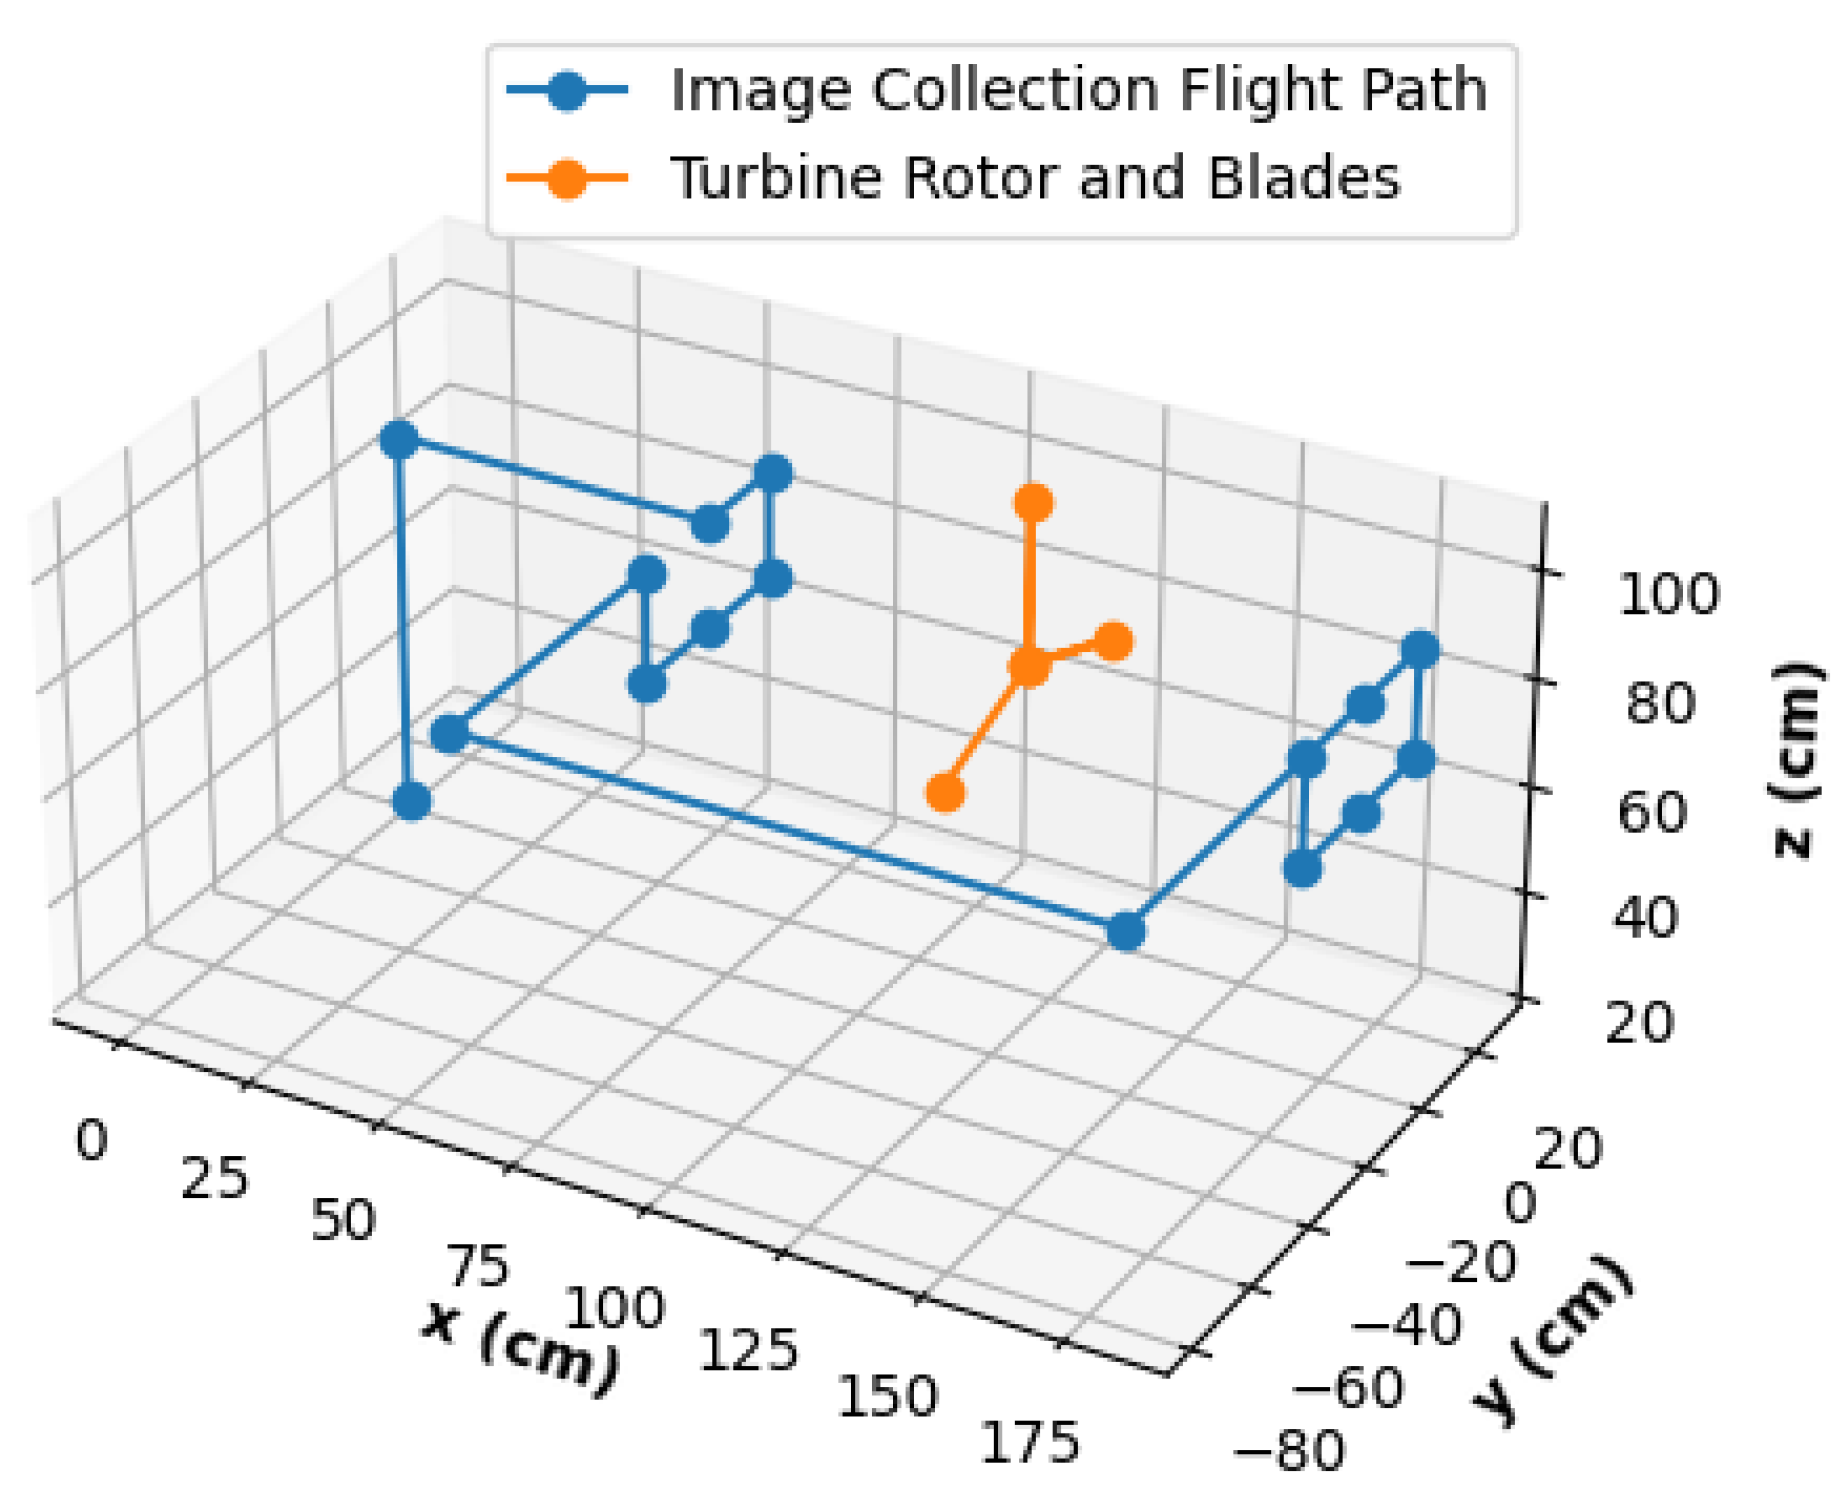
Figure 17 shows the flight path for image collection. Once the QR code is scanned, the drone can be assumed to be about 100 cm in front of the fan; thus, the first steps are to elevate the drone and move it towards the fan to prepare the rectangular pattern for image collection. Once the images are taken at the six designated locations of the front, the drone moves to the right, forward past the fan, left to align with the fan rotor, and turns around to face the back of the fan. Images are taken in the same rectangular pattern of the fan rear to finish the mission around the fan. The conservatively large U-bracket shape around the fan allows for a safe margin of error during the flight.
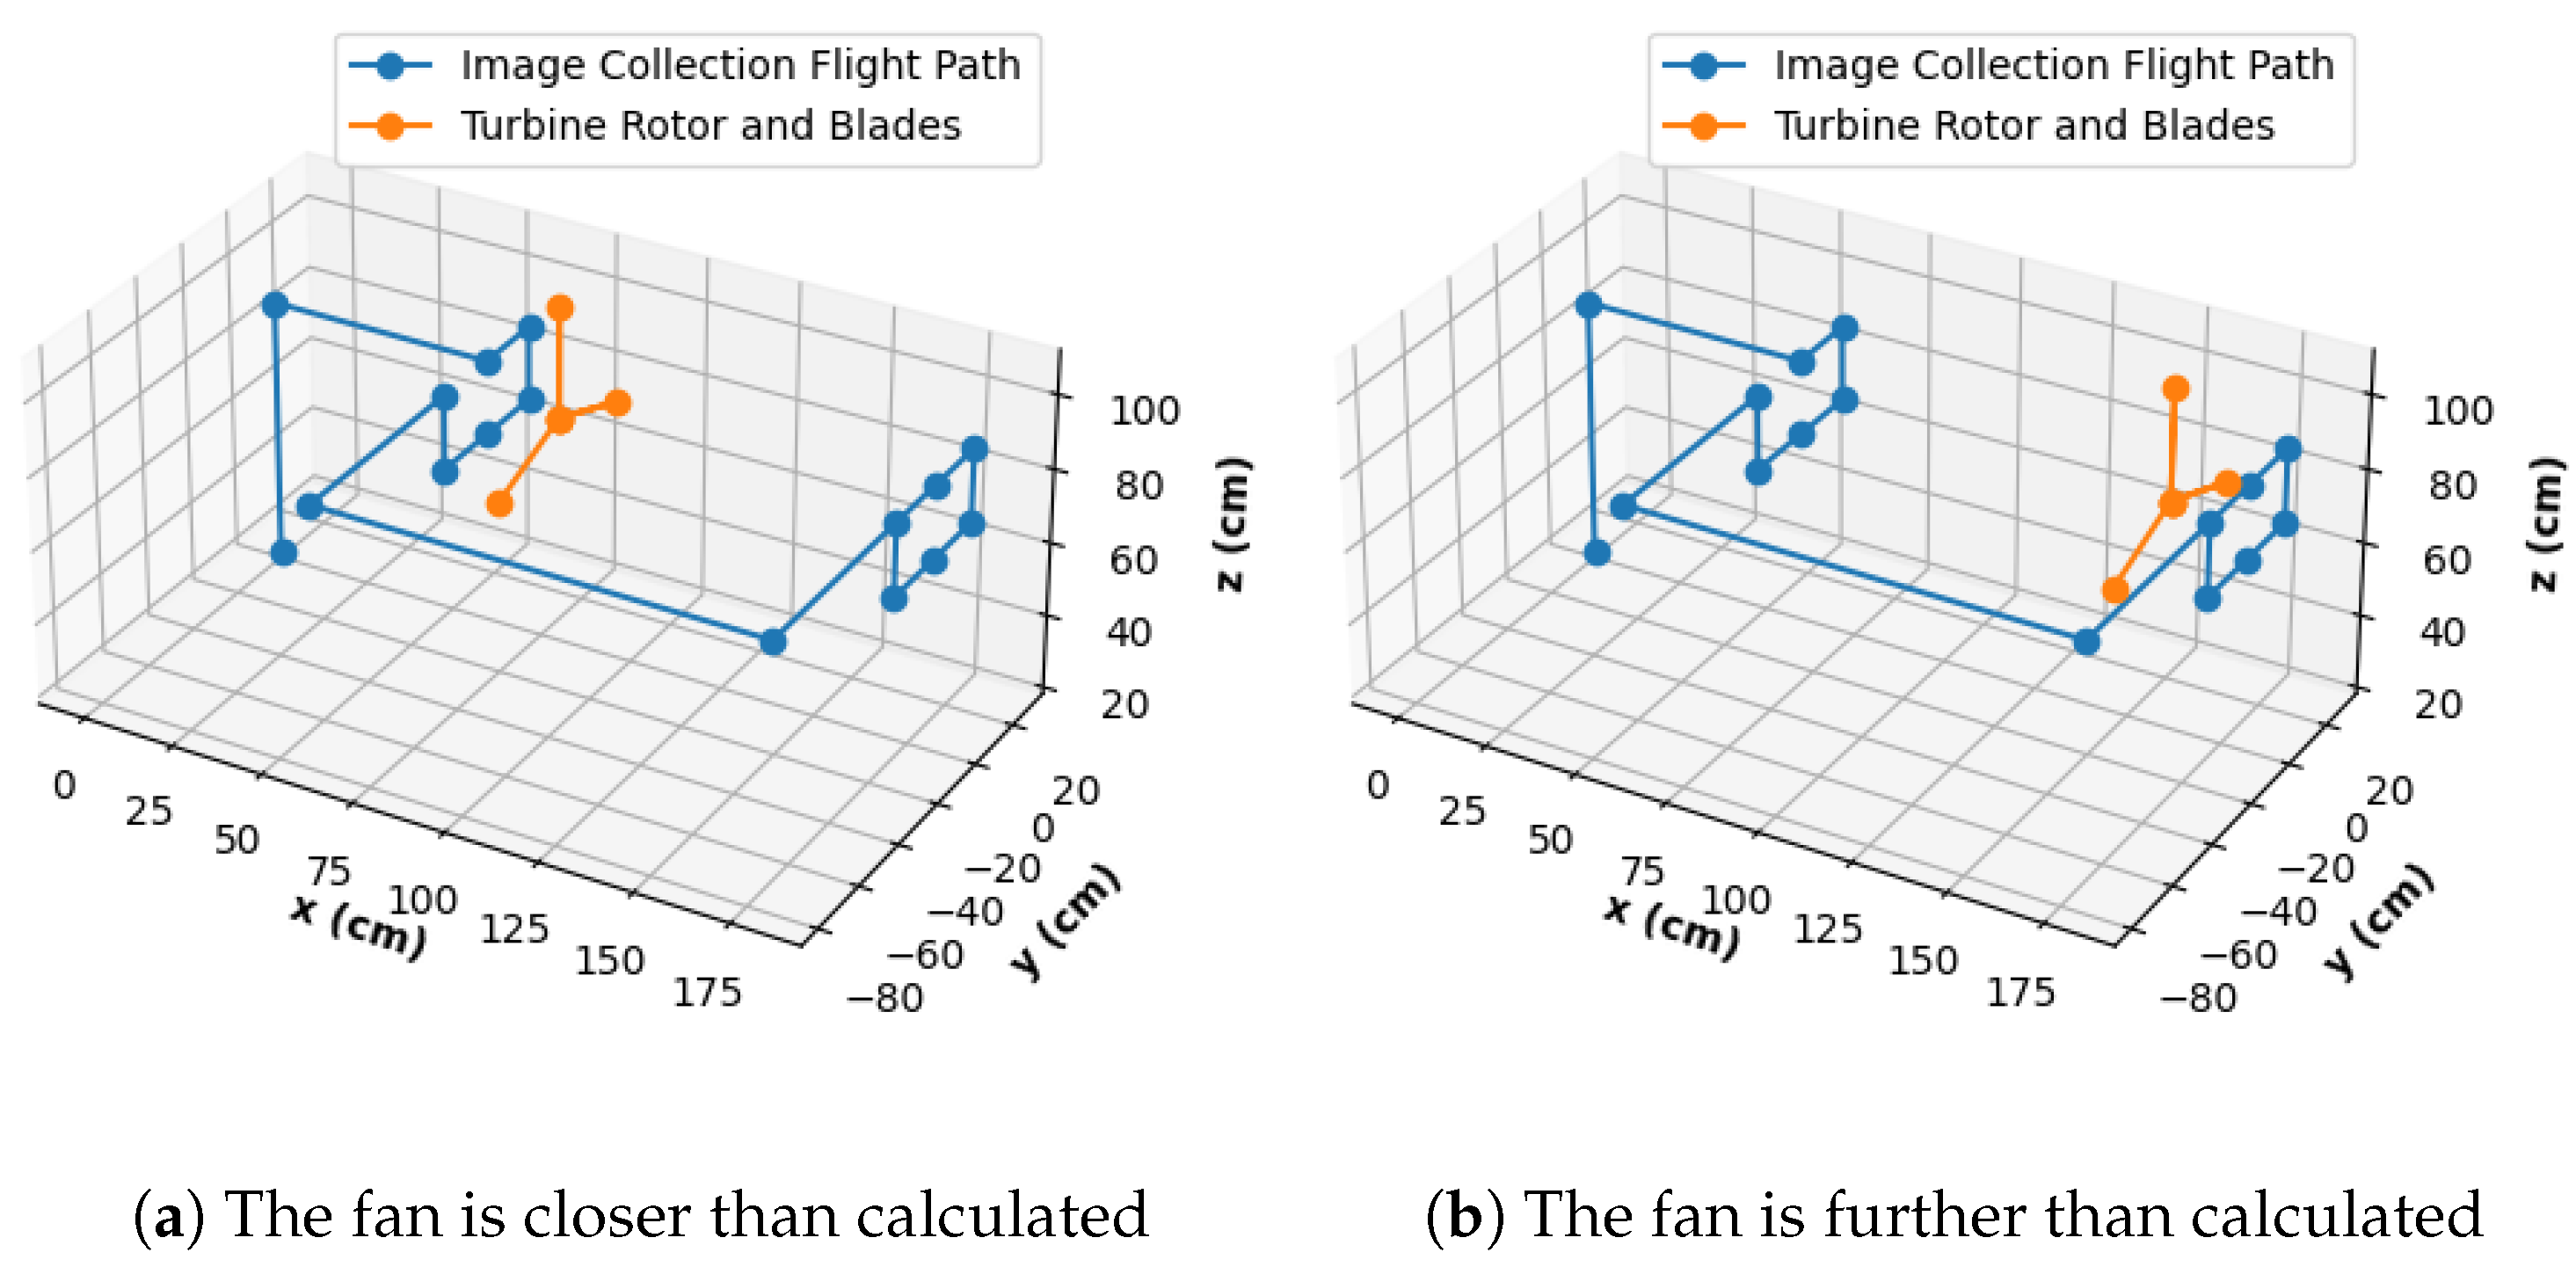
Figure 17 shows the planned path in a perfect scenario where the fan is equidistant from the inspection points. However, this case is not always present in the experiments. With a smaller U-bracket-shaped flight and the position of the fan being farther than expected, the drone could collide once it is time to go behind the fan. Alternatively, in the reverse case, a resulting collision is probable when it is time for the drone to approach the fan front. With collisions observed in preliminary experiments, the image collection path was conservatively defined so that the worst case scenarios would look like those shown in
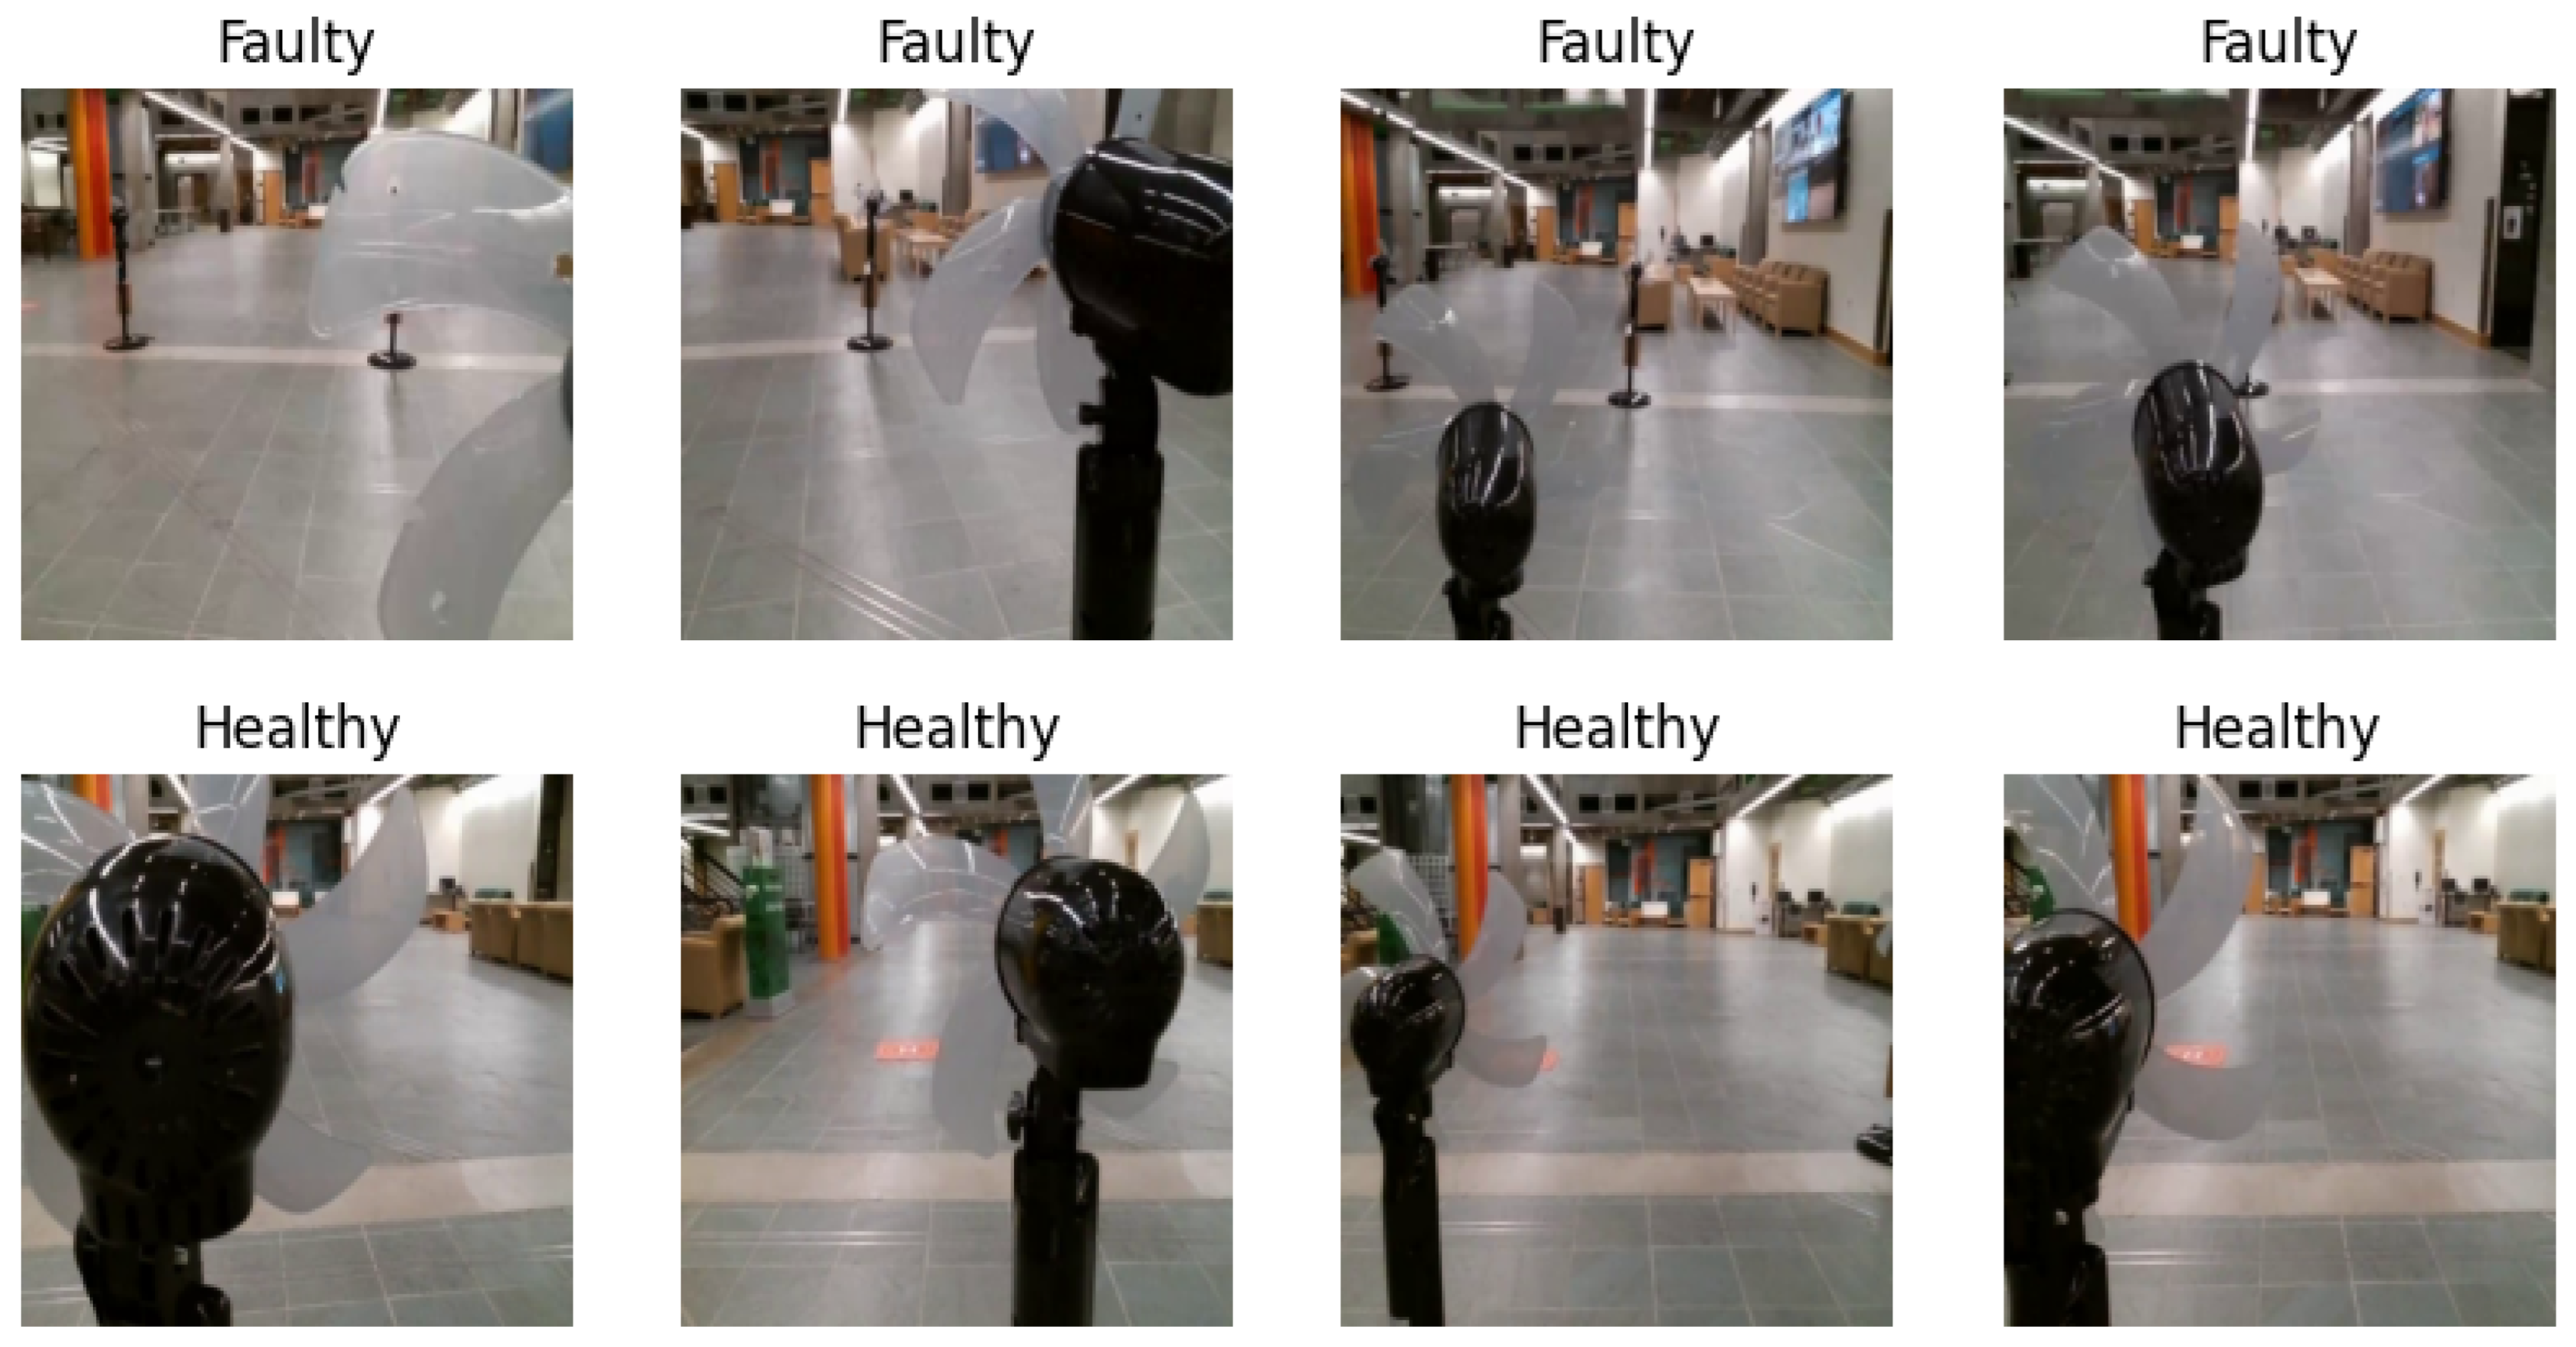
Figure 18. This safety measure results in the drone being capable of only one sided close-up images, but not both, without risking collision. A sample of the resulting collected images via the autonomous drone can be observed in
Figure 19.
5.2. Fault Detection and Classification
In this section, we explore the comprehensive analysis, which includes a series of methodically designed experiments aimed at evaluating the effectiveness, efficiency, and adaptability of each model in identifying structural anomalies within the PFBs. Through a detailed examination of the performance metrics, computational requirements, and real-world applicability, this section aims to offer valuable insights into the capabilities of advanced neural networks in enhancing predictive maintenance strategies for wind energy infrastructure.
5.2.1. Dataset and Data Augmentation Strategy
The created dataset consists of 2100 images taken from all seven fans, with one fan having visible damages allowing for binary classification of healthy vs. faulty. These images are a result of the path-planning experiment outlined in
Section 5.1.3, where the front and back of the PFBs were examined autonomously. Of the 2100 total images, 70% were used for training, 10% for validation, and 20% for testing, illustrated in
Table 2. Additionally, the raw images were downsized to
pixels to allow them to be easily fed to the models for training.
Figure 20 provides a visualization sample of the dataset with each of their perspective class labels.
Our data-augmentation strategy comprised several transformations, each designed to introduce specific variabilities into the training dataset, thereby encouraging the model to learn invariant and discriminative features for accurate defect detection. This included RandomHorizontalFlip, which mirrors images horizontally with a 50% probability, aiming to increase the model’s invariance to the orientation of the defect objects; RandomRotation, where images are rotated by a random angle within degrees to simulate variations in object orientation relative to the camera, a common occurrence in practical scenarios; RandomAffine, applying translation, scaling, and shearing to the images (specifically, it translates images up to 10%, scales by a factor between 0.9 and 1.1, and shears by up to 10 degrees, crucial for simulating real-world positional, size, and perspective variations); and RandomApply with GaussianBlur, where a Gaussian blur is applied to a subset of the images (with a probability of 50%), using a kernel size of 3 and a range between 0.1 and 2.0. This was designed to mimic the effect of out-of-focus captures and varying image quality, thereby directing the model’s attention towards more significant shape and texture patterns rather than overfitting to fine, potentially inconsistent details.
5.2.2. Optimization of Model Parameters and Hyperparameter Tuning
In the pursuit of enhancing the efficiency and accuracy of our models, we adopted a strategic two-phase methodology for the optimization of the model hyperparameters. The initial phase utilized a random search technique to broadly investigate a vast array of hyperparameter values, setting the stage for a more focused fine-tuning phase. Furthermore, we engaged in Bayesian optimization, a more targeted approach, to refine our selection to the most advantageous parameters. This combination leveraged the wide-reaching capability of random search with the targeted precision of Bayesian optimization. Central to our optimization efforts was the application of Bayesian optimization to identify the ideal decision threshold for our ensemble model. This process incorporated a probabilistic model that was progressively refined with each evaluation of hyperparameter performance, guiding us efficiently through the parameter space to identify an optimal balance for the precision–recall trade-off. Through this analytical process, we determined a decision threshold of 0.7, within an investigatory range of 0.5 to 0.8, thereby optimizing our model’s predictive performance by achieving a superior balance between sensitivity and specificity.
For the adjustment of other hyperparameters, we set the learning rate within a spectrum from to , to calibrate the convergence speed against the stability of the learning process. Batch sizes ranged from 16 to 128, tailored to maximize computational efficiency while ensuring precise gradient estimation. We opted for the Adaptive Moment Estimation (Adam) as our optimizer for its adeptness in dynamically adjusting the learning rates. To mitigate the risk of overfitting, we established a weight decay range from to , promoting a balance between model adaptability and regularization. Furthermore, we implemented an early stopping mechanism to halt training upon detecting no improvement in validation loss over a specified number of epochs, thereby preventing overtraining. This comprehensive and methodical approach to hyperparameter tuning underpins the superior performance of our ensemble model in identifying anomalies.
5.2.3. Adaptation and Application of Deep Learning Model Architectures
This study incorporates a refined methodology rooted in our previous work [
65]. In that foundational research, we evaluated the application of diverse deep learning architectures for effectively distinguishing between
healthy and
faulty WTBSs using thermal imagery. Leveraging the insights gained, we selectively adapted those architectures that previously demonstrated exceptional performance for this particular task.
Our approach focused on a curated assortment of deep learning models, each fine-tuned for the binary classification of WTBs as either healthy or faulty. The architectural spectrum ranged from early convolutional networks like AlexNet and the VGG series to more advanced frameworks such as ResNet and DenseNet, extending to the latest innovations with the Vision Transformer (ViT). This selection was guided by the successful outcomes and efficacy of these models in our earlier investigations, facilitating a robust examination of various image classification strategies tailored to the unique requirements of WTB condition assessment.
Crucial to our strategy was the specific customization of each model for binary classification, building on their proven capabilities. This entailed detailed adjustments to their terminal layers, categorizing them according to the nature of these layers—either as classifiers or fully connected layers. Such modifications were essential for precise tuning towards binary classification of PFB health. Employing a structured configuration approach, we utilized a
base_config dictionary as a pivotal organizational tool. This facilitated a systematic arrangement of models based on architectural characteristics and the requisite end-layer modifications, ensuring the application of our previous knowledge for the optimal adaptation of each architecture to the task at hand, as documented in our prior work [
65].
5.2.4. Implementation of Transfer Learning
In the context of our study on anomaly detection within PFBs, we strategically adopted a transfer learning paradigm, leveraging the rich, pre-existing knowledge encapsulated within models initially trained on the ImageNet dataset [
66]. The ImageNet database, renowned for its comprehensive size and variety, serves as a pivotal resource in the development and evaluation of state-of-the-art image-classification technologies. Utilizing these pre-trained models as a starting point, we effectively endowed our models with a preliminary understanding of diverse image characteristics. This pre-acquired insight proves invaluable in navigating the intricate and nuanced features present in thermal images of WTBs. The infusion of transfer learning into our methodology markedly accelerated the training process. This acceleration stems from the initial broad exposure to the ImageNet dataset, equipping the models with a fundamental grasp of a wide array of image attributes. Consequently, tailoring these models to our specialized requirement of identifying anomalies in PFBs became more time-efficient than initiating model training from a blank slate. This expedited training period underscores the practical advantages of transfer learning, particularly in scenarios involving elaborate and voluminous datasets, as encountered in our investigation.
5.2.5. Results Analysis
This subsection delves into the detailed results obtained from the application of various deep learning models on our dataset, with a focus on their performance across multiple metrics.
Table 3 shows the performance metrics of the implemented models, highlighting their accuracy, precision, recall, and F1-score. The F1-score is the harmonic mean of precision and recall, providing a single metric that balances both the false positives and false negatives. It is particularly useful in situations where an uneven class distribution might render metrics like accuracy unuseful. The F1-score ranges from 0 to 1, with a higher value indicating better model performance and a more balanced trade-off between precision and recall.
Table 3 orders the models by their performance, demonstrating the comparative effectiveness of each architecture in the context of image classification of
healthy and
faulty for PFBs. Particularly notable are the performances of the ViT and DenseNet models, which stand out with high accuracy and F1-scores, exemplifying their precision and effectiveness in this task.
The F1-score is calculated as follows:
Our extensive analysis, documented through 10 random training runs, culminated in a comparative evaluation of several deep learning models, as illustrated in
Table 3. The top performance metrics—average accuracy, precision, recall, and F1-score—highlight the capabilities and effectiveness of these models in detecting anomalies in PFBs.
Remarkably, both ViT and DenseNet achieved unparalleled performance across all metrics, securing a perfect score of 100% in accuracy, precision, recall, and F1-score on our dataset. This exceptional outcome underscores the advanced capabilities of these models in flawlessly identifying both healthy and faulty PFBs, indicating a potentially groundbreaking advancement in the field of anomaly detection within PFBs.
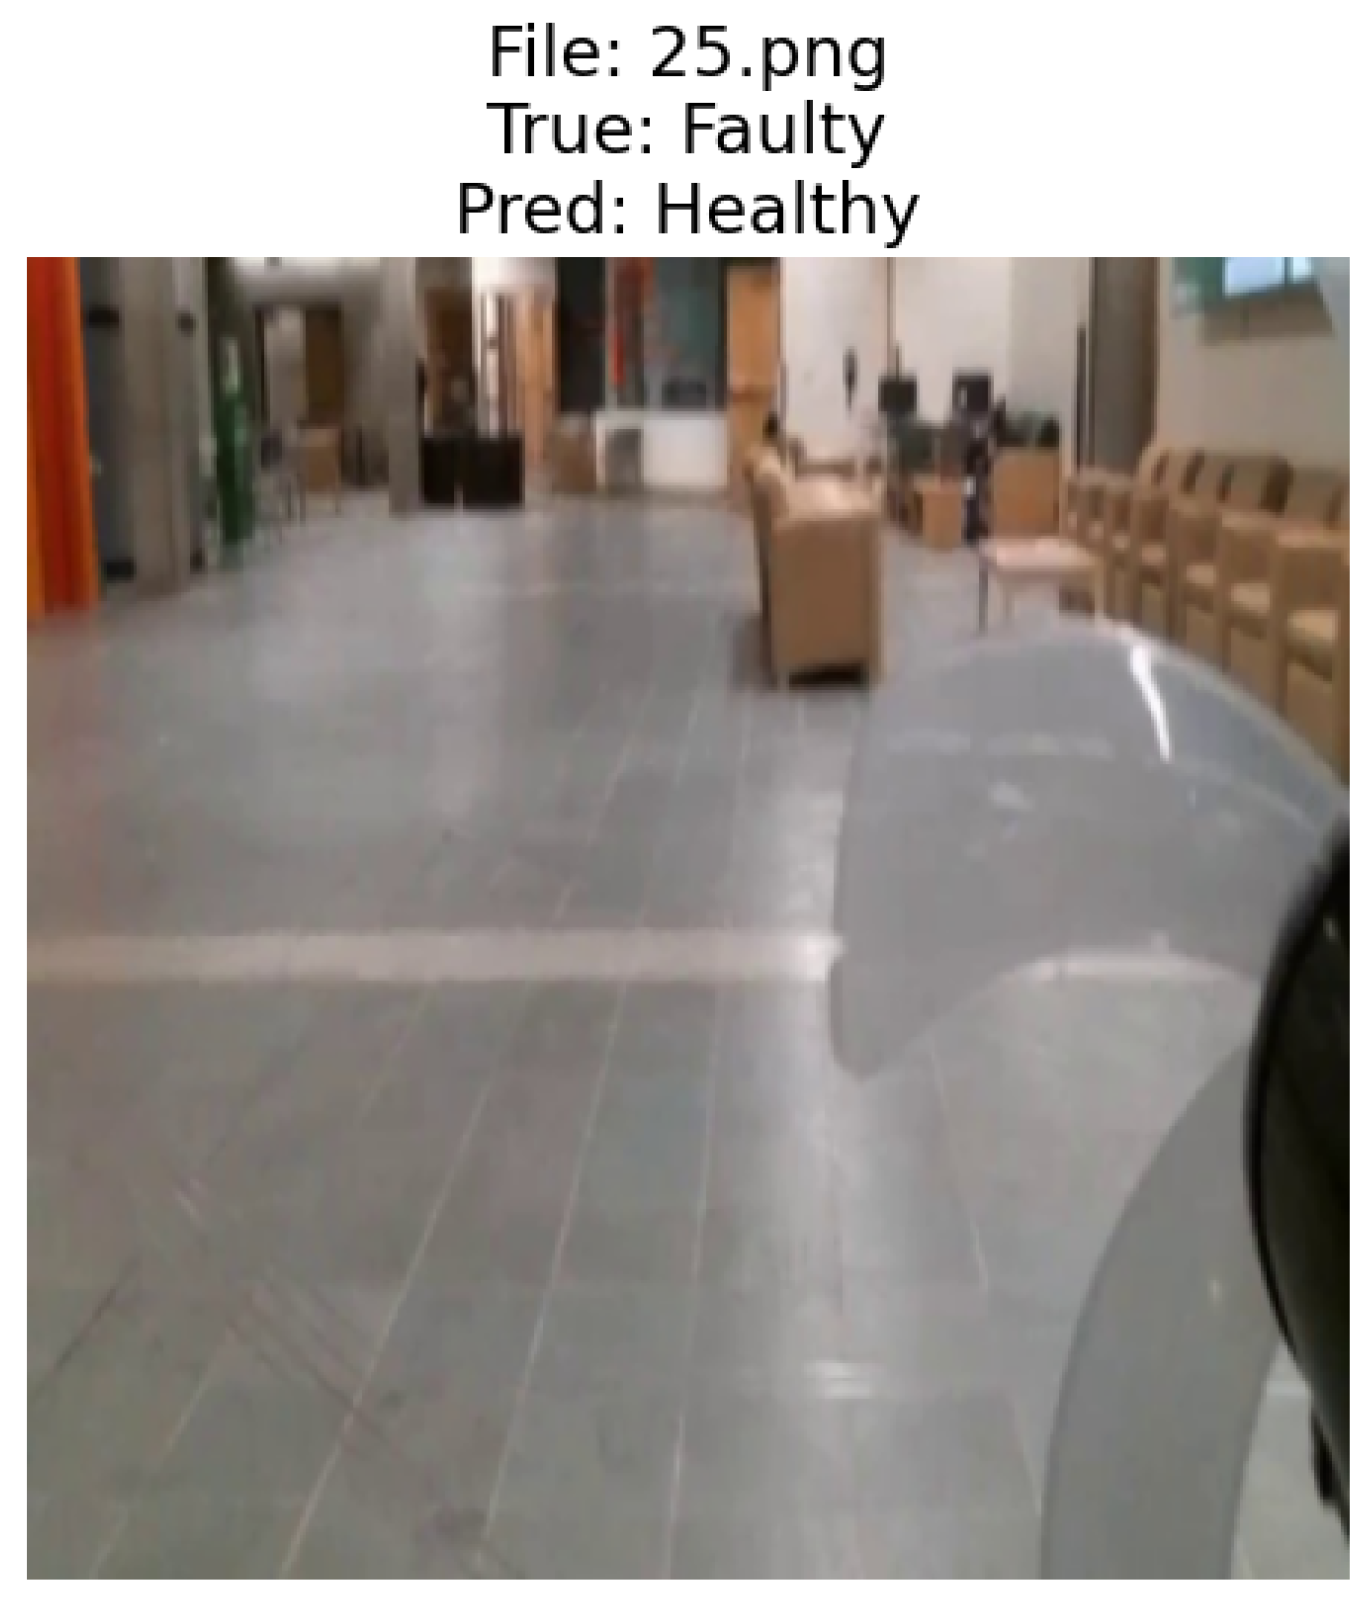
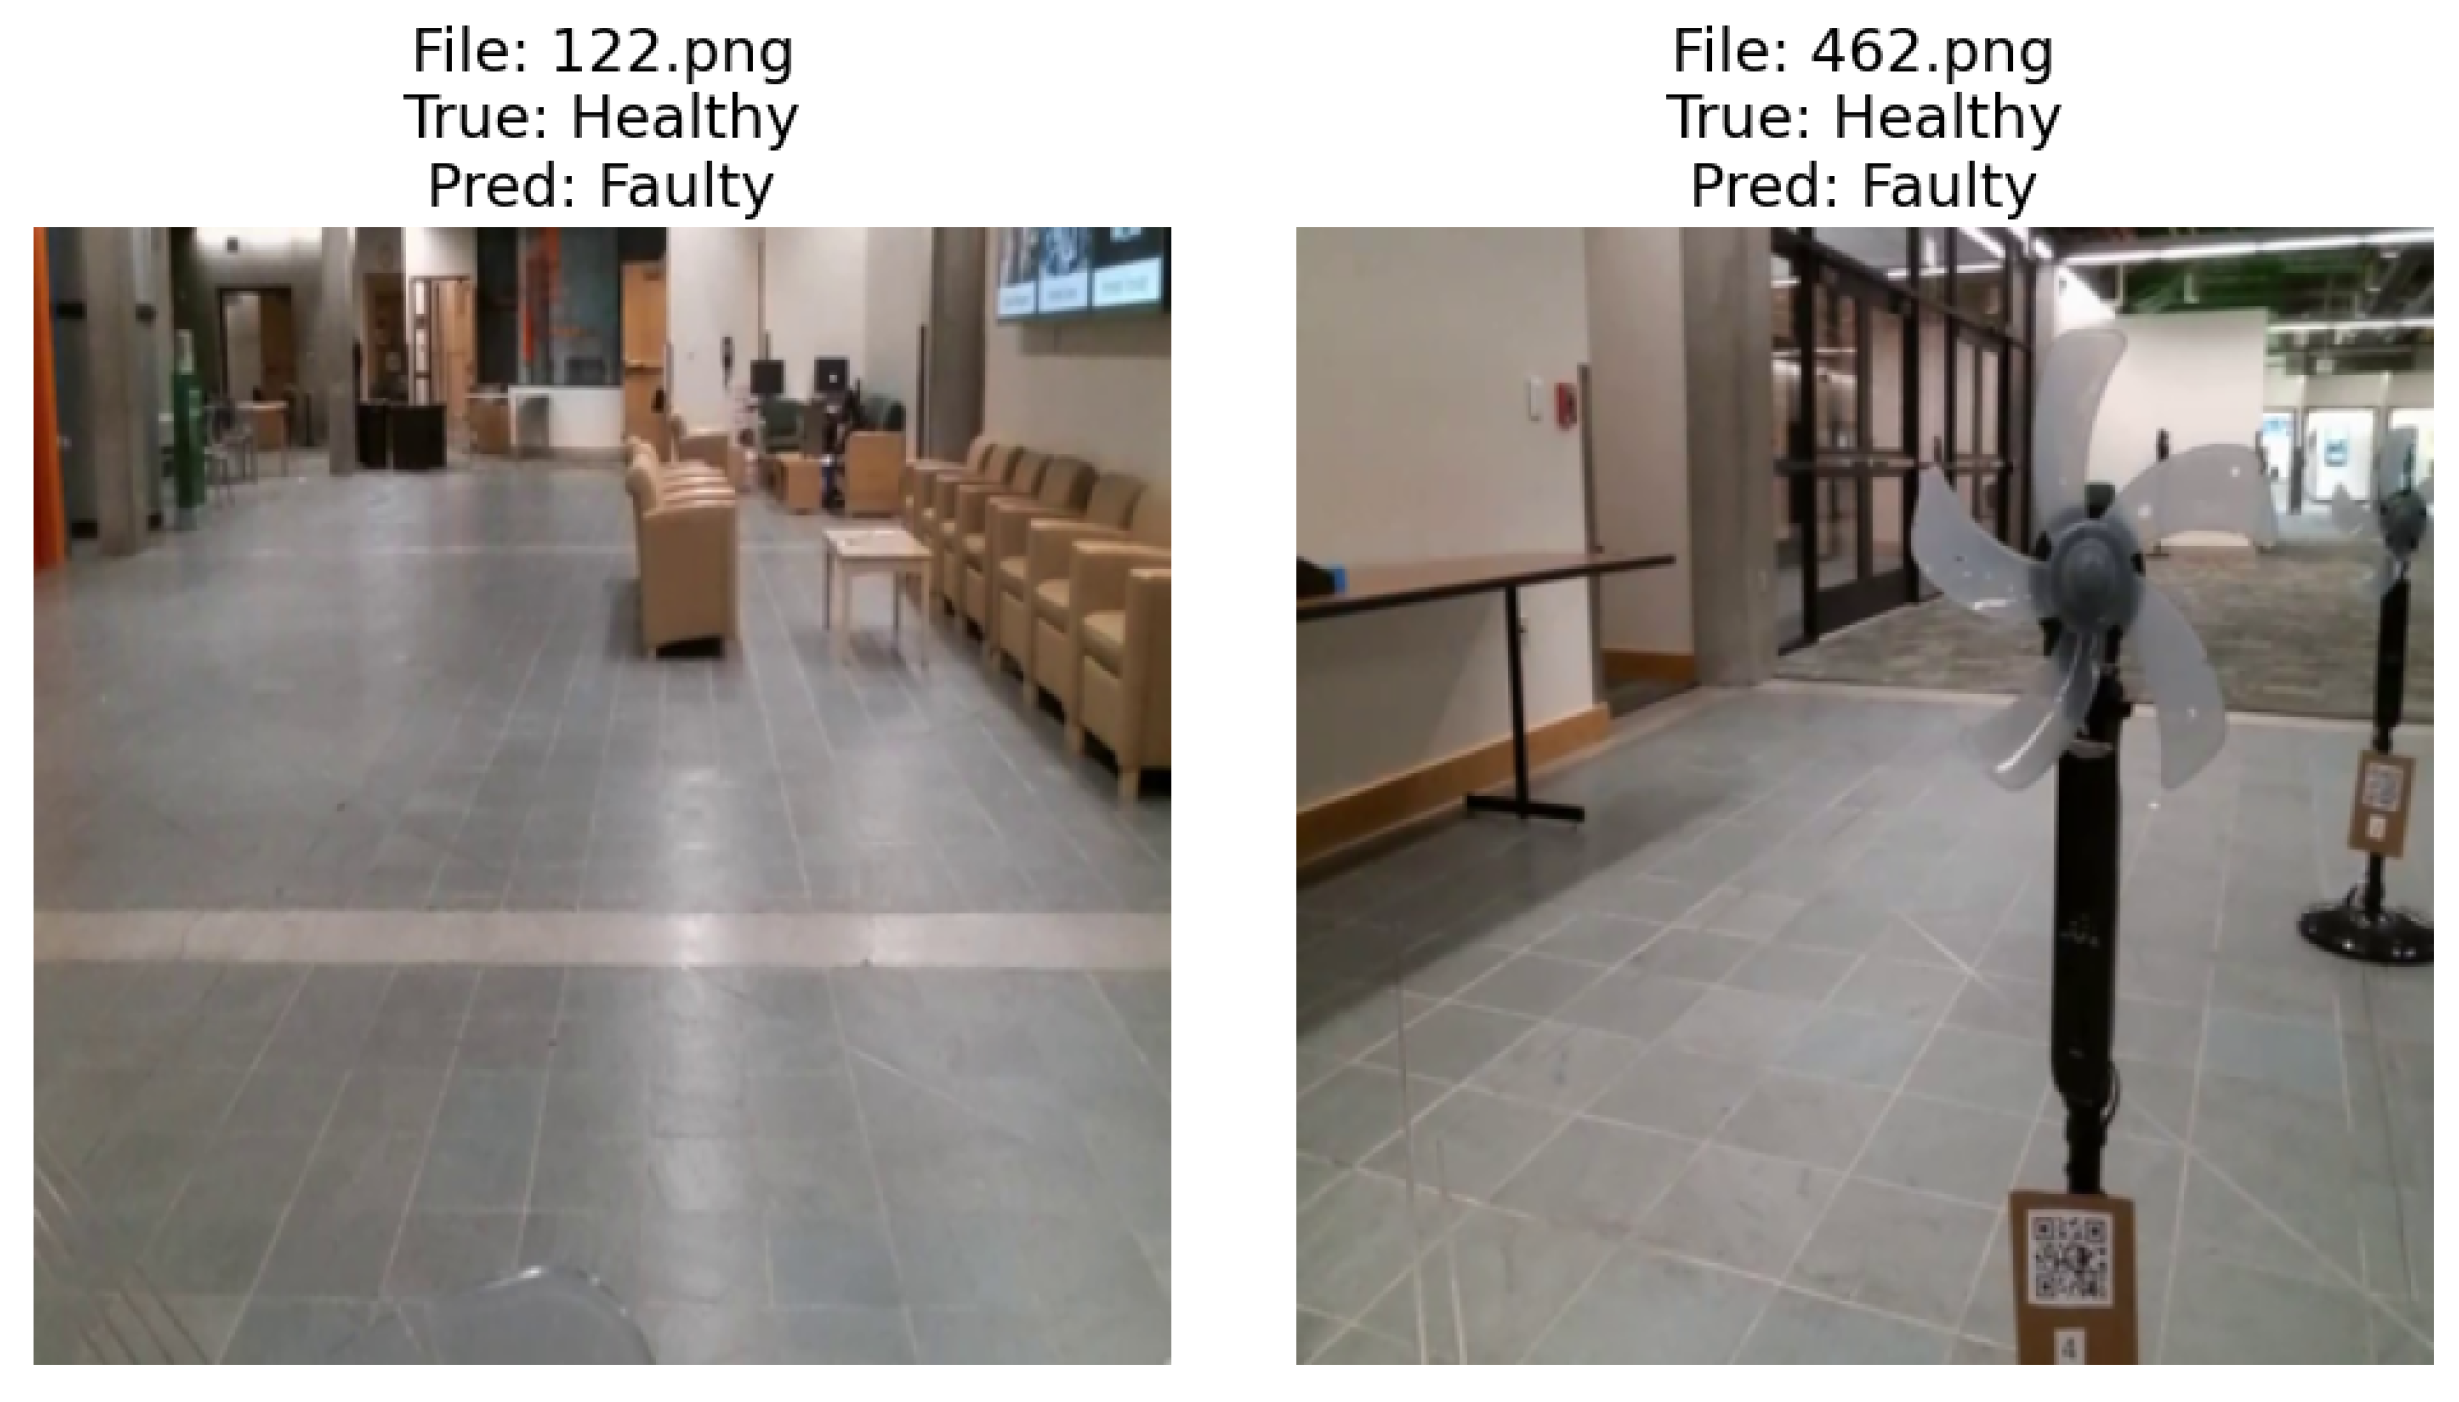
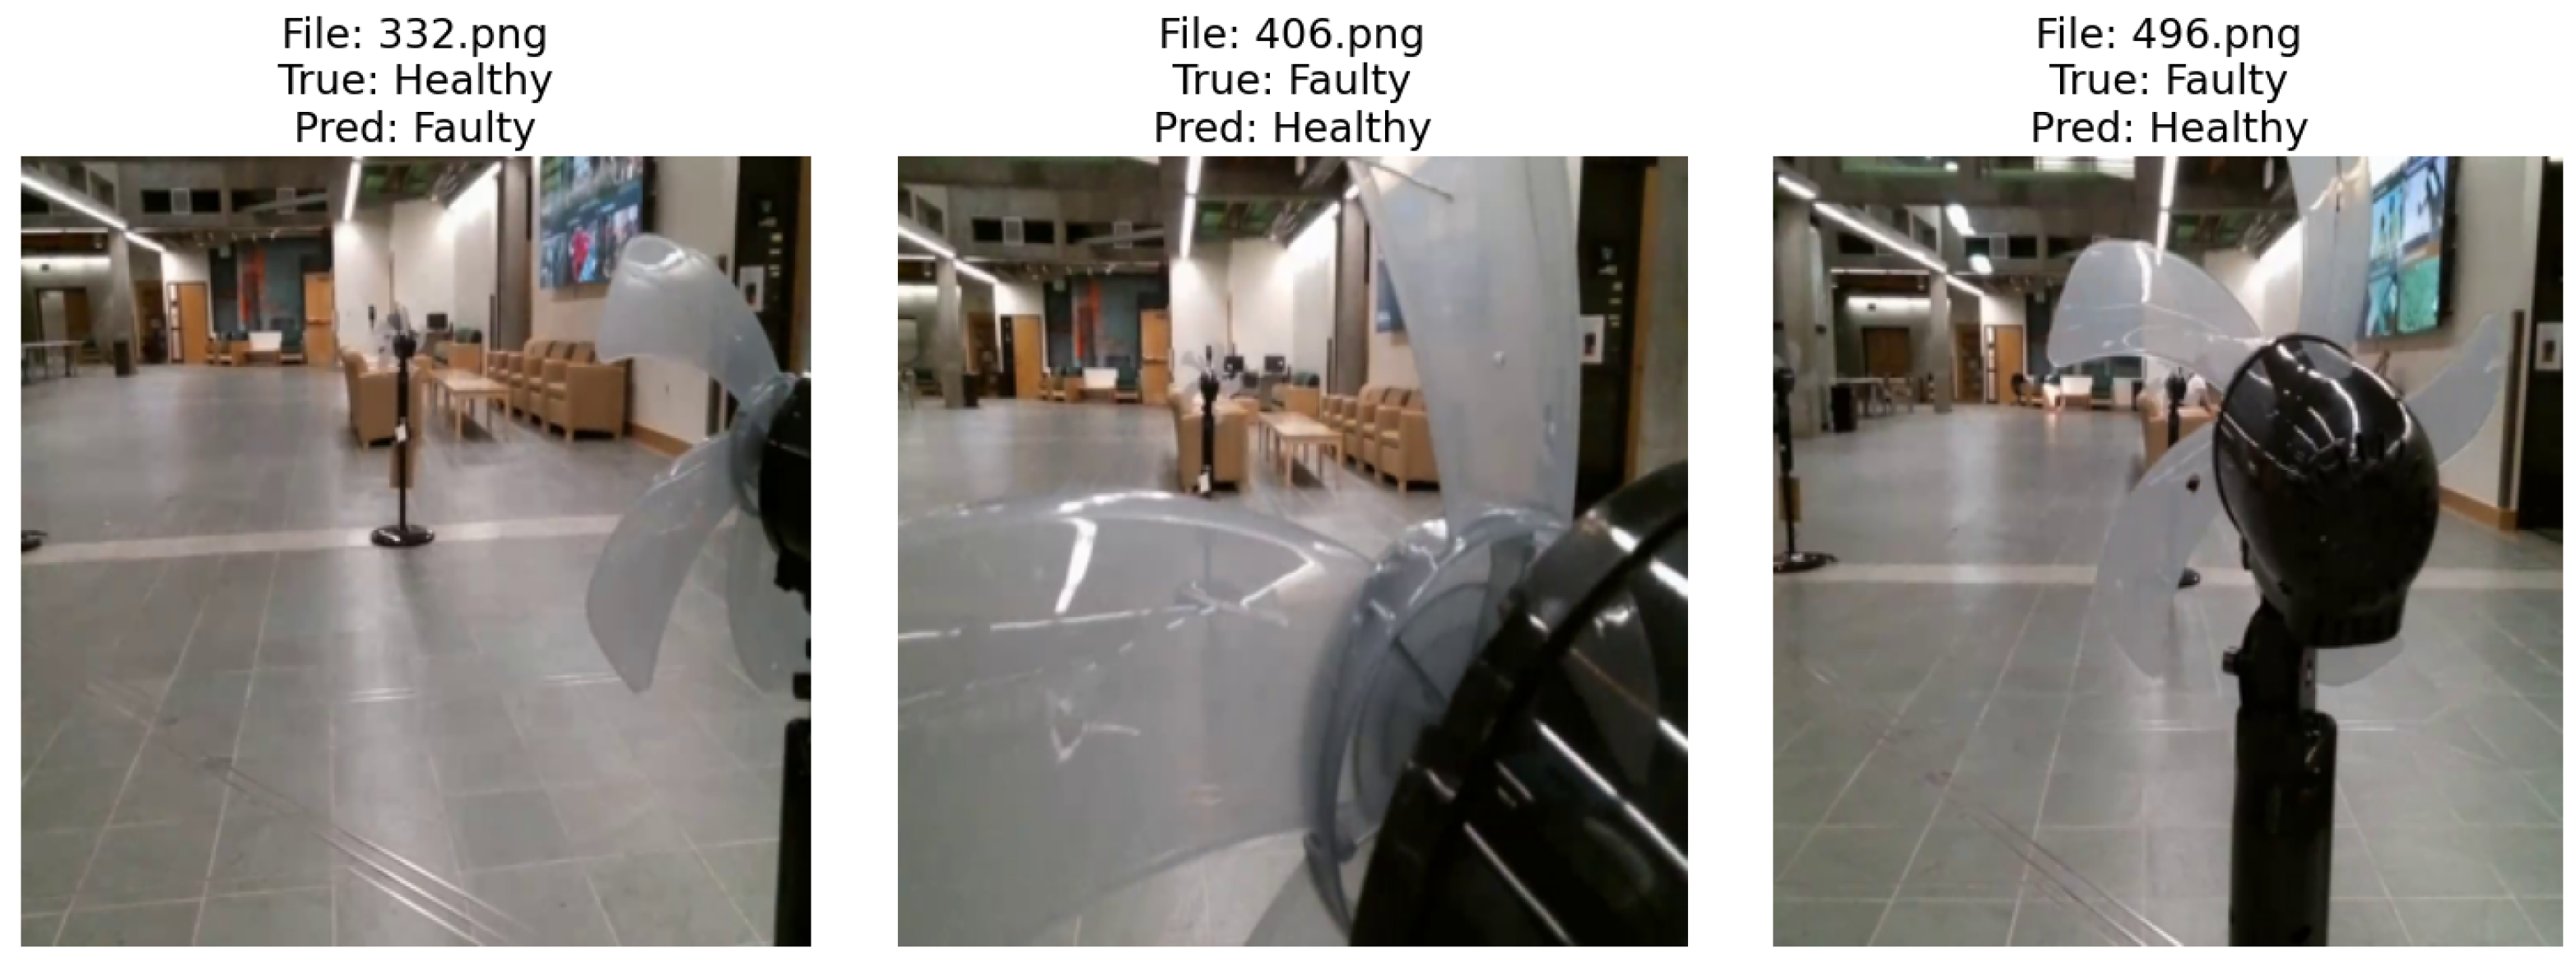
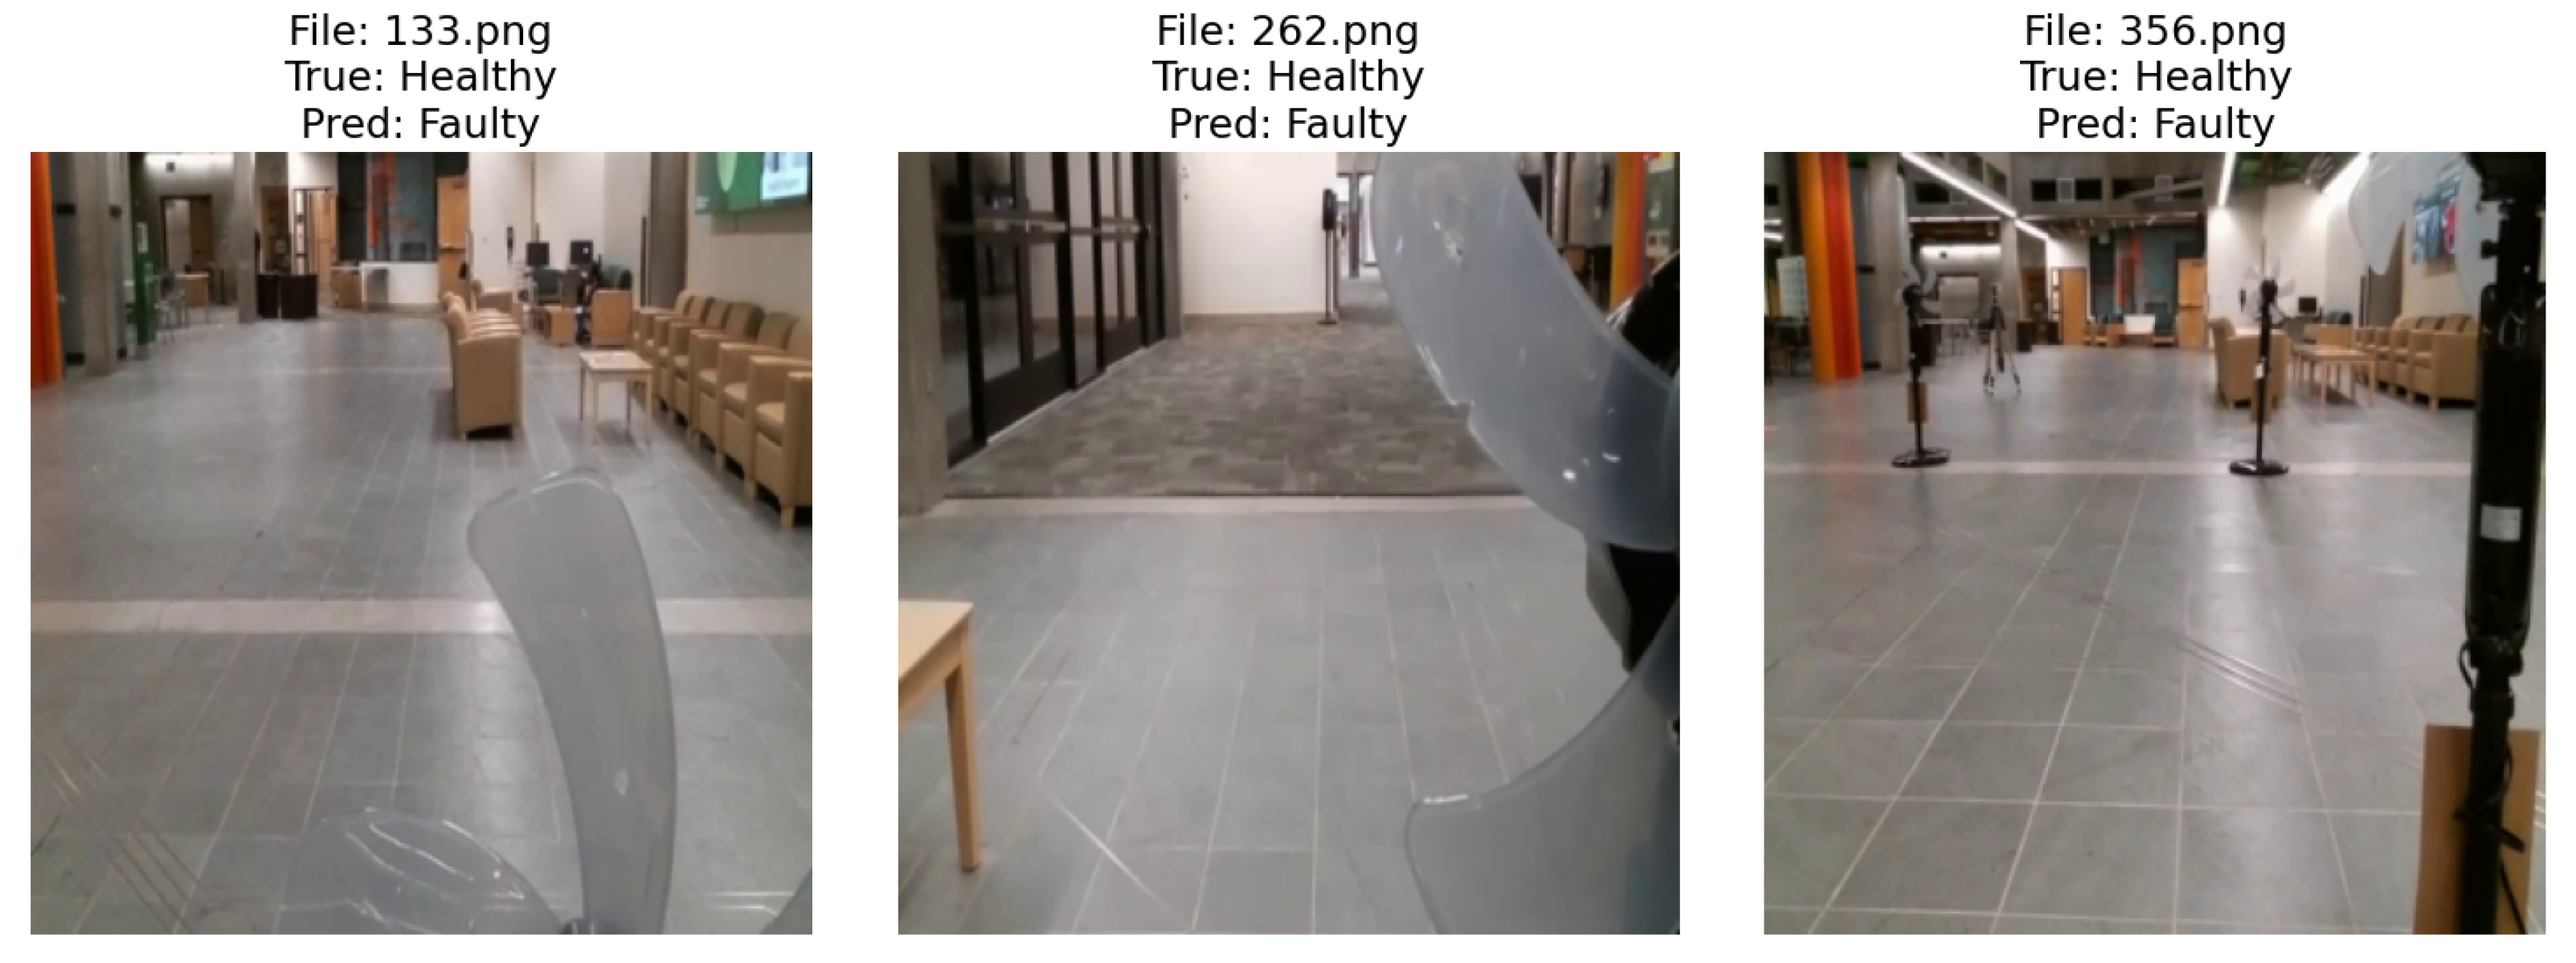
Following closely, Xception demonstrated almost impeccable performance with an average accuracy of 99.79%, precision of 99.33%, and a perfect recall of 100%, culminating in an F1-score of 99.66%. This indicates a strong ability to correctly identify all instances of faulty PFBs, albeit with a marginally lower precision compared to the leading models. ResNet and VGG, while still exhibiting high performance, presented slightly more variation in their metrics. ResNet’s perfect precision score of 100% contrasted with a lower recall of 98.51%, indicating a slight tendency to miss a minimal number of faulty PFB instances. VGG, with an accuracy of 99.37%, precision of 98.66%, and recall of 99.32%, demonstrated balanced performance, but with room for improvement in precision. AlexNet, sharing the same accuracy with VGG, showcased a perfect precision score, but a reduced recall of 97.97%, suggesting it occasionally overlooked faulty PFB instances more than other models. The misclassified test images from these architectures are illustrated in
Figure 21 for Xception,
Figure 22 for ResNet,
Figure 23 for VGG, and
Figure 24 for AlexNet. According to
Figure 21,
Figure 22,
Figure 23 and
Figure 24, Xception, ResNet, VGG, and AlexNet misclassified 1, 2, 3, and 3 images out of 420 test images, respectively.
These findings reveal the significant impact of model selection on the effectiveness of anomaly detection in PFBs. The success of ViT and DenseNet in our study proposes these models as the optimal choices for tasks requiring faultless performance in image-based classification. Moreover, the high marks achieved by Xception, ResNet, VGG, and AlexNet reinforce the potential of deep learning models in achieving near-perfect detection rates, albeit with slight distinctions in their precision–recall balance. This analysis not only affirms the value of employing advanced deep learning techniques for PFB inspections, but also highlights the importance of model selection based on specific performance criteria to address the precise needs of the task at hand.
6. Real-World Challenges and Alternative Data Acquisition Strategies
Implementing drone-based inspection systems for PFBs or similar applications in real-world environments presents several challenges. For example, when it comes to wind turbine blade (WTB) inspection using drones, adverse weather conditions such as rain, snow, fog, and strong winds can severely impact the drone’s flight stability and image quality [
67]. Ensuring the drone can operate in various weather conditions or developing protocols for data collection under optimal weather conditions is crucial. Additionally, proximity to large rotating wind turbine blades can create turbulence, posing a risk to the drone’s stability and safety [
68]. Implementing advanced control algorithms and stabilizing mechanisms can mitigate this risk. Real-world environments may also present obstacles such as electric lines, trees, and buildings that can obstruct the drone’s path and pose collision risks [
69]. Therefore, advanced obstacle-detection and -avoidance systems are essential for safe navigation. Acquiring a sufficient amount of labeled training data can be another significant challenge. In real-world scenarios, manual annotation of images can be time-consuming and labor-intensive, making it difficult to build large datasets [
70].
To address the challenge of acquiring training data in real-world applications, several alternative strategies can be employed. Utilizing computer-generated images to augment the training dataset can be an effective approach. Techniques such as generative models can create realistic synthetic images that help diversify the training data [
71]. Applying various data-augmentation techniques such as rotation, scaling, flipping, and color adjustments can artificially expand the training dataset, improving the robustness and generalization of the model [
72]. Leveraging pre-trained models on large publicly available datasets can significantly reduce the amount of required training data [
73]. Fine-tuning these models on a smaller domain-specific dataset can yield effective results. Engaging a community of users or using platforms like Amazon’s Mechanical Turk can facilitate the annotation process by distributing the workload across many contributors [
74]. Combining labeled and unlabeled data in a semi-supervised learning framework can also improve model performance. Techniques such as self-training and co-training can utilize the unlabeled data to enhance the learning process [
75].
In real-world applications, acquiring images directly from the blades and annotating them can indeed serve as an immediate assessment of damage. However, for educational purposes and model training, it is crucial to maintain a separate dataset and annotation process to ensure the model can learn to generalize from labeled examples. While the annotation process might seem redundant, it is necessary for training robust models capable of performing automated inspections independently. By addressing these challenges and employing alternative data-acquisition strategies, we aimed to provide a comprehensive framework that prepares students and instructors for real-world applications while ensuring the effectiveness and reliability of drone-based inspection systems.
The subsequent section details the study’s methodology, focusing on drone path-planning and image-processing techniques. It explains the algorithms and technologies used to optimize drone navigation for efficient PFB inspections and the image-processing methods for detecting and classifying anomalies. The aim is to demonstrate how advanced path planning and image processing enhance the effectiveness and reliability of drone-based inspections, highlighting both the technical aspects and practical applications.
7. Conclusions
In conclusion, the integration of drones, computer vision, path-planning optimization, Python programming, and machine learning within an educational surrogate project framework represents a significant shift toward innovative educational methodologies in engineering and technology. This study not only serves as a surrogate for the challenges of wind turbine blade inspection problems, but also serves as a foundational educational tool that simulates real-world scenarios in a classroom setting. Through the implementation of a scalable, low-cost autonomous drone system that utilizes a real-time feed of the camera instead of GPS data, we demonstrated a viable approach to teaching complex engineering concepts:
Educational surrogate project: Utilizing PFB to represent wind turbines, our surrogate project enables students to explore the nuances of drone-based inspections in a controlled environment. This approach allows for hands-on learning and experimentation with autonomous navigation systems, computer vision-based path planning, and collision avoidance strategies, all tailored to mimic real-world applications in a safe and cost-effective manner.
Deep learning for fault detection: The comparative analysis of various deep learning architectures, such as DenseNet and ViT, highlights their efficacy in classifying faults in WTBs. By integrating these models into the path-planning experiments, students can engage with advanced data analysis techniques, contributing to their understanding of AI applications in real-world scenarios.
Benefits for education: The project provides a less expensive alternative to GPS-based systems and is particularly useful in scenarios where GPS data may be unreliable or inaccurate. This makes the drone system an attractive educational tool, offering a practical demonstration of technology that students can build upon in future engineering roles.
Impact on future engineering education: By reducing the need for human intervention and enhancing the accuracy and safety of inspections through autonomous systems, this study not only advances the field of wind turbine maintenance but also equips students with the skills and knowledge necessary to contribute to sustainable energy technologies.
The findings and methodologies presented in this study underscore the potential of using low-cost, intelligent drone systems, not just for industrial applications, but as powerful educational tools that prepare students for technological challenges in renewable energy and beyond.
8. Data Availability Statement
This section provides access to the datasets created and used in our study and videos of our drone missions, offering a comprehensive view of the data creation and the practical implementations of the methodologies discussed. Here is the GitHub repository containing the developed Python scripts for experiments:
The datasets created for this research are crucial for training and validating the computer vision and deep learning models employed in our drone-navigation and -inspection tasks. These datasets include annotated images of PFBs, details of detected anomalies, and environmental variables affecting flight patterns.
Videos from our drone missions demonstrate the application of the path-planning algorithms, the drone’s response to environmental cues, and the effectiveness of fault-detection systems. These videos provide real-world insights into the operational capabilities of our drone systems under various conditions.
Mission Videos: The videos showcase the drone navigating through a simulated wind farm using computer vision-based path planning. For a detailed visual representation of the missions, you can access the following video feeds:
For further information or additional resources, please get in touch with the authors.
