Abstract
For atypical traditional villages, their invaluable historical traces and cultural memories are preserved in the existing village landscapes. Rapid and accurate acquisition of the spatial information of various surface elements in a village is an important prerequisite for a scientific, reasonable, feasible planning and design scheme for conserving, progressing, and developing atypical villages. Taking Qianfeng Village as an example, this research proposes the atypical traditional village landscape classification model based on unmanned aerial vehicle (UAV) imagery (ATVLUI) by virtue of the UAV RGB images and the object-oriented fuzzy logic membership classification technique that extracts objects according to their spectrums, textures, geometries, and context relationships, aiming at precise extraction of atypical traditional village landscapes. Based on the landscape information, the landscape pattern indexes are calculated to explore the spatial distribution characteristics of different landscapes and analyze the current conditions of Qianfeng Village as the epitome of atypical traditional villages. Accordingly, suggestions for protecting, planning, and developing atypical villages are proposed. The results show that: (1) the ATVLUI boasts excellent identification for village landscapes in a complex scenario, with a classification accuracy for traditional structures of 84%, an overall accuracy of 93%, and a Kappa coefficient of 0.89. This model is proven superior to K-nearest neighbors (KNN), decision tree (DT), and random tree (RT); (2) according to the area and proportion calculations, the structures account for 33.94% of Qianfeng Village’s total area, in which 29.69% and 4.25% are modern and traditional structures, respectively. The number of traditional structures is 202, accounting for 13% of the total number of structures; (3) within the village, connectivity between and extension of the modern structures can be recognized, suggesting a trajectory where the traditional structures are being gradually substituted by modern ones. The ecological environment at the periphery of the village is favorable. The building-to-building common boundaries are long. The modern structures are densely distributed. The discretely distributed traditional structures gather as small clusters. In general, different structures are highly interlaced to form a fragmented distribution pattern.
1. Introduction
In China, other than those villages that have been included in the national protection system as “traditional villages”, there is still a large number of villages that can be classified as neither “traditional villages” nor “modern villages” for involving both traditional and modern landscapes; they are called “atypical traditional villages” [1]. Village landscapes can refer to individual elements (e.g., buildings, vegetation, roads, mountains, water bodies, farmland, crops, and production and living facilities), as well as global patterns and field spirits formed by the coexistence and interaction of these elements. Protecting the traditional landscapes in atypical traditional villages is one of the important measures for preserving the historical traces and cultural memories of Chinese villages, inheriting fine traditional Chinese culture, cultivating healthy moral ideas, and promoting harmonious social development [2]. Also, it is one of the crucial subjects under the “Beautiful Countryside” program. While all-round exploration and utilization of traditional village landscapes as cultural heritages are considered the necessary procedures to reshape rural cultures and develop rural tourism, precise capture of landscape elements’ spatial information (e.g., location, quantity, area, percentage, aggregation, and dispersion), especially traditional structures, is an important prerequisite for a scientific, reasonable, feasible planning and design scheme for conserving, progressing, and developing atypical villages.
Currently, primary methods for acquiring the spatial information of village landscapes include manual field survey and visual interpretation of unmanned aerial vehicle (UAV) remote sensing (RS) images, which are time- and labor-intensive and suffer from insufficient precision and efficiency. Therefore, rapid and precise capture of landscapes, especially traditional structures, is the key to narrowing the planning and design span, controlling the cost of information acquisition, improving the planning and design quality, and achieving the expected effect.
Aerial photography, laser scanning, and other RS technologies can provide high-resolution datasets in building analysis and identification [3]. As the resolution of such satellite RS data has increased satisfactorily, automatic building identification is subject to a few restrictions, including scenario complexity, building variability, and sensor resolution [4]. Typical satellite RS systems, such as Landsat 8 OLI/TIRS, ASTER, and Sentinel-2, boast abundant spectral information to provide time-series multi-spectral images for long-term observation, but their unsatisfactory resolutions (10–30 m) [5] allow for only fuzzy spatial information of landscapes. These techniques are incapable of clearly outlining the boundaries and contours of small structures out of a complex scenario. Given the coexistence and interlacement of various surface features (e.g., houses, vegetation, rivers, and roads) in the village context, with influence factors like light, season, and hour involved, the phenomena of “the same object with different spectrums” and “different objects with the same spectrum” can be serious and frequent.
In recent years, UAV RS has been applied strategically to vegetation monitoring, environmental management, building information identification, and other fields for its high spatial resolution and time flexibility. The sensors equipped in UAVs are capable of precisely capturing the spatial information of surface features (e.g., roof tiles, automobiles, structures, and individual trees) and outputting sub-meter RS images [6,7]. UAVRS makes up for the satellite imagery’s shortcomings (e.g., low spatial resolution and long acquisition span) and increases the possibility of identifying different roofs in a rural scenario of high complexity. Despite the high-resolution RGB images provided by UAVs, the three-band spectral information is too barren to be used to distinguish the structures in a complex village scenario.
The “building extraction from RS images” technique is based on high-resolution RS images to integrate with classification methods such as edge detection, image segmentation, digital morphology, and object-oriented classification to extract building information according to shape, spectrum, texture [8], and other building features [9] according to the context [10]. Compared with pixel classification, object-oriented segmentation is based on spatial and spectral features and takes the objects composed of homogeneous pixels as the analytical units, which can effectively avoid the fragmented distribution of the surface features classified. With the booming development of artificial intelligence (AI), scholars have attempted to extract building information from high-resolution images by virtue of deep learning [9,11,12,13], but it is almost impracticable to acquire the massive high-quality sample data for deep learning in a complex village scenario. This is exactly the case for atypical traditional village landscapes, as the difficulty of collecting high-quality data disqualifies deep learning models from direct use. Supervised and unsupervised classification rely on deterministic memberships (also known as “hard classification”) to group pixels accurately into different classes according to the training sample points and the statistical standards, because each pixel involves or does not involve one or more relationships of subordination. The two techniques are especially applicable to scenarios where the surface features are externally unique yet internally homogeneous [14]. However, not all objects are equally representative when it comes to a complex village scenario, and such a decisive “yes or no” approach may lead the classifier to output unreliable classification results [15]. Nevertheless, the fuzzy logic membership model allows for fuzzy classification in practice, where some memberships can be 0, 1, or a random value between 0 and 1, and it has been widely applied in crop classification, image classification [14,16], medical science, and other fields.
Based only on the UAV RGB images, this research proposes an atypical traditional village landscape classification model based on UAV imagery (ATVLUI) by virtue of object-oriented image segmentation and fuzzy logic membership classification, which is highly capable of identifying traditional structures in a complex scenario of atypical traditional villages according to their shapes, spectrums, and textures. After the classification procedure, the spatial information and the landscape pattern indexes of each class of surface features are calculated for analyzing the spatial distribution characteristics of traditional structures, so as to provide scientific references for the protection and overall planning of traditional structures.
2. Data and Methodology
The ATVLUI can solve the problem of low-precision automatic extraction of traditional structures’ roofs in a complex scenario when UAV imagery serves as the only data source (Figure 1). For an atypical traditional village, the surface features in UAV images include traditional structures, modern structures (e.g., modern roofs, vegetable greenhouses, and impermeable roads), vegetation (e.g., crops, trees, shrubs, and building greenery), bare land (e.g., unvegetated farmland and permeable roads), and shadows. The interpretation signs are shown in Table 1. According to the UAV images, the structures are concentrated, with large semblable roofs, whereas the vegetation, bare land, and shadows are unevenly distributed as fragments of varying sizes. Therefore, the surface features can be grouped into “Structures”, which includes traditional and modern structures, and “Non-Structures”, which involve vegetation, bare land, and shadows. The classification involves 4 steps: (1) use a small segmentation scale, with the spectral information combined, to extract the non-structures by virtue of fuzzy logic membership classification, which involves masking the non-structure information in the original images; (2) use a large scale to segment the structure layers to extract the traditional and modern structures via membership classification according to the shapes, spectrums, textures, and context relationships; (3) use the confusion matrix to verify the classification results, and compare them with the results output by the K-nearest neighbors (KNNs), decision tree (DT), and random forest (RF) methods; (4) use ArcGIS’s spatial analyst toolbox and Fragstats’ landscape pattern analysis program to explore the spatial distribution characteristics of the landscapes in Qianfeng Village.
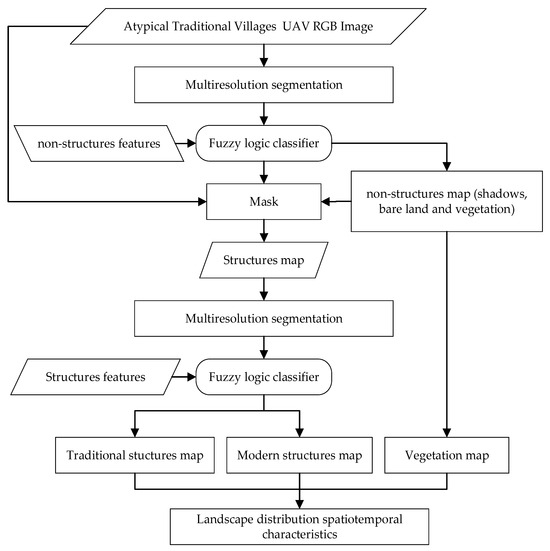
Figure 1.
The atypical traditional village landscape classification model based on UAV imagery.

Table 1.
Interpretation signs of different surface features in UAV RGB imagery.
2.1. Survey Region
The research subject is Qianfeng Village, Fengshan Town, Fengqing County, Lincang City, Yunnan Province, China. Located in the southwest area of Fengqing County and 15 km away from the center of the county, Qianfeng Village possesses a territory area of 7.28 square kilometers, an elevation of 1900.00 m, and an average annual temperature of 16.60 °C. Facing the east, the village sits on the gentle slope at the bottom of the valley and is surrounded by farmland and woodland to form a beautiful environment (Figure 2A). In 2023, Qianfeng Village was listed by the local government as one of the 21 villages requiring key attention under the “Beautiful Countryside” program. As an atypical village, most of its old houses have been replaced with modern structures (Figure 2C), and a small number of traditional structures of high value have been preserved (Figure 2B). Also, Qianfeng Village enjoys some rural tourism resources as its traditional tea-making and wine-brewing cultures have been preserved.
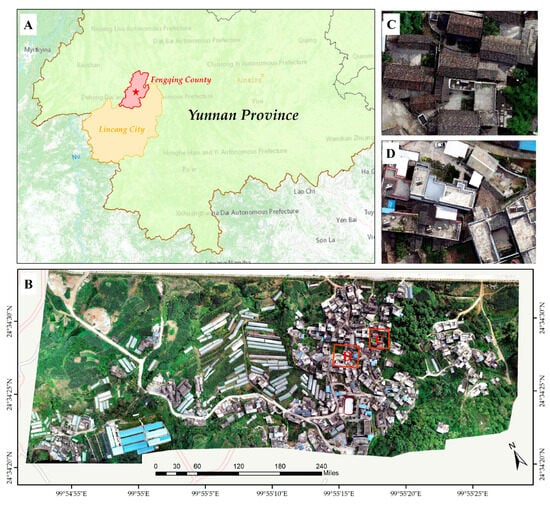
Figure 2.
Survey region (A) for location of the survey region in Qianfeng Village, Fengqing County, Lincang City, Yunnan Province, China; (B) for survey region; (C) for traditional structures; (D) for modern structures.
2.2. Data Acquisition and Processing
In this research, the DJI Phantom 4 Pro equipped with an RGB digital camera was used to acquire high-spatial resolution UAV image data on 17 August 2020. Clouds and light angles can produce excessive shadows to impact the image quality to hinder the subsequent extraction of information. Thus, it is essential to arrange the optimal flight time according to the weather conditions, thereby ensuring the quality of UAV imagery. On the day of data acquisition, the flight was performed between 10:30 and 14:30 local time, when the solar ray was nearly perpendicular to the ground, the sky was clear and cloudless, and the wind velocity was low. To generate orthoimages that can cover the entire research area, the forward and side overlap rates were set to 80% and 70%, respectively. The data acquisition was accomplished based on the preset flight path.
The Pix4D 4.5.6 mapper software was used to process the highly overlapping images acquired by the UVA. The procedure included adding images, aligning images, matching feature points, generating density point clouds, operating the digital surface model, and outputting orthoimages. Subsequently, the orthoimages were input into the ENVI5.6 software to remove the fuzzy parts on the boundaries with its crop tool. A linear 2% stretch was applied to amplify the pixel spectrum contrast.
2.3. Atypical Traditional Village Landscape Classification Based on UAV RGB Images
2.3.1. Determination of Thresholds for Object-Oriented Segmentation
The multiresolution segmentation (MRS) algorithm provided in the eCognition9.0 software is used for image segmentation, which is a bottom-up technique that can merge two adjacent image regions into a large object until no more mergence appears under the specified scale, realizing region merging at minimum heterogeneity.
The segmentation scale is one of the key parameters in extracting structure and non-structure information from RS images [17]. The ESP2 tool in eCognition is applied to analyze and calculate the scale parameters for structure and non-structure information, which is based on the statistics of the local variances (LVs) of different scales to determine the optimal scale [18] because the LV increases as the scale rises and reaches its peak when the scale matches with the actual surface feature. At this point, the internal homogeneity among the same class of objects is maximum, and so is the heterogeneity between different object classes. So far, this LV can be considered the optimal segmentation scale. Moreover, according to the local rate of change (ROC; Equation (1)), an ROC-LV curve can be generated, where the curve peak is equivalent to the optimal segmentation scale.
where ROC is the object’s local rate of change; L is the local variance of the target layer; and L − 1 is the local variance of the layer next to the target layer.
Scale solutions for structures and non-structures are different. Upon analyzing the surface features’ band information, the three bands’ proportional weights can be obtained. Meanwhile, the control variate method is used according to the class of objects being segmented so as to determine the shape weight, color weight, and compactness. Accordingly, assuming ESP2 is the optimal tool for segmentation scales and the ROC-LV curve peak is the optimal scale, the optimal edge compactness should be determined to locate the best scale solution.
2.3.2. Fuzzy Logic Membership Classification
Based on object-oriented segmentation, fuzzy logic classification uses the membership function to establish rules for object classification. In the extraction of surface features in a complex scenario, setting only one threshold for an object class could be prone to segmentation faults and, thus, unreliable classification results. For instance, there are significant differences between the spectrums of uncovered vegetation, partly-covered vegetation, and fully-covered vegetation. Thus, in threshold selection, it is recommended to locate the critical sample point between the target and the non-target and set the problematical point to a critical interval through a fuzzy logic membership function.
2.3.3. Extraction of Non-Structures
The non-structures were vegetation, bare land, and shadows. Shadows referred to the parts of structures, vegetation, and bare land that were unexposed to sunlight due to height differences, such as eave-structure gaps and vegetation voids. In this case, the shadows were extracted using the spectrum averages (brightness) of the RGB bands and fuzzy logic classification (Equation (2)). For the extraction of vegetation, the shadows were removed from the images at first, and then the vegetation index (Equation (3)) was used to extract the vegetation in the shadow-free regions. The principle was that the vegetation’s spectral reflectance was at its peak on the green band to render the vegetation objects green in the RGB images. The extraction of bare land was realized by the blue–green difference index (Equation (4)).
where is the number of spectrums; is the gray value of the mth band that corresponds to the object; is the gray value of the red band; is the gray value of the green band; and is the gray value of the blue band.
2.3.4. Extraction of Structures
After removing the non-building objects from the UAV RS images, the patches that remain are structures. Subsequently, the differences between the traditional and modern structures, in terms of spectrum, texture, and geometrical shape, were explored one at a time, with different criteria selected or built and proper threshold parameters adopted, to separate the traditional structures from the modern ones using layered extraction. However, the problem of “different objects with the same spectrum” was noticed for the traditional and modern structures, which necessitated a sequential classification order from texture to shape and spectrum. Also, a refinement of the classification results based on the context relationships was performed.
The first step is the structure extraction based on the texture features. As for texture differences, the roofs of traditional structures are mainly composed of antique tiles with uneven surfaces, detailed and regular textures, and low homogeneity (Figure 2A), whereas the modern structures (e.g., impermeable roads, vegetable greenhouses, and concrete roofs) tend to have smooth, flat surfaces, without significant textures and with high homogeneity (Figure 3b,c). In this section, the gray level co-occurrence matrix (GLCM) dissimilarity and the spectral standard deviation (StdDev) were adopted to eliminate the modern structures without a significant texture, as the GLCM reflects the comprehensive information of the image grayscale in direction, inter-pixel distance, and amplitude of variation (the higher the dissimilarity, the rougher the texture) and the StdDev is calculated based on the layer values of all n pixels that consist of an object (the smoother and flatter the surface and the evener the color, the smaller the deviation).
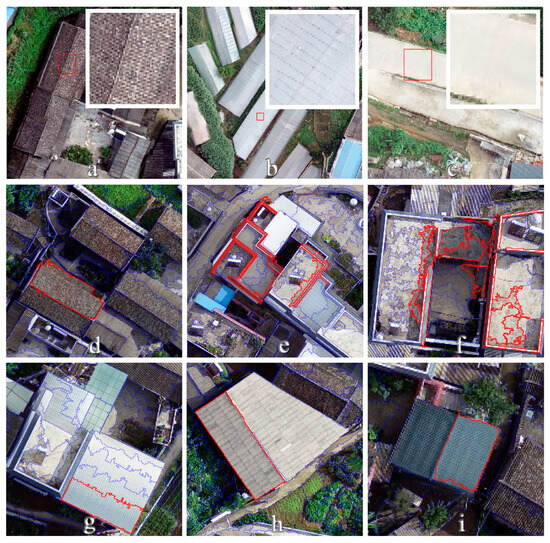
Figure 3.
Comparison between traditional and modern structures: (a–c) are texture differences; (d–f) are geometric differences; (g–i) are spectrum differences.
The second step is the structure extraction based on the shape features. An object’s shape feature is equivalent to the spatial distribution statistics of the pixels constituting the object, whose geometric information can be captured by calculating the approximations of the objects’ bounding boxes. As for shape differences, the traditional structures have a rectangular roof, with a vertex on the center line and two slopes. The shape segmentation is structured, mostly presented as a wide rectangle (Figure 3d,f). In contrast, the modern roofs tend to have a significantly different style from the traditional ones, most of which consist of a central platform and a thin, vertical brickwork parapet wall around it (Figure 3e). In image segmentation, the brickwork structure can be segmented into independent strip-like objects due to its highly different color and shape from the platform. Particularly, these parapet walls have an extremely similar texture to traditional roofs. Therefore, the analysis of the shape differences between the traditional and the modern structures is necessary for the structures that remain in the images after the texture-based extraction. The non-rectangular structures and a part of the fragmented modern structures can be effectively removed according to their values of length–width ratio, rectangular fit, roundness, and area.
The third step is the structure extraction based on the spectrum features. After the two procedures above, there can still be some structures remaining ambiguous, which are mainly rectangular, textured roofs in red, blue, and white, with high reflectance (Figure 3g–i). Based on the spectrum differences between the remaining structures and the traditional structures, white roofs with high reflectance can be removed using the brightness and the sum of the grey values of the RGB bands (Equation (5)), red roofs can be removed using the red–green difference index (Equation (6)) and the red mean difference index (Equation (7)), and blue roofs can be removed using the blue–green difference index (Equation (4)).
where is red band; is green band; is blue band.
The final step is the refined structure extraction based on the context information. So far, some of the traditional structures might be mistakenly classified as “modern structures” for they satisfy a certain condition. For instance, some traditional structures are provided with a convex central beam, which can be segmented into an independent strip-like object due to its significantly different brightness from the surrounding objects because of sunlight. Therefore, these traditional beams may be classified as modern structures in the second shape-based extraction. According to the “relative border to class” rule of context information, for objects on the same layer, an object’s relative border is calculated by dividing the shared border length of the objects from the class to which this object is assigned by the total border length. The relative border can be 0 to 1, where 1 indicates that an object is fully surrounded by the objects that have been assigned to another class. In other words, when a “modern” object is surrounded by traditional objects, this object should possess a high “shared border to total border” ratio (i.e., rel. border to class), suggesting that it should be considered a traditional structure.The extraction process of traditional buildings is show in Figure 4.

Figure 4.
Extraction process for traditional structures.
2.4. Evaluation of the Classification Results of Atypical Traditional Village Landscapes
The confusion matrix is an important tool for evaluating the performance of classification models by comparing the classification results with the actual measurements and presenting the number of true and false results in the matrix. To verify this layered multi-feature model’s performance in classifying traditional structures, the research compared its results with the results from the conventional machine learning (ML)-enabled supervised classification methods KNN, DT, and RF. The confusion matrix was used for classification accuracy evaluation for the model’s results [19], and the model was compared with KNN, DT, and RF in terms of single-class accuracy, overall accuracy (OA), and Kappa coefficient. Also, random sampling was used to acquire sample points for accuracy validation, and a total of 1579 sample points were collected upon field verification and human–computer interaction interpretation.
where OA is the overall classification accuracy, indicating the ratio of the number of true results to the number of false results; N is the total number of verification samples; n is the number of classes; and is the number of a class’s pixels being correctly classified.
where, Kappa is the Kappa coefficient, which is a ratio representing the proportion of errors reduced by the current model to a fully random classifier; is the number of pixels of any class in the classification results; is the number of samples of the ith class after classification; is the predicted number of samples of the ith class; N is the total number of verification samples; and n is the number of classes.
2.5. Calculation of Landscape Pattern Indexes
The landscape pattern indexes allow for quantitative analysis of the composition and spatial distribution characteristics of a landscape structure from three dimensions: patch level, patch type, and landscape level [20,21]. Based on the classification results extracted from the RGB UAV images, with the research objectives and these indexes’ ecological significances considered, the research used Fragstats 4.2 to calculate the aggregation index (AI), interspersion and juxtaposition index (IJI), mean nearest-neighbor distance (MNN), and contagion index (CONTAG), so as to explore Qianfeng Village’s landscape pattern and spatial heterogeneity.The four index’s landscape pattern indexs and their ecological significances show in Table 2.

Table 2.
Landscape pattern indexes and their ecological significances.
3. Results
3.1. Extraction Thresholds and Results
As described in Section 2.3.1, the segmentation scales for structures and non-structures can be determined based on the curve peaks generated by the ESP2 tool. For non-structures, the weights of the R, G, and B bands are 1:1:1, the shape factor is 0.1, the compactness is 0.5, and the segmentation scale is 28. For structures, the weights of the R, G, and B bands are 1:1:1, the shape factor is 0.2, the compactness is 0.5, and the segmentation scale is 58.
Based on the experimental analysis, the extraction threshold for shadows is <28, with a fuzzy interval of 28–30 (the closer the value to 28, the higher the possibility of the object being classified as a shadow); the threshold for vegetation is > 0.36, with a fuzzy interval of 0.35–0.36; the threshold for bare land is >0.072, with a fuzzy interval of 0.070–0.072.
Similarly, the extraction thresholds for traditional structures are shown in Figure 5. When GLCM-dissimilarity > 36 and StdDev-layer1 > 13.6, the structures with textures can be identified. For the structures with textures, when rectangular fit > 0.35, length/width < 5.5, area > 500, and roundness < 2.3, non-rectangular, strip-like, fragmented structures can be eliminated from the list of traditional structures. When brightness < 180 and 145 < RGB sum < 405, meanwhile <0.05, <0.38, and >−0.0025, the colored structures, other than the traditional structures, are removed. At last, concerning the patches that represent modern structures, when rel. border to “Traditional Structures” Class > 0.55, the patches should be considered traditional structures and classified as the “Traditional Structures” class.
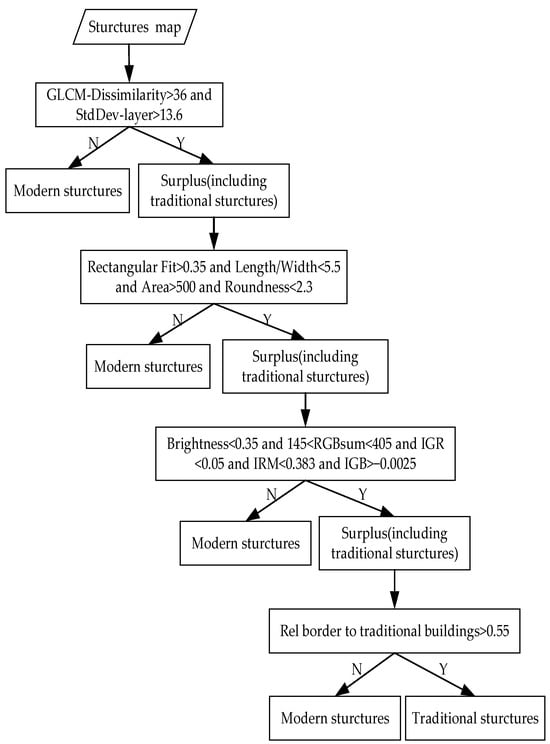
Figure 5.
ATVLUI’s segmentation thresholds for modern and traditional structures.
3.1.1. Classification Results of Village Landscapes
Segmentation Results of Structures and Non-Structures
As observed, the segmentation borders between the non-structures (Figure 6a,b) and their peripheral objects are distinct. The homogeneity among the non-structure objects is high, but the structure objects are fragmented with obscure borders. In addition, the segmentation borders between the structures (Figure 5c,d) and their peripheral objects are distinct, with their segmentation boundaries being highly semblable to the actual boundaries. Despite the perceptible adhesions between the vegetation and the bare land, as well as between the vegetation and the structures, the homogeneity between the non-structure objects is low.
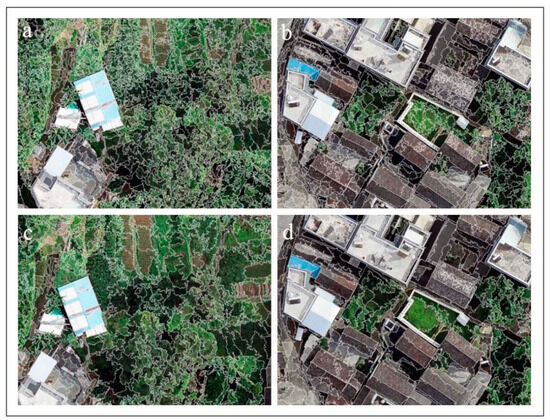
Figure 6.
The ATVLUI’s segmentation results of structures and non-structures: for (a,b), the scale is 28 and the shape factor is 0.1; for (c,d), the scale is 58 and the shape factor is 0.2.
Classification Results of Structures and Non-Structures
By virtue of the ATVLUI, the shadows, vegetation, and bare land are extracted (Figure 7). As demonstrated in Figure 7A,B, the extraction of shadow, vegetation, and bare land information using the small scale-based segmentation solution and thresholds is excellent. Upon extracting the non-structure information, the surface features that remain are structures.
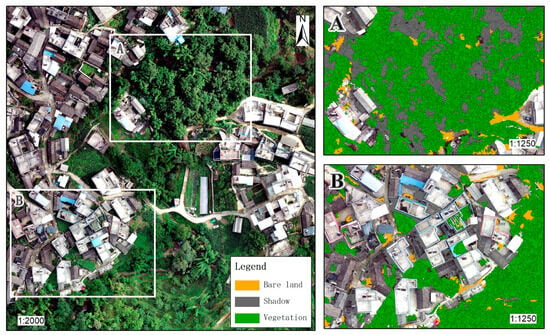
Figure 7.
Classification of vegetation, bare land, and shadows. (A,B) are Classification result of vegetation, bare land, and shadows.
As shown in Figure 8A1,B1, after the texture extraction, most of the modern structures (e.g., impermeable roads, greenhouses, and concrete roofs) with homogeneous colors and inconspicuous textures are eliminated, and the structures that remain are either traditional structures or modern structures with textures. After removing the modern roof edges and small, scattered patches, the structures that remain are either traditional structures or rectangular structures with textures (Figure 8A2,B2). Next, the recognition of spectrum features can exclude the red, blue, and white roofs with high reflectance and retain only traditional structures (Figure 8A3,B3). Finally, the context interpretation can return the patches that have been mistakenly classified as modern structures to the “Traditional Structures” class.

Figure 8.
Classification of traditional and modern structures: (A,B) are original images; (A1,B1) are extracted according to texture; (A2,B2) are extracted according to texture and geometry; (A3,B3) are extracted according to texture, geometry, and spectrum; (A4,B4) are extracted according to texture, geometry, spectrum, and context.
3.1.2. Accuracy Validation and Comparison
The validation results have demonstrated different techniques’ performance in classifying traditional structures and other classes of surface features (Table 3). As observed, the ATVLUI proposed is optimal in terms of traditional structure extraction accuracy (84%), OA (93%), and Kappa coefficient (0.89). According to the classification results shown in Figure 9, for traditional structures, the ATVLUI can realize clear boundaries and contours and lower rates of classification errors and mistakes than the other three techniques. In general, compared with the conventional ML classification methods, this layered multi-feature classification model is capable of extracting traditional structures and other surface features in a complex scenario at a higher accuracy based on UAV RGB images.

Table 3.
Accuracy verification.
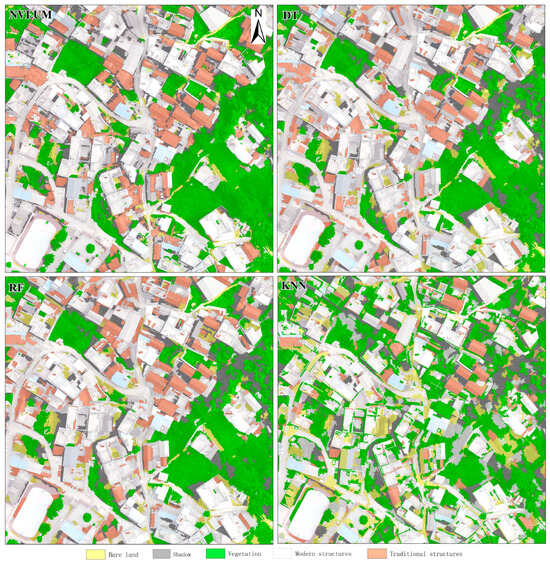
Figure 9.
Classification results of ATVLUI, DT, RF, and KNN.
3.2. Distribution Characteristics of Traditional Structures in Qianfeng Village
In light of the spatial distribution of the traditional structures (Figure 10), as well as the areas and proportions of the five classes of surface features (Table 4), the structures in Qianfeng Village are naturally distributed along the main road, surrounded by vegetation and farmland. The dwellings are dominated by modern structures, which mix with scattered traditional structures. Agricultural greenhouses can be seen in the farmland. Table 4 shows that the vegetation possesses the largest area proportion, followed by the modern structures, bare land, shadows, and traditional structures. The structures account for 33.94% of the village’s total area. The number of traditional structures is 202, accounting for 13% of the total number of structures.
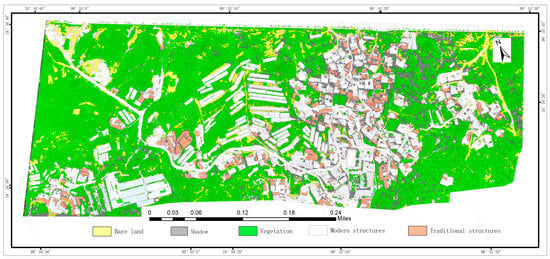
Figure 10.
Spatial distributions of different landscapes in Qianfeng Village.

Table 4.
Areas and proportions of different surface features in Qianfeng Village.
3.3. Analysis of the Traditional Structure Landscape Pattern in Qianfeng Village
Fragstats 4.2 was used to calculate the landscape pattern indexes of each class of surface features (Table 5). The AIs for all classes are greater than 90, where vegetation has the highest aggregation (98.54), followed by modern structures (97.75), and traditional structures (97.22), with a standard deviation of 3.35, suggesting that all the landscapes possess great internal aggregation. In particular, vegetation is the highest in terms of area proportion and aggregation, which indicates that Qianfeng Villages enjoy high vegetation coverage and an outstanding ecological environment, for which potential planning schemes may try to take advantage of existing green plants to satisfy the village’s ecological supply. However, the high AIs for modern and traditional structures suggest that the lengths of structure-to-structure common boundaries and the density of structures are so high that challenges for future road development and fire protection improvement are possible.

Table 5.
Landscape pattern indexes of different surface features in Qianfeng Villages.
From the IJIs and MNNs, it is perceptible that: (1) modern structures have the highest IJI (90.98) and a moderate MNN (1.39), which shows that the modern structures in the village are densely distributed and sit close to the other classes of surface features so as to form complex local patterns; (2) vegetation has the second highest IJI (83.89) and the lowest MNN (1.24); (3) traditional structures have an IJI (83.28) slightly lower than vegetation’s and yet the highest MNN (6.36). Thus, it suggests that different classes of surface features are interspersed in Qianfeng Village, while the discretely distributed traditional structures are located far from each other. Any subsequent planning schemes should notice that Qianfeng Village does not have the conditions for tourist streets with traditional characteristics, and attention should be paid to the protection and development of the traditional structures of value.
The CONTAG is relatively low (60.82), indicating a highly interlaced pattern of different classes of landscape elements in the village. These landscapes are disorderly distributed, and the village’s overall landscape pattern suffers a high degree of fragmentation. Based on the AIs, IJIs, and MNNs, it is known that the modern structures are well connected to each other to form clusters that are extending outwards and replacing the traditional structures, resulting in the village’s scattered traditional structures and fragmented overall landscape pattern. Therefore, practical protection of its valuable traditional structures is essential and urgent.
4. Discussion
4.1. Automatic ATVLUI: High Efficiency and Accuracy
This research is the first attempt to build an atypical traditional village landscape classification model based on UAV images (ATVLUI), which is capable of automatic classification and quantitative analysis of the landscapes in atypical traditional villages. This model requires significantly fewer human, material, and financial resources compared with UAV imagery-based manual classification.
The ATVLUI proposed possesses a classification accuracy for traditional structures of 84%, an overall accuracy of 93%, and a Kappa coefficient of 0.89, superior to KNN, DT, and RF (Table 3). The reason for the ATVLUI’s improved accuracy is that this model not only considers the independence and integrity of the surface features segmented but also employs different segmentation solutions for the “structures” and “non-structures” layers. A small scale is adopted for the “non-structures” layer to preserve the fine, irregular edges of non-structure objects such as vegetation, bare land, and shadows. Once these surface features are eliminated, a large scale is used to ensure the compactness between the structures’ segmentation boundaries and the actual boundaries, thereby reserving more spatial geometric information. Also, upon a series of analyses on the spectrums, textures, geometries, and context relationships, the optimal segmentation features and parameter intervals for different classes of surface features are obtained based on the feature sets established, which helps improve the efficiency and accuracy of extracting the information of traditional structures in a complex scenario from the UAV images. In addition, the ATVLUI can output more objective and precise results in landscape classification, as this automatic model evades the impacts of subjective human factors and the errors that may be incurred by interpreters for their different levels of professional competence and sense of responsibility.
4.2. Spatial Distribution Characteristics of Landscapes in Atypical Traditional Villages
According to the area, number, and proportion of each class of surface features, the number and distribution of each kind of structures can be obtained, by which a village’s historical value should be assessed. Also, the landscape pattern indexes (i.e., AI, IJI, MNN, and CONTAG) can reflect the spatial distribution characteristics of landscapes and a village’s development tendency. In the case of Qianfeng Village, the spatial distribution characteristics are summed up as: (1) the traditional culture is subject to a high degree of fragmentation. In light of the distribution of traditional structures (Figure 9) and the landscape pattern indexes, the traditional structures have a high AI of 97.22 and a high MNN of 6.36 (4.97 higher than that of the modern structures), suggesting that these structures gather densely as small clusters and are discretely mixed with the modern structures. This finding is consistent with existing research [22]; (2) the modern structures have the largest proportion in Qianfeng Village (87%) and are squeezing the survival space of the traditional structures, whose proportion is only 13%. This finding is consistent with existing research [1]. It is recommended that policy support and practical protection should be provided for the traditional structures of value in the village; (3) the overall ecology is vulnerable. According to Figure 9 and the AI for vegetation (98.54), the stretch along the mountainside enjoys a favorable ecological environment for the higher vegetation coverage and aggregation. However, its IJI (83.89) shows that the vegetation is greatly adjacent to the other classes of landscape patches within the village and thus vulnerable to the structures, which may deteriorate the ecological system’s sustainability. The general ecology within Qianfeng Village is unfavorable; (4) it is already known that the traditional structures are scattered and fragmented (Characteristic 1), and Figure 9 and the CONTAG (60.82) suggest that different classes of surface features are highly interlaced within the village, and the sizes and distribution of the “tradition structure” patches are both irregular. Also, the disordered orientations of the modern structures have contributed to the frequently interrupted roads between the structures, which indicates that Qianfeng Village has long been in a disordered growing state, and its development is non-directional.
4.3. Suggestions for Protecting and Renewing Atypical Traditional Villages
The renewal measures for atypical traditional villages should be different from those for common villages. Destruction and reconstruction should be avoided, and important attention should be paid to the conservation and revitalization of historical sites and cultural symbols [1]. On the basis of preserving the villages’ naturally-formed spatial pattern and humanistic system, proper construction and extension are acceptable, so as to retain the villagers’ customs and traditional marks and revitalize the existing cultures with new cultures. Thus, a new force of production may be formed for rural revitalization to practice effective protection and benign development over a wider range of atypical traditional villages. The following suggestions are proposed: (1) based on the current spatial conditions of the landscapes in Qianfeng Village, an optimization of the farmland, mountains, and waters at the periphery of the village is recommended to adopt a holistic approach to conserving mountains, waters, forests, and farmland by structuring a green, low-carbon circuit to connect the natural and humanistic landscape nodes inside and outside the villages in series. The circuit should both serve as a recreation trail for the original residents and a trail of ecological tourism for tourists; (2) since it is impracticable to plan an ancient culture street due to the discrete distribution of the traditional structures, it is recommended to zone the traditional structure clusters of value for special protection and proper development; (3) an orderly planning of renewing and constructing modern structure is recommended to prevent wild growth, and a cultural element can be extracted from the traditional and infused into the renewal and design of the modern structures; (4) according to the aggregation indexes obtained, an overall improvement for the existing road system is required. Construction of shoreside leisure footpaths as well as unified management and optimization of the sewage network, garbage sites, lighting projects, and other living elements are recommended; (5) Qianfeng Village should rely on the ecological resources (e.g., mountains, waters, forests, and farmland) at the periphery of the village, traditional architectural heritages, and time-honored tea-making and wine-making cultures so as to reshape its pattern of rural tourism to form a new type of “beautiful countryside” integrating idyllic scenery, traditional cultures, and local customs.
5. Conclusions
This atypical traditional village landscape classification model based on UAV images (ATVLUI) is capable of extracting the spatial information of village landscapes, especially traditional structures, in a rapid, efficient, and accurate manner. As a rational quantitative analysis for rural planning, it can shorten the planning and design cycle, reduce the costs of information acquisition, and improve the objectivity and accuracy of the information obtained. In this case, the ATVLUI has provided detailed, precise data to support the subsequent planning and construction of Qianfeng Village. At the same time, it is a new technological solution for spatial information acquisition, which can be used to improve the early investigation and later planning and construction of atypical traditional villages to provide an optimal scheme for village planning and design. So far, the following conclusions are suggested:
First, the integration between the automatic landscape classification algorithm and the centimeter UAV RS imagery provides an opportunity to capture the information of the landscapes in atypical traditional villages rapidly and accurately. The ATVLUI proposed in this research is capable of classifying the village landscapes in a complex scenario precisely based on UAV RGB images, which boasts a classification accuracy for traditional structures of 84%, an overall accuracy of 93%, and a Kappa coefficient of 0.89, superior to KNN, DT, and RF.
Second, the high-precision classification map for atypical traditional village landscapes provides us with the spatial distribution characteristics as basic, precise quantitative information for protecting atypical traditional villages. According to the calculations of the area and proportion of each class of landscape objects, the structures account for 33.94% of Qianfeng Village’s total area, in which 29.69% and 4.25% are modern and traditional structures, respectively. The number of traditional structures is 202, accounting for 13% of the total number of structures.
Third, connectivity between and extension of the modern structures can be noticed in Qianfeng village as an atypical traditional village, which demonstrates the existence of a trajectory where the traditional structures are being gradually substituted by modern ones. At the periphery of the village, the vegetation coverage is high. Within the village, the aggregation of all the classes of surface features is high, the lengths of structure-to-structure common boundaries are great, the modern structures are densely distributed, and the discretely distributed traditional structures gather as small clusters. Overall, the distribution pattern is highly fragmented, where different structures are highly interlaced.
Author Contributions
Conceptualization, S.Z. and W.K.; methodology, L.W. and W.K.; software, L.W. and H.Y.; validation, S.Z., L.W. and W.K.; formal analysis, S.Z.; resources, H.Y.; data curation, S.Z. and L.W.; writing—original draft preparation, S.Z. and W.K.; writing—review and editing, S.Z. and L.W.; visualization, L.W. and W.K.; supervision, S.Z.; funding acquisition, S.Z. All authors have read and agreed to the published version of the manuscript.
Funding
This research was funded by Yunnan Provincial Social Science and Art Planning Fund “Research on the Conservation Design of Traditional Village Dwellings in Northwest Yunnan”, grant number A2016YBS009, Scientific Research Fund Project of the Department of Education of Yunnan Province “Research on Human Settlement Environment Construction of Ethnic Villages in Remote Areas of Yunnan from the Perspective of Rural Revitalization Strategy” grant number A2016YBS009 and Key Project of Yunnan Forestry Technological College grant number KY (ZD) 202302.
Data Availability Statement
The data supporting this study’s findings are available on request from the corresponding authors.
Conflicts of Interest
The authors declare no conflicts of interest.
References
- Xiaoqing, W.; Jingxiang, Z.; Zhendong, L. Discussion of the Plight and the Countermeasure of Protection and Renaissance of “the Atypical Ancient Villages” Locate in the Edge of the City: A Case Study of Doucun. Mod. J. Urban Res. 2015, 5, 99–106. [Google Scholar]
- Zhang, C.; Liu, C.; Gong, H.; Teng, J. Research on the Protection and Development of Traditional Villages from the Perspective of Ecological Wisdom—Taking Yanfang Ancient Village in Ji An as an Example. Open J. Soc. Sci. 2022, 10, 1–11. [Google Scholar] [CrossRef]
- Li, Q.; Taubenböck, H.; Shi, Y.; Auer, S.; Roschlaub, R.; Glock, C.; Kruspe, A.; Zhu, X.X. Identification of undocumented buildings in cadastral data using remote sensing: Construction period, morphology, and landscape. Int. J. Appl. Earth Obs. Geoinf. 2022, 112, 102909. [Google Scholar] [CrossRef]
- Nicholas, S.; Takis, K. Automatic Vegetation Identification and Building Detection from a Single Nadir Aerial Image. Remote Sens. 2009, 1, 731–757. [Google Scholar] [CrossRef]
- Kerr, J.T.; Ostrovsky, M. From space to species: Ecological applications for remote sensing. Trends Ecol. Evol. 2003, 18, 299–305. [Google Scholar] [CrossRef]
- Yang, B.; Hawthorne, T.L.; Searson, H.; Duffy, E. High-Resolution UAV Mapping for Investigating Eelgrass Beds Along the West Coast of North America. In Proceedings of the IGARSS 2020—2020 IEEE International Geoscience and Remote Sensing Symposium, Waikoloa, HI, USA, 26 September–2 October 2020. [Google Scholar]
- Marmanis, D.; Schindler, K.; Wegner, J.D.; Galliani, S.; Datcu, M.; Stilla, U. Classification With an Edge: Improving Semantic Image Segmentation with Boundary Detection. Isprs J. Photogramm. Remote Sens. 2018, 135, 158–172. [Google Scholar] [CrossRef]
- Zhang, Y. Optimisation of building detection in satellite images by combining multispectral classification and texture filtering. Isprs J. Photogramm. Remote Sens. 1999, 54, 50–60. [Google Scholar] [CrossRef]
- Xu, Y.; Wu, L.; Xie, Z.; Chen, Z. Building Extraction in Very High Resolution Remote Sensing Imagery Using Deep Learning and Guided Filters. Remote Sens. 2018, 10, 144. [Google Scholar] [CrossRef]
- Ye, B.; Bao, N. The Building Extraction Based on Object Oriented Classification Method in High Vegetation Coverage Area. J. Comput. Commun. 2019, 7, 9. [Google Scholar] [CrossRef]
- Wang, S.; Mu, X.; Yang, D.; He, H.; Zhao, P. Road Extraction from Remote Sensing Images Using the Inner Convolution Integrated Encoder-Decoder Network and Directional Conditional Random Fields. Remote Sens. 2021, 13, 465. [Google Scholar] [CrossRef]
- Chen, Z.; Deng, L.; Gou, J.; Wang, C.; Li, J.; Li, D. Building and road detection from remote sensing images based on weights adaptive multi-teacher collaborative distillation using a fused knowledge. Int. J. Appl. Earth Obs. Geoinf. 2023, 124, 103522. [Google Scholar] [CrossRef]
- Guo, H.; Shi, Q.; Du, B.; Zhang, L.; Wang, D.; Ding, H. Scene-Driven Multitask Parallel Attention Network for Building Extraction in High-Resolution Remote Sensing Images. IEEE Trans. Geosci. Remote Sens. 2021, 59, 4287–4306. [Google Scholar] [CrossRef]
- Murmu, S.; Biswas, S. Application of Fuzzy Logic and Neural Network in Crop Classification: A Review. Aquat. Procedia 2015, 4, 1203–1210. [Google Scholar] [CrossRef]
- Irigoien, I.; Ferreiro, S.; Sierra, B.; Arenas, C. Fuzzy classification with distance-based depth prototypes: High-dimensional unsupervised and/or supervised problems. Appl. Soft Comput. 2023, 148, 110917. [Google Scholar] [CrossRef]
- Mehdi, S.N.; Amir, T.; Abdolabbas, J. Fuzzy logic classification of mature tomatoes based on physical properties fusion. Inf. Process. Agric. 2022, 9, 547–555. [Google Scholar]
- Drăguţ, L.; Csillik, O.; Eisank, C.; Tiede, D. Automated parameterisation for multi-scale image segmentation on multiple layers. Isprs J. Photogramm. Remote Sens. 2014, 88, 119–127. [Google Scholar] [CrossRef]
- Drǎguţ, L.; Tiede, D.; Levick, R.S. ESP: A tool to estimate scale parameter for multiresolution image segmentation of remotely sensed data. Int. J. Geogr. Inf. Sci. 2010, 24, 859–871. [Google Scholar] [CrossRef]
- Congalton, R.G. A review of assessing the accuracy of classifications of remotely sensed data. J. Remote Sens. Environ. 1991, 37, 270–279. [Google Scholar] [CrossRef]
- Shi, Y.; Song, H.; Shang, M.; Shao, M.; Lei, H. Analysis of Land Cover and Landscape Pattern Change in Beijing-Tianjin-Hebei Region Based on Globeland30 Data. J. Geogr. Inf. Syst. 2020, 12, 241–255. [Google Scholar] [CrossRef]
- Lewis, S.; Rosales, J.; Lewis, L. Remote Sensing for Analyzing Forested Landscape Structure and Land-Use Histories in Guyana’s Bauxite Mining Landscapes. Adv. Remote Sens. 2023, 12, 29–46. [Google Scholar] [CrossRef]
- Tong, L.; Xiaoduo, Z. Research on the Preservation and Vitalization Strategy of “Atypical Traditional Villages”. J. Archit. Cult. 2019, 5, 55–56. [Google Scholar]
Disclaimer/Publisher’s Note: The statements, opinions and data contained in all publications are solely those of the individual author(s) and contributor(s) and not of MDPI and/or the editor(s). MDPI and/or the editor(s) disclaim responsibility for any injury to people or property resulting from any ideas, methods, instructions or products referred to in the content. |
© 2024 by the authors. Licensee MDPI, Basel, Switzerland. This article is an open access article distributed under the terms and conditions of the Creative Commons Attribution (CC BY) license (https://creativecommons.org/licenses/by/4.0/).


