Article

The Challenges of Blood Sample Delivery via Drones in Urban Environment: A Feasibility Study through Specific Operation Risk Assessment Methodology

1
EuroUSC Italia, Via Daniele Manin, 53, 00185 Roma, Italy
2
Department of Mechanical and Aerospace Engineering, Sapienza University of Rome, via Eudossiana, 18, 00184 Rome, Italy
*
Author to whom correspondence should be addressed.
Drones 2024, 8(5), 210; https://doi.org/10.3390/drones8050210
Submission received: 2 April 2024 / Revised: 16 May 2024 / Accepted: 17 May 2024 / Published: 20 May 2024
(This article belongs to the Special Issue Flight Control and Collision Avoidance of UAVs)

Abstract

:
In recent years, Unmanned Aircraft System (UAS) usage in the medical sector as an alternative to traditional means of goods transport has grown significantly. Even though the reduced response time achieved with UASs can be lifesaving in critical situations, their usage must comply with technological constraints such as range, speed and capacity, while minimizing potential risks. In this paper, the feasibility of a drone operation dedicated to the transport of blood samples in an urban area is studied through a safety risk analysis. The assessment utilizes the Specific Operation Risk Assessment (SORA) framework, in line with current European regulations, and extends it to define flight trajectories with minimal risk. A case study in the Helsinki urban area is used as a reference, with an exemplary case of commercial drone transportation of blood samples between the Töölö and Malmi Hospitals. By leveraging the drone performance capabilities and minimizing the risk for people on the ground, this approach demonstrates that medical delivery using drones in densely populated urban environments remains challenging. Nonetheless, it argues that the proposed method can enhance risk awareness and support the planning of feasible operations.

1. Introduction

According to the Regulation (EU) 2018/1139, the notion of ‘unmanned aircraft’ is used to depict any aircraft operating or designed to operate autonomously or to be piloted remotely without a pilot on board [1]. However, these aircraft are commonly referred to as drones. The Commission Implementing Regulation (EU) 2019/947 [2] classifies UAS operations in three categories based on the level of the risk posed by the operation itself both for people on ground and for manned aircraft present in the operational area:
  • Open category: it includes UAS operations with a maximum take-off mass lower than 25 kg. The drone must be kept in VLOS (Visual Line Of Sight) at all times by the remote pilot, who must also maintain the unmanned aircraft at a safe distance from people and must not fly over crowds. It is also prohibited to carry dangerous goods or drop any material. The remote pilot must keep the drone at a maximum height of 120 m from the closest point of the surface of the earth. If there is an obstacle taller than 105 m, the drone can be flown at a height up to 15 m above it, after having received the authorization by the entity responsible of the obstacle. Since the Open category includes low-risk operations, it does not require any prior operational authorization nor an operational declaration by the UAS operator.
  • Specific category: authorization is required to operate in the Specific category. There are four different processes to obtain the operational authorization: the first one consists of the conduction of a risk assessment using the SORA methodology, which is then submitted to competent authority to obtain the authorization. On the other hand, if an operator intends to operate according to standard scenarios, it must send a declaration of compliance to the competent authority. In the third case, the operator could demonstrate compliance with the Pre-Defined Risk Assessments (PDRAs) in order to obtain the authorization from the competent authority. In the fourth case, the operator is exempt from obtaining an operational authorization, if it holds a LUC (Light UAS Operator Certificate) with the appropriate privileges.
  • Certified category: since it includes highest risk operations, the UAS shall be certified, the remote pilot shall be licensed, and the operator shall be approved by the competent authority. An operation falls into the Certified category if it is conducted over assemblies of people with a UAS with a dimension of more than 3 m, or if it involves the transport of people or the carriage of dangerous goods.
UASs can be an efficient alternative with respect to traditional road transportation means, since they are fast, cheap in the long run and are not subject to traffic jams [3], reducing accidents, pollution [4] and congestion. This is particularly valid for congested areas, with a minor impact in low-density cities. Moreover, they can be flown remotely or in an automatic mode controlled by a computer and they do not need a lot of space to take off and land [5,6]. For this reason, drones can also be used in the medical field for transport medical equipment, medicines, biological samples and organs [7]. Indeed, medical drones have the potential to improve lifesaving capabilities by reducing the time of delivery over long distances or to hard-to-reach remote areas [8]. They can also help to close health inequities, because people who would otherwise have difficulties accessing healthcare would have new means to receive medicines and lifesaving equipment [9,10]. However, the reason why drones are not widely adopted in healthcare are often related to regulatory and technological limitations, such as the communication and control of the flight, the temperature control and the effects of drone transport on the biological material [11]. Safety and security issues relate to the ability to avoid near misses, collisions and accidents as well as hijacking and espionage [12,13].
For what concerns the transport of blood, in particular, drones can be used for an efficient and fast transport in case of necessity [14,15]. The blood is stored at hospitals in a refrigerator, which preserves its properties. When there is a request, the UAS can fly to the hospital, load the blood units and fly to its destination to drop the package. Then, the UAS returns to its base to charge its batteries in order to be ready for the next flight. This method does not only guarantee the fast delivery of blood but it represents a way to reduce blood wastage too. Indeed, blood is a perishable material and has a short lifespan, while its demand has a relevant fluctuating trend and is difficult to predict [16].
The advantages of using drones to transport blood have been demonstrated by different studies, for example, the one conducted by Swiss Post in collaboration with Matternet between two clinics in Switzerland [17]. In Germany, a drone called Parcelocopter also delivered blood samples across the Rhine River in Bonn [18]. Another study of blood transport between the hospitals of Pondera and Volterra in Italy demonstrated the possibility to overcome road traffic in urban areas and facilitate the access to zones in which the communication routes are scarce [19]. The same results were obtained by a similar study in Montreal [20], in which it was demonstrated that transport of blood products with drones is significantly faster than ground delivery. Last but not least, drones have recently started being used to transport blood in remote areas [21] to reach people that have difficulties getting access to healthcare. For example, Zipline is a company that delivers blood in remote areas of Rwanda [16,22,23,24], and in Malaysia, drone transport of blood products is used also to improve maternal healthcare [25], helping women to recover from postpartum hemorrhages.
In Europe, the transport of blood samples is a drone operation that is likely to be classified in the abovementioned Specific category. If the blood is not tested before being transported, it is considered a Dangerous Good according to ICAO Doc 9284 [26] and the operation falls into the Certified category. However, the operation can be considered as part of the Specific Category if the samples are transported in a crash-resistant container which prevents the dispersal of biological material in case of a crash. To operate in this category, it is necessary to assess the risks related to the operation and demonstrate that this is sufficiently safe. In aviation, there are different methods to assess the risks connected to an operation and the SORA methodology is only one of them. However, to date, the SORA process is the only methodology approved by EASA and listed in the Commission Implementing Regulation (EU) 2019/947 [2] as the official method to assess the risks related to UAS operations. It qualitatively assesses the risks for people on the ground and the risks of mid-air collision with other aircraft, which are then combined and measured through the Specific Assurance and Integrity Level (SAIL), according to which the barriers to hazards are selected (i.e., Operational Safety Objectives (OSOs)) [27,28].
The SORA methodology has already been tested for drone operations in various field for research purposes [29] but also for particular operations such as aerial cinematography [30], emergency services [31] and airframe inspection in an airport, extending it also to multiple UAVs operations [32]. The main issue that was pointed out for this methodology is that the implementation process is time-consuming, due to its numerous steps and its iterative nature which requires an expert knowledge [29,31].
This article focuses on the transport of medical-related samples with the purpose of assessing the operational risks through the SORA methodology. The aim of this paper is to define and experiment a novel approach for determining the best trajectory based on a simple risk minimization logic, given a specific drone model. The logic is simply to ensure a complete understanding by the drone operator when planning for a mission. While in the literature other approaches can be found linked to technical constraints and battery capacity [33,34,35], this approach deals with the problem prioritizing the risk-based operational feasibility. The methodology proposed here has been instantiated in a use case referred to a medical operation in Finland, i.e., the transport of blood samples between two hospitals in the urban area of the city of Helsinki. This case has been selected as it offered reasonably reliable and precise data on dynamic population density, along with a number of different case scenarios (e.g., no-fly area, different UAS geographical zones, tall buildings) useful to test the proposed methodology.
The remainder of the paper is organized as follows: Section 2 describes the material and methods utilized for the risk assessment, focusing on the SORA methodology applied to the case study in the Helsinki urban area. In Section 3, the results are presented and analyzed, while they are further discussed and interpreted in Section 4. In particular, the feasibility of the blood transport in the Helsinki urban area is assessed and the effectiveness of the mitigations applied is evaluated. Finally, conclusions from this study are drawn in Section 5.

2. Materials and Methods

The Specific Operation Risk Assessment (SORA) methodology was developed by Joint Authorities on Rulemaking on Unmanned Systems (JARUS), proposing a methodology for the risk assessment to support the application for an authorization to operate a UAS within the “Specific” category, as envisaged by the Commission Implementing Regulation (EU) 2019/947 [2]. An updated version of SORA (SORA 2.5) has been developed and approved for publication in May 2024 by JARUS (SORA 2.5 will bring some significant changes with respect to SORA 2.0, even though the conceptual philosophy on which the SORA is based remains the same. The most important innovation is the introduction of a quantitative ground risk assessment methodology together with a simplification of the language and a clarification of some aspects.

2.1. Data Collection and Problem Definition

The first step of the present study refers to the collection of all relevant data and the accurate definition of the intended operation to properly set the scenario at hand.

2.1.1. Population Density Data Collection

For determining the ground risk, it is necessary to collect data about the dynamic population density in the area of interest. The database used for this research is Dataset Search [36], which includes the publication “A 24-hour dynamic population distribution dataset based on mobile phone data form Helsinki Metropolitan Area, Finland” [37]. This database contains three datasets: one for the workdays (Monday–Friday), the other for Saturdays and the last one for Sundays. The time interval considered covers all the 24 h of the day with data of population density provided every hour. The latter are based on aggregated mobile phone data and are assigned to square statistical grid cells with dimensions of 250 m by 250 m. Indeed, each cell is identified by an ID number with the respective 4 coordinates of the vertices of the square.

2.1.2. Choice of the Operation Sites

The next step consists of finding the sites between which the operation takes place. The information about the transfusion centers in Helsinki can be found in the “HUS” website [38], the largest provider of healthcare in Finland. The two transfusion centers selected for this study are located at Malmi Hospital (60°15′15.39″ N 24°59′58.76″ E) and at Töölö Hospital (60°10′51.59″ N 24°55′20.92″ E), since their location allows to study UAS flights in urban environment. The blood samples are collected at Töölö Hospital and are sent to Malmi Hospital or vice versa.
Using Google Earth [39], it is possible to visualize their location (Figure 1) and calculate their distance: 9.16 km (as the crow flies).

2.1.3. Definition of Operational Time

The opening hours of the laboratories are during the weekdays, so the dynamic density data taken in consideration are the ones related to the workdays.

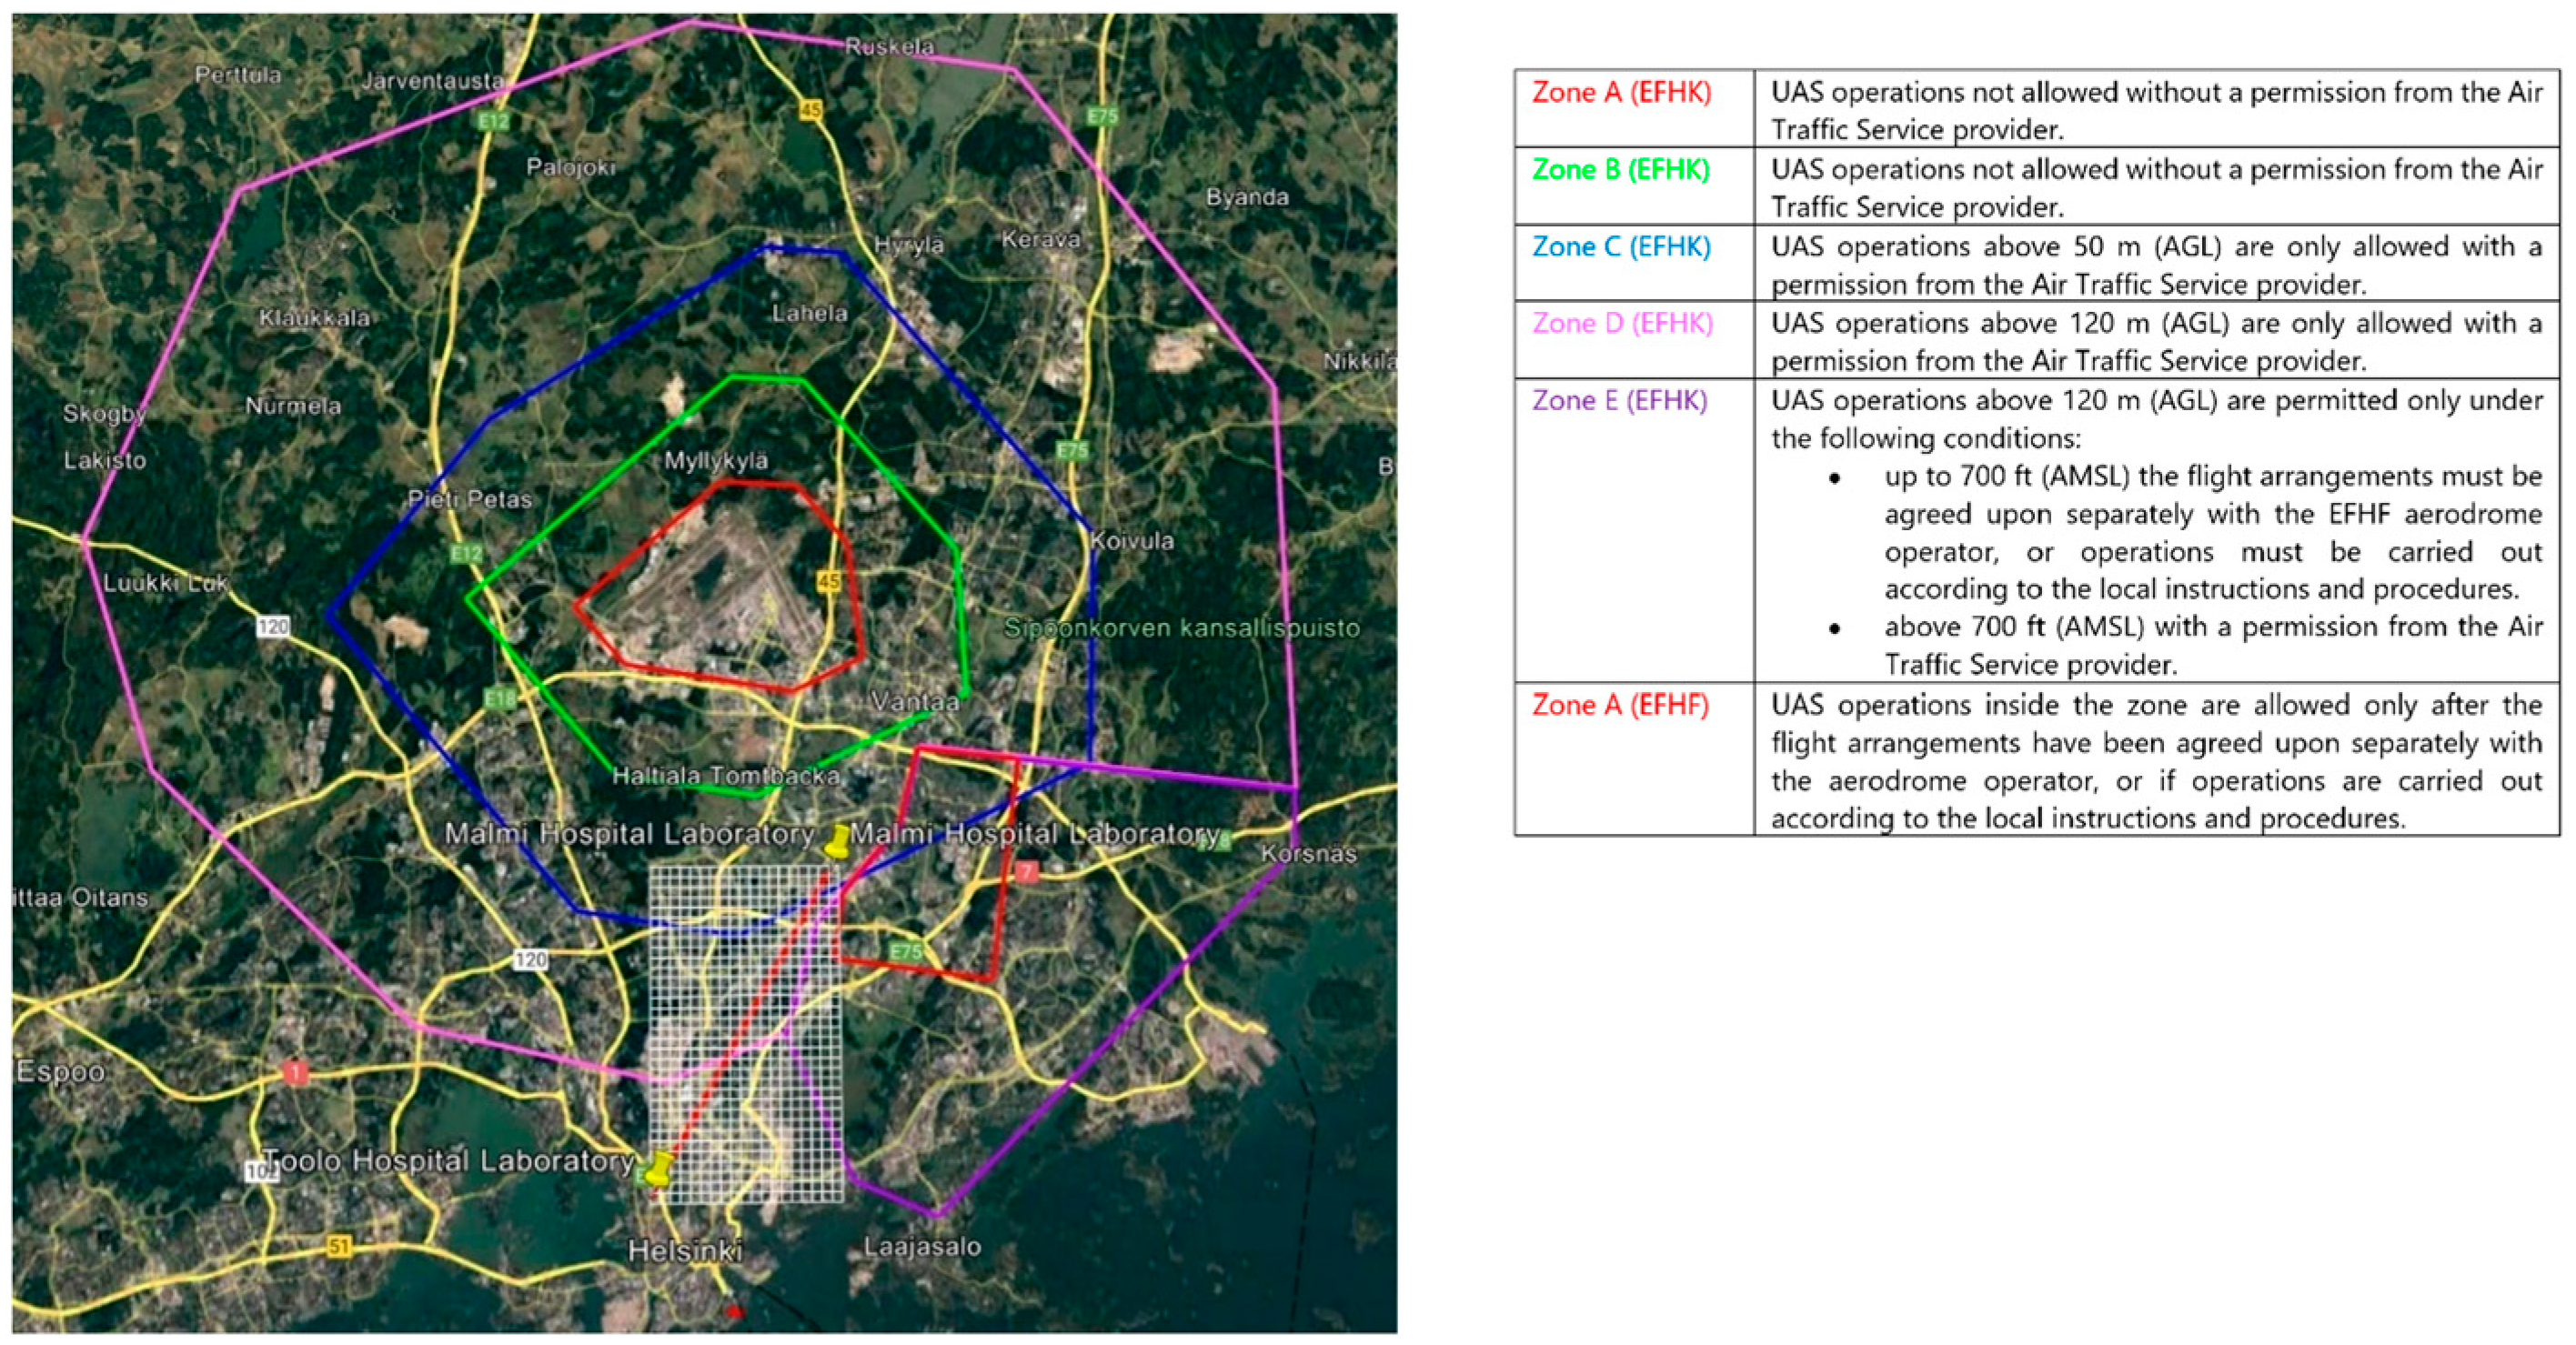
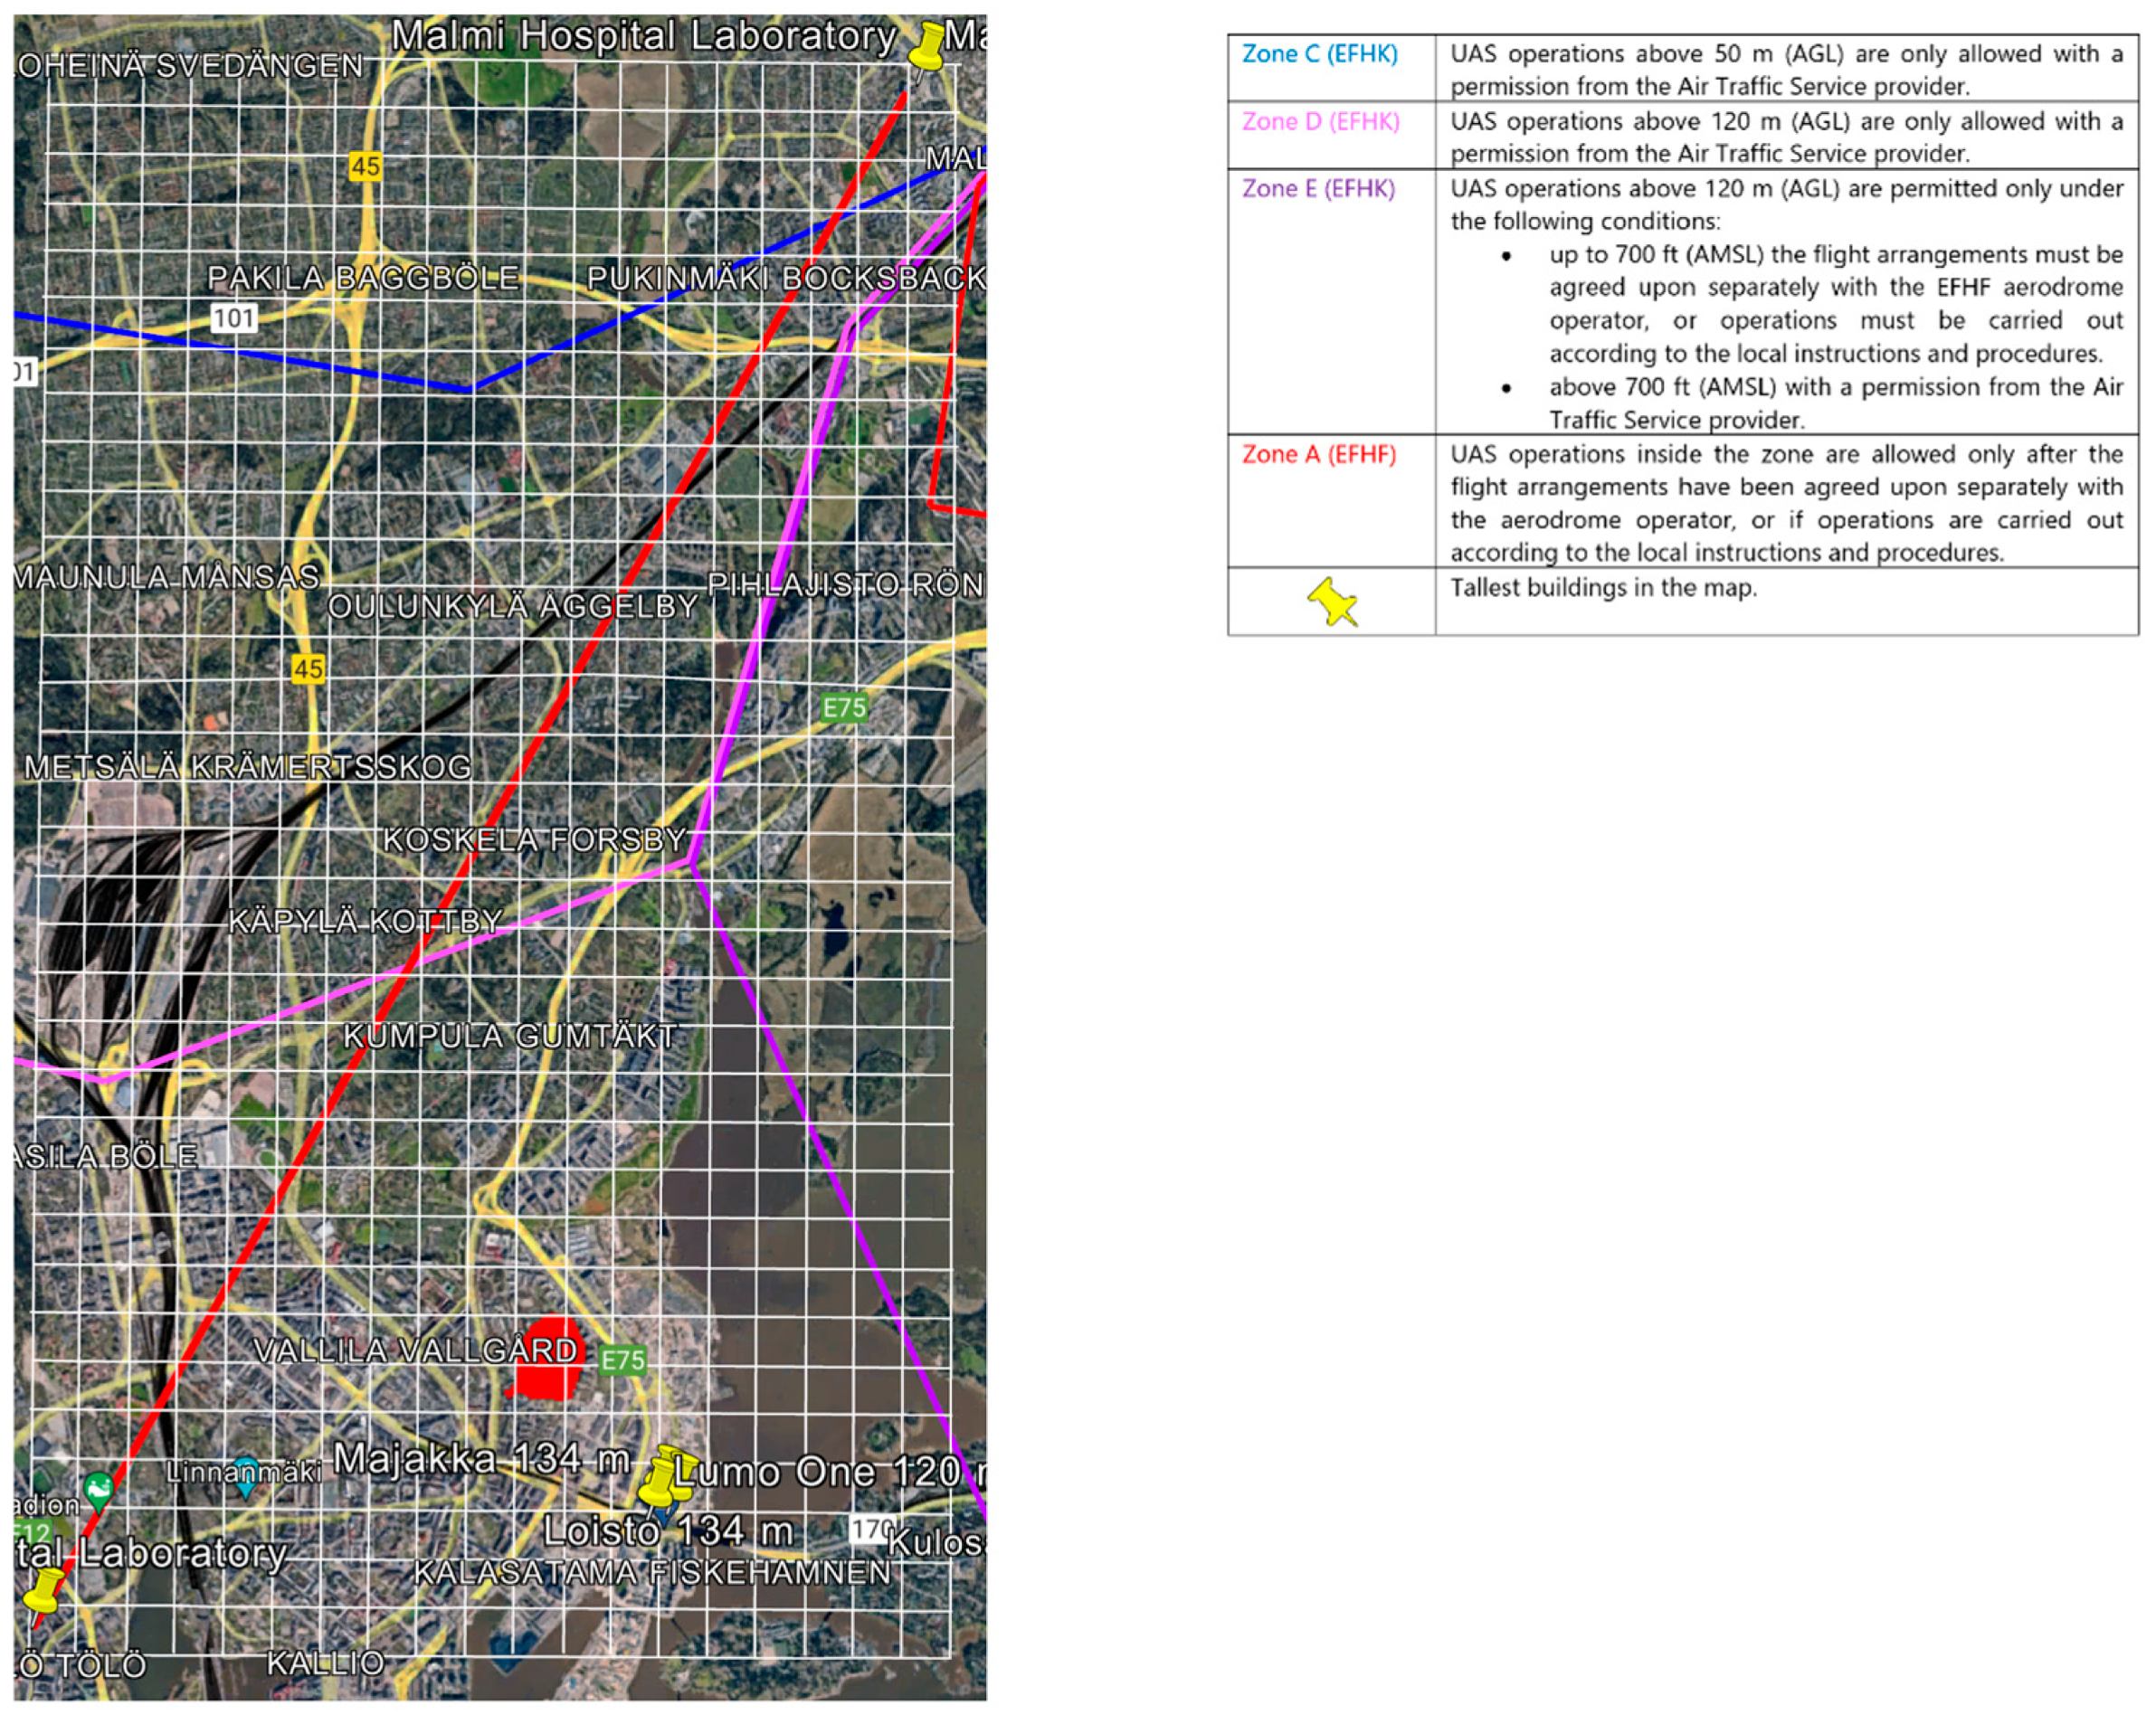
2.1.4. UAS Geographical Zones

The UAS geographical zones that interfere with the area of operations are the restricted ones around the two airports of Helsinki (Helsinki-Vantaan Airport and Helsinki-Malmi Airport). The Helsinki-Vantaan airport is identified with the ICAO code EFHK, whereas the Helsinki-Malmi airport is identified with the code EFHF. In particular, around the Helsinki-Vantaan airport, there are 5 areas classified using letters from A to E in which the restrictions reported in [40,41] and summarized in Figure 2 apply. Therefore, the UAS geographical zones that enter the grid considered for the intended operations are EFHK zone C, EFHK zone D, EFHK zone E and EFHF zone A.
Moreover, there are also temporary restricted zones that must be considered. In particular, the zone above the Helsinki Vankila (Helsinki Prison) is a prohibited zone where drones can fly only with a special permit, and it is activated daily 24 h (Figure 3) [41].
Since this study focuses primarily on the risks posed by the operation for people on ground, it is assumed that a flight corridor (a portion of segregated airspace in which only the UASs involved in this operation are present) is defined.

2.1.5. Flight Height

In order to define the optimal height of the operations, the first step consists of identifying the tallest buildings in Helsinki urban area and locating them on the map (Figure 4) [42].
As shown by the yellow thumbtacks, the tallest buildings are located in the right-downside part of the map and reach a maximum altitude of 134 m above ground level (AGL). The maximum altitude chosen for the drone route is 100 m AGL; this is due to the fact that the flight takes place in an urban area and it is therefore better to fly at a high altitude to avoid obstacles, but remaining under 500 ft (this value was chosen by various stakeholder under the assumption that manned aviation does not normally operate below 500 ft AGL). For this reason, the cells in which there are buildings higher than 100 m will be avoided.

2.1.6. Selection of the Drone

For determining the best drone to use for the transport of the blood samples, the drones mainly utilized in the literature have been analyzed.
The DJI drones were excluded because they are usually utilized for video footage, and for this reason, they are not designed for transport and dropping goods. On the other hand, Hercules company produces Hercules 2, Hercules 10 and Hercules 20. The latter two can be possible candidates for this choice [43,44], whereas Hercules 2 was excluded because its flight time is too short, around 14 min. Also, the Wingcopter 178 and Wingcopter 198 seemed possible candidates from this initial analysis [45,46]. T-motor drones M690A, M1000, M1200, and M1500 were left out of the research due to their limited maximum range of 10 km [47]. For the same reason, the new Wing drone was also excluded [48].
After having compared all the technical characteristics, it has been concluded that the most suitable drone for the intended operation is the most recent (2021) and best performing one, namely Wingcopter 198, which has the best performance characteristics between the drones analyzed. It is an electric tilt-rotor with vertical take-off and landing (eVTOL) capabilities which can fly in two modes: multicopter mode and fixed-wing mode. The propulsion system consists of 8 rotors for redundancy during multicopter flight, 4 of which are tiltable for redundancy during fixed-wing flight. The Wingcopter 198 can carry a maximum payload of 5 kg and its range and time depends on the payload transported and the type of mission (direct one-way flight, or flight with a slow drop or intermediate landing). For its technical specifications, please refer to [46].

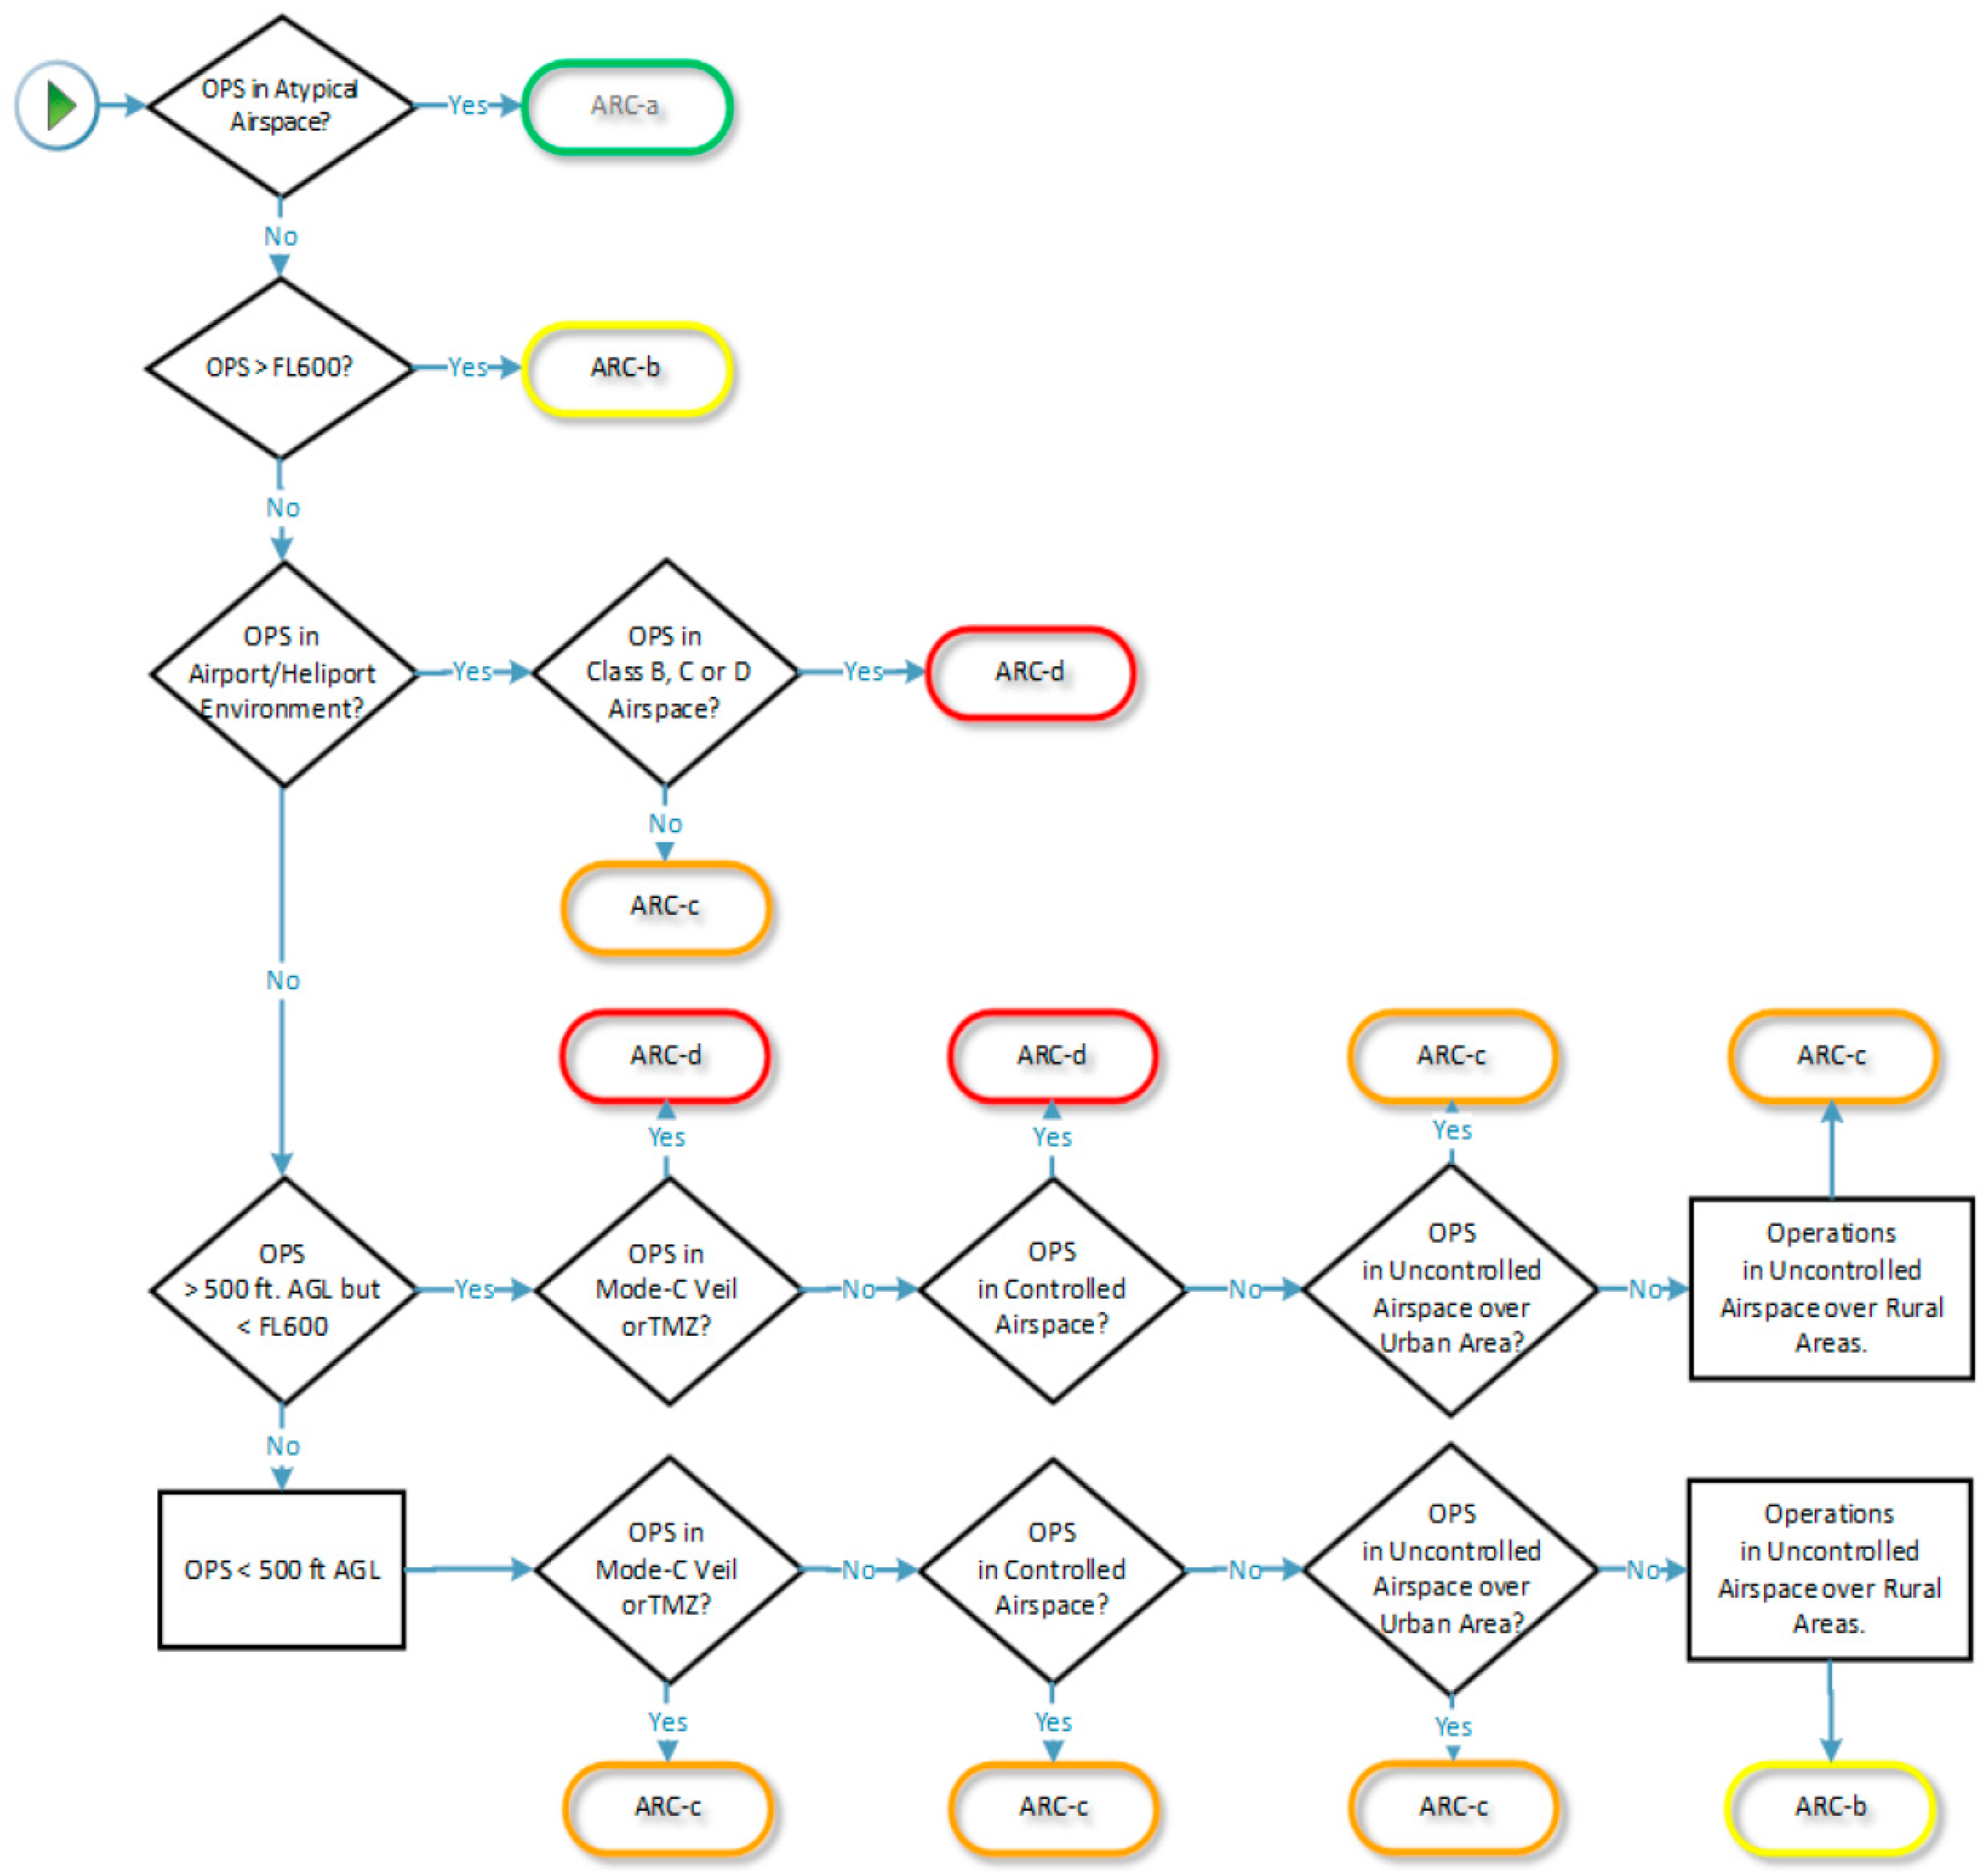
2.2. SORA Methodology Application and Simplified Risk-Based Trajectory Identification

The SORA methodology is used to assess the risks of the blood transport in the Helsinki urban aera, which will be enhanced by dynamic risk modeling. The general idea is to draw cells of 250 × 250 m containing the population density data for each hour over the operations area. Then, a routine designed in MatLab [49] is utilized to determine the flight trajectory by choosing the cells with the minimum population density or Ground Risk Class (GRC). The algorithm starts from the starting cell, analyses the nearby cells and chooses the one with the minimum value of population density or minimum GRC. Afterwards, the same evaluation is iterated for the nearby cells of the cell initially chosen. The cells which are located behind the cell chosen, in opposite direction with respect to the delivery point, are not considered. Thus, the cells evaluated in the optimization are the ones reported in Figure 5.
In the cases in which the minimum value belongs to more than one cell, the cells that are in the direction of the ending point are chosen. For example, if all the cells have the same value, cell C is chosen, or if A and B have the same value, B is chosen, since the operative grid has a higher number of rows than columns. Similarly, if D and E have the same values, cell D is chosen. The different cases are reported in Table 1. Once the trajectory is established, its length is calculated and compared with the maximum range of the drone, given by the manufacturer, to ensure the feasibility of the operation.
Finally, the GRC of each the cell in which the drone will fly is calculated and compared with the overall risk of the trajectory.

3. Results

The analysis focuses on two cases: the straight-line trajectory and the risk-driven trajectory. The results are presented in this section and then their implications are further discussed in Section 4.

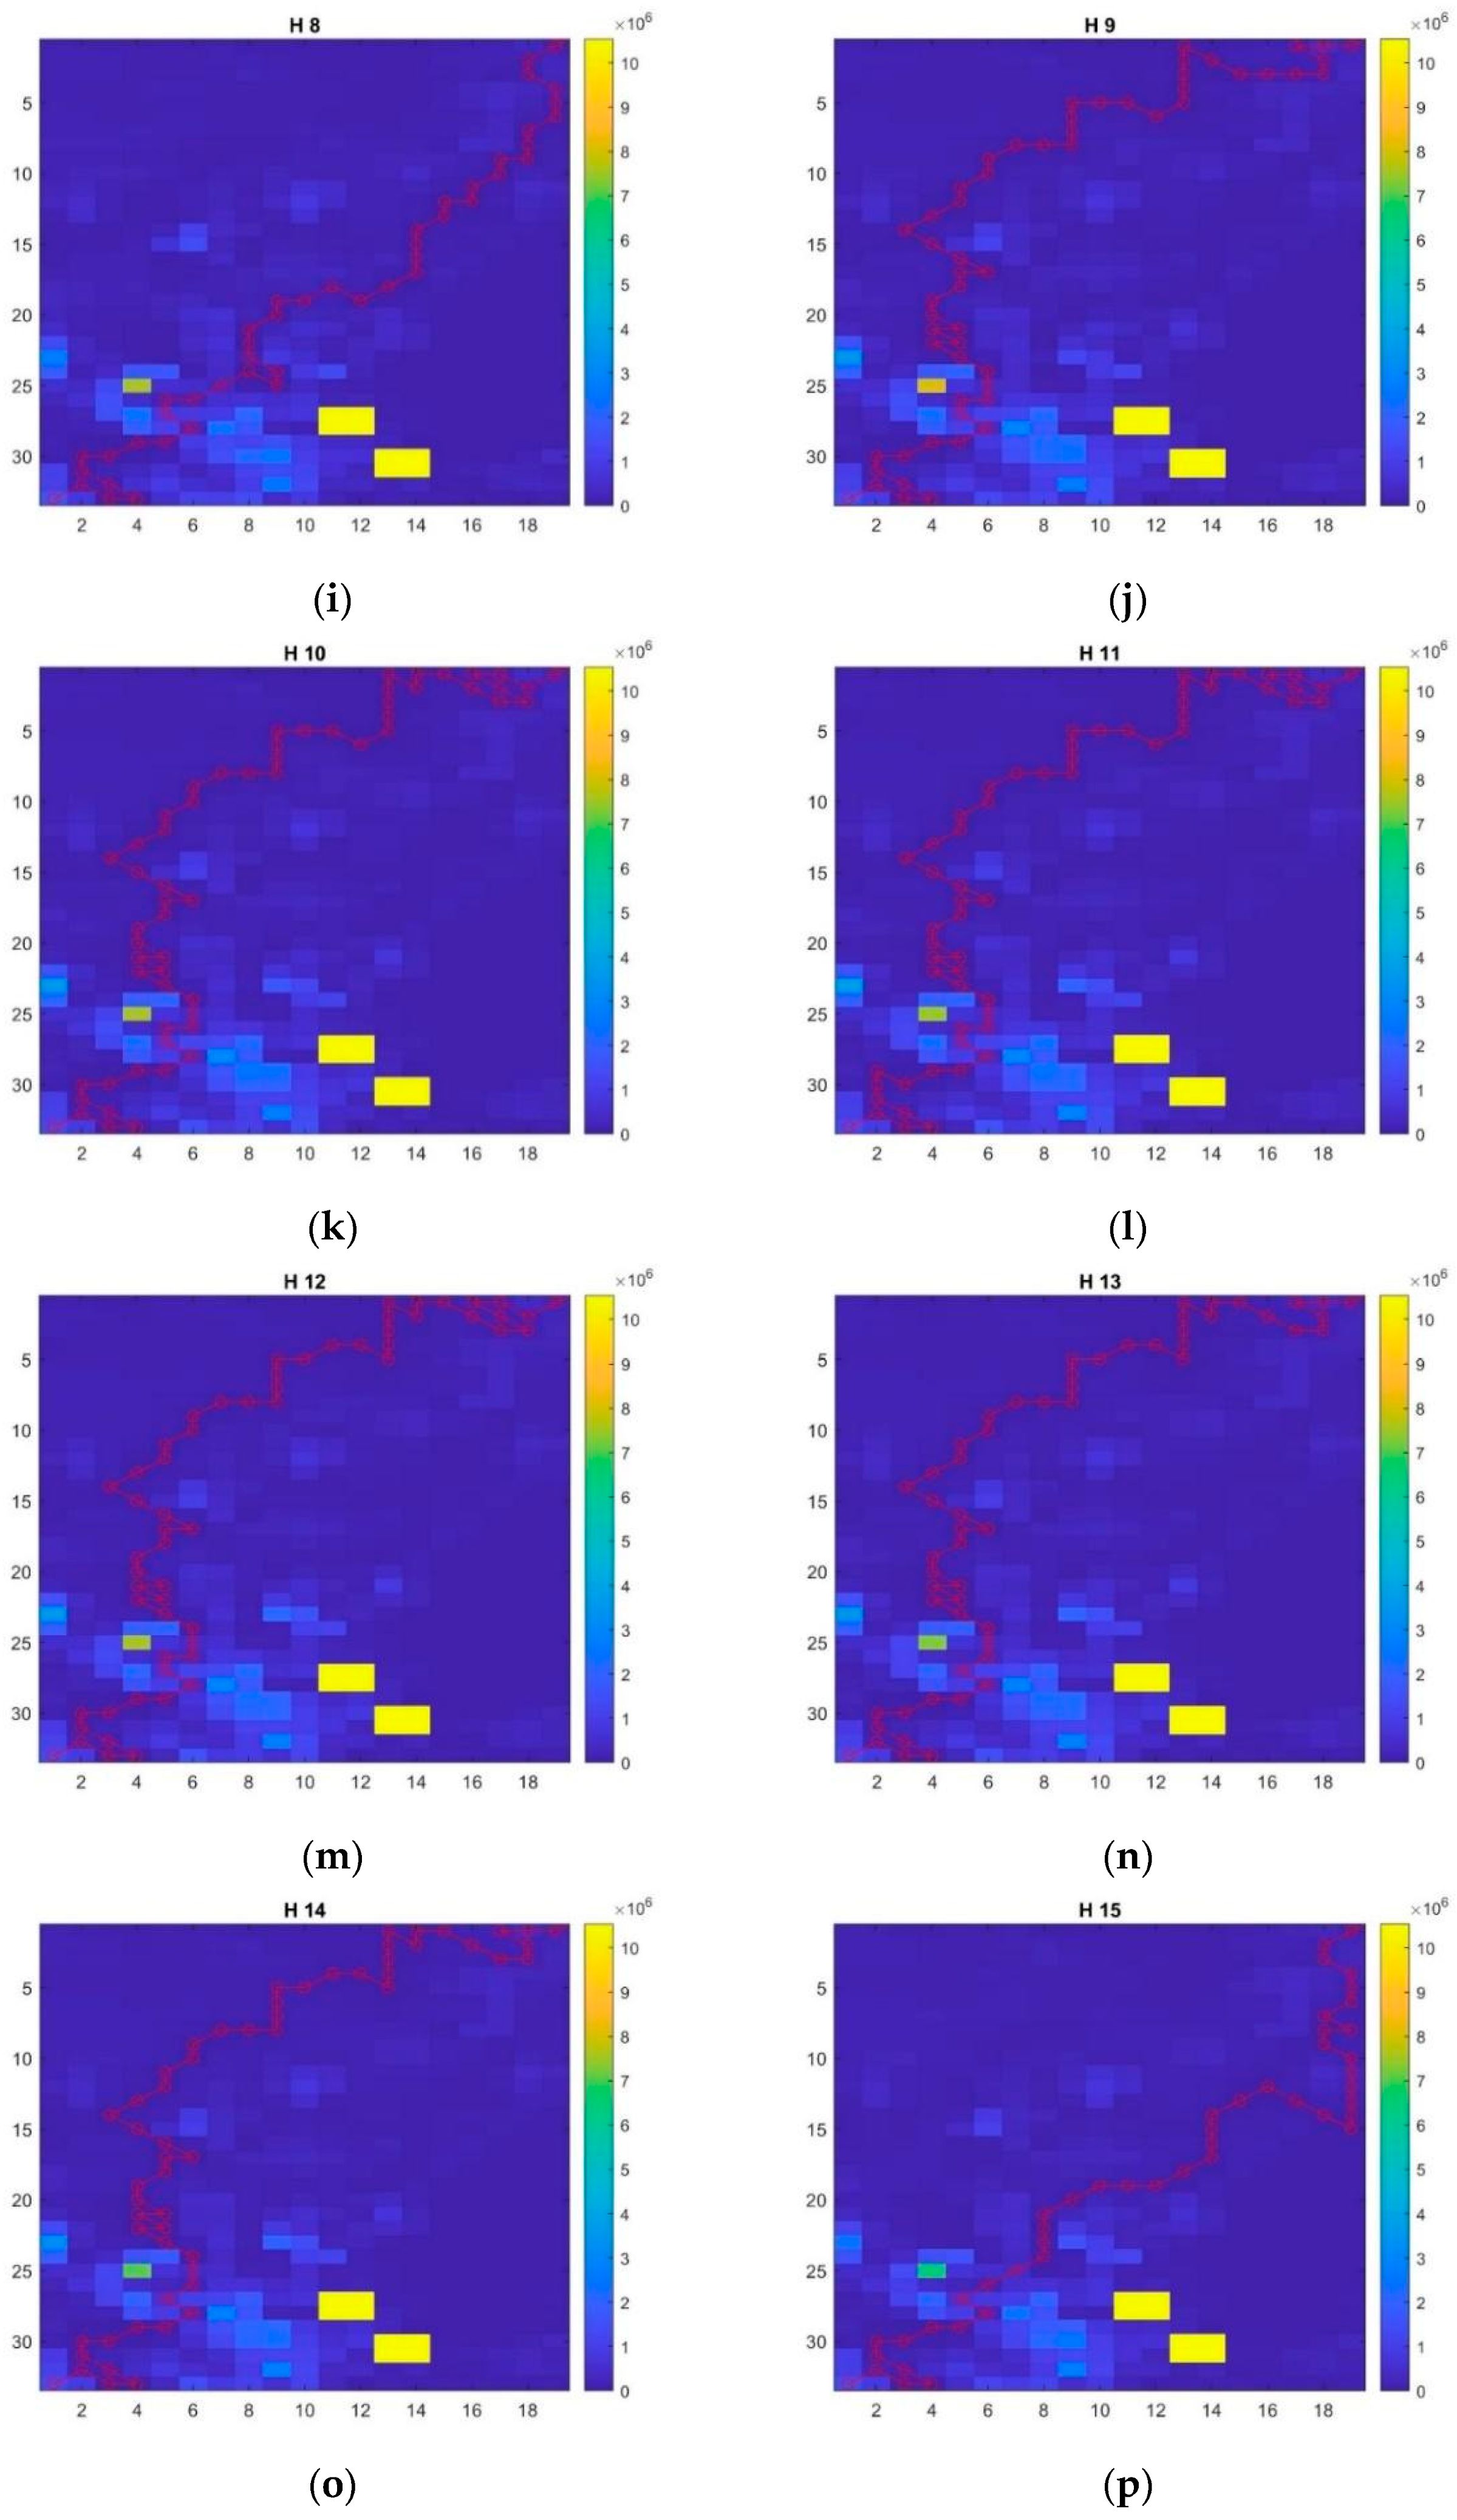
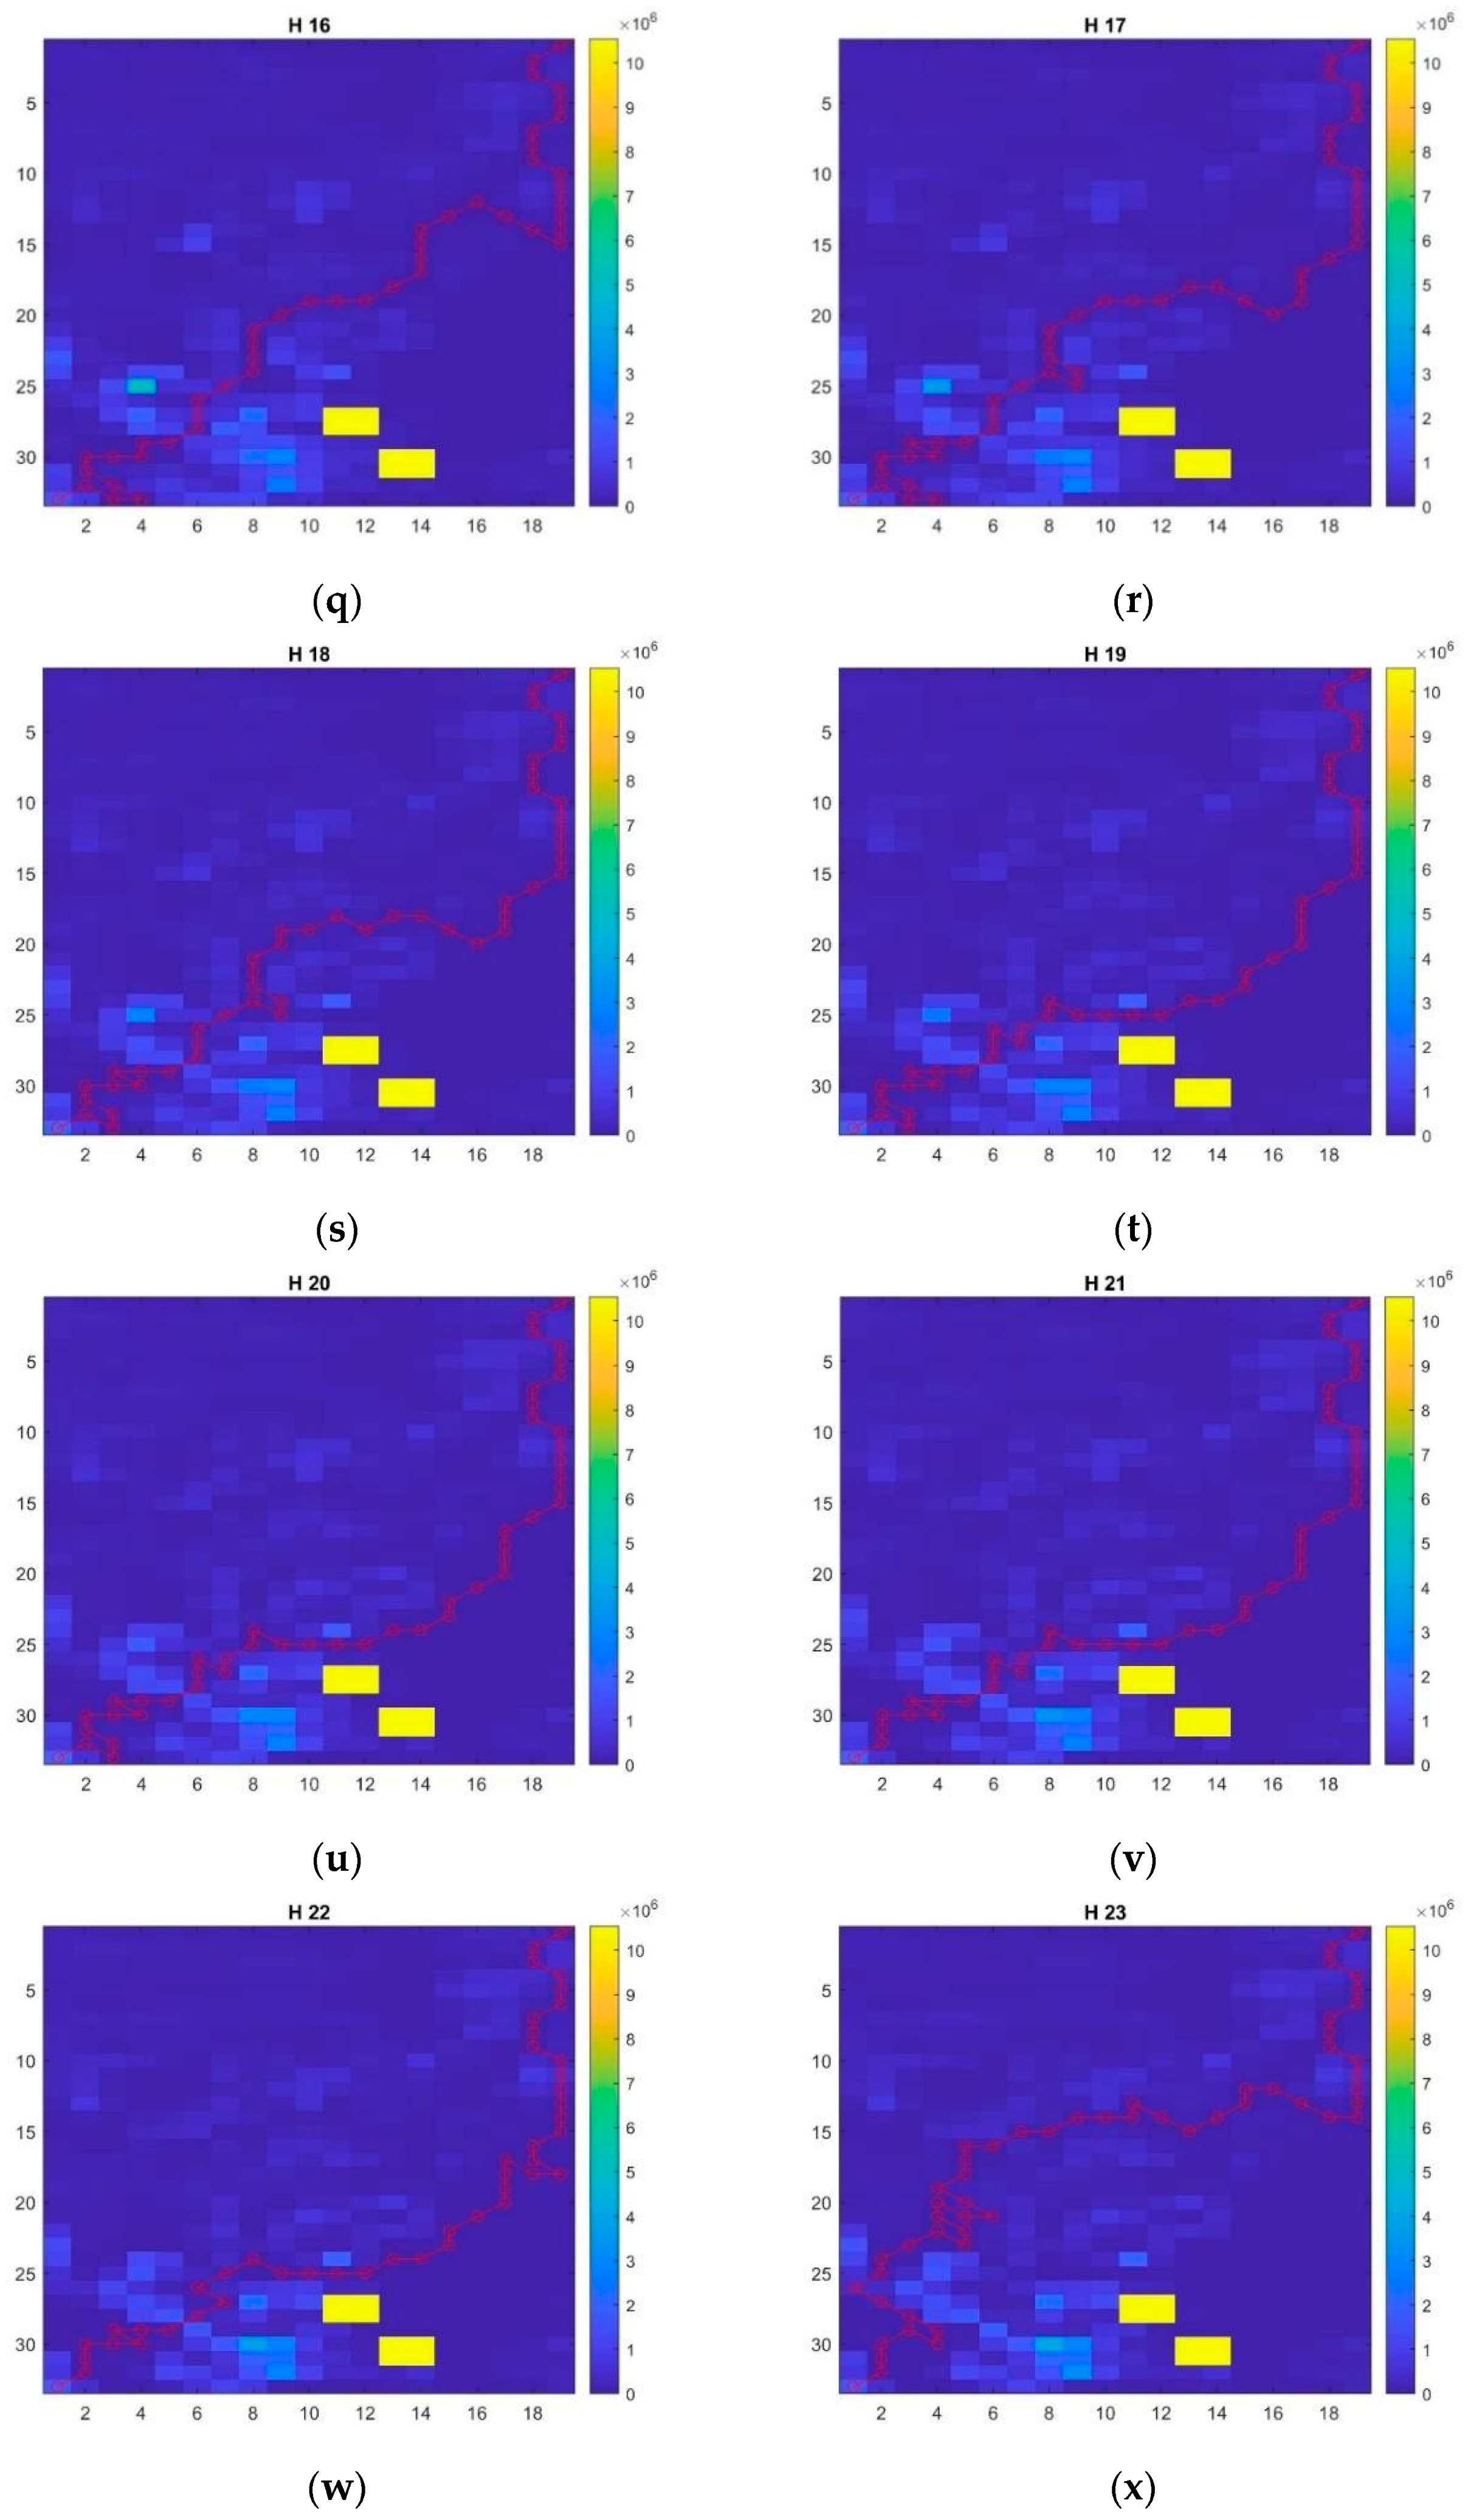
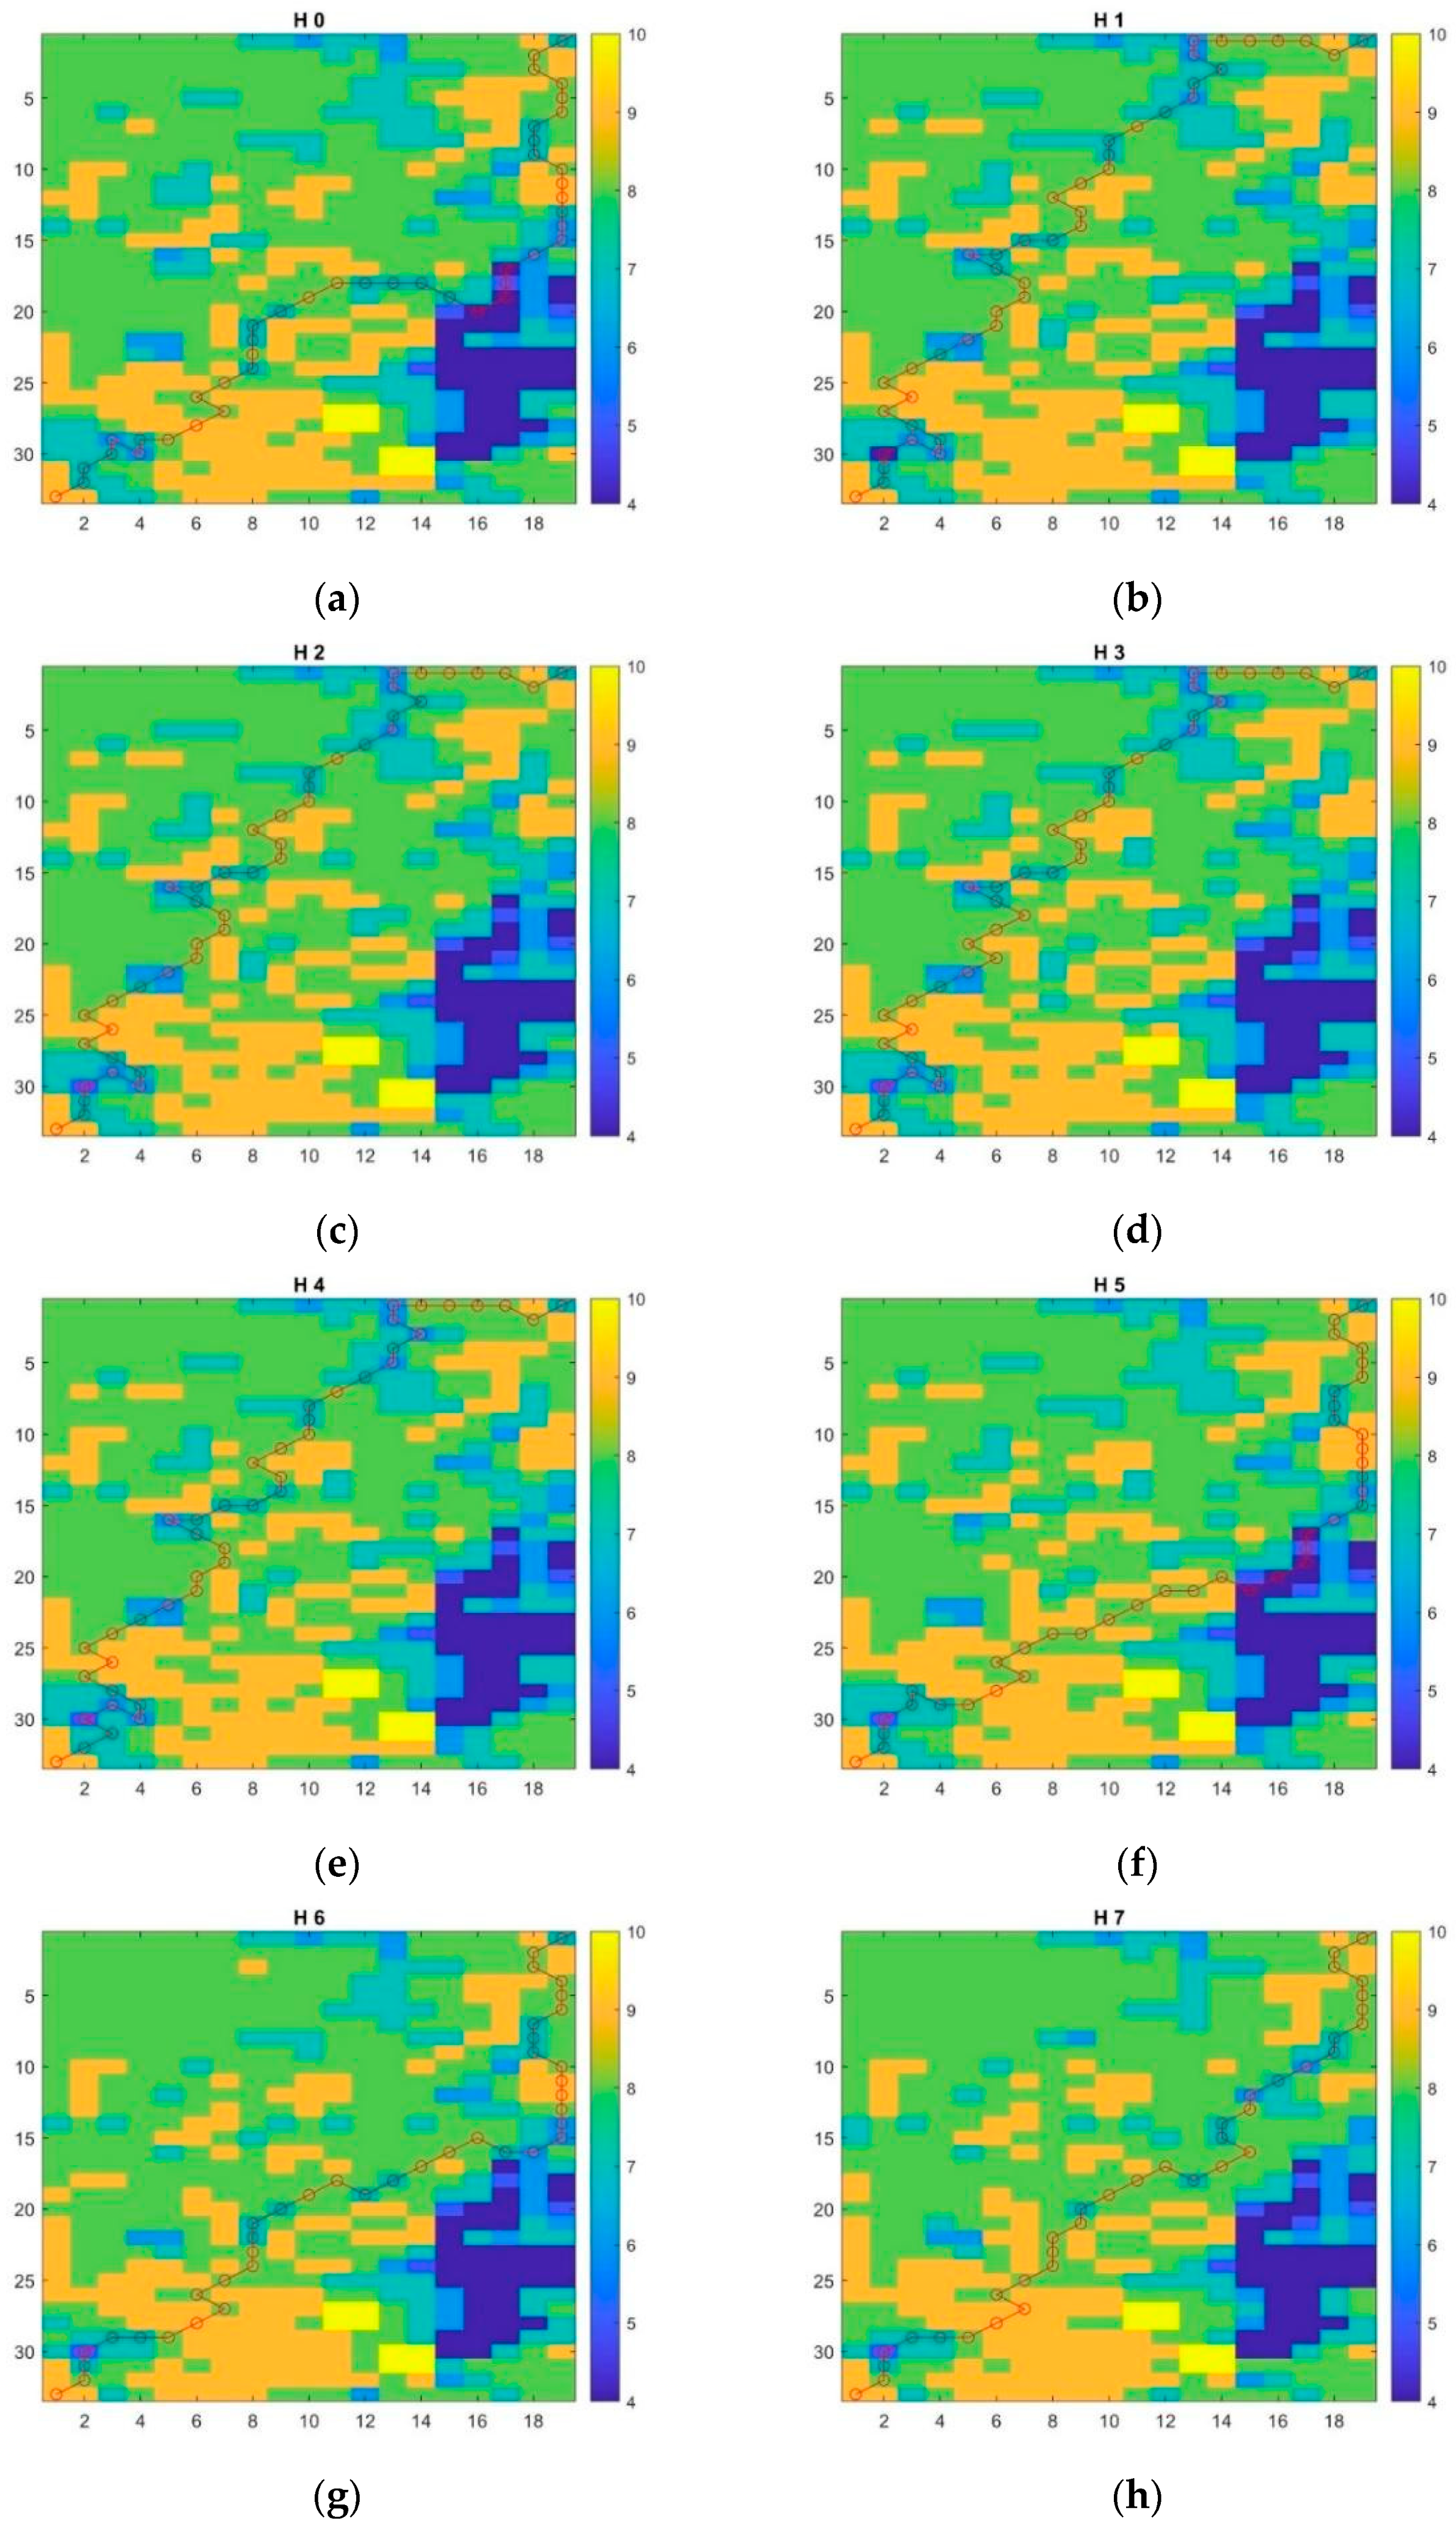
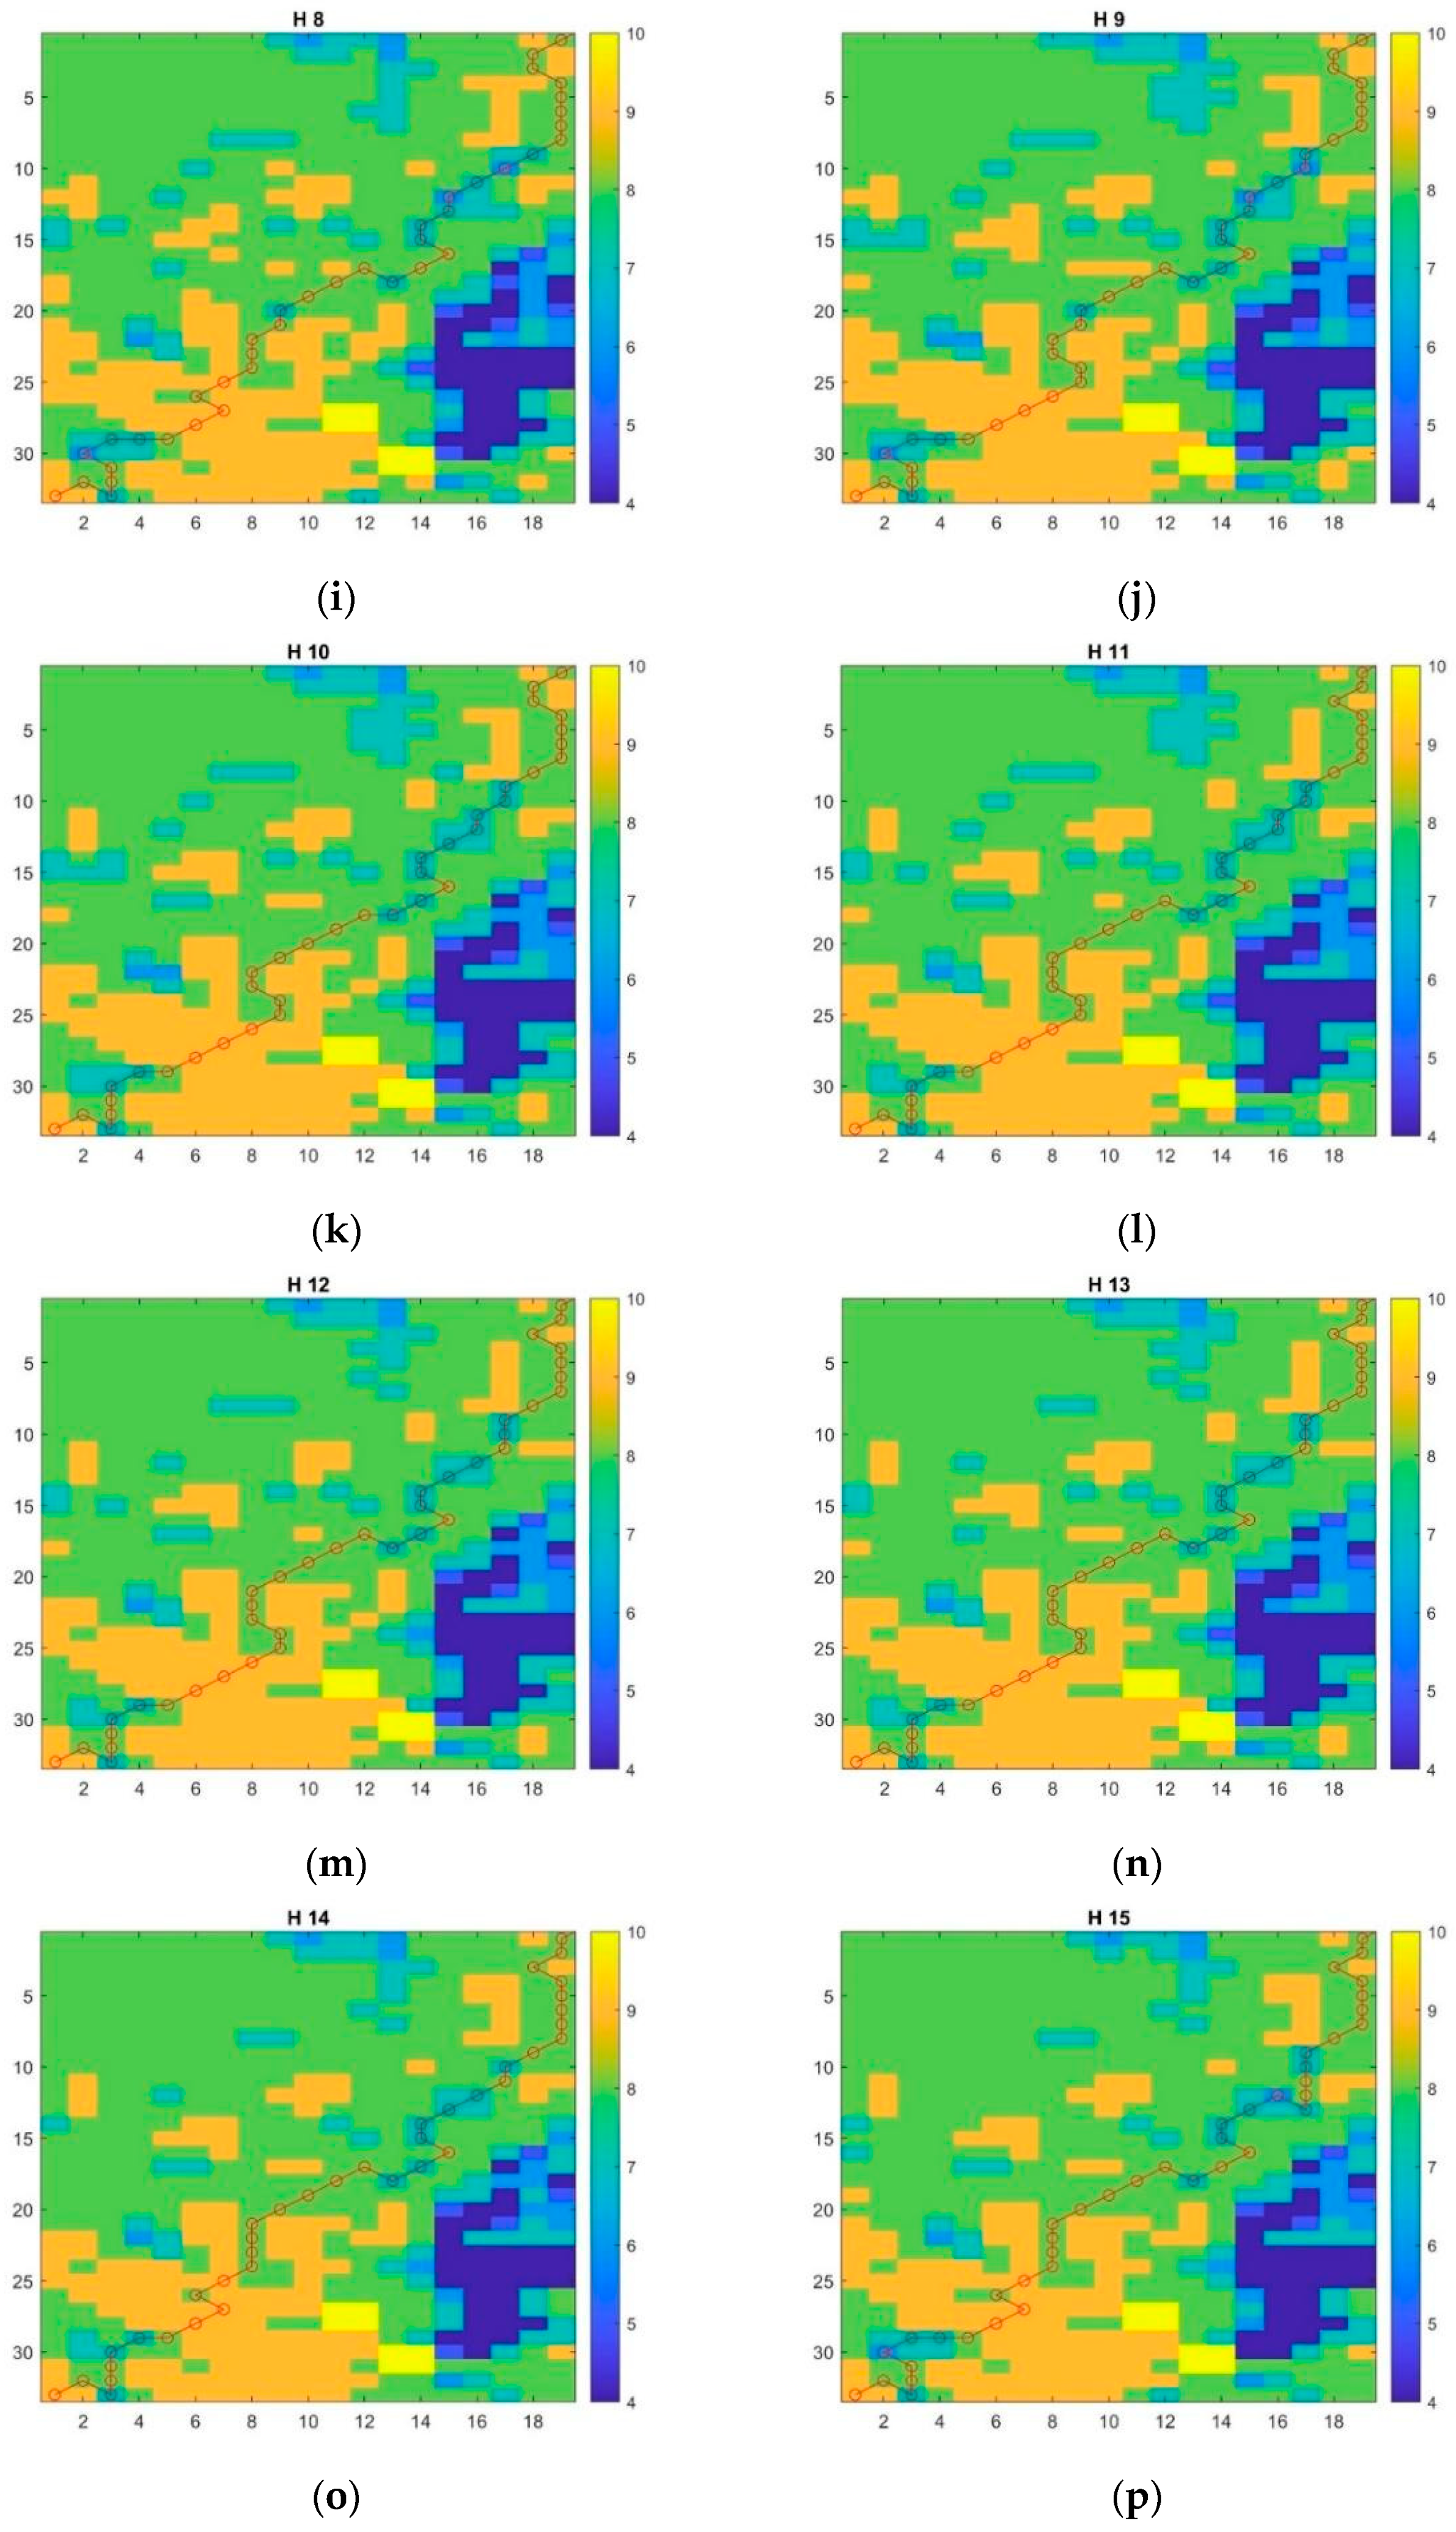
3.1. Straight-Line Trajectory

The first case studied is the one in which the drone travels on a straight-line trajectory between the two hospitals, because it is considered the most convenient in terms of time of delivery and drone performance. In this paragraph, the results of each step of the SORA methodology are applied to the straight-line trajectory UAS operation.
Step #0 Pre-application evaluation [50].
Before starting the SORA process, the aspects in Table 2 should be verified.
Since none of the above cases is verified, the SORA process should be applied.
Step #1 Documentation of the proposed operation(s) [50].
The first step in the SORA process has the aim of collecting the relevant technical, operational and system information that will be utilized in the analysis. For simplicity, not all the information requested in the Annex A of the SORA [50] is presented in this analysis. This is also due to the fact that some information is not published by the manufacturer of the drone.
From a more technical perspective, the intended operation consists of a transport of blood samples between two hospitals (Malmi Hospital and Töölö Hospital in Helsinki) in BVLOS at an altitude of 100 m, with a dropping phase in which the samples are delivered to the final destination. Blood samples are considered dangerous goods. Nevertheless, it is assumed that they are stored in a crash-resistant capsule that prevents the dispersal of the content: in this way, they are not subject to the regulations applied for dangerous goods. As per the most common approach in operations, the prevailing crash-resistant container utilized by drone operators in this area is a metal box housing a plastic insert lined with a specialized material designed to solidify blood in case of spillage. The total payload transported for the intended operation is assumed to be equal to 1 kg plus the weight of the parachute. Moreover, for the intended operation, it is assumed that the drone is set in such a way that its maximum cruise speed is 30 m/s, even if it can reach 40 m/s according to the manufacturer manual.
The area in which the operation takes place is accurately defined in Step #2 and Step #4 of the SORA process. It is assumed that the weather conditions allow the operations to take place in line with the operational limitations described in the manufacturer manual.
The flight consists of three phases: the take-off from the Malmi Hospital, the cruise, the dropping of the blood samples at Töölö Hospital and then the flight back to the starting point that includes the landing of the drone.
The remote pilot uploads the route on the onboard computer in such a way that the drone flies automatically. Nevertheless, there is always a remote pilot that monitors the operation and can take control of the drone in emergency situations. The drone also has some automatic systems for collision avoidance, particular systems that can keep the drone on its planned route, a return-to-home function and a Flight Termination System in case of an imminent emergency.
The best location chosen for take-off, dropping and landing is the rooftop of both the hospitals, since it is a wide and flat zone particularly suitable for drones. Moreover, the rooftop is a zone in which only people involved in operations are allowed.
Before take-off, a crew briefing, and a drone check must be conducted. A general visual inspection of the drone is important to verify that all the parts are installed correctly and that they do not present any damage, but most importantly, the loading of the payload must be accurately checked. Then, the operativity of all the systems must be controlled, as well as the connectivity between the ground control station and the UA, and the Flight Termination System. The remote pilot must check that all the electrical and avionics systems are functioning correctly and the flight control responds to the inputs. Also, the mechanism of the payload release system must be checked after the assembly. Similarly, another check of the drone structure must be performed in the post-flight phase to immediately discover the presence of any damage and report it according to the operator occurrence reporting system.
Step #2 Determination of the Intrinsic UAS Ground Risk Class (GRC) [50].
According to the SORA methodology, the area at risk is defined as:
A r e a   a t   r i s k = F l i g h t   G e o g r a p h y + C o n t i n g e n c y   V o l u m e + G r o u n d   R i s k   B u f f e r
The Flight Geography (in orange in Figure 6) is determined by considering the total system error (TSE) both in the horizontal and vertical dimension. The TSE is defined as the sum of path definition error (PDE), flight technical error (FTE) and navigation system error (NSE). The path definition error (PDE) represents the divergence from the intended path, while the flight technical error (FTE) involves the capability of the remote pilot or autopilot to stay on the designated path or track, encompassing any display discrepancies. The navigation system error (NSE) is defined as the difference between the drone’s calculated position and its true position; it depends on the performances of the navigation tools equipped on the drone. A reasonable value of the total system error is 20 m, taking into account the instrumental errors [51].
The Contingency Volume (in yellow in Figure 6) can be determined by multiplying the maximum cruise speed of the drone (30 m/s) by the time necessary for the drone to activate the return-to-home function, assumed as 1 s.
C o n t i n g e n c y   V o l u m e = s p e e d × t i m e   o f   R T H   a c t i v a t i o n = 30   m / s × 1   s = 30   m
The Ground Risk Buffer (in light blue in Figure 6) can be calculated as the sum of two distances D1 and D2. Specifically, D1 is the distance traveled by the drone during the pilot reaction time and can be calculated as the maximum cruise speed multiplied by the time of reaction (3 s). D2 can be calculated as the projection on the ground of a glide trajectory with a 9-degree incidence angle [52].
D 1 = m a x . c r u i s e   s p e e d × t i m e   o f   r e a c t i o n = 30   m / s × 3   s = 90   m
D 2 = h × c o s   c o s   9 °   s i n   s i n   9 °   = 100   m × c o s   c o s   9 °   s i n   s i n   9 °   = 631   m
D = D 1 + D 2 = 90   m + 631   m = 721   m
For the calculation of the intrinsic Ground Risk Class, the following data are taken into account: the max UA characteristic dimension equal to 1.98 m (width), the maximum cruise speed (30 m/s) in fixed-wing mode. In the dynamic population density file, data are expressed as a percentage proportional distribution of the total population in the study area. By multiplying the total population (population of Helsinki in 2018 was set to 658,864 ppl [53]) with the proportional value of each cell of the dataset and dividing by 100, the number of people in each cell can be determined. These values are valid for cells whose size is 250 × 250 m, and thus, they must be transformed into people/km2.
Then, the intrinsic Ground Risk Class (iGRC) can be determined according to Table 3; the results are represented in Table 4.
Step #3 Final GRC determination [50].
To reduce the GRC, some mitigations can be applied according to Annex B of the SORA methodology [50]. The philosophy for determining the level of robustness is conservative, which means that the level of robustness is the lowest one between assurance and integrity. There are some criteria for which the requirements for the level of integrity and assurance are the same; these cases are indicated in Table 5 as L/M/H.
Having applied M1(A) mitigation at a low level of robustness and M2 mitigation at a medium level of robustness, the iGRC can be reduced by 2 points, according to Table 6.
Step #4 Determination of the Initial Air Risk Class (ARC) [50].
Since this study is focused primarily on the feasibility of the operation based on the ground risk, for simplicity, an airspace corridor reserved for this particular operation is defined by the Air Traffic Service Provider (ATSP). Given that the ATSP is aware that drone operations take place in the corridor, they can actively give instructions to manned aviation pilots to avoid this segregated airspace. Therefore, this zone can be considered as an atypical airspace because it is quite impossible to find manned aircraft.
The corresponding value of ARC for the atypical airspace can be determined using the diagram in Figure 7 and it corresponds to ARC-a.
Step #5 Application of strategic mitigations to determine the residual ARC [50].
An operation that takes place in an atypical airspace (ARC-a) does not need any additional mitigation.
Step #6 Tactical Mitigation Performance Requirement (TMPR) and robustness levels [50].
Since the ARC is “a”, no tactical mitigations are required. In conclusion, the residual ARC remains ARC-a.
Step #7 SAIL determination [50].
Having established the Final GRC and Residual ARC, it is possible to derive the SAIL according to the following Table (Table 7):
The results are reported in Table 8.
Step #8 Identification of containment requirements [50].
The Adjacent Area and Adjacent Airspace containment requirements have been identified; however, since they are not relevant for this discussion, they are omitted for simplicity.
Step #9 Identification of Operational Safety Objectives (OSO) [50].
According to the SAIL obtained, the respective OSOs that the operator must fulfill can be obtained from [50] (cf. Table 10 in [50]). It can be noticed that most of the requirements are high and only some of them Medium. After having analyzed the detailed description of each OSOs present in Annex E [50], it can be concluded that a SAIL of IV or V is too high because it entails too many stringent requirements that the operator and the manufacturer cannot achieve easily, or the cost of complying with these requirements is impressive.

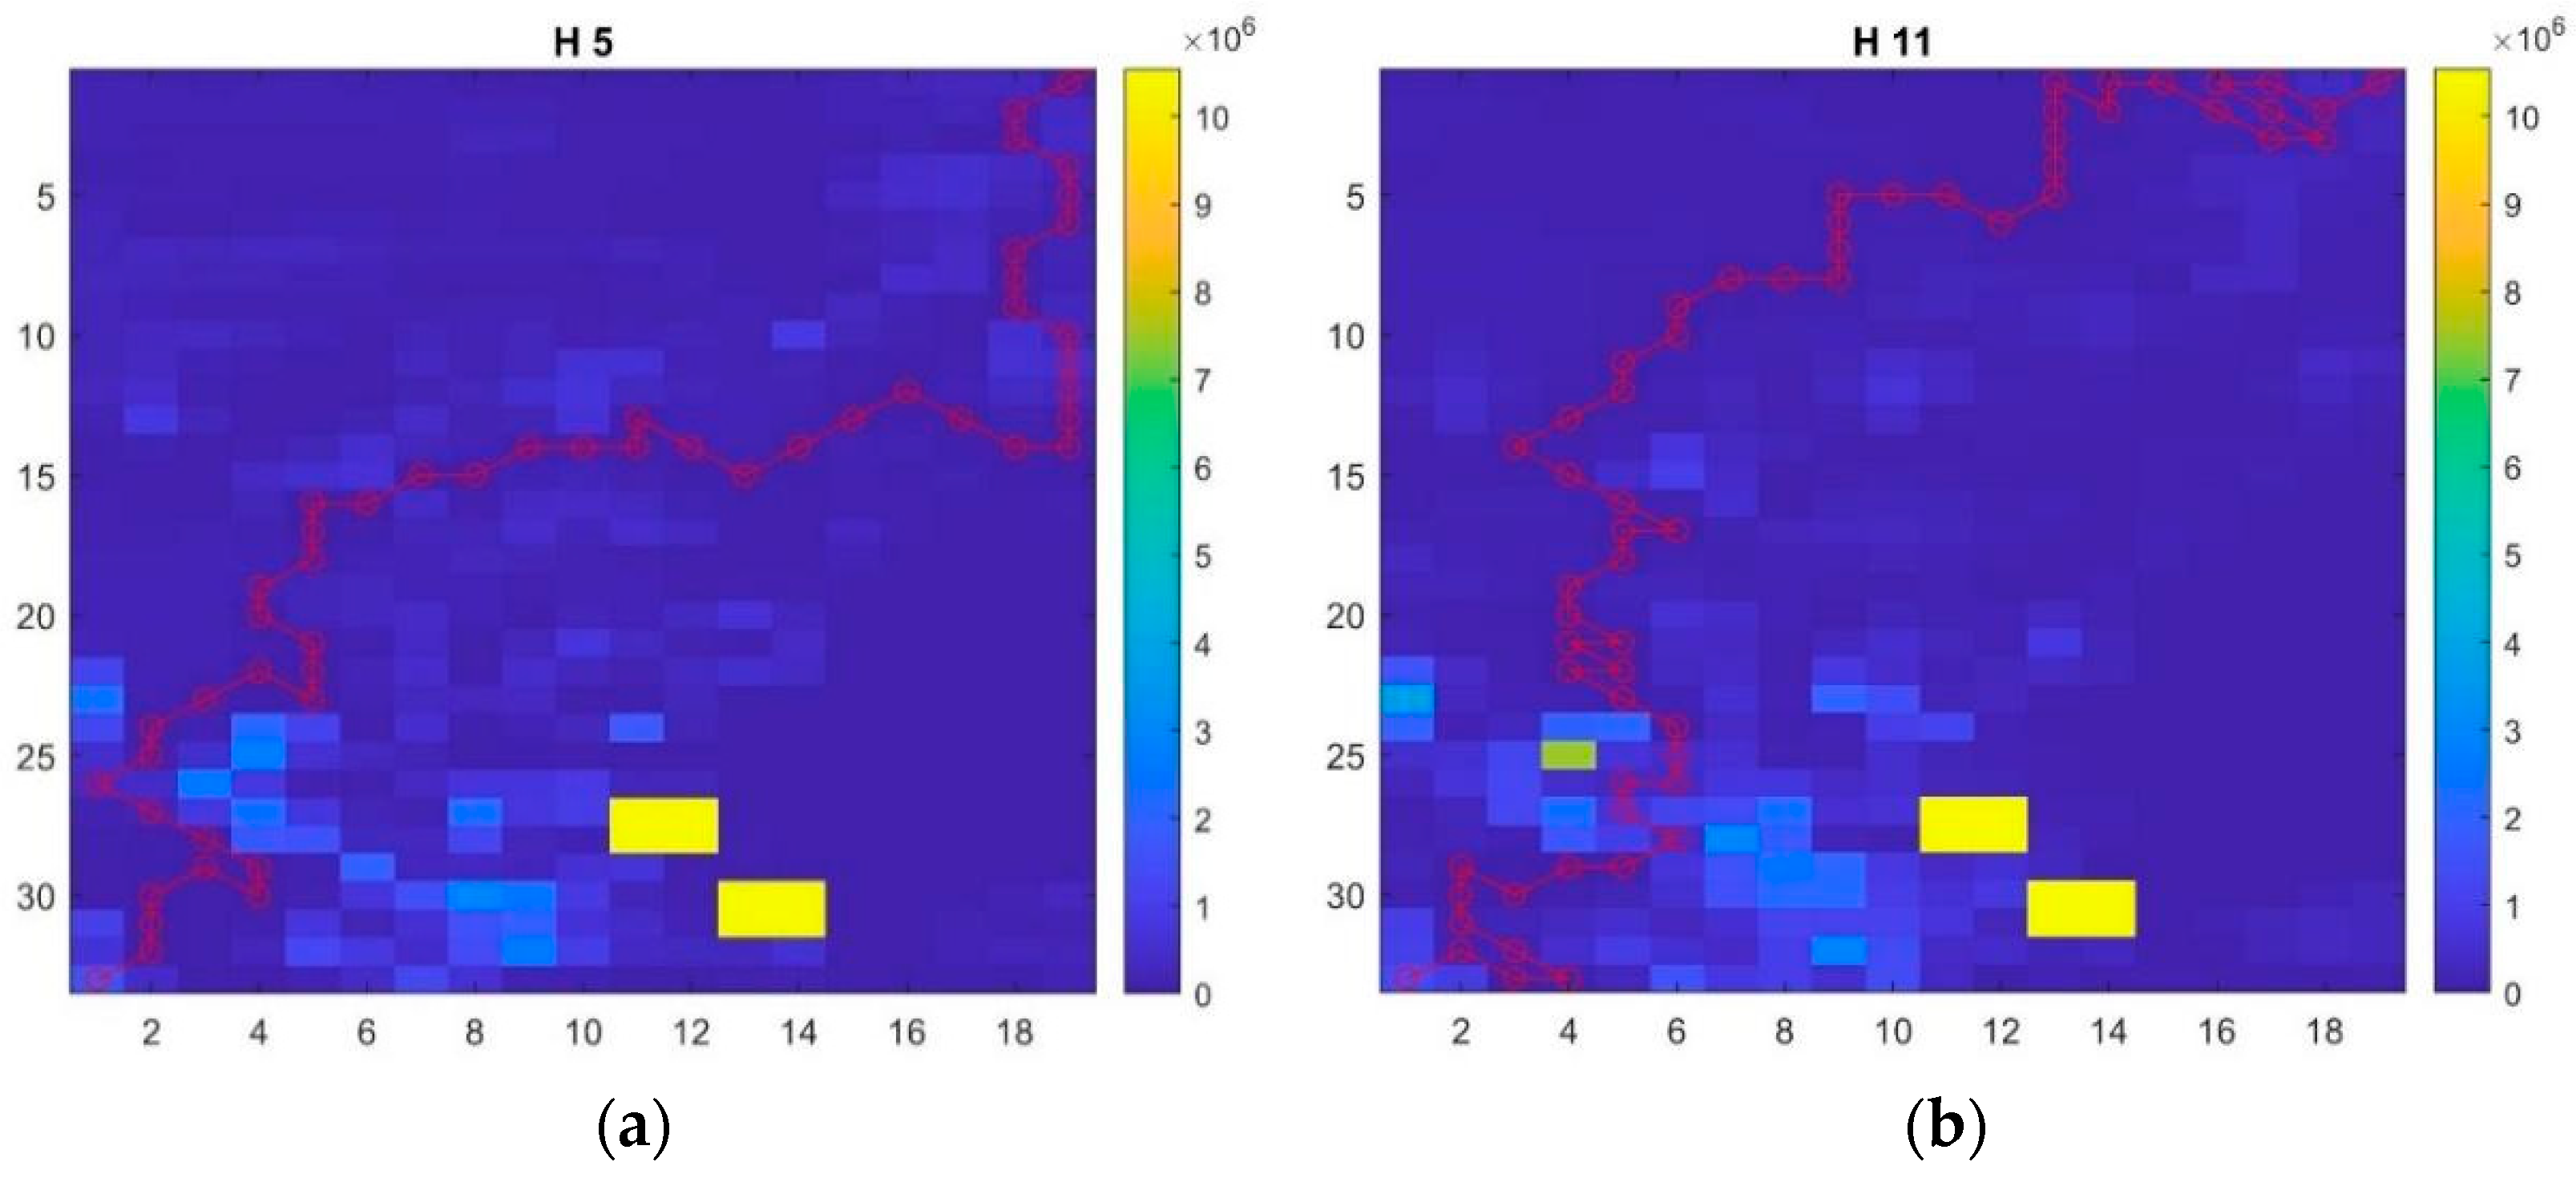
3.2. Risk-Driven Trajectory Optimization

Since the intended operation on a straight-line trajectory is not feasible from a safety risk management perspective, sub-optimal trajectories are studied in order to minimize the associated risk. The trajectories are calculated using the method described in Section 2.2 choosing in the first analysis the cells with the minimum population density values, and secondly, the trajectories are designed selecting the cells with the minimum GRC. Then, the length of each trajectory obtained is compared with the maximum range of the drone, given by the manufacturer.
In particular, in this case, the drone carries a payload of 1 kg and another 1.64 kg is taken into account for the weight of the parachute, reaching a total payload weight of 2.64 kg. Thus, from the manufacturer manual [46], it can be noticed that the maximum range for a flight with a slow drop is 75 km (45 min) in ideal conditions (no wind, sea level altitude, 15 °C air temperature) and ideal operations (ideal cruise speed, 20% battery reserve, standard payload from factor). In Table 9, the length of the one-way trajectory and the total length for a round trip flight are calculated together with the feasibility of the operation for both the cases in which the population density and the Ground Risk Class are considered. Finally, the last term calculated is the percentage of range that the drone can still fly after a round trip flight.
As shown in Table 9, all the trajectories are feasible and the range available after the round trip exceeds 50%. For this reason, if the flights take place in conditions similar to the ideal ones, it can be assumed that the drone can even take two round trips before charging the batteries, especially in the cases in which the range still flyable is close to 70%.
The trajectory obtained has different lengths according to the values of population density or GRC of each cell. Some examples of these trajectories are reported in Figure 8 for the optimization based on the population density and in Figure 9 for the optimization based on the Ground Risk Class. The complete results are reported in Appendix A.
The areas in yellow in Figure 8 and Figure 9 correspond to zones in which the drone cannot fly, since they represent the prohibited area of the Helsinki Vankila (Helsinki Prison) and an area in which buildings higher than 100 m are located. The other cells are colored according to a color scale ranging from blue to yellow, whereby areas tending more towards blue are those with a lower population density/GRC values, while the ones tending towards yellow are those with higher population density/GRC values.
The next step consists of observing the GRC of the cells in which the drone will fly and determining the final GRC after having applied the mitigations discussed in the previous section. Finally, the SAIL is determined according to Table 7. This calculation is conducted for both the optimization processes, i.e., the one based on population density and the one on GRC (Table 10 and Table 11).
As shown in Table 10, the SAIL obtained is VI in all cases, since the maximum intrinsic GRC is 9, whereas only in Table 11 are there some cases in which the GRC is V. After having evaluated the OSOs requirements present in Annex E [50] that must be fulfilled for this operation, it can be stated that this operation is not feasible in a highly populated environment such the Helsinki urban area due to the numerous stringent requirements involved, which operators and manufacturers may find challenging to meet or incur significant costs in compliance.

4. Discussion

The results of the analysis demonstrate that the transport between the Töölö Hospital and Malmi Hospital in Helsinki using the Wingcopter is feasible from a technological perspective, but it remains unfeasible in operational terms since the SAIL of the sub-optimal trajectories is equal to V or VI. For operating with such a high SAIL, the drone model shall hold a Type Certificate; however, nowadays, drones with Type Certificate, issued by EASA according to Regulation (EU) 748/2012 do not exist on the market. This condition is caused by the certification process that remains long and expensive, since there is not yet evidence of its adaptation to unmanned aircraft. For operating with SAIL IV, classified as medium risk, a Design Verification Report (DVR) issued by EASA is required [58]. This is a document attesting that the design of the UAS complies with the requirements set out in the Special Condition (SC)-Light UAS which contains a list of design requirements. The process to obtain a DVR is similar to a classic certification process, yet it is tailored for unmanned aircraft and thus expected to be less time-consuming, and less expensive.
The process is described in the “Guidelines on Design verification of UAS operated in the “Specific” category and classified in SAIL III and IV” [59] developed by EASA. However, nowadays, there are no drones on the market with DVR; this means that to make the operation feasible, the SAIL would need to be reduced to at least III. This analysis has proven that the values of the intrinsic GRC are too high to allow drone operations in a densely populated urban environment like Helsinki, at least if complying with the constraints just discussed. A possible solution already envisaged by SORA 2.5 is to reduce the GRC by obtaining more accurate real-time data about the population density and accordingly consider only the people actually exposed to the risk, which corresponds to the ones that are outside the buildings. This way, the mitigation M1(A) could reach the medium level of robustness since it can be assumed that the at-risk population can be reduced by 99%. Thus, the overall reduction in the GRC value will be 3 points, since the M1(A) mitigation will reduce the GRC by 2 points and the parachute application (mitigation M2) will reduce the GRC by 1 point.
Another solution that can be proposed consists of the determination of the percentage of time in which the operation exceeds SAIL III. In this view, it can be assessed with a higher level of granularity the actual exposure risk, and the potential for an exception to the regulation in force might be requested to the authority. Moreover, the operation could be divided into distinct parts, in order to apply appropriate mitigations for each part. For example, in critical zones, the ground risk can be reduced by lowering the speed of the drone or by reducing its height.
More advanced solutions might also reflect the usage for the analysis of a grid with a higher resolution. This way, the values of the population density in each area can be more accurate, thus allowing for choosing the most suitable zones to overfly, i.e., the ones with a higher density of buildings to reduce risk exposure of people.
Another way to reduce the GRC and the SAIL is linked to the selection of a different drone, in particular, a drone with a maximum characteristics dimension of 1 m and a maximum cruise speed of 25 m/s. This choice would lead to an additional 1-point reduction in GRC (cf. Table 3), yet to be verified against the mission requirements.
Finally, a hybrid way of transport that exploits the collaboration between trucks and drones [60] can be evaluated as an opportunity to facilitate goods transport by taking the advantages that each means of transport can offer.
One should also note how the results of the proposed approach remain significant for other drone operations, allowing wider generalization of the proposed approach to diverse aerial logistics missions. The logic proposed by the SORA framework may also serve as a basis for other investigations in more complex VTOL operations.

5. Conclusions

In this work, the SORA methodology has been applied to a realistic case study, which consists of a risk assessment of blood sample transportation using drones between two hospitals in the urban area of the city of Helsinki. The first case studied is the straight-line trajectory, whose results show that the SAIL has a high value, even after having applied some mitigations. For this reason, sub-optimal trajectories were considered. Even in this case, the final level of SAIL remains higher than the one allowed, since currently no UAS operator and no drone is capable of complying with the requirements corresponding to SAIL IV or higher. This means that the residual risk does not enable operations in an urban environment like the city of Helsinki. It is expected that the same, or even riskier results would be experienced in other large, crowded cities.
Potential future developments for the risk assessment using the SORA 2.5 methodology consist of also considering the interaction of the drone with the other airspace users. It is fundamental to organize and manage accurately manned and unmanned aviation jointly to limit the risk for collisions. This concern should extend the focus area of current research mainly linked to airport sites [61,62]. Additionally, further SORA customizations may be beneficial to deal with the specificity of diverse dangerous goods in order to provide assessments that go beyond considering the drone as a unique item, but which acknowledge the peculiar effects of its payload, where relevant. In this framework, more sophisticated trajectory optimization approaches could also be considered, evolving the simple one presented in this research. Similarly, it may be useful to investigate indirect risks, such as drivers’ distractions when flying over motorways, or incidents caused by the drone failure on the ground, as well as the implications of security, and cyber-security, which demand for the integration of systemic approaches [63].
In conclusion, operating drones in urban areas is still a challenge from a safety perspective. Although adequate drone technology already exists, its reliability has been proven only to a limited extent. For this reason, aviation authorities, and in particular EASA in Europe, are taking a cautious approach that requires the use of certified drones for high-risk operations. But certified drones are not yet available on the market, and in any case, their use could be too expensive to make drone delivery competitive with respect to current means of transport. Therefore, in the short term, drones can find better applications in emergency situations, especially in remote or less populated areas. Subsequently, with the development of more reliable drones and the availability of U-space services, we will start seeing drones flying over urban areas.

Author Contributions

Conceptualization, S.M., R.P. and M.D.; methodology, S.M., R.P. and M.D.; software, S.M.; validation, R.P. and M.D.; formal analysis, S.M. and M.D.; investigation, S.M.; resources, S.M.; data curation, S.M. and M.D.; writing—original draft preparation, S.M.; writing—review and editing, S.M., R.P. and M.D.; visualization, S.M. and R.P.; supervision, R.P. and M.D.; project administration, R.P. and M.D.; funding acquisition, R.P. All authors have read and agreed to the published version of the manuscript.

Funding

The work by one of the authors (R.P.) is funded partly within the framework of the PNRR: CN4 “Sustainable Mobility Center”—SPOKE 1 “Air Mobility”—CN_00000023—CUP B83C22002900007.

Data Availability Statement

The raw data supporting the conclusions of this article will be made available by the authors upon reasonable request.

Acknowledgments

This work is part of the research activities developed within the framework of PNRR: CN4 “Sustainable Mobility Center”—SPOKE 1 “Air Mobility”—CN_00000023—CUP B83C22002900007 by one author (R.P.).

Conflicts of Interest

The authors declare no conflicts of interest. The funders had no role in the design of the study; in the collection, analyses, or interpretation of data; in the writing of the manuscript; or in the decision to publish the results.

Appendix A

Figure A1. Trajectories determined considering the population density: (ax) trajectories determined for each hour.
Drones 08 00210 g0a1aDrones 08 00210 g0a1bDrones 08 00210 g0a1c
Figure A2. Trajectories determined considering the GRC: (ax) trajectories determined for each hour.
Drones 08 00210 g0a2aDrones 08 00210 g0a2bDrones 08 00210 g0a2c

References

  1. European Parliament; Official Journal of the European Union. Regulation EU 2018/1139 of the European Parliament and of the Council. 2018. Available online: https://eur-lex.europa.eu/legal-content/EN/TXT/?uri=CELEX%3A32018R1139 (accessed on 1 April 2024).
  2. Commission Implementing Regulation EU 2019/947. European Parliament, Council of the EU. Official Journal of the European Union. 2019. Available online: https://eur-lex.europa.eu/eli/reg_impl/2019/947/oj (accessed on 1 April 2024).
  3. Dhote, J.; Limbourg, S. Designing Unmanned Aerial Vehicle Networks for Biological Material Transportation—The Case of Brussels. Comput. Ind. Eng. 2020, 148, 106652. [Google Scholar] [CrossRef]
  4. Nyaaba, A.A.; Ayamga, M. Intricacies of Medical Drones in Healthcare Delivery: Implications for Africa. Technol. Soc. 2021, 66, 101624. [Google Scholar] [CrossRef]
  5. Ozkan, O. Multi-Objective Optimization of Transporting Blood Products by Routing UAVs: The Case of Istanbul. Int. Trans. Oper. Res. 2023, 30, 302–327. [Google Scholar] [CrossRef]
  6. Thiels, C.A.; Aho, J.M.; Zietlow, S.P.; Jenkins, D.H. Use of Unmanned Aerial Vehicles for Medical Product Transport. Air Med. J. 2015, 34, 104–108. [Google Scholar] [CrossRef] [PubMed]
  7. De Silvestri, S.; Capasso, P.J.; Gargiulo, A.; Molinari, S.; Sanna, A. Challenges for the Routine Application of Drones in Healthcare: A Scoping Review. Drones 2023, 7, 685. [Google Scholar] [CrossRef]
  8. Ling, G.; Draghic, N. Aerial Drones for Blood Delivery. Transfusion 2019, 59, 1608–1611. [Google Scholar] [CrossRef] [PubMed]
  9. O’Keeffe, D.T.; Johnson, K.; Maraka, S. Provision of Bidirectional Remote Patient Care with an Unmanned Aerial Vehicle. Mayo Clin. Proc. 2020, 95, 830. [Google Scholar] [CrossRef] [PubMed]
  10. Carrillo-Larco, R.M.; Moscoso-Porras, M.; Taype-Rondan, A.; Ruiz-Alejos, A.; Bernabe-Ortiz, A. The Use of Unmanned Aerial Vehicles for Health Purposes: A Systematic Review of Experimental Studies. Glob. Health Epidemiol. Genom. 2018, 3, e13. [Google Scholar] [CrossRef] [PubMed]
  11. Patel, K.; El-Khoury, J.M.; Simundic, A.-M.; Farnsworth, C.W.; Broell, F.; Genzen, J.R.; Amukele, T.K. Evolution of Blood Sample Transportation and Monitoring Technologies. Clin. Chem. 2021, 67, 812–819. [Google Scholar] [CrossRef] [PubMed]
  12. Balasingam, M. Drones in Medicine—The Rise of the Machines. Int. J. Clin. Pract. 2017, 71, e12989. [Google Scholar] [CrossRef] [PubMed]
  13. Haematology, T.L. Look! Up in the Sky! It’s a Bird. It’s a Plane. It’s a Medical Drone! Lancet Haematol. 2017, 4, e56. [Google Scholar] [CrossRef]
  14. Mangtani, L.M.; Khanorkar, A.K.; Titarmare, S.N.; Badhane, R.S.; Baghele, S.D.; Pandele, R.M.; Baig, M.M. Implement Emergency Medical Facility through Unmanned Aerial Vehical. In Proceedings of the 3rd International Conference on I-SMAC IoT in Social, Mobile, Analytics and Cloud, I-SMAC 2019, Palladam, India, 12–14 December 2019. [Google Scholar]
  15. Ayyappaa, N.; Raj, A.Y.; Adithya, A.; Murali, R.; Vinodh, A. Autonomous Drone for Efficacious Blood Conveyance. In Proceedings of the 2019 4th International Conference on Robotics and Automation Engineering, ICRAE 2019, Singapore, 22–24 November 2019. [Google Scholar]
  16. Nisingizwe, M.P.; Ndishimye, P.; Swaibu, K.; Nshimiyimana, L.; Karame, P.; Dushimiyimana, V.; Musabyimana, J.P.; Musanabaganwa, C.; Nsanzimana, S.; Law, M.R. Effect of Unmanned Aerial Vehicle (Drone) Delivery on Blood Product Delivery Time and Wastage in Rwanda: A Retrospective, Cross-Sectional Study and Time Series Analysis. Lancet Glob. Health 2022, 10, e564–e569. [Google Scholar] [CrossRef] [PubMed]
  17. Mion, F.U. Flying Drones to Exchange Lab Samples: Service Innovation by the Swiss Multisite Hospital EOC. In Service Design and Service Thinking in Healthcare and Hospital Management; Springer: Cham, Switzerland, 2018. [Google Scholar]
  18. Scott, J.E.; Scott, C.H. Models for Drone Delivery of Medications and Other Healthcare Items. Int. J. Healthc. Inf. Syst. Inform. 2018, 13, 20–34. [Google Scholar] [CrossRef]
  19. Niglio, F.; Comite, P.; Cannas, A.; Pirri, A.; Tortora, G. Preliminary Clinical Validation of a Drone-Based Delivery System in Urban Scenarios Using a Smart Capsule for Blood. Drones 2022, 6, 195. [Google Scholar] [CrossRef]
  20. Homier, V.; Brouard, D.; Nolan, M.; Roy, M.-A.; Pelletier, P.; McDonald, M.; de Champlain, F.; Khalil, E.; Grou-Boileau, F.; Fleet, R. Drone versus Ground Delivery of Simulated Blood Products to an Urban Trauma Center: The Montreal Medi-Drone Pilot Study. J. Trauma Acute Care Surg. 2021, 90, 515–521. [Google Scholar] [CrossRef] [PubMed]
  21. Jain, V.; Luthra, N. Medical Assistance Using Drones for Remote Areas. In Proceedings of the International Conference on Artificial Intelligence and Applications. Advances in Intelligent Systems and Computing; Bansal, V.P., THushir, M., Balas, V., Srivastava, R., Eds.; Springer: Singapore, 2021; Volume 1164. [Google Scholar] [CrossRef]
  22. Ackerman, E.; Koziol, M. The Blood Is Here: Zipline’s Medical Delivery Drones Are Changing the Game in Rwanda. IEEE Spectrum 2019, 56, 24–31. [Google Scholar] [CrossRef]
  23. Glauser, W. Blood-Delivering Drones Saving Lives in Africa and Maybe Soon in Canada. CMAJ Can. Med. Assoc. J. 2018, 190, E88–E89. [Google Scholar] [CrossRef] [PubMed]
  24. Ackerman, E.; Strickland, E. Medical Delivery Drones Take Flight in East Africa. IEEE Spectr. 2018, 55, 34–35. [Google Scholar] [CrossRef]
  25. Zailani, M.A.H.; Raja Sabudin, R.Z.A.; Abdul Rahman, R.; Mohd Saiboon, I.; Ismail, A.; Mahdy, Z.A. Drone Technology in Maternal Healthcare in Malaysia: A Narrative Review. Malays. J. Pathol. 2021, 43, 251–259. [Google Scholar] [PubMed]
  26. International Civil Aviation Organization (ICAO). Technical Instructions for the Safe Transport of Dangerous Goods by Air (Doc 9284); 2019–2020 Edition; International Civil Aviation Organization: Montreal, QC, Canada, 2018. [Google Scholar]
  27. Shelley, A.V. Ground Risk Model for UAVs. Int. J. Aviat. Aeronaut. Aerosp. 2023, 10. [Google Scholar] [CrossRef]
  28. Denney, E.; Pai, G.; Johnson, M. Towards a Rigorous Basis for Specific Operations Risk Assessment of UAS. In Proceedings of the 2018 IEEE/AIAA 37th Digital Avionics Systems Conference (DASC), London, UK, 23–27 September 2018; pp. 1–10. [Google Scholar]
  29. Habibi, H.; Venkateswara Rao, D.M.K.K.; Luis Sanchez-Lopez, J.; Voos, H. On SORA for High-Risk UAV Operations under New EU Regulations: Perspectives for Automated Approach. In Proceedings of the 2023 International Conference on Unmanned Aircraft Systems (ICUAS), Warsaw, Poland, 6–9 June 2023; pp. 213–220. [Google Scholar]
  30. Capitán, C.; Capitán, J.; Castaño, Á.R.; Ollero, A. Risk Assessment Based on SORA Methodology for a UAS Media Production Application. In Proceedings of the 2019 International Conference on Unmanned Aircraft Systems (ICUAS), Atlanta, GA, USA, 11–14 June 2019; pp. 451–459. [Google Scholar]
  31. Janik, P.; Zawistowski, M.; Fellner, R.; Zawistowski, G. Unmanned Aircraft Systems Risk Assessment Based on SORA for First Responders and Disaster Management. Appl. Sci. 2021, 11, 5364. [Google Scholar] [CrossRef]
  32. Martinez, C.; Sanchez-Cuevas, P.J.; Gerasimou, S.; Bera, A.; Olivares-Mendez, M.A. SORA Methodology for Multi-UAS Airframe Inspections in an Airport. Drones 2021, 5, 141. [Google Scholar] [CrossRef]
  33. Liu, Y. Routing Battery-Constrained Delivery Drones in a Depot Network: A Business Model and Its Optimization–Simulation Assessment. Transp. Res. Part C Emerg. Technol. 2023, 152, 104147. [Google Scholar] [CrossRef]
  34. Pinto, R.; Lagorio, A. Point-to-Point Drone-Based Delivery Network Design with Intermediate Charging Stations. Transp. Res. Part C Emerg. Technol. 2022, 135, 103506. [Google Scholar] [CrossRef]
  35. Dukkanci, O.; Kara, B.Y.; Bektaş, T. Minimizing Energy and Cost in Range-Limited Drone Deliveries with Speed Optimization. Transp. Res. Part C Emerg. Technol. 2021, 125, 102985. [Google Scholar] [CrossRef]
  36. Dataset Search. Available online: https://datasetsearch.research.google.com/ (accessed on 30 March 2024).
  37. Bergroth, C.; Järv, O.; Tenkanen, H.; Manninen, M.; Toivonen, T. A 24-Hour Population Distribution Dataset Based on Mobile Phone Data from Helsinki Metropolitan Area, Finland. Sci. Data 2022, 9, 39. [Google Scholar] [CrossRef] [PubMed]
  38. HUS. Available online: https://www.hus.fi/en (accessed on 30 March 2024).
  39. Google Earth Pro, (2024) 60°15′15.39″ N–60°10′51.59″ N; 24°59′58.76″ E–24°55′20.92″ E). Available online: http://www.google.com/earth/index.html (accessed on 30 March 2024).
  40. Helsinki-Vantaa (EFHK) Restrictive UAS Geographical Zones. Available online: https://www.droneinfo.fi/en/news/helsinki-vantaa-efhk-restrictive-uas-geographical-zone (accessed on 30 March 2024).
  41. UAS Geographical Zones in Machine-Readable Format. Available online: https://droneinfo.fi/en/news/uas-geographical-zones-machine-readable-format (accessed on 30 March 2024).
  42. List of Tallest Buildings in Finland. Available online: https://en.wikipedia.org/wiki/List_of_tallest_buildings_in_Finland (accessed on 30 March 2024).
  43. Hercules 10. Available online: https://www.dronevolt.com/en/expert-solutions/hercules-10/ (accessed on 30 March 2024).
  44. Hercules 20. Available online: https://www.dronevolt.com/en/expert-solutions/hercules-20/ (accessed on 30 March 2024).
  45. Wingcopter 178. Available online: https://wingcopter.com/wp-content/uploads/2021/02/Technical-Details-Wingcopter-178-Heavy-Lift-A-Delivery-Variant-1-1.pdf (accessed on 30 March 2024).
  46. Wingcopter 198. Available online: https://wingcopter.com/wingcopter-198 (accessed on 30 March 2024).
  47. T-Motor. Available online: https://store.tmotor.com/category.php?id=75 (accessed on 30 March 2024).
  48. Wing. Available online: https://wing.com/ (accessed on 30 March 2024).
  49. The MathWorks Inc. MatLab, 2020, Natick, Massachussetts, USA. 2022. Available online: https://www.mathworks.com (accessed on 30 March 2024).
  50. JARUS, External Consultation—“SORA Version 2.5 Package. Available online: http://jarus-rpas.org/document/sora-2-5-annex-h-uas-safety-services-considerations/ (accessed on 30 March 2024).
  51. Geister, R.; Limmer, L.; Rippl, M.; Dautermann, T. Total System Error Performance of Drones for an Unmanned PBN Concept. In Proceedings of the 2018 Integrated Communications, Navigation, Surveillance Conference (ICNS), Herndon, VA, USA, 10–12 April 2018; pp. 1–12. [Google Scholar]
  52. Means of Compliance with Light-UAS.2511 Containment. Available online: https://www.easa.europa.eu/en/document-library/product-certification-consultations/final-means-compliance-light-uas2511-moc-light (accessed on 30 March 2024).
  53. StatFin, Statistics Finland, Finland’s Preliminary Population Structure by Area. 2022. Available online: https://stat.fi/en/publication/cktlhpm743g870c55g0o669k0 (accessed on 30 March 2024).
  54. Mobilidade e Funcionalidade Do Território Nas Áreas Metropolitanas Do Porto e de Lisboa. 2017. Available online: https://www.ine.pt/xportal/xmain?xpid=INE&xpgid=ine_publicacoes&PUBLICACOESpub_boui=349495406&PUBLICACOESmodo=2&xlang=pt (accessed on 30 March 2024).
  55. FAA UAS Center of Excellence Task A4: UAS Ground Collision Severity Evaluation. Available online: https://rosap.ntl.bts.gov/view/dot/32209 (accessed on 30 March 2024).
  56. EASA. Notice of Proposed Amendment 2017-05 (B). Introduction of a Regulatory Framework for the Operation of Drones, Unmanned Aircraft System Operations in the Open and Specific Category. 2017. Available online: https://www.easa.europa.eu/en/downloads/22496/en (accessed on 30 March 2024).
  57. Parachute Descent Rate Calculator. Available online: https://fruitychutes.com/help_for_parachutes/parachute-descent-rate-calculator.htm (accessed on 30 March 2024).
  58. EASA Design Verification Report. Available online: https://www.easa.europa.eu/en/domains/civil-drones-rpas/specific-category-civil-drones/designverification-report (accessed on 30 March 2024).
  59. EASA Guidelines on Design Verification of UAS Operated in the “Specific” Category and Classified in SAIL III and IV 2021. Available online: https://www.easa.europa.eu/en/guidelines-design-verification-uas-operated-specific-category (accessed on 30 March 2024).
  60. Najy, W.; Archetti, C.; Diabat, A. Collaborative Truck-and-Drone Delivery for Inventory-Routing Problems. Transp. Res. Part C Emerg. Technol. 2023, 146, 103791. [Google Scholar] [CrossRef]
  61. Zhang, N.; Liu, H.; Ng, B.F.; Low, K.H. Collision Probability between Intruding Drone and Commercial Aircraft in Airport Restricted Area Based on Collision-Course Trajectory Planning. Transp. Res. Part C Emerg. Technol. 2020, 120, 102736. [Google Scholar] [CrossRef]
  62. Kovacova, M.; Gravio, G.D.; Patriarca, R. Unmanned Aerial Systems: Status and Forthcoming Challenges for Safety Risk Management. Transp. Res. Procedia 2022, 65, 329–338. [Google Scholar] [CrossRef]
  63. Simone, F.; Akel, A.J.N.; Gravio, G.D.; Patriarca, R. Thinking in Systems, Sifting Through Simulations: A Way Ahead for Cyber Resilience Assessment. IEEE Access 2023, 11, 11430–11450. [Google Scholar] [CrossRef]
Figure 1. Location of the two laboratories. The red segment identifies the linear connecting path.
Drones 08 00210 g001
Figure 2. UAS geographical zones in the operational area.
Drones 08 00210 g002
Figure 3. Temporary restricted zone, colored in red.
Drones 08 00210 g003
Figure 4. The tallest buildings in the operational zone indicated by yellow pins.
Drones 08 00210 g004
Figure 5. Cells considered in the iterative analysis.
Drones 08 00210 g005
Figure 6. Area at risk for the straight-line trajectory.
Drones 08 00210 g006
Figure 7. ARC determination [50].
Drones 08 00210 g007
Figure 8. Examples of the trajectories obtained taking into account the population density for each hour: (a) Trajectory at 5 h; (b) trajectory at 11 h.
Drones 08 00210 g008
Figure 9. Examples of the trajectories obtained taking into account the GRC for each hour: (a) Trajectory at 0 h; (b) trajectory at 1 h.
Drones 08 00210 g009
Table 1. Logic for cell selection as imposed by the heuristic developed in case of cells with equal risk value.
Cells with Equal Risk ValueCell Chosen
A, BB
A, CC
A, DD
A, EA
B, CC
B, DB
B, EB
C, DC
C, EC
D, ED
A, B, CC
A, B, DB
A, B, EB
A, C, DC
A, C, EC
A, D, ED
B, C, DC
B, C, EC
B, D, EB
C, D, EC
A, C, D, EC
A, B, D, EB
A, B, C, EC
A, B, C, DC
A, B, C, D, EC
Table 2. Pre-application evaluation for the straight-line trajectory.
RequirementsVerified?Note
If the operation falls under the “Open” category or if the competent authority has determined that the UAS is “harmless” (the worst credible case is negligible or minor in consequence) in terms of the risk presented by the operation.NOThe operation does not fall in the “Open” category because it is a BVLOS operation and material is expected to be released.
If the operation is covered by a “standard scenario” recognized by the competent authority.NOThe operation is not covered by any “standard scenario”.
If the operation falls under the “certified” category.NOThe operation does not fall into the “certified” category since the drone maximum dimension does not exceed 3 m, it does not fly over assemblies, it does not transport passengers, and it does not transport dangerous goods.
If the operation is subject to specific “no-go” criteria from the competent authority.NOThe operation is not subject to specific “no-go” criteria from the competent authority. No-go criteria are operations prohibited by the authority, for example, the dropping of prohibited material.
Table 3. Intrinsic GRC criteria [50].
Max UA Characteristics Dimension1 m3 m8 m20 m40 m
Max Cruise Speed25 m/s35 m/s75 m/s150 m/s200 m/s
Maximum iGRC population density (ppl/km2)Controlled ground area12345
<2534567
<25045678
<250056789
<25,000678910
<250,0007891011
>250,00079Category C Operations (SORA N/A)
Table 4. Intrinsic GRC values at different hours for the straight-line trajectory before mitigations are applied.
HourMax Population Density/km2iGRC
H 019,8687
H 123,6817
H 227,0528
H 329,0428
H 429,0558
H 527,6998
H 634,7308
H 753,9648
H 876,0278
H 980,4488
H 1076,1158
H 1174,7178
H 1275,8888
H 1373,0738
H 1470,2228
H 1565,6638
H 1651,1838
H 1736,8228
H 1829,1248
H 1925,2738
H 2019,9837
H 2118,8547
H 2219,3677
H 2318,5287
Table 5. Applicable mitigations to GRC.
Mitigation TypeIntegrity/AssuranceCriterionDescriptionAvailable Level of Integrity/Assurance
M1(A)—Strategic mitigations for ground riskIntegrityCriterion #1
Evaluation of people at risk
The drone is not expected to penetrate a structure under which people are sheltered, and it is reasonable to consider that most of the non-active participants will be located under a structure.L/M/H
In Annex B [50], it is stated that drones weighing less than 25 kg are not able to penetrate structures (except in some rare cases). It can also be supposed that people usual spend most of the time indoors.
Criterion #2
Impact on at-risk population
The at-risk population is lowered by at least 1 iGRC population band (~90%) using one or more methods described in the Level of Integrity for Criterion #1 above.L
It is supposed that the greatest part of the population present in the area is sheltered under a structure. *
AssuranceCriterion #1
Evaluation of people at risk
All mapping products, data sources and processes used to claim lowering the density of the population at risk are accepted/approved by the competent authority.L/M/H
The lowering of the density of population for drones weighing less than 25 kg is stated in the Annex B [50] and so it is approved by the competent authority.
Criterion #2
Impact on at-risk population
The applicant has supporting evidence that the required level of integrity is achieved. This is typically achieved by means of testing, analysis, simulation, inspection, design review and through operational experience.L/M
It is supposed that studies were conducted to demonstrate the tendency of people to spend the majority of time indoors.
Level of robustness M1 (A)Low
M1(B)—Visual Line of Sight (VLOS)—avoid flying over peopleIntegrityCriterion #1
  • The operation is performed within Visual Line of Sight (VLOS) of the remote pilot.
  • While operating the drone, the remote pilot can safely and unambiguously identify area(s) of less risk on the ground.
  • The remote pilot is able to safely reduce the number of people at risk […].
Not applicable, since the operation is not performed in VLOS.
AssuranceCriterion #1The operational procedures for the mitigation are documented, including the safe distance from non-active participants (when applicable).Not applicable, since the integrity is not applicable.
Level of robustness M1 (B)N/A
M2—Effects of UA impact dynamics are reducedIntegrityCriterion #1
Technical design
  • Effects of impact dynamics and immediate post impact hazards, critical area or the combination of these results are reduced such that the risk to the population is reduced by an approximate 1 order of magnitude (90%).
  • When applicable, in case of malfunctions, failures or any combinations thereof that may lead to a crash, the UAS contains all elements required for the activation of the mitigation.
  • When applicable, any failure or malfunction of the proposed mitigation itself (e.g., inadvertent activation) does not adversely affect the safety of the operation.
M **
It is assumed that equipping the drone with a parachute can reduce the risk to the population by 90%.
The system is designed in such a way that in case the drone is in a freefall situation, there is an automatic system that opens the parachute. The inadvertent opening of the parachute will not affect the safety of the operation, but the drone will land safely.
Criterion #2
Procedures, if applicable
Any equipment used to reduce the effect of the UA impact dynamics are installed and maintained in accordance with manufacturer instructions.L/M/H
A parachute is installed and maintained according to the manufacturer instructions.
Criterion #3
Training, if applicable
When the use of the mitigation requires action from the remote crew, then training must be provided for the remote crew by the operator.
If the personnel responsible for the installation and maintenance of the mitigation measures are internal to the operator, then these personnel must be identified and provided training by the operator.
Not applicable; the parachute is activated automatically.
AssuranceCriterion #1
Technical design
The applicant has supporting evidence to claim the required level of integrity and reliability has been achieved. This is typically carried out by means of testing, analysis, simulation, inspection, design review and through operational experience.M
Tests and simulations on the automatic parachute system are performed during the design and the post-design phase. Also, industry standards are utilized during the design of the parachute.
Criterion #2
Procedures, if applicable
  • Procedures are validated against standards considered adequate by the competent authority and/or in accordance with means of compliance acceptable to that authority.
  • The adequacy of the procedures is proved through either of the following:
-
Dedicated flight tests;
-
Simulation, provided that the representativeness of the simulation means is proven for the intended purpose with positive results.
M
The parachute is installed and maintained according to the manufacturer instructions. These instructions are validated by the competent authority and the procedures are tested with dedicated flight tests.
Criterion #3
Training, if applicable
/Not applicable, since the integrity is not applicable.
Level of robustness M2Medium
* For example, from a study carried out in Portugal [54], the mobility rate is estimated to be on average 80%, which means that daily, 20% of the population remains sheltered in their houses. The exposure time is estimated to be 70 min during a working day. However, these 70 min are not evenly spread over the duration of the day with most of them being concentrated between 07:00 am and 01:00 am. By combining these data, it has been estimated that the percentage of the population that is protected between 07:00 am and 01:00 am on a typical working day is around 95%. ** Parachute. According to [55], there is a 10% probability of causing fatal injuries with an energy transferred at the impact of 49J. This probability is reduced to 1% with an energy transferred to the impact of 32J. It is assumed that 50% of the kinetic energy of the UAS is transferred at impact: EASA NPA 2017-05 (page 119) refers to 46.5% as the amount of energy transferred at impact and makes reference to a study from the Australian CAA and Monash University [56]. However, since both EASA assumptions and the paper referenced refer to small UAS, a more conservative value of 50% is taken as reference in this study. Accordingly, a 90% reduction in the UAS lethality can be achieved by using a system that can reduce the kinetic energy of the UAS below around 98J. On the other hand, to achieve a 99% reduction in UAS lethality of 99% the kinetic energy transferred to the impact must be below 64J. It is sufficient to install a parachute that has an impact energy less than 98J, since that the overall level of robustness will be medium independent of the Criterion #1. In this way the parachute chosen can have smaller dimensions and be lighter, in such a way not to overload the drone. After an accurate analysis of different parachute models [57], it can be stated that the best parachute to use for this operation is the Fruity Chutes IFC-192-S.
Table 6. Mitigations for Ground Risk. Highlighted cells refer to the mitigations in place.
Level of Robustness
Mitigations for Ground RiskLowMediumHigh
M1(A)—Strategic mitigations for ground risk−1−2−3
M1(B)—Visual Line of Sight (VLOS)—Avoid flying over people−1N/AN/A
M2—Effects of UA impact dynamics are reduced0−1−2/−3
Table 7. SAIL determination [50].
Residual ARC
Final GRCabcd
≤2IIIIVVI
3IIIIIVVI
4IIIIIIIVVI
5IVIVIVVI
6VVVVI
7VIVIVIVI
>7Category C Operation
Table 8. SAIL values at different hours for the straight-line trajectory.
HourMax Population
Density/km2
Intrinsic GRCFinal GRCResidual ARCSAIL
H 019,86875aIV
H 123,68175aIV
H 227,05286aV
H 329,04286aV
H 429,05586aV
H 527,69986aV
H 634,73086aV
H 753,96486aV
H 876,02786aV
H 980,44886aV
H 1076,11586aV
H 1174,71786aV
H 1275,88886aV
H 1373,07386aV
H 1470,22286aV
H 1565,66386aV
H 1651,18386aV
H 1736,82286aV
H 1829,12486aV
H 1925,27386aV
H 2019,98375aIV
H 2118,85475aIV
H 2219,36775aIV
H 2318,52875aIV
Table 9. Operation feasibility of the optimized trajectories for each hour.
HourOne-Way Length (Population Density) [m]Total Length [m]Feasibility (Population Density)Percentage of Range still FlyableOne-Way Length (Ground Risk) [m]Total Length [m]Feasibility (Ground Risk)Percentage of Range Still Flyable
H 016,04632,799Drones 08 00210 i00156.27%12,57125,849Drones 08 00210 i00265.53%
H 114,98530,678Drones 08 00210 i00359.10%13,19227,092Drones 08 00210 i00463.88%
H 214,98530,678Drones 08 00210 i00559.10%13,19227,092Drones 08 00210 i00663.88%
H 314,98530,678Drones 08 00210 i00759.10%13,39927,506Drones 08 00210 i00863.33%
H 414,83930,385Drones 08 00210 i00959.49%13,39927,506Drones 08 00210 i01063.33%
H 514,83930,385Drones 08 00210 i01159.49%11,92524,556Drones 08 00210 i01267.26%
H 612,21825,142Drones 08 00210 i01366.48%11,92524,556Drones 08 00210 i01467.26%
H 714,69230,092Drones 08 00210 i01559.88%11,27823,263Drones 08 00210 i01668.98%
H 813,42527,756Drones 08 00210 i01763.26%11,98524,678Drones 08 00210 i01867.10%
H 916,48533,678Drones 08 00210 i01955.10%11,98524,678Drones 08 00210 i02067.10%
H 1017,39935,506Drones 08 00210 i02152.66%11,27823,263Drones 08 00210 i02268.98%
H 1117,75336,213Drones 08 00210 i02351.72%11,63223,971Drones 08 00210 i02468.04%
H 1217,39935,506Drones 08 00210 i02552.66%11,63223,971Drones 08 00210 i02668.04%
H 1316,69234,092Drones 08 00210 i02754.54%11,63223,971Drones 08 00210 i02868.04%
H 1416,69234,092Drones 08 00210 i02954.54%11,63223,971Drones 08 00210 i03068.04%
H 1513,98528,678Drones 08 00210 i03161.76%12,48525,678Drones 08 00210 i03265.76%
H 1613,57127,849Drones 08 00210 i03362.87%12,48525,678Drones 08 00210 i03465.76%
H 1714,27829,263Drones 08 00210 i03560.98%12,13224,971Drones 08 00210 i03666.71%
H 1814,27829,263Drones 08 00210 i03760.98%11,27823,263Drones 08 00210 i03868.98%
H 1913,36427,435Drones 08 00210 i03963.42%11,71824,142Drones 08 00210 i04067.81%
H 2013,36427,435Drones 08 00210 i04163.42%11,07122,849Drones 08 00210 i04269.53%
H 2112,65726,021Drones 08 00210 i04365.31%11,27823,263Drones 08 00210 i04468.98%
H 2213,21827,142Drones 08 00210 i04563.81%12,07124,849Drones 08 00210 i04666.87%
H 2316,04632,799Drones 08 00210 i04756.27%12,48525,678Drones 08 00210 i04865.76%
Table 10. GRC and SAIL (evaluated according to population density) for each hour.
HourOne-Way Length (Population Density) [m]N° Cells with GRC = 4N° Cells with GRC = 5N° Cells with GRC = 6N° Cells with GRC = 7N° Cells with GRC = 8N° Cells with GRC = 9Cell Occupancy with GR > 6Max GRCFinal GRCSAIL
H 016,0460091625383%97VI
0%0%17%30%47%6%
H 114,9851091720380%97VI
2%0%18%34%40%6%
H 214,9850191720380%97VI
0%2%18%34%40%6%
H 314,9850191818480%97VI
0%2%18%36%36%8%
H 414,8390181917482%97VI
0%2%16%39%35%8%
H 514,8390162117486%97VI
0%2%12%43%35%8%
H 612,2186341015368%97VI
15%7%10%24%37%7%
H 714,6923231027383%97VI
6%4%6%21%56%6%
H 813,4250031227393%97VI
0%0%7%27%60%7%
H 916,4850051629691%97VI
0%0%9%29%52%11%
H 1017,3990041831593%97VI
0%0%7%31%53%9%
H 1117,7530031932594%97VI
0%0%5%32%54%8%
H 1217,3990031733595%97VI
0%0%5%29%57%9%
H 1316,6920031632595%97VI
0%0%5%29%57%9%
H 1416,6920031534495%97VI
0%0%5%27%61%7%
H 1513,985003930493%97VI
0%0%7%20%65%9%
H 1613,5710031030393%97VI
0%0%7%22%65%7%
H 1714,2783131028385%97VI
6%2%6%21%58%6%
H 1814,2783041030186%97VI
6%0%8%21%63%2%
H 1913,364608920370%97VI
13%0%17%20%43%7%
H 2013,3646081020270%97VI
13%0%17%22%43%4%
H 2112,6576171017369%97VI
14%2%16%23%39%7%
H 2213,2188271214262%97VI
18%4%16%27%31%4%
H 2316,0461081922383%97VI
2%0%15%36%42%6%
Table 11. GRC and SAIL (evaluated according to GRC) for each hour.
HourOne-Way Length (Ground Risk) [m]N° Cells with GRC = 4N° Cells with GRC = 5N° Cells with GRC = 6N° Cells with GRC = 7N° Cells with GRC = 8N° Cells with GRC = 9Cell Occupancy with GR > 6Max GRCFinal GRCSAIL
H 012,5713151713378%97VI
7%2%12%40%31%7%
H 113,1921071518181%97VI
2%0%17%36%43%2%
H 213,1920171518181%97VI
0%2%17%36%43%2%
H 313,3990181418179%97VI
0%2%19%33%43%2%
H 413,3990181517179%97VI
0%2%19%36%40%2%
H 511,9254221116479%97VI
10%5%5%28%41%10%
H 611,9250131319390%97VI
0%3%8%33%49%8%
H 711,2780121021292%97VI
0%3%6%28%58%6%
H 811,9850031022392%97VI
0%0%8%26%58%8%
H 911,9850031121392%97VI
0%0%8%29%55%8%
H 1011,27800012213100%97VI
0%0%0%33%58%8%
H 1111,63200012223100%97VI
0%0%0%32%59%8%
H 1211,63200011233100%97VI
0%0%0%30%62%8%
H 1311,63200011233100%97VI
0%0%0%30%62%8%
H 1411,63200010243100%97VI
0%0%0%27%65%8%
H 1512,4850021025395%97VI
0%0%5%25%63%8%
H 1612,485002927295%97VI
0%0%5%23%68%5%
H 1712,1320011125297%97VI
0%0%3%28%64%5%
H 1811,2780011025097%86V
0%0%3%28%69%0%
H 1911,718005725287%97VI
0%0%13%18%64%5%
H 2011,0710031122092%86V
0%0%8%31%61%0%
H 2111,2780031419092%86V
0%0%8%39%53%0%
H 2212,0711051418285%97VI
3%0%13%35%45%5%
H 2312,4851061419183%97VI
3%0%15%33%48%3%
Disclaimer/Publisher’s Note: The statements, opinions and data contained in all publications are solely those of the individual author(s) and contributor(s) and not of MDPI and/or the editor(s). MDPI and/or the editor(s) disclaim responsibility for any injury to people or property resulting from any ideas, methods, instructions or products referred to in the content.

