Article

Optimization Design and Experimental Study of Solid Particle Spreader for Unmanned Aerial Vehicle

1
Research Center of Intelligent Equipment, Beijing Academy of Agricultural and Forestry Sciences, Beijing 100097, China
2
National Research Center of Intelligent Equipment for Agriculture, Beijing 100097, China
3
National Center for International Research on Agricultural Aerial Application Technology, Beijing 100097, China
4
Graduate School of Agriculture, Kyoto University, Kyoto 606-8502, Japan
*
Author to whom correspondence should be addressed.
Drones 2024, 8(12), 726; https://doi.org/10.3390/drones8120726
Submission received: 20 October 2024 / Revised: 23 November 2024 / Accepted: 29 November 2024 / Published: 1 December 2024

Abstract

:
This study designed and investigated a solid particle spreader, as well as parameter optimization and experimental for a groove wheel, to mitigate the problems of low uniformity and poor control accuracy of solid particulate material UAV spreading. The discrete element method was used to simulate and analyze the displacement range and stability of each grooved wheel at low speeds. Furthermore, orthogonal regression and response surface analyses were used to analyze the influence of each factor on the stability of the discharge rate and pulsation amplitude. The results showed that the helix angle, sharpness, and length of the groove significantly influenced the application performance, whereas the number of grooves had no significant influence. The groove shape was eccentric, the helix angle was 50°, the length was 35 mm, and the number of grooves was 7. Additionally, the bench test results showed that in the range of 10–60 rpm, the relative deviation of the discharging rate between the simulation and bench test is from 0.47% to 10.39%, and the average relative deviation is 3.93%. Between the groove wheel rotation speed and discharge rate, R2 was 0.991, and the adjustable range of the discharge amount was between 3.68 and 23.43 g/s. The minimum and maximum variation coefficients of the average discharge rate among individual applicators were 1.01% and 2.79%, respectively, whereas the standard deviations were 0.09 and 0.46 g/s, respectively. In conclusion, the discharge stability and adjustable range of the spreader using the optimized groove wheel satisfied the requirements for solid particulate material discharge.

1. Introduction

Agricultural production environments can be complex, with significant differences in planting and management practices. The growth of crop plants in the middle and late stages of growth often limits the application of ground machinery [1,2]. Unmanned aerial vehicles (UAVs) exhibit high working efficiency, fewer constraints by the ground environment, and the ability to operate regardless of changes in the working environment or crop growth stages. Furthermore, the difficulties faced in accessing fields during the middle and late growth stages of crops can be resolved using UAV. Therefore, UAVs are becoming important agricultural working tools [3,4,5]. In recent years, UAV-based techniques have been widely used for remote sensing [6], pesticide spraying [7,8], seed sowing [9,10,11], and fertilization spreading [12,13]. Companies like DJI and XAIRCRAFT in China have successively launched various models of UAV spreaders, which demonstrates the effectiveness of UAV spreading operations in actual applications [14].
The discharge apparatus is a key component of a UAV spreader, and its performance directly affects the spreading quality [15]. The centrifugal disc spreading method uses the centrifugal force generated by the spreading disc to spread materials in the field and is currently widely used in UAV-based fertilization, with the advantage of simple structure and high work efficiency but also with the disadvantage of uneven spreading and difficulty in controlling the spreading amplitude. Hwang et al. analyzed the extent to which the movement of the shield hole affects the distribution of fertilizer particles to determine its optimal position to improve the uniformity of fertilizer spreading [16]. Coetzee et al. established a model to investigate the effect of adding deflector plates under a double centrifugal disc structure on the distribution state of fertilizer particles and the amount of spreading [17]. Wang et al. proposed a solution that incorporated a horizontal screw auger, curved and straight vanes on the disc, and a cover with bumps to enhance the distribution uniformity of a large discharge rate disc spreader for UAV fertilizer application. This achieved a discharge rate of 190.02 kg/min, with an 8 m operation width and low coefficient of variation (CV) of 14.68% for compound fertilizer application [18]. Besides the centrifugal disc spreading method, the grooved wheel-based spreading method is widely used and also has a simple structure, low cost, and strong adaptability to particles [19]. According to the comparative experiments conducted by Song et al., the grooved wheel-based method is able to provide superior performance in precise fertilization for a large application range compared to the centrifugal disc spreading method [20]. When the grooved wheel rotates at a low speed, periodic pulsation will occur and potentially lead to under-application or omission [21].
Combined with the aerodynamic solid particle UAV application characteristics of this study, the groove wheel-based spreading method is considered more advantageous in terms of application flexibility and adjustment accuracy [22]. To achieve the target of discharging with low pulsation and stable application rate, researchers have conducted extensive studies on the optimization parameters of the groove wheel and discharge apparatus. Zheng et al. designed a mechanism for an electromagnetic vibrating-type seeding device that combines a grooved wheel and electromagnetic vibrations to improve the uniformity and stability of seeding [23]. Sun et al. designed an outer-grooved wheel fertilizer-spreading device, analyzed the speed and force of particles during the process of spreading, and obtained a spiral groove structure to reduce particle damage [24]. Karayel et al. analyzed the consistency of the seed particle spacing spread using an outer grooved wheel metering device and determined the optimal parameters of the grooved wheel to improve the uniformity of seeding [25]. All these studies demonstrated that optimizing the structural parameters of the grooved wheel can effectively reduce pulsation and improve discharge stability. However, the above studies were mainly conducted on ground-machinery application scenarios. There is still very little research on groove wheel discharge apparatus for UAVs. Song et al. designed a staggered groove for UAV application to reduce the pulsation phenomenon [26]. Further research is required to optimize the groove wheel by considering the limitations of the load and size of UAVs and for different application scenarios.
This study investigated a grooved wheel-based discharge apparatus suitable for precise spreading by UAVs to solve the problems of low uniformity and poor precision of UAV-based solid particle spreading. First, the effects of the groove section shape, wheel length, helix angle, and the number of grooves on the stable discharge performance were investigated using the discrete element method. Orthogonal tests were designed to analyze the simulation test results. Based on the significance regression analysis and response surface analysis, the influence of each factor on the stability of the discharge and its pulsation amplitude was analyzed, and the influence level of each factor was further studied. Finally, optimized structural parameters of the grooved wheel were obtained and used to develop a UAV discharge apparatus. Bench tests were performed to evaluate the stability and pulsation amplitude of the designed discharge apparatus.

2. Materials and Methods

2.1. UAV-Based Solid Particulate Material Spreading System and Structure of Discharge Apparatus

A UAV-based particulate material spreading system comprises multiple unit spreaders, which can be adjusted depending on the UAV loading capacity (Figure 1). The unit spreader comprises a bunker, discharge apparatus, air-solid mixing tube, booster fan, and a particulate accelerating tube (Figure 2). As shown in Figure 1, the UAV is loaded with six spreader units, and the intervals between the units can be adjusted. The discharge apparatus was installed under the bunker, and the solid particulate material was accelerated in the particulate accelerating tube to ensure the sprayed solid particulate material obtained a high velocity with high directive.
This study investigated an external groove wheel-structured helical groove wheel discharge apparatus. The discharge apparatus comprised a shell, a helical groove wheel, a guide plate, and a discharge tongue (Figure 3). During discharge, the solid particulate material entered one side of the discharge apparatus by following a guide plate. When the groove wheel does not rotate, the solid particulate material is blocked by the discharging tongue to prevent falling. When the groove wheel rotates, the solid particulate material rotates with the discharging groove wheel, fills the groove, and is discharged at the uncovered size of the tongue.
According to the principle of the groove wheel discharge apparatus, the discharge capacity is equal to the number of particulates filled into the groove by one circular rotation of the helical groove wheel [27]. The discharge rate Q is calculated as follows:
Q = l ρ α 0 s z + π d l ρ λ
l = H × π D S 2 + 1
where Q is the discharge rate of the helical groove wheel in one circle (g/r). D is the outer diameter of the helical groove wheel, s is the cross-sectional area of a single groove (cm2), ρ is the stacking density of the particulate (kg/m3), α 0 is the filling coefficient of particulate in helix groove (g/r), λ is the driving layer characteristic parameter, z is the number of grooves, L is the effective working length of the helical groove wheel (mm), and H is the length of the helical groove wheel (mm).

2.2. Structure Design and Parameter Analysis of the Groove Wheel

An appropriate shape of the groove wheel is conducive to the filling and discharge of solid particles, according to the work principle of the groove wheel and the movement state of the solid particles in the groove. In this research, circular-arc, eccentric-arc, and circumscribed-arc, the three different shapes of grooves, were designed for analysis, and all the grooves had similar section surfaces. As shown in Figure 4, the intersection angles across the two ridges θ, outer circle Diameter D, and radius of the bottom arc Rd were set to 54°, 40 mm, and 4 mm, respectively, for all three groove section shapes. The groove depths h1, h2, and h3 for the three groove types were 10, 11, and 10 mm, respectively. The eccentric angle of the bottom arc of the eccentric arc groove was set to 10°.
To ensure continuity discharging of the discharge apparatus, the helix angle range should satisfy the following equation:
β arccos d δ l z
where β is the helix angle (°), d is the sheave diameter (mm), δ is the curvature of the wheel ridge, l is the effective length of the groove (mm), and z is the number of grooves.
Under the combined action of gravitational force G, normal thrust force P n , and tangential frictional force P f of the helix surface, the particulates perform axial and radial rotation and finally to complete the discharging process [28,29]. The force analysis of the particles in the grooves is shown in Figure 5a based on the movement analysis of the particulates in the groove and by neglecting the interaction among the particles and treating one particulate as a point particle. In this study, the expansion helix curve was equivalent to an oblique line with an angle equal to the spiral rise angle, as shown in Figure 5b. The resultant force F on the particle can be decomposed into axial force F z and circumferential force F t as follows:
F z = F cos α + β F t = F sin α + β β = arctan P h π d
where P h is the screw pitch of the grooved wheel (mm), d is the diameter of the groove wheel (mm), F, F z , and F t are the resultant force, axial force, and circumferential force of particles in the groove (N), respectively. α is the friction angle between the particles and the groove surface (°).
Through the actual measurement, the friction angle between the test fertilizer particles and the grooved wheel utilized in this study was ascertained to be 17.52°. Curves depicting the circumferential force and axial force of the material particles within the helix groove wheel with respect to the helix angle are calculated and shown in Figure 6. It can be found that as the helix angle of the groove wheel increases, the circumferential force of the particles in the groove first increases and then decreases, while the axial force gradually decreases. When the helix angle is greater than 30°, the circumferential force exceeds the axial force. The circumferential force attains its maximum when the helix angle reaches 70°. According to the kinematic principle, the circumferential force must be greater than the axial force for the particles to be discharged from the groove, otherwise they will rotate in the groove. Based on this analysis, the range of helix angle selection is 30–70°.

2.3. Simulation Model

As it is difficult to directly measure the pulsation amplitude and time parameters of the groove wheel discharge apparatus, the DEM simulation method was used to simulate the movement of the particulates. The discharge characteristics of groove wheels with different structural parameters were analyzed to provide a basis for structural optimization.
In the DEM simulation, a tetrahedral four-sphere model was selected to generate the particulate model. The adhesion between the particulates was neglected, and the Hertz–Mindin (no-slip) model was adopted as the contact model [30,31,32]. The parameters of the particulate characteristics were measured for an actual particulate material with an average diameter of 4.53 mm, as shown in Table 1.
A three-dimensional model of the discharge apparatus was established using the SolidWorks 2018 software and simplified into three parts: the shell, the helix groove wheel, and the particulate discharging tongue. As the groove wheel was fabricated using a 3D printer, the parameters of the groove wheels were in accordance with the physical characteristics of the printing materials. To reduce the number of simulation computations, the range of the calculation domain should be reasonably set. In this study, the calculation domain was set 30 mm beyond the outlet of the discharge apparatus.
As shown in Figure 7, a particulate factory was built above the bunker to dynamically generate particulates. To avoid a lack of particulates during the simulation process, the initial particulate should exceed one-third of the fertilizer box. The particulate generation speed, generation time, falling speed, gravitational acceleration, and total simulation time were set to 1000 g/s, 1 s, 2 m/s, 9.81 g/m2, and 6 s, respectively.
In this study, the DEM simulation was conducted by considering the groove section shape, helix angle, and groove numbers as the influencing factors and the differences in the discharge amount and rate for the performance evaluation. A virtual particulate flow sensor was set up to obtain the instantaneous particulate rate, as shown in Figure 7.
Based on the particulate flow rate generated by the virtual particulate flow sensor, the pulsation amplitude of the discharge rate is calculated as follows:
S W = Q max Q min
where S W is the pulsation amplitude (g/s), Q max is the maximum instantaneous discharge rate (g/s), and Q min is the minimum instantaneous discharge rate (g/s).

3. Results and Discussion

3.1. Simulation Experiments

In this study, the groove shape, length, helix angle, and number of grooves were considered, and the interactions between these parameters were investigated. A quadratic orthogonal experiment with four factors and three levels was conducted, and the parameter levels were selected as listed in Table 2, with a rotation speed of 30 rpm. The three groove shapes of the circular, eccentric, and circumscribed arcs are represented by Y, P, and W, respectively. The groove shape, length, groove helix angle, and number of grooves are represented as A, B, C, and D.
According to the four-factor and three-level orthogonal rotation combination, 29 groups of simulation experiments were conducted, and a quadratic regression analysis was performed based on the test results. Regression equations for the stability variation coefficient and pulsation amplitude were obtained, and their significance was evaluated. The simulation results are presented in Table 3.

3.1.1. Significance Evaluation of Pulsation Amplitude

Variance analysis and significance evaluation were performed based on the quadratic regression model. Table 4 shows the variance analysis of the pulsation amplitude. After eliminating non-significant items, the quadratic regression model of the pulsation amplitude was obtained as follows:
Y = 31.43 − 1.47A + 0.16B + 2.47C − 0.57D − 0.031AB − 0.31AC + 0.57AD − 0.28BC − 0.031BD + 1.27CD
+ 2.65A2 − 2.38B2 + 1.55C2 − 2.1D2
The analysis results showed that a p value of the quadratic regression model smaller than 0.01 indicated extreme significance, and a p value larger than 0.05 indicated non-significance. In addition, the regression model correctly reflected the relationship between the factors and errors and can be used for predicting the simulation results. Meanwhile, the R-squared of the regression model was 0.938, and the adjusted R-squared was 0.881. Furthermore, 88.10% of the data could be explained by the model, indicating that the regression model was highly reliable. Regarding the principal factors, the groove shape and helix angle had an extremely significant influence (p < 0.01), the number of grooves had a significant influence (p < 0.05), and the groove length had an insignificant effect (p > 0.05) on the pulsation amplitude of Y. In terms of interaction, the groove helix angle and number of grooves had an extremely significant influence (p < 0.01), whereas the groove helix shape and groove number had a significant influence (p < 0.05) on the pulsation amplitude of Y. The influence level of each factor on the pulsation amplitude was in the order of C, A, D, and B, from largest to smallest.

3.1.2. Response Surface Analysis of Discharge Apparatus Performance

Design-Expert 13 software was used to process the simulation experimental data, and the response surface plots of the discharge apparatus performance indicators with two fixed factors are shown in Figure 8. Combined with the analysis of the variance results, the interacting factors with significant effects were analyzed. As shown in Figure 8b, when the helix angle was low, the pulsation amplitude first decreased gradually as the number of grooves increased. When the helix angle was large, the pulsation amplitude first increased and then decreased as the helix angle increased. When the number of grooves was small, the pulsation amplitude first decreased and then increased as the helix angle increased. When the number of grooves was large, the pulsation amplitude initially increased as the helix angle increased. This indicates that the interaction between the number of grooves and helix angle with relatively high significance can be known when the number of grooves is 6–7 and the helix angle is between 50 and 55°, and the pulsation amplitude is relatively small. Furthermore, the effect of the helix angle was greater than that of the number of grooves.
As shown in Figure 8d, the pulsation amplitude first decreased and then slowly increased as the groove shape increased. As the number of grooves increased, the pulsation amplitude first increased and then rapidly decreased. Moreover, when the groove shape had different values, as the number of grooves increased, the pulsation amplitude differed, indicating a significant interaction effect between the number of grooves and groove shape. Additionally, when the groove shape was 2–3 and the number of grooves was approximately 6–7, the pulsation amplitude was relatively small. The slope of the pulsation amplitude changed more with the groove shape than the number of grooves, indicating that the groove shape had a greater influence on the pulsation amplitude than the number of grooves. As shown in Figure 8e, the changing trends of the pulsation amplitude with changes in the groove shape and length were similar to those shown in Figure 8d. When the groove shape was 2–3 and the length of grooves was approximately 35–37 mm, the pulsation amplitude was relatively small, and the slope of the pulsation amplitude affected by the groove shape change was greater than that of the groove length, thereby indicating that the groove shape had a greater influence on the pulsation amplitude.
Figure 8a,c show that the helix angle had a greater influence on the pulsation amplitude than the groove shape and length. As seen in Figure 8a, when the groove shape was 2–3 and the helix angle was between 50 and 55°, the pulsation amplitude was smaller. As seen in Figure 8c, when the helix angle was between 50 and 55° and the groove length was between 35 and 37 mm, the pulsation amplitude decreased. Figure 8f shows that the changes in the pulsation amplitude affected by the length and number of grooves had a relatively small influence on the pulsation amplitude values, and the degrees of influence were close to each other with an insignificant interaction. The factors of the groove shape, length, helix angle, and number that affect the discharge pulsation amplitude range are consistent with the variance analysis results presented in Table 4.
Based on the variance analysis and significance evaluation and considering the influence of the four factors on the stability of the discharge performance and pulsation amplitude, the optimal solution can be obtained by setting the minimum pulsation amplitude as the optimization objective. The groove shape was 2, the groove length was 35 mm, the helix angle was 50°, and the number of grooves was 6.853. After modification according to the actual experimental situation, the parameters can be adjusted and fixed as follows: the groove shape was an eccentric arc, the groove length was 35 mm, the groove helix angle was 50°, and the number of grooves was 7. The groove wheels with the above parameters can ensure that the discharge apparatus achieves a minimum pulsation amplitude and a stable discharge.
Using the optimized groove wheel parameters, the discharging amount at different groove wheel rotation speeds of 10, 20, 30, 40, 50, and 60 rpm were recorded in simulation for 5 s, as shown in Figure 9.

3.2. Experiments of Bench Test

Based on the optimized parameters, the groove wheels and components were produced using a 3D printer, and six spreader units were assembled and integrated on a UAV for performance evaluation experiments, as shown in Figure 10. The fertilizer parameters used for the experiments are listed in Table 5, with an average equivalent diameter of 4.53 mm.
In the experiments of bench test, the fertilizer discharging performance evaluation for all six spreader units was conducted. The speed of the groove wheel driving motor was adjusted by the fertilizer discharging rate control unit, which is implemented on the UAV, and the rotation speed of the groove wheels was controlled at 10 rpm, 20 rpm, 30 rpm, 40 rpm, 50 rpm, and 60 rpm. During the experiment, sufficient fertilizer of 3 kg was filled in all six bunkers, and collection boxes were placed under each spreader unit to collect discharged fertilizer. The weight of fertilizer discharged from each spreader unit was measured using an electronic scale with an accuracy of 0.01 g. The discharging time was 30 s for each experiment, repeated three times for each rotation speed. As listed in Table 6, the discharging rate of six spreader units was recorded, and the average discharge rates of the UAV spreader at different rotation speeds were calculated as 3.68 g/s, 7.71 g/s, 11.78 g/s, 16.06 g/s, 19.40 g/s, and 23.43 g/s, as listed in Table 7.
The stability of the discharge rate is expressed by the coefficient of variation (CV) in the simulation and is calculated as follows:
X ¯ = i = 1 m X i m
S F = i = 1 m X i X ¯ 2 m 1
V F = S F X
where the X ¯ is the average weight of the discharged particulates (g), X i is the weight of the discharged particulate measured in the ith test (g), m is the number of repetitions, and S F is the standard deviation of discharged particulates (g).

3.3. Discussion

3.3.1. Deviation of Discharging Rate Between Simulation and Bench Test

Based on the simulated discharging amount at different groove wheel rotation speeds, as shown in Figure 9, the discharging rate of simulation can also be calculated (Table 8). By calculating the relative deviation of the discharging rate between the bench test and simulation, the reliability of simulation results can be verified.
The relative deviation of the discharging rate between the simulation and bench test can be calculated as follows:
E = Q b e n c h Q s i m Q b e n c h × 100 %
where E is the relative deviation, Q b e n c h is the discharging rate obtained from the bench test (g/s), and Q s i m is the discharging rate obtained from the simulation (g/s).
From Table 8 and Figure 11, it could be found that the relative deviation of the discharging rate between the simulation and bench test is from 0.47% to 10.39% with an average relative deviation of 3.93%. The reasons causing the deviation between the simulation and the bench test results can be attributed to the fact that the physical parameters, including the model size and the dynamic and static friction coefficients of the fertilizer particles used in the simulation model, may not perfectly match those of the actual fertilizer particles, and the size uniformity of the actual fertilizer particles may not be as consistent as what is assumed in the simulation.
Linear regression was further used to obtain the relationship between the groove wheel rotation speed and the discharging rate, as shown in Figure 11. It can be observed that in both the simulation and bench test, the discharge rate increased linearly as the groove wheel rotation speed increased. The fitted equation is given as follows:
Q b e n c h = 0.3946 x 0.1333
Q s i m = 0.4059 x 0.0957
where x is the groove wheel speed (rpm).
From the above analysis, it could be verified that the results from the bench test can match well with the simulation results, and the groove wheel optimization approach and optimal structure parameters provided by the research are efficient.
Also, as shown in Figure 11, the R2 for the fitted equation of the bench test archived up to 0.9991 indicates that the linear function relationship between the discharging rate and groove wheel speed has a very high goodness of fit, which enables the precise control of solid particulate material discharge by adjusting the groove wheel rotational speed. Taking solid particulate fertilizer as a case study, the adjustable range of discharge is between 3.68 and 23.43 g/s. The designed UAV spreading system has an operational width of 1.8 m, six spreader unit installations, and a flight speed of 1–3 m/s. Based on these UAV operation parameters, it can be calculated that the adjustable range of the discharging rate for one hectare is 40.88–781 kg/ha. This adjustable range can meet the application requirements of sowing, fertilization, and other solid particles for most crops.

3.3.2. Discharging Rate Stability of Bench Test

As mentioned above, experiments of the bench test were conducted three times under different groove wheel rotation speeds to record the discharging rate of each spreader. Using the discharge rates of each spreader unit (Table 6), the coefficient of variation among the unit spreaders and the standard deviation of each spreader unit was calculated using Equations (7)–(9), as shown in Table 9 and Table 10 and Figure 12.
The average standard deviation of each spreader unit was obtained by calculating the average coefficient of variation of the discharge rate among different spreaders at different rotation speeds, as shown in Table 8. The highest coefficient of variation (2.79%) was observed when the groove wheel speed was 10 rpm. When the groove wheel speed was 30 rpm, the average coefficient of variation reached a minimum of 1.01%. When the groove wheel speed was 60 rpm, the average coefficient of variation was 2.00%. The results showed that the standard deviation tended to increase with increasing rotation speed, and the minimum and maximum values were 0.09 g/s and 0.46 g/s, respectively. Compared with the designed grooved wheel-based spreaders by Sun et al., 2020 and Song et al., 2023 with a variation coefficient of fertilizer amount of 5.60% [24] and 9.23% [33], respectively, the groove wheel-based spreader designed in our research exhibited superior spreading uniformity.

4. Conclusions

For UAV-based precise spreading of solid particles, such as seeding and fertilization, this research designed an innovative small-sized groove wheel-type discharge apparatus for UAV applications and proposed a solution for groove wheel parameter optimization.
Firstly, three kinds of groove wheel structures of circular, eccentric, and circumscribed arcs were investigated, and an EDEM simulator was established to conduct simulation experiments for optimizing the major parameters such as groove length, helix angle, and numbers.
Secondly, the significance of the groove parameters influencing the discharge pulsation amplitude was investigated. By combining orthogonal regression analysis and response surface analysis, the optimal structural parameters of the groove wheel-type spreader were determined. The results showed that the helix angle and groove shape had an extremely significant influence on the pulsation amplitude, and the number of grooves had a significant influence, while the groove length had a non-significant influence on the pulsation amplitude. The optimal wheel combination parameters of the groove shape, groove length, groove helix angle, and number of grooves were determined to be eccentric, 35 mm, 50°, and 7, respectively.
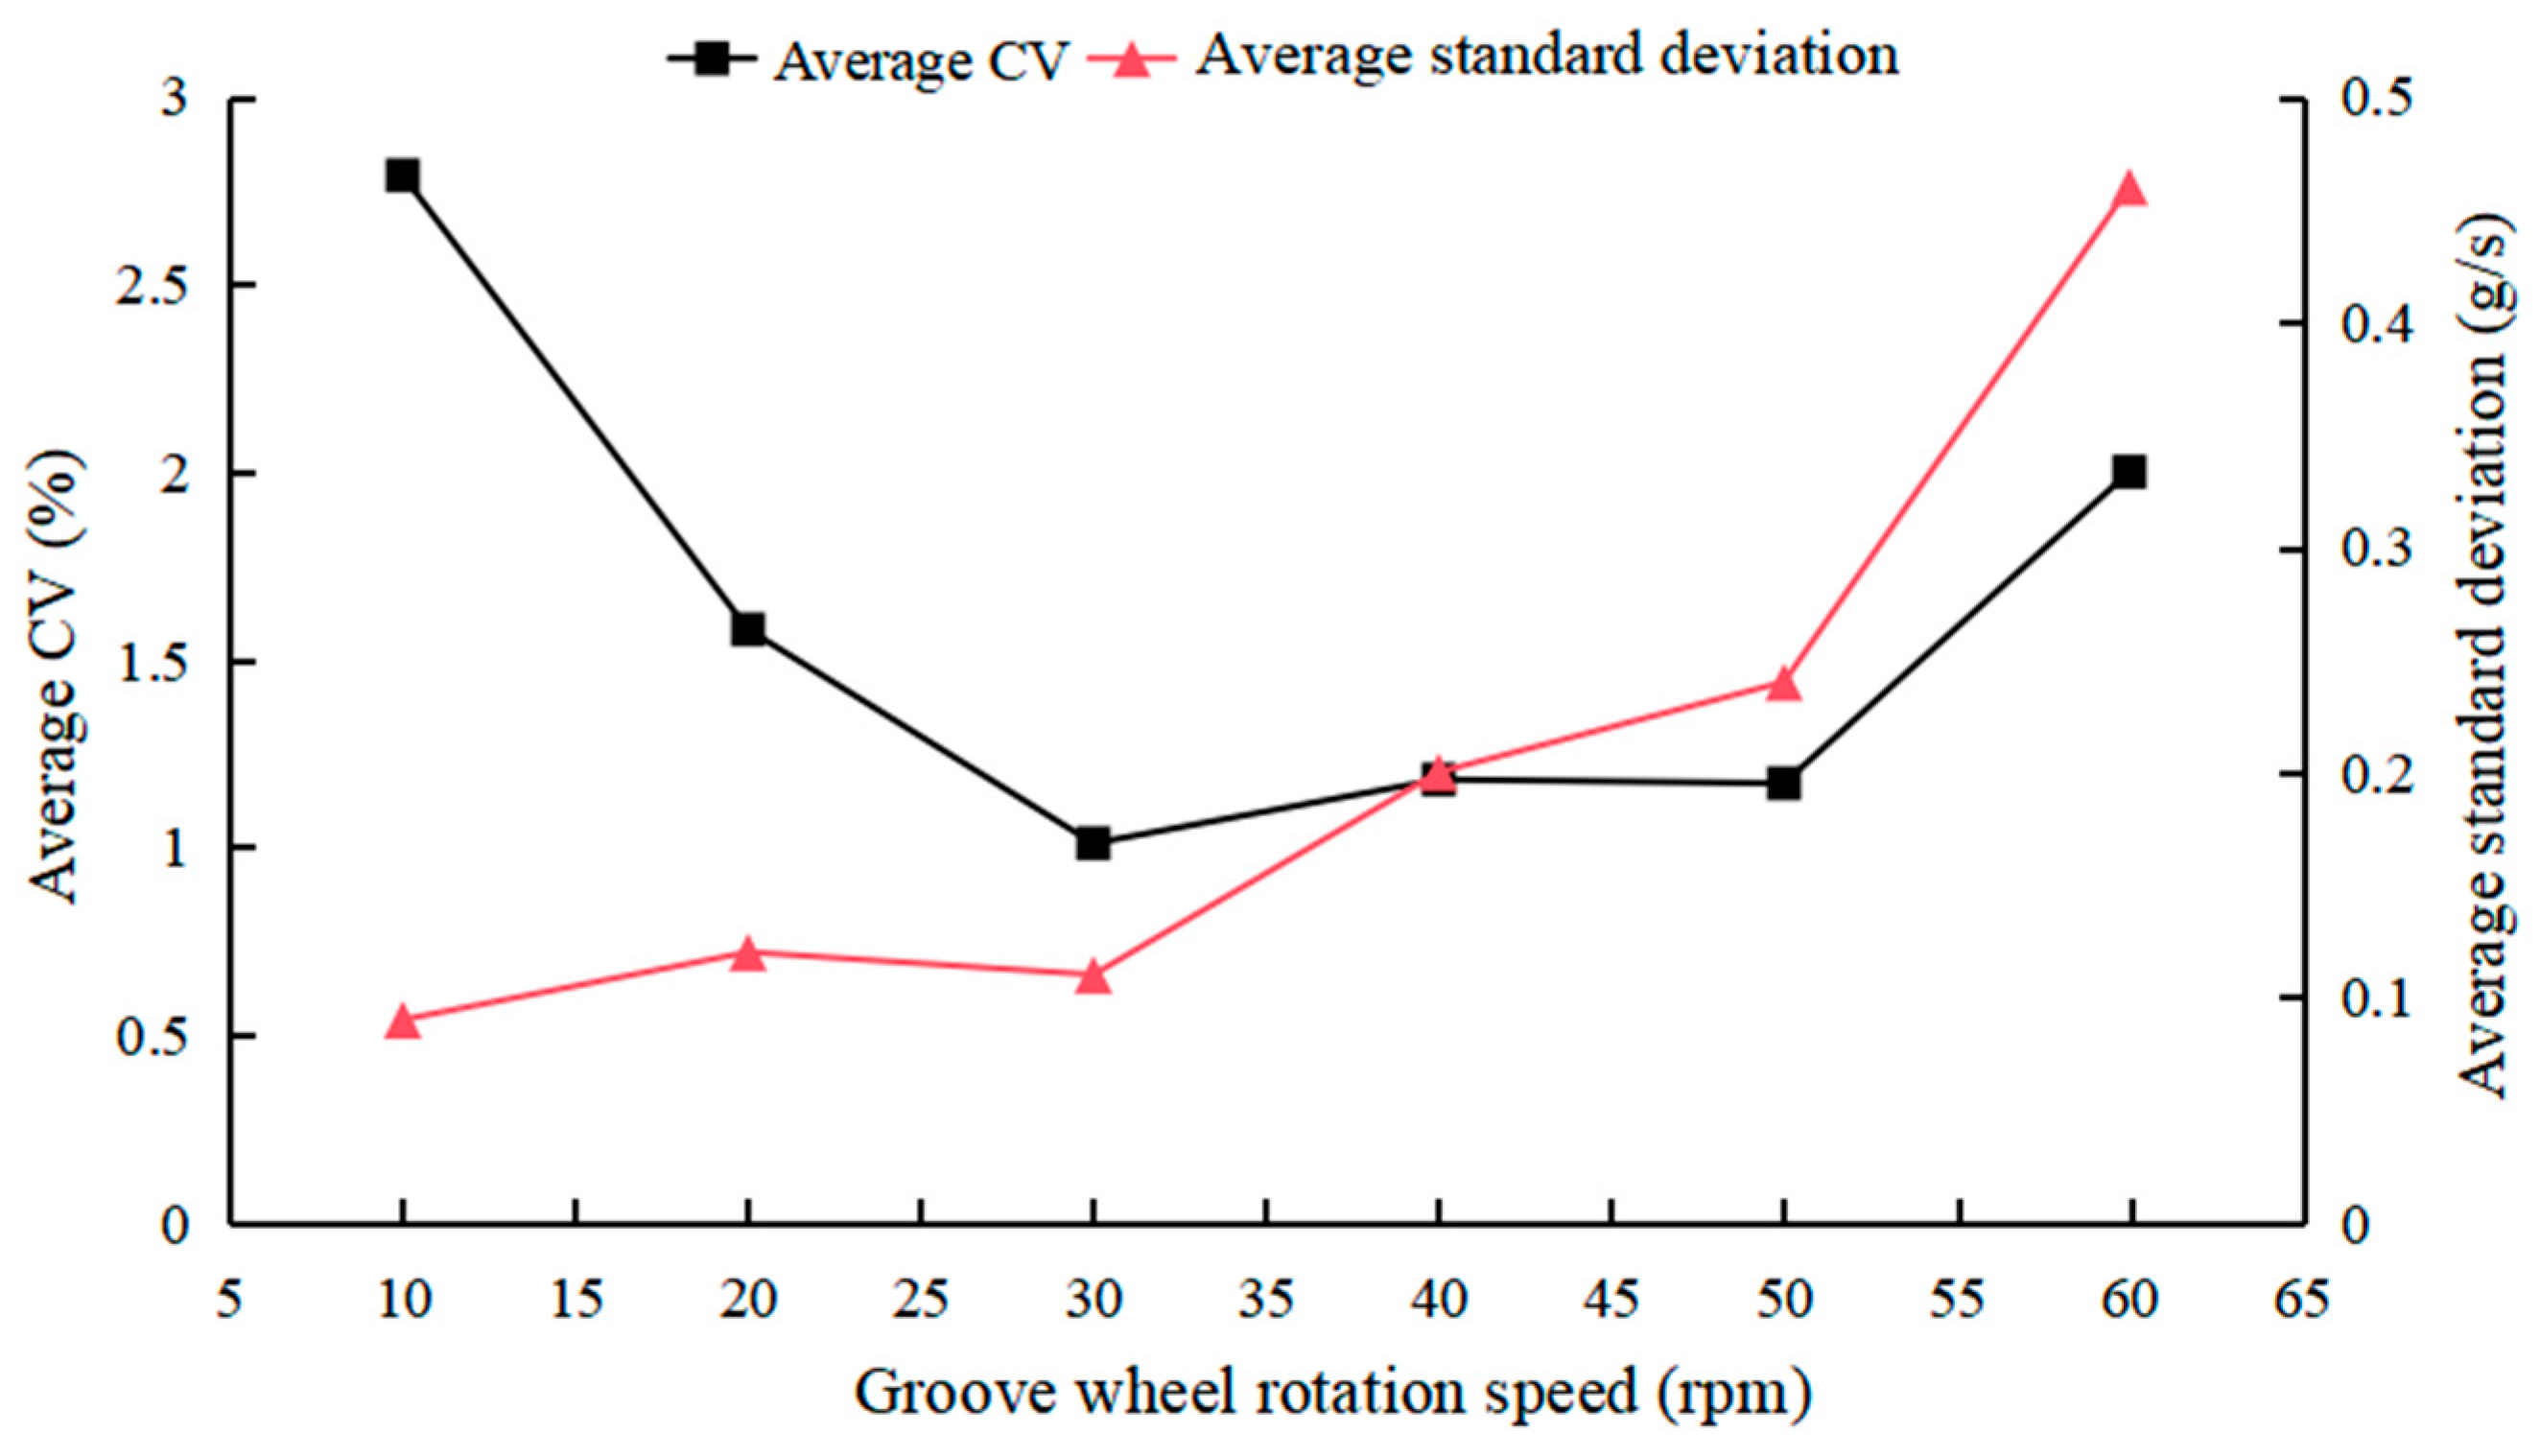
Finally, a solid particle spreader was designed with the parameter of the optimized groove wheel. A bench test was carried out to evaluate the spreading stability and analyze the correlation between the rotation speed of the groove wheel and the spreading rate. The results indicated that when the rotation speed was within the range of 10–60 rpm, the average relative deviation between the bench test and the simulation was 3.93%, the maximum coefficient of variation of the average spreading rate among six spreaders was 2.79%, and the correlation coefficient between the speed of the groove wheel and the spreading rate reached 0.991.
In conclusion, the optimization design method proposed in this research for solid particle spreaders is reasonable and effective. The parameters obtained from the simulation environment can be highly consistent with the actual condition. Based on this research, we will further evaluate and optimize the stability and control accuracy of solid particle materials with different particle sizes in the scenario of seeding and fertilization in our future research.

Author Contributions

L.Z.: writing—original draft, methodology, funding acquisition. R.Z.: writing—review and editing, supervision, resources, conceptualization. T.Y.: visualization, validation. D.Z.: visualization, validation. C.D.: formal analysis. M.W.: visualization, validation. R.N.: review, conceptualization. All authors have read and agreed to the published version of the manuscript.

Funding

This study was supported by the Shanghai Chongming Agricultural Science and Technology Innovation Project (2021CNKC-05-03), the Construction project of the international science and technology cooperation platform of BAAFS (2024-01), and Innovation Capacity Construction Project of the BAAFS (KJCX20240324).

Institutional Review Board Statement

Not applicable.

Informed Consent Statement

Not applicable.

Data Availability Statement

Data are contained within the article.

Conflicts of Interest

The authors declare no conflicts of interest.

References

  1. Edson, C.D.; Takashi, M.; Alefe, V.B. Biomass and Nutrient Accumulation by Cover Crops and Upland Rice Grown in Succession Under No-Tillage System as Affected by Nitrogen Fertilizer Rate. J. Crop Sci. Biotechnol. 2020, 23, 117–126. [Google Scholar]
  2. Pan, S.G.; Wen, X.C.; Wang, Z.M.; Ashraf, U.; Tian, H.; Duan, M.Y.; Mo, Z.W.; Fan, P.S.; Tang, X.R. Benefits of mechanized deep placement of nitrogen fertilizer in direct-seeded rice in South China. Field Crops Res. 2017, 203, 139–149. [Google Scholar] [CrossRef]
  3. Ehsani, R.; Maja, J.M. The rise of small UAVs in precision agriculture. Resource 2013, 20, 18–19. [Google Scholar]
  4. Zeng, S.; Tan, Y.P.; Wang, Y.; Luo, X.W.; Yao, L.M.; Huang, D.P.; Mo, Z.W. Structural design and parameter determination for fluted-roller fertilizer applicator. Int. J. Agric. Biol. Eng. 2020, 13, 101–110. [Google Scholar] [CrossRef]
  5. Zhang, R.R.; Andrew, J.H.; Chen, L.P.; Li, L.L.; Tang, Q. Challenges and opportunities of unmanned aerial vehicles as a new tool for crop pest control. Pest Manag. Sci. 2023, 11, 4123–4131. [Google Scholar] [CrossRef]
  6. Xia, L.; Zhang, R.; Chen, L.; Huang, Y.; Xu, G.; Wen, Y.; Yi, T. Monitor Cotton Budding Using SVM and UAV Images. Appl. Sci 2019, 9, 4312. [Google Scholar] [CrossRef]
  7. Zhang, R.R.; Wen, Y.; Li, L.L.; Chen, L.P.; Xu, G.; Huang, Y.; Tang, Q.; Yi, T. Method for UAV spraying pattern measurement with PLS model based spectrum analysis. Int. J. Agric. Biol. Eng. 2020, 13, 22–28. [Google Scholar] [CrossRef]
  8. Li, L.L.; Hu, Z.; Liu, Q.; Yi, T.; Han, P.; Zhang, R.; Pan, L. Effect of flight velocity on droplet deposition and drift of combined pesticides sprayed using an unmanned aerial vehicle sprayer in a peach orchard. Front. Plant Sci. 2022, 13, 981494. [Google Scholar] [CrossRef] [PubMed]
  9. Liu, W.; Zou, S.; Xu, X.; Gu, Q.; He, W.; Huang, J.; Luo, X. Development of UAV-based shot seeding device for rice planting. Int. J. Agric. Biol. Eng. 2022, 15, 1–7. [Google Scholar] [CrossRef]
  10. Wang, X.Y.; Yang, G.D.; Pan, X.C.; Xiang, H.S.; Peng, S.B.; Xu, L. Feasibility of improving unmanned aerial vehicle-based seeding efficiency by using rice varieties with low seed weight. Rice Sci. 2022, 29, 299. [Google Scholar]
  11. Liu, W.; Zhou, Z.; Xu, X.; Gu, Q.; Zou, S.; He, W.; Jiang, R. Evaluation method of rowing performance and its optimization for UAV-based shot seeding device on rice sowing. Comput. Electron. Agric. 2023, 207, 107718. [Google Scholar] [CrossRef]
  12. Kharim, M.; Wayayok, A.; Shariff, A.; Abdullah, A.F.; Husin, E.M. Droplet deposition density of organic liquid fertilizer at low altitude UAV aerial spraying in rice cultivation. Comput. Electron. Agric. 2019, 167, 105045. [Google Scholar] [CrossRef]
  13. Zhu, S.; Zhou, W.; Zhu, L.; Sun, B.; Huang, S.; Wu, Z.; Ren, W. Unmanned air vehicle adaptability and application evaluation for new rice panicle fertilizers: Fertilizer characteristics and mechanical adaptability. Technol. Agron. 2022, 2, 1–8. [Google Scholar] [CrossRef]
  14. Hu, P.; Zhang, R.; Yang, J.; Chen, L. Development Status and Key Technologies of Plant Protection UAVs in China: A Review. Drones 2022, 6, 354. [Google Scholar] [CrossRef]
  15. Hu, J.; He, J.C.; Wang, Y.; Wu, Y.P.; Chen, C.; Ren, Z.Y. Design and study on lightweight organic fertilizer distributor. Comput. Electron. Agric. 2020, 169, 105149. [Google Scholar] [CrossRef]
  16. Hwang, S.J.; Nam, J.S. DEM simulation model to optimise shutter hole position of a centrifugal fertiliser distributor for precise application. Biosyst. Eng. 2021, 204, 326–345. [Google Scholar] [CrossRef]
  17. Coetzee, C.J.; Lombard, S.G. Discrete element method modelling of a centrifugal fertiliser spreader. Biosyst. Eng. 2011, 109, 308–325. [Google Scholar] [CrossRef]
  18. Wang, X.W.; Zhou, Z.Y.; Chen, B.Q.; Zhong, J.F.; Fan, X.L.; Andrew, H. Distribution uniformity improvement methods of a large discharge rate disc spreader for UAV fertilizer application. Comput. Electron. Agric. 2024, 220, 108928. [Google Scholar]
  19. Gao, X.; Xie, G.; Xu, Y.; Yu, Y.; Lai, Q. Application of a staggered symmetrical spiral groove wheel on a quantitative feeding device and investigation of particle motion characteristics based on DEM. Powder Technol. 2022, 407, 117650. [Google Scholar] [CrossRef]
  20. Song, C.C.; Zang, Y.; Zhou, Z.Y.; Luo, X.W.; Zhao, L.L.; Ming, R.; Zi, L.; Zang, Y. Test and Comprehensive Evaluation for the Performance of UAV-Based Fertilizer Spreaders. IEEE Access 2020, 8, 202153–202163. [Google Scholar] [CrossRef]
  21. Nukeshev, S.; Eskhozhin, D.; Karaivanov, D.; Yeskhozhin, K. Determination of parameters of the main distributor for fertilizer applying machine. Bulg. J. Agric. Sci. 2014, 20, 1513–1521. [Google Scholar]
  22. Zhang, L.P.; Zhang, L.X.; Zheng, W.Q. Fertilizer Feeding Mechanism and Experimental Study of a Spiral Grooved-Wheel Fertilizer Feeder. J. Eng. Sci. Technol. Rev. 2018, 11, 107–115. [Google Scholar]
  23. Zheng, W.Q.; Zhang, L.P.; Zhang, L.X.; Zhou, J.P. Reflux problem analysis and structure optimization of the spiral grooved-wheel fertilizer apparatus. Int. J. Simul. Model. 2020, 19, 422–433. [Google Scholar] [CrossRef]
  24. Sun, J.; Chen, H.; Duan, J.; Liu, Z.; Zhu, Q. Mechanical properties of the grooved-wheel drilling particles under multivariate interaction influenced based on 3D printing and EDEM simulation. Comput. Electron. Agric. 2020, 172, 105329. [Google Scholar] [CrossRef]
  25. Karayel, D.; Wiesehoff, M.; Özmerzi, A.; Müller, J. Laboratory measurement of seed drill seed spacing and velocity of fall of seeds using high-speed camera system. Comput. Electron. Agric. 2006, 50, 89–96. [Google Scholar] [CrossRef]
  26. Song, C.; Zhou, Z.; Zang, Y.; Zhao, L.; Yang, W.; Luo, X.; Zhu, Q. Variable-rate control system for UAV-based granular fertilizer spreader. Comput. Electron. Agric. 2021, 180, 105832. [Google Scholar] [CrossRef]
  27. Su, N.; Xu, T.S.; Song, L.T.; Wang, R.J.; Wei, Y.Y. Variable rate fertilization system with adjustable active feed-roll length. Int. J. Agric. Biol. Eng. 2015, 8, 19–26. [Google Scholar]
  28. Richardson, B.; Rolando, C.A.; Kimberley, M.O.; Strand, T.M. Spray application efficiency from a multi-rotor unmanned aerial vehicle configured for aerial pesticide application. Trans. ASABE 2019, 62, 1447–1453. [Google Scholar] [CrossRef]
  29. Su, Y.; Wang, F.; Zong, S.; Liu, Y. Experimental study on the damping properties of NBR-based viscoelastic materials enhanced by minimal particles. J. Rubber Res. 2021, 24, 735–744. [Google Scholar] [CrossRef]
  30. Yu, Y.; Fu, H.; Yu, J. DEM-based simulation of the corn threshing process. Adv. Powder Technol. 2015, 26, 1400–1409. [Google Scholar]
  31. Horabik, J.; Molenda, M. Parameters and contact models for DEM simulations of agricultural granular materials: A review. Biosyst. Eng. 2016, 147, 206–225. [Google Scholar] [CrossRef]
  32. Ding, S.; Bai, L.; Yao, Y.; Yue, B.; Fu, Z.; Zheng, Z.; Huang, Y. Discrete element modelling (DEM) of fertilizer dual-banding with adjustable rates. Comput. Electron. Agric. 2018, 152, 32–39. [Google Scholar] [CrossRef]
  33. Song, X.; Dai, F.; Zhang, X.; Gao, W.; Li, X.; Zhang, F.; Zhao, W. Simulation and Experiment of Fertilizer Discharge Characteristics of Spiral Grooved Wheel with Different Working Parameters. Sustainability 2023, 15, 11309. [Google Scholar] [CrossRef]
Figure 1. UAV-based particulate material spreading system.
Drones 08 00726 g001
Figure 2. Structure of the particulate unit spreader.
Drones 08 00726 g002
Figure 3. Structure of the discharging apparatus.
Drones 08 00726 g003
Figure 4. Section view of three typical groove wheels: (a) circular-arc type, (b) eccentric-arc type, and (c) circumscribed-arc type.
Drones 08 00726 g004
Figure 5. Force analyzing particulates in the helix groove: (a) particle force analysis, (b) particles and pane force analysis.
Drones 08 00726 g005
Figure 6. Circumferential and axial force of particulates under different helix angles.
Drones 08 00726 g006
Figure 7. Simulation model of the discharge apparatus.
Drones 08 00726 g007
Figure 8. Two-factor response surface of discharge apparatus performance: (a) groove shape and helix angle interaction, (b) groove helix angle and number interaction, (c) groove helix angle and length interaction, (d) groove shape and number interaction, (e) groove shape and length interaction, and (f) groove length and number interaction.
Drones 08 00726 g008aDrones 08 00726 g008b
Figure 9. Simulated discharging amount at different groove wheel rotation speeds.
Drones 08 00726 g009
Figure 10. Discharge apparatus performance evaluation experiments.
Drones 08 00726 g010
Figure 11. Relationship between the discharge rate and groove wheel rotation speed.
Drones 08 00726 g011
Figure 12. Coefficient of variation and standard deviation of spreader units.
Drones 08 00726 g012
Table 1. Material and physical characteristic parameters of DEM.
ParameterValue
ParticulateDensity/(kg/m3)1.56
Poisson’s ratio0.24
Shear modulus/Pa3.2 × 107
GrooveDensity/(kg/m3)1.12
Poisson’s ratio0.42
Shear modulus/Pa9.8 × 106
Particulate-ParticulateStatic friction coefficient0.28
Dynamic friction coefficient0.10
Recovery coefficient0.32
Particulate-GrooveStatic friction coefficient0.39
Dynamic friction coefficient0.12
Recovery coefficient0.35
Table 2. Coding of factors for simulation.
LevelFactors
Groove Shape/AGroove Length/B (mm)Groove Helix Angle/C (°)Groove Numbers/D
−11 (Circular arc)35505
02 (Eccentric arc)40606
13 (Circumscribed arc)45707
Table 3. Pulsation amplitude range analysis.
Serial NumberABCDPulsation Amplitude/Y
113550531.5
214550532.8
314570535.2
413570534.8
524060531.5
634570530.8
733570530.6
833550528.0
934550528.6
1014060635.8
1123560630.1
1224060629.8
1324070634.8
1424050631.6
1524060630.7
1624060631.2
1724060631.3
1824560628.4
1924060632.9
2024060631.4
2134060632.8
2213570736.2
2314570735.8
2413550726.7
2514550727.9
2624060727.6
2734570733.1
2833550725.8
2933570733.3
Table 4. Variance analysis of the influencing factors for pulsation amplitude.
SourceError Sum of SquaresDegree of FreedomMean Square ErrorF Valuep ValueSignificance Level
Model228.331416.3116.33<0.0001**
A39.01139.0139.07<0.0001**
B0.4510.450.450.5131
C110.011110.01110.16<0.0001**
D5.7815.785.790.0295*
AB0.01610.0160.0160.9021
AC1.5011.501.500.2392
AD5.1815.185.180.0379*
BC1.2711.271.270.278
BD0.01610.0160.0160.9021
CD25.76125.7625.790.0001**
A218.26118.2618.290.0007**
B214.62114.6214.640.0017**
C26.2616.266.270.0243*
D211.37111.3711.390.0042**
Residue14.98151.00
Lack of fit9.83100.980.950.5578
Pure Error5.1551.03
Total Sum243.3129
R2 = 0.9384    Adj R2 = 0.8810     Pre R2 = 0.7871
* significance at 0.01 < p < 0.05, ** extreme significance at p < 0.01.
Table 5. Fertilizer composition.
IngredientNP2O5K2OCaOMgOSiO2ZnB
Content (%)21.3011.3313.561.104.830.580.530.08
Table 6. Discharging rate of six spreader units.
Rotation Speed (rpm)Experiment NumbersDischarging Rate of Six Spreaders Units (g/s)
No. 1No. 2No. 3No. 4No. 5No. 6
1013.573.843.743.593.853.59
23.743.653.523.653.713.68
33.783.793.673.623.653.51
2017.727.687.947.697.757.69
27.657.757.677.737.827.99
37.367.607.727.537.727.72
30111.7911.7212.0111.8711.7011.66
211.5711.7811.8011.7311.8811.95
311.7611.6311.7611.9311.7511.73
40116.1615.8815.8516.2215.9716.13
215.8716.1316.3116.1915.7215.96
316.2216.3416.2815.8416.1115.95
50119.2119.1919.4519.5819.6019.64
219.4919.6819.3719.2319.1119.35
319.8419.5619.0219.3619.3719.22
60123.3422.7422.6623.5123.7123.92
223.85 23.53 23.88 23.36 22.75 23.64
322.73 23.62 24.13 23.76 23.28 23.39
Table 7. Average discharge rates of the UAV spreader.
Rotation Speed (rpm)Average Discharging Rate of Six Spreader Units (g/s)Average Discharging Rate (g/s)
No. 1No. 2No. 3No. 4No. 5No. 6
103.693.763.653.623.743.593.68
207.587.687.787.657.767.807.71
3011.7111.7111.8611.8411.7811.7811.78
4016.0816.1116.1416.0815.9416.0116.06
5019.5119.4719.2819.3919.3619.4019.40
6023.3123.2923.5523.5523.2523.6523.43
Table 8. Comparison of discharging rate between simulation and bench test.
Rotation Speed (rpm)Discharging Rate of Simulation (g/s)Discharging Rate of Bench Test (g/s)Relative Deviation (%)
104.063.6810.39
207.927.712.84
3011.9711.781.66
4016.1316.060.47
5020.3919.405.12
6024.1623.433.13
Table 9. Coefficient of variation of discharging rate among spreader units.
Rotation Speed (rpm)CV for Each Numbers of Experiment (%)Average CV (%)
123
103.552.032.802.79
201.251.591.891.58
301.101.100.821.01
400.971.361.211.18
501.041.021.461.17
602.211.762.022.00
Table 10. Standard deviation of each spreader unit.
Rotation Speed (rpm)Standard Deviation of Six Spreader Units (g/s)Average Standard Deviation (g/s)
No. 1No. 2No. 3No. 4No. 5No. 6
100.110.100.110.030.100.080.09
200.190.080.140.100.050.160.12
300.120.080.140.100.090.150.11
400.190.230.260.210.200.100.20
500.320.260.230.180.240.220.24
600.560.490.790.200.480.270.46
Disclaimer/Publisher’s Note: The statements, opinions and data contained in all publications are solely those of the individual author(s) and contributor(s) and not of MDPI and/or the editor(s). MDPI and/or the editor(s) disclaim responsibility for any injury to people or property resulting from any ideas, methods, instructions or products referred to in the content.

