Article

An AI-Based Deep Learning with K-Mean Approach for Enhancing Altitude Estimation Accuracy in Unmanned Aerial Vehicles

by
Prot Piyakawanich
1 and
Pattarapong Phasukkit
1,2,*
1
School of Engineering, King Mongkut’s Institute of Technology Ladkrabang, Bangkok 10520, Thailand
2
King Mongkut Chaokhun Thahan Hospital, King Mongkut’s Institute of Technology Ladkrabang, Bangkok 10520, Thailand
*
Author to whom correspondence should be addressed.
Drones 2024, 8(12), 718; https://doi.org/10.3390/drones8120718
Submission received: 1 November 2024 / Revised: 25 November 2024 / Accepted: 25 November 2024 / Published: 29 November 2024

Abstract

:
In the rapidly evolving domain of Unmanned Aerial Vehicles (UAVs), precise altitude estimation remains a significant challenge, particularly for lightweight UAVs. This research presents an innovative approach to enhance altitude estimation accuracy for UAVs weighing under 2 kg without cameras, utilizing advanced AI Deep Learning algorithms. The primary novelty of this study lies in its unique integration of unsupervised and supervised learning techniques. By synergistically combining K-Means Clustering with a multiple-input deep learning regression-based model (DL-KMA), we have achieved substantial improvements in altitude estimation accuracy. This methodology represents a significant advancement over conventional approaches in UAV technology. Our experimental design involved comprehensive field data collection across two distinct altitude environments, employing a high-precision Digital Laser Distance Meter as the reference standard (Class II). This rigorous approach facilitated a thorough evaluation of our model’s performance across varied terrains, ensuring robust and reliable results. The outcomes of our study are particularly noteworthy, with the model demonstrating remarkably low Mean Squared Error (MSE) values across all data clusters, ranging from 0.011 to 0.072. These results not only indicate significant improvements over traditional methods, but also establish a new benchmark in UAVs altitude estimation accuracy. A key innovation in our approach is the elimination of costly additional hardware such as Light Detection and Ranging (LiDAR), offering a cost-effective, software-based solution. This advancement has broad implications, enhancing the accessibility of advanced UAVs technology and expanding its potential applications across diverse sectors including precision agriculture, urban planning, and emergency response. This research represents a significant contribution to the integration of AI and UAVs technology, potentially unlocking new possibilities in UAVs applications. By enhancing the capabilities of lightweight UAVs, we are not merely improving a technical aspect, but revolutionizing the potential applications of UAVs across industries. Our work sets the stage for safer, more reliable, and precise UAVs operations, marking a pivotal moment in the evolution of aerial technology in an increasingly UAV-dependent world.

1. Introduction

Unmanned Aerial Vehicles (UAVs), commonly known as drones, have revolutionized various sectors, from precision agriculture to urban planning and emergency response. As these aerial platforms become increasingly ubiquitous, the demand for more precise and reliable operational capabilities has intensified. Among the critical challenges facing lightweight UAVs, particularly those under 2 kg, is the need for accurate altitude estimation. This capability is fundamental to ensuring safe flight operations, optimizing data collection, and expanding the potential applications of these versatile machines.
Despite significant advancements in UAV technology, the challenge of accurate altitude estimation in lightweight drones remains a significant hurdle. Traditional high-precision altitude estimation methods for lightweight UAVs (under 2 kg) heavily rely on hardware solutions such as LiDAR, which present significant disadvantages including prohibitive costs, added weight burden, reduced payload capacity, and increased power consumption from the battery system. These limitations substantially impact the operational effectiveness and practical applications of lightweight drones.
This paper proposes a novel software-based altitude estimation method using deep learning with K-means clustering (DL-KMA) that processes data from existing onboard sensors while maintaining high accuracy. Our approach leverages the synergy between unsupervised and supervised learning techniques to achieve significant improvements in altitude estimation without requiring additional expensive hardware.
The selection of K-means clustering as our primary clustering algorithm is justified through comprehensive comparative analysis with alternative methods. The K-means clustering demonstrates superior performance compared to hierarchical clustering methods in handling multidimensional UAV altitude data, particularly in terms of computational complexity (O(n) versus O(n2log n)). Furthermore, when compared to DBSCAN, K-means offers enhanced scalability and more distinct cluster boundaries, which is crucial for precise altitude range segmentation. Unlike Gaussian Mixture Models (GMMs), K-means provide more interpretable results with well-defined cluster boundaries, making it particularly suitable for altitude-based decision making in UAV applications.
The effectiveness of our proposed method is validated by experimental results, achieving MSE values ranging from 0.011 to 0.072 across all data clusters. These results establish DL-KMA as a practical alternative for drone height estimation, combining high accuracy with cost-effectiveness. This approach not only addresses current challenges in UAV altitude estimation, but also opens new avenues for research in lightweight drone development.
The field of Unmanned Aerial Vehicle (UAV) technology has seen significant advancements in recent years, particularly in altitude estimation for lightweight drones. This review examines the current state of research and highlights key developments in this area.
Recent advancements, however, have explored alternative approaches. Ref. [1] investigated the application of deep learning techniques to enhance object detection in UAV imagery, potentially improving altitude estimation accuracy without the need for additional hardware. Similarly, Liu et al. [2] demonstrated the integration of AI-based approaches for optimizing UAV altitude while considering power constraints in Internet of Vehicles applications, highlighting the growing importance of efficient altitude management in complex delivery systems. This trend is further developed in the research of Wang et al. [3] on multi-UAV path planning, which showcases how AI applications can coordinate multiple UAVs while maintaining optimal altitude for urban delivery scenarios. Nevertheless, as Feiyu et al. [4] revealed in their study of UAV Position Optimization for Servicing Ground Users Based on Deep Reinforcement Learning., which can prove challenging for lightweight drones weighing less than 2 kg due to computational constraints.
This limitation highlights the need for more cost-effective and weight-efficient solutions in altitude estimation for small UAVs. Recent research has shifted towards software-based solutions leveraging artificial intelligence. Chen et al. [5] and Sanjar and Sulaym [6] proposed adaptive systems for object detection and image classification, highlighting the potential of AI in enhancing UAV capabilities without additional hardware. This trend is further supported by the work of Odabas Yildirim et al. [7] and Panthakkan et al. [8] in automated vehicle detection using deep learning models.
Deep learning techniques have shown promise in improving UAV performance. Zeng et al. [9] and Chen et al. [10] developed various approaches for UAV navigation and mapping using deep learning. While effective, some of these methods still rely on LiDAR, limiting their applicability to lightweight drones.
Addressing the specific needs of lightweight UAVs, several studies have focused on optimizing algorithms for resource-constrained platforms [8,11]. The integration of unsupervised and supervised learning techniques has emerged as a promising direction, as demonstrated by Makrigiorgis et al. [12,13] and Cheng et al. [14].
Altitude estimation without additional hardware has been explored by Taame et al. [15] using Kalman filters, Yang et al. [16] with altitude-guided detection, and Aslani and Saberinia [17] in the context of energy-efficient UAV networks.
Furthermore, despite these advancements, there remains a gap in research specifically addressing altitude estimation for UAVs under 2 kg without relying on additional hardware. The work of Zhenyu et al. [18] on global localization of UAVs and the multi-feature approach of Weiguang et al. [19] suggest potential directions for improvement.
Our study contributes to the field of UAV technology in several significant ways. Firstly, it introduces an innovative AI-based methodology for enhancing altitude estimation accuracy in lightweight UAVs. Secondly, we conduct a comprehensive evaluation of the proposed method across a diverse range of environmental conditions and altitude ranges, ensuring its applicability in various operational scenarios. Finally, our research demonstrates a marked improvement in altitude estimation accuracy without necessitating the incorporation of additional expensive hardware.
These advancements represent a significant leap forward in the development of altitude estimation systems for lightweight UAVs, underscoring the potential of AI-driven solutions in enhancing the performance and capabilities of these aircraft. The findings of this research have important implications for the broader field of autonomous aerial systems and contribute to ongoing efforts to improve the efficiency and reliability of UAVs operations.

2. Materials and Research Methodology

The attached diagram (Figure 1) illustrates a method for measuring the altitude of a drone using a digital laser distance meter. The setup includes a drone in flight, a digital laser distance meter positioned on a tripod, and a remote pilot operating the drone. The digital laser distance meter is aimed vertically at the drone, measuring the direct distance from the device to the drone’s undercarriage. This direct measurement is referred to as the “Measured Distance”. The diagram also indicates the “Offset Distance”, which is the vertical distance from the ground to the laser meter’s sensor. The combination of these distances allows the calculation of the drone’s absolute altitude above ground level. This method is essential for applications requiring precise altitude measurements, such as surveying, mapping, or aerial photography. The clear, labeled diagram assists in understanding the procedure, emphasizing the roles of each component in obtaining accurate altitude data.

2.1. Materials and Methods

The study utilized an Unmanned Aerial Vehicle (UAV) equipped with the following components (Figure 2):
  • Flight Control Unit (FCU): 32 bit ARM Cortex M4 core with Floating Point Unit (FPU) (168 MHz/256 KB, RAM 2 MB Flash) (Pixhawk, an internationally developed open-hardware project.) Sensors: MPU6000 (primary accelerometer and gyroscope), ST Micro 16-bit gyroscope, ST Micro 14-bit accelerometer/compass, MEAS barometer (InvenSense [now part of TDK Corporation], a U.S.-based company, San Jose, CA, USA)
  • Interfaces: 5× UART serial ports, Spektrum DSM/DSM2/DSM-X Satellite input, Futaba S.BUS input, PPM sum signal, RSSI input, I2C, SPI, 2× CAN, USB
  • Dimensions: 38 g weight, 50 mm width, 15.5 mm height, 81.5 mm length
GPS Module (Neo 3): (u-blox, A Swiss-based company, Zurich, Switzerland)
  • Processor: STM32F412
  • GNSS Receiver: Ublox M9N
  • Supported GNSS Bands: GPS/QZSS L1 C/A, GLONASS L10F, BeiDou B1I, Galileo E1B/C, SBAS L1 C/A
  • Navigation Update Rate: Up to 25 Hz (RTK)
  • Position Accuracy: Up to 1.5 m
  • Dimensions: 60 × 60 × 16 mm, 33 g weight
Propulsion System: (Xrotor, Shenzhen, China)
  • Motors: 4 x Xrotor pro 50A 380 KV
  • Propellers: 15” Carbon Fiber, 12 mm hole size
Reference Measurement Device: (CZDANG, Shenzhen, China)
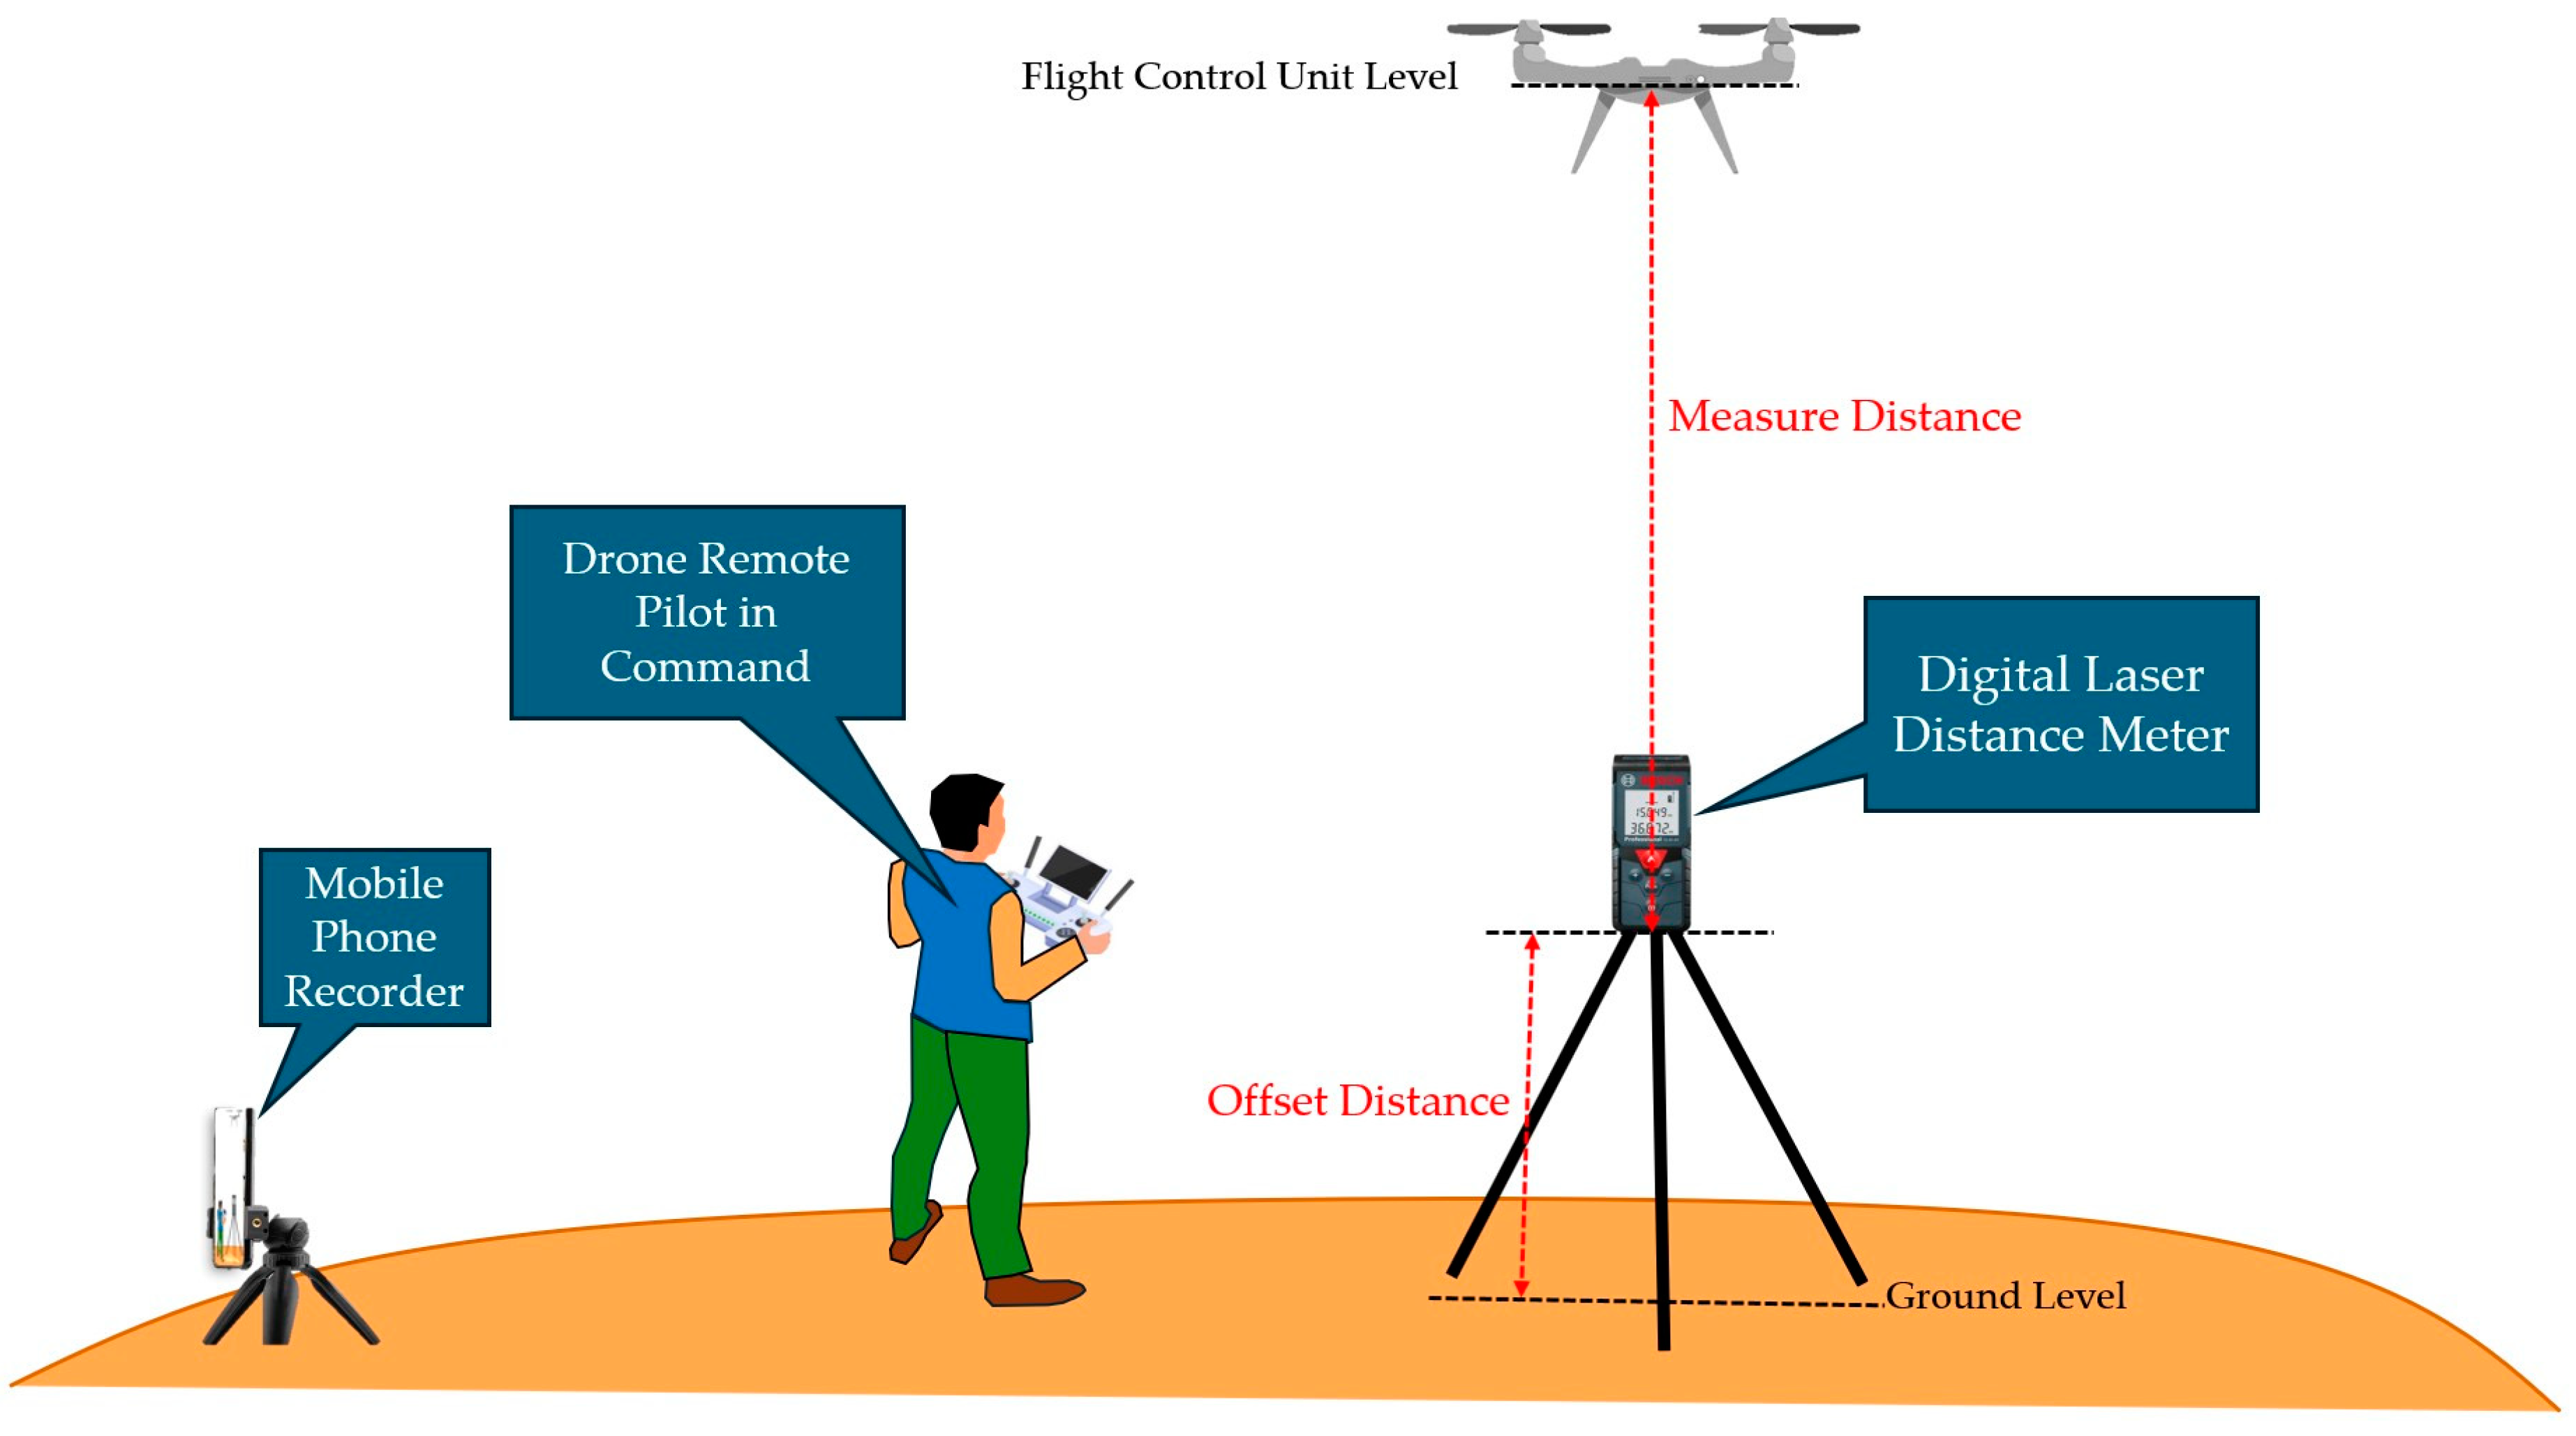
  • Digital Laser Distance Meter (Figure 3)
  • Measurement Range: 120 m
  • Accuracy: ±3 mm
  • Laser Class: Class II
Figure 2. Hardware Components and System Architecture of the Experimental UAV Platform.
Drones 08 00718 g002
Figure 3. Experimental Setup for UAV Altitude Data Collection and Validation Using Digital Laser Measurement.
Drones 08 00718 g003

2.1.1. Preparation of Experimental Altitude Ranges for Comprehensive UAV Performance Analysis

In the rapidly evolving field of unmanned aerial vehicle (UAV) research, precise altitude measurements across various operational ranges are crucial for developing accurate and reliable systems. The DL-KMA method aims to provide comprehensive coverage while facilitating detailed analysis of altitude-dependent factors affecting UAV performance.
The initial design of altitude ranges for this research was developed to measure UAVs operating within a height range of 1 to 30 m, segmented into the following four distinct altitude intervals: 1–10 m, 10–20 m, 20–25 m, and 25–30 m. These proposed altitude ranges are strategically crafted to ensure continuous data collection across the entire span, aligning with previous work on multi-altitude aerial vehicle datasets, which emphasizes the importance of defined altitude intervals for consistent data analysis and model training [13]. This study builds upon such datasets through data extraction and validation methodology, as shown in Figure 4, utilizing sensor fusion algorithms for UAV altitude estimation to identify critical transition points where estimation accuracy significantly changes, enhancing adaptive control system development.
The K-Means Clustering, a widely used unsupervised machine learning technique, offers significant advantages in identifying natural groupings within multidimensional data. Recent advancements, such as the K-Means Clustering approach based on Chebyshev Polynomial Graph Filtering, have further enhanced the effectiveness of this technique in handling complex datasets, as demonstrated [20]. By applying K-Means to altitude-related features extracted from UAV flight logs, we can determine data-driven altitude ranges that reflect the inherent structure of the collected measurements. This approach allows for a more nuanced understanding of how environmental factors impact altitude estimation accuracy at different heights, as compared to predetermined fixed ranges.
Recent studies have demonstrated the effectiveness of clustering techniques in UAV-related applications. For instance, Ren et al. (2022) [21] successfully employed K-Means Clustering to optimize UAV deployment for wireless communications, showing improved coverage and energy efficiency.
The application of K-Means Clustering to UAV altitude range determination offers data-driven range selection, forming clusters based on the natural distribution of altitude measurements. This approach potentially reveals critical transition points where estimation accuracy undergoes significant changes, thus enhancing adaptive control system development for UAVs [20]. Secondly, an adaptive approach for UAV altitude estimation automatically adjusts to environmental influences such as wind patterns and air density variations in complex indoor settings, enhancing accuracy under varying conditions (Pritzl et al., 2022) [22].
Furthermore, Kolarik et al. (2023) [23] demonstrate that clustering techniques optimize sensor performance evaluation by identifying altitude-specific trends or anomalies in estimation accuracy, facilitating more precise calibration of algorithms and enhancing overall measurement reliability in complex environments. Additionally, comparative analysis between adjacent altitude brackets provides valuable insights into the continuity and consistency of UAS photogrammetry-based altitude estimation methods across diverse terrain sites, enhancing the understanding of method performance at different heights (Liu et al., 2024) [24].
To implement this approach, comprehensive flight data are collected, including altitude measurements and related sensor readings. The K-Means algorithm is then applied to this multidimensional dataset, with the optimal number of clusters determined through methods such as the elbow method. Previous studies have demonstrated the effectiveness of integrating the elbow method with K-Means clustering for identifying optimal cluster configurations, which can be particularly useful in our context for determining the most appropriate number of altitude ranges [25].
The fundamental equations for K-Means Clustering are as follows:
  • Cluster Assignment Equation:
c i = a r g m i n j x i μ j 2
where c i denotes the cluster assigned to data point x i and μ j represents the centroid of cluster j.
  • Centroid Update Equation:
μ j = 1 C j x i C j x i
where C j is the set of all data points in cluster j, and | C j | is the cardinality of this set.
  • Objective Function:
J = i = 1 n j = 1 k w i j x i μ j 2
where J is the objective function to be minimized, n is the total number of data points, k is the number of clusters, and w i j equals 1 if data point i belongs to cluster j, and 0 otherwise.
W C S S = j = 1 k X i C j   x i -   μ j 2
where WCSS represents the Within-Cluster Sum of Squares.
In the context of integrating K-Means with C j Learning for UAV applications, the following equations are pertinent:
Cluster-Specific Model Training: For each cluster C j , train the following separate model f j :
f j X = W j · X +   B j
where W j and B j are the model parameters for cluster j .
Prediction in Clustered Context: For a new data point, determine its nearest cluster centroid μ j , then apply the following model for that cluster f j :
Y ^ j = f j X = W j ·   X + B j
where Y ^ j is the prediction output of the model specific to cluster j .
This data-driven clustering approach to altitude range determination represents a significant advancement in UAV research methodology. By leveraging machine learning techniques, researchers can gain deeper insights into the multifaceted factors influencing altitude estimation accuracy. This strategy not only enhances the robustness of UAV research, but also provides critical insights for improving drone performance and safety across diverse applications and environments.
As the field of UAV technology continues to evolve, such data-driven approaches to experimental design and analysis will play a pivotal role in advancing the capabilities and reliability of these aerial systems. The integration of machine learning techniques like K-Means Clustering into UAV altitude analysis promises to unlock new possibilities in precision flight control, environmental monitoring, and autonomous navigation.

2.1.2. Preparation for Testing the Digital Laser Distance Meter

A methodical approach was implemented to assess the digital laser distance meter, in accordance with the stratified altitude measurement protocol for unmanned aerial vehicle (UAV) research. The experimental design encompassed the following four distinct altitude ranges: 1–10, 10–20, 20–25, and 25–30 m, providing a comprehensive evaluation across various operational heights.
The calibration of digital laser distance meters measuring ground-to-UAV altitude for UAV altimetry requires meticulous consideration of environmental variables to ensure precision in established controlled testing environments for UAV operations. Previous research has evaluated laser distance sensors in geomatics, highlighting the importance of environmental calibration to achieve accurate measurements [26]. Reference points and critical altitudes were determined utilizing high-precision surveying instrumentation, a methodology analogous to that employed by Taddia et al. (2020) [27] in their UAV topographic surveys, thus ensuring consistency and reliability in data collection.
The digital laser distance meter was calibrated in accordance with manufacturer specifications, with a particular emphasis on performance within the 1–30 m range (Figure 5). This instrument was subsequently utilized for establishing reference points and critical altitudes, serving as a crucial component in the data acquisition process for this research study.
The vertical axis denotes the distance range from 0 to 30 m, while the horizontal axis represents time progression. The graph is characterized by a grid system with precise intervals, facilitating accurate measurements.
Red vertical lines at regular intervals indicate measurement points, with a note specifying “Read Value ~ 1 m”. This suggests a systematic data collection process at predefined increments. The UAV icons positioned at 10 m, 15 m, 20 m, and 25 m heights illustrate the experimental setup at various altitudes.
The experiment appears to involve incremental altitude increases for the UAV, allowing for comprehensive data collection across the specified range. This methodical approach emphasizes the importance of precision and repeatability in UAV altitude measurements. The graph’s design implies a rigorous, controlled experimental environment, crucial for validating or calibrating distance measurement equipment in UAV applications. Such a setup is essential for ensuring high accuracy across various altitudes within the operational range of UAVs.
By structuring the testing process to mirror the proposed altitude strata, this preparation phase aims to provide comprehensive data that can contribute to the development of robust altitude estimation algorithms for UAVs. The careful consideration of overlapping ranges and environmental factors in the testing setup reflects the complex nature of UAV-based altitude measurement and aligns with the research objectives of improving drone performance across diverse operational conditions.

2.2. Deep Learning Regression-Based Models

Figure 6 illustrates a DL-KMA in each cluster (4 clusters) designed to enhance altitude estimation accuracy in Unmanned Aerial Vehicles (UAVs). The model’s input features are derived from an array of operational data logs that exhibit strong correlations with UAVs altitude such as barometric readings, atmospheric pressure measurements, and other relevant parameters. The model’s output target is optimized to produce altitude estimations that closely align with the ground truth measurements obtained via a digital laser distance meter, thus maximizing accuracy (±3 mm).
The algorithmic architecture composed of two hidden layers, each containing 100 nodes. This doubling of node quantity in both hidden layers, compared to the single-input deep learning model, serves to augment the multi-input model’s predictive capabilities. The weight matrices (W) and bias vectors (B) interconnecting the layers (W1, B1, W2, B2, W3, and B3) undergo optimization through a gradient descent iterative algorithm. For the activation functions, the hidden layers employ the hyperbolic tangent function (tanh(z)), while the output layer utilizes the Rectified Linear Unit (ReLU) activation function.
This sophisticated model structure is designed from scratch to effectively process and integrate multiple input parameters, thereby enhancing the robustness and precision of UAV altitude estimations across diverse operational scenarios.
In this study, altitude measurements were categorized into four distinct altitude ranges to ensure comprehensive data coverage and to assess the various impacts observed following UAV flights, as previously discussed in Section 2.1.2. A digital laser distance meter, meticulously calibrated for each range, was employed as the reference device for altitude measurement. Given the extensive data recorded from UAV flights, the initial dataset for training and testing the multiple-input algorithm model comprised 48,000 datasets, derived from 6 altitude-related features measured 8000 times.
The dataset with altitude-related features (48,000 datasets) was divided into four groups based on the specified altitude ranges, each containing 12,000 data points. Normalization was applied to the full dataset initially to maintain uniform scaling, preventing any discrepancies in normalization scales between training and testing data. Following normalization, within each group, 80% (9600 datasets) were allocated for training and 20% (2400 datasets) for testing.
The training dataset comprised Xtrain (normalized training input data) and Ytrain (normalized training output data), while the test dataset included Xtest (normalized test input data) and Ytest (normalized test output data). The variables W1, B1, W2, B2, W3, and B3 were randomly initialized. These variables were optimized using a gradient descent algorithm with a learning rate (α) of 0.01 over 3000 epochs. Furthermore, L1-norm regularization was used to avoid overfitting. The iteration is terminated once divergence occurs between the MSE of the training and testing datasets.
Prior to training and testing the DL-KMA, standardized altitude data from the UAV, as measured by the digital laser distance meter, were required as a reference signal (target) to predict UAV altitude estimation accuracy. The training and testing input and output datasets (Xtrain, Ytrain, Xtest, and Ytest) under four distinct altitude ranges, are normalized using min–max normalization in Equation (7).
Data normalization = Dataset Training _ Dataset min Training _ Dataset max Training _ Dataset min
where Dataset represents any input or output data to be (Xtrain, Ytrain, Xtest, and Ytest); Training _ Dataset min is the minimum value from the training dataset only; and Training _ Dataset max is the maximum value from the training dataset only. The value of the normalized datasets ( Data normalization ) ranges between 0 and 1 [0, 1].
In the feedforward of the deep learning models, the activation function between hidden layers is a hyperbolic tangent function ( tanh Z ), as shown in Equation (8), where tanh Z = [−1, 1]. The activation function ReLU(Z) is used in the output layer, as shown in Equation (9), where Z is the linear combination. The predicted output Y ^ j of the DL-KMA is the UAV altitude estimation accuracy.
tanh Z = e Z   - e - Z e Z +   e - Z
Relu Z = 0 ,   Z < 0 Z ,   Z 0
1.
Layer Specific Equations:
  • First Hidden Layer Equations
    Z 1 = W 1 · X + B 1
    where W 1 and B 1 represent the weights and biases of the first hidden layer
  • Second Hidden Layer.
    Z 2 = W 2 · tanh Z 1 + B 2
    where W 2 and B 2 are the weights and biases of the second hidden layer, and tanh is applied as the activation function for the output of the first layer.
2.
Output Layer Equations:
Y ^ = W 3 · tanh Z 2 + B 3
where W 3 and B 3 are the weights and biases for the output layer, with a chosen activation function like ReLU if applicable for the final prediction.
3.
Activation Functions:
Clearly state that the first and second hidden layers use the tanh activation function to handle non-linear transformations, while the output layer uses a ReLU or other appropriate activation depending on the target prediction (e.g., linear if regression).
In the back propagation of deep learning models, the mean squared error (MSE) between the normalized training output dataset ( Y t r a i n ; Y i ) and predicted normalized output Y ^ i is first calculated using Equation (13), and the gradient descent iterative optimization algorithm is subsequently applied to fine-tune W and B by using the chain rule derivative.
Mean Squared Error (MSE):
M S E = 1 n i = 1 n Y i Y ^ i 2
The prediction performance (i.e., predictive ability) of DL-KMA is assessed by mean squared error (MSE; Equation (13)), mean absolute error (MAE; Equation (14)), and coefficient of determination ( R 2 ; Equation (15))
M A E = 1 n i = 1 n Y i Y ^ i
where Y i is the normalized testing output dataset ( Y t e s t ), Y ^ i is predicted normalized output ( Y p r e d i c t ), and n is the number of datasets.
The coefficient of determination (R2) is a goodness-of-fit measure for regression models and the dependent variables on a scale of 0–1
R 2 = Var Y t r u e   MSE Var Y t r u e
where Var( Y t r u e ) is the variance of actual values, MSE is the mean squared error between predicted and actual values.
Figure 7 illustrates an advanced deep learning pipeline for enhancing UAV altitude precision. The process begins with UAV flight log datasets, which serve as input features. These data undergo preprocessing through an Elbow method, followed by K-Means clustering to identify key patterns. The clustered data are then normalized to ensure consistent scaling across features.
The core of the system is a deep neural network, represented by the complex interconnected structure. This network processes the normalized data, learning intricate relationships between input features and altitude estimates. The output undergoes denormalization to convert it back to real-world units.
The final step produces a “Precision Altitude” estimate, which is compared to the “True Altitude” measured from ground level. This comparison allows for continuous refinement of the model’s accuracy. The system aims to significantly improve UAV altitude estimation by leveraging deep learning techniques on rich flight log data, potentially enhancing the precision and reliability of drone operations in various applications.
In the proposed DL-KMA, the features after Elbow and K-Means method for clustering already are used. Each clustering will be normalized prior to feedforwarding for the normalized target, given the optimized W1, B1, W2, B2, W3, and B3. The normalized target is subsequently denormalized to obtain the altitude estimation.

3. Experimental Setup and Data Analysis

Figure 8 depicts a system for precise drone altitude control using DL-KMA. The workflow begins with a drone equipped with telemetry and MAVLink logging capabilities. Data are transmitted via MAVLink to both a remote-control device and a computer running an AI DL-KMA.
The remote control receives telemetry data through WiFi/Datalink, while the computer processes MAVLink log data including datalink and video (VDO) information. Additionally, accurate altitude measurements are obtained from ground level using a separate device, likely a laser rangefinder.
The AI model on the computer integrates the following inputs: telemetry from the remote control, MAVLink log data, and the precise ground-level altitude measurement. Using deep learning regression techniques, it processes this information to estimate a “Precision Height ≈ Target” value.
This system aims to achieve highly accurate altitude control by combining various data sources and leveraging AI capabilities. The integration of ground truth measurements with onboard sensors and control inputs allows for more precise hovering and altitude maintenance than traditional methods relying solely on onboard systems.

3.1. Experimental Design, Instrumentation Configuration

3.1.1. Area Setup

The study was conducted across two distinct geographical locations to ensure diverse environmental conditions:
Area A, Terrain (Provincial): Muak Lek, Saraburi Province Thailand (14.782831° N, 101.253410° E, elevation: approximately 430 m).
Area B, Terrain (Metropolis): MiniRC Airfield, Bangkok Thailand (13.895999° N, 100.779172° E, elevation: approximately 3 m).

3.1.2. UAVs Setup

The experimental setup for Unmanned Aerial Vehicles (UAVs) was meticulously designed to ensure seamless operation and data collection. The primary components comprising a customized lightweight drone (>2 kg) without an integrated camera, lithium-polymer batteries, a remote-control unit, a smartphone for real-time Bluetooth connectivity, and “QGroundControl” software for advanced flight control.
The selected UAV underwent comprehensive pre-flight checks, including propeller inspection, frame integrity verification, and sensor calibration. Battery management protocols evolved throughout the study. In Area A, a single battery limited flight time and necessitated extensive charging periods (75–90 min). This experience informed the utilization of two batteries in Area B, significantly extending data collection duration.
Battery safety protocols were rigorously implemented, as demonstrated in Figure 9, including full balance-cell charging, adherence to specified current limitations, and the incorporation of cooling periods between charging cycles to ensure safety and longevity. The remote-control unit employed a mobile screen for telemetry display, paired with a smartphone via Bluetooth for real-time command transmission.
The “QGroundControl” software, installed on a Google Pixel 6 Android smartphone, facilitated advanced flight planning and control. To mitigate electromagnetic interference, all electronic devices were strategically positioned.
Prior to commencing the research, it is essential to prepare the equipment meticulously. The distance laser distance meter should be mounted on a tripod with three legs to ensure stability, and a bubble level should be employed to achieve symmetry, ensuring that the laser beam is projected in a straight line. Additionally, the device’s automatic distance measurement function must be tested before every flight to verify its accuracy.
Before UAV deployment, weather conditions should be assessed using forecasting applications such as UAV Forecast or Windy. This is crucial to avoid the adverse effects of gusty winds or excessive wind speeds, which could compromise the accuracy of altitude measurements.
Furthermore, it is important to prepare a mobile device to capture images and a wireless microphone to record both the readings from the digital laser distance meter and the altitude data displayed by the UAV. To ensure a smooth and complete data collection process, it is advisable to conduct a preliminary flight test lasting 1 to 2 min. This test will confirm the accuracy and reliability of the recorded measurements, providing confidence in the data acquisition for each session.
Figure 9. Diagram Illustrating Area Configuration and UAV Deployment Setup.
Drones 08 00718 g009

3.2. Data Analysis

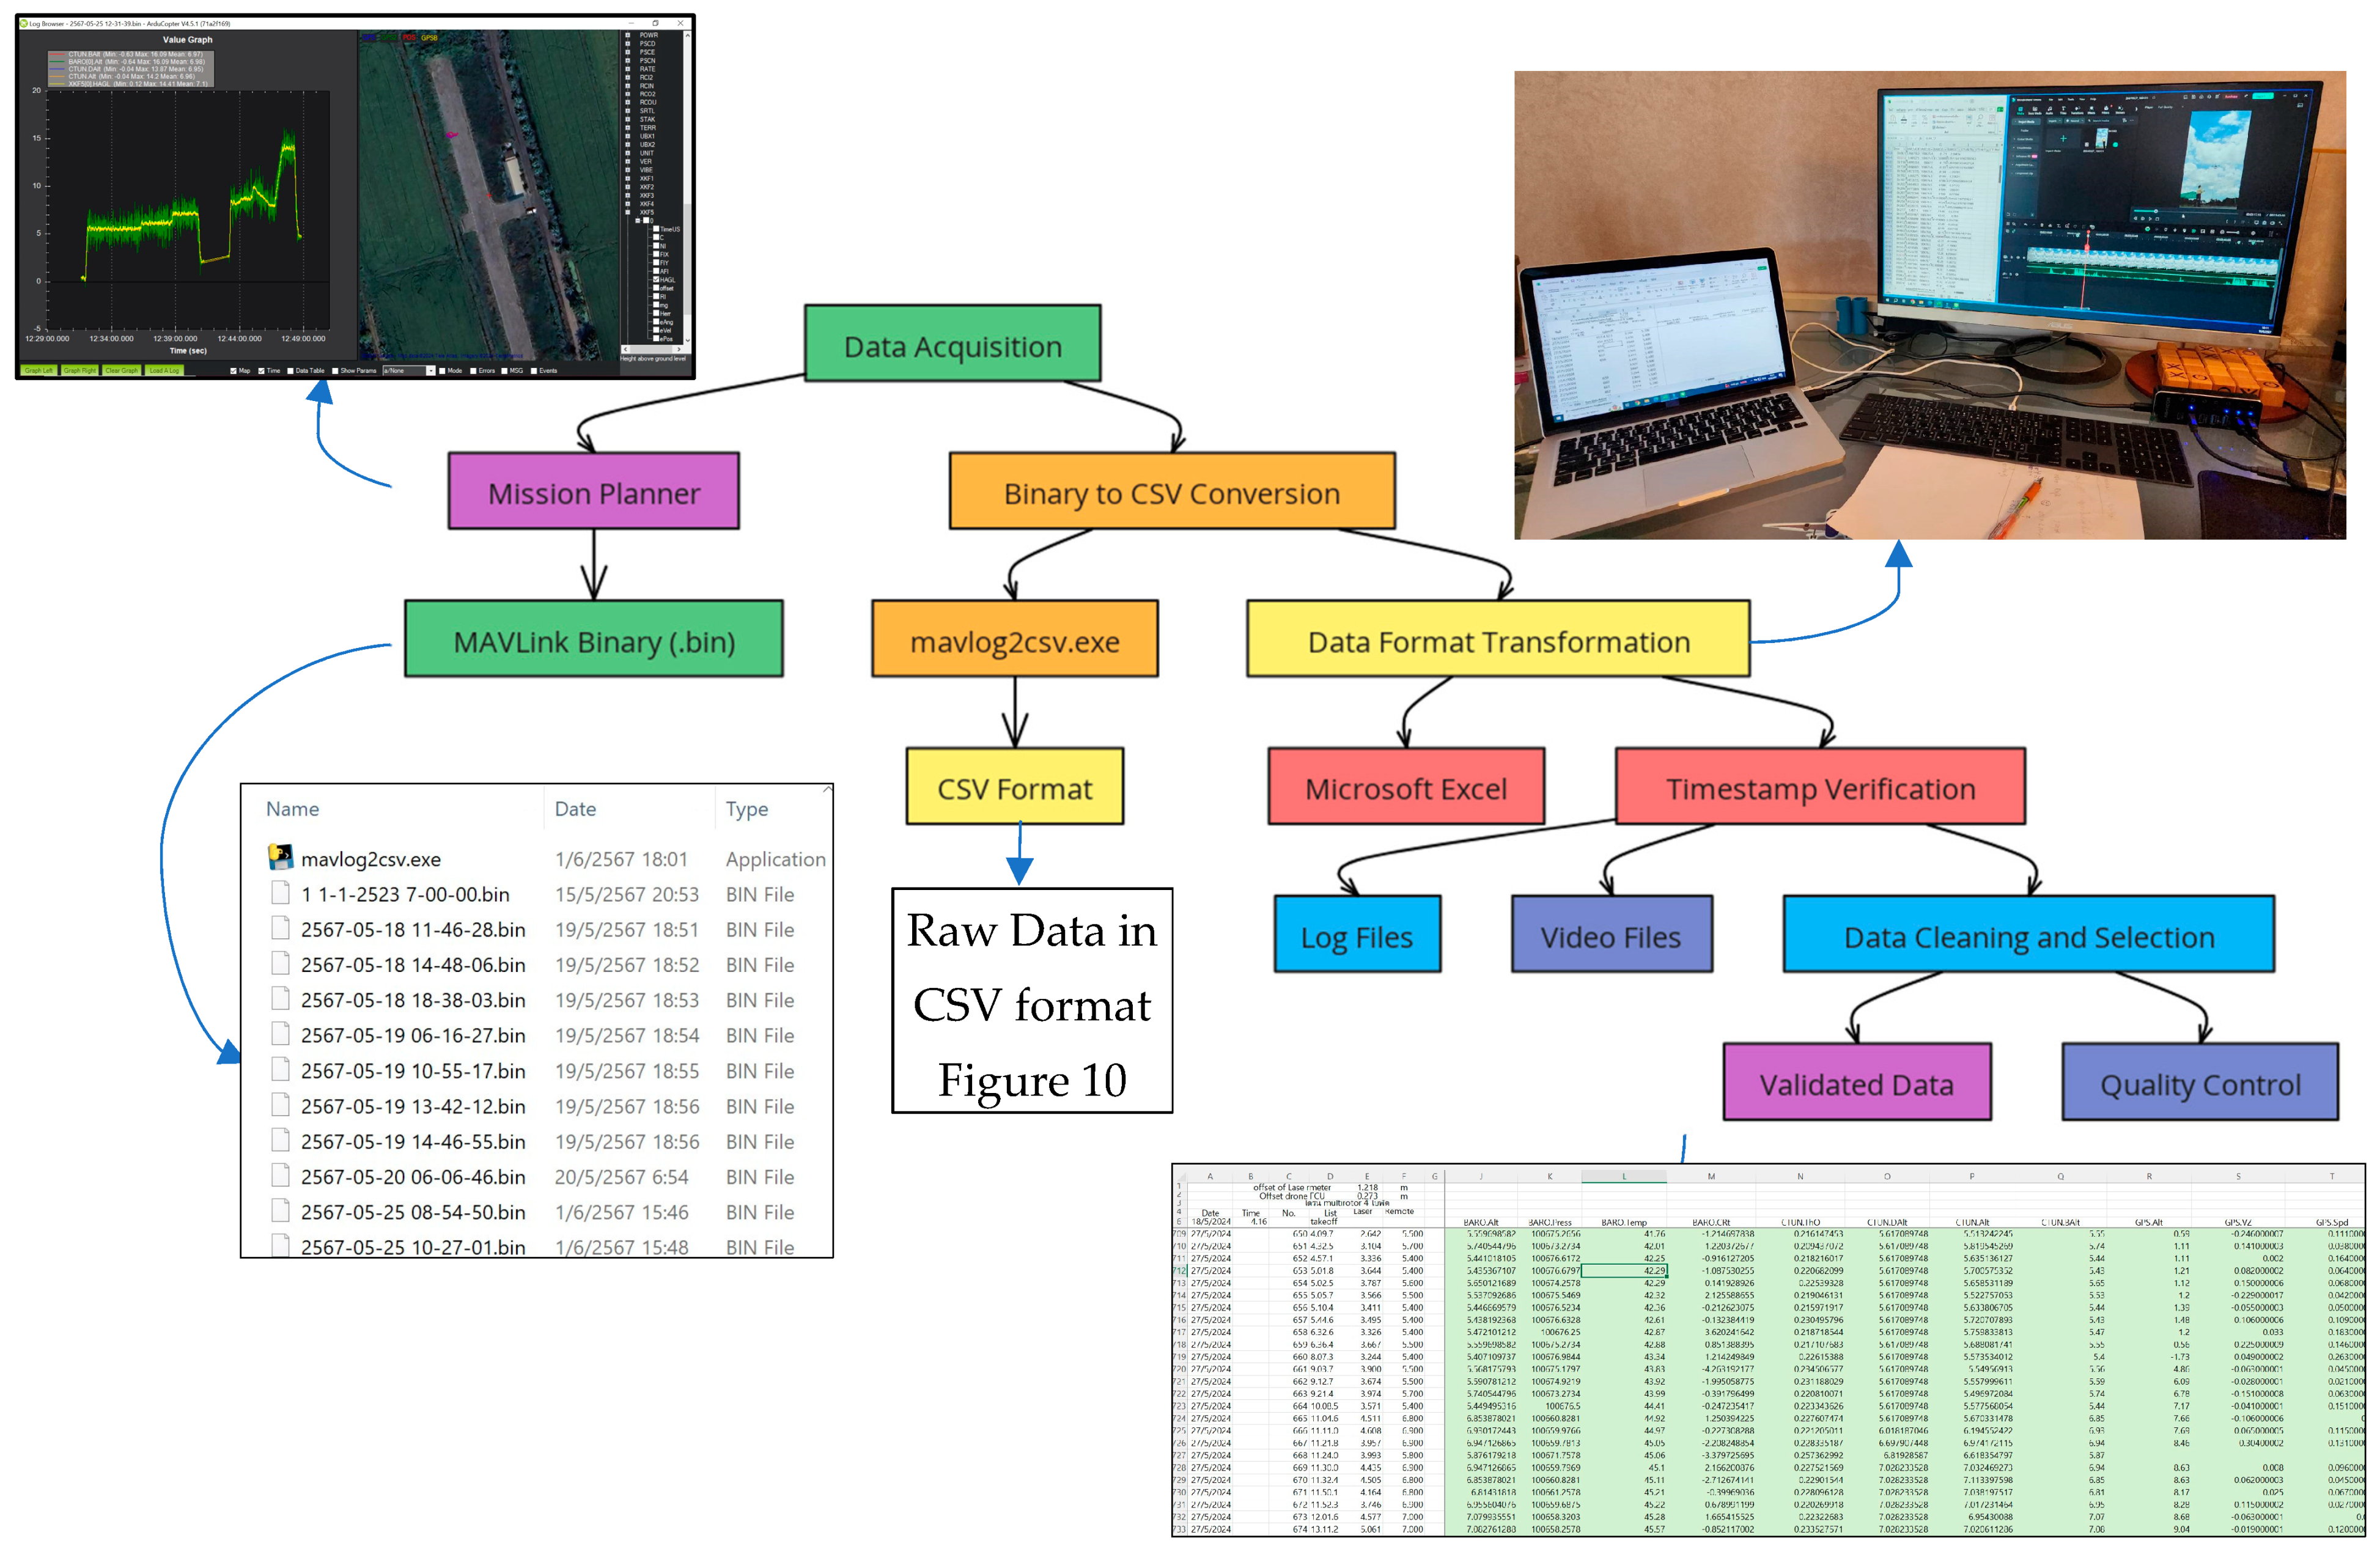
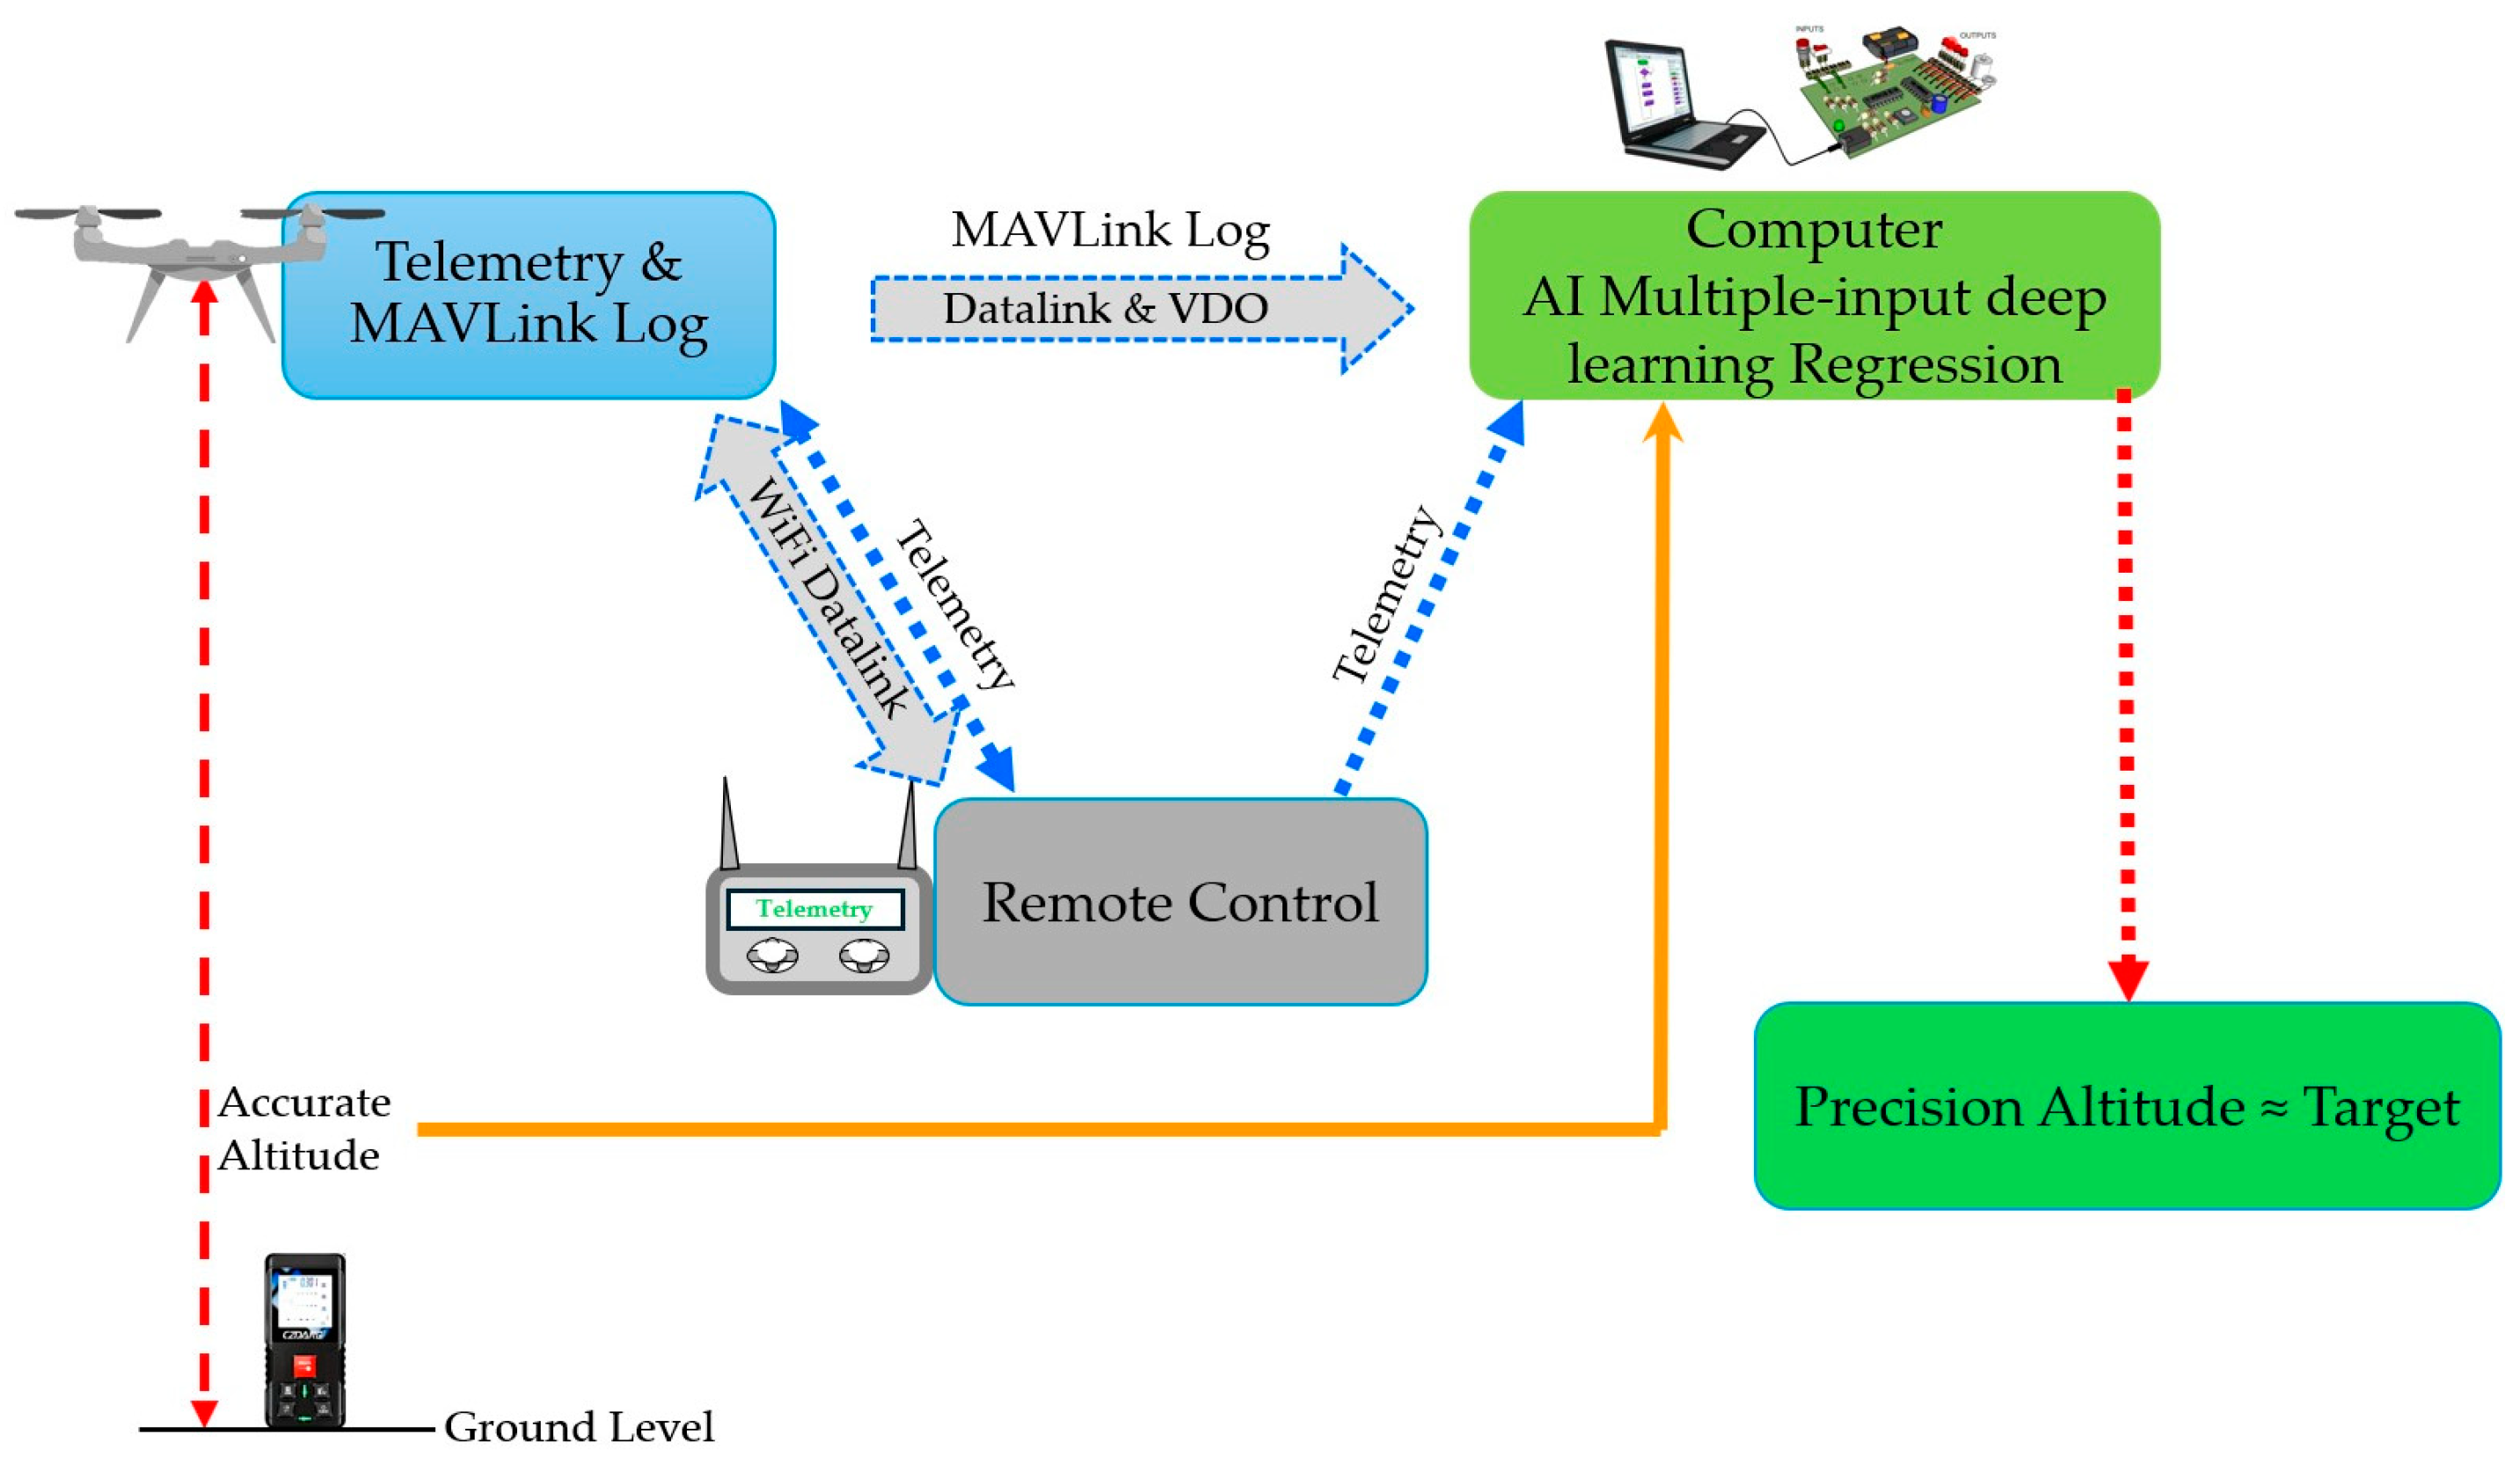
3.2.1. Data Acquisition

The data collection process from UAVs aims to obtain high-quality data for analysis. In the preliminary research phase, the investigator collects data from MAVLink logs in binary format and converts these binary files to CSV (Comma-Separated Values) format (Figure 10).
Figure 10. Example Raw Data from UAV MAVLink logs binary format and converts to CSV files.
Drones 08 00718 g010
Each flight session generates hundreds of thousands of data rows due to the simultaneous recording of multiple sensor inputs at millisecond intervals. Detailed information on these data logs can be found at “https://ardupilot.org/copter/docs/logmessages.html” (accessed on 24 November 2024).

3.2.2. Data Cleaning and Selecting Feature

The study employed an innovative approach to enhance altitude estimation accuracy for lightweight UAVs using deep learning regression-based models with altitude compensation. The methodology combined unsupervised and supervised learning techniques to process and analyze data from multiple onboard sensors.
Following the initial data collection, a comprehensive feature selection process was implemented to identify the most relevant parameters for the altitude prediction model (detailed procedures and sample data are shown in Figure 11). This process is crucial for enhancing model performance, reducing computational complexity, and mitigating potential overfitting issues.
Figure 11. Data Collection and Preprocessing Workflow for UAV Flight Log Analysis with VDO Integration.
Drones 08 00718 g011
The feature selection methodology incorporated both statistical analysis and domain expertise. Correlation analysis, K-Means Clustering were employed to assess the significance and independence of each feature.
Through this rigorous analytical process, 6 predictor variables and 1 target variable were identified. These selected features demonstrated significant variability and strong correlations with the target variable, making them ideal candidates for the regression model. The refined feature set is composed of the following:
  • Remote Control Altitude
    • Description: Altitude displayed on the UAV’s remote control, calculated by the onboard Flight Control Unit (FCU) using data from barometric sensors, IMU, and GPS.
    • Relevance: Provides the operator with a real-time, integrated altitude estimate, essential for manual adjustments, especially in low-visibility or GPS-limited scenarios.
    • Example: During flight, the remote control combines data from the barometer, IMU, and GPS, enabling altitude monitoring and adjustments to maintain the UAV’s height above ground. For instance, if the UAV ascends beyond the desired altitude, the operator can adjust controls to descend back to the set level.
  • BARO.Alt (Barometric Altitude)
    • Description: Altitude based on barometric pressure readings, which decrease predictably with increasing altitude.
    • Relevance: Crucial for altitude stability, especially in variable weather conditions, by providing a consistent atmospheric pressure reference.
    • Example: As the UAV ascends, barometric readings decrease, indicating an increase in altitude. Conversely, if the UAV descends, barometric readings increase, helping to confirm the reduction in altitude. This trend stabilizes altitude estimation even in windy conditions.
  • CTUN.DAlt (Desired Altitude for Control)
    • Description: The target altitude set by the operator or flight controller.
    • Relevance: Serves as a benchmark for altitude correction, enabling the control system to adjust the UAV’s position if deviations from the target occur.
    • Example: If programmed to maintain at 10 m, the UAV adjusts to return to this set altitude upon detecting any deviation. If the UAV descends below 10 m due to a gust of wind, it will adjust to ascend back to the desired altitude.
  • CTUN.Alt (Reference Altitude for Adjustment)
    • Description: A dynamically updated altitude base level for comparison with the desired altitude.
    • Relevance: Acts as a feedback loop, helping correct altitude changes in response to environmental factors.
    • Example: During ascent, this reference helps stabilize the climb by correcting for altitude shifts caused by wind. Likewise, during descent, it provides a stable reference point to ensure controlled lowering, avoiding sudden drops or altitude fluctuations.
  • CTUN.BAlt (Barometer-Based Control Altitude)
    • Description: Altitude calculated purely from barometric readings, which the control system uses to ensure stability.
    • Relevance: Ensures accurate altitude holding, especially at high altitudes or in conditions where GPS signals are unreliable.
    • Example: During high-altitude operations, the UAV relies on this reading to maintain stability when GPS accuracy is compromised. If the UAV descends unexpectedly, barometric control altitude helps stabilize the descent until the target altitude is regained.
  • XKF5.HAGL (Height Above Ground Level from EKF3 Sensor)
    • Description: Height above ground level, calculated from the Extended Kalman Filter (EKF3) sensor, considering immediate terrain conditions.
    • Relevance: Vital for terrain navigation, especially in areas with varied topography, by maintaining a safe distance above the ground.
    • Example: When flying over hilly terrain, this measurement ensures consistent altitude above ground, preventing possible collisions with obstacles. For instance, if the UAV ascends over rising ground, HAGL helps it maintain safe clearance, while during descent over descending terrain, it ensures the UAV keeps the necessary distance to avoid collisions.
The target variable is defined as follows:
  • Target: Reference altitude from digital laser distance meter
This dimensionality reduction not only streamlines the model’s input, but also enhances its interpretability and generalization capabilities. The selected features represent a balanced mix of sensor data and control parameters, providing a comprehensive yet concise representation of the UAV’s altimetric state.
The feature selection process aligns with best practices in data analytics, ensuring that the model focuses on the most informative aspects of the UAV’s operation while minimizing redundancy and noise in the input data. This refined dataset forms the foundation for developing a robust and efficient altitude prediction model.

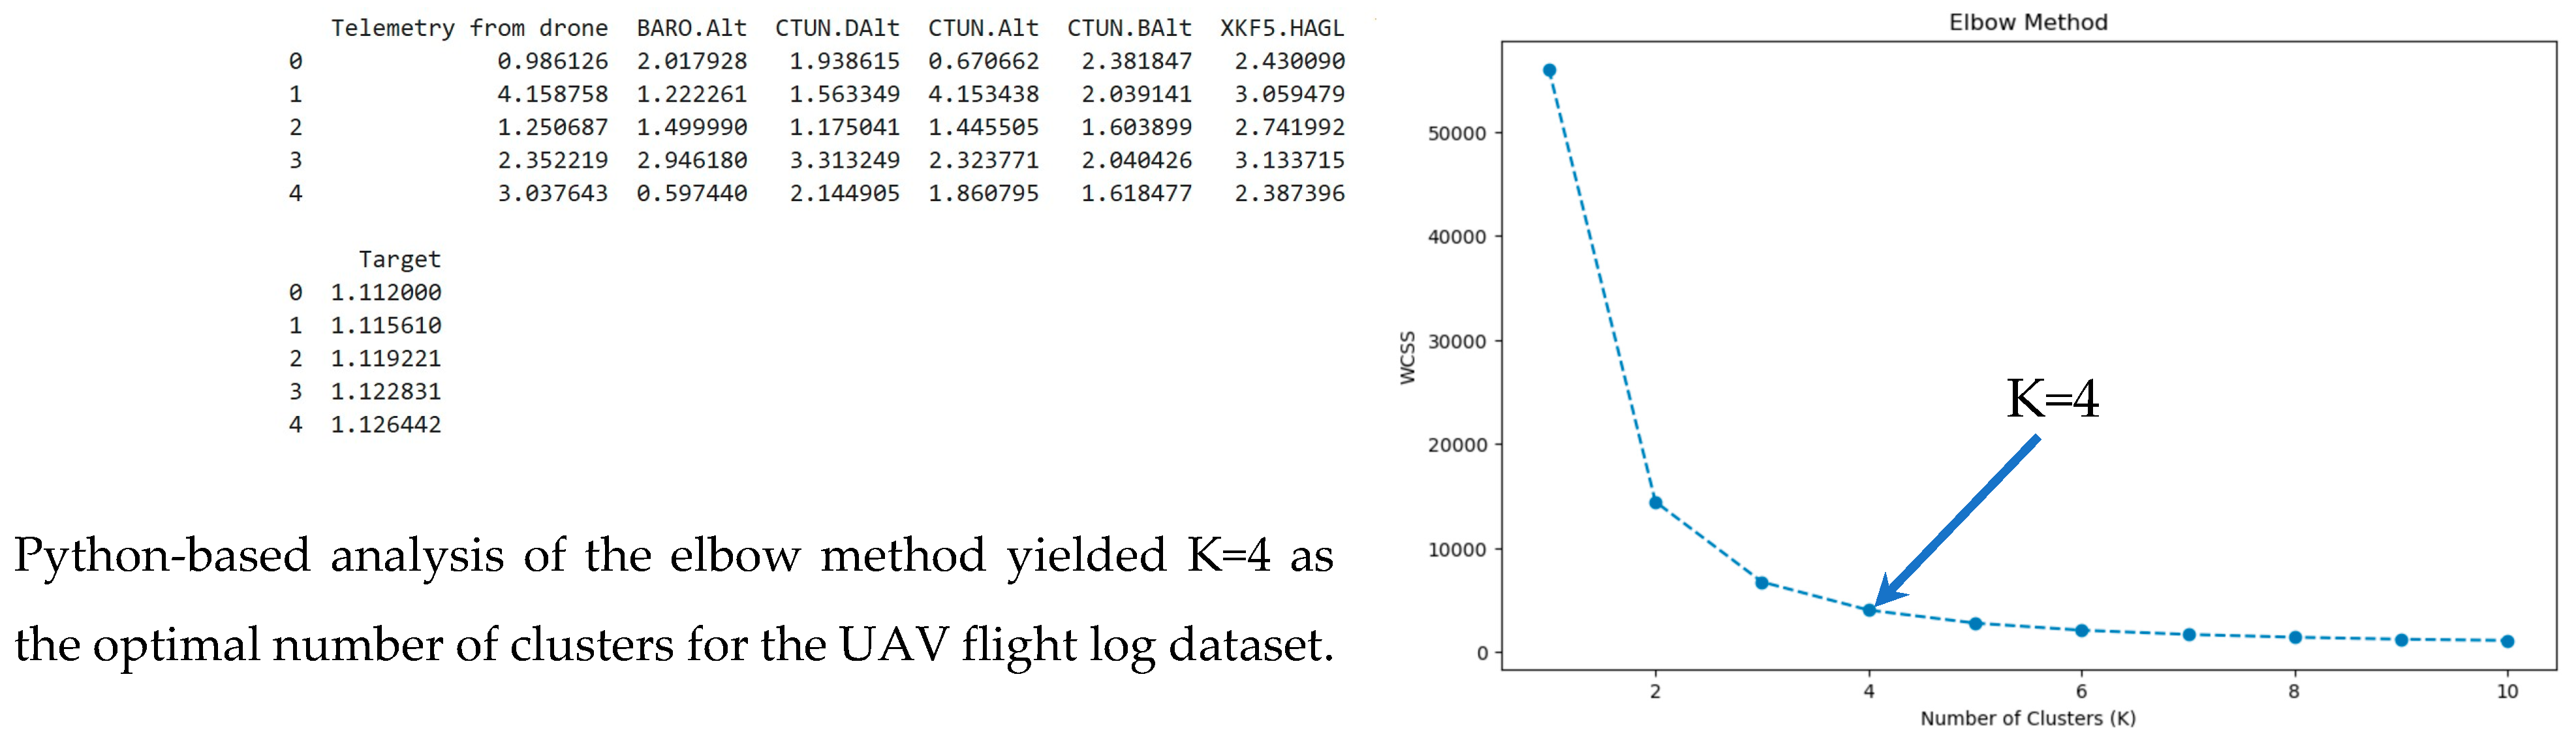
3.2.3. Elbow and K-Mean Method

Figure 12 illustrates the application of the Elbow Method, a technique used in cluster analysis to determine the optimal number of clusters (K) in a dataset. The graph plots the Within–Cluster Sum of Squares (WCSS) against the number of clusters (K).
Figure 12. Elbow method analysis of UAV telemetry data demonstrating optimal K=4 clusters based on WCSS (Within-Cluster Sum of Squares) metric and corresponding flight parameters.
Drones 08 00718 g012
The x-axis represents the number of clusters, ranging from 1 to 10, while the y-axis denotes the WCSS, which is a measure of the compactness of the clusters. As the number of clusters increases, the WCSS generally decreases.
The plot exhibits a characteristic “elbow” shape, where the rate of decrease in WCSS slows significantly after a certain point. This inflection point is typically considered the optimal number of clusters, as adding more clusters beyond this point yields diminishing returns in terms of explaining the variance in the data.
In this specific graph, the elbow appears to occur at K = 4, as indicated by the arrow and label. This suggests that four clusters may be the optimal choice for this dataset, balancing between model complexity and explanatory power.
The use of a dashed blue line connecting the data points aids in visualizing the trend, while the solid blue arrow emphasizes the location of the elbow. This graphical representation serves as a valuable tool for researchers in determining the most appropriate number of clusters for their analysis.

3.3. Preparation of Training and Testing Datasets

The model training was developed using a comprehensive dataset comprising 8000 instances, each characterized by six distinct features. This dataset served as the foundation for our approach, which integrated both supervised and unsupervised learning methodologies. High-precision measurements obtained from a Digital Laser Distance Meter were utilized as ground truth for target values, ensuring the model’s accuracy and reliability.
To optimize model performance and ensure robust generalization, we implemented a rigorous training strategy encompassing the following key elements:
Data Preprocessing and Partitioning: The raw data underwent meticulous cleaning and normalization procedures to mitigate potential biases and ensure consistency across features. Subsequently, the dataset was partitioned into training (80%) and testing (20%) subsets, with careful attention paid to maintaining the distribution of target values across both sets.
Loss Function and Regularization: Mean Squared Error (MSE) was selected as the primary loss function due to its demonstrated effectiveness in regression tasks. To mitigate overfitting and enhance model generalization, L1 regularization was applied. This technique promotes sparsity in model parameters, effectively reducing model complexity while preserving predictive power.
Early Stopping Mechanism: An early stopping protocol was implemented to further prevent overfitting and optimize computational resources. This approach involves monitoring the model’s performance on a validation set during training and halting the process when no significant improvement is observed over a predefined number of iterations.
Model Evaluation and Testing: The model’s performance was rigorously assessed using the held-out test set, employing metrics such as Mean Absolute Error (MAE), Mean Squared Error (MSE), and R-squared (R2) to provide a comprehensive evaluation of predictive accuracy and generalization capability.
This methodical training approach was designed to develop a robust model capable of accurate altitude predictions across diverse operational scenarios. The resulting model aims to significantly enhance UAV navigation and control systems, contributing to the advancement of autonomous aerial vehicle technology.

3.4. DL-KMA

The DL-KMA was developed from scratch to enhance altitude estimation accuracy for lightweight UAVs (under 2 kg) without cameras. This innovative approach integrates both unsupervised and supervised learning techniques, combining K-Means Clustering with a deep learning regression model.
  • Data Preprocessing and Normalization:
The model was implemented entirely from scratch using Python, allowing for customized optimization tailored to UAV altitude estimation requirements.
  • Altitude Range Clustering:
To address variations in altitude estimation accuracy across different flight conditions, the dataset was divided into four distinct altitude ranges using K-Means Clustering.
This clustering approach allows for targeted altitude estimation across different flight scenarios, enhancing the model’s versatility and applicability.
Each dataset, comprising about 2000 instances with six distinct features, underwent thorough cleaning and normalization. The normalization process, crucial for ensuring consistency across features, was performed using the min-max normalization technique as described in Section 2.2 Equation (7).
In this equation, the dataset represents the training and testing input and output datasets, and Dataset min and Dataset max are the minimum and maximum values, respectively.
  • Model Architecture:
The model architecture consists of:
  • Input Layer: Accepting six selected features derived from UAV flight logs.
  • Hidden Layers: Two hidden layers, each containing 100 nodes, with hyperbolic tangent (tanh) activation functions.
  • Output Layer: A single neuron with ReLU activation for altitude prediction.
  • Training Process:
The dataset was split into 80% for training and 20% for testing, maintaining the distribution of target values. The training process involved the following:
  • Loss Function: Mean Squared Error (MSE) was used as the primary loss function.
  • Regularization: L1 regularization was applied to prevent overfitting.
  • Optimization: A gradient descent iterative algorithm was used to fine-tune the weight matrices (W) and bias vectors (B).
  • Early Stopping: Implemented to prevent overfitting and optimize training time.
The training was conducted over 3000 epochs with a learning rate (α) of 0.01.
  • Altitude Compensation Mechanism:
An altitude compensation mechanism was incorporated to adjust the model’s predictions based on the identified cluster from the K-Means algorithm. This enhances accuracy within particular altitude ranges or flight conditions.
  • Experimental Validation:
The model was validated using real-world data collected across two distinct geographical locations in Thailand, ensuring diverse environmental conditions. Data collection spanned from 08:30 to 18:00, capturing a full range of daily weather variations characteristic of tropical climates.
The response time of the DL-KMA model was evaluated using a MacBook Pro (13-inch, Mid 2012) equipped with a 2.5 GHz Intel Core i5 processor. The computational performance, implemented in Python programming language, produced the approximate response times as shown in Table 1 below. These timing metrics serve as baseline indicators for future real-world implementations and provide insights into the model’s practical deployment capabilities in UAV applications.
Table 1 Show Response time per input of model DL-KMA in each cluster specifications for the MacBook Pro 2012 models:
  • Processor: 2.5 GHz Intel Core i5 (Ivy Bridge)
  • Memory: DDR3 RAM (upgradeable)
  • Storage: Traditional hard drive with option for SSD
  • Display: 13.3-inch standard display
  • Ports: USB 3.0, Thunderbolt
  • Optical Drive: DVD SuperDrive
This comprehensive approach, combining advanced AI techniques with rigorous real-world testing, aims to significantly enhance UAV navigation and control systems, contributing to the advancement of autonomous aerial vehicle technology.

4. Results and Discussion

The implementation of our DL-KMA with altitude compensation demonstrated significant improvements in altitude estimation accuracy for lightweight UAVs. The results are presented in terms of key performance metrics and comparative analysis with traditional methods.

4.1. Cluster-Specific Performance

The K-means clustering approach facilitated targeted altitude estimation across diverse flight scenarios by partitioning data into homogeneous subgroups. This method enabled the identification of latent patterns within flight data, allowing for the optimization of altitude estimation algorithms tailored to specific conditions. Cluster-specific performance metrics elucidated the strengths and limitations of estimation methodologies across different scenarios, informing the selection of appropriate models or parameters for each cluster to achieve optimal results. This approach enhanced the understanding of altitude estimation performance in varied flight contexts.

4.2. Model Performance Metrics

Figure 13 illustrates the Model Performance Metrics for DL-KMA in altitude estimation. We evaluated the algorithm across K values (1–4) using Mean Squared Error (MSE), Mean Absolute Error (MAE), and coefficient of determination (R2), optimizing clustering configurations for accurate drone altitude determination.
Figure 13. Model Performance Metrics for DL-KMA in altitude estimation.
Drones 08 00718 g013aDrones 08 00718 g013b
This rigorous assessment framework enabled a comprehensive analysis of the algorithm’s efficacy in altitude estimation across various clustering configurations, providing insights into the optimal parameterization for drone altitude determination.
This systematic evaluation across the four pre-clustered datasets reveals valuable insights into the model’s performance characteristics. The progressive improvement in performance metrics from the first to the fourth cluster demonstrates the varying degrees of pattern complexity and predictability within each data segment. These findings highlight the importance of understanding cluster-specific performance in drone altitude estimation systems, as different data segments may exhibit distinct characteristics that influence model accuracy.
The comprehensive analysis across all clusters provides crucial insights into the DL-KMA model’s robustness in handling diverse altitude estimation scenarios, with each cluster potentially representing different flight conditions or altitude ranges within the drone’s operational envelope.
For the first cluster (K = 1), the model demonstrated baseline performance with an MSE of 0.072 and MAE of 0.013. This evaluation using the first clustered dataset established a fundamental benchmark for altitude estimation patterns, with the relatively higher MSE indicating potential variations within this specific data partition.
When evaluating the second cluster (K = 2), we observed substantial improvement in model accuracy, with MSE decreasing to 0.034 and MAE to 0.116. This analysis of the second data cluster revealed enhanced prediction capabilities, suggesting that the characteristics of altitude-related patterns within this group were more conducive to precise height estimations.
The third cluster analysis (K = 3) yielded further improvements with an MSE of 0.014 and MAE of 0.078. This evaluation demonstrated the model’s enhanced capability in capturing altitude-specific patterns within this data segment, effectively optimizing the balance between model complexity and performance for this cluster’s characteristics.
Most significantly, the fourth cluster evaluation (K = 4) achieved optimal performance metrics, recording the lowest MSE of 0.011 and an improved MAE of 0.069. This final cluster’s analysis proved most effective in processing altitude-related data patterns, suggesting that the inherent characteristics of this data segment were particularly well-suited for precise altitude estimation. Our results highlight the potential of integrating K-means clustering with Deep Learning regression models in the drone industry, particularly for precise height estimation tasks. This approach could significantly enhance the accuracy of drone-based measurements in various applications, including terrain mapping, building inspection, and environmental monitoring.
Furthermore, this study contributes to the broader discourse on data preprocessing techniques in machine learning, emphasizing the tangible benefits of thoughtful dataset partitioning. The marked improvement in model performance achieved through optimal clustering underscores the value of this methodology in refining predictive algorithms for drone-related applications.
In conclusion, our findings not only demonstrate the efficacy of the proposed model, but also provide valuable insights into the optimization of Deep Learning algorithms for height estimation in drone technology. The analysis of different K values reveals the importance of finding the right balance in data segmentation, with K = 4 emerging as the optimal choice for this dataset and application. This research paves the way for further exploration of advanced data segmentation techniques to enhance the precision and reliability of drone-based measurements across diverse operational contexts.

4.3. Comparative Analysis

Our proposed DL-KMA for UAVs height estimation represents a significant advancement over current methods. While traditional techniques like barometric sensors, GPS, LiDAR, and computer vision each have their merits, they also face limitations such as weather sensitivity, signal obstruction, high costs, or varying accuracy.
Based on recent literature, the following is a detailed comparison that could be added to the manuscript for a more in-depth analysis of altitude estimation accuracy between the developed DL-KMA model and traditional sensors like barometers, LiDAR, GPS, and flow sensors:
Barometric sensors, while cost-effective and easily integrated, offer altitude accuracy between ±0.5 and ±2 m, with controlled methods reaching up to ±0.05 m. In comparison, the DL-KMA model achieves significantly higher precision, with a Mean Squared Error (MSE) of 0.011, Mean Absolute Error (MAE) of 0.013, and R2 value of 0.999. This level of accuracy, less sensitive to atmospheric fluctuations, demonstrates the DL-KMA model’s robustness and reliability, surpassing standard barometric sensors in providing stable altitude estimates under varying conditions.
LiDAR Sensors: LiDAR offers centimeter-level accuracy but is generally unsuitable for lightweight UAVs due to its power and weight requirements. The LiDAR provides an accuracy of about ±0.1 m, making it highly precise but impractical for low-cost or weight-sensitive applications. The DL-KMA model, achieving an MSE of 0.011, offers competitive accuracy without the added hardware demands of LiDAR.
GPS-Based Altitude Estimation: GPS is effective for general outdoor altitude estimation but can have deviations of 1–3 m in dense or obstructed areas due to satellite signal limitations. The DL-KMA model, which integrates multi-sensor data, achieves a stable altitude estimation with an R2 value of 0.999, making it more reliable in GPS-limited environments.
Optical Flow Sensors: Suitable for indoor or low-altitude flight, optical flow sensors can detect altitude changes without GPS. However, their accuracy is reduced on low-texture surfaces or in environments with rapid motion. The DL-KMA model, which does not rely solely on optical flow, addresses this limitation by integrating additional sensor inputs, making it more adaptable and robust in varied conditions.
Table 2 Comparative Analysis of DL-KMA System versus Traditional Hardware-Based Approaches for UAV Height Estimation.
By adding these comparative results to the manuscript, it emphasizes the advantages of the DL-KMA model, especially in terms of flexibility, hardware efficiency, and accuracy across different environments, which is particularly beneficial for lightweight UAVs. This detailed comparison helps readers see the practical relevance of the DL-KMA approach across various UAV applications. By integrating multiple data inputs and leveraging K-means clustering, the model achieves unparalleled adaptability and robustness. It mitigates the weaknesses of single-sensor systems, potentially reducing costs compared to high-end LiDAR while maintaining accuracy. This innovation promises to enhance UAV operations across various applications, from precision agriculture to urban planning, by providing more reliable and precise height estimations in real-time.

4.4. Data Collection Limitations and Challenges

The process of gathering data in real-world environments presented the following significant challenges:
Battery Constraints: Each flight was limited to 15 min, with a 75–90 min charging interval between flights. This restriction allowed for only six data collection sessions per day (08:30–18:00), highlighting the challenges in accumulating comprehensive and sufficient data.
Altitude Measurement Precision: The digital laser distance meter’s narrow laser beam (7 mm radius) posed difficulties in targeting UAVs at altitudes exceeding 10 m, particularly when confronted with visibility limitations and unpredictable wind conditions at higher altitudes.
Varying Visibility Conditions: The midday period (11:40–14:50) presented the most challenging visibility due to intense sunlight, affecting the ability to maintain precise UAV positioning.
This real-world data collection approach significantly enhances the reliability and applicability of our model. It ensures that our altitude estimation techniques are robust across a diverse range of actual operational scenarios, including daily weather fluctuations, seasonal weather patterns characteristic of tropical climates, and various altitude levels and flight patterns.
The integration of multi-sensor data with this comprehensive real-world dataset enables more accurate and reliable altitude predictions, particularly in challenging environments. The model’s ability to adapt to different flight situations through clustering enhances its robustness and applicability across diverse operational contexts.

4.5. Environmental Impact Analysis on Model Accuracy

Our research deliberately incorporated data from diverse environmental conditions to ensure model robustness. Data collection was conducted as follows across two distinct locations with significant environmental variations:
Geographical Diversity:
  • Area A (Muak Lek, Saraburi): elevation approximately 430 m
  • Area B (Bangkok): elevation approximately 3 m
Environmental Challenges:
  • Varying wind conditions at different altitudes
  • Atmospheric pressure differences due to elevation disparities
  • Diverse lighting conditions throughout the day (08:30–18:00)
  • Critical midday period (11:40–14:50) with intense sunlight
A key strength of our approach lies in the intentional combination of datasets from these varying conditions. The DL-KMA model processes these environmental variations implicitly through the input features, without explicit knowledge of the environmental conditions during data collection. This design choice enhances the model’s robustness and generalization capabilities.
The optimized model demonstrates remarkable consistency in accuracy (MSE: 0.011, R2: 0.999) across the following:
  • Different elevations and atmospheric pressures
  • Various times of day
  • Changing wind conditions
  • Diverse lighting conditions
This performance validates our hypothesis that a well-designed deep learning model can effectively handle environmental variability without requiring explicit environmental condition inputs, making it more practical for real-world applications.

5. Conclusions

This study presents significant advancements in UAVs altitude estimation through the development of a custom Deep Learning architecture implemented entirely from scratch. The research introduces an innovative approach by integrating K-means Clustering for data segmentation, enabling targeted altitude estimation across diverse flight conditions. This integration enhances the model’s adaptability to various environmental factors and flight patterns, significantly improving its versatility and accuracy.
The model underwent comprehensive real-world validation across a spectrum of geographical and environmental conditions, ensuring its robustness and applicability in practical scenarios. Notably, this solution eliminates the necessity for additional costly hardware such as LiDAR, offering a cost-effective, software-based alternative for precise altitude estimation in lightweight UAVs.
The proposed model exhibits exceptional performance metrics. In its optimal configuration, it achieved a Mean Squared Error (MSE) of 0.011, a Mean Absolute Error (MAE) of 0.013, and a coefficient of determination (R2) of 0.999, underscoring the model’s high accuracy and reliability. These findings collectively represent a significant advancement in UAV altitude estimation techniques, offering both theoretical insights and practical applications for the drone industry, particularly in scenarios where lightweight and cost-effective solutions are crucial.
The incorporation of K-means Clustering represents a significant advancement in UAVs altitude estimation technology. By segmenting the altitude data into distinct clusters, we enable the model to recognize and adapt to specific patterns within each altitude range. This approach not only improves overall accuracy but also enhances the model’s ability to handle varying atmospheric conditions and flight dynamics unique to different altitude brackets.
Our research demonstrates the efficacy of combining advanced machine learning techniques with traditional sensor data to overcome the limitations of conventional altitude estimation methods. The model’s performance metrics underscore its remarkable accuracy and consistency across diverse operational scenarios. These results significantly surpass traditional methods such as barometric sensors, GPS, and computer vision techniques in terms of accuracy, consistency, and adaptability to varying environmental conditions.
Nonetheless, this study also highlights areas for future research. The challenges encountered in data collection, particularly related to battery constraints and visibility issues at higher altitudes, underscore the need for further technological advancements in UAVs hardware. Future studies could explore the development of more energy-efficient UAVs systems or alternative power sources to extend flight times and data collection capabilities. Additionally, the integration of our DL-KMA model with other onboard systems, such as obstacle avoidance or navigation algorithms, could lead to more comprehensive and robust UAVs control systems.
Furthermore, while our model demonstrates excellent performance in the tested scenarios, future research opportunities exist to enhance the model’s capabilities under extreme conditions. Regarding battery limitations, subsequent studies could investigate energy-efficient systems, particularly autonomous charging systems for extended operations, as proposed by Barrile et al. (2024) [28]. The DL-KMA model shows significant potential for specialized applications, such as precision agriculture monitoring, as demonstrated by Xu et al. (2024) [29] and Raj et al. (2024) [30] in their crop height estimation research. Additionally, Han (2024) [31] further validated the effectiveness of UAV remote sensing in agricultural applications. Moreover, the model could be adapted for urban infrastructure inspection applications.
In conclusion, this research successfully achieved its primary objective of enhancing UAV flight control through the development of the DL-KMA model, demonstrating significant improvements in altitude estimation accuracy. The experimental results validated our initial hypothesis that artificial intelligence-driven approaches could optimize critical flight parameters beyond traditional methods. As targeted in our research goals, the model proved its reliability across diverse operational conditions, aligning with practical applications such as disaster response scenarios, as explored by Chandran and Vipin (2024) [32] in their multi-UAV network architectures. This study fulfills its intended purpose of establishing a robust foundation for future autonomous aerial systems, particularly advancing our original aim of enhancing lightweight drone applications in our increasingly UAV-dependent society.

Author Contributions

Conceptualization, P.P. (Pattarapong Phasukkit); methodology, P.P. (Pattarapong Phasukkit); validation, P.P. (Pattarapong Phasukkit); formal analysis, P.P. (Prot Piyakawanich), P.P.; investigation, P.P. (Prot Piyakawanich) and P.P. (Pattarapong Phasukkit); writing—original draft P.P. (Prot Piyakawanich); funding acquisition, P.P. (Pattarapong Phasukkit). All authors have read and agreed to the published version of the manuscript.

Funding

King Mongkut’s Institute Technology Ladkrabang (KMITL).

Institutional Review Board Statement

Not applicable.

Informed Consent Statement

Not applicable.

Data Availability Statement

Data available in a publicly accessible repository.

Acknowledgments

The authors extend their profound gratitude to the BURNLAB within the Electronics Department, School of Engineering at King Mongkut’s Institute Technology Ladkrabang (KMITL).

Conflicts of Interest

The authors declare no conflicts of interest.

References

  1. Poudel, G. Improved Object Detection in UAV Images using Deep Learning. Cogniz. J. Multidiscip. Stud. 2024, 4, 83–109. [Google Scholar] [CrossRef]
  2. Qin, P.; Wu, X.; Cai, Z.; Zhao, X.; Fu, Y.; Wang, M. Joint Optimization of UAV’s Flying Altitude and Power Allocation for UAV-Enabled Internet of Vehicles. IEEE Trans. Intell. Transp. Syst. 2023, 10, 3421–3434. [Google Scholar]
  3. Pesci, A.; Teza, G.; Fabris, M. Editorial of Special Issue Unconventional Drone-Based Surveying. Drones 2023, 7, 175. [Google Scholar] [CrossRef]
  4. Gao, F.; Wang, Z.; Liu, X.; Liu, S. UAV Position Optimization for Servicing Ground Users Based on Deep Reinforcement Learning. J. Phys. Conf. Ser. 2024, 2861, 012011. [Google Scholar] [CrossRef]
  5. Wang, W.; Chen, H.; Zhang, X.; Zhou, W.; Shi, W. Aprus: An Airborne Altitude-Adaptive Purpose-Related UAV System for Object Detection. In Proceedings of the 2022 IEEE 24th International Conference on High Performance Computing & Communications; 8th International Conference on Data Science & Systems; 20th International Conference on Smart City; 8th International Conference on Dependability in Sensor, Cloud & Big Data Systems & Application (HPCC/DSS/SmartCity/DependSys), Hainan, China, 18–20 December 2022. [Google Scholar] [CrossRef]
  6. Sanjar, S.; Sulaym, S. Optimal Deep Learning-Based Image Classification for IoT-Enabled UAVs in Remote Sensing Applications. Int. J. Adv. Appl. Comput. Intell. 2024, 6, 1–12. [Google Scholar] [CrossRef]
  7. Yildirim, E.O.; Sefercik, U.G.; Kavzoglu, T. Automated identification of vehicles in very high-resolution UAV orthomosaics using YOLOv7 deep learning model. Turk. J. Electr. Eng. Comput. Sci. 2024, 32, 144–165. [Google Scholar] [CrossRef]
  8. Panthakkan, A.; Mansoor, W.; Al Ahmad, H. Accurate UAV-Based Vehicle Detection: The Cutting-Edge YOLOv7 Approach. In Proceedings of the 2023 International Symposium on Image and Signal Processing and Analysis (ISPA), Rome, Italy, 18–19 September 2023. [Google Scholar] [CrossRef]
  9. Zeng, H.; Li, J.; Qu, L. Lightweight Low-Altitude UAV Object Detection Based on Improved YOLOv5s. Int. J. Adv. Netw. Monit. Control 2024, 9, 87–99. [Google Scholar] [CrossRef]
  10. Chen, Z.; Li, J.; Li, Q.; Dong, Z.; Yang, B. DeepAAT: Deep Automated Aerial Triangulation for Fast UAV-based mapping. arXiv 2024, arXiv:2402.01134. [Google Scholar] [CrossRef]
  11. Wang, C.; Li, Z.; Gao, Q.; Cui, T.; Sun, D.; Jiang, W. Lightweight and Efficient Air-to-Air Unmanned Aerial Vehicle Detection Neural Networks. In Proceedings of the 2023 IEEE International Conference on Unmanned Systems (ICUS), Hefei, China, 13–15 October 2023. [Google Scholar] [CrossRef]
  12. Makrigiorgis, R.; Kyrkou, C.; Kolios, P. How High can you Detect? Improved accuracy and efficiency at varying altitudes for Aerial Vehicle Detection. In Proceedings of the 2023 International Conference on Unmanned Aircraft Systems (ICUAS), Warsaw, Poland, 6–9 June 2023. [Google Scholar] [CrossRef]
  13. Makrigiorgis, R.; Kyrkou, C.; Kolios, P. Multi-Altitude Aerial Vehicles Dataset (Version 1.0); Zenodo: Geneva, Switzerland, 2023. [Google Scholar] [CrossRef]
  14. Cheng, Q.; Wang, Y.; He, W.; Bai, Y. Lightweight air-to-air unmanned aerial vehicle target detection model. Sci. Rep. 2024, 14, 2609. [Google Scholar] [CrossRef] [PubMed]
  15. Taame, A.; Lachkar, I.; Abouloifa, A.; Mouchrif, I. UAV Altitude Estimation Using Kalman Filter and Extended Kalman Filter. In Automatic Control and Emerging Technologies, Proceedings of ACET 2023, Kenitra, Morocco, 11–13 July 2023; El Fadil, H., Zhang, W., Eds.; Lecture Notes in Electrical Engineering; Springer: Singapore, 2024; p. 1141. [Google Scholar] [CrossRef]
  16. Yang, Z.; Xie, F.; Zhou, J.; Yao, Y.; Hu, C.; Zhou, B. AIGDet: Altitude-Information-Guided Vehicle Target Detection in UAV-Based Images. IEEE Sens. J. 2024, 24, 22672–22684. [Google Scholar] [CrossRef]
  17. Aslani, R.; Saberinia, E. Joint Power Control and Altitude Planning for Energy-Efficient UAV-Assisted Vehicular Networks. In Advances in Systems Engineering; Selvaraj, H., Chmaj, G., Zydek, D., Eds.; Springer: Cham, Switezerland, 2023; p. 761. [Google Scholar] [CrossRef]
  18. Li, Z.; Jiang, X.; Ma, S.; Ma, X.; Lv, Z.; Ding, H.; Ji, H.; Sun, Z. Expediting the Convergence of Global Localization of UAVs through Forward-Facing Camera Observation. Drones 2024, 8, 335. [Google Scholar] [CrossRef]
  19. Zhai, W.; Li, C.; Cheng, Q.; Mao, B.; Li, Z.; Li, Y.; Ding, F.; Qin, S.; Fei, S.; Chen, Z. Enhancing Wheat Above-Ground Biomass Estimation Using UAV RGB Images and Machine Learning: Multi-Feature Combinations, Flight Height, and Algorithm Implications. Remote Sens. 2023, 15, 3653. [Google Scholar] [CrossRef]
  20. Du, L.; Liang, Y.; Mian, I.A.; Zhou, P. K-Means Clustering Based on Chebyshev Polynomial Graph Filtering. In Proceedings of the ICASSP 2024 IEEE International Conference on Acoustics, Speech and Signal Processing (ICASSP), Seoul, Republic of Korea, 14–19 April 2024; Available online: https://ieeexplore.ieee.org/document/10446384 (accessed on 24 November 2024).
  21. Ren, H.; Pan, C.; Wang, K.; Deng, Y.; Elkashlan, M.; Nallanathan, A. Achievable Data Rate for URLLC-Enabled UAV Systems With 3-D Channel Model. IEEE Wirel. Commun. Lett. 2019, 8, 1587–1590. [Google Scholar] [CrossRef]
  22. Pritzl, V.; Vrba, M.; Tortorici, C.; Ashour, R.; Saska, M. Adaptive estimation of UAV altitude in complex indoor environments using degraded and time-delayed measurements with time-varying uncertainties. Robot. Auton. Syst. 2022, 156, 104315. [Google Scholar] [CrossRef]
  23. Kolarik, J.; Lyng, N.L.; Bossi, R.; Li, R.; Witterseh, T.; Smith, K.M.; Wargocki, P. Application of Cluster Analysis to Examine the Performance of Low-Cost Volatile Organic Compound Sensors. Buildings 2023, 13, 2070. [Google Scholar] [CrossRef]
  24. Liu, Y.; Han, K.; Rasdorf, W. A Comparison of Accuracy of UAS Photogrammetry in Different Terrain Sites. In Construction Research Congress 2024; American Society of Civil Engineers: Reston, VA, USA, 2024; pp. 367–376. [Google Scholar] [CrossRef]
  25. Humaira, H.; Rasyidah, R. Determining the Appropiate Cluster Number Using Elbow Method for K-Means Algorithm. In Proceedings of the 2nd Workshop on Multidisciplinary and Applications (WMA) 2018, Padang, Indonesia, 24–25 January 2018; EAI: Gent, Belgium, 2020. [Google Scholar] [CrossRef]
  26. Khalaf, A.Z.; Alyasery, B.H. Laser Distance Sensors Evaluation for Geomatics Researches. Iraqi J. Sci. 2020, 61, 1831–1841. [Google Scholar] [CrossRef]
  27. Taddia, Y.; Stecchi, F.; Pellegrinelli, A. Coastal Mapping Using DJI Phantom 4 RTK in Post-Processing Kinematic Mode. Drones 2020, 4, 9. [Google Scholar] [CrossRef]
  28. Barrile, V.; La Foresta, F.; Genovese, E. Optimizing Unmanned Aerial Vehicle Electronics: Advanced Charging Systems and Data Transmission Solutions. Electronics 2024, 13, 3208. [Google Scholar] [CrossRef]
  29. Xu, T.; Damron, E.; Silvestri, S. High-Precision Crop Monitoring Through UAV-Aided Sensor Data Collection. In Proceedings of the ICC 2024—IEEE International Conference on Communications, Denver, CO, USA, 20 August 2024. [Google Scholar] [CrossRef]
  30. Raj, A.S.; Karthekeyan, S.G.; Kaviyarasu, A.; Henrietta, H.M. Revolutionizing Precision Agriculture with Drone-Based Imaging and Fuzzy Intelligent Algorithms. Qeios 2024. preprint. [Google Scholar] [CrossRef]
  31. Han, Y. Application of Unmanned Aerial Vehicle Remote Sensing for Agricultural Monitoring. E3S Web of Conferences. In Proceedings of the 2024 International Conference on Ecological Protection and Environmental Chemistry, Budapest, Hungary, 21–23 June 2024. [Google Scholar] [CrossRef]
  32. Chandran, I.; Vipin, K. Comparative Analysis of Stand-alone and Hybrid Multi-UAV Network Architectures for Disaster Response Missions. In Proceedings of the 2024 International Conference on Advancements in Power, Communication and Intelligent Systems (APCI), Kannur, India, 21–22 June 2024. [Google Scholar] [CrossRef]
Figure 1. A method for measuring the altitude of a drone using a digital laser distance meter.
Drones 08 00718 g001
Figure 4. UAV Flight Data Extraction and Validation Process Using Video-synchronized Log Analysis.
Drones 08 00718 g004
Figure 5. The image presents a schematic representation of a high-precision fixed distance range measurement experiment, likely designed for unmanned aerial vehicle (UAV) altitude calibration.
Drones 08 00718 g005
Figure 6. The DL-KMA predicts altitude estimation accuracy in each cluster of Unmanned Aerial Vehicles (UAVs).
Drones 08 00718 g006
Figure 7. An advanced deep learning pipeline for enhancing UAV alti-tude precision.
Drones 08 00718 g007
Figure 8. A system for precise drone altitude control using DL-KMA.
Drones 08 00718 g008
Table 1. Performance comparison of K-means clustering (K = 1–4) showing dataset sizes, response times, and processing efficiency for UAV telemetry data analysis.
ClusterDatasets
(Before Normalize)
Response Time
(msec)
Response Time/Input
K = 11998 rows84,00042.04 ms
K = 21978 rows84,00042.76 ms
K = 31994 rows85,00042.62 ms
K = 42030 rows89,00043.84 ms
Table 2. Performance Comparison between DL-KMA and Traditional LiDAR Systems for UAV Applications.
Comparison
Aspects
Proposed System (DL-KMA) Traditional Hardware System (LiDAR)
CostUSD (No additional hardware installation required, uses existing sensors in FCU, cost-effective in terms of equipment)Based on our analysis, 3 LiDAR models were identified that meet or closely align with the following research specifications:
1. 399 USD: Benewake TF03-100 LiDAR
2. 7700 USD: DJI Zenmuse L1
3. 1599 USD: Livox AVIA
Computational CostSoftware-based processing Minimal computational overhead- Requires LiDAR data processing, high power consumption during operation
Response TimeApproximately 42.815 msLiDAR Sensors:
  • Response time: 0.02–0.1 ms
  • Common drone LiDAR sensors like TFmini Plus have update rates of 1000 Hz (1 ms response time)
GPS Receivers:
  • Update rate: 1–10 Hz (typical for drone applications)
  • Response time: 100–1000 milliseconds
  • Note: Modern GPS modules optimized for UAVs can achieve higher rates up to 20 Hz (50 ms)
Barometric Pressure Sensors:
  • Response time: 5–10 milliseconds
  • Common drone barometers (like BMP388) have response times around 5.5 ms
  • Update rates typically 50–200 Hz
Error (Accuracy)- MSE = 0.011 ≈ ±0.105 m
-MAE = 0.069 ≈ ±0.069 m
(Accuracy comparable to Digital Laser distance meter [±3 mm])
- LiDAR: Accuracy ±0.1 m
- Barometric: ±0.5 to ±2 m
- GPS: Error margin 1–3 m
Limitations- Requires model training
- Depends on training data quality
- Increased equipment weight, higher power consumption, not suitable for lightweight UAVs
Disclaimer/Publisher’s Note: The statements, opinions and data contained in all publications are solely those of the individual author(s) and contributor(s) and not of MDPI and/or the editor(s). MDPI and/or the editor(s) disclaim responsibility for any injury to people or property resulting from any ideas, methods, instructions or products referred to in the content.

