Article

Mission-Based Design and Retrofit for Energy/Propulsion Systems of Solar-Powered UAVs: Integrating Propeller Slipstream Effects

1
School of Aeronautic Science and Engineering, Beihang University, Beijing 100191, China
2
China Academy of Aerospace and Aerodynamics, Beijing 100071, China
*
Author to whom correspondence should be addressed.
Drones 2024, 8(10), 584; https://doi.org/10.3390/drones8100584
Submission received: 29 August 2024 / Revised: 29 September 2024 / Accepted: 14 October 2024 / Published: 16 October 2024

Abstract

:
Over twenty Solar-Powered Unmanned Aerial Vehicle (SPUAV) designs exist worldwide, yet few have successfully achieved uninterrupted high-altitude flight. This shortfall is attributed to several factors that cause the actual performance of SPUAV to fall short of expectations. Existing studies identify the propeller slipstream as one of these adverse factors, which leads to a decrease in the lift–drag ratio and an increase in energy consumption. However, traditional design methods for SPUAVs tend to ignore the potential adverse effects of slipstream at the top-level design phase. We find that this oversight results in a reduction in the feasible mission region of SPUAVs from 109 days to only 46 days. To address this issue, this paper presents a high-fidelity multidisciplinary design framework for the energy/propulsion systems of SPUAVs that integrates the effects of a propeller slipstream. Specifically, deep neural networks are employed to predict the lift–drag characteristics of SPUAVs under various slipstream conditions, and the energy performance is further analyzed by evaluating the time-varying state parameters throughout a day. Subsequently, the optimal solutions for the energy/propulsion systems specific to certain latitudes and dates are obtained through optimization design. The effectiveness of the proposed design framework was demonstrated on a 30-m wingspan SPUAV. The results indicated that, compared to the traditional design method, the proposed approach led to designs that more effectively accomplished closed-loop flight in designated regions and prevented the reduction of the feasible mission region. Additionally, through the targeted retrofit of the energy/propulsion systems, SPUAVs exhibited enhanced adaptability to the solar radiation characteristics of different mission points, resulting in a further expansion of the feasible mission region. Furthermore, this research also explored the variation trends in optimal solutions across different latitudes and dates and investigated the reasons and physical mechanisms behind these variations.

1. Introduction

Solar-powered Unmanned Aerial Vehicles (SPUAVs) are a kind of aircraft that relies solely on solar energy as the power source, aiming to achieve high-altitude and long-endurance flights for months or even years without interruption. Due to the particularity of SPUAVs, the design and development face numerous challenges [1]. Scholars have actively explored various design methods for SPUAVs. Noth proposed a design method based on energy balance and weight balance, forming the foundation of existing conceptual design methods for SPUAVs [2]. Li et al. presented a general optimization design method that considers propulsion system planning as the priority [3]. This method integrated the propulsion system top-level target parameters that affect the path planning into the general optimization design. Then, the reference area, aspect ratio, and target altitude of the SPUAV were optimized. Barkar et al. employed genetic algorithms to optimize the aerodynamic shape of SPUAVs and compared the energy performance of different designs [4]. Wu et al. achieved improved energy performance of SPUAVs by optimizing the Λ-shaped rotatable wing [5]. In addition, many other studies also have focused on developing various design methods for SPUAVs, aiming to develop solutions capable of achieving day–night closed-loop flight [6,7,8].
According to our survey, there are over twenty existing SPUAV designs worldwide, yet fewer than five have successfully achieved high-altitude and day–night closed-loop flight. One significant reason is that, in previous research, low-fidelity or multi-fidelity models have often been used for the top-level parameter design of SPUAVs. Specifically, certain rough assumptions or approximations have been employed, such as assuming constant efficiency for some subsystems, neglecting propeller slipstream effects on the wings, or using simplified models like panel methods for aerodynamic performance estimation. These approaches help in reducing system complexity and computational costs. However, the introduction of low-fidelity models might lead to suboptimal designs. In particular, due to the high sensitivity of SPUAVs to energy [9,10,11], overestimating the efficiency of certain subsystems during the top-level design phase may significantly reduce the actual performance of the designed SPUAV or even make it unable to achieve closed-loop flight. These factors cause the actual performance of SPUAVs to fall short of expectations, with propeller slipstream being one of the unavoidable and non-negligible factors [12]. To address these potential uncertainties at the top-level design phase, designers typically incorporate design margins to enhance the robustness of the design results. However, the size of the margins is entirely dependent on the designer’s experience, which is clearly not conducive to achieving an optimal design [13]. Therefore, improving the fidelity of models used during the SPUAV design process is vital to accurately predict system behavior, avoid suboptimal design, and optimize performance. This is crucial for scientifically allocating system design margins, ultimately reducing the risk associated with achieving prolonged and uninterrupted flights.
Numerous fluid dynamics studies on the propeller/wing coupling effects in SPUAVs indicate that the propeller slipstream leads to a reduction in the wing’s lift–drag ratio [14,15,16]. Wang et al. analyzed the flow characteristics of a 20-m straight wing of a SPUAV (Re ≈ 3 × 10⁵) [14]. This wing was equipped with four propellers, each with a diameter of 2 m. They pointed out that, in the propeller-on condition, the slipstream-induced spanwise secondary flow transformed the near-wall limiting streamlines into complex and chaotic turbulence patterns, resulting in increased turbulent frictions and pressure losses on the wing. Macroscopically, this manifests as a 16.32% decrease in the lift–drag ratio of the wing. Sun et al. employed the sliding mesh method to calculate the unsteady aerodynamic characteristics of SPUAVs under the influence of a propeller slipstream (Re ≈ 4.8 × 10⁵) [15]. The research focused on a two-bladed propeller with a diameter of 2 m and a straight wing section with a wingspan of 10 m. The results indicate that the slipstream leads to a 4.6% increase in lift and a 25.5% increase in drag for the wing section, culminating in a 16.6% decrease in the lift–drag ratio. Additionally, they observed that the propeller slipstream is beneficial in reducing the size of laminar separation bubbles. Jin et al. conducted CFD simulations and flight tests on a small SPUAV named EAV-1 (Re ≈ 2.8 × 10⁵) and derived the actual drag from flight test data [16]. They pointed out that the CFD results for a clean configuration underestimate the drag of the SPUAV, with a relative error of 27.6%. The discrepancy is reduced to 14.4% when the additional drag from the propeller slipstream is more properly predicted by applying the fan disk model. Moreover, since the SPUAV maintained a steady-level turn during the flight test, the error was further reduced to 2.3% after considering the additional drag from the aircraft trim and load factor for the turning flight. Jin et al.’s research suggests that, aside from changes in the flight state, the propeller slipstream is the primary reason for the deviation of the actual drag of the SPUAV from the estimated values.
It can be expected that the additional drag introduced by a slipstream will affect the accuracy of flight performance calculations and lead to an increase in overall energy consumption. However, there are currently few pieces of research considering this effect at the top-level design phase of SPUAVs, and a systematic understanding of how the propeller slipstream impacts the optimal design solutions is still lacking [17,18]. Therefore, this paper presents an optimization design framework for the energy and propulsion systems of a SPUAV, taking into account the effects of propeller slipstream. Specifically, for a particular SPUAV configuration, the optimization targets the energy and propulsion systems, and a deep neural network (DNN) model is employed to predict the lift–drag characteristics of the SPUAV under the effects of propeller slipstream. Based on the proposed multidisciplinary high-fidelity hybrid design framework, this research discusses the impacts of propeller slipstream on the optimal design results and the underlying physical mechanisms.
The remainder of this paper is structured as follows:
Section 2 introduces a high-fidelity hybrid design framework which takes the photovoltaic (PV) coverage ratio, secondary battery capacity, motor overload factor, and propeller diameter as the design variables. The objective is to minimize the total weight of the SPUAV under the premise of achieving closed-loop flight during day and night. In this section, we employ an adaptive sequential sampling method based on k-fold cross-validation to construct a DNN model for predicting the effects of propeller slipstream on lift–drag characteristics under various flight conditions. Combined with the mathematical and physical models of each subsystem, the time-varying state parameters of the SPUAV over a day are solved to measure the weight and energy performance of the design scheme. Subsequently, a genetic algorithm is used to obtain the optimal design solution that enables day–night closed-loop flight for specific mission points.
In Section 3, a SPUAV with a wingspan of 30 m is used as the study object. We firstly present the accuracy of the constructed DNN model in Section 3.1. Subsequently, we compare the design results at a specific mission point using both the traditional design method and the proposed method. The results reveal that the feasible mission space area obtained using the proposed method is approximately 3.3 times larger than that of the traditional method. An in-depth analysis explores the underlying reasons causing the differences between the two methods. Furthermore, this research examines how the optimal design varies with different mission points. It is observed that, compared to the results of single-point design, secondary design of the energy and propulsion systems can further expand the feasible mission region of the SPUAV to 2.5 times the original size. This presents promising application prospects, because traditional SPUAV design methods typically use top-level design parameters such as wingspan and aspect ratio as design variables [19,20]. However, the final solution can only adopt one of these designs, meaning it cannot accommodate the needs of different latitudes. In contrast, the retrofit framework proposed in this study only requires a secondary design of the energy and propulsion systems while keeping the SPUAV’s aerodynamic shape unchanged, which enhances the SPUAV’s adaptability to a wide range of mission scenarios. Additionally, the trends of the optimal design results with latitude and date variations are also analyzed, highlighting how differences in solar radiation characteristics influence the optimal design results.
The main purpose of this paper is to integrate the propeller slipstream effects into the top-level design of SPUAVs. By enhancing cross-references between subsystems, a high-fidelity multidisciplinary design framework is established, which improves the accuracy of the design outcomes for the SPUAV. The methodology and general rules presented in this paper provide a universal reference for the general design and trade-offs of SPUAVs. The related analysis contributes to a deeper comprehension of the correlation between the energy performance and design of SPUAVs.

2. High-Fidelity Hybrid Design Framework

The essence of SPUAV design lies in identifying the optimal design parameters that ensure that the SPUAV satisfies the energy balance equation EaviEreq within a day, where Eavi is the acquired solar energy, and Ereq is the consumed energy. Figure 1 illustrates the energy transmission path of a SPUAV throughout a day. In the daylight hours, the PV cells convert solar energy for sustaining flight and charging the onboard secondary battery, while the SPUAV also climbs to store gravitational potential energy. During the night, the SPUAV glides to convert the stored gravitational potential energy back into kinetic energy for flight, and the energy stored in the secondary battery is also utilized for nighttime flight.
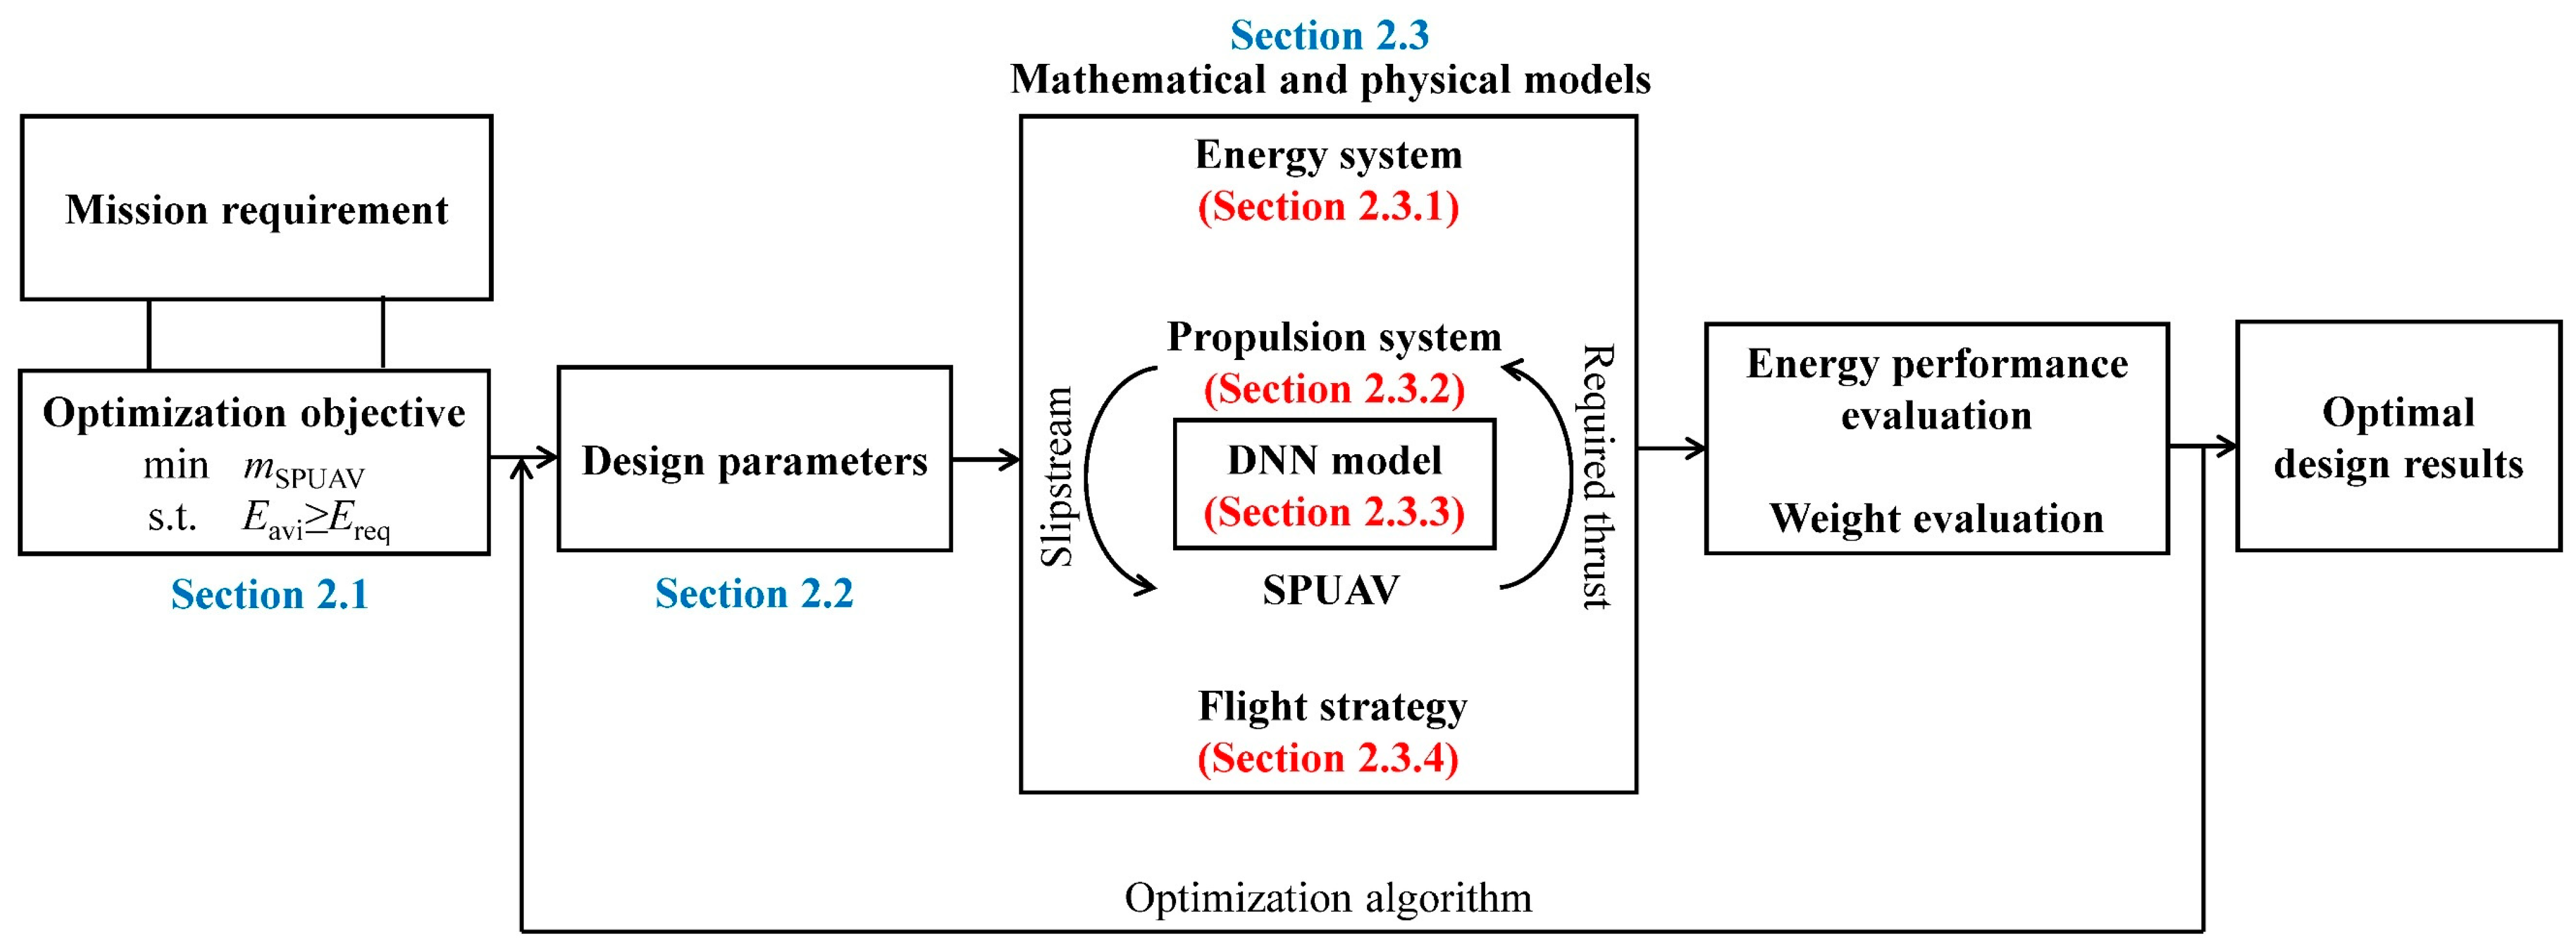
However, as mentioned in the Introduction, existing design methods for SPUAVs often neglect the potential adverse effects of the propeller slipstream at the top-level design stage. This may result in inaccurate estimations of the energy consumption levels illustrated in Figure 1 and consequently lead to deviations in the design results. To address this issue, this paper proposes a high-fidelity hybrid design framework that integrates the propeller slipstream effects. The general process of this framework is depicted in Figure 2.
For different design parameters, we assess the energy acquisition and consumption of the SPUAV throughout a day to ascertain whether it can satisfy the energy balance constraint. In this process, there is a coupling relationship between the propulsion system and the lift–drag characteristics of the SPUAV. Specifically, the propeller slipstream affects the aerodynamic performance of the SPUAV, while the drag of the SPUAV determines the required thrust of the propeller. We employ a DNN model to predict the lift–drag characteristics of the SPUAV under different slipstream conditions and iteratively find a balanced state for the coupled relationship. Subsequently, the energy performance and weight of the SPUAV are evaluated through the constructed mathematical and physical models of each subsystem, and the design parameters are optimized by the optimization algorithm.

2.1. Mission Points and Optimization Objective

2.1.1. Mission Points

In this research, the mission points are defined by specific temporal and spatial coordinates, namely the sequential day number nd (ranging from 1 to 365) and latitude ψ (ranging from −90° to 90°). The solar declination movement causes the solar elevation angle to vary with latitude and date (independent of longitude), leading to changes in solar radiation [21], which intuitively manifests as seasonal changes. Consequently, the mission points directly determine the level of solar energy accessible to the SPUAV, thereby affecting the design results. Investigating the trends in the optimal design results corresponding to different mission points is also one of the purposes of this research.

2.1.2. Optimization Objective

For the specified mission points, we employ the proposed high-fidelity hybrid design framework for optimal design. The optimization objective is to minimize the total weight of the SPUAV. In this process, the attainment of day–night closed-loop flight is a necessary prerequisite, meaning that the total solar energy absorbed by a SPUAV within 24 h should exceed the energy consumed.
Additionally, the SPUAV may be deployed across various latitudes and dates. The regions where day–night closed-loop flight can be achieved constitute the feasible mission region for the SPUAV. The feasible mission region reflects the versatility and the energy performance of the design results. Consequently, discussions regarding the feasible mission region of the design results are also essential.

2.2. Design Parameters of the SPUAV

The SPUAV primarily consists of structural components, energy systems, propulsion systems, control systems, and mission payloads. Based on the energy transmission path depicted in Figure 1, the energy and propulsion systems of the SPUAV occupy the most crucial position from an energy perspective. The energy system directly influences the absorption, storage, and release of solar energy, while the propulsion system directly determines the power consumption level of the SPUAV. Therefore, this research focuses on these two subsystems as the design objects.
Figure 3 depicts the energy and propulsion systems of a 30-m wingspan SPUAV developed by the authors’ team. The flexible gallium arsenide (GaA) PV cells, used for converting solar energy, are encapsulated between two flexible polyurethane substrates and bonded to the wing ribs using epoxy resin. During nighttime flight, the SPUAV is powered by the secondary battery (lithium-ion battery in this research), which is packaged into several units and distributed across the SPUAV. By configuring the battery cells in a series and parallel arrangements, a battery pack of specified capacity can be obtained. The propulsion system is secured to the wing’s stiffening ribs through a carbon fiber support shaft and fastened with bolts.
Figure 4 outlines the main technical parameters for the energy and propulsion systems of the SPUAV. They can be categorized into two types: index parameters and design parameters. The index parameters are contingent upon the existing state of the technology within the industry and are generally fixed or have standard values that reflect the current capabilities of the technology. In contrast, the design parameters are variables that need to be carefully determined through an optimization process to achieve the best performance of the SPUAV.
For the design of the propeller, the Betz condition provides a rapid design approach to obtain the most efficient rotational speed and geometric shape [22,23]. The main input variables for the Betz condition are the required thrust (equal to the cruise drag of the SPUAV) and the propeller diameter. Therefore, based on the Betz condition, the top-level design parameter for the propeller is further determined to be the diameter.
To sum up, in this research, the following parameters are identified as design parameters: for the energy system, the PV coverage rate RPV (defined as the percentage of the PV cells area to the wing area) and the secondary battery capacity Ebatt are the variables of interest, which respectively determine the ability to absorb and store solar energy. For the propulsion system, the motor overload factor kmotor (defined as the ratio of the motor’s maximum continuous output power to the rated output power) and the propeller diameter Dprop are the variables of interest, which respectively determine the path planning and flight power consumption of the SPUAV. The aforementioned four parameters are the top-level design parameters for the propulsion and energy systems of the SPUAV, directly impacting the energy performance and mission feasibility. Correspondingly, the aerodynamic shape of the SPUAV and the configuration of the other subsystems remain unchanged. This implies that the retrofit work primarily includes covering the designated area with PV cells based on RPV, installing the secondary batteries of the specified capacity, and replacing the propulsion system with specific parameters. It is anticipated that these retrofits will not require significant time or cost.

2.3. Mathematical and Physical Models

2.3.1. Energy System

(a)
PV cells
The output power of the PV cells can be represented by
P PV = P SC S wing R PV η PV η MPPT
where PSC is the power per unit area received from the sun, Swing is the wing area of the SPUAV, and RPV is the PV coverage ratio (RPV = SPV/Swing), which is one of the design parameters in this research. The energy conversion efficiencies of the PV cells (ηPV) and maximum power point tracking (ηMPPT) are specified as 0.28 and 0.95, respectively.
P SC = S I τ H sin α e
In Equation (2), SI is the solar irradiance above the atmosphere, τH is the solar radiation attenuation coefficient, and αe is the solar elevation angle. They are expressed as functions of the date, latitude, and apparent solar time. The detailed derivation process is provided in reference [24].
Moreover, changes in the PV coverage ratio will also alter the weight of the PV cells.
m PV = S wing R PV ρ PV
The surface density of the PV cells ρPV is specified as 0.4 kg/m2 in this research.
(b)
Secondary battery
The secondary battery provides energy for the nighttime cruise of the SPUAV, and the weight can be expressed as
m batt = E batt / ρ batt = E available / ( d discharge ρ batt )
where Ebatt is the capacity of the secondary battery (which is one of the design parameters in this study). ρbatt is the energy density of the secondary battery, which is specified as 350 Wh/kg in this research. In practice, the limitation imposed by the discharge depth ddischarge (specified as 0.9 in this research) results in the battery capacity not being fully available, and Eavailable represents the actual available battery capacity.

2.3.2. Propulsion System

(a)
Propeller
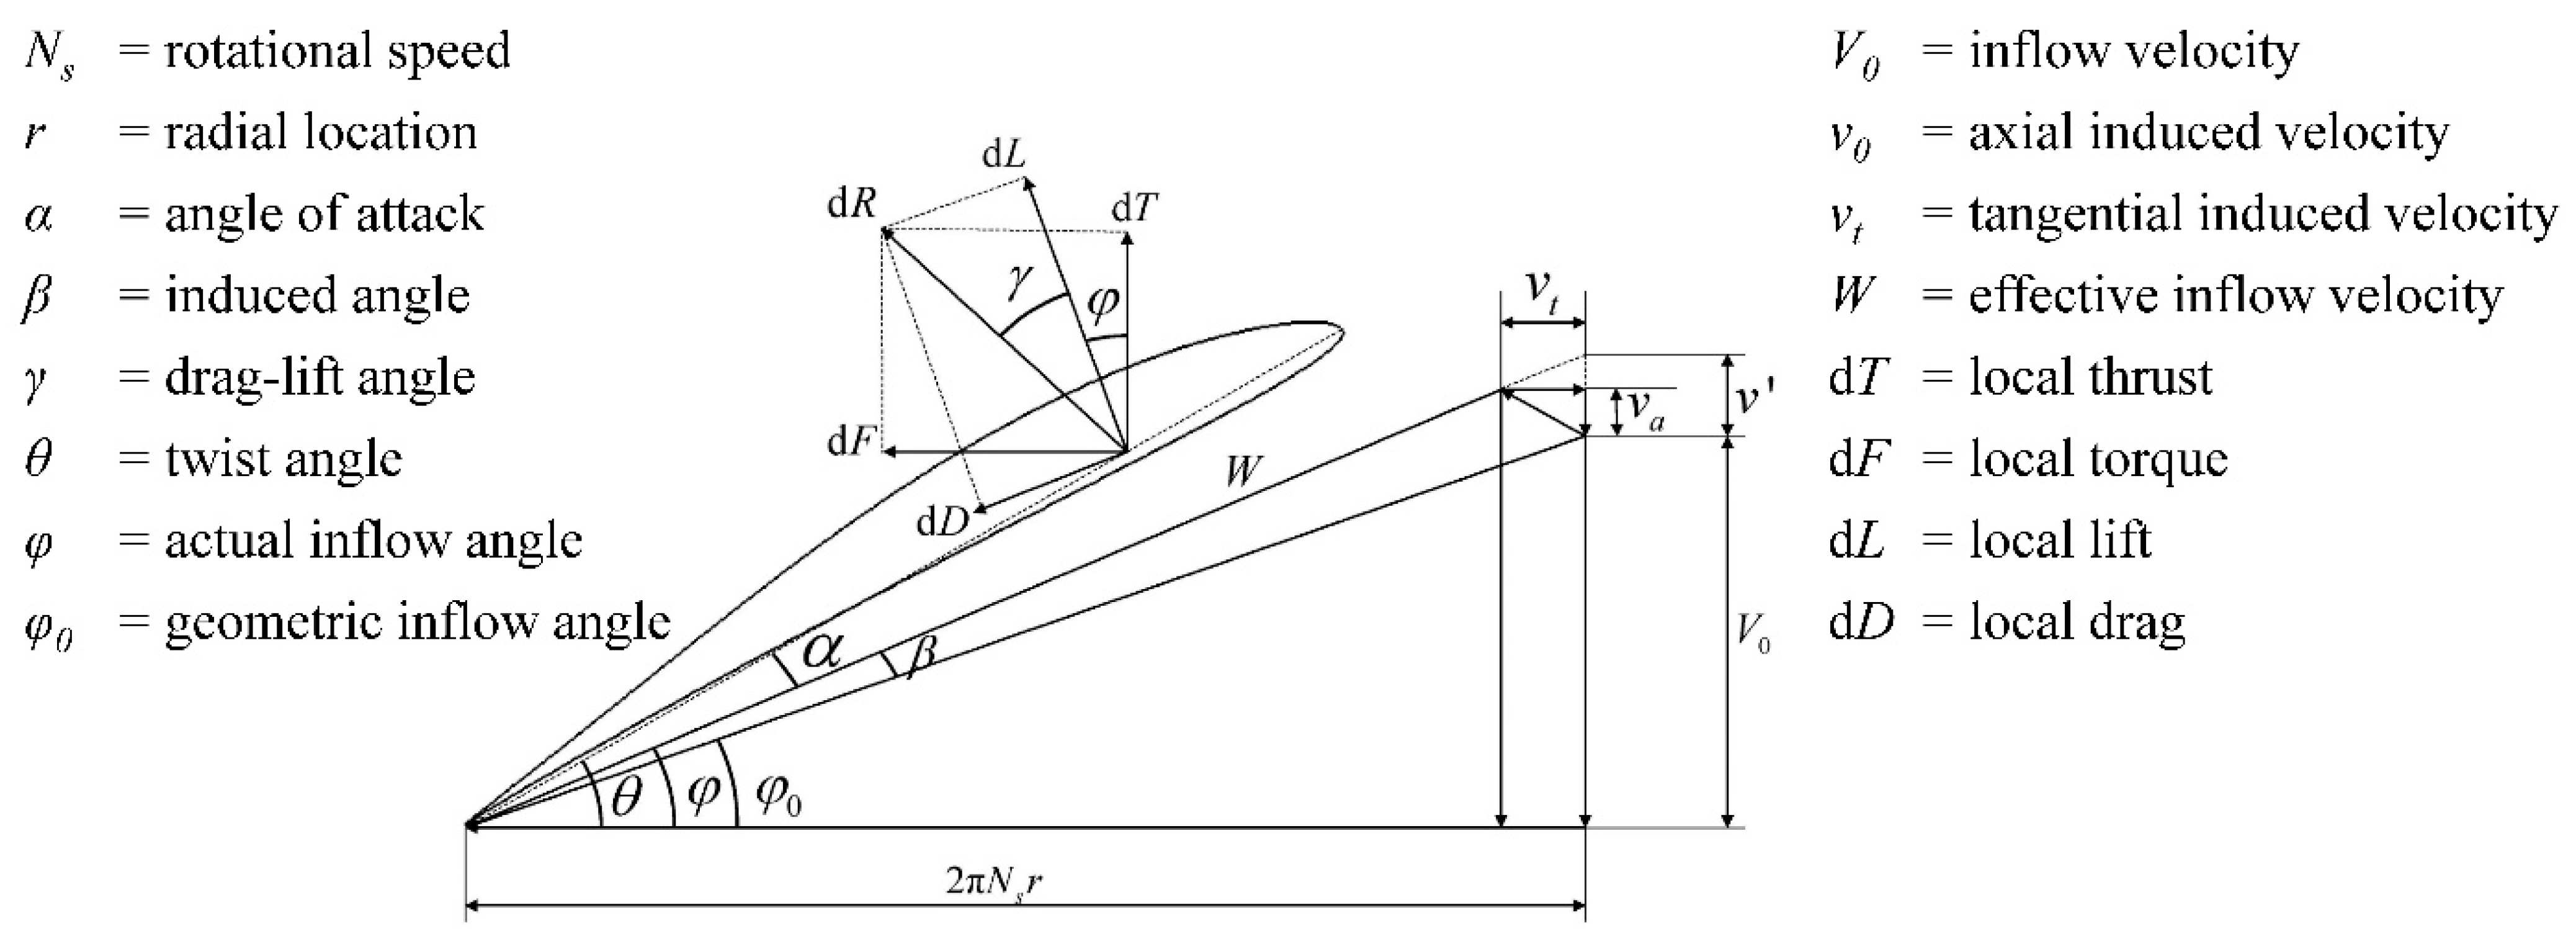
Figure 5 illustrates the aerodynamic model of an individual blade element. Based on the propeller diameter Dprop (one of the design variables in this research) and the required thrust (equivalent to the cruise drag of the SPUAV), the Betz condition provides a rapid design approach for the optimal propeller [25]. The Betz condition states that the optimal circulation distribution should satisfy a constant ratio of the energy loss due to circulation change in the blade element to the change in output power at any radius. The optimal circulation distribution for the propeller is determined as
Γ best = ( C ε 2 π N s r V 0 ) 4 π 2 r 2 N s / [ 1 + ( 2 π N s r V 0 ) 2 ]
where the constant C is determined by the required thrust, and ε is the drag–lift ratio of the blade element.
Additionally, the optimal chord length and twist angle distributions are determined as
{ C h o r d ( r ) = 2 Γ best ( r ) W ( r ) C l k max ( r ) θ ( r ) = φ 0 ( r ) + β ( r ) + α k max ( r )
where αkmax is the angle of attack with the maximum lift–drag ratio, and Cl-kmax is the corresponding lift coefficient.
After obtaining the optimal propeller geometry, its aerodynamic performance during the day–night mission cycle needs to be evaluated. The SPUAV undergoes the stages of horizontal cruising, climbing, gliding, and horizontal cruising over a day–night cycle. In this research, Blade Element Momentum Theory (BEMT) is employed to estimate the aerodynamic characteristics of the propeller during these different stages [26]. Under various operational conditions, the unknowns depicted in Figure 5 can be determined by solving the following nonlinear aerodynamic equilibrium equations:
{ d L cos φ d D sin φ = 2 A i ρ v a ( v a + V 0 ) d L sin φ + d D cos φ = 2 A i ρ v t ( v a + V 0 ) tan φ = ( V 0 + v a ) / ( 2 π N s r v t ) d L = f L ( c , α , W ) d D = f D ( c , α , W )
Then, the radial distribution functions of propeller thrust and torque can be determined as
{ d T = d L cos ( φ ) d D sin ( φ ) d M = [ d L sin ( φ ) + d D cos ( φ ) ] r
The macroscopic efficiency of the propeller can be expressed as
η prop = sum ( d T ) V 0 sum ( d M ) 2 π N s
Additionally, the SPUAV propeller mass estimation model proposed by Mascarenhas et al. is utilized to estimate the weight of different propeller configurations [27].
m prop = 0.495 ( D prop 1.25 ) 1.6 [ ln ( e 3 + e 5 P prop ,   max / 14914 ) 5 ] 2
Dprop is the propeller diameter, and Pprop, max is the maximum output power of the propeller.
(b)
Motor
We utilize a second-order DC electric motor model to predict the motor efficiency under various operating conditions [28]. As illustrated in Equation (11), the motor efficiency is primarily determined by the rotational speed NS and torque M.
{ U motor = ( 1 + τ motor N s ) N s K V + ( M K Q + I motor 0 ) R motor I motor = M K Q + I motor 0 η motor = M N s U motor I motor
In Equation (11), Umotor is the terminal voltage, τmotor is the torque lag time constant, KV is the speed constant, KQ is the torque constant, Imotor0 is the zero-torque current, Rmotor is the resistance, Imotor is the current, and ηmotor is the efficiency of the motor. This research benefits from a customized permanent magnet synchronous motor solution provided by the team from Harbin Institute of Technology. The technical specifications are described in reference [29], which provides the necessary motor parameters for the motor model.
In addition, we use the maximum continuous output power Pmotor, max and the power density constant ρmotor of the motor to estimate the motor mass:
m motor = P motor ,   max ρ motor

2.3.3. Lift–Drag Characteristics of the SPUAV under Propeller Slipstream Effects

To accurately assess the lift–drag characteristics of the SPUAV under various cruise speeds, cruise altitudes, and slipstream conditions, this research employs the three-dimensional Reynolds-averaged Navier–Stokes (RANS) equations as the principle governing equations for aerodynamic calculations, and the Shear Stress Transport (SST) turbulence model coupled with the γ-R transition model is utilized to simulate low Reynolds number flows [30,31,32,33]. The viscous terms are treated with second-order central difference. For the spatial discretization of the convection terms in the solution equations, a least square cell-based formulation is applied for the gradient calculation, second-order discretization schemes are applied for the pressure calculation, and second-order upwind schemes are chosen for the remaining quantities. Additionally, the Momentum Source Method (MSM) is implemented to consider the effects induced by the propeller slipstream [34]. The MSM operates by solving the momentum source terms through the radial distribution functions of propeller thrust and torque, then the impact of propeller thrust and torque on the momentum of fluid particles in space is simulated, which mainly manifests as acceleration along the axial direction of the propeller and additional rotational effects along the circumferential direction. Turbulent kinetic energy source terms are used to simulate the turbulence introduced by the propeller slipstream [35,36]. The accuracy of the above method is validated through the experimental data from reference [37]. This reference tested the downstream flow field of a hovering rotor and is widely used for the accuracy verification of MSM [34,38]. Figure 6 illustrates the computational domain and block-structured hexahedral meshes used for calculations, and Figure 7 depicts the dynamic pressure distribution at 0.104 times the radius downstream of the propeller. In the region near the rotation center, the interference from the rotor drive mechanism introduces some error, while, in most other areas, the numerical simulation results are in good agreement with the experimental data, validating the accuracy of the above method in simulating propeller slipstream effects.
However, the propeller undergoes different operating conditions throughout the day, and the optimal propeller varies for different SPUAV designs. It is infeasible to calculate all operating points solely based on CFD due to the associated high costs. Therefore, the DNN model is used for predicting the impacts of different propellers on the lift–drag characteristics of the SPUAV under various flight conditions. The specific process is outlined below.
Firstly, two fourth-order Class-Shape Transformation (CST) curves are used to fit the shape parameters of the propeller (chord length and twist angle distribution functions):
{ C h o r d ( r ¯ ) = c c 1 ( 1 r ¯ ) + c c 2 r ¯ ( 1 r ¯ ) 5 + 4 c c 3 r ¯ 2 ( 1 r ¯ ) 4 + 6 c c 4 r ¯ 3 ( 1 r ¯ ) 3 + 4 c c 5 r ¯ 4 ( 1 r ¯ ) 2 + c c 6 r ¯ 5 ( 1 r ¯ ) + c c 7 r ¯ θ ( r ¯ ) = c θ 1 ( 1 r ¯ ) + c θ 2 r ¯ ( 1 r ¯ ) 5 + 4 c θ 3 r ¯ 2 ( 1 r ¯ ) 4 + 6 c θ 4 r ¯ 3 ( 1 r ¯ ) 3 + 4 c θ 5 r ¯ 4 ( 1 r ¯ ) 2 + c θ 6 r ¯ 5 ( 1 r ¯ ) + c θ 7 r ¯
where r ¯ is the normalized radial coordinate, and r ¯ = 2 r / D prop .
The DNN model comprises 18 input variables (including the cruise speed V0, cruise altitude H, propeller diameter Dprop, rotational speed of propeller NS, and the 14 coefficients in Equation (13)), and 2 output variables (the lift L ¯ SPUAV and drag D ¯ SPUAV of the SPUAV under the effects of propeller slipstream). Additionally, setting the source terms to zero allows the evaluation of cruise lift LSPUAV and cruise drag DSPUAV in the absence of slipstream effects. We also construct the corresponding DNN model, where the inputs only include the cruise speed and altitude when the effects of propeller slipstream are not considered. The training process is illustrated in Figure 8.
In the design space, we utilize the Uniform Latin Hypercube (ULH) method to generate a series of points as the initial sample set [39]. For each sample point, the BEMT described in Section 2.3.2 is employed to estimate the thrust and torque distribution of the propeller. Subsequently, MSM is used to calculate the cruise lift and drag of the SPUAV under the effects of the propeller slipstream. The red wireframe outlined in Figure 8 represents the block-structured hexahedral meshes used for MSM.
The sample set is divided into k subsets, with one subset used as the validation set in each iteration, while the remaining subsets serve as the training set. This process yields k separate DNN models, and the final output is the average of the outputs from these k DNN models. The bottom right of Figure 8 illustrates the architecture of a DNN model. In each layer, data from the preceding layer are processed through weights and biases. Nonlinearity is introduced via activation functions, and the processed data are forward-propagated to the output layer. In the output layer, the error between the true values and predicted values is calculated through the loss function, which guides the further optimization of network parameters.
To ensure the stability of the generalization error, the DNN models are evaluated by the test set, which is also sampled from the design space in the same way. The size of the test set is significantly larger than the initial sample set, allowing for a thorough exploration of the design space. We use the previously obtained k DNN models to make predictions on the test set; that is, for a certain test sample point, there will be k predicted values Out1, Out2, …, Outk. The coefficient of variation C V = [ i = 1 k ( O u t i O u t ¯ ) 2 ] / ( k O u t ¯ 2 ) is used as the evaluation metric. A larger CV indicates a greater disparity in the predictions of the k DNN models for that point. The sample points with the largest CV are selected as a supplementary set, and the corresponding true values are calculated through CFD. Subsequently, we add the data contained in the supplementary set to the sample set and proceed with the next round of DNN training. This iterative process continues until the maximum relative error of the DNN model falls below 3%.

2.3.4. Day–Night Flight Strategy

In order to reduce energy consumption during nighttime flights, SPUAVs typically employ the strategy of gravity energy reservation. This strategy involves several stages throughout a day, including horizontal cruising, climbing, gliding, and horizontal cruising again. This section introduces the adopted flight strategy, which directly affects the energy input and output of the SPUAV over the course of a day.
(1) Horizontal cruising state: Starting from 0:00, the SPUAV initially operates in a low-altitude horizontal cruising state (in this research, the nighttime cruise altitude is specified as 16 km). During this stage, the electrical power consumption for the propulsion system is expressed as
P dcharge ,   propulsion = ( D ¯ SPUAV V 0 ) / ( η prop η motor η cable η dcharge )
where ηcable is the cable transmission efficiency, and ηdcharge is the discharge efficiency of the secondary battery.
(2) Climbing stage: As the sun rises, the solar radiation intensity gradually increases. When the power obtained from the PV cells exceeds the power required for horizontal cruising, the secondary battery disconnects from the energy communication, and the SPUAV relies on solar energy to begin climbing. During this period, the propeller thrust is decided by the output power of the motors, which, in turn, is directly determined by the solar radiation intensity. The output power of the motors can be expressed as
P motor = P PV η cable η motor
where PPV is the output power of the PV cells described in Equation (1), and ηmotor is the motor efficiency.
As the solar radiation intensity increases, the PV cells generate more power, leading to a higher output power from the motors and consequently increasing the thrust produced by the propellers. This increase in thrust enables the climb rate of the SPUAV to gradually increase from zero. The climb rate is given as
V climb = ( T prop D ¯ SPUAV ) V 0 / ( m SPUAV g )
This state continues until the motors reach their maximum output power Pmotor, max, which is determined by the motor overload factor kmotor (one of the design parameters in this research). Subsequently, the motor output power remains constant, and the SPUAV keeps climbing at the maximum climb rate. During this period, the excess solar energy is used for charging the secondary batteries, as stated in Equation (18).
P motor ,   max = P motor ,   night k motor
P charge = ( P PV η cable P motor ,   max / η motor ) η charge
where Pmotor, night is the output power of motors in the horizontal cruising stage at night (equal to the rated output power of motors), Pcharge is the charging power of the secondary battery, and ηcharge is the charging efficiency.
(3) Powered gliding stage: In the afternoon, the solar radiation intensity begins to decrease. When the energy generated by the PV cells is insufficient to sustain the climb, the secondary battery stops charging. All available solar energy is then directed to the propulsion system, and the SPUAV turns into the powered gliding stage. During this phase, the motor output power and gliding rate of the SPUAV follow the same relationships as given in Equations (15) and (16).
(4) Unpowered gliding stage: When the solar radiation intensity drops to 0, the SPUAV transitions into the unpowered gliding stage.
(5) Horizontal cruising state: After gliding to an altitude of 16 km, the SPUAV re-enters the horizontal cruising stage.
In addition, the payload directly draws energy from the secondary battery throughout the day, and the resulting electrical power consumption can be expressed as
P dcharge ,   payload = P payload / ( η DC η cable η dcharge )
where Ppayload is the power of the payload, and ηDC is the efficiency of the DC/DC voltage conversion module.

2.4. Optimal Design Framework

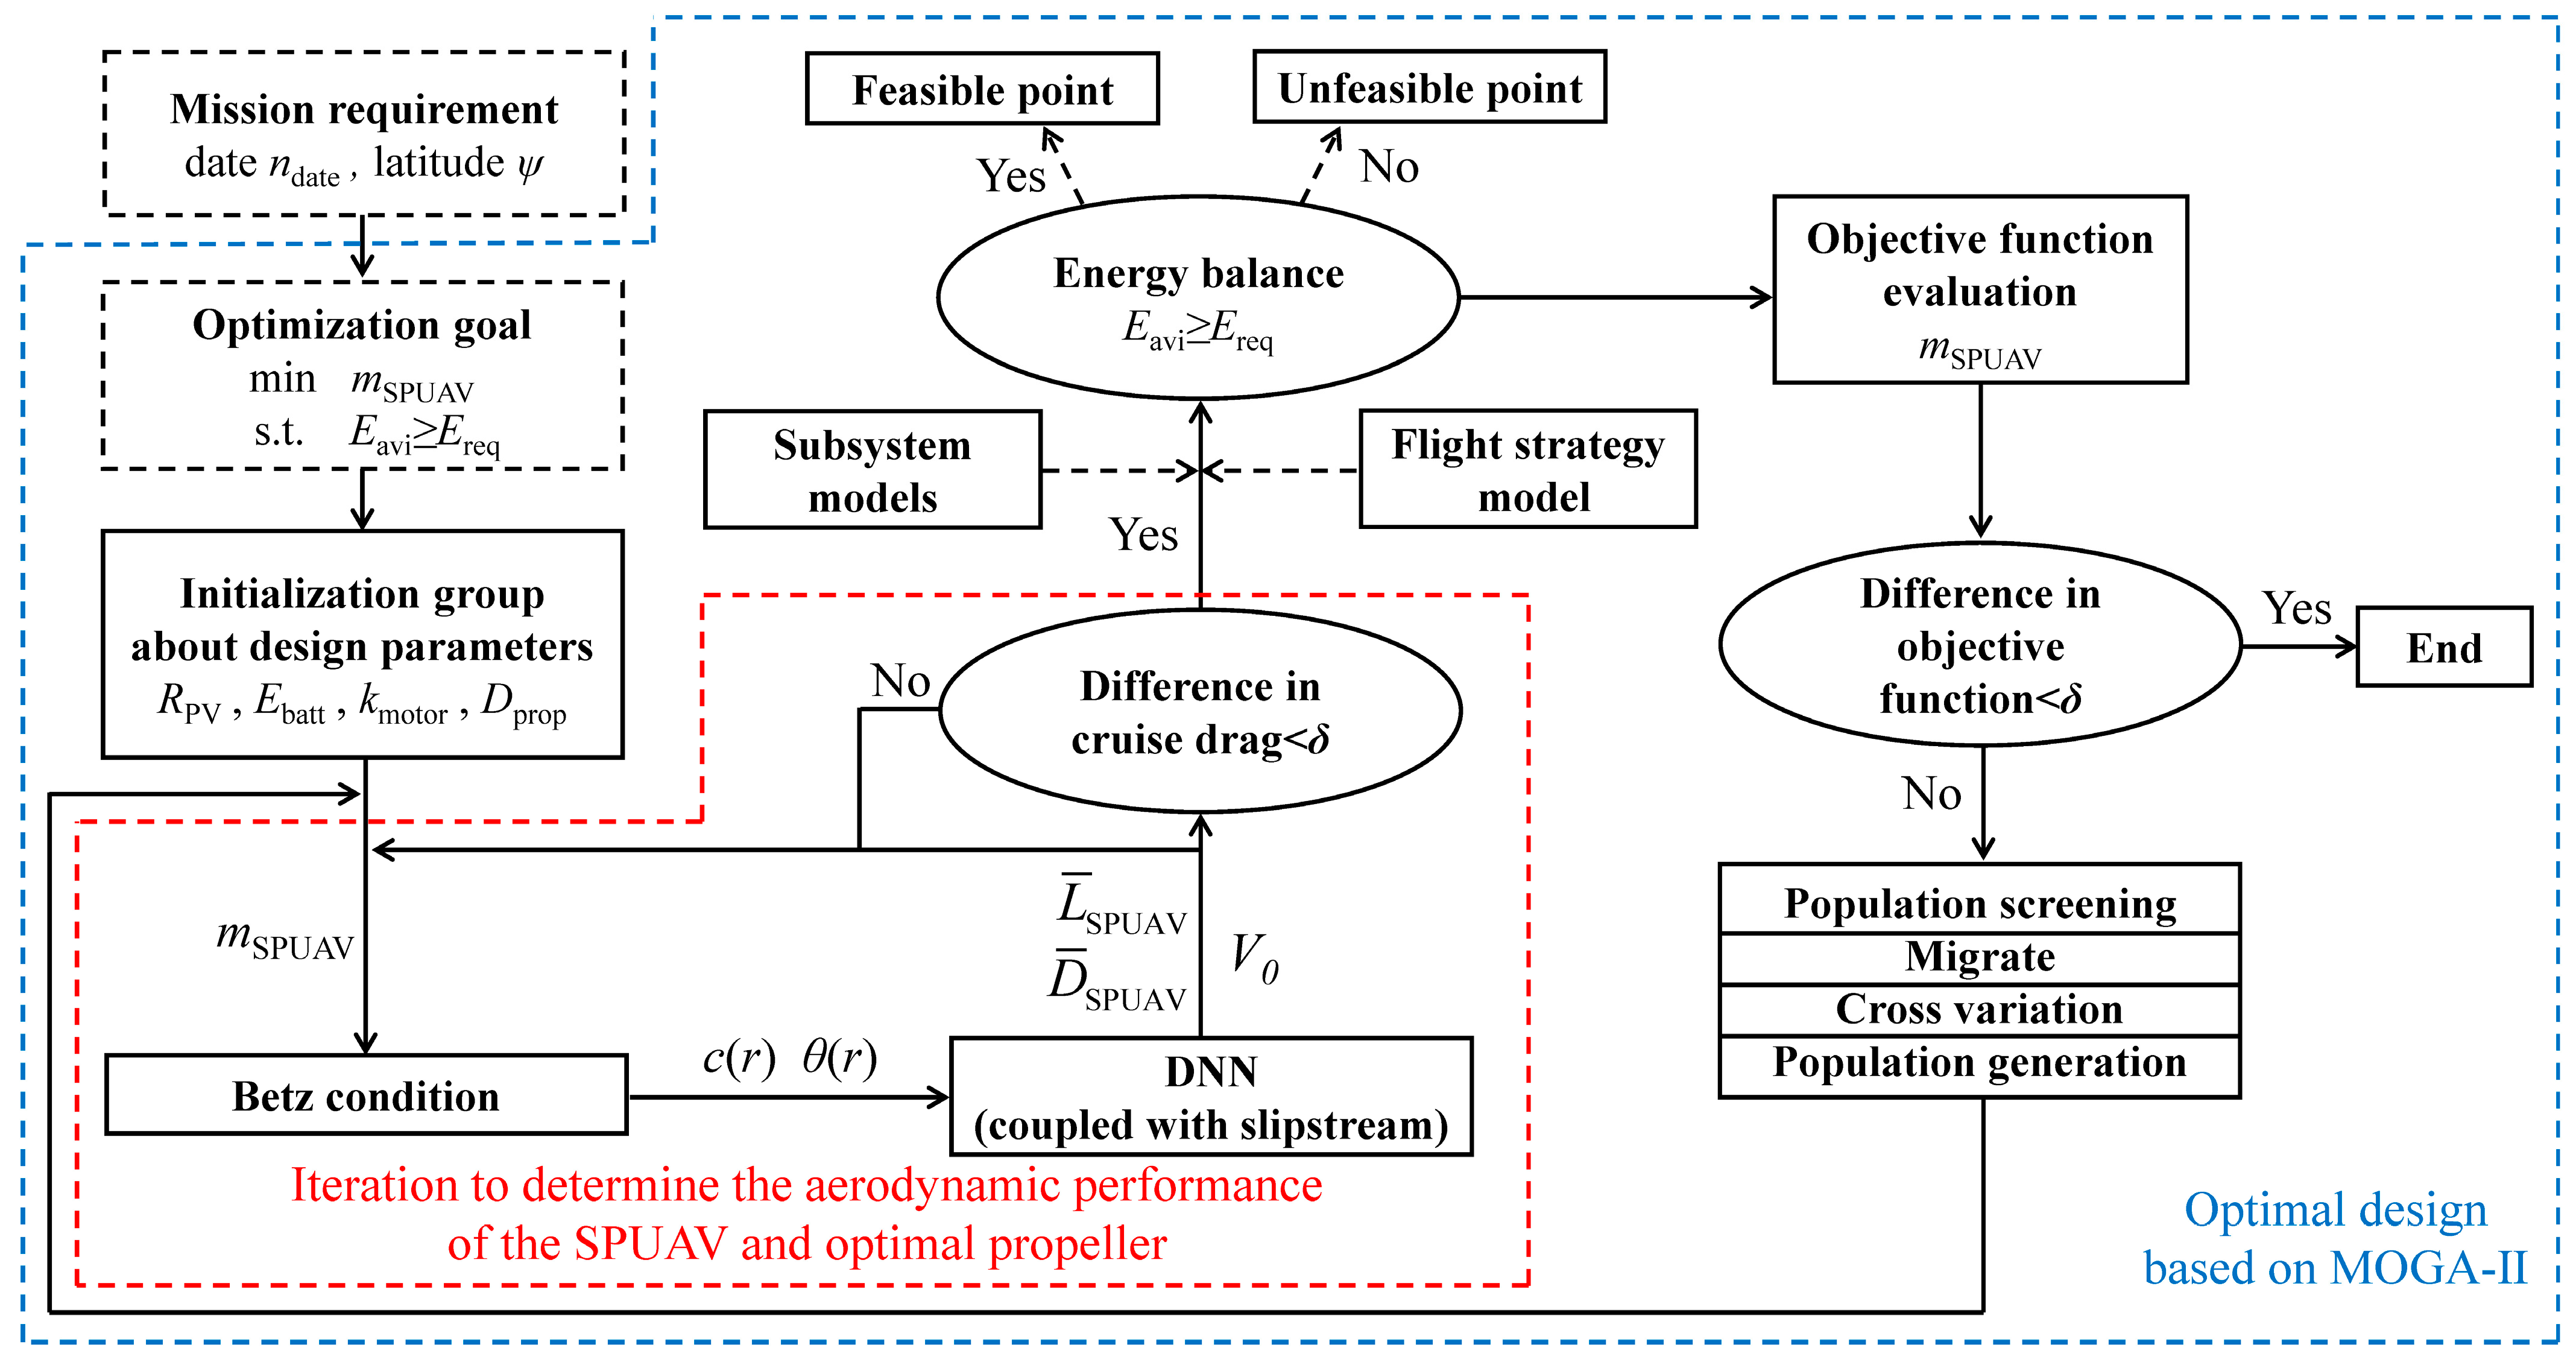
Expanding on Figure 2, Figure 9 illustrates a more detailed framework for the optimal design. Under specific mission requirements (flight date and latitude), the corresponding optimal design scheme is identified through the following steps:
  • Step 1: The design space is sampled to form the initial population based on the Uniform Latin Hypercube method.
  • Step 2: Since the required propeller thrust is determined by the cruise drag of the SPUAV, the lift–drag characteristics are, in turn, impacted by the propeller slipstream. The coupling between these two factors necessitates iterative solutions for each sample point in the optimization design process. This forms a sub-iteration process. We start with the cruise drag of the SPUAV. In the first iteration, since the propeller slipstream pattern is initially undetermined, the DNN model for the case without propeller slipstream, as described in Section 2.3.3, is used to preliminarily estimate the lift–drag characteristics of the SPUAV. After obtaining the required thrust, we use the Betz condition described in Section 2.3.2 to determine the optimal propeller. Subsequently, the DNN model considering propeller slipstream effects is employed to determine the actual lift–drag characteristics of the SPUAV under slipstream effects. The total weight, cruise speed, and required thrust of the SPUAV are then reevaluated, and these updated inputs are used in the Betz condition to start the next iteration. The above process is repeated until convergence is achieved. We use the change in cruise drag as the convergence criterion. When the change in cruise drag is less than 0.1 N, convergence is considered to have been reached. According to our experience, this typically requires three to four iterations.
  • Step 3: In combination with the subsystem models and flight strategy model described in Section 2.3, the time-varying state parameters of the SPUAV throughout a day can be derived. Specifically, these include the lift–drag characteristics of the SPUAV, flight speed, altitude, climb/glide rate, propulsion system efficiency, and battery level at each moment. Through these time-varying state parameters, the flight path and energy spectrum of the SPUAV throughout a day can be constructed. If the energy consumed by the SPUAV throughout a day is less than the solar energy that can be acquired during the same timeframe, it indicates that the SPUAV can realize day–night closed-loop flight. Conversely, energy consumption exceeding the solar energy acquisition signals the infeasibility of the design scheme.
  • Step 4: Based on the preceding steps, we utilize the genetic algorithm MOGA-II for the optimization of the SPUAV [40]. The optimization objective is to minimize the overall weight of the SPUAV, ultimately yielding the optimal design scheme capable of closed-loop flight under specific mission requirements. MOGA-II is a robust evolutionary optimization technique. The main steps of this optimization technique include initialization, evaluation, selection, crossover, mutation, replacement, and iteration. In this study, the probability of directional crossover, selection, mutation, and DNA string mutation ratio are specified as 0.5, 0.05, 0.1, and 0.05, respectively. Additionally, for the genetic algorithm optimization process, the algorithm terminates when the change in the best objective function value falls below 0.1 kg over 20 consecutive generations.
In addition, to ensure the practicality of the design results, a further constraint is incorporated. Zhang et al. compiled data on the wing loads of 12 successful SPUAVs, ranging from 2.4 to 6.3 kg/m2 [41]. Deviating from this range typically indicates either too low a cruise speed (resulting in poor wind resistance) or excessive total weight (leading to high energy consumption), both of which elevate the risk associated with the design. In this research, this constraint limits the variation range in the total weight of the SPUAV.

3. Case Study

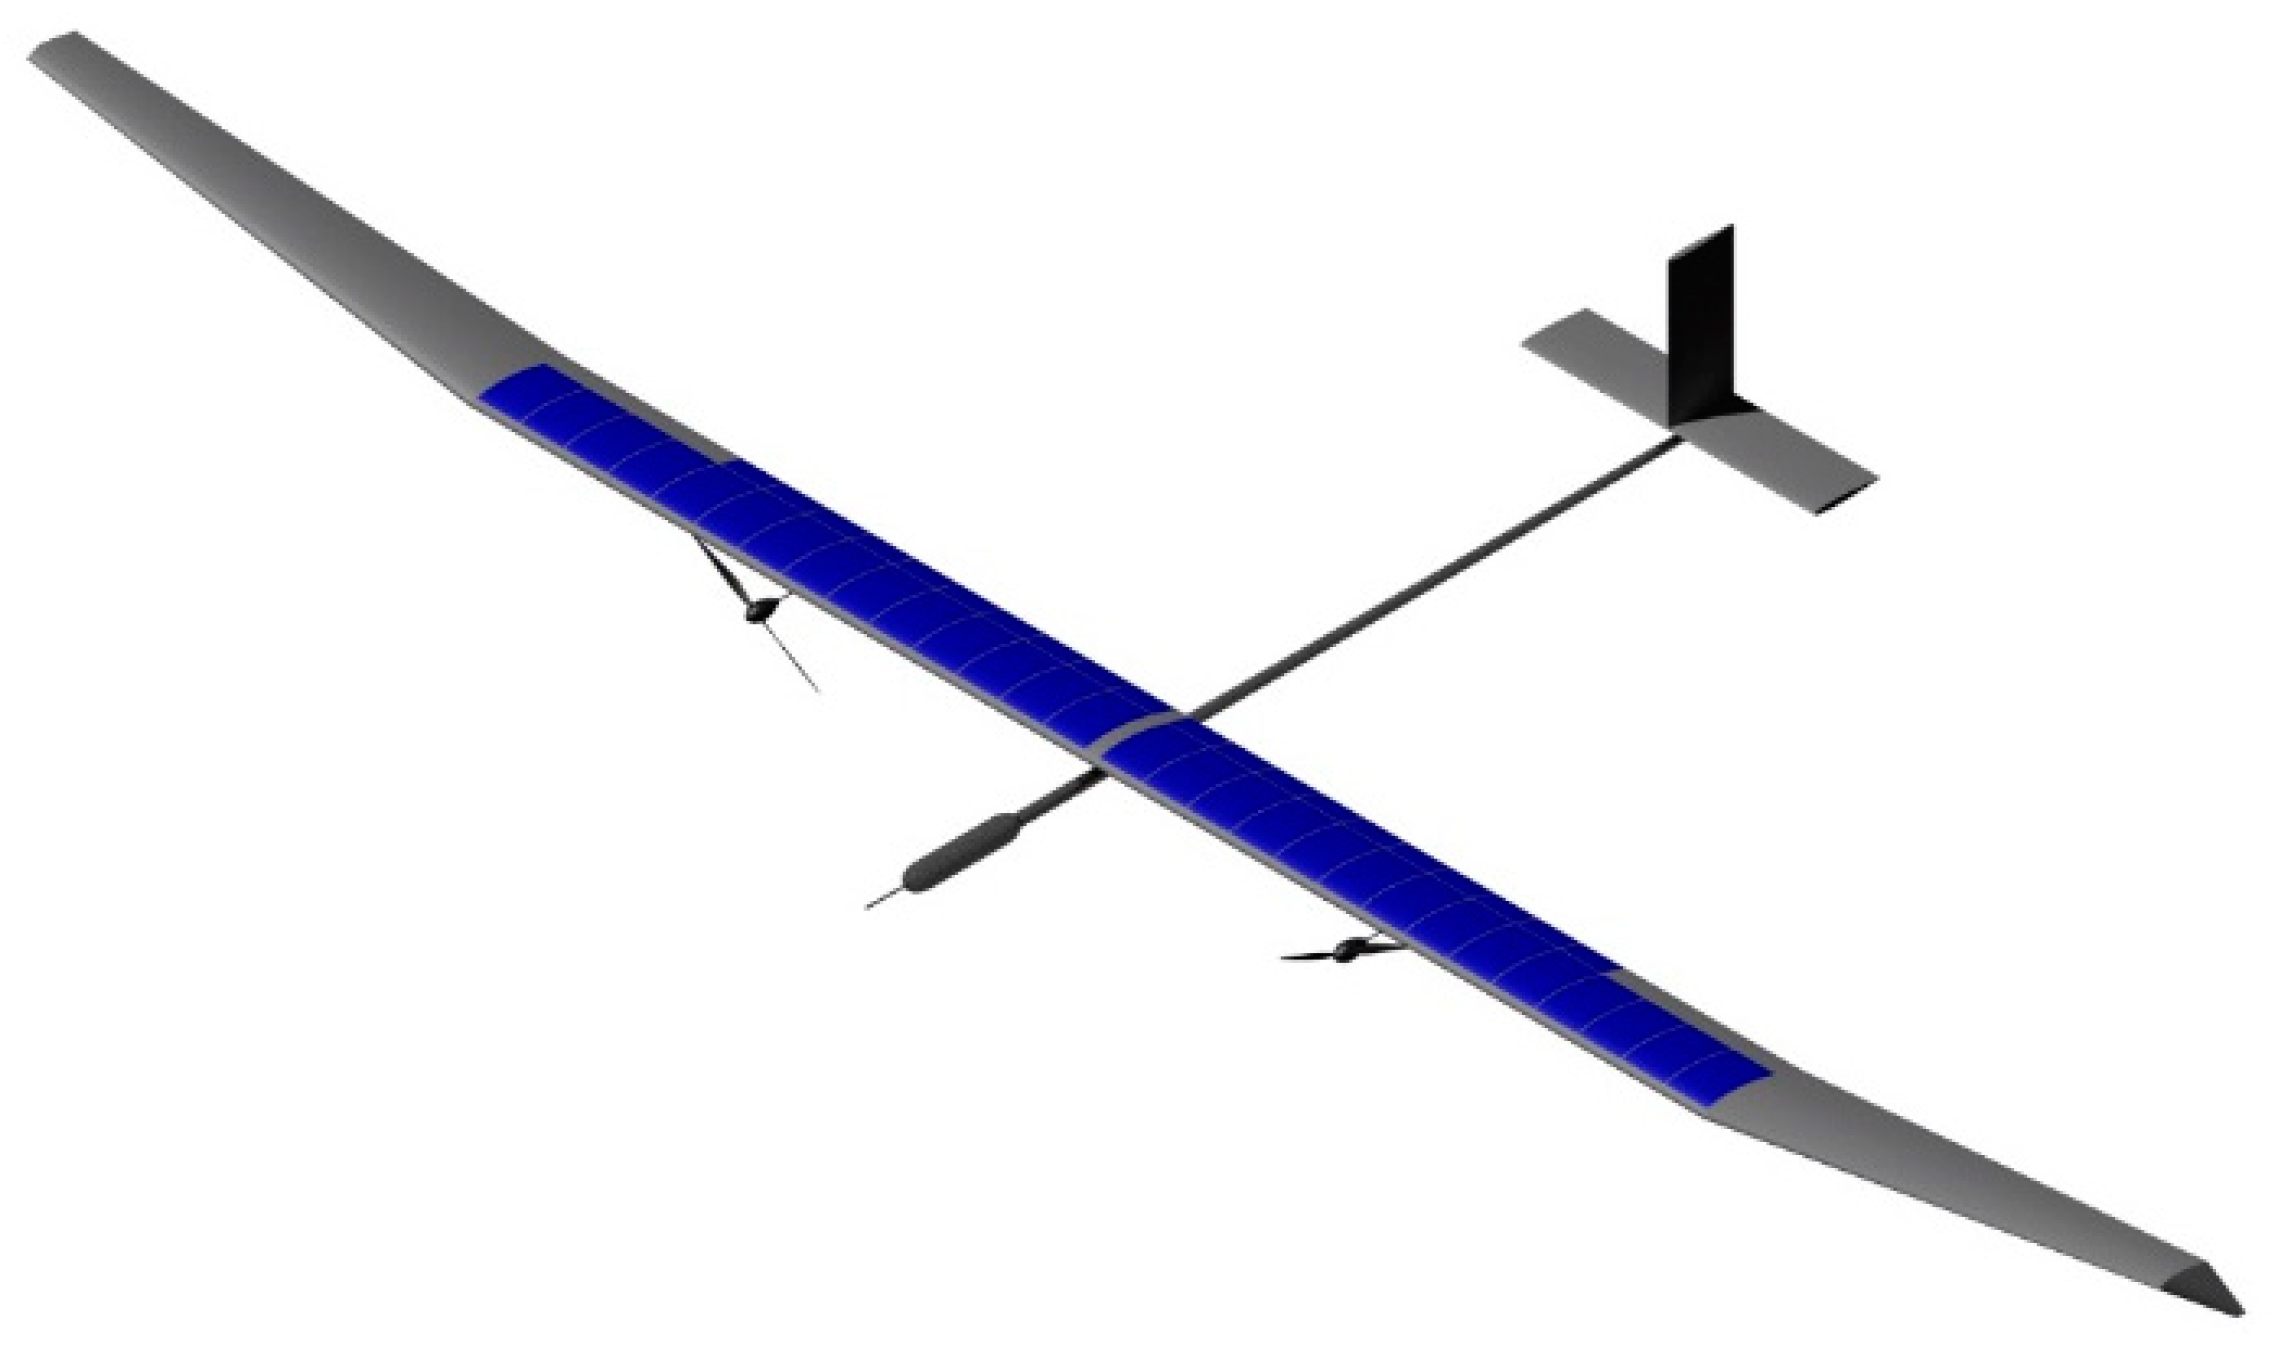
This research is centered on a SPUAV with a wingspan of 30 m and a wing area of 34.35 m2, as depicted in Figure 10. The initial goal is to achieve uninterrupted flight at 30° N latitude, carrying an infrared detection device with a weight of 5 kg and a power of 150 W. Table 1 shows the aerodynamic parameters of the SPUAV and the electrical properties of the cells.

3.1. DNN Model

As delineated in Section 2.3.3, the DNN model is constructed through the adaptive sequential sampling method based on k-fold cross-validation, aiming to obtain the lift–drag characteristics of the SPUAV under various flight conditions within a day. During each round of DNN model training, the cruise speed, cruise altitude, propeller diameter, and propeller rotational speed, as well as the chord length and twist angle distribution functions of the propeller, serve as the inputs of the DNN model, then the cruise lift and drag of the SPUAV are output from the network. Throughout a day’s flight trajectory of the SPUAV, it experiences various flight conditions, such as different altitudes, speeds, and propeller rotational speeds. The DNN model enables the prediction of aerodynamic characteristics for all these states along the trajectory. On the other hand, the trajectory is, to some extent, influenced by the output of the DNN model, as the model predicts the lift and drag under various flight conditions. These aerodynamic forces directly affect the climb rate, cruise speed, and descent rate, thereby influencing the trajectory.
The DNN model features four hidden layers with neuron counts of 120, 60, 30, and 15, respectively, from the first to the fourth layer. The hidden layers utilize the ReLU activation function, defined as f(x) = max (0, x). During the training, Bayesian Regularization is implemented to manage overfitting, and the Levenberg–Marquardt algorithm is employed to adjust the weights and biases to minimize the loss function [42].
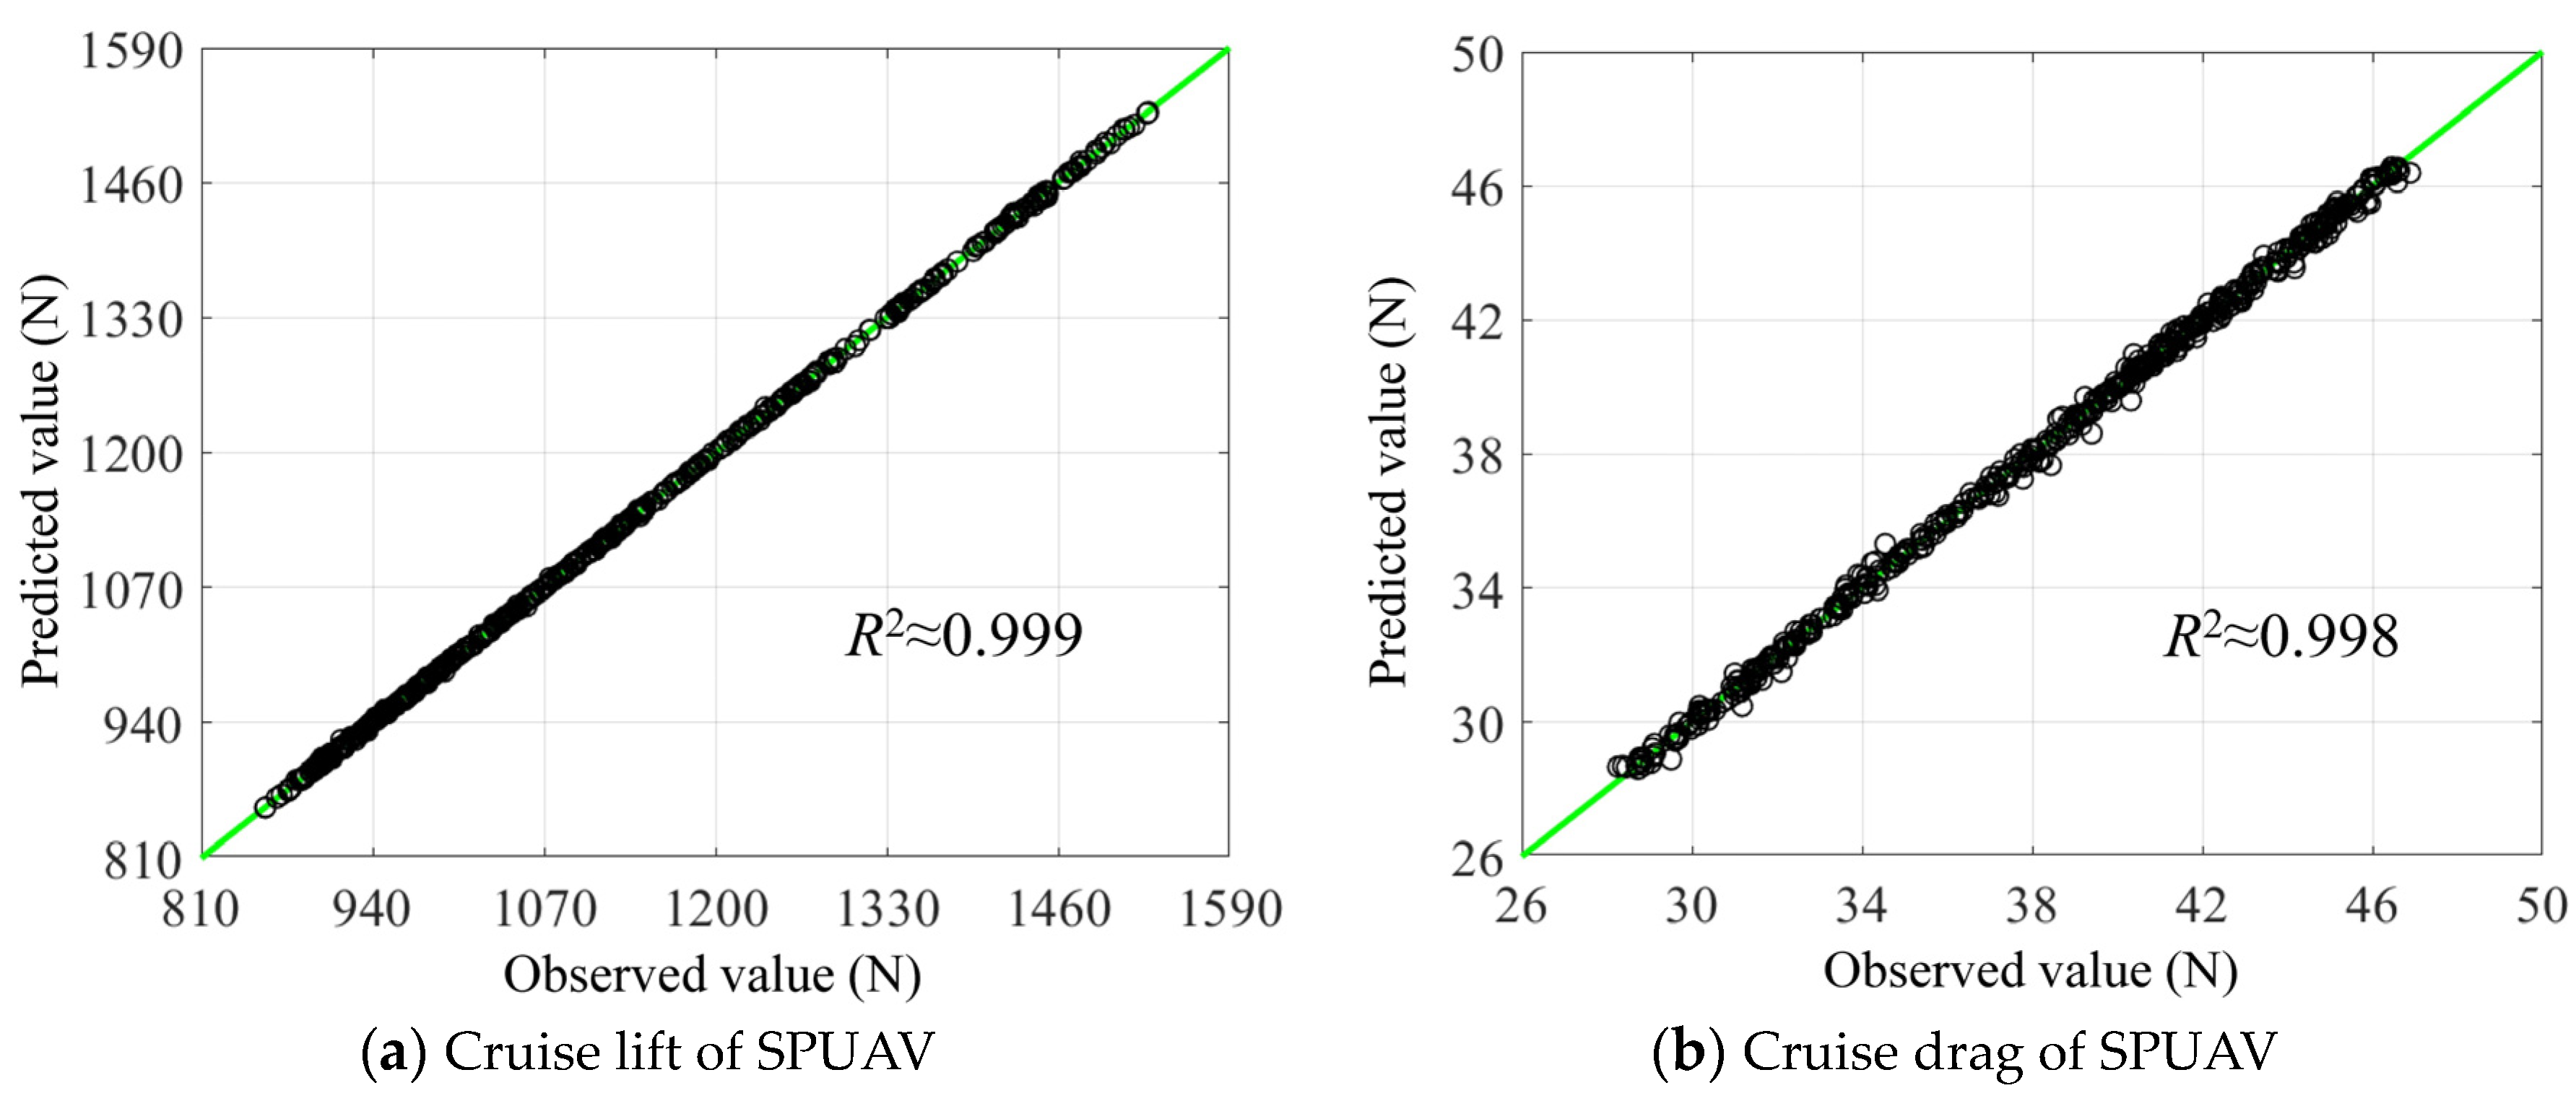
The initial sample set consists of 200 samples. In each adaptive sequential sampling step, the method based on k-fold cross-validation (with k set to five in this research) is used to select 100 samples from the test set containing 10,000 samples as a supplementary set. These 100 samples, once their true values have been computed via CFD, are incorporated into the sample set for subsequent training rounds. After three rounds of adaptive sampling based on the initial sample set, the DNN model attains a satisfactory level of accuracy. In Figure 11, regression lines demonstrate the agreement between the predicted values of the final DNN model and the observed values from CFD.
The propeller slipstream affects lift predominantly through the acceleration of airflow. While the drag of SPUAV is influenced by a range of factors, such as the configuration of spanwise secondary flow and the scale of laminar separation bubbles, which have complex potential connections with the propeller slipstream. Therefore, the prediction accuracy for lift is relatively higher than that for drag.
Taking the cruise drag as an example, Figure 12 presents the distribution of the absolute percentage error (APE) for each adaptive sampling round through violin plots. In this figure, the vertical axis represents the APE of the DNN model, while the horizontal axis indicates the proportion of the corresponding error level. The internal black boxplots denote the interquartile range (25~75%), and the white dots indicate the median APE values. It can be observed that the accuracy of DNN model progressively enhances with each round of adaptive sequential sampling. In the last round, the median APE of the DNN model drops to 0.27%, and the maximum APE is 2.25%. Overall, the precision requirements for the optimization design have been met.
In this study, the DNN algorithm is executed offline, and the relevant work was conducted on a computing workstation equipped with an AMD EPYC 7532 processor (64 cores, 128 threads) and 256 GB of RAM.

3.2. Optimal Design and Analysis

Utilizing the optimization design framework described in Section 2.4, the SPUAV undergoes optimization with design parameters that include the PV coverage rate, secondary battery capacity, motor overload factor, and propeller diameter. The ranges for these design variables are as follows: the PV coverage rate varies from 10% to 80%, the secondary battery capacity varies from 5000 Wh to 35,000 Wh, the motor overload factor varies from 2 to 3, and the propeller diameter varies from 1 m to 2 m. Among them, the PV coverage rate is capped at 80%, because it is challenging to lay PV cells on some certain areas, such as control surfaces and the leading edge of the wing. The lower limit for the motor overload factor is set as 2 to ensure sufficient power redundancy for differential turning or to cope with the scenario of a single-engine failure.
As a comparison, we also perform optimization design using the traditional design method, which does not consider the propeller slipstream effects on the lift–drag characteristics of the SPUAV. By comparing the design results of these two methods, the differences can be visually reflected.

3.2.1. Optimal Design at a Single Mission Point

Taking 16 April at 30° N latitude as an example (according to our calculations, this day is located at the boundary of the feasible mission region at 30° N latitude), two methods are employed to optimize the parameters of the SPUAV, and the results are summarized in Table 2.
From Table 2, it can be observed that the traditional method yields a relatively larger propeller diameter. This discrepancy can be analyzed from an energy consumption perspective. For the SPUAV, the optimal solutions lead to the lowest overall energy consumption. The reduction in energy consumption can effectively decrease the demand for secondary battery capacity, thereby lowering the total weight of the SPUAV, which is particularly significant during nighttime flights when the SPUAV relies entirely on the secondary battery. The input power required for the propulsion system can be expressed as
P propulsion = P cruise η prop η motor = D SPUAV V 0 η prop η motor
where Ppropulsion is the input power for the propulsion system, Pcruise is the required power for cruising, ηprop is the propeller efficiency, and ηmotor is the motor efficiency.
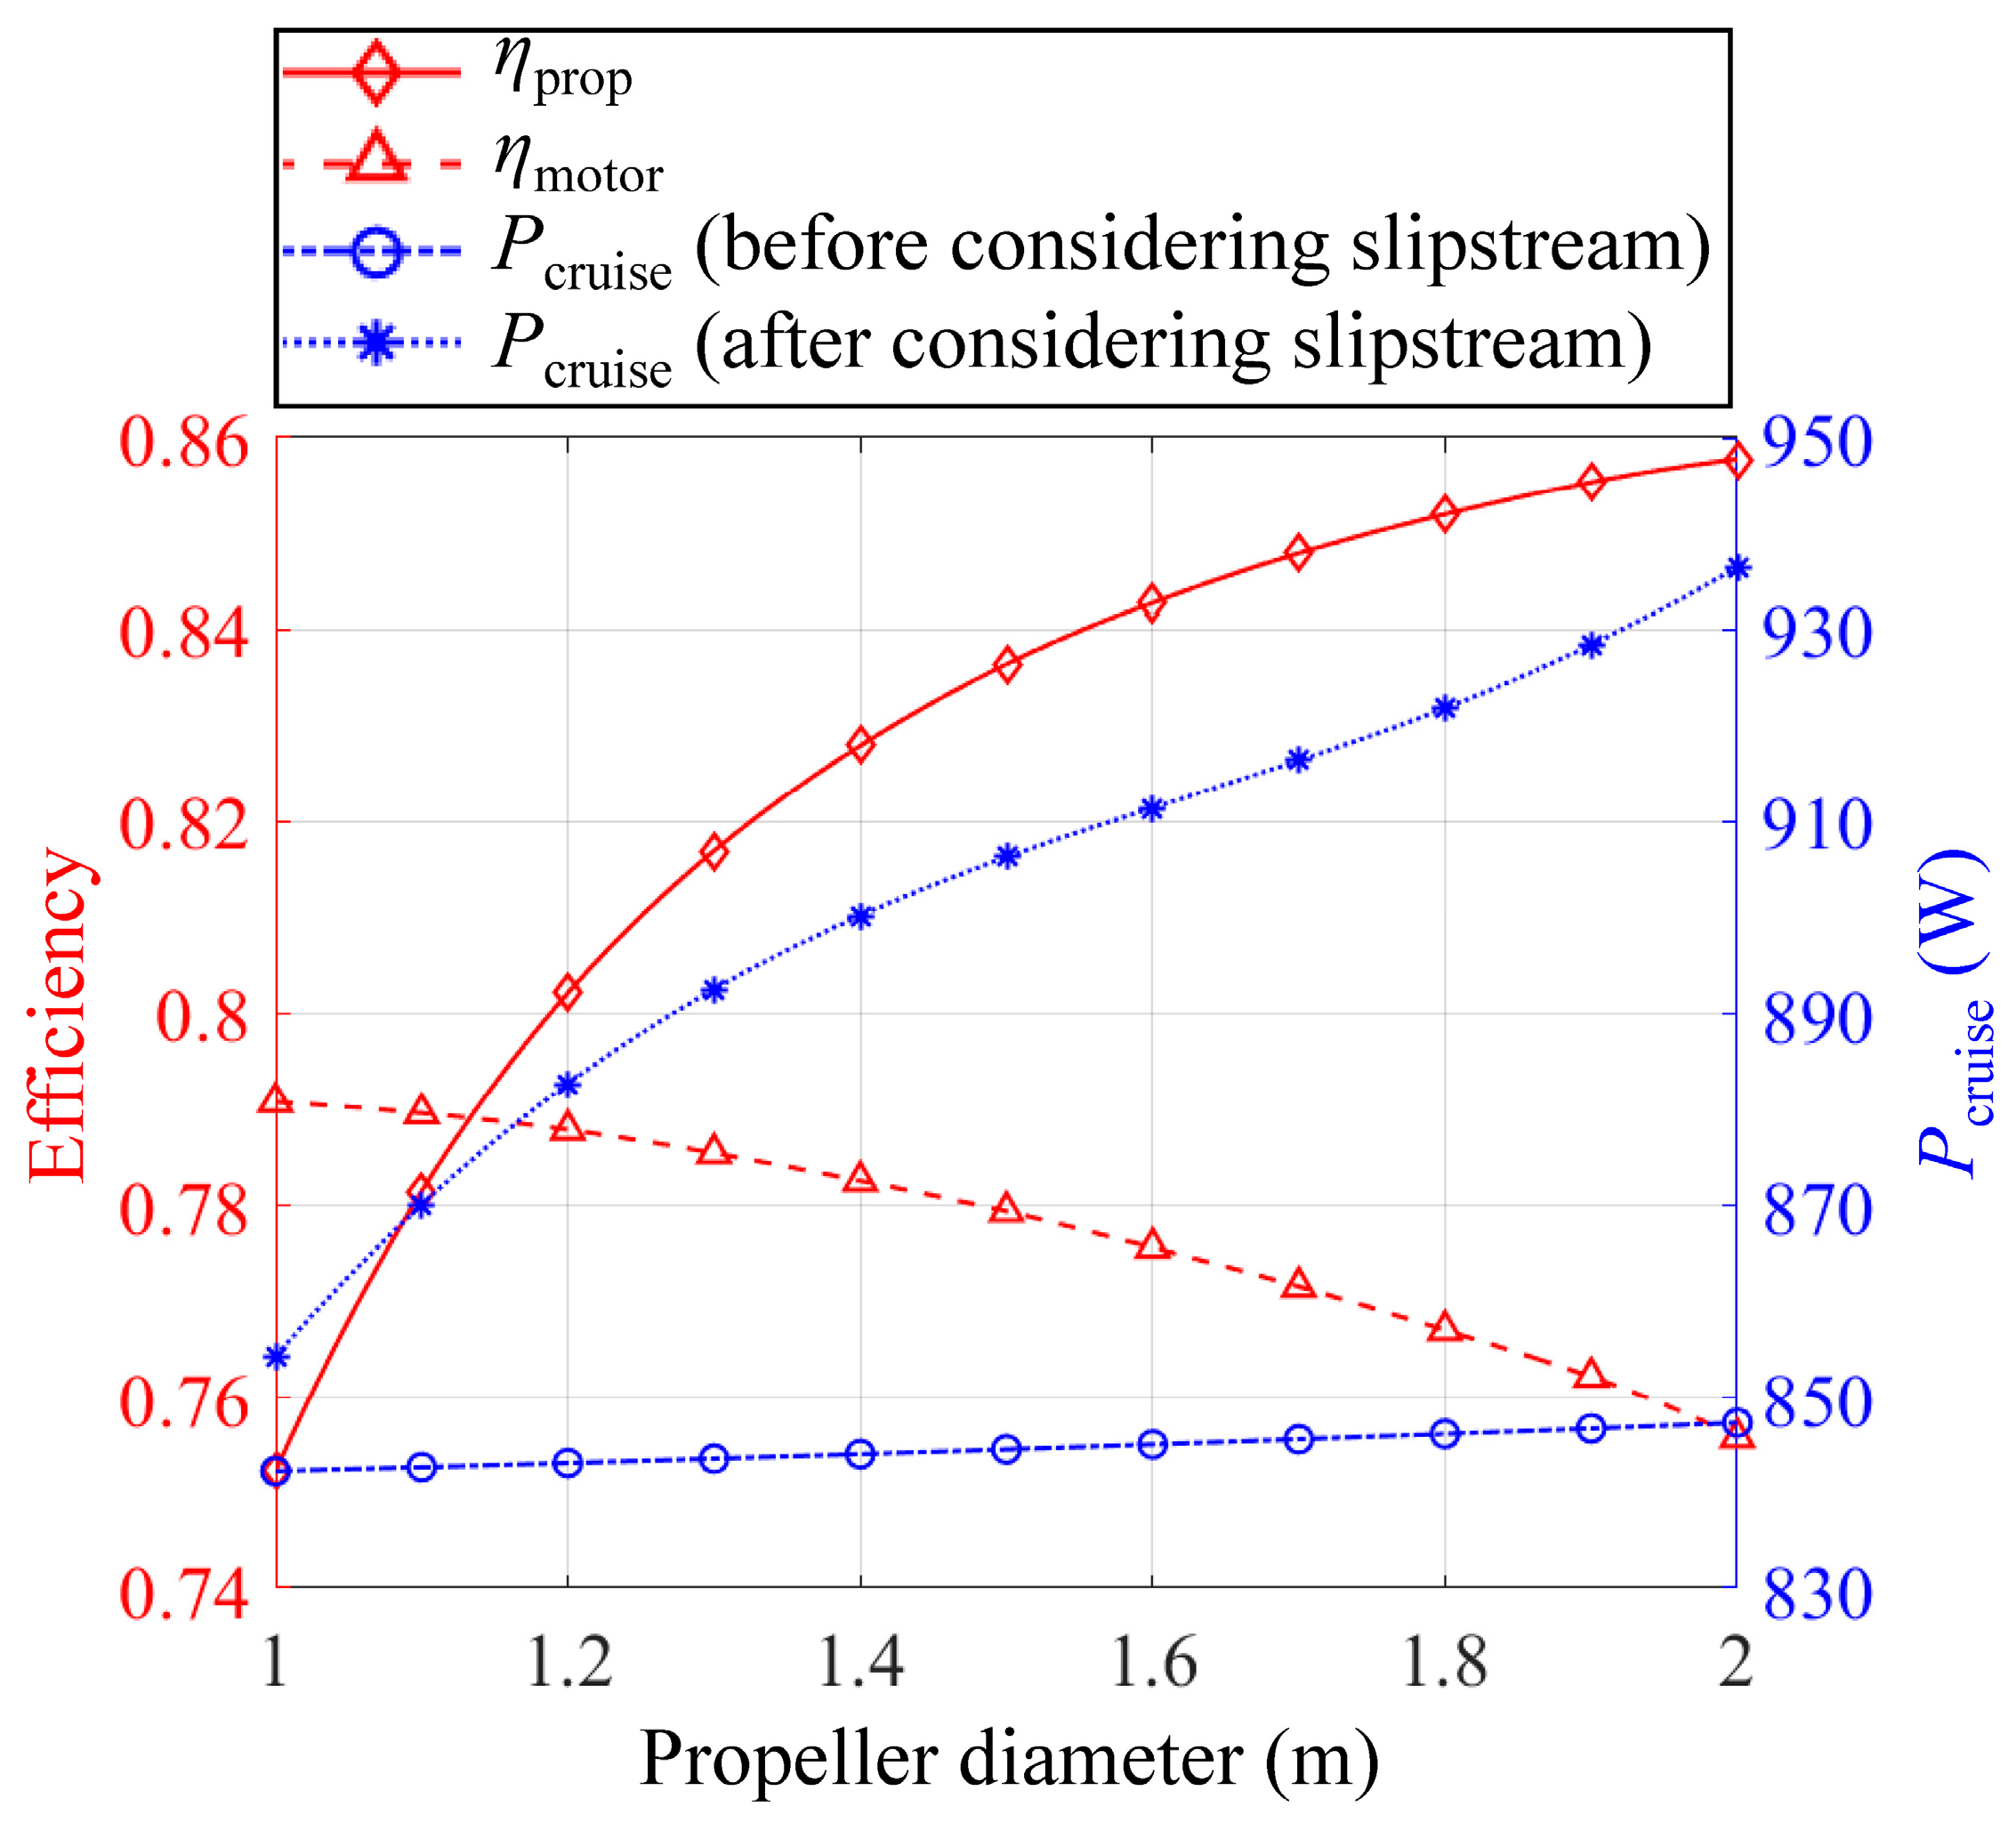
Taking the design result of the traditional method in Table 2 as an example, Figure 13 compares the ηprop, ηmotor, and Pcruise when different propeller diameters are configured. These parameters exhibit the following patterns with respect to the propeller diameter:
(a)
As the propeller diameter increases, the propeller efficiency also improves, which can be explained through the actuator disk theory. In this idealized model, a circular disk is used to represent the action of the propeller. Combining the momentum and mass conservation equations, the propeller efficiency can be expressed as
η prop = 2 / ( 1 + 8 T prop π ρ V 0 2 D prop 2 + 1 )
where Tprop is the thrust of the propeller, V0 is the cruise speed of the SPUAV, and Dprop is the propeller diameter. Equation (21) elucidates a positive correlation between propeller efficiency and diameter. From a physical standpoint, in the case of generating the same thrust, the propeller with a larger diameter propels a greater mass of air, resulting in a reduction in the induced velocity, which serves to diminish the induced losses during the operational phase of the propeller.
(b)
The propeller with a larger diameter corresponds to a relatively lower rotational speed and higher torque. This results in an increased operational current and internal resistance losses, leading to a decline in the motor efficiency [27].
(c)
When the effects of the propeller slipstream are not considered, the required cruising power Pcruise increases slightly with the increase in propeller diameter, primarily due to the added weight of the larger propeller. However, after considering the propeller slipstream, Pcruise shows more pronounced changes.
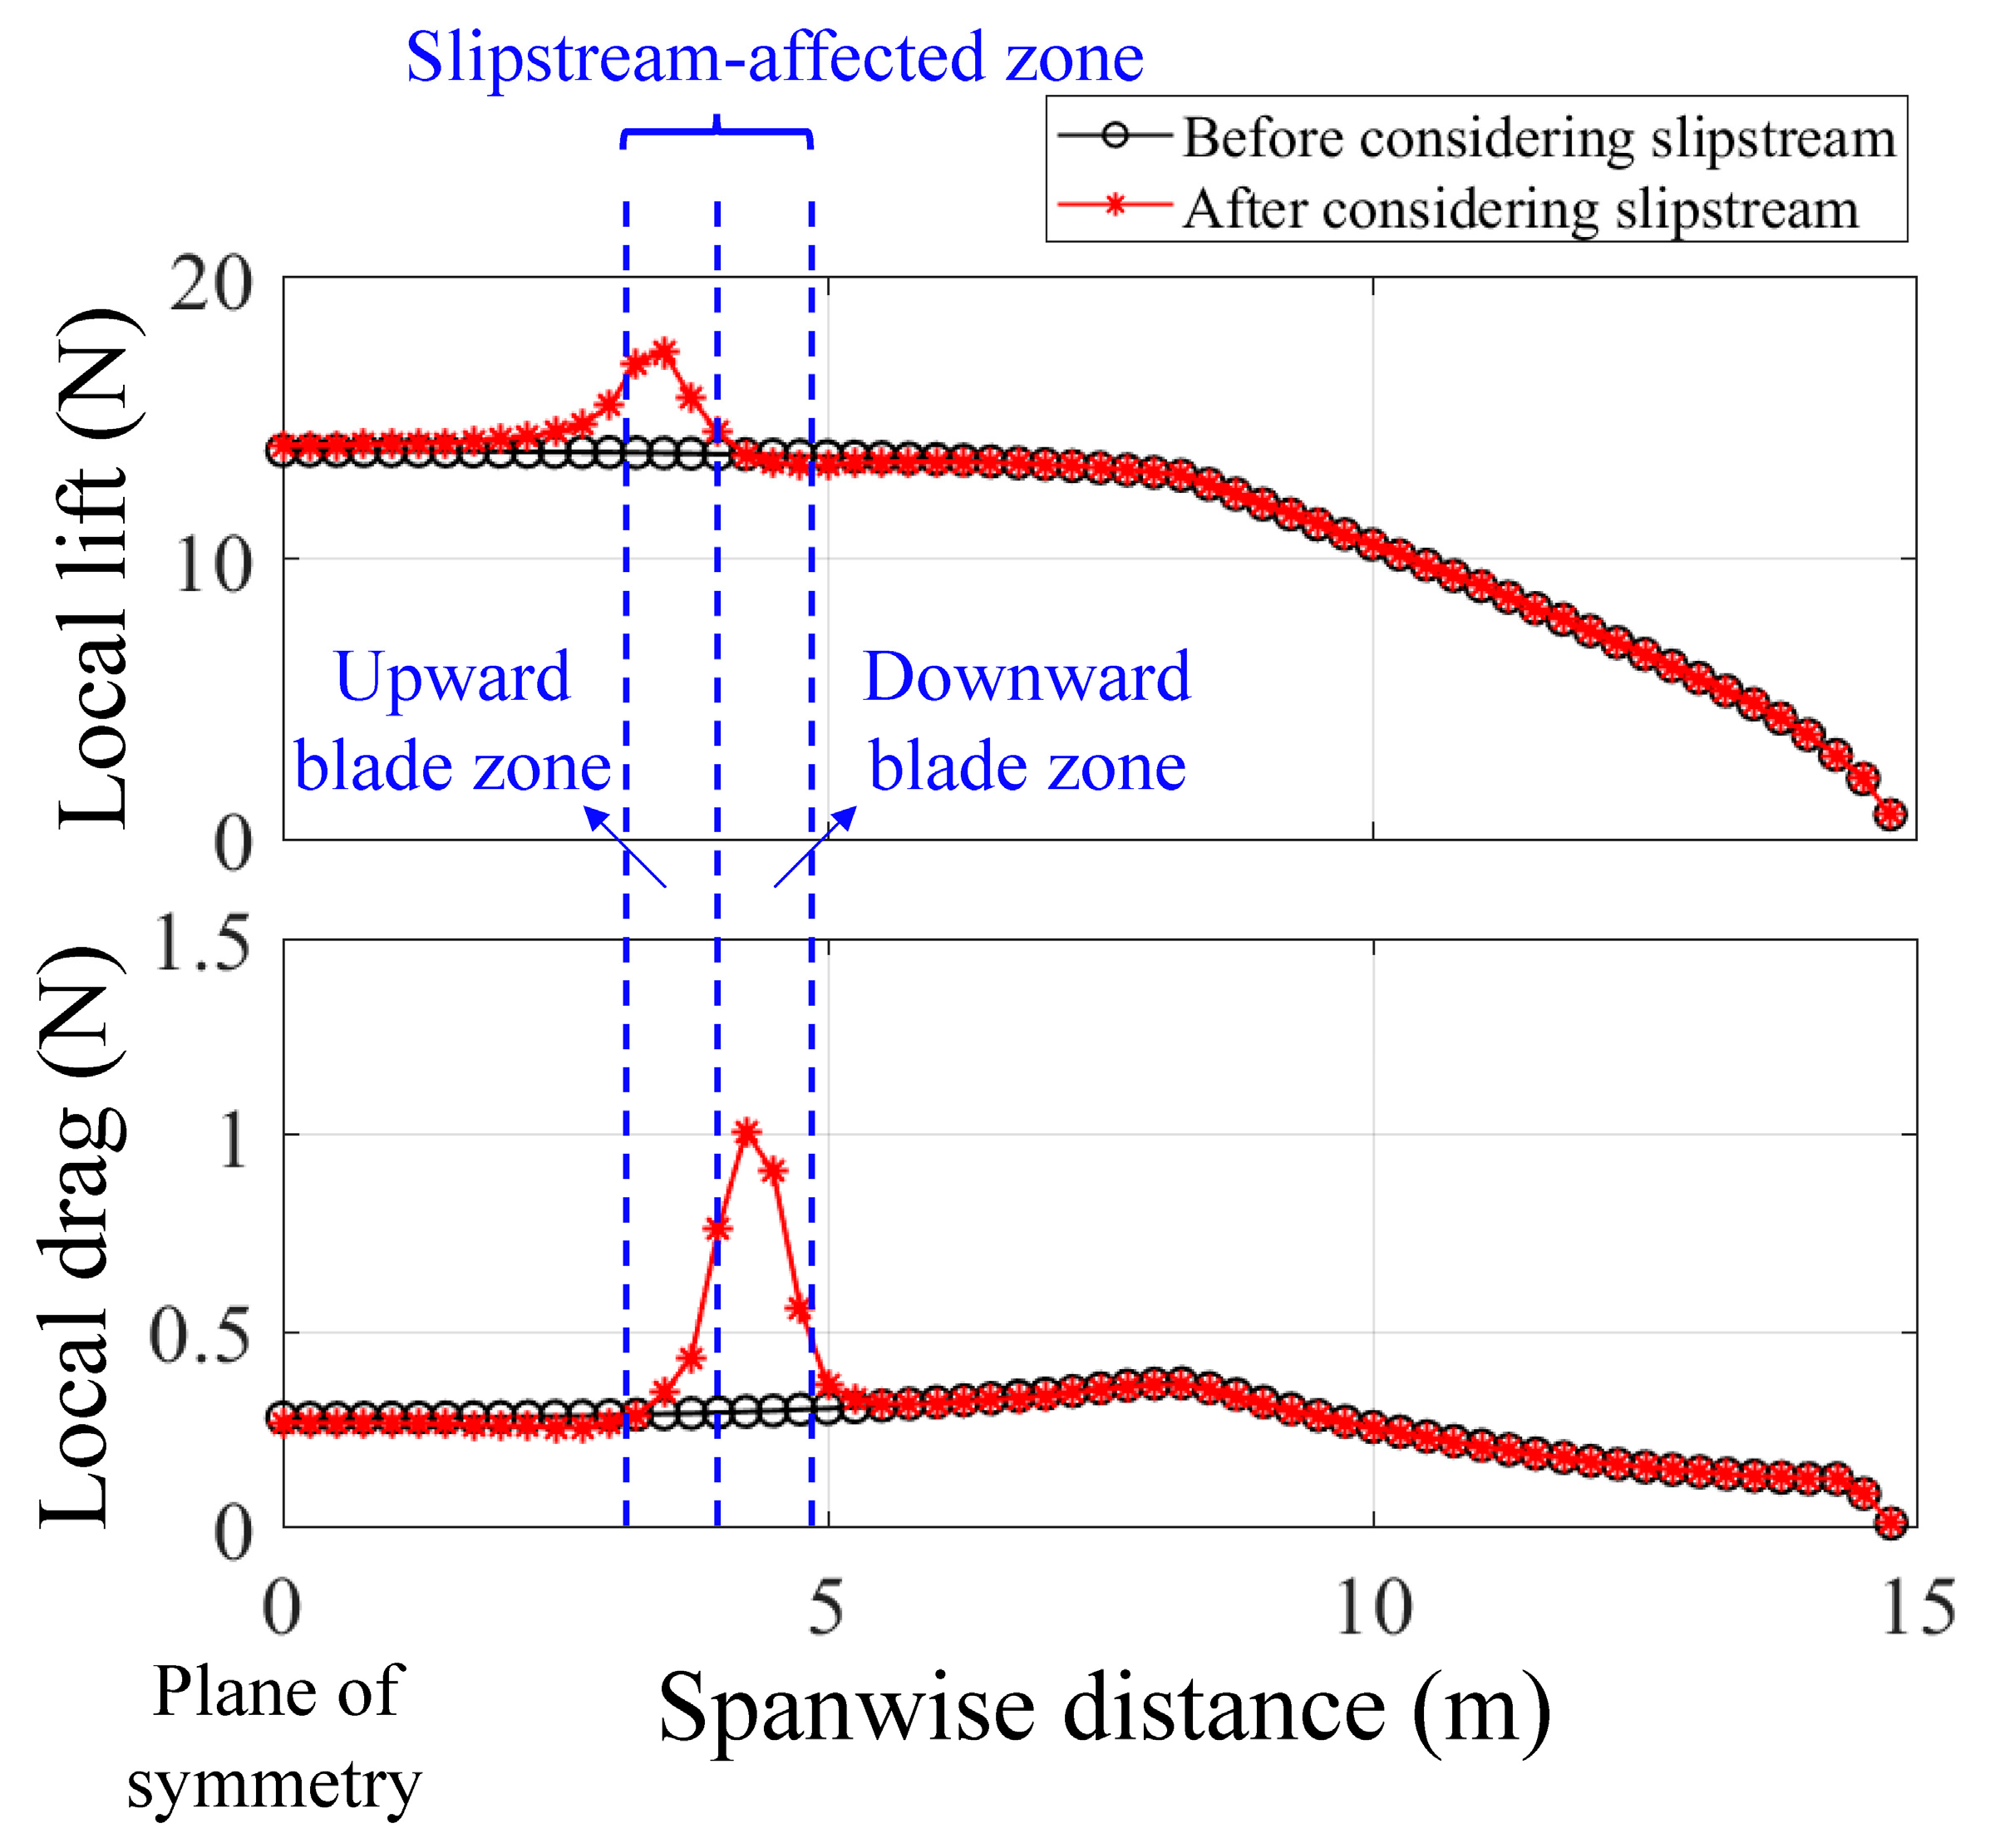
On the one hand, the required cruising power Pcruise under the propeller slipstream is greater than that of a clean configuration, due to the adverse effects of the propeller slipstream on the lift–drag ratio of the SPUAV. Taking the design results of the traditional method in Table 2 as an example, we conduct a CFD simulation for the SPUAV in the cruising condition. Figure 14 presents the local lift and drag distribution along the half-span of the wing, while Figure 15 shows the pressure coefficient distribution on the wing surface in the region affected by the propeller slipstream. To further quantify the results, Table 3 compares the aerodynamic parameters of the SPUAV before and after considering the propeller slipstream effects.
It can be observed that, under the influence of the propeller slipstream, the pressure distribution on the wing becomes more complex, introducing adverse lateral secondary flows. In terms of lift distribution, the propeller-induced rotational effects in the upward blade zone cause a local increase in the wing’s angle of attack. Simultaneously, the propeller accelerates the airflow, leading to an increase in local dynamic pressure. These two effects combined result in a significant increase in the suction peak at the leading edge, thereby enhancing the local lift. In the downward blade zone, the rotational effects reduce the local angle of attack, counteracting the lift increase caused by the higher dynamic pressure. Consequently, the lift in the downward blade zone decreases slightly. Regarding drag distribution, there is a noticeable increase in local drag across the entire slipstream-affected zone. This is particularly evident in the downward blade zone, where the local angle of attack significantly deviates from the angle for the maximum lift–drag ratio. This deviation causes a region of high pressure near the leading edge, as shown in Figure 15, resulting in a rapid increase in drag. Some aerodynamic studies on low Reynolds number propeller/wing systems have conducted an in-depth analysis of these phenomena [14,15,16,43].
Furthermore, with the increase in the propeller diameter, Pcruise shows a clear upward trend. This is because the larger propeller disk leads to an increased area affected by the above adverse effects. The research by Wang et al. indicated that a more centralized induced secondary flow is favorable for reducing the wing’s loss in the lift–drag ratio caused by the propeller slipstream, further confirming the positive correlation between the cruise power and propeller diameter [34].
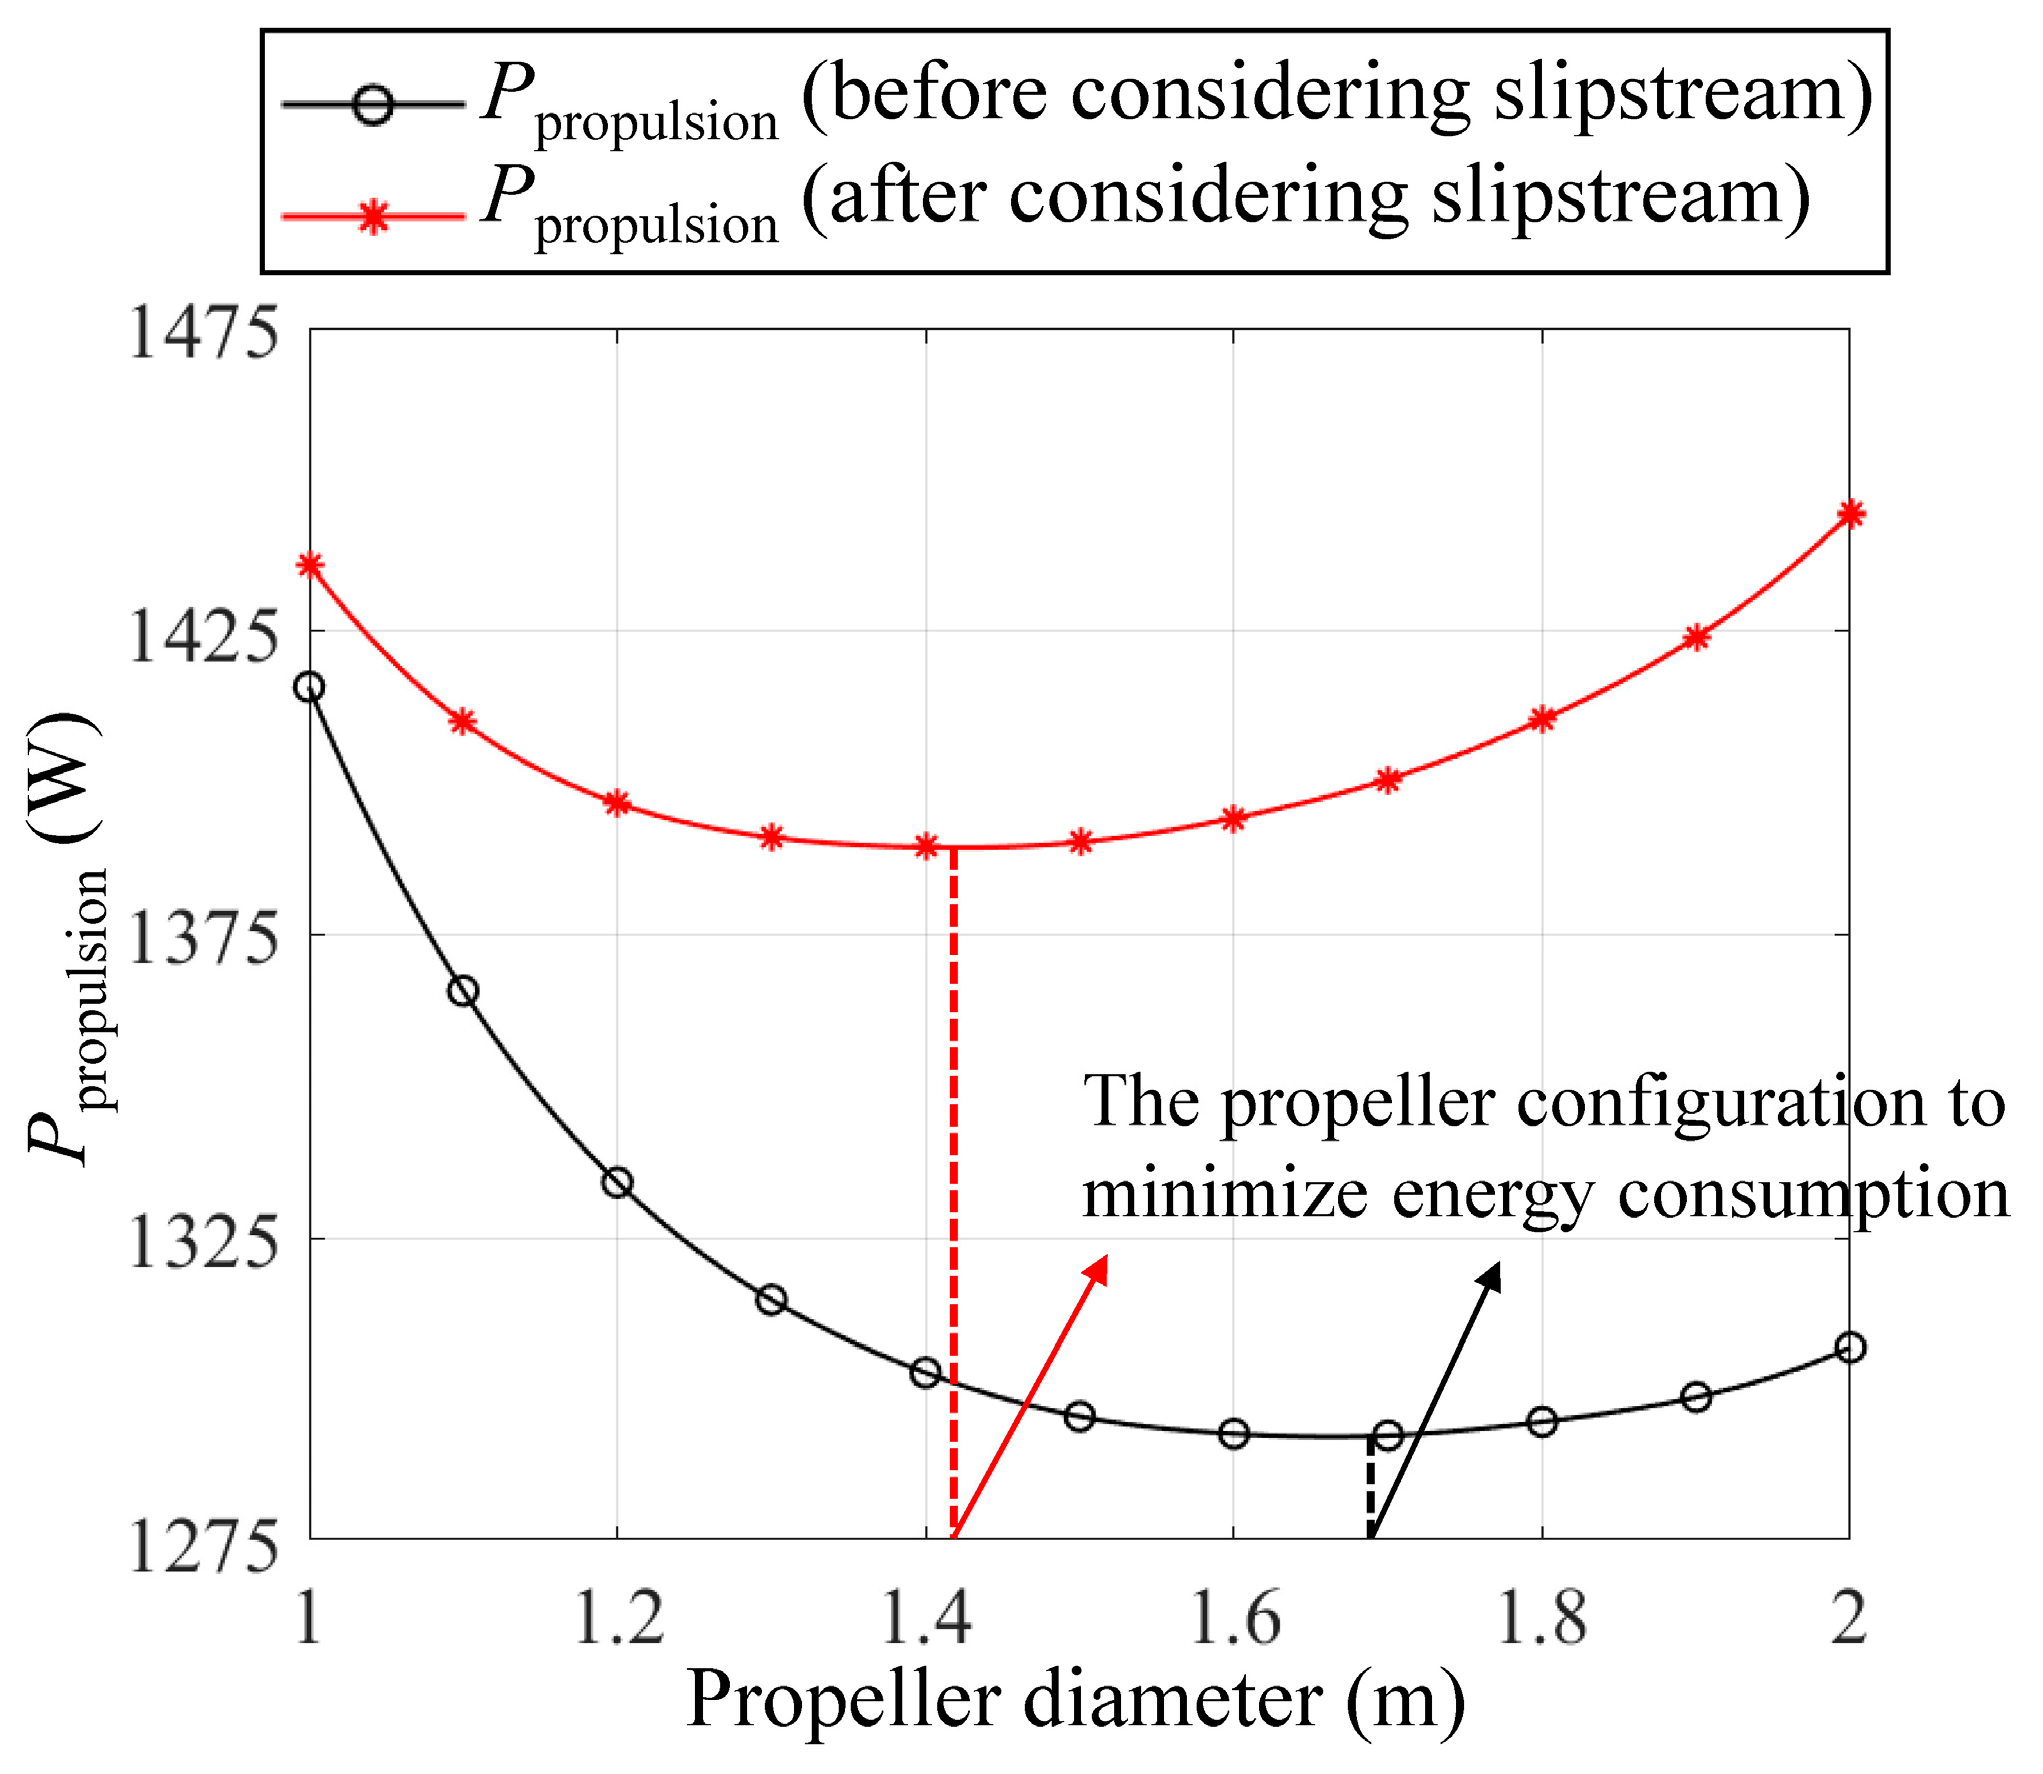
Figure 16 compares the propulsion system input power Ppropulsion before and after considering the slipstream effects, also exhibiting two characteristics. On the one hand, due to the enhancement of cruise power caused by the propeller slipstream, the corresponding Ppropulsion is larger than that of the clean configuration. On the other hand, due to the additional power increase introduced by large-diameter propellers when considering the slipstream effects, the corresponding optimal propeller diameter is relatively smaller.
The above comparison highlights the differences between the evaluation systems for the optimal propeller design in the proposed method and the traditional method. Traditional propeller optimization methods usually focus solely on the propeller itself, lacking cross-references between different systems, which can lead to suboptimal designs [44,45]. In contrast, the integrated design method proposed in this study achieves overall performance optimization through the synergistic optimization of different subsystems.
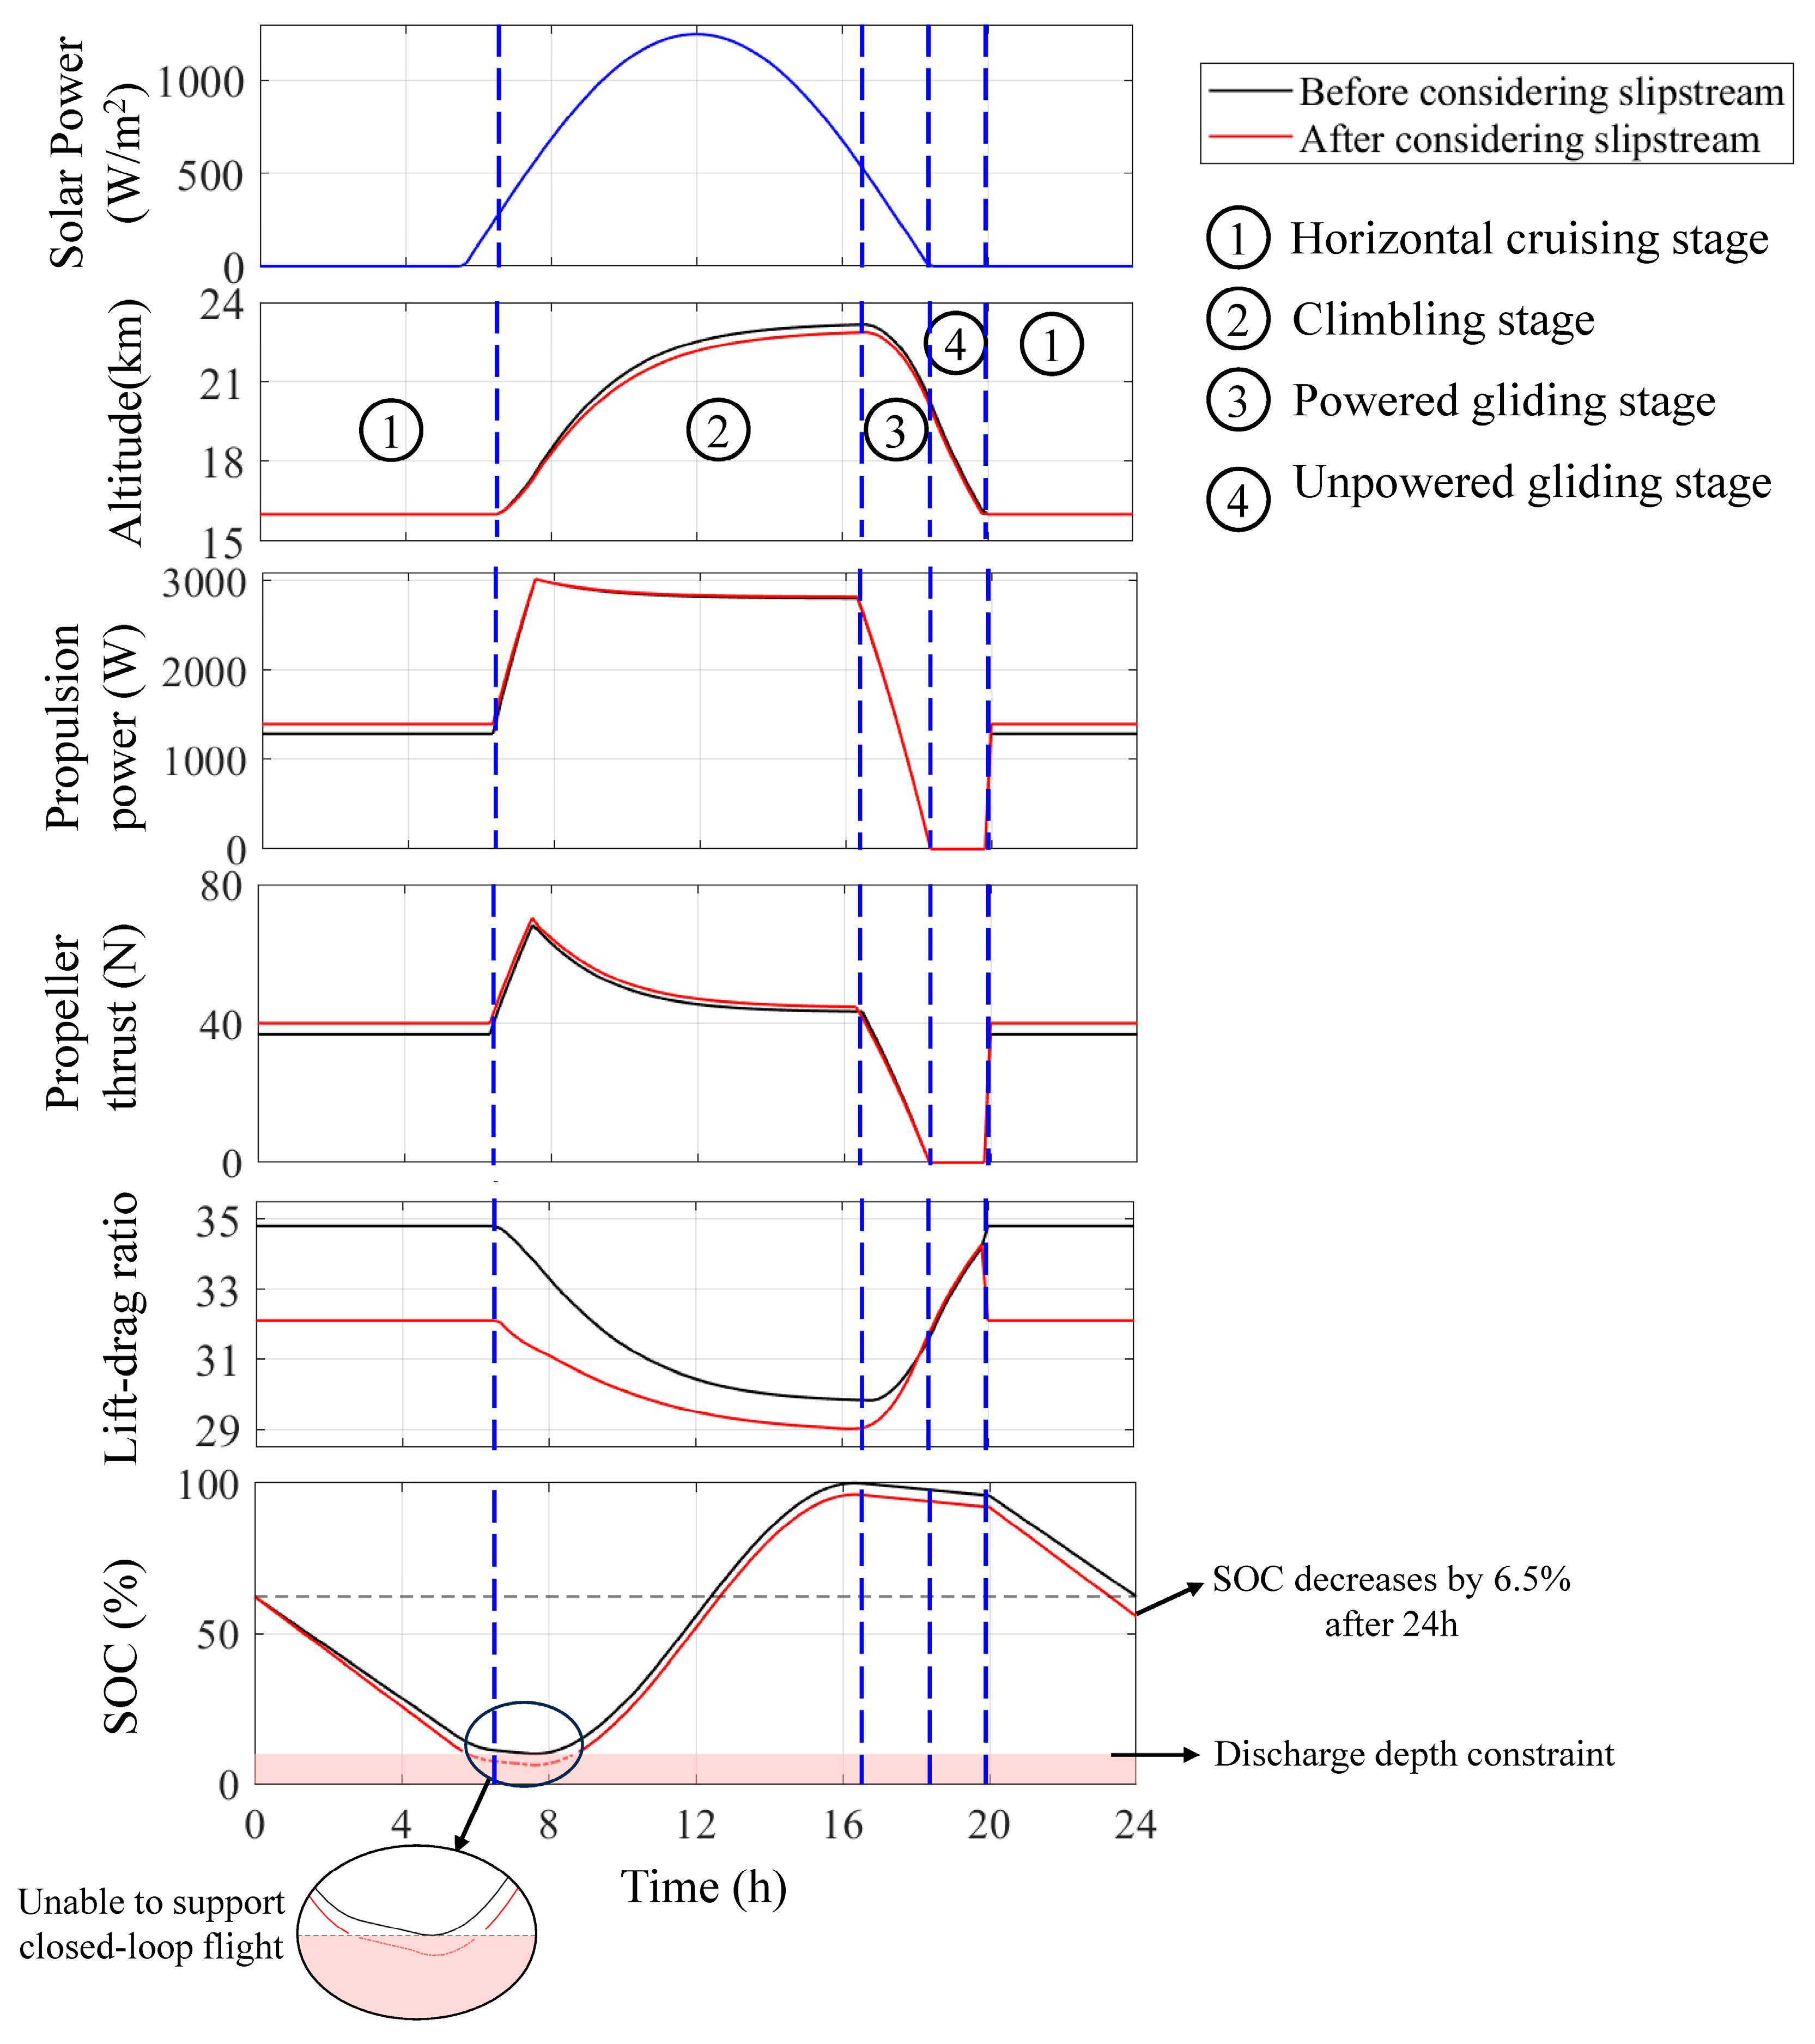
As discussed earlier, the propeller slipstream introduces additional power requirements that are not considered in the traditional method. As a result, the traditional method tends to underestimate the energy consumption level of the SPUAV at the macro level. As shown in Table 2, the deviation in energy consumption estimates leads to a tendency for the traditional method to carry fewer secondary batteries and PV cells. This indicates that the traditional method is overly aggressive and could introduce additional risks into the design outcomes. In order to quantitatively illustrate this point, taking the design results of the traditional method in Table 2 as an example, we compare the energy performance of the SPUAV before and after considering the slipstream effects for the same design parameters. Figure 15 displays the spectrum of time-varying state parameters throughout a day, including the solar radiation intensity, the cruise altitude, the lift–drag ratio, and the state of charge (SOC) of the secondary battery.
As described in Section 2.3.4, we categorize the flight within a day into four typical stages.
The lift–drag ratio curves in Figure 17 indicate that, with the design parameters of the SPUAV unchanged, the propeller slipstream causes a decrease of approximately 2.7 in the lift–drag ratio during horizontal cruising stage (stage 1), resulting in a higher propeller thrust and greater energy consumption of the propulsion system.
During the climbing stage (stage 2), the adverse effects of the propeller slipstream decrease with the increase in altitude. The reduction in Reynolds number at higher altitudes augments the size of laminar separation bubbles on the wing. Some studies have shown that the propeller slipstream, by injecting energy into the boundary layer of the wing, is conductive to reducing the scale of laminar separation bubbles. This can, to some extent, mitigate the adverse effects of slipstream mentioned previously, and this mitigating effect is more pronounced at lower Reynolds numbers. When the Reynolds number is below 1 × 10⁵, the slipstream may even exert a beneficial effect [15,46,47]. However, due to size and flight altitude limitations, it is difficult for the SPUAV to achieve such low Reynolds numbers [14,15,16,48]. For the subject of this research, the flight Reynolds numbers are approximately between 2 × 10⁵ and 3 × 10⁵. Therefore, under typical operating conditions, the propeller slipstream still has negative effects on the SPUAV.
Additionally, during the climbing stage, the propulsion system operates at its maximum power output, so the energy consumption of the propulsion system is similar before and after considering the slipstream effects. However, since the required flight power is higher when accounting for the slipstream, the climb rate is relatively lower, and the maximum flight altitude decreases from 23.17 km to 22.88 km. As the flight altitude increases, the low Reynolds number effects become more pronounced, resulting in a gradual decrease in propeller thrust and a decrease in climb rate.
During the powered gliding stage (stage 3), as solar radiation wanes, both the propulsion system’s energy consumption and the propeller thrust gradually decline, thus reducing the adverse effects caused by the slipstream.
During the unpowered gliding stage (stage 4), with the absence of propulsion power and propeller thrust, the lift–drag ratio curves for the two scenarios are nearly identical.
Therefore, under the effects of the propeller slipstream, the actual power consumption of the SPUAV will be slightly higher than the estimated value for the clean configuration, which results in the decline of the energy performance of the SPUAV. The SOC curves reveal that, after taking into account the propeller slipstream effects, the battery fails to fully charge due to the higher power consumption. After a complete 24-h flight cycle, the battery level decreases by 6.5%, indicating that the total energy consumed by the SPUAV in a day exceeds the energy obtained from solar power. This implies an energy deficit, and with each successive day of flight, the battery’s remaining power will continue to decline. The SOC curve shows that the battery level drops below 10% at 4:50 a.m., exceeding the discharge depth constraint of the secondary battery. All these phenomena suggest that the design result of the traditional method, when considering the effects of the propeller slipstream, will be incapable of achieving day–night closed-loop flight at the specified mission points.
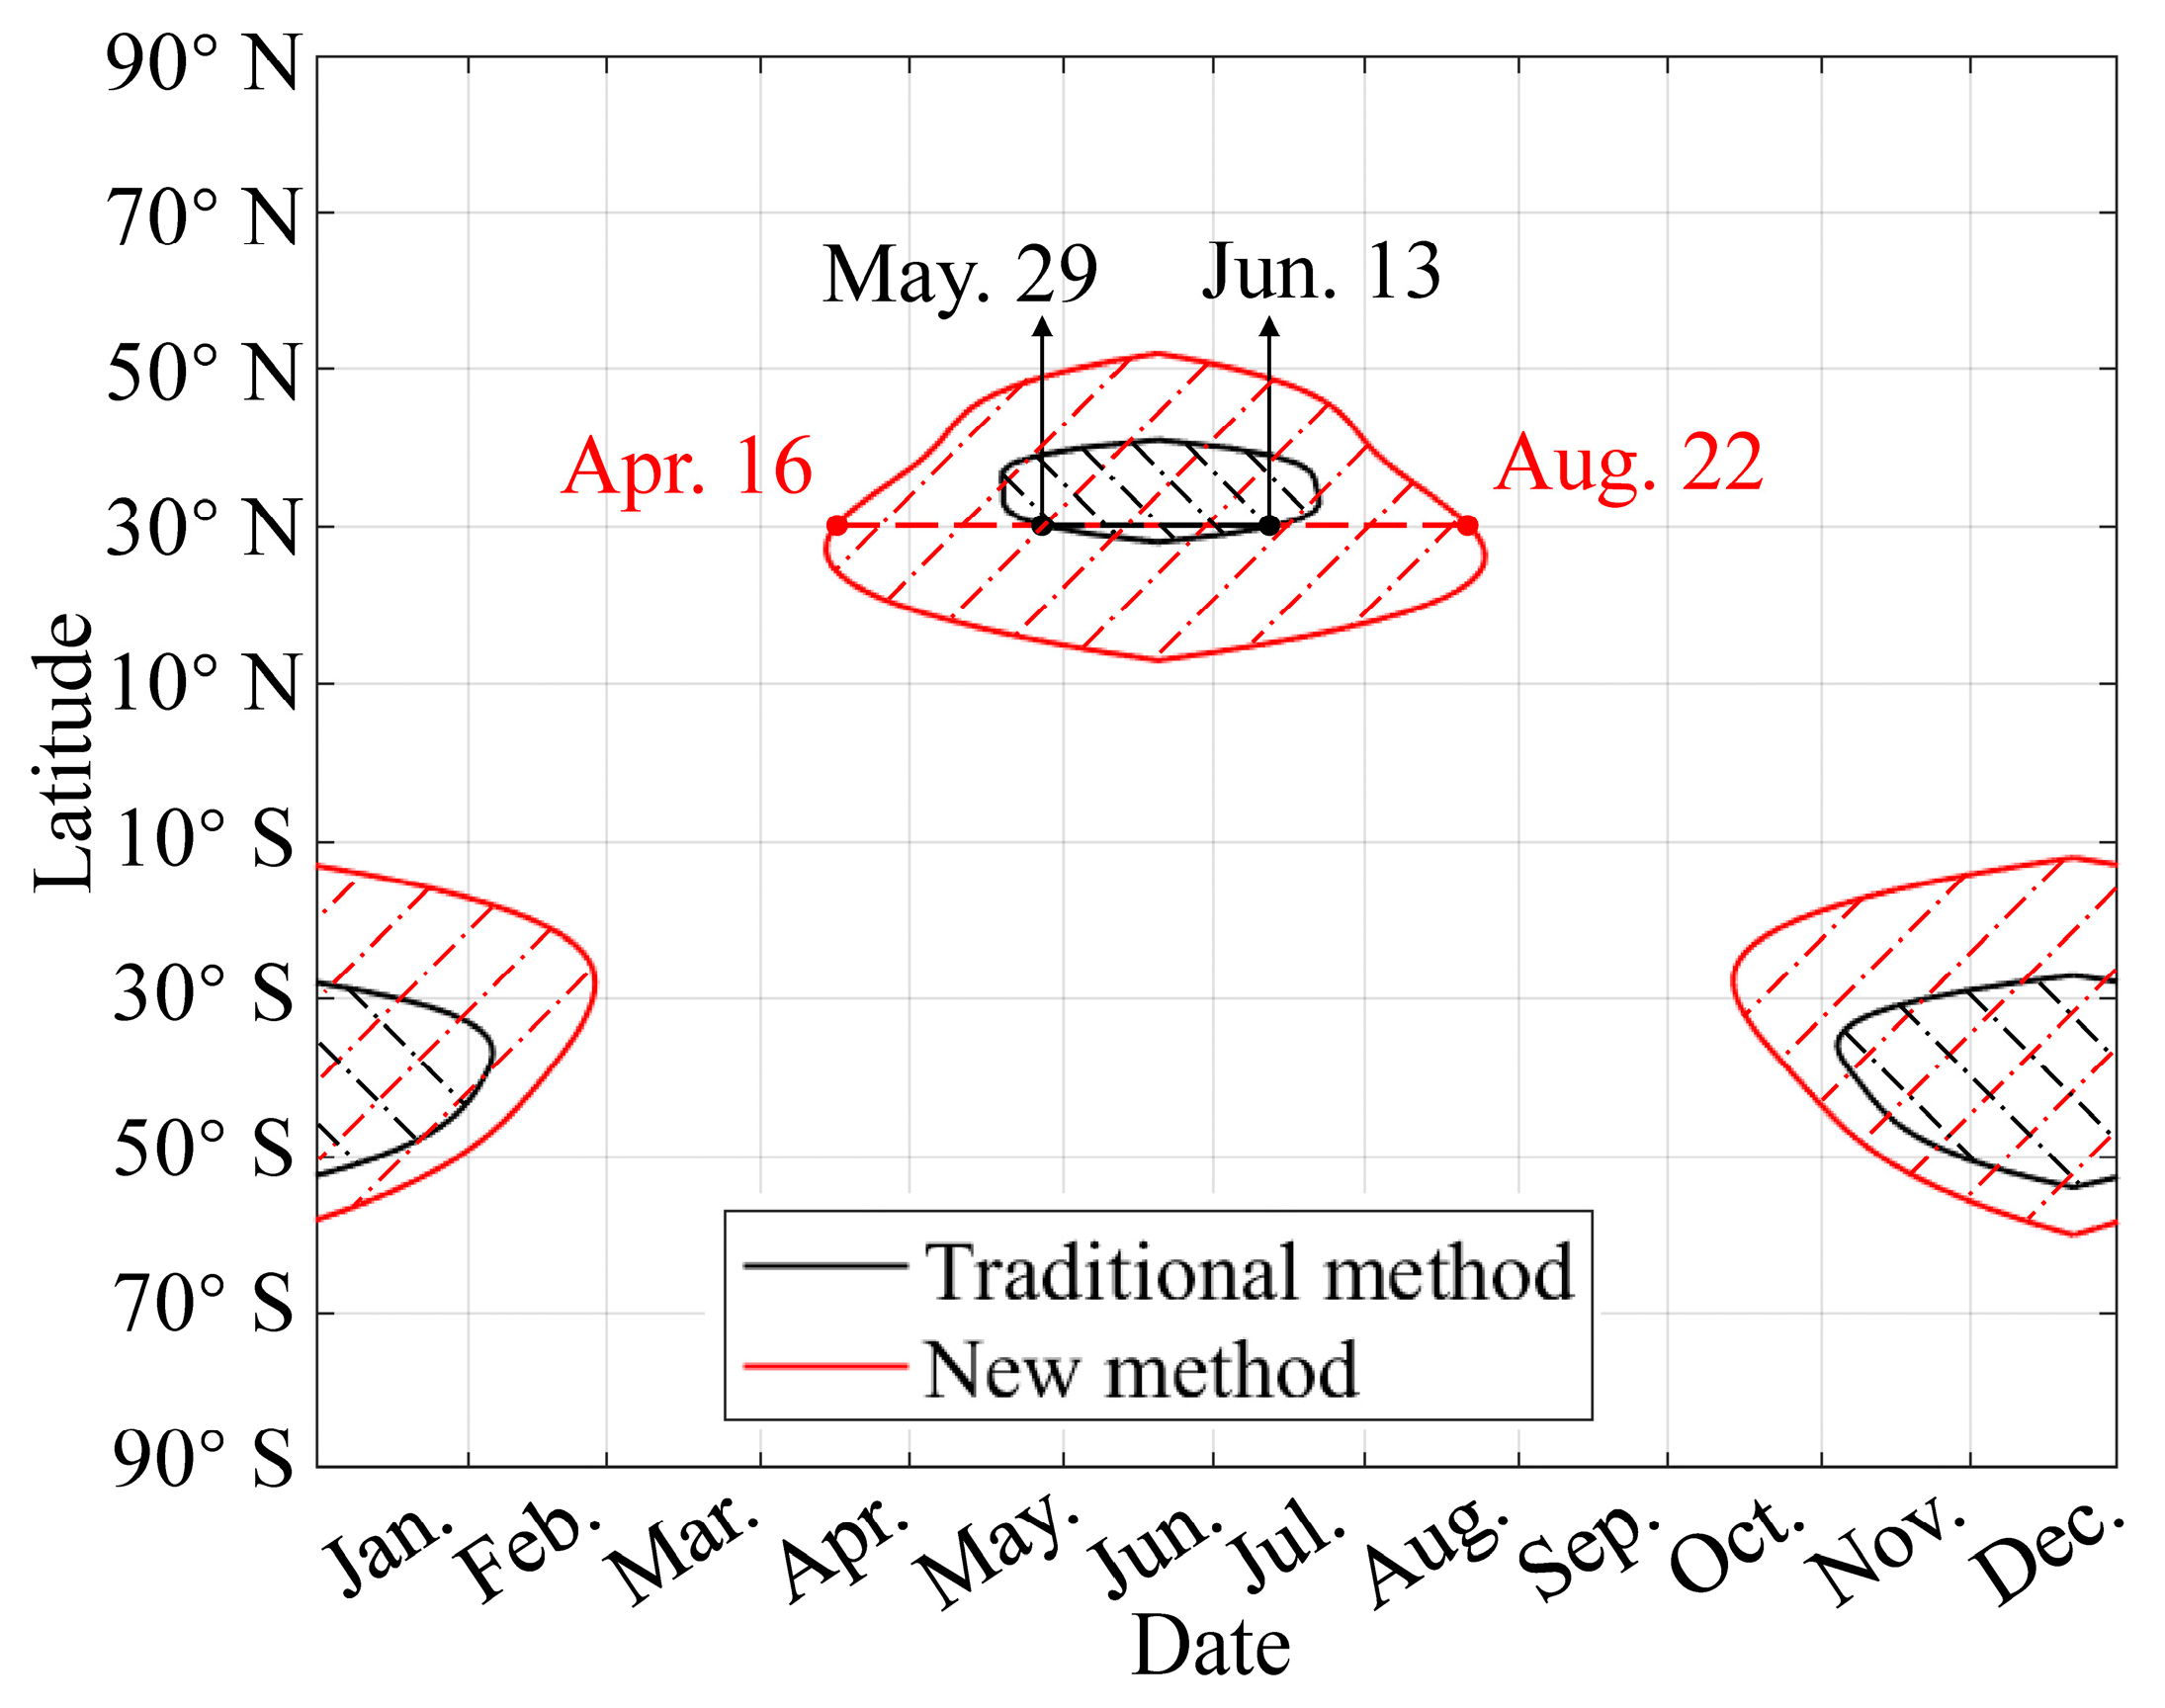
The shaded regions enclosed by the curves in Figure 18 denote the actual feasible mission region within which the two design results listed in Table 2 can achieve day–night closed-loop flight. Both methods target the mission point of 16 April at 30° N latitude. Under this scenario, the design results should be capable of closed-loop flight on all dates with higher solar radiation (106 days from 16 April to 22 August). However, the low-fidelity design framework employed by the traditional method results in the deviation of the design results, and the specified mission requirements cannot be achieved. At 30° N latitude, the feasible mission region for the traditional method’s design results is restricted to the period between 29 May and 13 July, totaling 46 days, which shows a reduction of more than half. In contrast, the new method avoids the reduction in feasible mission region caused by the propeller slipstream with an additional weight of about 15.9%. Additionally, at other latitudes, the feasible mission region of the new method is also larger than that of the traditional method. It is worth noting that Earth’s orbit around the Sun is elliptical, with the aphelion typically occurring in July and the perihelion in January. This causes the solar radiation in the Southern Hemisphere’s summer to be slightly greater than that in the Northern Hemisphere’s summer. Consequently, slight differences exist in the feasible mission regions between the Southern and Northern Hemispheres.
In conclusion, traditional SPUAV design methods have limited cross-referencing capabilities between systems, which leads to suboptimal designs. Therefore, the integrated design approach is necessary [49]. The significance of the new method lies in its ability to quantify the effects of the propeller slipstream on flight power consumption over a mission cycle, thus providing a more accurate and reliable design for the SPUAV, as opposed to relying on empirical safety factors. This is crucial for scientifically allocating the design margins of the SPUAV.

3.2.2. Retrofit Design at Multiple Mission Points

In the previous section, we conducted an optimum design with 16 April at 30° N latitude as the mission point and identified the corresponding feasible mission region. In this section, we aim to perform a retrofit design for the SPUAV across all latitudes and dates in order to further expand the feasible mission region and explore the correlation between optimal solutions and mission points. Specifically, we use a grid increment of 10 degrees for latitude and 1 month for date to discretize the entire mission region and apply the optimization framework from Section 2.4 to derive optimal design results for each mission point.
Figure 19 compares the feasible mission region areas before and after the retrofit design. One of the main improvements is the achievement of day–night closed-loop flight over a broader range of latitudes. This demonstrates that the adaptability of the SPUAV is enhanced by conducting retrofit designs tailored to different solar radiation characteristics of different mission points. Additionally, traditional SPUAV design methods typically use top-level design parameters such as wingspan and aspect ratio as the design variables [19,20]. However, the final adopted solution can only be one of these. This means it is challenging to meet the requirements of different latitudes simultaneously. In contrast, the retrofit approach proposed in this study requires only secondary configurations on the energy and propulsion systems, without altering the SPUAV’s aerodynamic shape, to expand the feasible mission region. This improvement demonstrates promising application prospects.
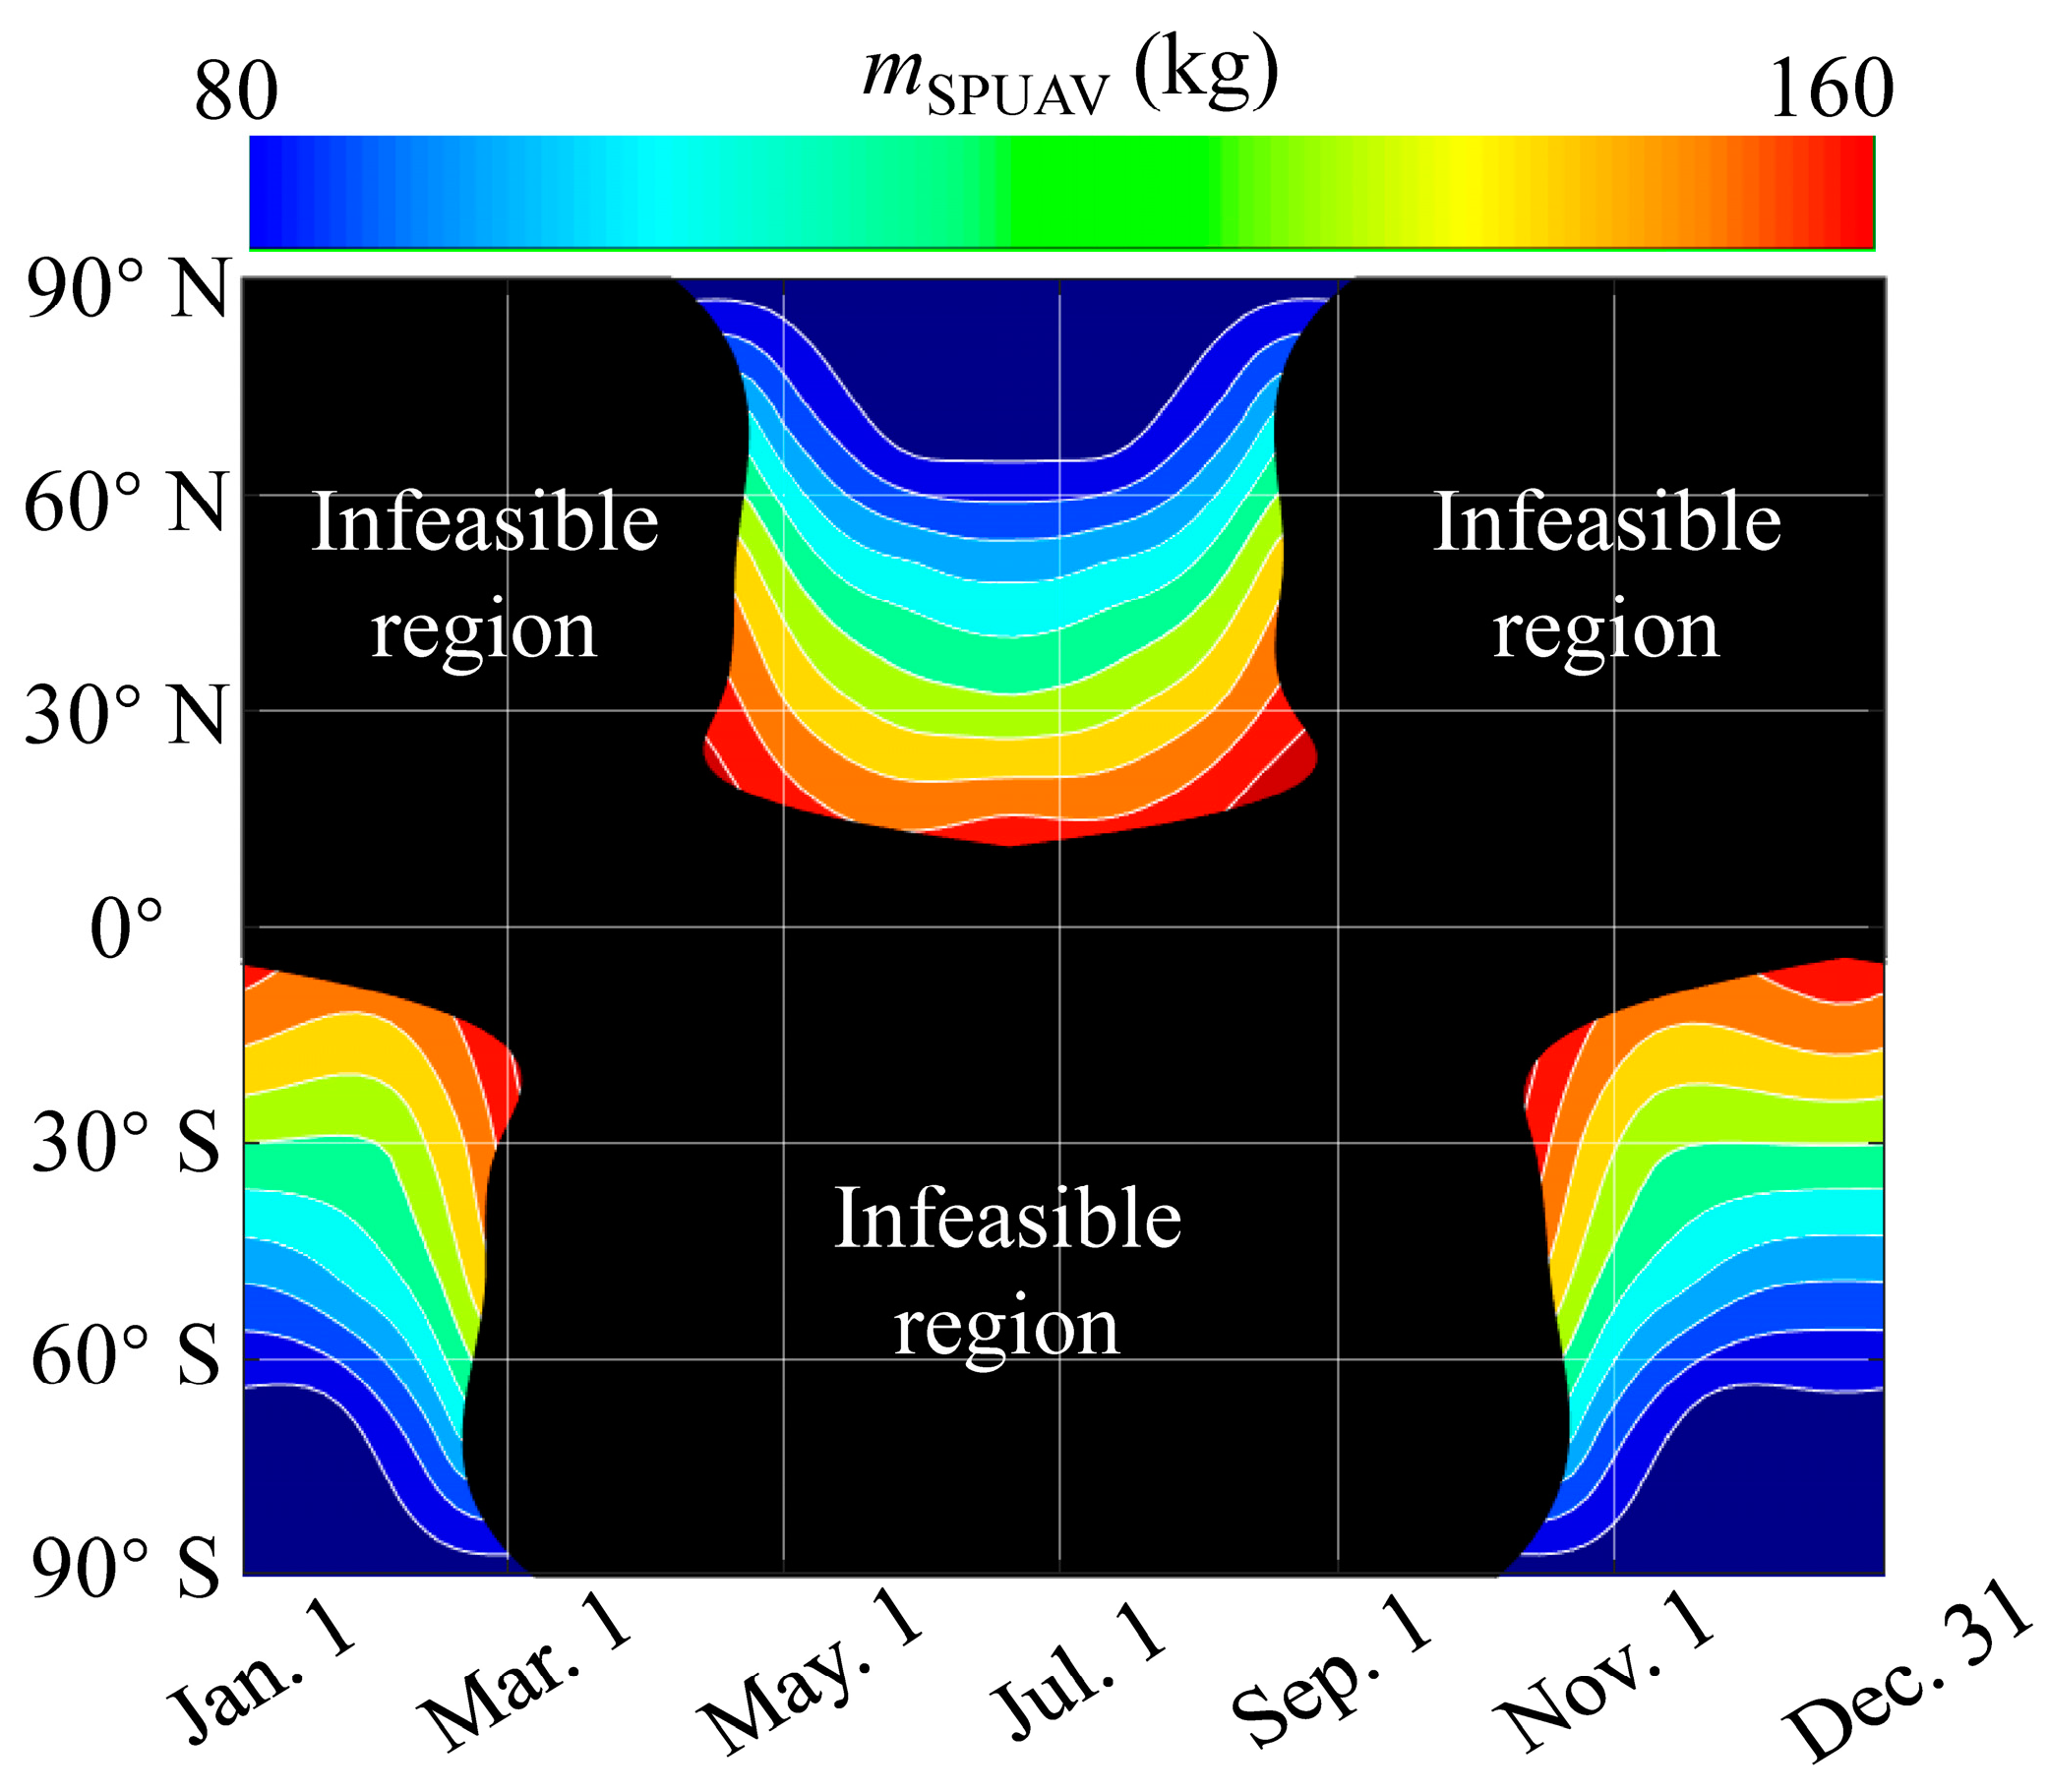
Figure 20 presents the total weight of the retrofit design results for various mission points. Preliminary analysis, in conjunction with Figure 19 and Figure 20, indicates that, for the SPUAV, there is no necessary correlation between total weight and energy performance. This is quite different from conventional UAVs. For conventional UAVs, carrying additional fuel or batteries can significantly enhance endurance, but this does not hold true for the SPUAV. In low-latitude regions, a greater total weight brings additional feasible mission space. However, in high-latitude regions, a reasonable reduction in the total weight may be more advantageous for the SPUAV to achieve closed-loop flight. Therefore, only by conducting targeted design and configuration according to mission requirements can the feasible mission region for the SPUAV be expanded as much as possible.
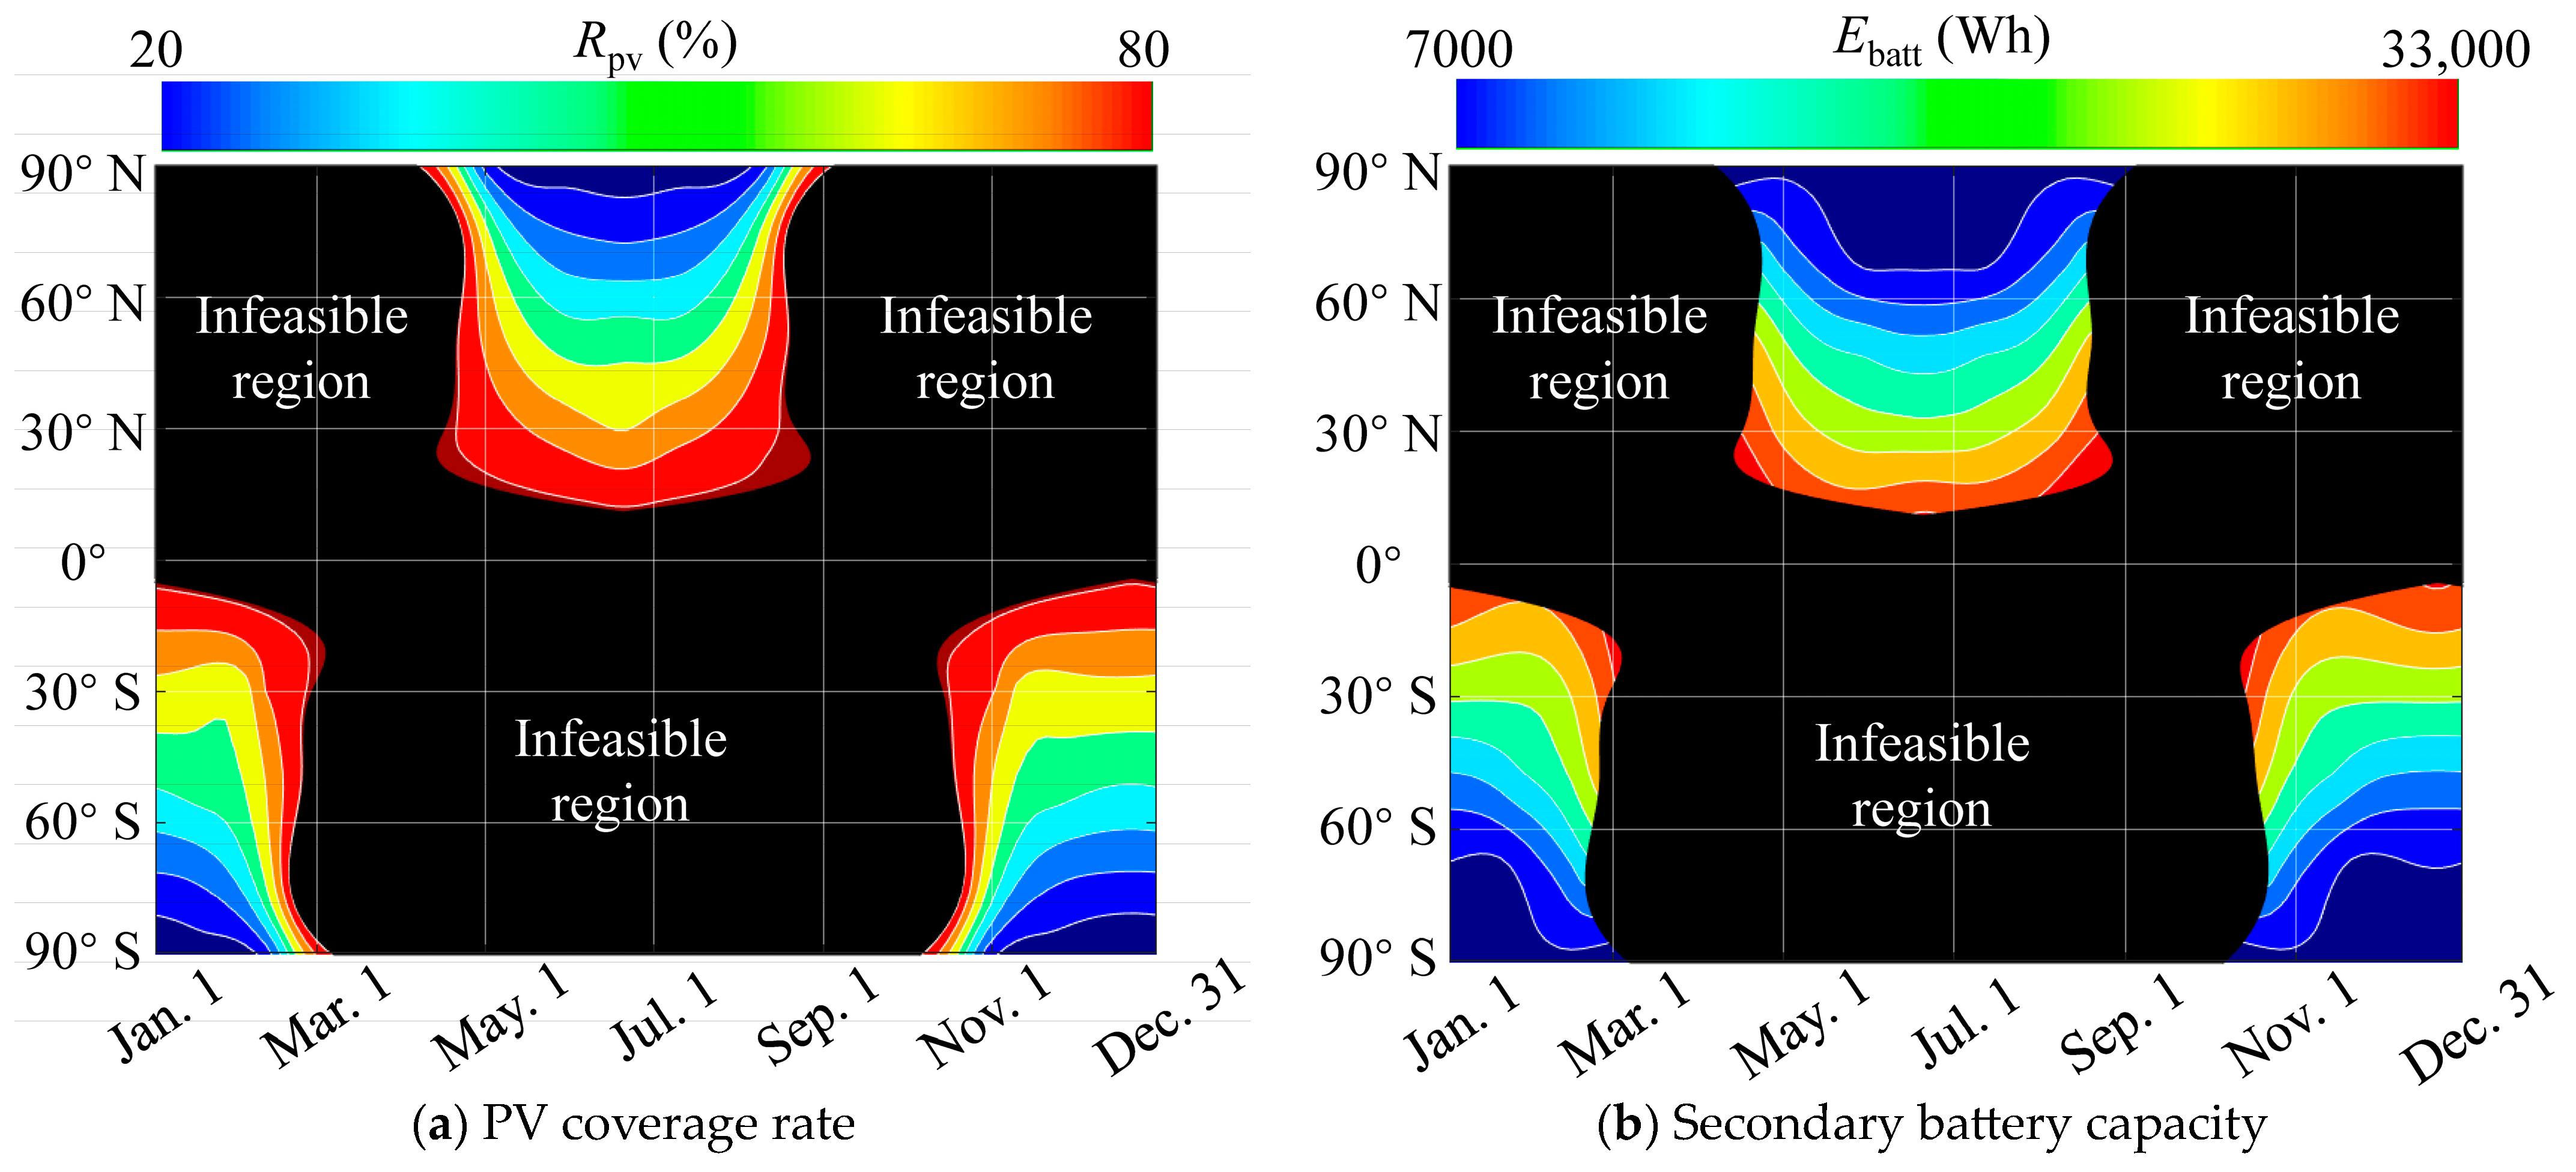
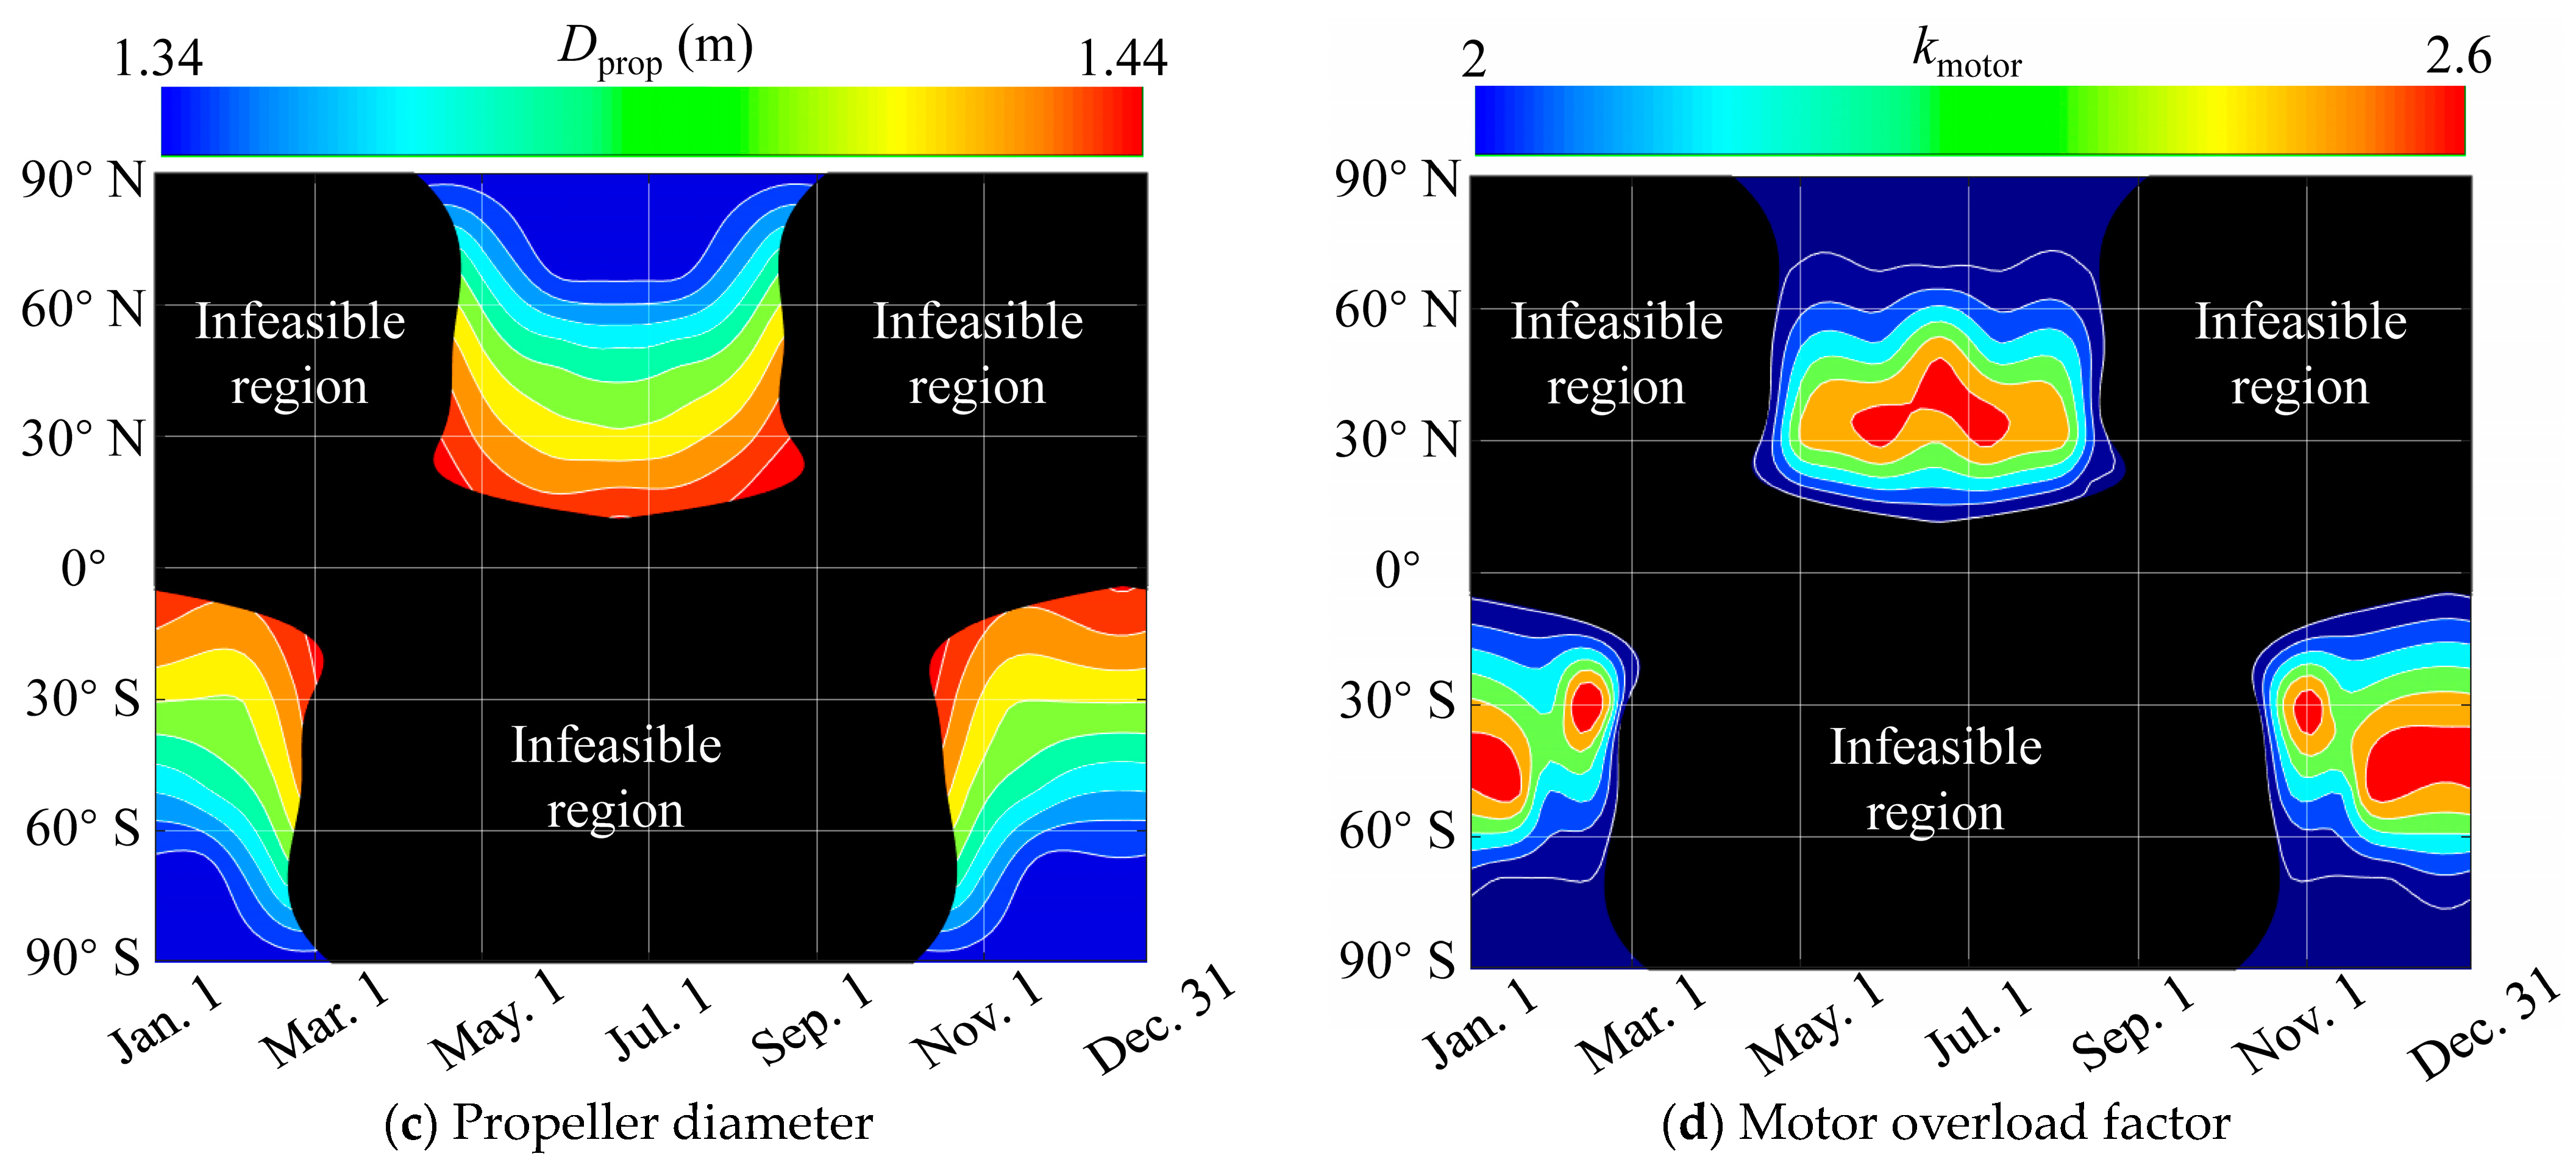
Figure 21 illustrates the optimal values of the design parameters at various mission points. Furthermore, the trends of the optimal design results are analyzed. The fundamental reason for the observed differences lies in the varying solar radiation conditions at different mission points. Specifically, the duration and total amount of solar radiation throughout a day vary at different mission points, as depicted in Figure 22.
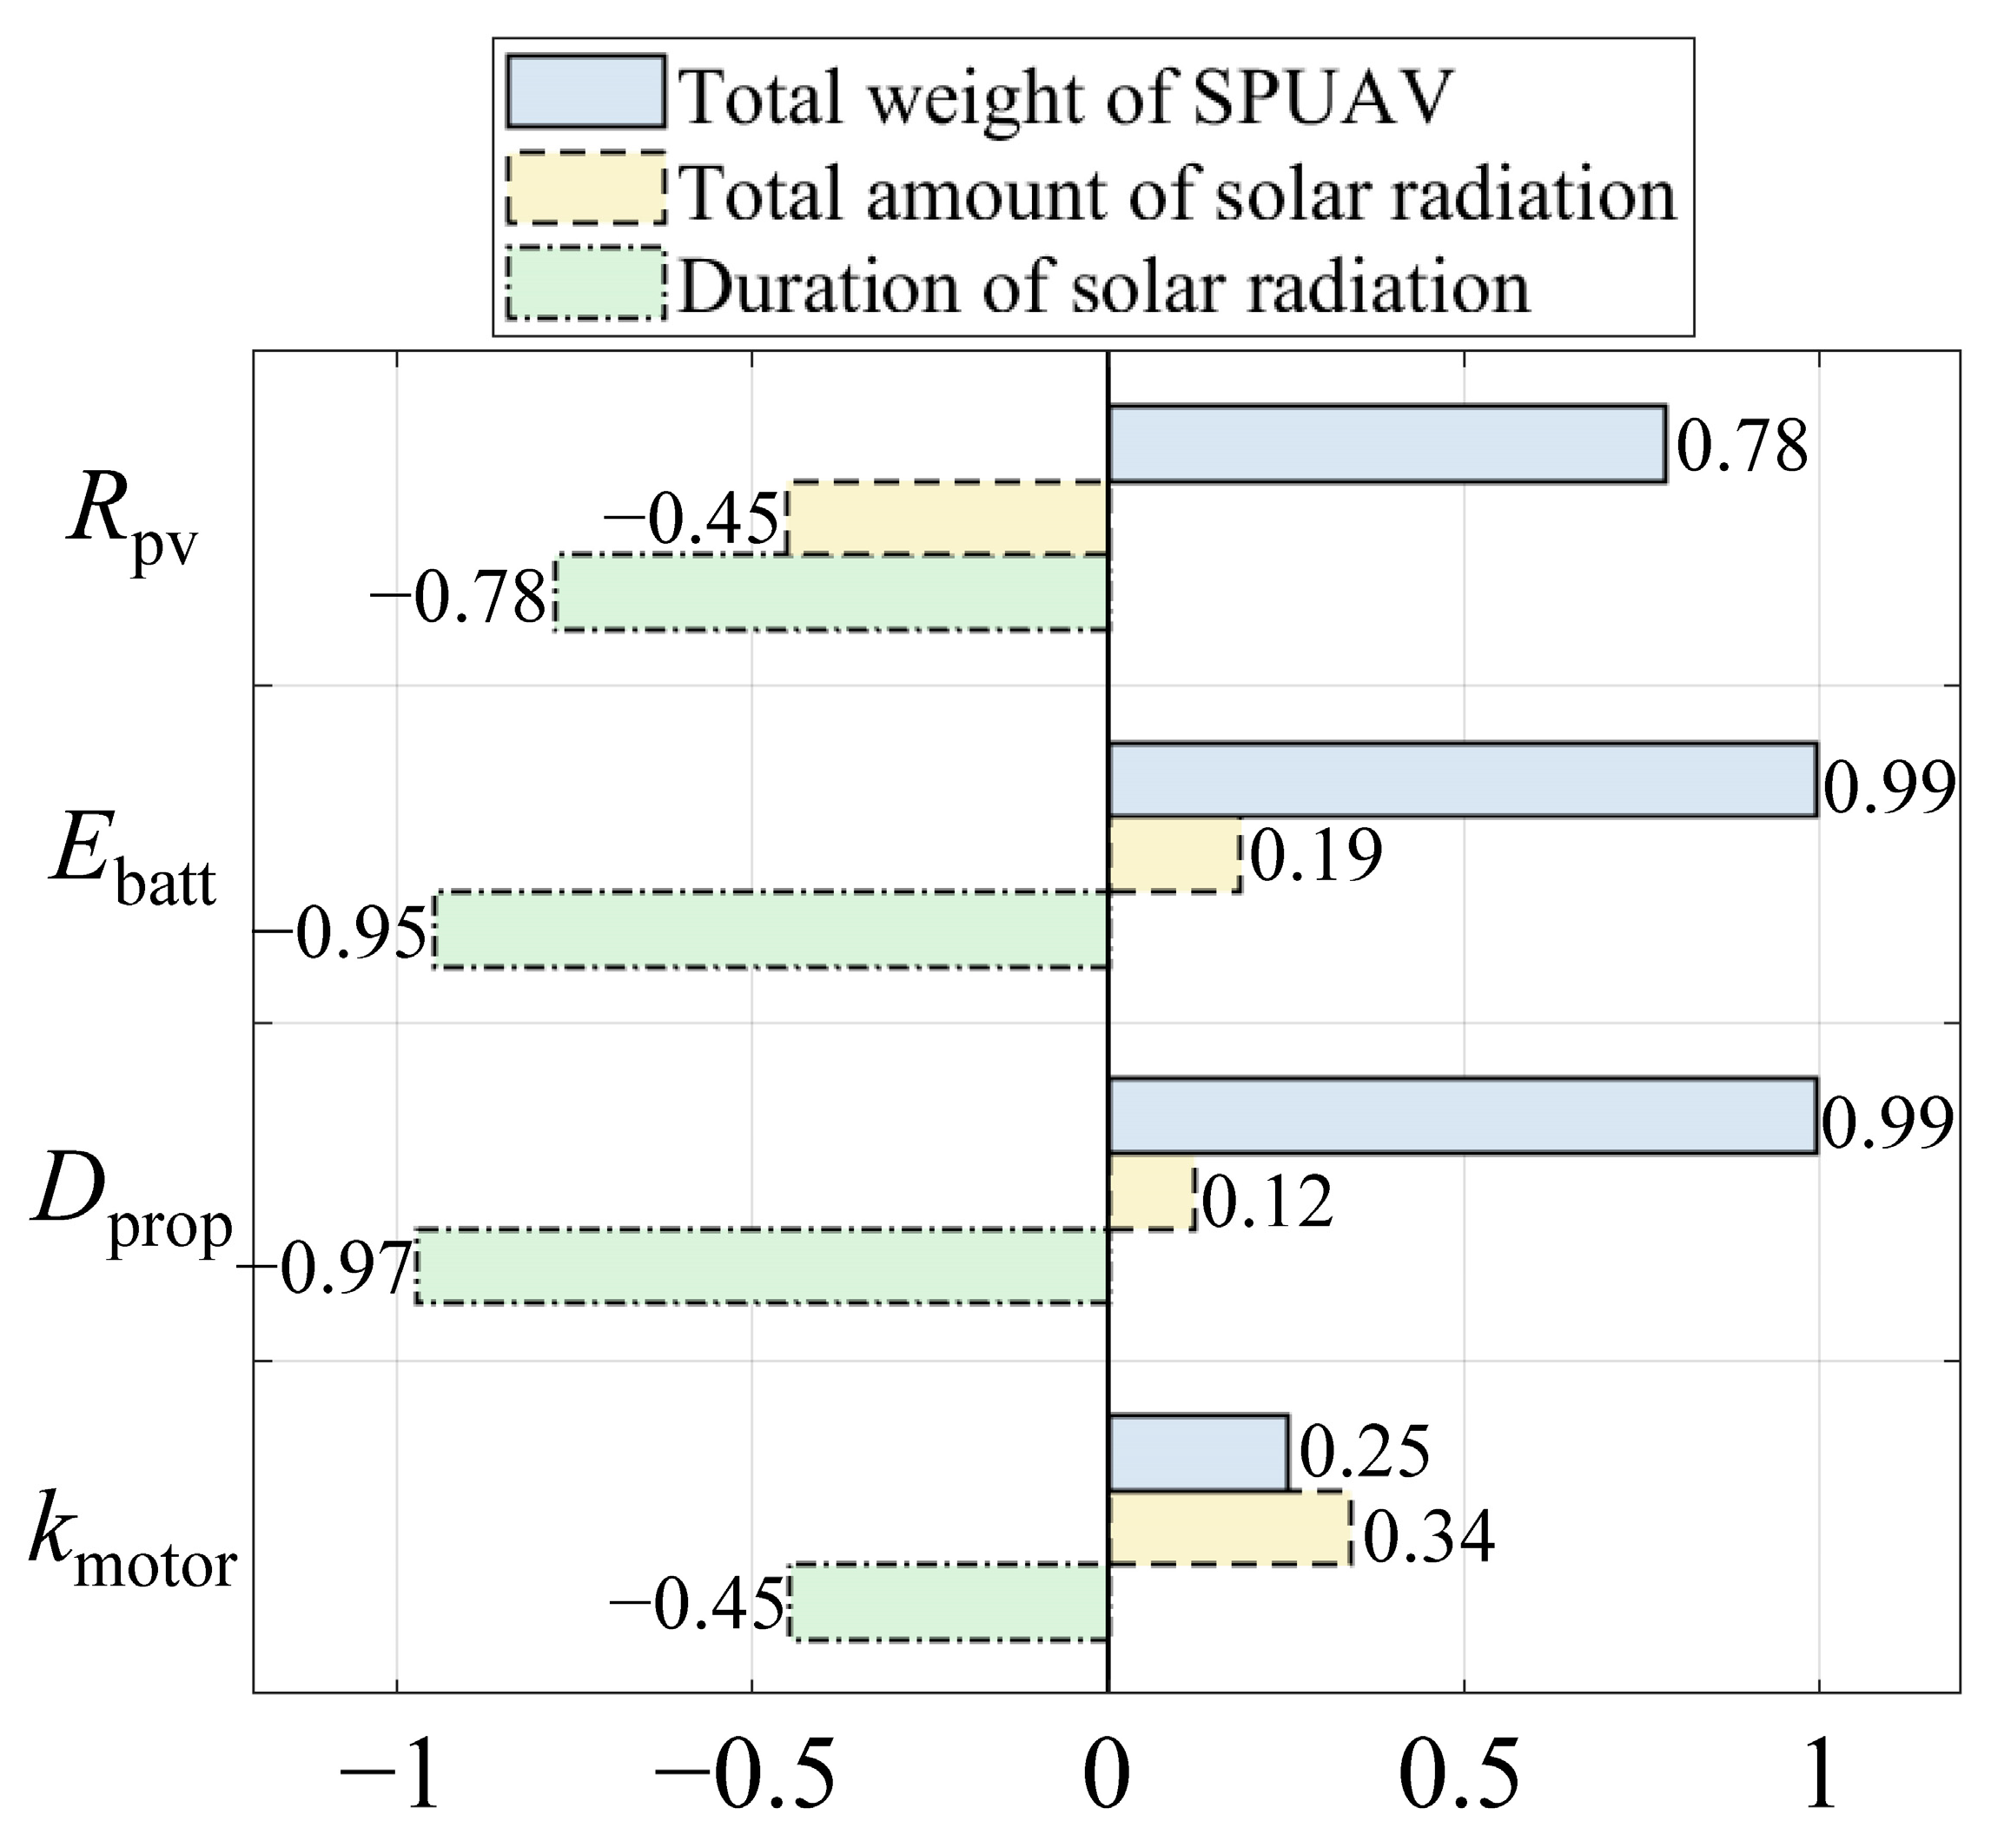
Figure 23 depicts the correlation between the design variables and various factors. It is evident that the PV coverage rate RPV is negatively correlated with the duration and total amount of solar radiation, which can be intuitively understood. Longer duration and larger amount of the solar radiation imply that fewer PV cells are required to obtain sufficient solar energy. In contrast, as shown in Figure 21a that, at all boundaries of the feasible mission region, the lack of solar power causes the PV coverage rate to always approach the upper limit.
The secondary battery capacity Ebatt exhibits a significant negative correlation with the duration of solar radiation, while it is almost unrelated to the total amount of solar radiation. In Figure 21b and Figure 22a, the distribution patterns of battery capacity and sunlight duration are nearly identical. This is because the role of the secondary battery is to provide the SPUAV with the necessary energy for nighttime flights. A shorter duration of sunlight implies the need for a larger capacity of the secondary battery to sustain prolonged nighttime flight. On the one hand, in the vicinity of the polar regions, the occurrence of polar days significantly reduces the demand for the secondary battery, as solar energy directly powers the propulsion system for most of the time throughout a day. Therefore, only a certain weight of the secondary battery is retained to meet the minimum wing load limit described in Section 2.4. On the other hand, in the regions near the equator, the direct sunlight results in approximately 12 h of daylight per day throughout the year, necessitating that the SPUAV carries a secondary battery of substantial capacity. This also explains why the subject of this study cannot achieve closed-loop flight near the equator. In equatorial regions, large secondary batteries result in a significantly high overall weight and energy consumption of the SPUAV. This means that, even if the PV coverage rate reaches its maximum, it is still insufficient to absorb enough solar energy. Achieving closed-loop flight near the equator would require either a flying platform with a larger wing area or PV cells with higher conversion efficiency, which would increase the amount of absorbable solar energy.
Since the weight of the energy system typically accounts for 30% or more of the total weight of the SPUAV, there exists a clear positive correlation between the PV coverage rate, the secondary battery capacity, and the total weight. For the propulsion system, the propeller diameter also shares a close relationship with the total weight, even though the mass of the propeller is usually only a few hundred grams. This can be explained by the actuator disk theory. A larger total weight signifies a greater thrust requirement. Assuming the same induced losses, a larger propeller is required to push a greater volume of air, leading to an increase in the optimal propeller diameter as the total weight of the SPUAV increases. Moreover, given the close relationship between the total weight and the energy system parameters, and the energy system parameters’ strong correlation with the sunlight duration, a relationship emerges between the propeller diameter and sunlight duration. However, this relationship does not possess any actual physical significance.
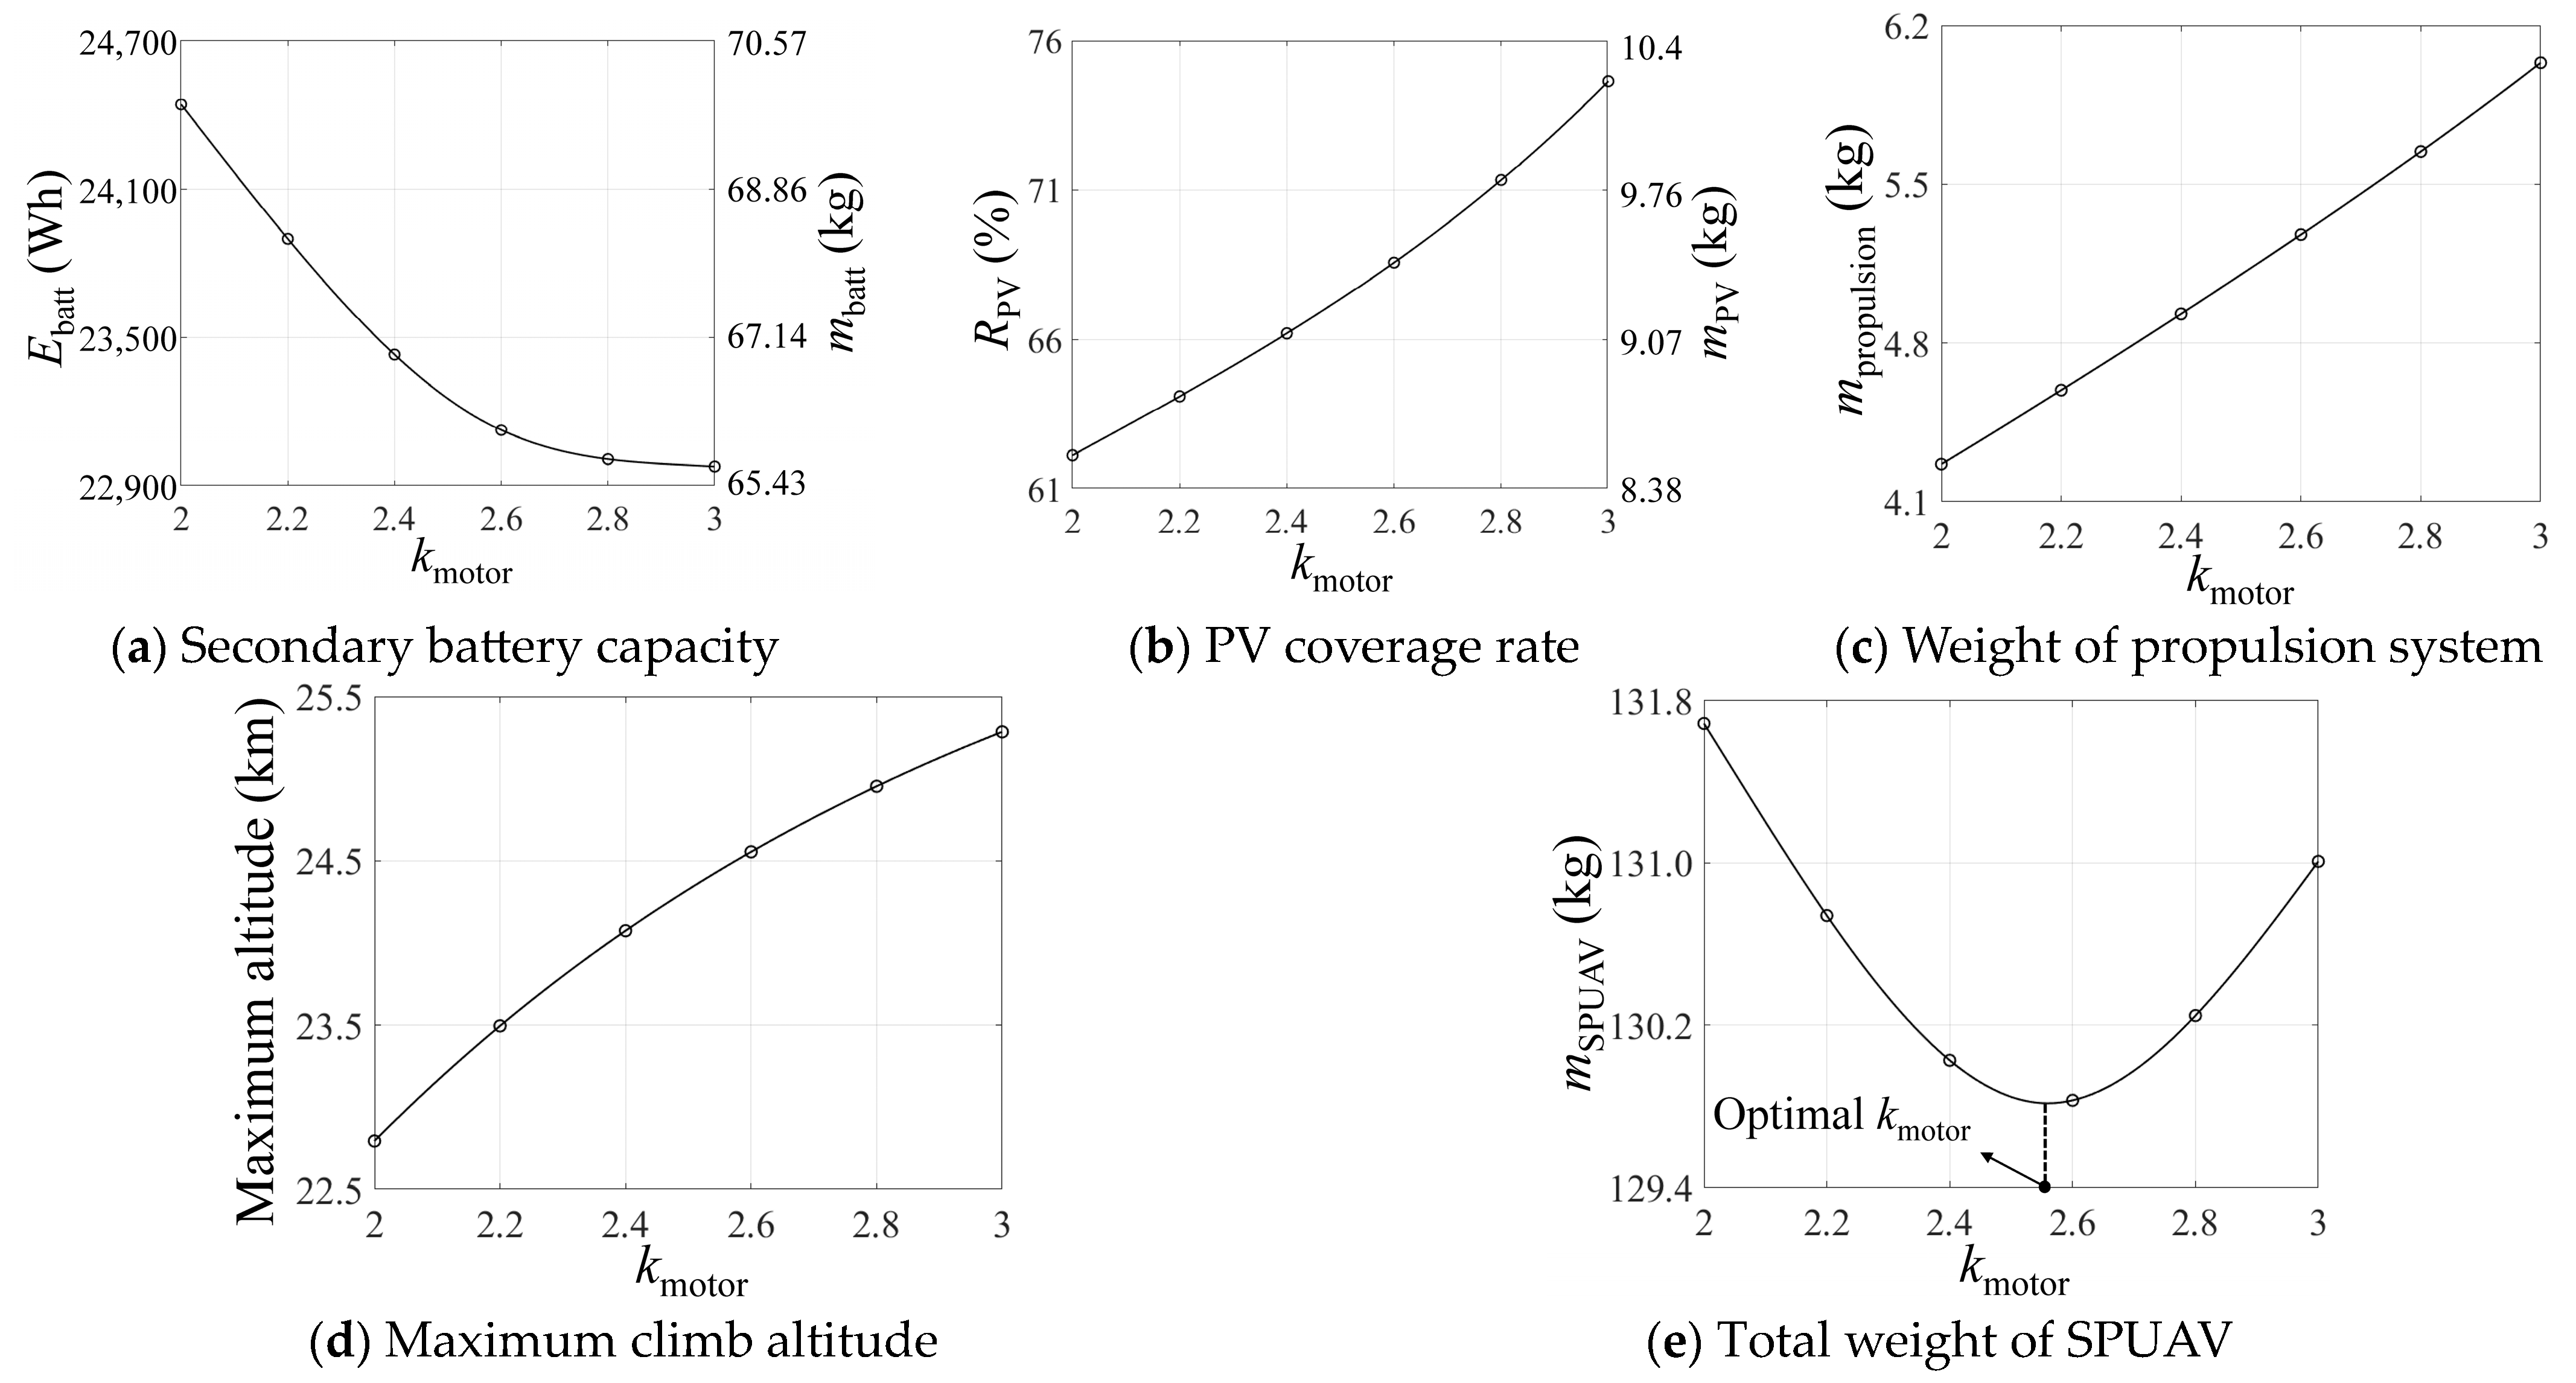
In Figure 23, the motor overload factor kmotor does not exhibit any apparent correlation. In fact, the factors determining the optimal magnitude of kmotor are more complex. The SPUAV converts solar energy into gravitational potential energy through climbing during the day and releases this stored gravitational potential energy at night. This flight strategy can reduce the energy required for overnight flight. The physical significance of kmotor lies in that it determines the climbing power and maximum climb altitude of the SPUAV during the day, thereby affecting the storage and release of gravitational potential energy. Figure 22 depicts that kmotor is relatively larger during the summer in mid-latitude regions. Therefore, we select an arbitrary mission point in this region (taking 30 May at 30° N latitude as an example) and conduct a sensitivity analysis on kmotor.
With the increase of kmotor, the maximum output power of motor also increases, which enables the SPUAV to achieve a higher maximum altitude, as depicted in Figure 24d. This allows the SPUAV to store more gravitational potential energy through climbing during the day, thereby reducing the energy required for nighttime flight. Therefore, a larger kmotor value reduces the need for the secondary battery capacity, as shown in Figure 22a. Moreover, the increased climbing power heightens energy consumption during the climbing stage, thus necessitating larger PV cells, as shown in Figure 24b.
As the maximum climb altitude increases with the rise of kmotor, the decrease in Reynolds number leads to a reduction in the lift–drag ratio of the SPUAV at the corresponding stage. In this case, there is a greater loss during the above-mentioned gravitational potential energy conversion process, and the benefits from the stored gravitational potential energy gradually diminish, which is reflected in the slope changes of the curves in Figure 24a,d. Therefore, as illustrated in Figure 24e, there exists an optimal value for kmotor that is conducive to minimizing the overall weight of the SPUAV.
Additionally, in some other regions, the optimal kmotor tends to approach its lower bound. On the one hand, in regions proximal to the poles, the short nights markedly lessen the energy required for nighttime flight and decrease the reliance on the gravitational energy storage. On the other hand, in the vicinity of the feasible mission region boundaries, the optimal kmotor is also relatively small. The solar energy is always scarce in these regions, and the PV coverage rate has already approached the upper limit to harness all potential solar absorption capacity. However, an increase in kmotor would lead to a higher energy consumption by the SPUAV, necessitating a greater PV coverage rate. The contradiction between these two factors constrains kmotor to a value close to the lower limit. This is reflected in the similarity in the distribution patterns of the red regions in Figure 21a and the blue regions in Figure 21d within the mid-latitude and low-latitude regions (from 60° S to 60° N).

4. Conclusions

This paper develops a high-fidelity hybrid design framework for the energy and propulsion systems of the SPUAV that integrates the effects of the propeller slipstream. The aim is to consider the influence of the slipstream at the top-level design stage of the SPUAV, thereby facilitating more accurate and reliable designs. The proposed method involves multidisciplinary models, including energy, propulsion, environment, and aerodynamics. The effectiveness of this design framework is validated on a 30-m wingspan SPUAV, and the following conclusions are obtained:
(1)
The propeller slipstream results in a maximum reduction of the lift–drag ratio for the SPUAV by up to 2.7, with the extent of the reduction depending on the flight stage of the SPUAV. The proposed design framework is capable of accurately quantifying the effects of the propeller slipstream under various flight conditions.
(2)
Traditional SPUAV design methods that ignore the adverse effects of slipstream lead to design results that fail to fulfill the established mission requirements. This oversight results in a contraction of the feasible mission region from 109 days to 46 days for a latitude of 30° N.
(3)
The proposed design framework is able to integrate the effects of the propeller slipstream and provide more rational top-level designs. The results indicate that the proposed method avoids the aforementioned reduction in feasible mission region with an additional weight of about 15.9%. This helps to scientifically allocate design margins for the SPUAV at the top-level design stage.
(4)
Taking the Northern Hemisphere as an example, the feasible mission region for the proposed method spans from 14 April to 28 August across latitudes 13° N to 52° N. In contrast, the feasible mission region for the traditional method spans from 20 May to 23 July, across latitudes 28° N to 41° N. Overall, the area of the feasible mission region for the proposed method is approximately 3.3 times larger than that of the traditional method.
(5)
Employing the proposed design framework for the secondary configuration of the energy and propulsion systems can further expand the feasible mission region to 2.5 times its original size without necessitating changes to the aerodynamic shape of the SPUAV. This improves the applicability of the SPUAV to a wide range of mission scenarios.
(6)
The variation trends in optimal design solutions across the entire mission region are explored. The results reveal that differences in the duration and total amount of solar radiation at different mission points lead to variations in the optimal design solutions.
(a)
The optimal PV coverage rate is negatively correlated with the duration and total amount of solar radiation. In polar regions with extended daylight, the coverage ratio only needs to be around 20%, while near the boundary of the feasible mission region, the coverage ratio reaches the upper limit (80%).
(b)
The function of the secondary battery is to provide the energy required for nighttime flight. Therefore, the optimal battery capacity mainly depends on the duration of solar radiation and is not significantly related to the total amount of solar radiation. In low-latitude regions, where solar radiation duration is approximately 12 h, secondary batteries with a capacity exceeding 30,000 Wh are required. In high-latitude regions, the presence of continuous daylight significantly reduces the battery capacity requirement to below 10,000 Wh.
(c)
The propeller diameter not only determines the efficiency of the propulsion system but also affects the lift–drag characteristics of the SPUAV. The optimal propeller diameter, which ranges between 1.34 m and 1.44 m, is the result of balancing multiple factors, with the aim of minimizing the total power consumption of the system. As the total weight of the SPUAV increases, the optimal propeller diameter also increases.
(d)
The motor overload factor is a critical parameter that determines the climb rate and maximum climb altitude of the SPUAV. A larger motor overload factor enables more gravitational potential energy to be stored during the day, thus reducing the need for secondary battery capacity. However, it also leads to an increase in the weight of the PV cells and propulsion system. An appropriate motor overload factor can lead to a maximum reduction of approximately 1.9 kg in the overall weight of the SPUAV.
This research delves into the physical mechanisms underlying the optimal design. The associated analysis provides insights into the trade-offs required for the design of the SPUAV, and the conclusions can provide valuable engineering references for the SPUAV to achieve uninterrupted flight in the stratosphere.
In the current study, although we use high-fidelity CFD simulations to assess the effects of the propeller slipstream, real-world environments are often much more complex. For example, the SPUAV flights do not always operate under steady-state conditions. How to account for atmospheric turbulence and unpredictable environmental conditions in the simulations still requires further research [50]. Additionally, several factors may introduce errors into the simulations, such as changes in the aerodynamic shape of the SUAV caused by static aeroelasticity and the vibration of flexible skin. Developing methods to correctly predict and quantify the impact of these factors during the top-level design stage is also one of the key areas and directions of the future research. Moreover, we plan to conduct further high-altitude, long-endurance flight tests of the SPUAV to verify some of our design concepts for the SPUAV.

Author Contributions

Conceptualization, X.Y., L.Z. and Y.Y.; methodology, X.Y. and Y.Y.; validation, X.Y., D.M. and L.Z.; writing—original draft preparation, X.Y.; writing—review and editing, L.Z., H.G. and Y.Y.; visualization, X.Y.; project administration, D.M. and F.L. All authors have read and agreed to the published version of the manuscript.

Funding

This research received no external funding.

Data Availability Statement

The data are contained within the article.

Conflicts of Interest

The authors declare no conflicts of interest.

References

  1. Abbe, G.; Smith, H. Technological development trends in Solar-powered Aircraft Systems. Renew. Sustain. Energy Rev. 2016, 60, 770–783. [Google Scholar] [CrossRef]
  2. Noth, A. Design of Solar Powered Airplanes for Continuous Flight. Ph.D. Dissertation, Swiss Federal Institute of Technology, Zurich, Switzerland, 2008. [Google Scholar]
  3. Li, X.H.; Sun, K.J.; Li, F. General optimal design of solar-powered unmanned aerial vehicle for priority considering propulsion system. Chin. J. Aeronaut. 2020, 33, 2176–2188. [Google Scholar] [CrossRef]
  4. Bakar, A.; Ke, L.; Liu, H.B.; Xu, Z.Q.; Wen, D.S. Design of low altitude long endurance solar-powered UAV using genetic algorithm. Aerospace 2021, 8, 228. [Google Scholar] [CrossRef]
  5. Wu, M.J.; Shi, Z.W.; Ang, H.S.; Xiao, T.H. Theoretical study on energy performance of a stratospheric solar aircraft with optimum Λ-shaped rotatable wing. Aerosp. Sci. Technol. 2020, 98, 105670. [Google Scholar] [CrossRef]
  6. Turk, I.; Ozbek, E.; Ekici, S.; Karakoc, T.H. A conceptual design of a solar powered UAV and assessment for continental climate flight conditions. Int. J. Green Energy 2022, 19, 638–648. [Google Scholar] [CrossRef]
  7. Hwang, H.; Cha, J.; Ahn, J. Solar UAV design framework for a HALE flight. Aircr. Eng. Aerosp. Technol. 2019, 91, 927–937. [Google Scholar] [CrossRef]
  8. Jiajan, W.; Kampoon, J.; Klongtrujrok, J.; Yuthayanon, I. Conceptual design of tactical solar power UAV. IOP Conf. Ser. Mater. Sci. Eng. 2019, 501, 012011. [Google Scholar] [CrossRef]
  9. Chu, Y.; Ho, C.; Lee, Y.; Li, B. Development of a Solar-Powered Unmanned Aerial Vehicle for Extended Flight Endurance. Drones 2021, 5, 44. [Google Scholar] [CrossRef]
  10. Zhu, X.F.; Guo, Z.; Hou, Z.X.; Gao, X.Z.; Zhang, J.T. Parameter’s sensitivity analysis and design optimization of solar-powered airplanes. Aircr. Eng. Aerosp. Technol. 2016, 88, 550–560. [Google Scholar] [CrossRef]
  11. Cao, X.; Liu, L. State-of-Charge Trajectory Planning for Low-Altitude Solar-Powered Convertible UAV by Driven Modes. Drones 2024, 8, 80. [Google Scholar] [CrossRef]
  12. Xiang, J.W.; Kan, Z.; Shao, H.Y.; Li, H.D.; Dong, X.; Li, D.C. A review of key technologies for long-endurance unmanned vehicle. J. Harbin. Inst. Technol. 2020, 52, 57–77. (In Chinese) [Google Scholar]
  13. Nam, T. A Generalized Sizing Method for Revolutionary Concepts under Probabilistic Design Constraints. PhD Dissertation, Georgia Institute of Technology, Atlanta, GA, USA, 2007. [Google Scholar]
  14. Wang, K.L.; Zhou, Z.; Zhu, X.P.; Xu, X.P. Aerodynamic design of multi-propeller/wing integration at low Reynolds numbers. Aerosp. Sci. Technol. 2019, 84, 1–17. [Google Scholar] [CrossRef]
  15. Sun, K.J.; Bao, X.X.; Fu, Y.W. Low Reynolds number propeller slipstream interference with wing aerodynamic characteristics. Adv. Aeronaut. Sci. Eng. 2018, 9, 577–584+622. (In Chinese) [Google Scholar]
  16. Jin, W.; Lee, Y.G. Drag reduction design for a long-endurance electric powered UAV. Int. J. Aeronaut. Space. Sci. 2015, 16, 311–324. [Google Scholar] [CrossRef]
  17. Jia, Z.; Zhou, Z.; Zhuang, S. Design and Parameters Analysis of a Solar Powered UAV for Extended Endurance. Asia-Pac. Int. Symp. Aerosp. Technol. 2023, 1050, 1742–1750. [Google Scholar]
  18. Shashati, M.; Zeyoudi, S.A.; Khatib, O.A.; Hakim, A.; Aasim, W.F.A.W.; Okasha, M.; Dief, T.N. Design and Fabrication of a Solar Powered Unmanned Aerial Vehicle (UAV). In Proceedings of the 2023 Advances in Science and Engineering Technology International Conferences (ASET), Dubai, United Arab Emirates, 20–23 February 2023; pp. 1–10. [Google Scholar]
  19. Wang, Y.C.; Sun, K.W.; Liu, S.Y.; Tian, Y.L.; Liang, H.Q. Overall parameter design method and sensitivity analysis for solar aircraft. J. Phys. Conf. Ser. 2024, 2820, 012011. [Google Scholar] [CrossRef]
  20. İlhan, C.; Çalık, Z. Solar-powered UAV: A novel approach to conceptual design. Konya J. Eng. Sci. 2024, 12, 396–409. [Google Scholar] [CrossRef]
  21. Ni, W.J.; Bi, Y.; Wu, D.; Ma, X.P. Energy-optimal trajectory planning for solar-powered aircraft using soft actor-critic. Chin. J. Aeronaut. 2022, 35, 337–353. [Google Scholar] [CrossRef]
  22. Betz, A.; Prandtl, L. Schraubenpropeller mit geringstem energieverslust. Goettinger Na-Chrichten 1919, 3, 193–217. [Google Scholar]
  23. Traub, L.W. Considerations in Optimal Propeller Design. J. Aircr. 2021, 58, 950–957. [Google Scholar] [CrossRef]
  24. Harmats, M.; Weihs, D. Hybrid-Propulsion High-Altitude Long-Endurance Remotely Piloted Vehicle. J. Aircr. 1999, 36, 321–331. [Google Scholar] [CrossRef]
  25. Menéndez Arán, D.H.; Kinnas, S.A. On fully aligned lifting line model for propellers: An assessment of betz condition. J. Ship Res. 2014, 58, 130–145. [Google Scholar] [CrossRef]
  26. Kuitche, M.A.J.; Botez, R.M.; Viso, R.; Maunand, J.C.; Moyao, O.C. Blade element momentum new methodology and wind tunnel test performance evaluation for the UAS-S45 Bàlaam propeller. CEAS Aeronaut. J. 2020, 11, 937–953. [Google Scholar] [CrossRef]
  27. Mascarenhas, C.A.; Anderson, J.G.; Langford, J.S. Solar-powered aircraft-configuration design optimization based on propulsion system mass and efficiency characterization. In Proceedings of the AIAA AVIATION 2021 FORUM, Virtual Event, 2–6 August 2021; p. 2416. [Google Scholar]
  28. Second-Order DC Electric Motor Model. Available online: https://web.mit.edu/drela/Public/web/qprop/motor2_theory.pdf (accessed on 28 August 2024).
  29. Zhang, X.T. Research on High Efficiency and High Torque Density Permanent Magnet Synchronous Motor of Solar Unmanned Aerial Vehicle. Master Dissertation, Harbin Institute of Technology, Harbin, China, 2018. (In Chinese). [Google Scholar]
  30. Langtry, R.B. A Correlation-Based Transition Model Using Local Variables for Un-Structured Parallelized Cfd Codes. Ph.D. Dissertation, Universität Stuttgart, Stuttgart, Germany, 2006. [Google Scholar]
  31. Menter, F.R.; Langtry, R.B.; Likki, S.R.; Suzen, Y.B.; Huang, P.G.; Völker, S. A correlation-based transition model using local variables—Part i: Model formulation. J. Turbomach. 2006, 128, 413–422. [Google Scholar] [CrossRef]
  32. Langtry, R.B.; Menter, F.R.; Likki, S.R.; Suzen, Y.B.; Huang, P.G.; Völker, S. A correlation-based transition model using local variables—Part ii: Test cases and industrial applications. J. Turbomach. 2006, 128, 423–434. [Google Scholar] [CrossRef]
  33. Chen, L.L.; Guo, Z.; Deng, X.L.; Hou, Z.X. Aerodynamic performance and transition prediction of low-speed fixed-wing unmanned aerial vehicles in full configuration based on improved γR model. Aerosp. Sci. Technol. 2020, 107, 106281. [Google Scholar] [CrossRef]
  34. Wang, K.L.; Zhou, Z.; Fan, Z.Y.; Guo, J.H. Aerodynamic design of tractor propeller for high-performance distributed electric propulsion aircraft. Chin. J. Aeronaut. 2021, 34, 20–35. [Google Scholar] [CrossRef]
  35. Turnock, S.R.; Phillips, A.B.; Banks, J.; Nicholls-Lee, R. Modelling tidal current turbine wakes using a coupled RANS-BEMT approach as a tool for analysing power capture of arrays of turbines. Ocean Eng. 2011, 38, 1300–1307. [Google Scholar] [CrossRef]
  36. Burton, T.; Jenkins, N.; Sharpe, D.; Bossanyi, E. Wind Energy Handbook, 1st ed.; John Wiley & Sons: New York, NY, USA, 2011. [Google Scholar]
  37. McKee, J.W.; Naeseth, R.L. Experimental Investigation of the Drag of Flat Plates and Cylinders in the Slipstream of a Hovering Rotor; NACA: Washington, DC, USA, 1958; Report No.: NACA-TN-4239. [Google Scholar]
  38. Li, H.D.; Liu, Y.L.; Li, D.C.; Bie, D.W.; Kan, Z. Ground Test and Numerical Simulation of Aerodynamic Interference of the Marsupial UAS. Aerospace 2023, 10, 175. [Google Scholar] [CrossRef]
  39. McKay, M.D.; Conover, W.J.; Beckman, R.J. Latin Hypercube Sampling: A Comparison of Three Methods for Selecting Values of Input Variables in the Analysis of Output from a Computer Code. Technometrics 1979, 21, 239–245. [Google Scholar]
  40. Rigoni, E.; Poles, S. NBI and MOGA-II, two complementary algorithms for Multi-Objective optimizations. In Dagstuhl Seminar Proceedings; Schloss Dagstuhl-Leibniz-Zentrum für Informatik: Wadern, Germany, 2005. [Google Scholar]
  41. Zhang, L.; Ma, D.L.; Yang, M.Q.; Xia, X.L.; Yao, Y. Optimization and analysis of composite sandwich box beam for solar drones. Chin. J. Aeronaut. 2021, 34, 148–165. [Google Scholar] [CrossRef]
  42. Dan Foresee, F.; Hagan, M.T. Gauss-Newton approximation to Bayesian learning. Proc. Int. Jt. Conf. Neural Netw. 1997, 3, 1930–1935. [Google Scholar]
  43. Aminaei, H.; Dehgan Manshadi, M.; Mostofizadeh, A.R. Experimental investigation of propeller slipstream effects on the wing aerodynamics and boundary layer treatment at low Reynolds number. Proc. Inst. Mech. Eng. Part G J. Aerosp. Eng. 2019, 233, 3033–3041. [Google Scholar] [CrossRef]
  44. Cornwell-Arquitt, L.A.; Curtis, C.G.; Albertani, R. Design, Manufacturing, and Testing of a Propeller for Solar-Powered Unmanned Aerial Vehicles. In Proceedings of the 2023 Regional Student Conferences, Multiple Locations, 1 January 2023; p. 72204. [Google Scholar]
  45. Pholdee, N.; Bureerat, S.; Nuantong, W.; Pongsatitpat, B. Kriging Surrogate-based Optimization for Shape Design of Thin Electric Propeller. J. Eng. Technol. Sci. 2024, 56, 404–413. [Google Scholar] [CrossRef]
  46. Ananda, G.K.; Selig, M.S.; Deters, R.W. Experiments of propeller-induced flow effects on a low-Reynolds-number wing. AIAA J. 2018, 56, 3279–3294. [Google Scholar] [CrossRef]
  47. Ikami, T.; Fujita, K.; Nagai, H. Low-Reynolds-number flowfield of wing with control surface in propeller slipstream. J. Aircr. 2021, 58, 228–235. [Google Scholar] [CrossRef]
  48. Shin, K.; Hwang, H.; Ahn, J. Mission analysis of solar UAV for high-altitude long-endurance flight. J. Aerosp. Eng. 2018, 31, 04018010. [Google Scholar] [CrossRef]
  49. Guo, Q.; Qiu, M.H.; Li, X.Q.; Sun, W.; Guo, Z.H. Integrated Design and Flight Validation of Solar-Powered Unmanned Aerial Vehicle (UAV) Structure and Propulsion System. Energies 2023, 16, 7110. [Google Scholar] [CrossRef]
  50. Hayal, M.R.; Elsayed, E.E.; Kakati, D.; Singh, M.; Elfikky, A.; Boghdady, A.I.; Grover, A.; Mehta, S.; Mohsan, S.A.H.; Nurhidayat, I. Modeling and investigation on the performance enhancement of hovering UAV-based FSO relay optical wireless communication systems under pointing errors and atmospheric turbulence effects. Opt. Quantum Electron. 2023, 55, 625. [Google Scholar] [CrossRef]
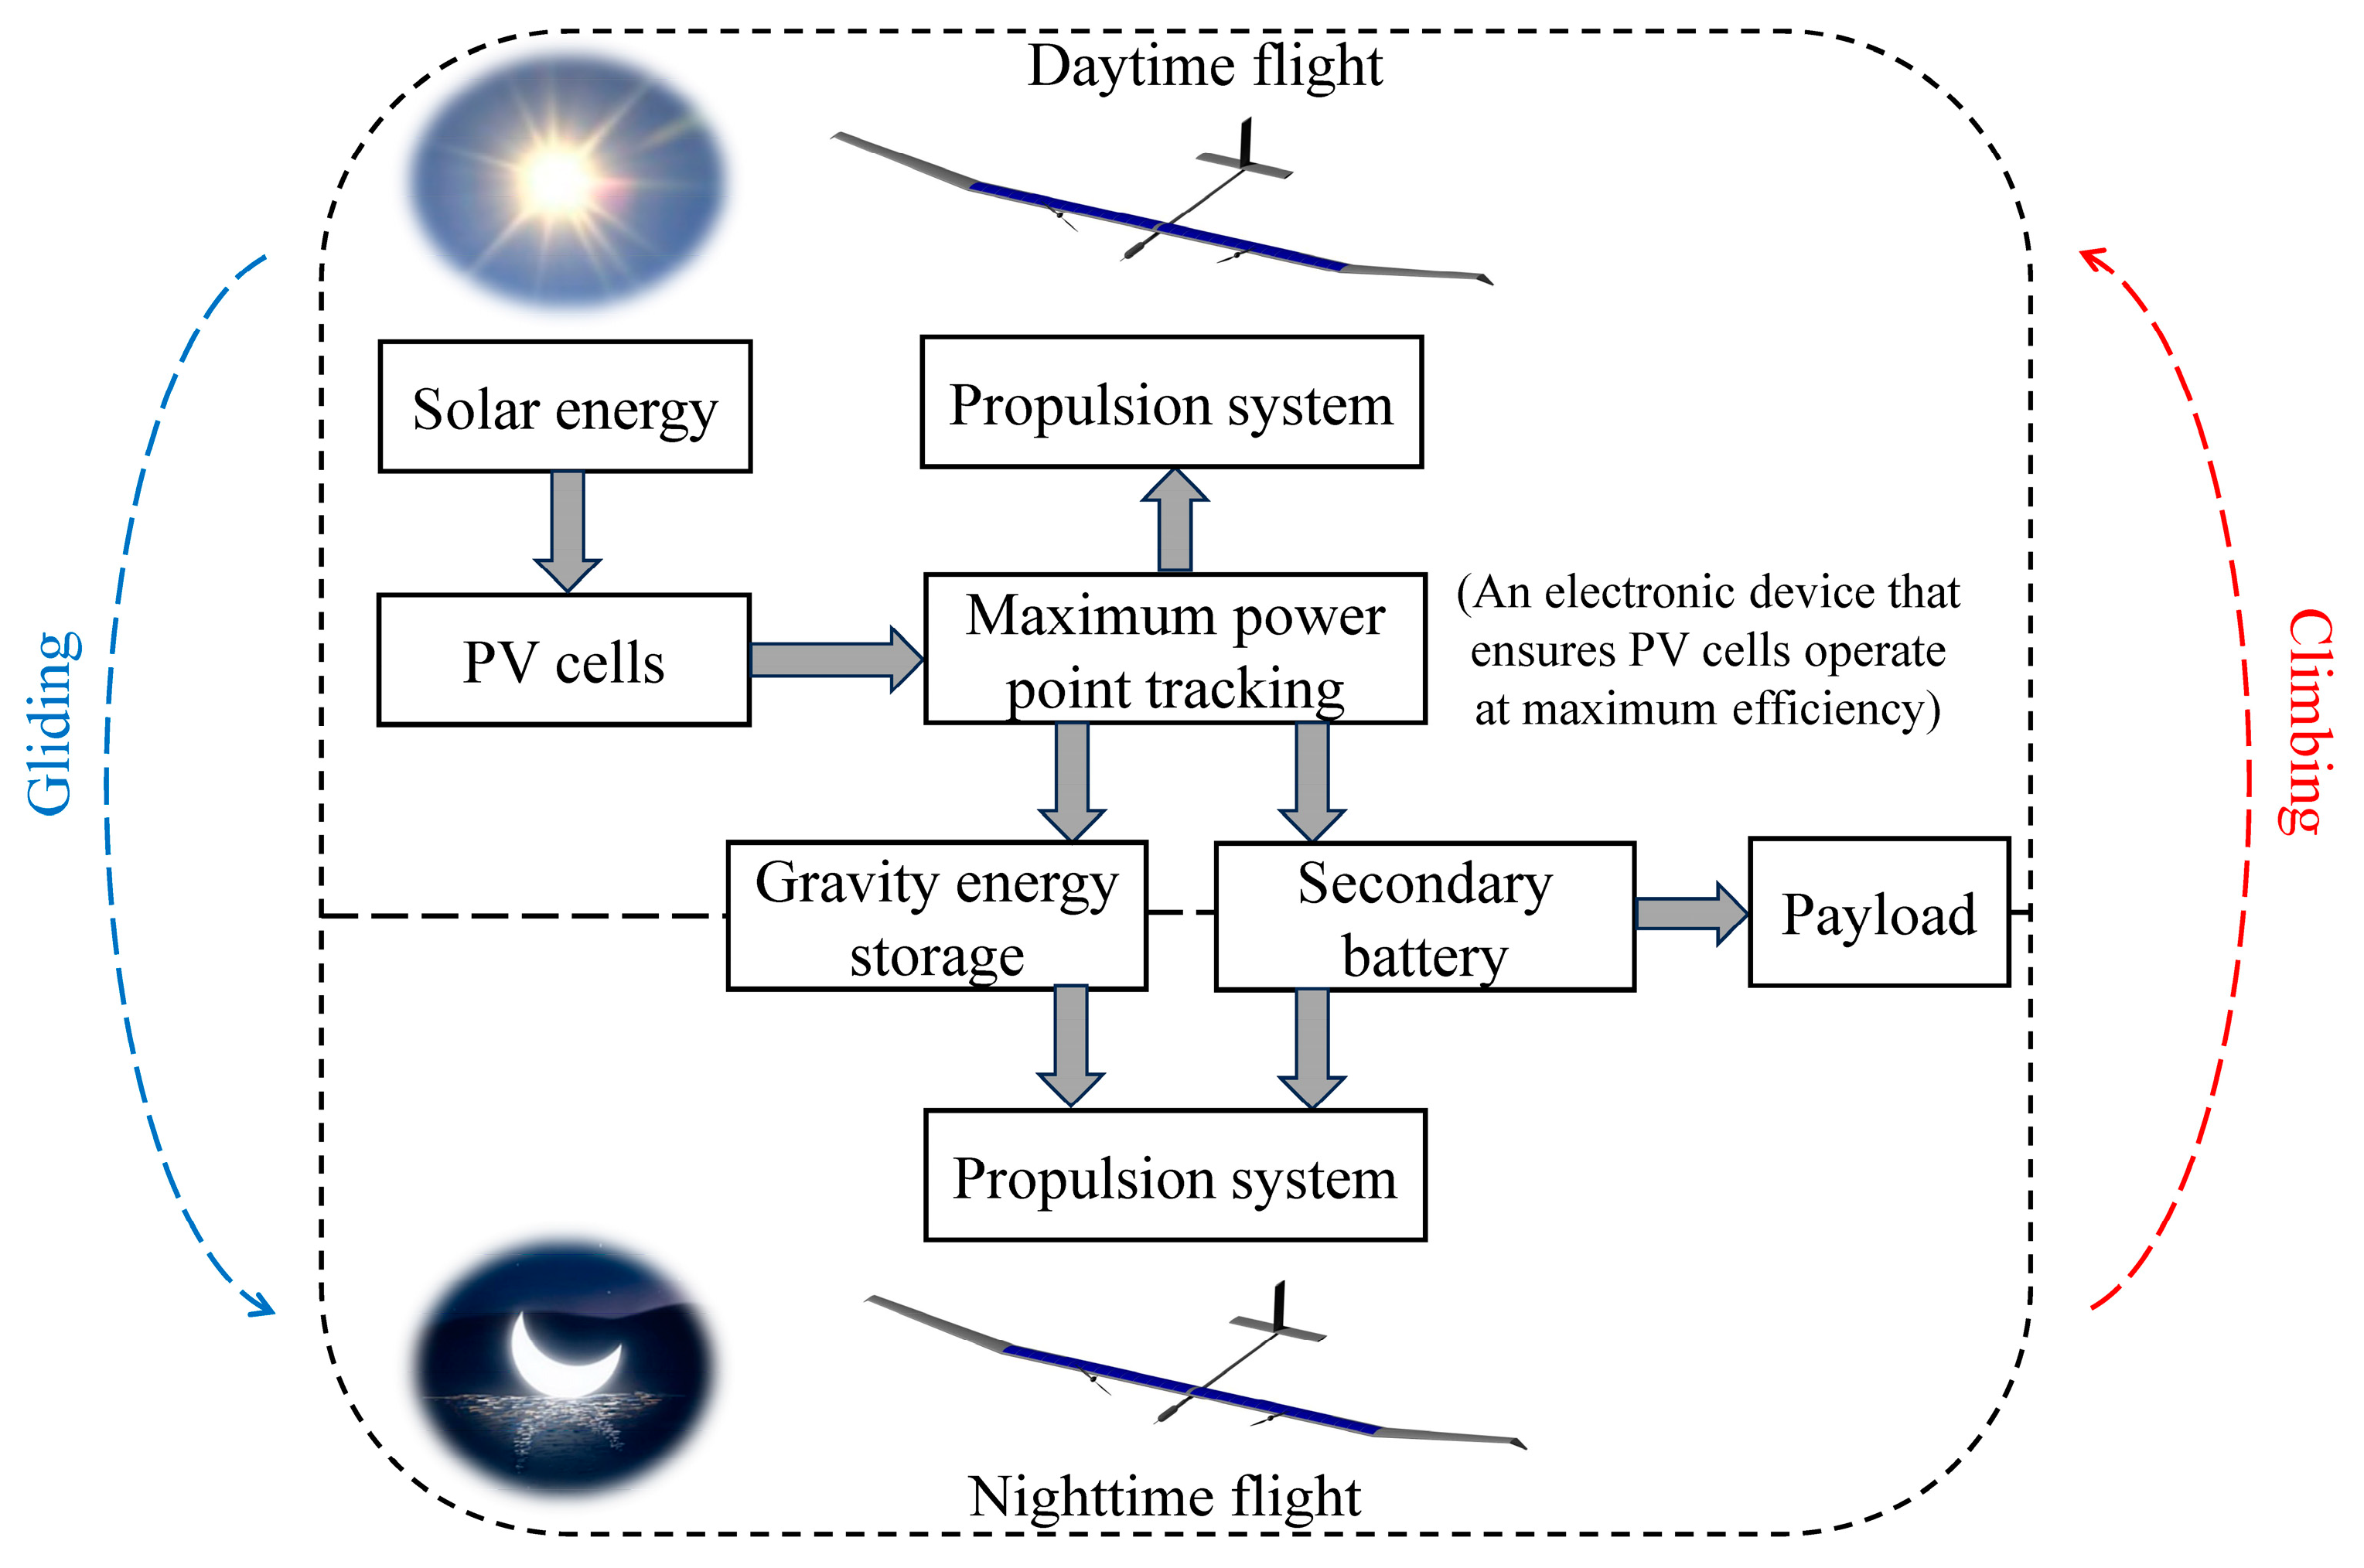
Figure 1. Energy transmission path of the SPUAV.
Drones 08 00584 g001
Figure 2. Simplified flowchart of the design framework.
Drones 08 00584 g002
Figure 3. The energy and propulsion systems of the SPUAV.
Drones 08 00584 g003
Figure 4. Technical parameters of energy and propulsion systems.
Drones 08 00584 g004
Figure 5. Local flow velocity and aerodynamic force component of the propeller.
Drones 08 00584 g005
Figure 6. Computational model of the rotor case.
Drones 08 00584 g006
Figure 7. Radial distribution of dynamic pressure.
Drones 08 00584 g007
Figure 8. The process of constructing the DNN model through an adaptive sequential sampling method based on k-fold cross-validation.
Drones 08 00584 g008
Figure 9. The optimal design framework integrating propeller slipstream effects.
Drones 08 00584 g009
Figure 10. Digital model of the SPUAV.
Drones 08 00584 g010
Figure 11. Comparison between the predicted values from DNN model and the observed values from CFD.
Drones 08 00584 g011
Figure 12. Violin plots about the distribution of the absolute percentage error.
Drones 08 00584 g012
Figure 13. Variation in the system performance with respect to the propeller diameter.
Drones 08 00584 g013
Figure 14. Local lift and drag distribution along the half-span of the wing.
Drones 08 00584 g014
Figure 15. Pressure coefficient distribution on the wing surface in the region affected by slipstream.
Drones 08 00584 g015
Figure 16. Variation in the propulsion system input power with respect to the propeller diameter.
Drones 08 00584 g016
Figure 17. The time-varying state parameters spectrum of the SPUAV throughout a day.
Drones 08 00584 g017
Figure 18. Comparison of the feasible mission region generated by different methods.
Drones 08 00584 g018
Figure 19. Comparison of the feasible mission region before and after retrofit design.
Drones 08 00584 g019
Figure 20. Total weight distribution of the optimal designs.
Drones 08 00584 g020
Figure 21. Distribution of the optimal designs within the feasible mission region.
Drones 08 00584 g021aDrones 08 00584 g021b
Figure 22. Variation of the solar radiation conditions with mission points.
Drones 08 00584 g022
Figure 23. Correlation coefficients between design variables and different factors.
Drones 08 00584 g023
Figure 24. Sensitivity analysis for the SPUAV with respect to the motor overload factor.
Drones 08 00584 g024
Table 1. Detailed parameters of the SPUAV.
ParametersValue
aerodynamic parameterswingspan30 m
wing area34.35 m2
cruising altitude16–23 km
Reynolds number2 × 105–3 × 10⁵
PV cellsconversion Efficiency28%
surface density0.4 kg/m2
secondary batteriesdischarge depth90%
energy density350 Wh/kg
Table 2. Comparison between the design results of the two methods.
Traditional MethodNew Method
propeller diameter (m)1.681.43
motor overload factor2.232.00
secondary battery capacity (Wh)24,14930,575
PV coverage rate (%)65.280.0
total weight of SPUAV (kg)131.49152.42
Table 3. Comparison between the aerodynamic parameters before and after considering slipstream.
Aerodynamic Parameters
of the SPUAV
Before Considering
Slipstream
After Considering
Slipstream
lift coefficient0.8390.858
drag coefficient0.02410.0267
lift–drag ratio34.832.1
Disclaimer/Publisher’s Note: The statements, opinions and data contained in all publications are solely those of the individual author(s) and contributor(s) and not of MDPI and/or the editor(s). MDPI and/or the editor(s) disclaim responsibility for any injury to people or property resulting from any ideas, methods, instructions or products referred to in the content.