Article

Drone Insights: Unveiling Beach Usage through AI-Powered People Counting

by
César Herrera
1,*,
Rod M. Connolly
1,
Jasmine A. Rasmussen
1,
Gerrard McNamara
1,
Thomas P. Murray
1,
Sebastian Lopez-Marcano
1,
Matthew Moore
2,
Max D. Campbell
1 and
Fernando Alvarez
2
1
Coastal and Marine Research Centre, Australian Rivers Institute, School of Environment and Science, Griffith University, Gold Coast, QLD 4222, Australia
2
Infrastructure Lifecycle, Planning and Performance, City of Gold Coast, Gold Coast, QLD 9726, Australia
*
Author to whom correspondence should be addressed.
Drones 2024, 8(10), 579; https://doi.org/10.3390/drones8100579
Submission received: 5 September 2024 / Revised: 4 October 2024 / Accepted: 9 October 2024 / Published: 13 October 2024

Abstract

:
Ocean beaches are a major recreational attraction in many coastal cities, requiring accurate visitor counts for infrastructure planning and value estimation. We developed a novel method to assess beach usage on the Gold Coast, Australia, using 507 drone surveys across 24 beaches. The surveys covered 30 km of coastline, accounting for different seasons, times of day, and environmental conditions. Two AI models were employed: one for counting people on land and in water (91–95% accuracy), and another for identifying usage types (85–92% accuracy). Using drone data, we estimated annual beach usage at 34 million people in 2022/23, with 55% on land and 45% in water—approximately double the most recent estimate from lifeguard counts, which are spatially limited and prone to human error. When applying similar restrictions as lifeguard surveys, drone data estimated 15 million visits, aligning closely with lifeguard counts (within 9%). Temporal (time of day, day of the week, season) and spatial (beach location) factors were the strongest predictors of beach usage, with additional patterns explained by weather variables. Our method, combining drones with AI, enhances the coverage, accuracy, and granularity of beach monitoring, offering a scalable, cost-effective solution for long-term usage assessment.

1. Introduction

Sandy beaches comprise one third of the global coastline [1] and provide many economic, ecological, and cultural values contributing to human health and well-being [2,3,4]. They can also represent a hazard for visitors due to risk of injury or drowning associated with beach rips, high-energy waves, tides, and other causes [5,6,7,8]. Hence, the management of beaches and associated infrastructure to support ongoing sustainable and safe usage is important for ensuring and fulfilling increasing beach usage demands [9,10,11]. Understanding variability in beach usage patterns is also critical for planning current and future maintenance and infrastructure requirements. In 2021, the collection of human usage data was identified as a top research priority by the coastal geoscience community in Australia [12]. Therefore, obtaining accurate information about the human use of sandy beaches in well-developed urban areas is a key component of beach management [12,13,14].
Assessing the number of beach visitors is a challenging task because it requires a reliable and consistent source of visitor counts over space and time, characterized by a defined and constant level of precision and accuracy. Counting the number of beach visitors, and sometimes their usage type, has conventionally been undertaken using on-ground headcount surveys by personnel patrolling beaches [13,15]. However, on-ground headcounts are inaccurate and imprecise [16,17] (but note the findings of [18]). Counts have also been made from semi-permanent fixed-cameras [11,19,20,21,22] and aerial surveys with piloted aircrafts [23,24]. More recently, the advent of drone-based camera surveys has been demonstrated as a flexible and potentially efficient survey method capable of accurately and repeatably counting visitors by usage type [25].
The efficiency and flexibility of drone surveys is, however, tempered by the sheer quantity of video imagery required to be processed (e.g., [26]). This processing bottleneck of manual data extraction from videos is a broader challenge for surveys in a wide variety of sectors, as diverse as healthcare and wildlife monitoring [26,27,28,29]. Underpinned by deep learning algorithms and increasing computing efficiency, computer vision is removing the barriers to processing vast amounts of imagery [30]. Automated data extraction is now possible through computer vision solutions, offering rapid, consistent, reliable extraction of people and wildlife counts (e.g., [31,32]). Thus, the amalgamation of computer vision and drone advancements has emerged as a new cornerstone for tracking and monitoring people and coastal dynamics with unparalleled detail [33,34,35].
In this study, we combined drone surveys and automated detection of people to provide reliable data on beach usage for the Gold Coast, a tourism-focussed city in Queensland, Australia. Gold Coast is among the fastest growing regions in Australia [36], attracting over AUD 4 billion in tourism expenditure every year [37] and hosting several natural attractions such as its beaches and the World Surfing Reserve [38]. Strong and consistent population growth, changing usage, and beach and surfing tourism are the underlying drivers to perform a detailed quantification of beach use.
Gold Coast beaches are classified as a wave-dominant open coastline [39] with many access points for visitors. The open coastline beaches stretch for a total of 37 km and are grouped into 29 beach compartment units. These 29 compartment units have been defined by the Local Government Authority, the City of Gold Coast, and serve as coastal management units [40] (Figure 1). In this context, sampling the number of beach visitors and the type of activities they engage in presents a challenge due to the expansive nature of the beaches. Consequently, our objective was to develop a cost-effective survey methodology capable of delivering a reliable estimate of visitation and usage on open coastline beaches with a known level of certainty.

2. Materials and Methods

2.1. Drone Flight Planning and Execution

Given the vast expanse of the beaches, we planned a cost-effective drone effort to account for the most significant sources of variation in beach usage. To achieve this, we utilized long-term beach usage data collected daily by professional City of Gold Coast Lifeguards and weekend-volunteer Surf Life Saving Queensland (SLSQ) lifeguards, together with historical weather variables [41]. While the primary focus of lifeguards is to prevent injuries and fatalities and ensure public safety, they also conduct spot counts and monitor usage at 42 designated patrolled areas (i.e., lifeguard towers) throughout the year. It is important to note that lifeguard data collection is not uniform throughout the year and varies based on seasons, time of day, day of the week, and specific beach locations due to different lifeguards working hours. Additionally, the accuracy and precision of their estimates are unknown, as their primary responsibility is public safety rather than providing accurate and precise counts on beach usage. Using historical lifeguard and weather data, we identified spatial and temporal patterns in beach usage whilst accounting for weather variables. This preliminary assessment highlighted five important sources of usage variation: season, weather conditions, temperature, day of the week, and beach location. Accordingly, drone surveys were scheduled to represent these conditions (Tables S1 and S2). However, given the unknown precision and accuracy of lifeguard data, we informed our drone surveys based on these patterns but were careful not to assume they perfectly reflected actual usage.
We conducted 507 aerial surveys across 38 beaches (24 out of 29 compartments, Figure 1) from December 2022 to April 2023 (Table S1) using DJI Mavic Mini and DJI Phantom 4 drones (DJI, Shenzhen, China). Compliance with aviation regulations was maintained, ensuring safe and unobtrusive operations. We excluded certain compartments for safety and regulatory compliance reasons (i.e., proximity to airport, Figure 1). Surveys were evenly distributed across various environmental conditions (Table S2), times, days of week and seasons to capture variations in beach use. Environmental variables including temperature, rain chance, wind speed, and wind direction, were recorded during each survey and use as predictors of beach usage during analysis (Table S2). Sampling was spread across three seasons that referred to the expected level of beach use: high (December to January), medium (February), and low (March to April). The thresholds of these seasons were set based on interrogation of the preliminary modeling of historical lifeguard data and known tourism patterns. Days of the week were classified as weekdays and weekends, and survey times were classified as morning (6 AM–10 AM), noon (10 AM–2 PM), and afternoon (2 PM–6 PM).
The high-resolution videos, geo-tagged for spatial reference, were obtained at altitudes of 20 to 30 m, ensuring minimal disturbance to the public. Multiple surveys (usually two, sometimes three) could be completed on a same flight depending on their proximity, with a typical flight lasting less than 20 min. The camera recorded at pitch angles ranging from 15 to 70 degrees from the ground parallel. Videos were recorded in HD resolution (1920 × 1080 pixels) at 30 frames per second (FPS).

2.2. Automated Data Extraction from Videos—Model Development

We developed two AI models for automated people count and usage data extraction from drone videos. The Land–Water model classified people into two categories: on land or in water. The Usage model further categorized people based on beach activities (Table 1). Both models were also trained to detect shelters like cabanas and umbrellas which are often used by beachgoers as sun cover. Ground-truth labels were manually added to images from drone videos (Figure 1c), with 35,289 total labels split across training (51%), evaluation (9%), and testing (40%) datasets (Table 1). For the Usage model, people were categorized into anglers, kite surfers, people resting, runners/walkers, surfers, and swimmers. Ground-truth labels were re-encoded into two categories for the Land–Water model. Training datasets covered diverse date–time and environmental conditions, ensuring model generalization, while evaluation and testing datasets allowed for fine-tuning and assessment of performance, respectively.
For object detection we employed a deep learning single-shot detector model YOLOv5; [42], consisting of a CSP-Darknet53 backbone, a Spatial Pyramid Pooling-Fast (SPP) neck, and a YOLOv3 head trained on the COCO dataset [43,44,45,46]. Model initialization used pre-trained weights, followed by custom dataset training with augmentation for improved performance and generalizability. To prevent overfitting, we implemented early stopping [47,48,49] and evaluated the model on an evaluation dataset. Model optimization involved fine-tuning hyperparameters and adjusting confidence thresholds for each target class. To mitigate over-hyping, a single test run on an independent dataset was conducted after satisfactory hyperparameter adjustments. All performance metrics are reported against the testing dataset (Table 2). The Land–Water model incorporated a tracking module for position-based tracking and re-identification of people and shelters [50]. All hyperparameters used for training can be found in the repository: https://github.com/globalwetlands/BeachAI (accessed on 8 October 2024).
Model performance assessment utilized three metrics: precision, recall, and F1-score. Calculated per class by comparing predictions to ground-truth labels (i.e., manual bounding box on a beachgoer), precision balances true positives (TP) against false positives (FP, Equation (1)), while recall measures the model’s ability to recover ground-truths (Equation (2)). The F1-score, a weighted average of precision and recall, is calculated using Equation (3). Overall model performance is reported as Mean Average Precision (mAP50; Equation (4)), a metric considering precision, recall, and the Intersection over Union (IoU) method for bounding box overlap between prediction and ground-truth.
P = TP TP + FP
R = TP TP + FN
F 1 = 2 P × R P + R
mAP 50 = 1 N i = 1 N AP i

2.3. Model Predictions

After models were trained, evaluated, and tested, we ran predictions on videos at a scaled resolution of 1280 pixels width, which balanced inference speed and performance. For discarding low-quality predictions, we set a base confidence threshold of 0.1, and IoU threshold of 0.8. After inference was completed, predictions were filtered based on confidence thresholds defined during evaluation and a video stride of 3. During inference, we regularly assessed models’ performance via a manual review of predictions in a randomized fashion. Thus, predictions overlayed on videos were scrutinized for departures from acceptable performance levels. During this process, we identified that people under shelters (e.g., cabanas and umbrellas) or under their shades were consistently less likely to be detected by our models. For this reason, we designed an experiment for allowing us to correct predictions based on the number of shelters on the beach.

2.4. Accounting for People under Beach Shelters

While Australian beaches rarely favor private businesses to serve the public with umbrellas or gazebos, there is an increasing popularity among beachgoers in Australia and elsewhere to use their own cabanas and umbrellas as sun shelter. The use of beach shelters is widespread [51] and represents a challenge for drone-based surveys as these structures can partially or fully occlude people from the drone cameras, potentially leading to an underestimation of counts. To address this, we derived a correction factor from simultaneous drone surveys and ground-level manual counts at high-shelter usage locations (i.e., Main Beach, Tallebudgera Creek, and Kurrawa Beach). Manual counts, specifying shelter types and people beneath, indicated an average of two people per shelter. Predicted counts in the Land–Water model were adjusted using this average. There was a 10% average difference between automated and manual shelter counting (Table S3). Factors contributing to errors included survey area discrepancies—notable in the narrow Tallebudgera Creek beach, potential gaps in shelter diversity representation in the training set and errors during manual counting. Addressing these factors by adding more ground-truths to the training data can enhance accuracy. Nonetheless, our benchmark between manual and automated shelter counting establishes a valuable reference for ongoing improvement efforts.

2.5. Data Visualization and Beach Usage Estimation

To better visualize the number of people at beaches and identify places of high/low density, we created choropleth maps by rasterizing and aggregating inference points into uniform lattices to avoid overplotting and undersampling detections over space [52]. We also used a perceptually uniform color palette that prevents under- and oversaturation, so data scale and variations are preserved in the visualization.
We used a Multi-level Bayesian Generalized Linear Model (GLM) with weak priors to assess the importance of explanatory variables on people count estimates from drone surveys [53]. As we employed two distinct deep learning models to detect multiple categories, each category from each detection model was studied independently. Thus, for each category and for the total people count, GLMs were fitted to extract pertinent information from count patterns and predict the annual use considering relevant explanatory variables. We used a negative binomial distribution with a log link function for modeling people counts (Table S4). This distribution was suitable given the mean to variance relationship in the dataset. The full description of the statistical model and choice of priors are described on Supplementary Material (Table S4), and the statistical model built on Python can be found in the repository: https://github.com/globalwetlands/BeachAI, (accessed on 8 October 2024). We assessed variable importance by quantifying posterior means and credible intervals of coefficients for each predictor. Thus, we recovered parameters associated with each predictor in the model. In addition to the weather variables described previously, we explored the importance of location, compartment, season, and time of the day. We allowed for random intercepts and slopes for location, compartment, and season. For all other variables, we originally hypothesized that changes in their group levels will only be expected on their baseline effects to response variable (i.e., changes on intercept), but upon further exploration and on a single base basis, random slopes were allowed. From these analyses, and for variables with predictive power, we extracted the GLM predictor parameters that allows us to compute the probability of observing specific people counts for combinations of explanatory variables. These parameters were critical for conducting annualized calculations from individual survey estimates over the entire day, season, and year. Thus, our predicted annual estimates were constructed by resampling the parameters’ distributions (n = 4000) and predicting over 365 days. In addition, when a weather variable exhibited high predictive power, we produced 100 estimates over its range of observed values. We conducted prior and posterior predictive checks, including diagnostics of posterior trace convergence for evaluating the adequacy of priors and models, together with Effective Sample Size (ESS) and Watanabe–Akaike Information Criterion (WAIC). Predictors that exhibited high correlation with each other were dropped from statistical models.
We explored the spatial distribution of people around lifeguard towers to identify areas needing additional lifeguard attention. Lifeguard towers’ geographical position was obtained from City of Gold Coast. Geo-referenced detections from video frames were linked to the nearest lifeguard tower based on spatial limits extending from the mid-points of lines connecting neighboring towers. For towers with a single neighbor, we extended the limit on the non-neighboring side by 100 m. Linear distances from detections to their closest tower along the coastline axis were then calculated. The accuracy and precision from calculated detection to lifeguard tower distances depended on several factors, including drone GPS accuracy, gimbal pitch accuracy, and the number of satellites during flight. Geographic validation suggests a conservative interpretation with a 10–30 m margin of error.
Our experimental design employed a systematic approach to sampling that included compartments, seasons, different days, and distinct times of the day (morning, noon, and afternoon). This design enabled us to calculate the total number of beachgoers observed by lifeguards during each of these periods. To avoid the potential for double-counting during surveys, we tracked flight paths and ensured that no single beach was surveyed multiple times on the same day. It is important to note that when deriving annual estimates, we did not assume an average length of stay for beachgoers. Consequently, the estimates for the number of people present at the beach during each period (morning, noon, and afternoon) are treated as independent observations. This approach mirrored the methodology currently employed by lifeguards, who also conduct counts at three distinct times throughout the day. Given this design, our annual estimates should not be interpreted as the number of unique visitors to the beach. Instead, they represent the total number of beachgoers encountered at beaches during the three distinct time periods each day. Therefore, these figures should be understood as an aggregate measure of beach usage as experienced by lifeguards, rather than a count of individual visitors. Furthermore, unlike a traditional time series forecast, which predicts future values based on temporal trends, our model was designed to estimate visitation by incorporating seasonal effects explicitly. Thus, we used historical data to calculate how many high, medium, and low season days are expected annually.

3. Results

3.1. Model Performance

All classes in the Land–Water model performed well, with precision and recall over 90% (Table 2). For the Usage model, classes with the lowest number of ground-truths performed worse than classes with more ground-truth labels. However, precision and recall for all classes were robust at over 80%, with the people resting, runners/walkers, surfers, and shelters classes performing particularly well. Furthermore, the mAP50 values for Land–Water and Usage models were 0.55 and 0.54, respectively, which is on par with the performance of state-of-the-art models trained on very large datasets [54]. Incorrect detections can occur even in well-performing models due to several factors associated with the model architecture and data. False positive and negative instances can arise from errors on the regressor or classifier components of the model architecture (e.g., for anchor-box architectures, see [55]). Inter-class misclassification can also occur due to unusual viewpoints, similarity in classes characteristics, relative size of objects, and the type of background [56,57]. In fact, we observed a slightly higher error classification on two pairs of classes that are semantically similar: runners/walkers and anglers, and surfers and kite surfers. The top-down viewpoint from our surveys marginally disfavored people sitting cross-legged on the resting category. Nonetheless, the performance metrics of the Land–Water and Usage models were satisfactory, and the number of incorrect detections were within an acceptable range.

3.2. Drone Surveys

All of our drone surveys detected individuals, with an average count of 1572 ± 2445 (standard deviation). During low and medium seasons, we observed a higher number of people on weekends, but the pattern reversed during peak season, except in Burleigh Heads and Kurrawa (compartments 15 and 20, respectively, Figure S1). The increased number of beachgoers on weekdays during the peak season suggests that this period attracts more tourists, who visit the beaches outside of typical working hours. Other patterns in beach usage observed in our drone surveys are well-represented in the annual estimates. These patterns, which have been captured and described in detail through the modeling, will be discussed in the following sections for avoiding redundancy in the results.

3.3. Annualized Estimates

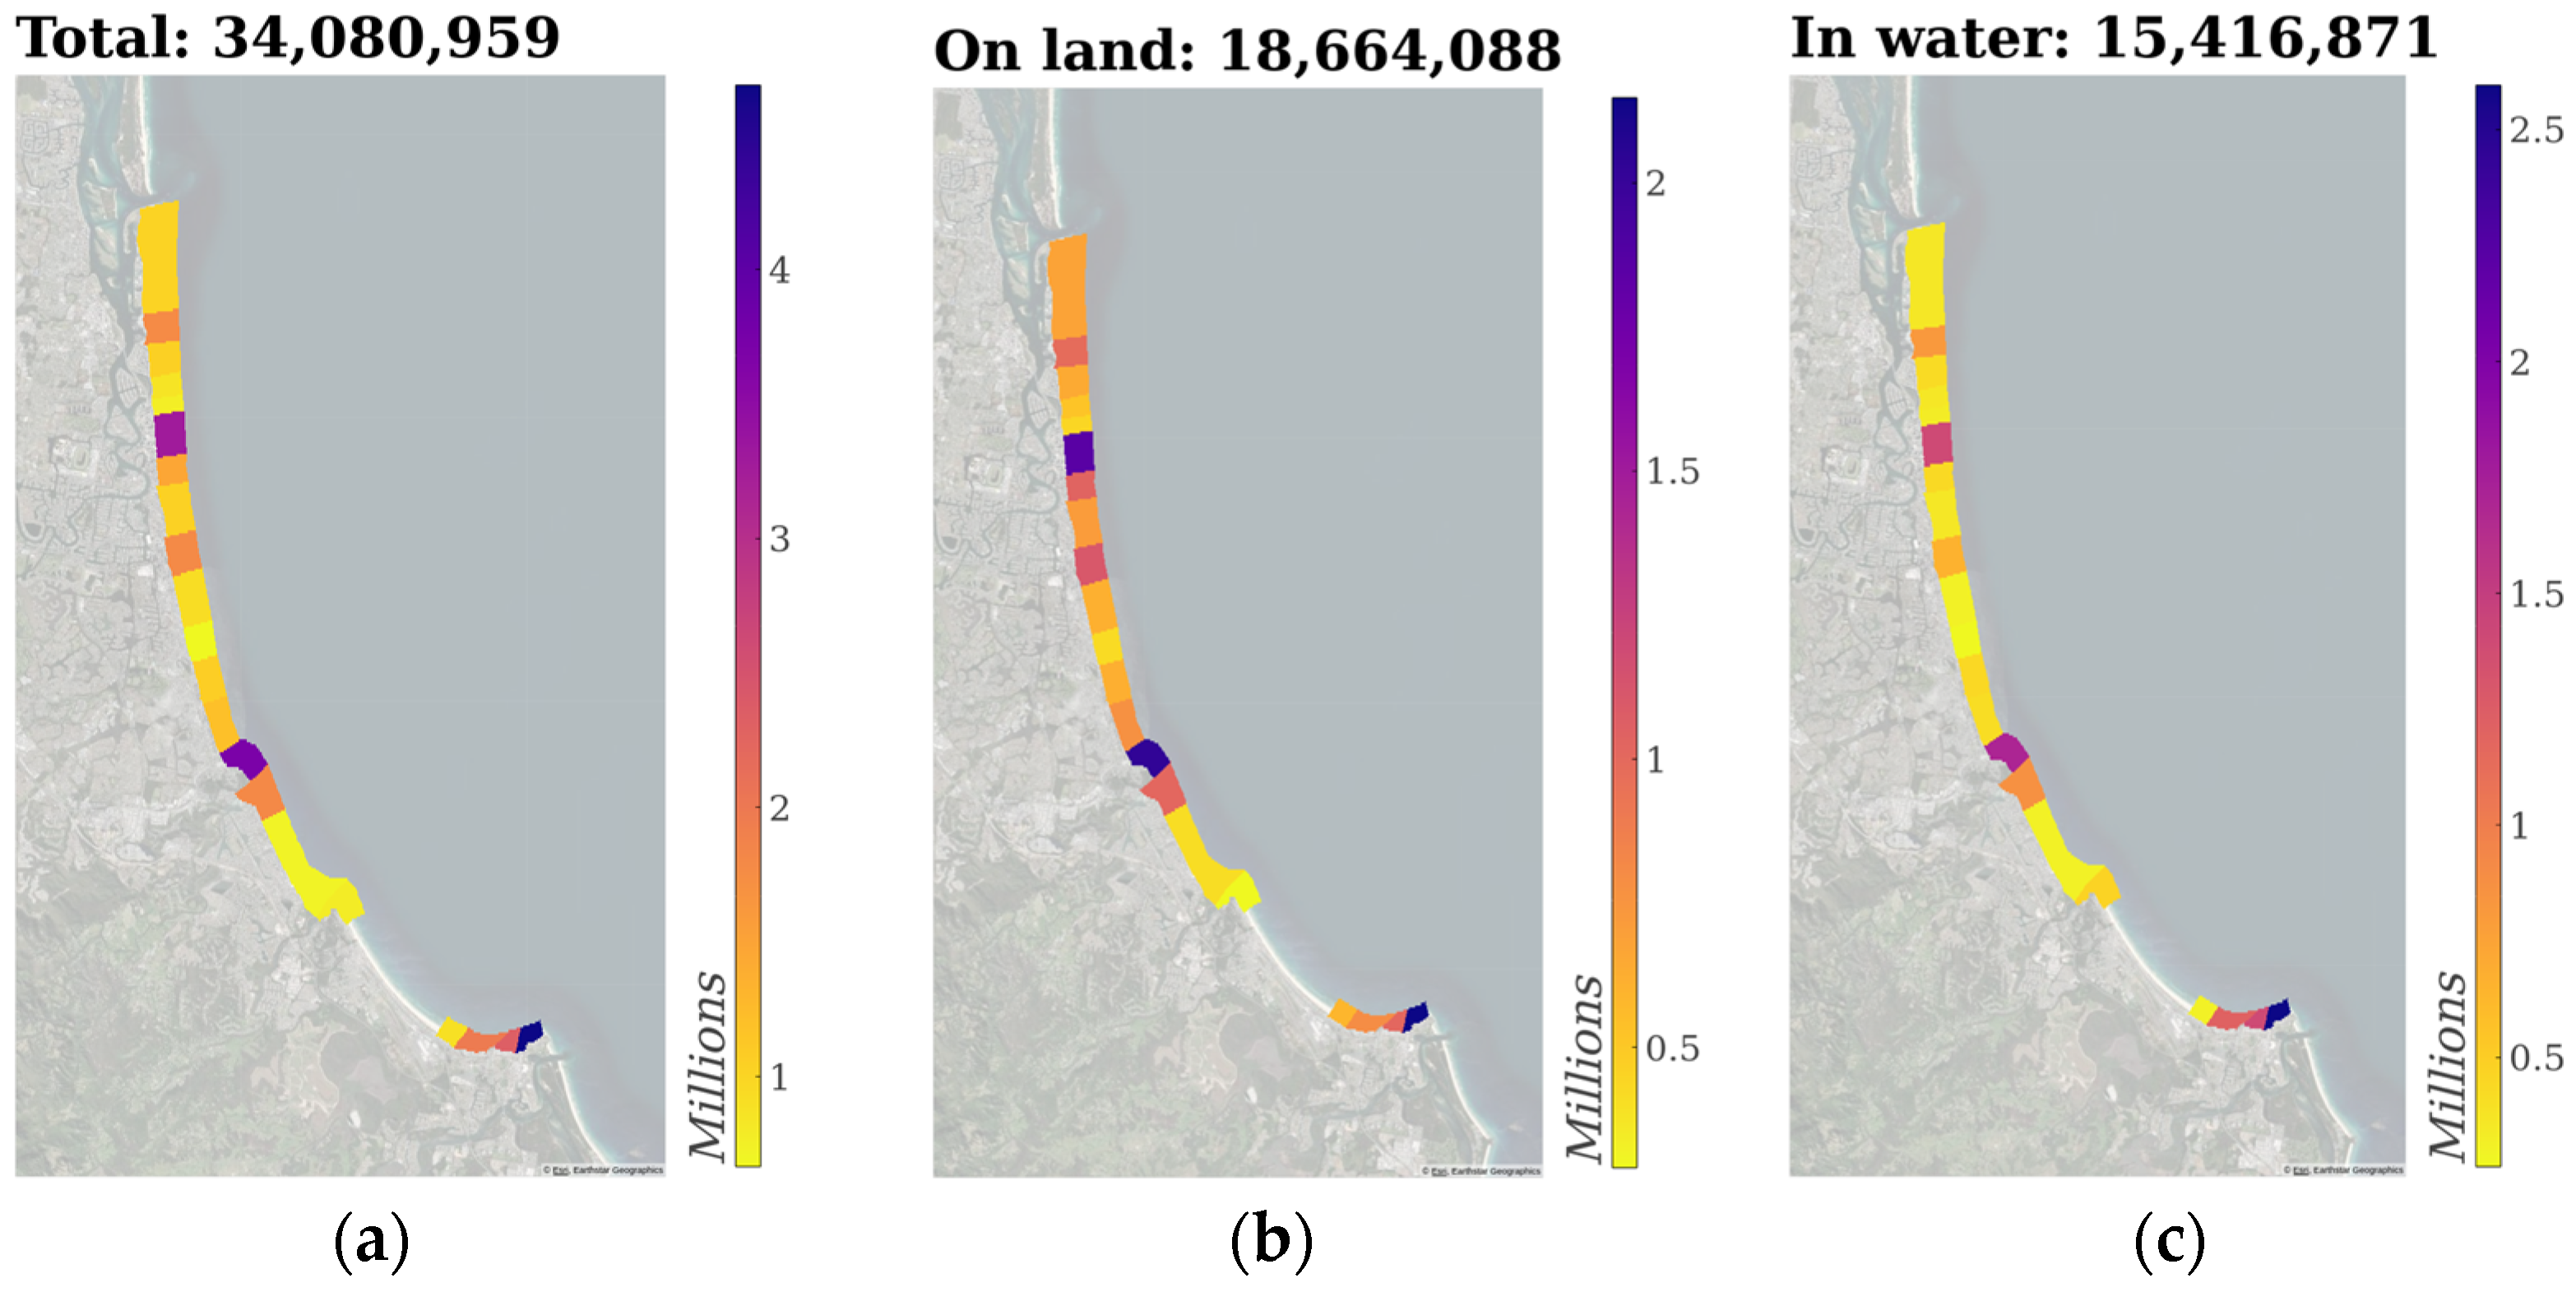
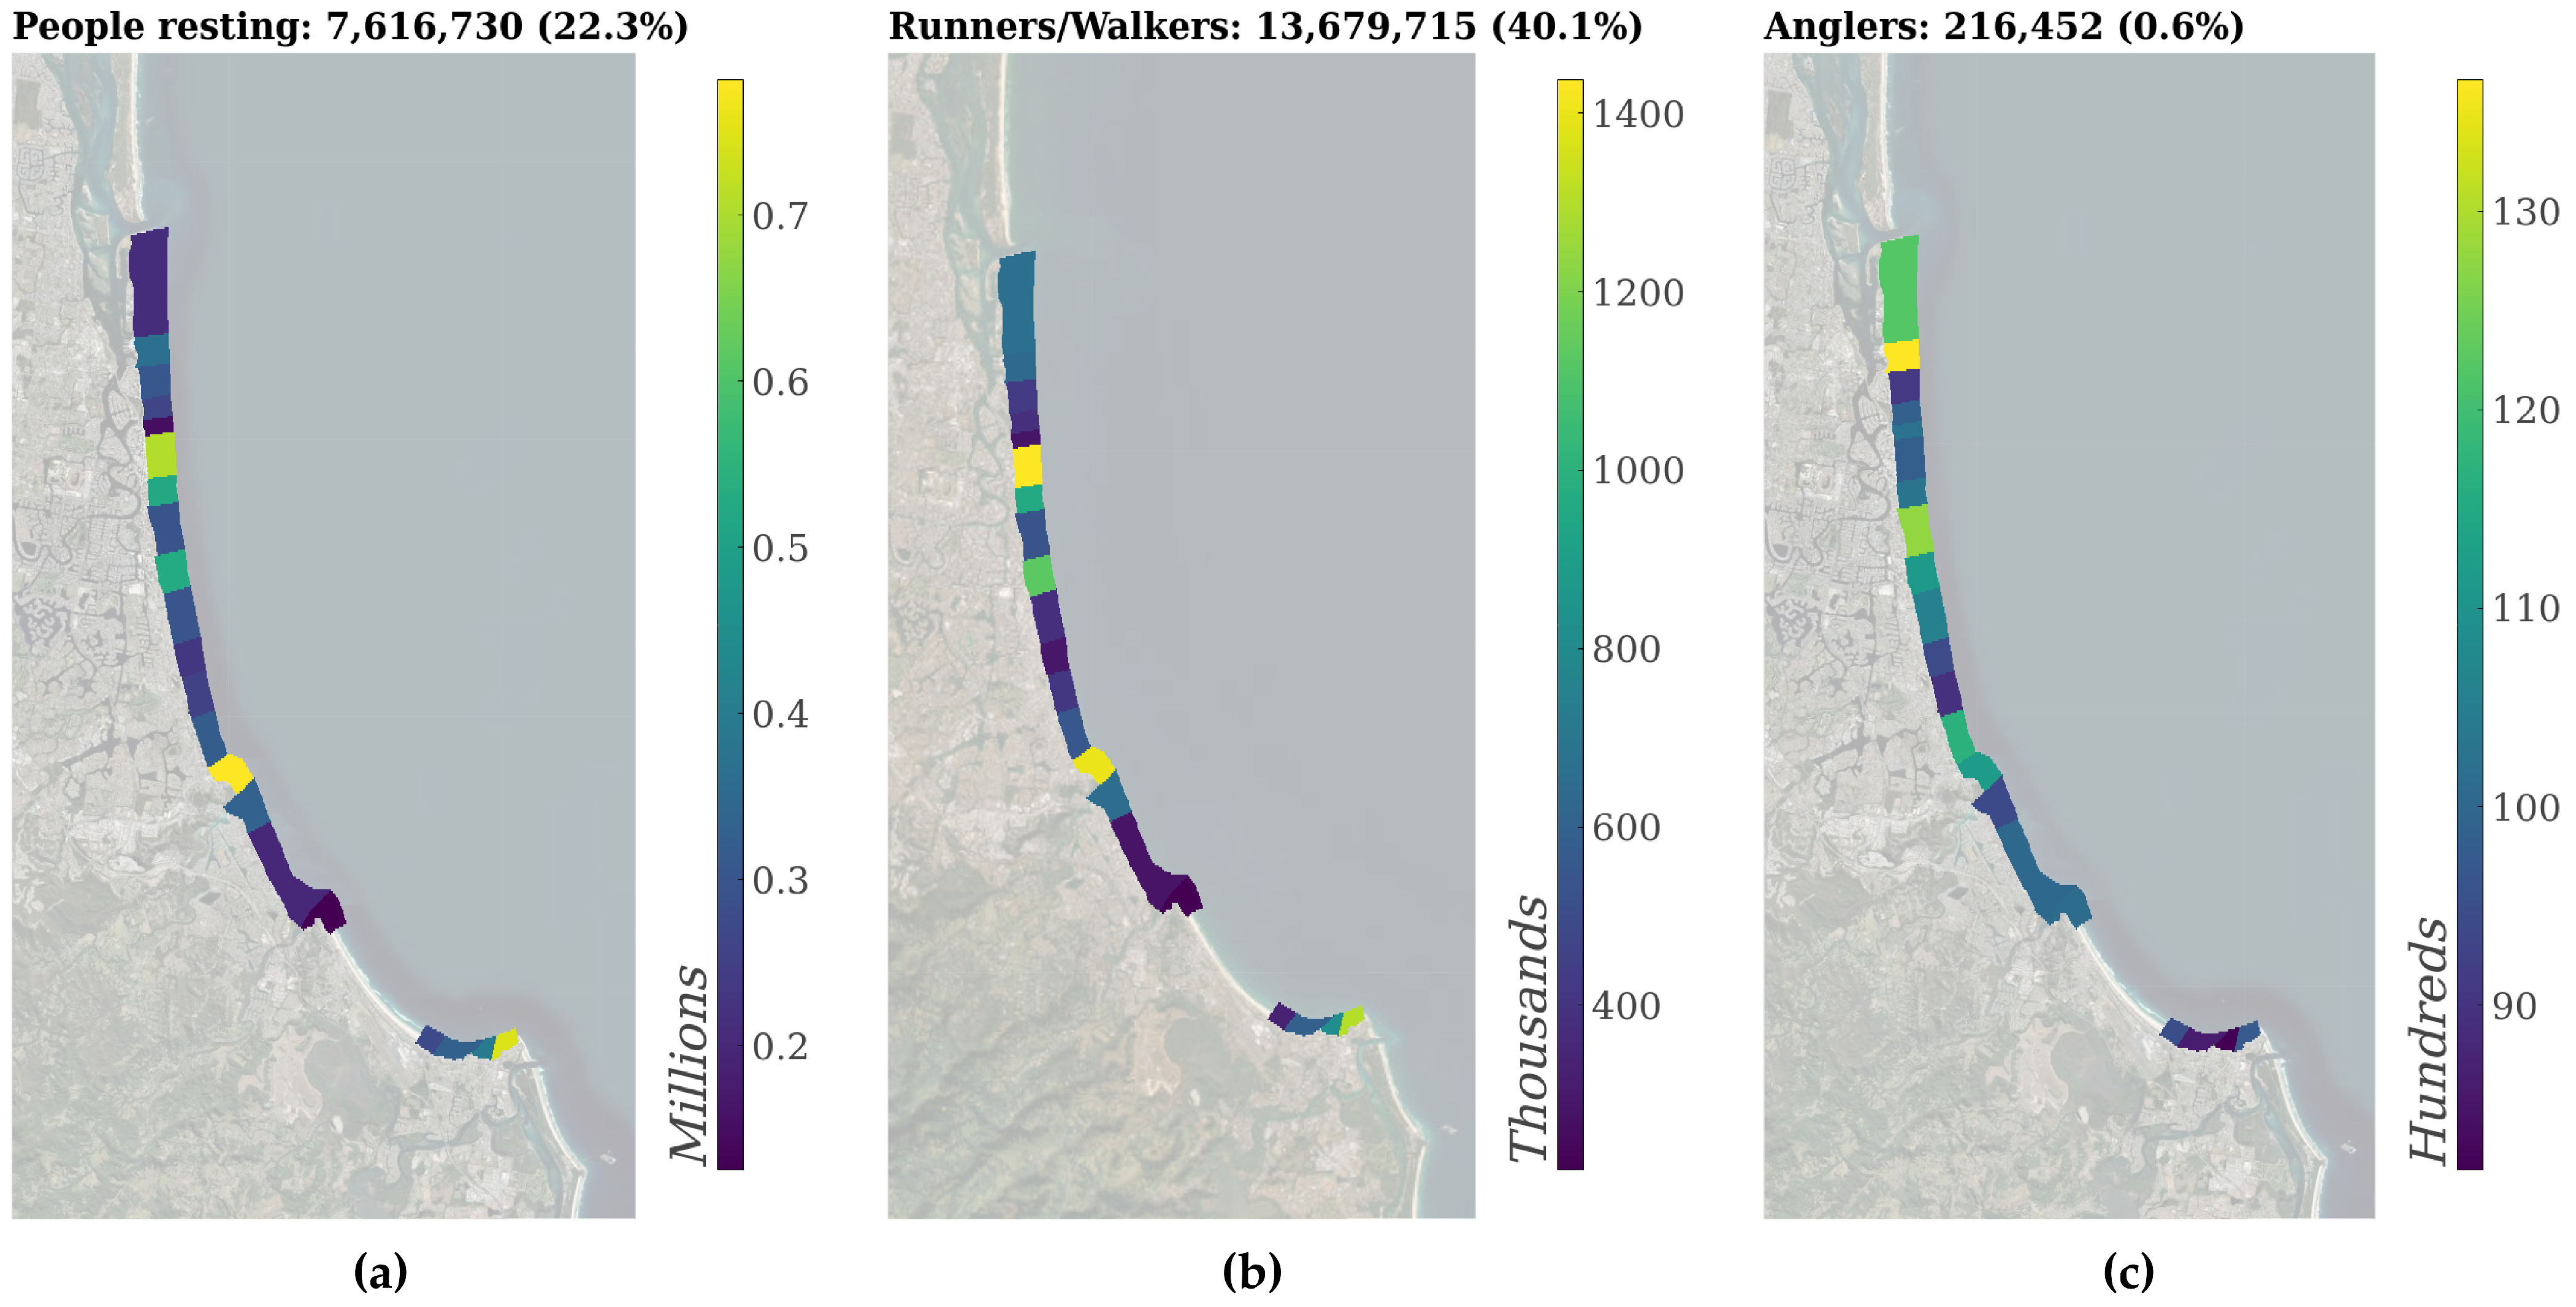
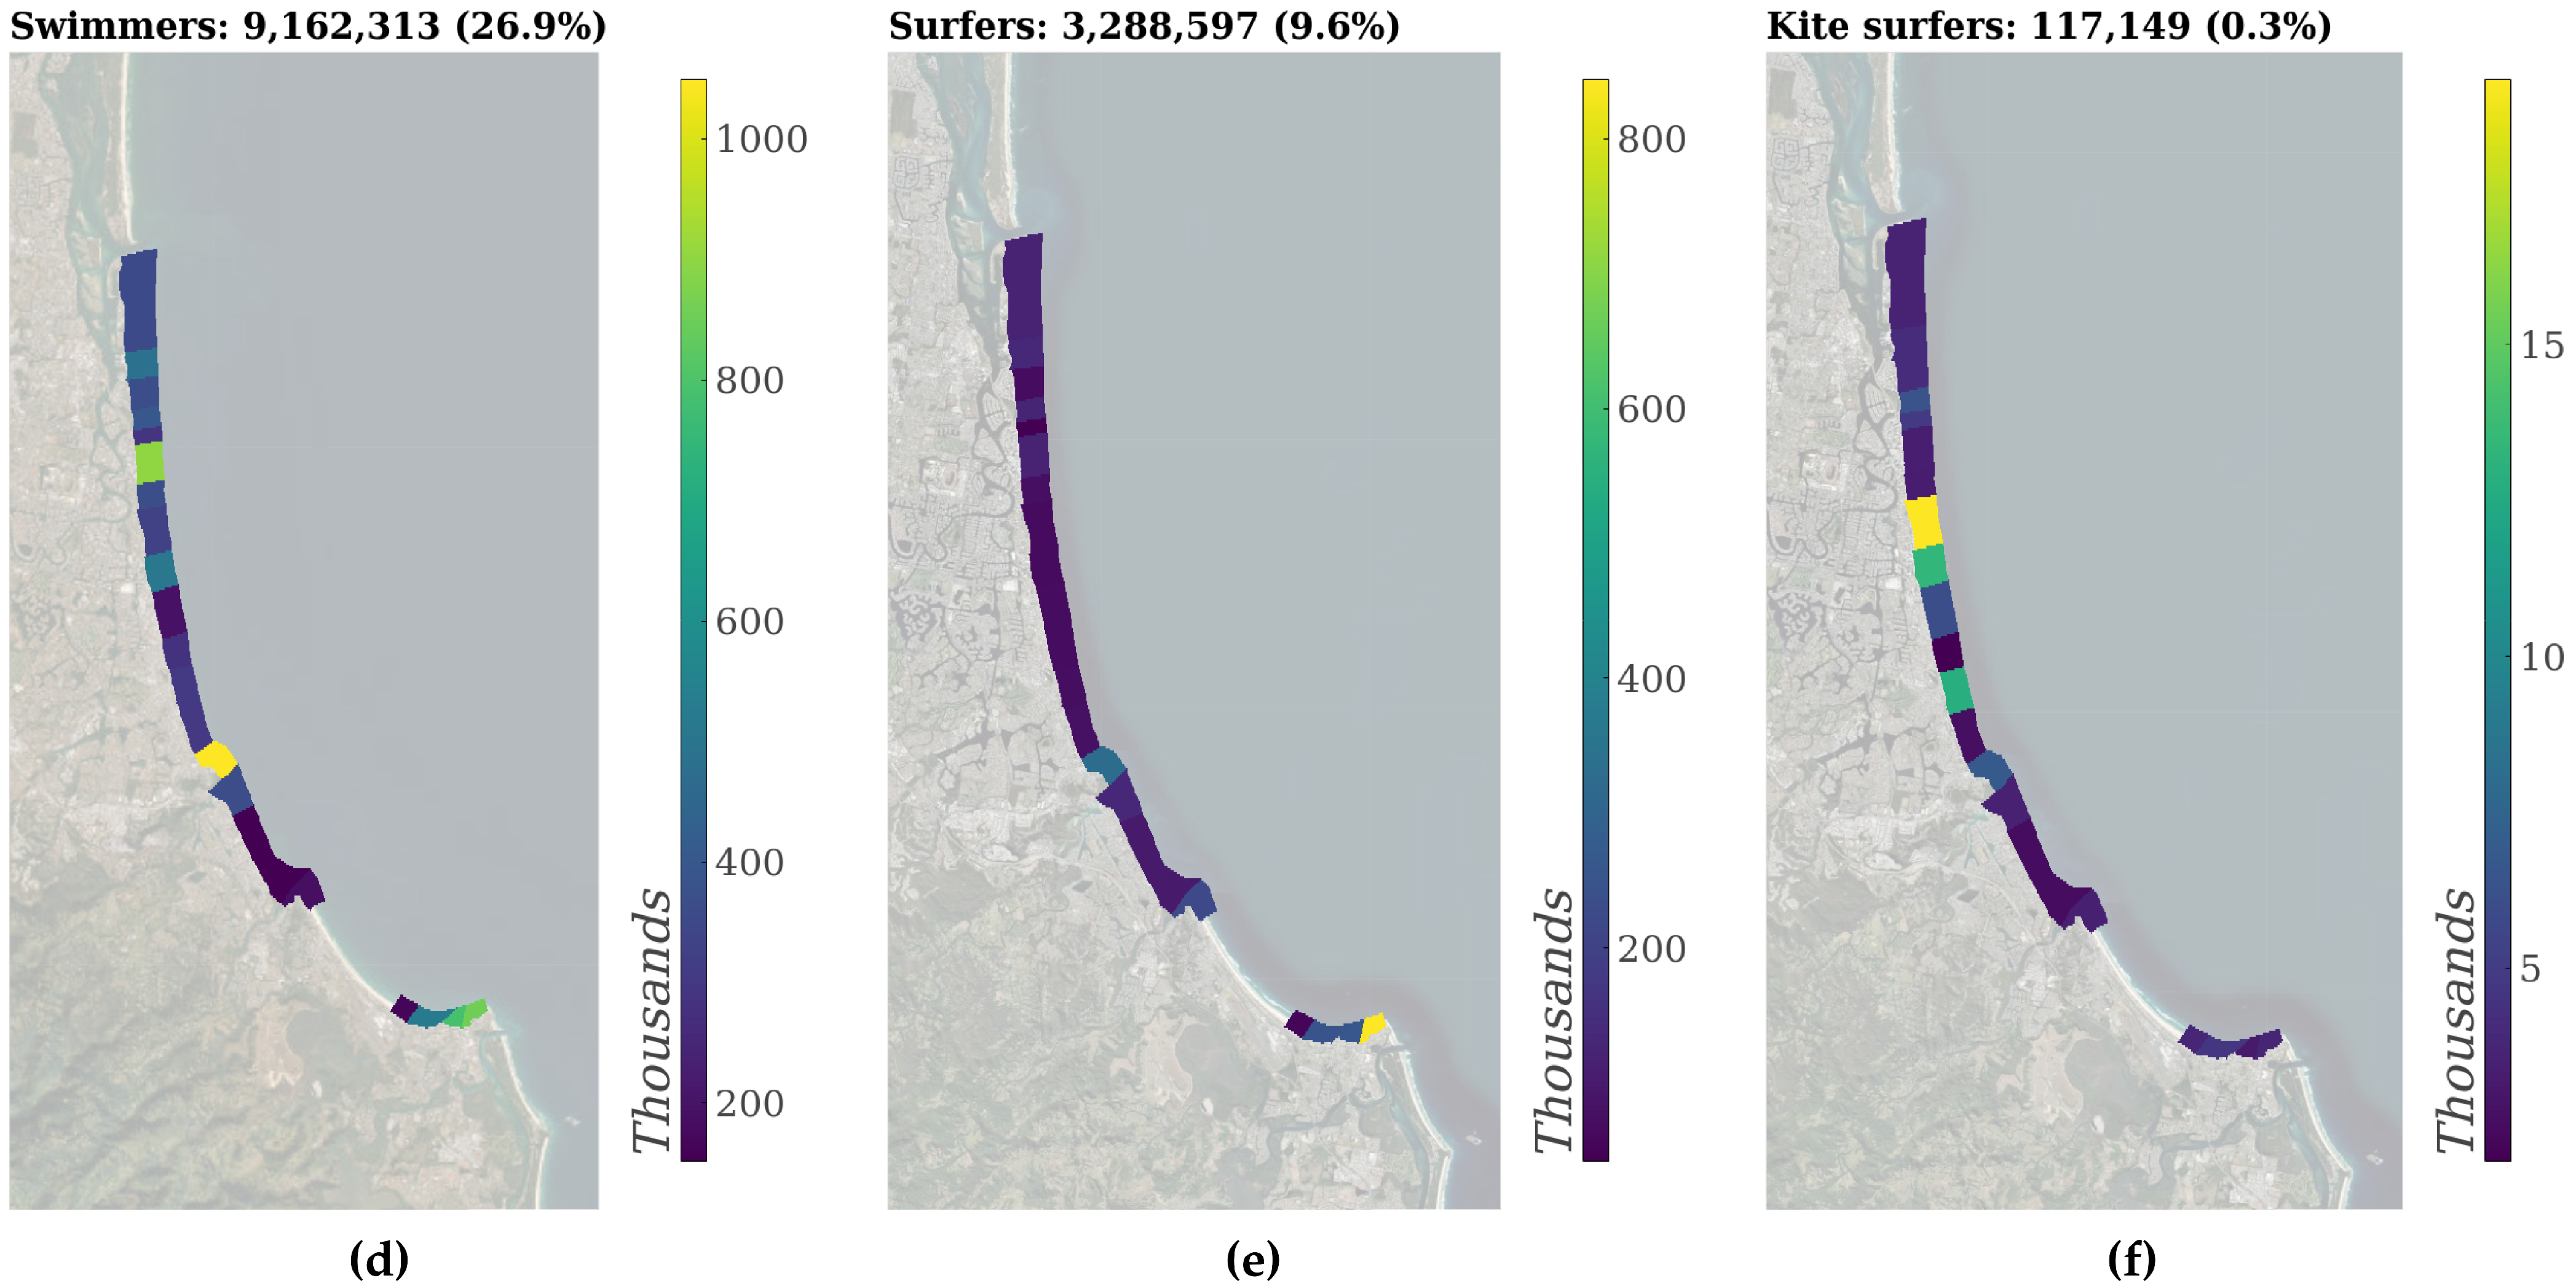
The annual estimate count from drone surveys derived from GLMs summed for all compartments for the 2022/23 year is ~34 million (±SE 3.7 million) visitors to Gold Coast beaches (Figure 2). Compartments 2, 4, 5, 15, and 23 (including Rainbow Bay, Greenmount, Coolangatta, Kirra, Burleigh Heads, and Surfers Paradise beaches—Table S1) were identified as hotspots (areas of high visitor counts). Users were a little more common on land than in the water (Figure 2). When separated by usage type, there were differences in people counts among beach compartments. Anglers and those running/walking were more prevalent on northern beaches, while surfers were prominent near headlands such as Burleigh Heads and Snapper Rocks (Figure 3).

3.4. Importance of Explanatory Variables

The key predictors of overall beach count (i.e., people on land and people in water) were compartment, season, time of day, and day of the week (see model in Table S4). Several predictors exhibited high correlation with each other, for example, rain chance was correlated with cloud coverage and temperature, and temperature was correlated with season. The variables with the lowest predictive power were removed from models. Hierarchical variables that did not improve the model predictive power were also dropped. Such was the case for locations, nested within compartments.
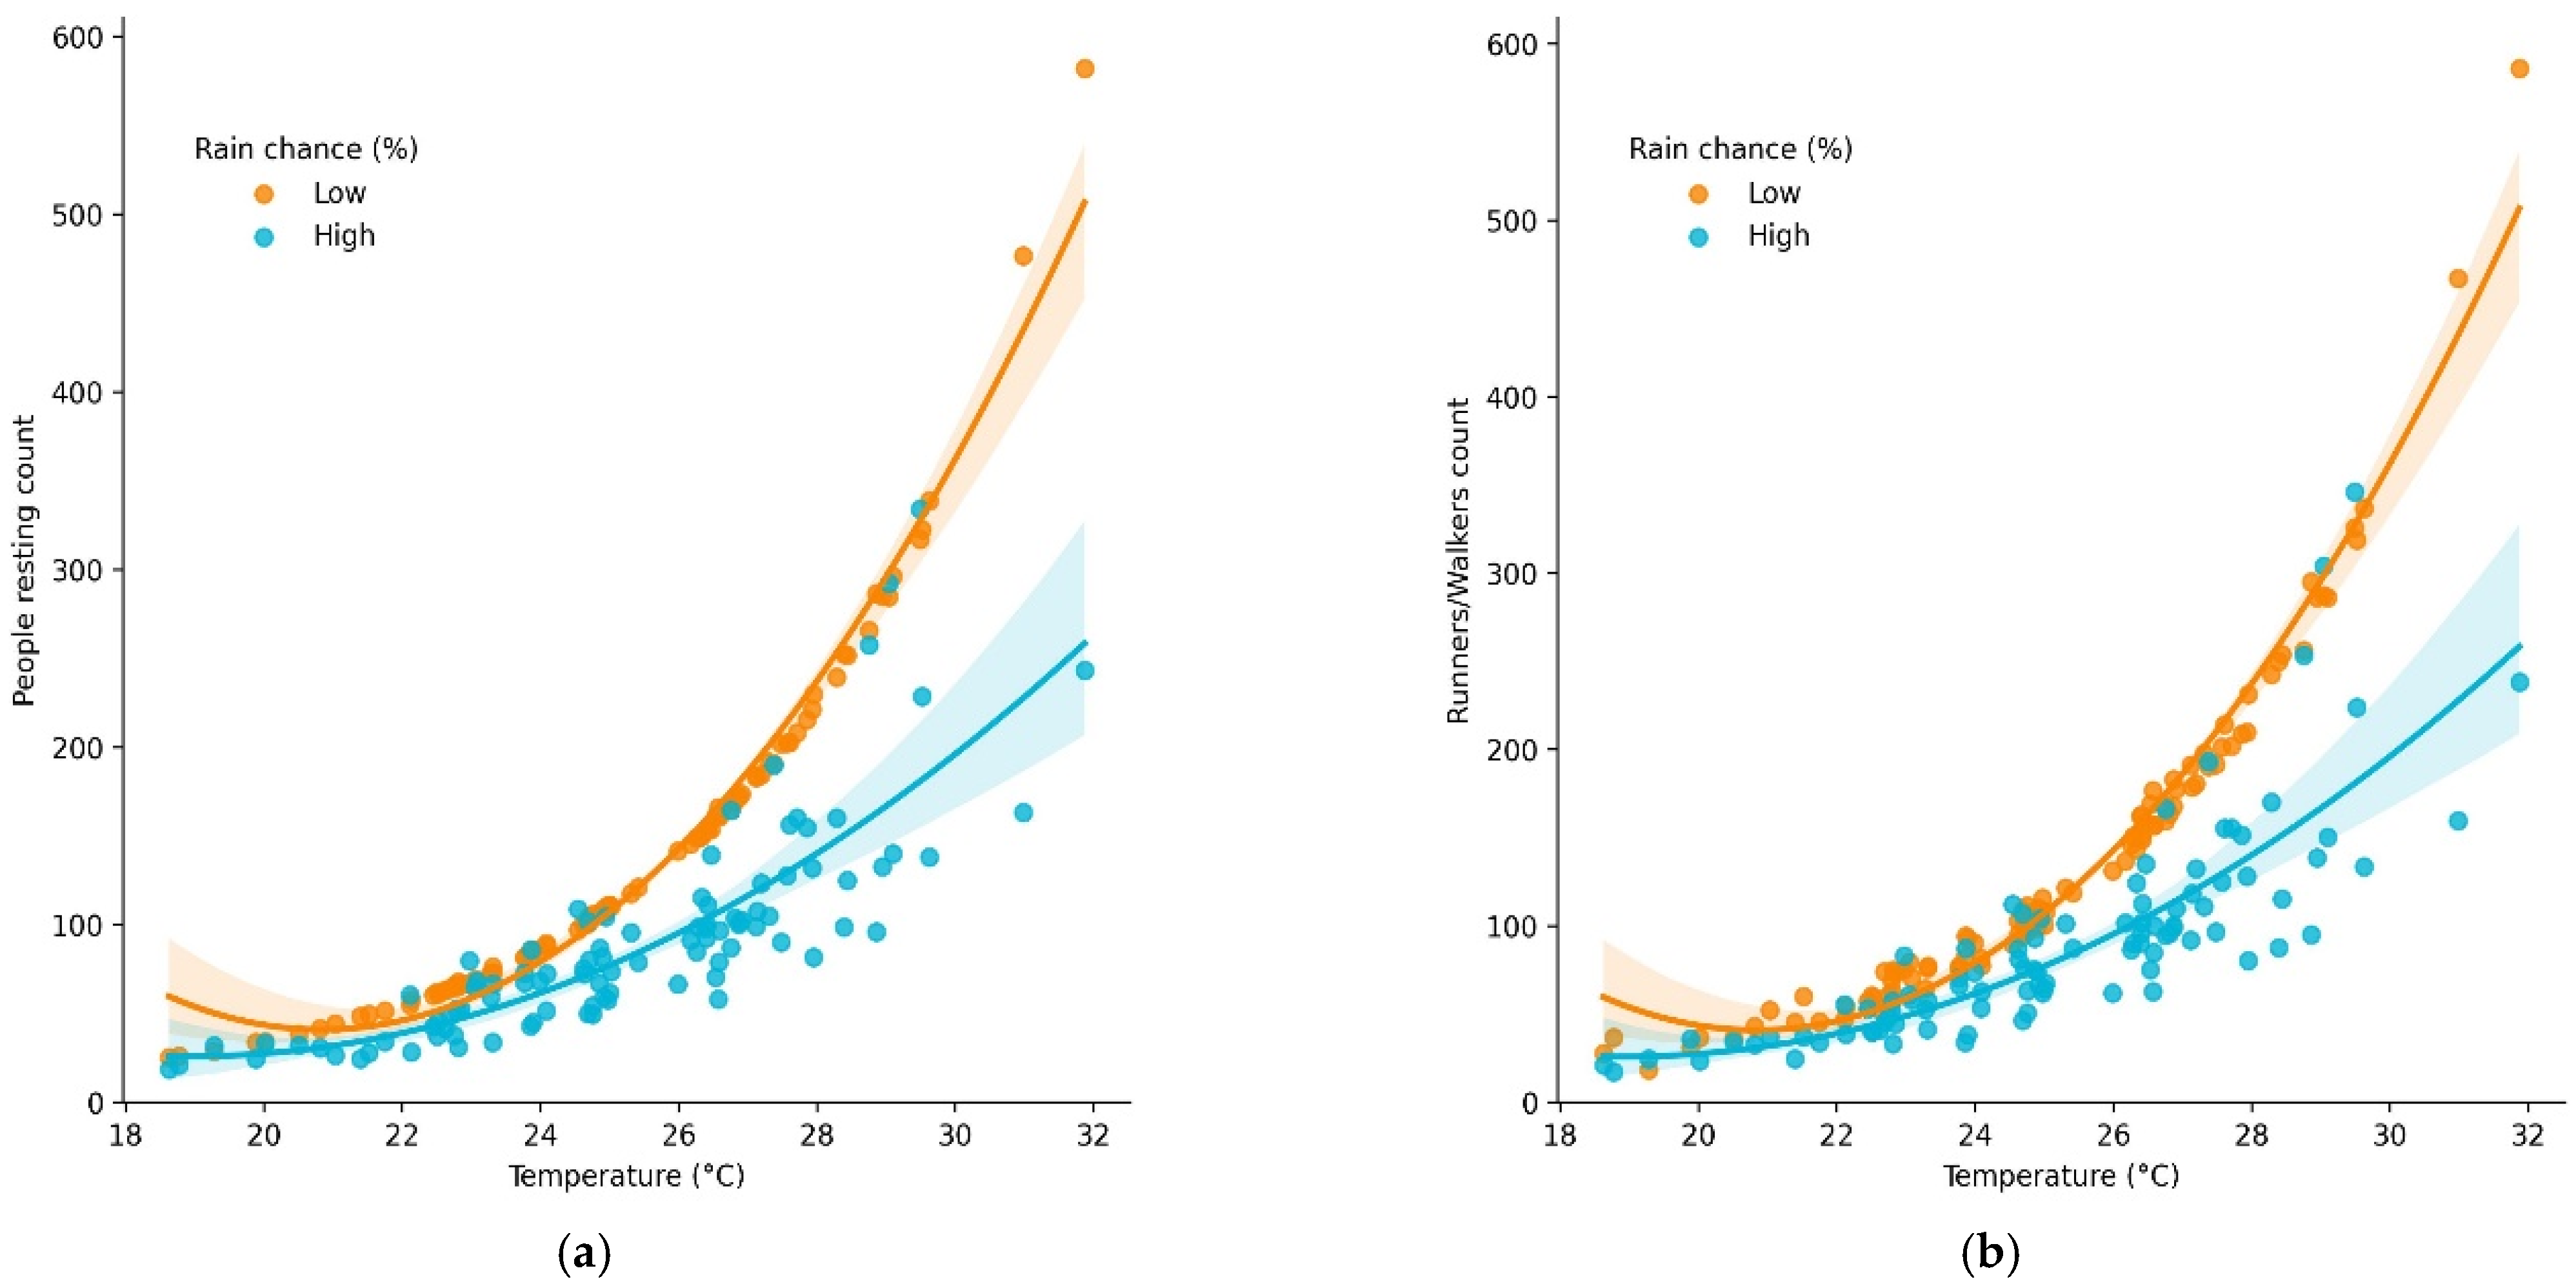
We found strong evidence of interacting dependent variables. The effect of day of the week on people count varies with season, as does the variation in counts over the course of a day (Figure 4). The total number of people increases as the day progresses from morning to afternoon during the low and medium season and weekends (Figure 4). However, the people count is marginally different during weekdays across all seasons, and the increasing count with time-of-day pattern for weekends reverses during peak season (Figure 4). There were striking effects of predictor variables on some usage types. Surfer counts, for example, were substantially higher when surf conditions were clean rather than messy (Figure 5). On land, counts of people resting or running/walking increased with air temperature and decreased with chance of rain (Figure 6).

3.5. Effect of Distance to Lifeguard Towers

The highest density of beachgoers occurs within 0 to 300 m from lifeguard towers, peaking at 120 m (Figure 7). Swimmers tend to be closer to lifeguard towers peaking at 20 and 100 m, with the group of swimmers and potential swimmers (i.e., people resting) following the same pattern. The observation that swimming activities tend to concentrate in closer proximity to lifeguard towers is likely influenced by factors such as the positioning of swimming flags, the perception of increased safety, and a preference to be in close proximity to lifeguard assistance [58].

3.6. Comparison against Existing Land-Based Counts

The GLMs produced an annual estimate of total beach users two times greater than the last annual estimate from the lifeguard dataset (Table 3). There is a 45.7% and 58.9% discrepancy between annual estimates for people on land and in water, respectively. Our annualized estimation approach, while robust, may introduce some additional uncertainty due to variations in seasonality and temporal factors. However, the significant differences between our estimates and those provided by lifeguards extend beyond the bounds of this uncertainty, suggesting that our method captures more comprehensive spatial and temporal coverage, leading to a higher visitation estimate. In both instances, the lifeguard dataset tends to underestimate the number of people. Manual counting is influenced by various factors, including weather conditions, the level of crowd counting expertise, and the chosen counting method, e.g., Jacob’s method—a technique developed for counting crowds [59], individual counting, aggregated temporal counting. Additionally, it is important to note that underestimation via the manual counting method may stem from the inherent limitation of not being able to count people beyond the visible area around lifeguard towers. The lifeguard dataset might be biased towards counting people closer to shore and to the lifeguard towers, potentially missing users outside of patrolled areas. Another explanation for discrepancies is that our method considered surveys over a longer period of the day, from 6 AM to 6 PM. Thus, our method was more likely to produce a higher count than the lifeguard method. When restricting our statistical model to the same temporal and spatial constraints as the lifeguard counting method, i.e., from 8 AM to 6 PM and only to people detected no further than 150 m from lifeguard towers, we obtained an annual estimate of 15 million people (9% overall discrepancy). This shows that the lifeguard survey method is useful and effective but only for a limited spatial and temporal range, resulting in a significantly underestimated annual count. The limitations of this method are overcome by the capabilities of drone surveys and automated analysis which, while conservative, provide more accurate and comprehensive beach use data.

4. Discussion

Our method provides a comprehensive view of beach usage on Gold Coast beaches that is both accurate and efficient. By integrating drone surveys, automated image processing, and probabilistic modeling with the drone collected data, we were able to produce reliable annual estimates of beachgoer numbers. The combination of drone technology and predictive modeling allows us to achieve a large spatiotemporal scope and level of accuracy that would be resource-intensive, or even impossible, with traditional survey methods. This method significantly reduces the cost and time required for data collection and analysis and can be adapted and applied to other locations. The flexibility of this approach makes it suitable for various environmental and geographical contexts, providing valuable insights into human usage patterns across different settings.
Our findings reveal notable interactions between season, day of the week, and time of day on beach usage, emphasizing the need for dynamic management strategies that adapt to these temporal patterns. The observed increase in visitor numbers throughout the day during low and medium seasons, especially on weekends (Figure 4), suggests that resource allocation such as lifeguard services and beach amenities could be optimized by anticipating higher afternoon activity. The reversal of this trend during peak season weekends, where counts were lower in the afternoon (Figure 4), highlights the potential influence of factors such as overcrowding or alternative recreational opportunities, which require further investigation. The strong effects of weather variables on activity-specific beach usage provide additional insights (Figure 5 and Figure 6). For example, clean surf conditions lead to significantly higher surfer counts, indicating that surf forecasting could be leveraged to anticipate crowd sizes. Although weather conditions such as temperature and wind speed had measurable effects on beach usage, limitations in our dataset—particularly the low number of surveys during medium rain probability—restrict our ability to generalize trends for all weather conditions. Future studies should extend data collection across a full year to improve model robustness and better understand the nuances of weather–beachgoer interactions. The spatial and temporal specificity of our findings underscores their broader applicability to other coastal regions. By accounting for both seasonality and environmental conditions, beach managers could refine staffing and resource deployment strategies to enhance safety and visitor satisfaction. However, caution should be exercised when extrapolating these results to other contexts, as local factors such as infrastructure and beach morphology could lead to different patterns.
Drone surveys and AI offer significant advantages over manual counting, particularly in scalability. Contrary to other methods of counting where costs increase in proportion to the scale of deployment, drone surveys and AI can exhibit an economy of scale, where initial costs may be high but the marginal cost of scaling up diminishes. For instance, besides personnel and expertise costs, initial investments in AI, for model training and pipeline development, are high but are one-time efforts that enable the models to handle larger datasets efficiently. However, researchers and managers must monitor for data drift, which could impact model performance if the new data differ from training data [60]. Extending drone surveys and AI to a larger area would be facilitated by the availability of data on beach usage patterns in the larger areas. In the absence of such data, drone surveys must be designed and scheduled to learn dynamically from ongoing surveys.
Visual manual counting can be saturated at high densities [61,62]. For instance, this could mean that in peak season, the lifeguard dataset could be consistently underestimating total counts because the visible appearances of a 1200 and a 2000 people spread on the beach (0.6× difference) could be indistinguishable to a human observer. On the other hand, differentiating from 360 and 600 people (also 0.6× difference) could be accomplished by an observer. Because the lifeguard counting method has not been independently groundtruthed, our reasoning remains a conjecture. As the lifeguard counting method continues into the future, it will be important to design experiments that improve our understanding of its accuracy, precision, and granularity (e.g., see review by [13]). Object detection models can also be saturated when counting highly packed crowds [63], but additional deep leaning models (e.g., crowd density maps, density regressions) can be employed in those cases [64,65,66]. Our surveys did not capture the sporadic instances of high crowd densities that occur during large public events (e.g., airshows, sporting competitions, and concerts). Consequently, we did not use crowd density models, and our estimates do not include the contribution of these events to the total annual beachgoer count.
Because the drone surveys were only undertaken over a 5-month period, our annualized estimates could not be constructed using a timeseries forecast strategy. This means that our models did not have an explicit understanding of time. Instead, our statistical approach relied on modeling with certainty the expected people count from all combinations of key factors (compartments, time of day, day of week and season) and then producing annualized predictions based on the expected number of occurrences for each factor combination within a year. Furthermore, since season was not modeled as an explicit period of the year but instead as a structured level of usage (low, medium, and high), we could model days of peak usage we did not observe. For instance, we were able to model periods of high expected usage during low seasons, such as winter school holidays with a high number of tourists. This approach is a robust and flexible statistical method able to produce estimates for the range of conditions expected during the entire year regardless of their chronological order.
Differences between annual estimates from various counting methods and spatiotemporal considerations highlight the importance of benchmarking different methods against each other. Moreover, other differences between data collection methods, such as precision and consistency, could contribute to the differences in the annual estimates. For instance, drone surveys and AI substitute the risk of individual and variable biases across different observers, days, and beaches via a consistent machine bias that can be mitigated and accounted for. Drone surveys demonstrate clear advantages by providing cost-effective access to highly accurate and detailed information (Table 4).
The City of Gold Coast Ocean Beaches Strategy—End of Life Review stated that an increasing population and the consequential changes to the use of beach amenities was one of the significant challenges for managing these natural assets into the future [67]. The work presented here supports a better understanding of these challenges by providing a more accurate tool with which to understand beach visitation and beach usage. Additionally, the City publishes an annual State of the Beaches Report, which aims to provide an overview of Gold Coast beaches and their visitors, uses, and facilities, while demonstrating the City of Gold Coast’s role in coastal management [40]. The State of the Beaches report includes beach visitation counts per compartment, with a breakdown between swimming, surfing, and craft activities. The methodology presented here enhances these management tools by providing more accurate data to support the allocation of funds to beach protection, assets, and amenities.
Satellite data could have provided complementary information to further explain some of the observed beach usage patterns. For example, satellite data can be used to (1) estimate the area of the beach available to visitors based on topography, slope, and tidal range; (2) provide insights into wave-breaking quality in the surf zone, which depends on local bathymetry and weather conditions; and (3) evaluate beach morpho-hydrodynamics [68,69]. However, there are practical challenges associated with incorporating such data. Calculating beach slope, and therefore beach width affected by tides, is not well standardized across the literature, as it can be measured from different points of reference such as from the dune or berm to the shoreline (mean sea level) or low tide bar. Given the large spatial scale and the wide range of times and dates for our drone surveys, we were unable to use consistent slope and tide data from sources such as CoastSat [70]. Consequently, our study does not account for the potential effects of these factors on beachgoer counts. Despite this limitation, we do not believe that beach slope, bathymetry, or tidal range would have significantly impacted most water-based and land-based activities in our analysis. Nevertheless, future studies could incorporate satellite data and other complementary methods to provide further insights into how such environmental variables influence beach usage patterns.
Future studies could also incorporate the quantification of travel time, visitation frequency, and length-of-stay patterns among beachgoers. Understanding where visitors are traveling from, the number of beach visits they undertake, and the average length of stay would enable the estimation of complementary management indicators such as the total number of unique visitors, the economic impact on the region, and a deeper understanding of the factors driving beachgoer behavior [71]. This additional data could also prove valuable for estimating economic losses following catastrophic events, such pandemics, that lead to reduced visitation (e.g., [72]).

5. Conclusions

Using drones and AI for data collection provides a fast, non-invasive, and spatially extensive method, offering detailed insights into beach use and enhancing the credibility of beach use data, actively mitigating risks associated with inaccurate assessments. This method has provided precise beach use quantification and categorization, which allows for an objective assessment of beach use, including temporal and spatial trends. In turn, this supports coastal management and strategic planning, including cases for increased funding or targeted investment in erosion protection, beach accessways, showers, toilets, lifeguard services, community engagement campaigns, or events planning.

Supplementary Materials

The following supporting information can be downloaded at https://www.mdpi.com/article/10.3390/drones8100579/s1: Table S1: Number of drone surveys per location, showing lifeguard tower and beach compartment IDs ordered from North to South; Table S2: Drone effort for weather-based explanatory variables; Table S3: Comparison of number shelter estimates between in situ manual counting method and Land–Water detection model; Table S4: Statistical model; Figure S1: Observed counts from 507 drone surveys per compartment, season and day of the week.

Author Contributions

Conceptualization, R.M.C., C.H., F.A. and G.M.; methodology, C.H., R.M.C., G.M., M.D.C., J.A.R. and T.P.M.; software, C.H. and S.L.-M.; validation, S.L.-M. and J.A.R.; resources, F.A. and M.M.; data curation, J.A.R., formal analysis, C.H. and M.D.C.; project administration, J.A.R., C.H. and R.M.C.; writing—original draft preparation, C.H., J.A.R. and R.M.C.; writing—review and editing, C.H., R.M.C., G.M., T.P.M., M.D.C., J.A.R., S.L.-M., F.A. and M.M. All authors have read and agreed to the published version of the manuscript.

Funding

This research project was sponsored by the City of Gold Coast (the City) through a funding and collaboration agreement between the City and Griffith University. The City has provided data, including lifeguard data counts and overview, to assist in the understanding of this research topic and its benefit to the industry partner. This research was supported by use of the Nectar Research Cloud and by FishID. The Nectar Research Cloud is a collaborative Australian research platform supported by the NCRIS-funded Australian Research Data Commons (ARDC).

Data Availability Statement

Count data from drone surveys and code for statistical analyses can be found at https://github.com/globalwetlands/BeachAI (accessed on 8 October 2024).

Acknowledgments

We acknowledge that the work described here was carried out on the country of the Yugambeh and Kombumerri peoples and pay our respects to them as traditional custodians of the land.

Conflicts of Interest

The authors declare no conflicts of interest. The funders had no role in the design of the study; in the collection, analyses of data; in the writing of the manuscript; or in the decision to publish the results.

References

  1. Luijendijk, A.; Hagenaars, G.; Ranasinghe, R.; Baart, F.; Donchyts, G.; Aarninkhof, S. The State of the World’s Beaches. Sci. Rep. 2018, 8, 6641. [Google Scholar] [CrossRef] [PubMed]
  2. Costanza, R.; d’Arge, R.; de Groot, R.; Farber, S.; Grasso, M.; Hannon, B.; Limburg, K.; Naeem, S.; O’Neill, R.V.; Paruelo, J.; et al. The value of the world’s ecosystem services and natural capital. Nature 1997, 387, 253–260. [Google Scholar] [CrossRef]
  3. Harris, L.R.; Defeo, O. Sandy shore ecosystem services, ecological infrastructure, and bundles: New insights and perspectives. Ecosyst. Serv. 2022, 57, 101477. [Google Scholar] [CrossRef]
  4. Buckley, R.C.; Cooper, M.-A. Mental health contribution to economic value of surfing ecosystem services. NPJ Ocean Sustain. 2023, 2, 20. [Google Scholar] [CrossRef]
  5. Short, A.D.; Hogan, C.L. Rip Currents and Beach Hazards: Their Impact on Public Safety and Implications for Coastal Management. J. Coast. Res. 1994, 12, 197–209. [Google Scholar]
  6. Scott, T.; Russell, P.; Masselink, G.; Wooler, A.; Short, A. Beach Rescue Statistics and their Relation to Nearshore Morphology and Hazards: A Case Study for Southwest England. J. Coast. Res. 2007, 50 (Suppl. 1), 1–6. [Google Scholar] [CrossRef]
  7. Murray, T.; Cartwright, N.; Tomlinson, R. Video-imaging of transient rip currents on the Gold Coast open beaches. J. Coast. Res. 2013, 2, 1809–1814. [Google Scholar] [CrossRef]
  8. Castelle, B.; Scott, T.; Brander, R.W.; McCarroll, R.J. Rip current types, circulation and hazard. Earth-Sci. Rev. 2016, 163, 1–21. [Google Scholar] [CrossRef]
  9. Schlacher, T.A.; Schoeman, D.S.; Dugan, J.; Lastra, M.; Jones, A.; Scapini, F.; McLachlan, A. Sandy beach ecosystems: Key features, sampling issues, management challenges and climate change impacts. Mar. Ecol. 2008, 29 (Suppl. 1), 70–90. [Google Scholar] [CrossRef]
  10. Defeo, O.; McLachlan, A.; Armitage, D.; Elliott, M.; Pittman, J. Sandy beach social–ecological systems at risk: Regime shifts, collapses, and governance challenges. Front. Ecol Env. 2021, 19, 564–573. [Google Scholar] [CrossRef]
  11. Murray, T.P.; Greaves, M.C.; Vieira da Silva, G.; Boyle, O.J.; Wynne, K.; Freeston, B.; Ditria, L.; Jardine, P.; Ditria, E.; Strauss, D.; et al. Utilising object detection from coastal surf cameras to assess surfer usage. In Proceedings of the Australasian Coasts & Ports 2023 Conference, Sunshine Coast, Australia, 15–18 August 2023. [Google Scholar]
  12. Power, H.E.; Pomeroy, A.W.M.; Kinsela, M.A.; Murray, T.P. Research Priorities for Coastal Geoscience and Engineering: A Collaborative Exercise in Priority Setting From Australia. Front. Mar. Sci. 2021, 8, 645797. [Google Scholar] [CrossRef]
  13. King, P.; McGregor, A. Who’s counting: An analysis of beach attendance estimates and methodologies in southern California. Ocean. Coast. Manag. 2012, 58, 17–25. [Google Scholar] [CrossRef]
  14. Hansen, A.S. Outdoor recreation monitoring in coastal and marine areas—An overview of Nordic experiences and knowledge. Geogr. Tidsskr.-Dan. J. Geogr. 2016, 116, 110–122. [Google Scholar] [CrossRef]
  15. Dwight, R.H.; Brinks, M.V.; SharavanaKumar, G.; Semenza, J.C. Beach attendance and bathing rates for Southern California beaches. Ocean. Coast. Manag. 2007, 50, 847–858. [Google Scholar] [CrossRef]
  16. Deacon, R.T.; Kolstad, C.D. Valuing Beach Recreation Lost in Environmental Accidents. J. Water Resour. Plann. Manag. 2000, 126, 374–381. [Google Scholar] [CrossRef]
  17. Koon, W.; Schmidt, A.; Queiroga, A.C.; Sempsrott, J.; Szpilman, D.; Webber, J.; Brander, R. Need for consistent beach lifeguard data collection: Results from an international survey. INJ Prev. 2021, 27, 308–315. [Google Scholar] [CrossRef]
  18. Harada, S.Y.; Goto, R.S.; Nathanson, A.T. Analysis of Lifeguard-Recorded Data at Hanauma Bay, Hawaii. Wilderness Environ. Med. 2011, 22, 72–76. [Google Scholar] [CrossRef]
  19. Jiménez, J.A.; Osorio, A.; Marino-Tapia, I.; Davidson, M.; Medina, R.; Kroon, A.; Archetti, R.; Ciavola, P.; Aarnikhof, S.G.J. Beach recreation planning using video-derived coastal state indicators. Coast. Eng. 2007, 54, 507–521. [Google Scholar] [CrossRef]
  20. Guillén, J.; García-Olivares, A.; Ojeda, E.; Osorio, A.; Chic, O.; González, R. Long-Term Quantification of Beach Users Using Video Monitoring. J. Coast. Res. 2008, 246, 1612–1619. [Google Scholar] [CrossRef]
  21. Lee, J.; Park, J.; Kim, I.; Kang, D.Y. Application of vision-based safety warning system to Haeundae Beach, Korea. J. Coast. Res. 2019, 91 (Suppl. 1), 216–220. [Google Scholar] [CrossRef]
  22. Drummond, C.; Blacka, M.; Harley, M.; Brown, W. Smart Cameras for Coastal Monitoring. In Proceedings of the Australasian Coasts & Ports 2021: Te Oranga Takutai, Adapt and Thrive, Te Pae, Christchurch, New Zealand, 11–13 April 2022; Volume 1, pp. 390–396. [Google Scholar]
  23. Wallmo, K. Assessment of Techniques for Estimating Beach Attendance; National Oceanic and Atmospheric Administration: Silver Spring, MD, USA, 2003. [Google Scholar]
  24. Horscha, E.; Welsha, M.; Pricea, J. Best practices for collecting onsite data to assess recreational use impacts from an oil spill. NOAA Tech. Memo. NOS ORR 2017, 11, 124. [Google Scholar] [CrossRef]
  25. Provost, E.J.; Coleman, M.A.; Butcher, P.A.; Colefax, A.; Schlacher, T.A.; Bishop, M.J.; Connolly, R.M.; Gilby, B.L.; Henderson, C.J.; Jones, A.; et al. Quantifying human use of sandy shores with aerial remote sensing technology: The sky is not the limit. Ocean. Coast. Manag. 2021, 211, 105750. [Google Scholar] [CrossRef]
  26. Gillan, J.K.; Ponce-Campos, G.E.; Swetnam, T.L.; Gorlier, A.; Heilman, P.; McClaran, M.P. Innovations to expand drone data collection and analysis for rangeland monitoring. Ecosphere 2021, 12, 03649. [Google Scholar] [CrossRef]
  27. Bondi, E.; Fang, F.; Hamilton, M.; Kar, D.; Dmello, D.; Noronha, V.; Choi, J.; Hannaford, R.; Iyer, A.; Joppa, L.; et al. Automatic detection of poachers and wildlife with UAVs. In Artificial Intelligence and Conservation. Artificial Intelligence for Social Good; Cambridge University Press: Cambridge, UK, 2019; pp. 77–100. [Google Scholar] [CrossRef]
  28. Subramaniyan, M.; Skoogh, A.; Bokrantz, J.; Sheikh, M.A.; Thürer, M.; Chang, Q. Artificial intelligence for throughput bottleneck analysis—State-of-the-art and future directions. J. Manuf. Syst. 2021, 60, 734–751. [Google Scholar] [CrossRef]
  29. Kleinschroth, F.; Banda, K.; Zimba, H.; Dondeyne, S.; Nyambe, I.; Spratley, S.; Winton, R.S. Drone imagery to create a common understanding of landscapes. Landsc. Urban Plan. 2022, 228, 104571. [Google Scholar] [CrossRef]
  30. LeCun, Y.; Bengio, Y.; Hinton, G. Deep learning. Nature 2015, 521, 436–444. [Google Scholar] [CrossRef]
  31. Velastin, S.A.; Fernández, R.; Espinosa, J.E.; Bay, A. Detecting, Tracking and Counting People Getting On/Off a Metropolitan Train Using a Standard Video Camera. Sensors 2020, 20, 6251. [Google Scholar] [CrossRef]
  32. Arshad, B.; Barthelemy, J.; Pilton, E.; Perez, P. Where is my Deer? Wildlife tracking and counting via edge computing and deep learning. In Proceedings of the 2020 IEEE Sensors, Rotterdam, The Netherlands, 25–28 October 2020; IEEE: Piscataway, NJ, USA, 2020. [Google Scholar]
  33. Gómez-Pazo, A.; Pérez-Alberti, A. The Use of UAVs for the Characterization and Analysis of Rocky Coasts. Drones 2021, 5, 23. [Google Scholar] [CrossRef]
  34. Papakonstantinou, A.; Batsaris, M.; Spondylidis, S.; Topouzelis, K. A Citizen Science Unmanned Aerial System Data Acquisition Protocol and Deep Learning Techniques for the Automatic Detection and Mapping of Marine Litter Concentrations in the Coastal Zone. Drones 2021, 5, 6. [Google Scholar] [CrossRef]
  35. Kelaher, B.P.; Pappagallo, T.; Litchfield, S.; Fellowes, T.E. Drone-Based Monitoring to Remotely Assess a Beach Nourishment Program on Lord Howe Island. Drones 2023, 7, 600. [Google Scholar] [CrossRef]
  36. Regional Population 2021–2022, Centre for Population Analysis of Regional Population Data from the Australian Bureau of Statistics (ABS). Available online: https://population.gov.au/data-and-forecasts/key-data-releases/regional-population-2021-22 (accessed on 8 February 2024).
  37. Tourism Research Australia Australia Trade Investment Commission. Gold Coast, Regional Tourism Satellite Account, Annual Data for Australia’s Tourism Regions. Available online: https://www.tra.gov.au/en/economic-analysis/tourism-satellite-accounts/regional-tourism-satellite-account#accordion-095f0aeb35-item-a2f4ea4e30 (accessed on 2 August 2024).
  38. Save the Waves Coalition. World Surfing Reserves. Available online: https://www.savethewaves.org/wsr/ (accessed on 5 May 2024).
  39. Strauss, D.; Murray, T.; Harry, M.; Todd, D. Coastal data collection and profile surveys on the Gold Coast: 50 years on. In Coast & Ports 2017: Working with Nature; Engineers Australia: Cairns, Australia, 2017; Volume 1, pp. 1030–1036. [Google Scholar]
  40. City of Gold Coast. State of the Beaches Report 2022–2023, Coastal Management & Climate Change; City of Gold Coast: Gold Coast, Australia, 2024; p. 79. [Google Scholar]
  41. Australian Bureau of Meteorology. Historical Weather Observations and Statistics. Available online: https://reg.bom.gov.au/climate/data-services/station-data.shtml (accessed on 14 June 2023).
  42. Jocher, G.; Stoken, A.; Borovec, J.; Changyu, L.; Hogan, A.; Diaconu, L.; Ingham, F.; Poznanski, J.; Fang, J.; Yu, L. Ultralytics/Yolov5: v3. 1-Bug Fixes and Performance Improvements; Zenodo: Geneva, Switzerland, 2020; Available online: https://zenodo.org/records/4154370 (accessed on 10 October 2023).
  43. Lin, T.-Y.; Maire, M.; Belongie, S.; Bourdev, L.; Girshick, R.; Hays, J.; Perona, P.; Ramanan, D.; Zitnick, C.L.; Dollár, P. Microsoft COCO: Common Objects in Context. In Proceedings of the Computer Vision–ECCV 2014: 13th European Conference, Zurich, Switzerland, 6–12 September 2014; Springer International Publishing: Cham, Switzerland, 2014. [Google Scholar]
  44. Redmon, J.; Divvala, S.; Girshick, R.; Farhadi, A. You Only Look Once: Unified, Real-Time Object Detection. In Proceedings of the IEEE Conference on Computer Vision and Pattern Recognition, Las Vegas, NV, USA, 27–30 June 2016; IEEE: Piscataway, NJ, USA, 2016. [Google Scholar]
  45. Redmon, J.; Farhadi, A. YOLOv3: An Incremental Improvement. arXiv 2018, arXiv:1804.02767. [Google Scholar]
  46. Wang, C.-Y.; Liao, H.-Y.M.; Wu, Y.-H.; Chen, P.-Y.; Hsieh, J.-W.; Yeh, I.-H. CSPNet: A new backbone that can enhance learning capability of CNN. In Proceedings of the IEEE/CVF Conference on Computer Vision and Pattern Recognition Workshops, Seattle, WA, USA, 14–19 June 2020; pp. 390–391. [Google Scholar]
  47. Paszke, A.; Gross, S.; Chintala, S.; Chanan, G.; Yang, E.; DeVito, Z.; Lin, Z.; Desmaison, A.; Antiga, L.; Lerer, A. Automatic differentiation in PyTorch. 2017. Available online: https://openreview.net/forum?id=BJJsrmfCZ (accessed on 9 February 2024).
  48. Morgan, N.; Bourlard, H. Generalization and parameter estimation in feedforward nets: Some experiments. Adv. Neural Inf. Process. Syst. 1989, 2, 630–637. [Google Scholar]
  49. Prechelt, L. Early stopping-but when? In Neural Networks: Tricks of the Trade; Springer: Berlin/Heidelberg, Germany, 2002; pp. 55–69. [Google Scholar]
  50. Maggiolino, G.; Ahmad, A.; Cao, J.; Kitani, K. Deep OC-SORT: Multi-Pedestrian Tracking by Adaptive Re-Identification. In Proceedings of the IEEE International Conference on Image Processing (ICIP), Kuala Lumpur, Malaysia, 8–11 October 2023; IEEE: Piscataway, NJ, USA, 2023. [Google Scholar]
  51. Mooser, A.; Anfuso, G.; Pranzini, E.; Rizzo, A.; Aucelli, P.P.C. Beach scenic quality versus beach concessions: Case studies from southern Italy. Land 2023, 12, 319. [Google Scholar] [CrossRef]
  52. Bednar, J.A.; Crail, J.; Crist-Harif, J.; Rudiger, P.; Brener, G.; Chris, B.; Thomas, I.; Mease, J.; Signell, J.; Liquet, M.; et al. Holoviz/Datashader: Version 0.14.3; Zenodo: Geneva, Switzerland, 2022; Available online: https://zenodo.org/records/7331952 (accessed on 26 March 2023).
  53. Salvatier, J.; Wiecki, T.V.; Fonnesbeck, C. Probabilistic programming in Python using PyMC3. PeerJ Comput. Sci. 2016, 2, e55. [Google Scholar] [CrossRef]
  54. Lin, T.-Y.; Maire, M.; Belongie, S.J.; Bourdev, L.D.; Girshick, R.B.; Hays, J.; Perona, P.; Ramanan, D.; Doll, P.; Zitnick, L.C. Microsoft COCO: Common Objects in Context; Papers with Code. 2024. Available online: https://paperswithcode.com/sota/object-detection-on-coco (accessed on 8 December 2022).
  55. Miller, D.; Moghadam, P.; Cox, M.; Wildie, M.; Jurdak, R. What’s in the black box? the false negative mechanisms inside object detectors. IEEE Robot. Autom. Lett. 2022, 7, 8510–8517. [Google Scholar] [CrossRef]
  56. Hoiem, D.; Chodpathumwan, Y.; Dai, Q. Diagnosing error in object detectors. In European Conference on Computer Vision; Springer: Berlin/Heidelberg, Germany, 2012. [Google Scholar]
  57. Miller, D.; Goode, G.; Bennie, C.; Moghadam, P.; Jurdak, R. Why object detectors fail: Investigating the influence of the dataset. In Proceedings of the IEEE/CVF Conference on Computer Vision and Pattern Recognition, New Orleans, LA, USA, 18–24 June 2022; pp. 4823–4830. [Google Scholar]
  58. Blackwell, B.D.; Tisdell, C.A. The Marginal Values of Lifesavers and Lifeguards to Beach Users in Australia and the United States. Econ. Anal. Policy 2010, 40, 209–227. [Google Scholar] [CrossRef]
  59. Jacobs, H. To count a crowd. Columbia J. Rev. 1967, 6, 37. [Google Scholar]
  60. Kore, A.; Abbasi Bavil, E.; Subasri, V.; Abdalla, M.; Fine, B.; Dolatabadi, E.; Abdalla, M. Empirical data drift detection experiments on real-world medical imaging data. Nat. Commun. 2024, 15, 1887. [Google Scholar] [CrossRef] [PubMed]
  61. Kaufman, E.L.; Lord, M.W.; Reese, T.W.; Volkmann, J. The Discrimination of Visual Number. Am. J. Psychol. 1949, 62, 498–525. [Google Scholar] [CrossRef]
  62. Cheyette, S.J.; Piantadosi, S.T. A unified account of numerosity perception. Nat. Hum. Behav. 2020, 4, 1265–1272. [Google Scholar] [CrossRef]
  63. Sam, D.B.; Peri, S.V.; Sundararaman, M.N.; Kamath, A.; Babu, R.V. Locate, Size, and Count: Accurately Resolving People in Dense Crowds via Detection. IEEE Trans. Pattern Anal. Mach. Intell. 2021, 43, 2739–2751. [Google Scholar] [CrossRef] [PubMed]
  64. Castellano, G.; Castiello, C.; Cianciotta, M.; Mencar, C.; Vessio, G. Multi-View Convolutional Network for Crowd Counting in Drone-Captured Images; Springer Nature Switzerland: Cham, Switzerland, 2020. [Google Scholar]
  65. Cruz, H.; Reyes, C.; Rolando, P.; Pinillos, M. Automatic Counting of People in Crowded Scenes, with Drones That Were Applied in Internal Defense Operations on October 20, 2019 in Ecuador; Springer Nature Singapore: Singapore, 2020. [Google Scholar]
  66. Saidon, M.S.; Mustafa, W.A.; Rajasalavam, V.R.; Khairunizam, W. Automatic People Counting System Using Aerial Image Captured by Drone for Event Management. In Intelligent Manufacturing and Mechatronics: Proceedings of SympoSIMM; Springer: Singapore, 2021. [Google Scholar]
  67. City of Gold Coast. Ocean Beaches Strategy 2021–2023: End of Life Review; City of Gold Coast: Gold Coast, Australia, 2024; p. 20. [Google Scholar]
  68. Ma, Y.; Wang, L.; Xu, N.; Zhang, S.; Wang, X.H.; Li, S. Estimating coastal slope of sandy beach from ICESat-2: A case study in Texas. Environ. Res. Lett. 2023, 18, 044039. [Google Scholar] [CrossRef]
  69. Salameh, E.; Frappart, F.; Almar, R.; Baptista, P.; Heygster, G.; Lubac, B.; Raucoules, D.; Almeida, L.P.; Bergsma, E.W.; Capo, S. Monitoring beach topography and nearshore bathymetry using spaceborne remote sensing: A review. Remote Sens. 2019, 11, 2212. [Google Scholar] [CrossRef]
  70. Vos, K.; Deng, W.; Harley, M.D.; Turner, I.L.; Splinter, K.D.M. Beach-face slope dataset for Australia. Earth Syst. Sci. Data 2022, 14, 1345–1357. [Google Scholar] [CrossRef]
  71. West, G.; Bayne, B. The Economic Impacts of Tourism on the Gold Coast; Common Ground Publishing: Altona, Australia, 2002. [Google Scholar]
  72. English, E.; von Haefen, R.H.; Herriges, J.; Leggett, C.; Lupi, F.; McConnell, K.; Welsh, M.; Domanski, A.; Meade, N. Estimating the value of lost recreation days from the Deepwater Horizon oil spill. J. Environ. Econ. Manag. 2018, 91, 26–45. [Google Scholar] [CrossRef]
Figure 1. Gold Coast beaches monitored during study. Extension and location of the 24 beach compartments (a), beach compartment number is indicated on the map; aerial view of beach compartment 23 Surfers Paradise (b); and example of annotated drone image from compartment 17 Miami with activity categories indicated as bounding boxes: blue, people resting; red, people walking/running; green, shelters (c).
Drones 08 00579 g001
Figure 2. Annual estimated total user counts per compartment: (a) total, (b) land, and (c) water. This model considers detections from the Land–Water detection model and statistical predictions from GLMs accounting for effects spatiotemporal factors.
Drones 08 00579 g002
Figure 3. Annual estimate of people per usage category and compartment: (a) people resting; (b) runners/walkers; (c) anglers; (d) swimmers; (e) surfers; and (f) kite surfers. Reported percentages add to 99.8% due to rounding. Satellite layer by ESRI Earthstar Geographics.
Drones 08 00579 g003aDrones 08 00579 g003b
Figure 4. Effect of season, day of week, and time of day on people counts for (a) total counts, (b) people on land, and (c) people in the water. Count estimates derived from Land–Water model and GLM for a typical compartment. Box plots show median values, 25th/75th percentiles, and min–max range.
Drones 08 00579 g004
Figure 5. Swell condition effect on surfer count. Surfer estimate derived from Usage model and GLM for a typical compartment. The clean condition refers to smooth, well-formed, and consistent waves, while the messy condition refers to choppy and irregular waves.
Drones 08 00579 g005
Figure 6. Relationship between rain chance and temperature on people resting count (a) and runners/walkers count (b). Estimates derived from Usage model and GLM for a typical compartment.
Drones 08 00579 g006
Figure 7. Spatial distribution of people with respect of lifeguard towers: (a) all people; (b) swimmers; and (c) swimmers and potential swimmers (i.e., people resting). Derived from the annual estimated total user counts, the kernel density estimate used a Gaussian kernel for smoothing people counts over the observed distances (left). KDE allows us to identify the distance with greater mass distribution, i.e., at which distance from a tower people are more concentrated. The cumulative KDE produces an empirical cumulative distribution so that the height of the filled curve reflects the estimated number of people at a specific distance (right). A vertical line at 150 m from the tower is included as a reference.
Drones 08 00579 g007
Table 1. Ground-truth labels for the two detection models. The shelters category refers to umbrellas, gazebos, and cabanas used by beachgoers to shade themselves from the sun.
Land–Water Model
ClassTrainingEvaluationTestingTotal
People on land92751669847119,415
People in water68401077538213,299
Shelters19013443302575
Total18,016309014,18335,289
Usage model
ClassTrainingEvaluationTestingTotal
Anglers48182107670
Kite surfers2083643287
People resting357360330457221
Runners/Walkers5395942531911,656
Surfers24684026823552
Swimmers387175246579280
Shelters17913704142575
Total17,787318714,26735,241
Table 2. Performance metrics of the two models developed for counting people on beaches. F1-score is the weighted average measure most used to report overall performance.
Land–Water Model
ClassPrecisionRecallF1-Score
People on land0.940.950.95
People in water0.900.920.91
Shelters0.980.990.98
Usage model
ClassPrecisionRecallF1-score
Anglers0.850.850.85
Kite surfers0.840.860.85
People resting0.900.890.89
Runners/Walkers0.910.930.92
Surfers0.890.900.90
Swimmers0.860.900.89
Shelters0.960.980.97
Table 3. Comparison between people count estimates from the lifeguard dataset and annual projection from drone surveys. Lifeguard data was obtained for the 2022 calendar year (source: City of Gold Coast Lifeguards and weekend-volunteer Surf Life Saving Queensland lifeguards). We encourage precaution when comparing these results because of different sampling methods; please refer to text below.
Lifeguard Observed
(2022)
Drone Survey Projection
(2022–2023)
Total people count16,489,292 (unknown error)34,080,959 ± SE 3.7 million
Land to water ratio1.591.21
Table 4. Comparing the capabilities of current monitoring methods with drone surveys and artificial intelligence analysis of beach visitor counts. Coverage refers to the amount of sampling in space and time. Accuracy is the closeness of people counts estimates to the true count. Precision is the closeness of repeated measurements. Data volume is the amount of data generated. Discrimination is the amount of change in the people truth count that can cause a distinguishable change in the people counting method. Granularity is the amount of detail captured by the counting method.
Lifeguard Counting ProgramDrone Surveys + AI Counting Program
Spatial coverage Unknown
Temporal coverage Low
Accuracy Medium
Precision High
Data volume
Discrimination
Granularity
Disclaimer/Publisher’s Note: The statements, opinions and data contained in all publications are solely those of the individual author(s) and contributor(s) and not of MDPI and/or the editor(s). MDPI and/or the editor(s) disclaim responsibility for any injury to people or property resulting from any ideas, methods, instructions or products referred to in the content.