Article

Application of End-to-End Perception Framework Based on Boosted DETR in UAV Inspection of Overhead Transmission Lines

by
Jinyu Wang
1,*,
Lijun Jin
1,
Yingna Li
2 and
Pei Cao
3
1
Shanghai Research Institute for Intelligent Autonomous Systems, Tongji University, Shanghai 200092, China
2
Faculty of Information Engineering and Automation, Kunming University of Science and Technology, Kunming 650500, China
3
State Grid Shanghai Electric Power Research Institute, Shanghai 200437, China
*
Author to whom correspondence should be addressed.
Drones 2024, 8(10), 545; https://doi.org/10.3390/drones8100545
Submission received: 27 August 2024 / Revised: 26 September 2024 / Accepted: 26 September 2024 / Published: 1 October 2024
(This article belongs to the Topic Civil and Public Domain Applications of Unmanned Aviation)

Abstract

:
As crucial predecessor tasks for fault detection and transmission line inspection, insulators, anti-vibration hammers, and arc sag detection are critical jobs. Due to the complexity of the high-voltage transmission line environment and other factors, target detection work on transmission lines remains challenging. A method for high-voltage transmission line inspection based on DETR (TLI-DETR) is proposed to detect insulators, anti-vibration hammers, and arc sag. This model achieves a better balance in terms of speed and accuracy than previous methods. Due to environmental interference such as mountainous forests, rivers, and lakes, this paper uses the Improved Multi-Scale Retinex with Color Restoration (IMSRCR) algorithm to make edge extraction more robust with less noise interference. Based on the TLI-DETR’s feature extraction network, we introduce the edge and semantic information by Momentum Comparison (MoCo) to boost the model’s feature extraction ability for small targets. The different shooting angles and distances of drones result in the target images taking up small proportions and impeding each other. Consequently, the statistical profiling of the area and aspect ratio of transmission line targets captured by UAV generate target query vectors with prior information to enable the model to adapt to the detection needs of transmission line targets more accurately and effectively improve the detection accuracy of small targets. The experimental results show that this method has excellent performance in high-voltage transmission line detection, achieving up to 91.65% accuracy and a 55FPS detection speed, which provides a technical basis for the online detection of transmission line targets.

1. Introduction

Insulators, anti-vibration hammers, and arc sags are essential components of transmission lines. Each plays a distinct role: insulators fix charged conductors and provide electrical insulation [1], anti-vibration hammers suppress inertial fluctuations between towers [2], and arc sags help detect the status of transmission lines [3]. Transmission lines, as links between power plants and distribution stations, are widely distributed in mountainous forests, rivers and lakes, fields and hills, etc. [4]. The complex and variable nature of the geographic environment makes detecting insulators, anti-vibration hammers, and arc sags challenging. Transmission lines are exposed for long periods to adverse conditions such as drastic temperature changes, wind and sun exposure, and voltage and mechanical stresses [5,6], which are prone to undetectable potential hazards such as missing insulator sheds [7], dislodged anti-vibration hammers [8], and tilted arc sags [3,9]. Thus, it seriously affects the safe operation of the entire power grid system [10]. Therefore, as preparation work for fault detection and high-voltage transmission line inspection tasks, inspecting insulators, anti-vibration hammers, and arc sags is vital.
In the past, the inspection of transmission lines mainly relied on manual visual inspection, which is inefficient and costly and prone to errors in leak detection and other situations [5]. Technological progress has driven the sustained development of intelligent robots [11] such as unmanned vehicles [12], unmanned aerial vehicles [13], and unmanned boats [14]. In particular, UAVs have made breakthroughs in high flexibility [15], safer operation [16], and cost reduction [17], which gives them broad application scenarios in the fields of search and rescue [10], military surveillance [18], urban planning [19], transportation [20], ecological security [21], and agricultural vegetation [22]. Regarding transmission line inspection, using UAVs is also of great value. For example, the use of drones is not only unaffected by whether the surrounding environment is harsh or not [12] but also allows drones to obtain a large number of image data exponentially more tremendously than humans at the same time [23]. Therefore, this paper focuses on accurately identifying high-voltage transmission line insulators, anti-vibration hammers, and arc sags: targets that UAVs take.
Compared to hyperspectral sensors, radar sensors, and infrared thermal sensors, optical sensors have the characteristics of low costs, fast imaging speeds, and easy operation [24]. Therefore, the task of the inspection of transmission lines based on optical sensors loaded on drones has attracted much attention [25]. Although UAVs can capture a large number of optical image data [23], due to the different shooting distances and angles [26,27], lighting [25], and other factors [26,27], which make the captured target images of insulators, anti-vibration hammers, and arc sags have problems such as mutual occlusion and small image proportions, inspecting transmission lines targets task such as insulators, anti-vibration hammers, and arc sags, which is complicated.
With the vigorous development of computer vision and deep learning technologies, more and more research has been using these technologies for object localization and detection. The object detection methods based on deep neural networks include two-stage Faster R-CNN [28], Mask R-CNN [29], single-stage SSD [30], YOLO [31], and the anchor-free models CornerNet [32] and CenterNet [33]. Lu et al. [34] combined a Multi-Granular Fusion Network (MGFNet) and Object Detection Network to identify minor defects in insulators under complex backgrounds accurately. Zhao et al. [8] used an improved YOLOv7 model to identify the corrosion of anti-vibration hammers in complex backgrounds. Song et al. [3] achieved the accurate segmentation of arc sags on transmission lines using CM-Mask RCNN. The more complicated the image background is, and the smaller the target proportion is, the worse the model recognition effect will be. Varghese et al. [35] detected insulator strings quickly in transmission lines by combining lightweight EfficientNetB0 and weight-based attention mechanisms. However, these methods require a series of designs for hyperparameters, such as anchor boxes.
The Facebook AI Research (FAIR) team has proposed an end-to-end object detection algorithm, Detection Transformer (DETR) [36], which avoids a series of post-processing processes such as NMS. It transforms object detection problems into ensemble prediction problems, opening up a new direction for using transformers for visual tasks. Lu et al. [37] used the CSWin transformer to obtain image features at different levels to achieve multi-scale representation and assist in multi-scale object detection. Rao et al. [38] proposed a Siamese transformer network (STTD)-based method that achieves unique advantages in suppressing image background to a lower level and highlighting targets with high probability. Huang et al. [39] used DETR as a baseline and combined it with the dense pyramid pooling module DPPM to detect smoke objects in forest fires at different scales. However, the DETR-series methods still face the issue of balancing accuracy and speed in detecting small targets in complex backgrounds.
To accurately identify small targets in transmission lines under complex backgrounds, this paper proposes a detection method for the insulator, vibration damper, and arc sag based on a deep neural network. The main contributions of this paper are as follows:
  • This paper proposes a transmission line insulator, anti-vibration hammer, and arc sag detection model called TLI-DETR. As an end-to-end target detection model, this model can accurately locate transmission line targets in complex backgrounds and achieves the best balance between calculation speed and detection accuracy, which would supply the basis for an overhead transmission line inspection strategy according to the existing standard, DL/T 741-2019 [40].
  • Considering the transmission line’s complex topography, this paper adopts the IMSRCR algorithm to enhance the edge feature while effectively suppressing noise, which assures subsequent image feature extraction.
  • This paper introduces MoCo’s extracted edge and semantic information into the feature extraction network as incremental information, which significantly enhances the robustness of the feature extraction from detection targets and effectively boosts the detection accuracy of transmission-line small targets.
  • Aiming at the rectangular features of transmission line targets in drone aerial images and the size changes caused by shooting angles and distances, this paper conducts statistical analysis on the area and aspect ratio of the dataset. Based on this prior information, the TLI-DETR model generates object query vectors to better adapt to the detection needs of transmission line targets.

2. Related Work

The detection of transmission line components based on optical images is mainly realized based on image processing and vision technology.
The traditional detection of transmission line components is mainly achieved through image processing technology. Zhai et al. [41] regarded the insulator fault detection problem as a morphological detection problem, first locating the insulator by fusing its color and gradient features, then separating the insulator through its salient color features, and finally using adaptive morphology to identify and locate faulty insulators. Huang et al. [42] used image gray-scale processing, local difference processing, edge intensity mapping, and image fusion to enhance the features of the shockproof hammer, followed by threshold segmentation and morphological processing to segment the shockproof hammer. Finally, they identified the shockproof hammer accurately using the rusting area ratio and color difference index parameters. Song et al. [1] used a segmentation algorithm to obtain the center coordinates of the arc sag and then combined beam-method leveling, the spatial front rendezvous, and spatial curve fitting methods to achieve the purpose of the economical and efficient inspection of the arc sag. Wu et al. [43], considering that a bird’s nest’s branches are characterized by disorder and distribution diversity, proposed to use two different types of histograms, the histogram of strip direction (HOS) and histogram of strip length (HLS), to capture and learn the bird’s nest’s direction distribution and length distribution, using a vector machine to model and understand the bird’s nest patterns.
Neural-network-based transmission line component detection is mainly achieved using existing and relatively advanced methods. To solve the problem that the same category defects of vibration-proof hammers behave diversely and various category defects are highly similar, Zhai et al. [2] introduced the geometric feature learning region into the Faster R-CNN network, and this can improve the model’s ability to distinguish between ordinary anti-vibration hammers and defective anti-vibration hammers. Song et al. [3] effectively solved the problems of the high cost and low efficiency of existing arc sag detection algorithms for power lines by combining the CAB attention mechanism and MHSA self-attention mechanism in the Mask R-CNN network. Li et al. [5] solved the problem of low accuracy in bird’s nest detection on high-voltage transmission lines by introducing a coordinate attention mechanism, zoom loss function, and SCYLLA-IoU loss function into the YOLOv3 network. In the work of Feng et al. [44], to solve the problem of having many insulators in the distribution network with slight differences between classes, the detail feature enhancement module and the auxiliary classification module were introduced into the Faster R-CNN network to improve the ability to distinguish similar insulators. To solve the poor robustness of existing target detection algorithms in complex environments, Dian et al. [45] proposed a Faster R-Transformer insulation detection algorithm that combines CNN and self-attention mechanisms to improve the accuracy of insulator detection under different lighting scenarios and angles.
In addition, some studies currently address issues such as complex backgrounds and small target proportions in UAV-captured images. To solve the problem of the difficulty of detecting small target faults in insulators in a complex environment, Ming et al. [1] introduced an attention mechanism fusing the channel and the position in the YOLOv5 model, and this can improve the detection accuracy of insulators by the strategy of first achieving identification and then fault detection. To solve the problem that neural networks do not pay enough attention to the regions of tiny defective insulators, Lu et al. [34] proposed a network that integrates a progressive multi-granularity learning strategy and a region relationship attention module, and this can achieve the goal of providing a more accurate diagnosis of the faulty insulator regions. Bao et al. [46] introduced a parallel attention mechanism (PMA) module in the YOLOv4 network to solve the problems of the small proportion and sparse distribution of shockproof hammers in images in a complex environment, allowing the network to focus more attention on the location areas of faulty shock absorbers in images. To solve the problem of the difficulty in identifying the location information of bird nests and risk level information, Liao et al. [47] used Faster R-CNN to locate the towers. Then, they mined each tower’s structural information and found its key points. Finally, they used the high-resolution network HRNet to detect tiny bird nests accurately and discriminate risk levels.
It can be inferred from previous studies that complex backgrounds and small target proportions generally limit the current transmission line inspection methods. Our summary of these studies is as follows.
Algorithms based on traditional image processing mainly achieve target detection by learning a lot of a priori knowledge and manually designing target features. Conventional image processing methods can achieve target detection and fault warning to a certain extent. Still, the algorithms’ robustness could be better, the model structures are relatively complex, and the detection accuracy could be higher, especially under complex background and small target proportions, where misdetection and wrong detection often occur.
Compared with traditional image processing methods, the key to the excellent performance of the method based on deep neural networks lies in its strong ability to extract image features, characterize image potential information, and train large amounts of data. However, most of the current research is aimed at the personalized design detection of the features of one or two categories of components of transmission lines. There are also models specifically designed to detect small target components of transmission lines. Nevertheless, in the task of simultaneously detecting multiple small targets such as transmission line insulators, anti-vibration hammers, and arc sags, most existing methods with significant detection effects require complex post-processing processes such as NMS; that is, there are few end-to-end models, and most consume more time.
In summary, we hope to provide a method based on computer vision technology with fast computing speed, high accuracy in detecting multiple small objects under complex backgrounds, and strong model generalization. Therefore, we focus on the Detection Transformer target detection method based on a transformer. Then, combined with the actual background of the UAV’s image and the detection targets’ visual characteristics, we propose a detection method for transmission line targets.

3. Basic Components of TLI-DETR

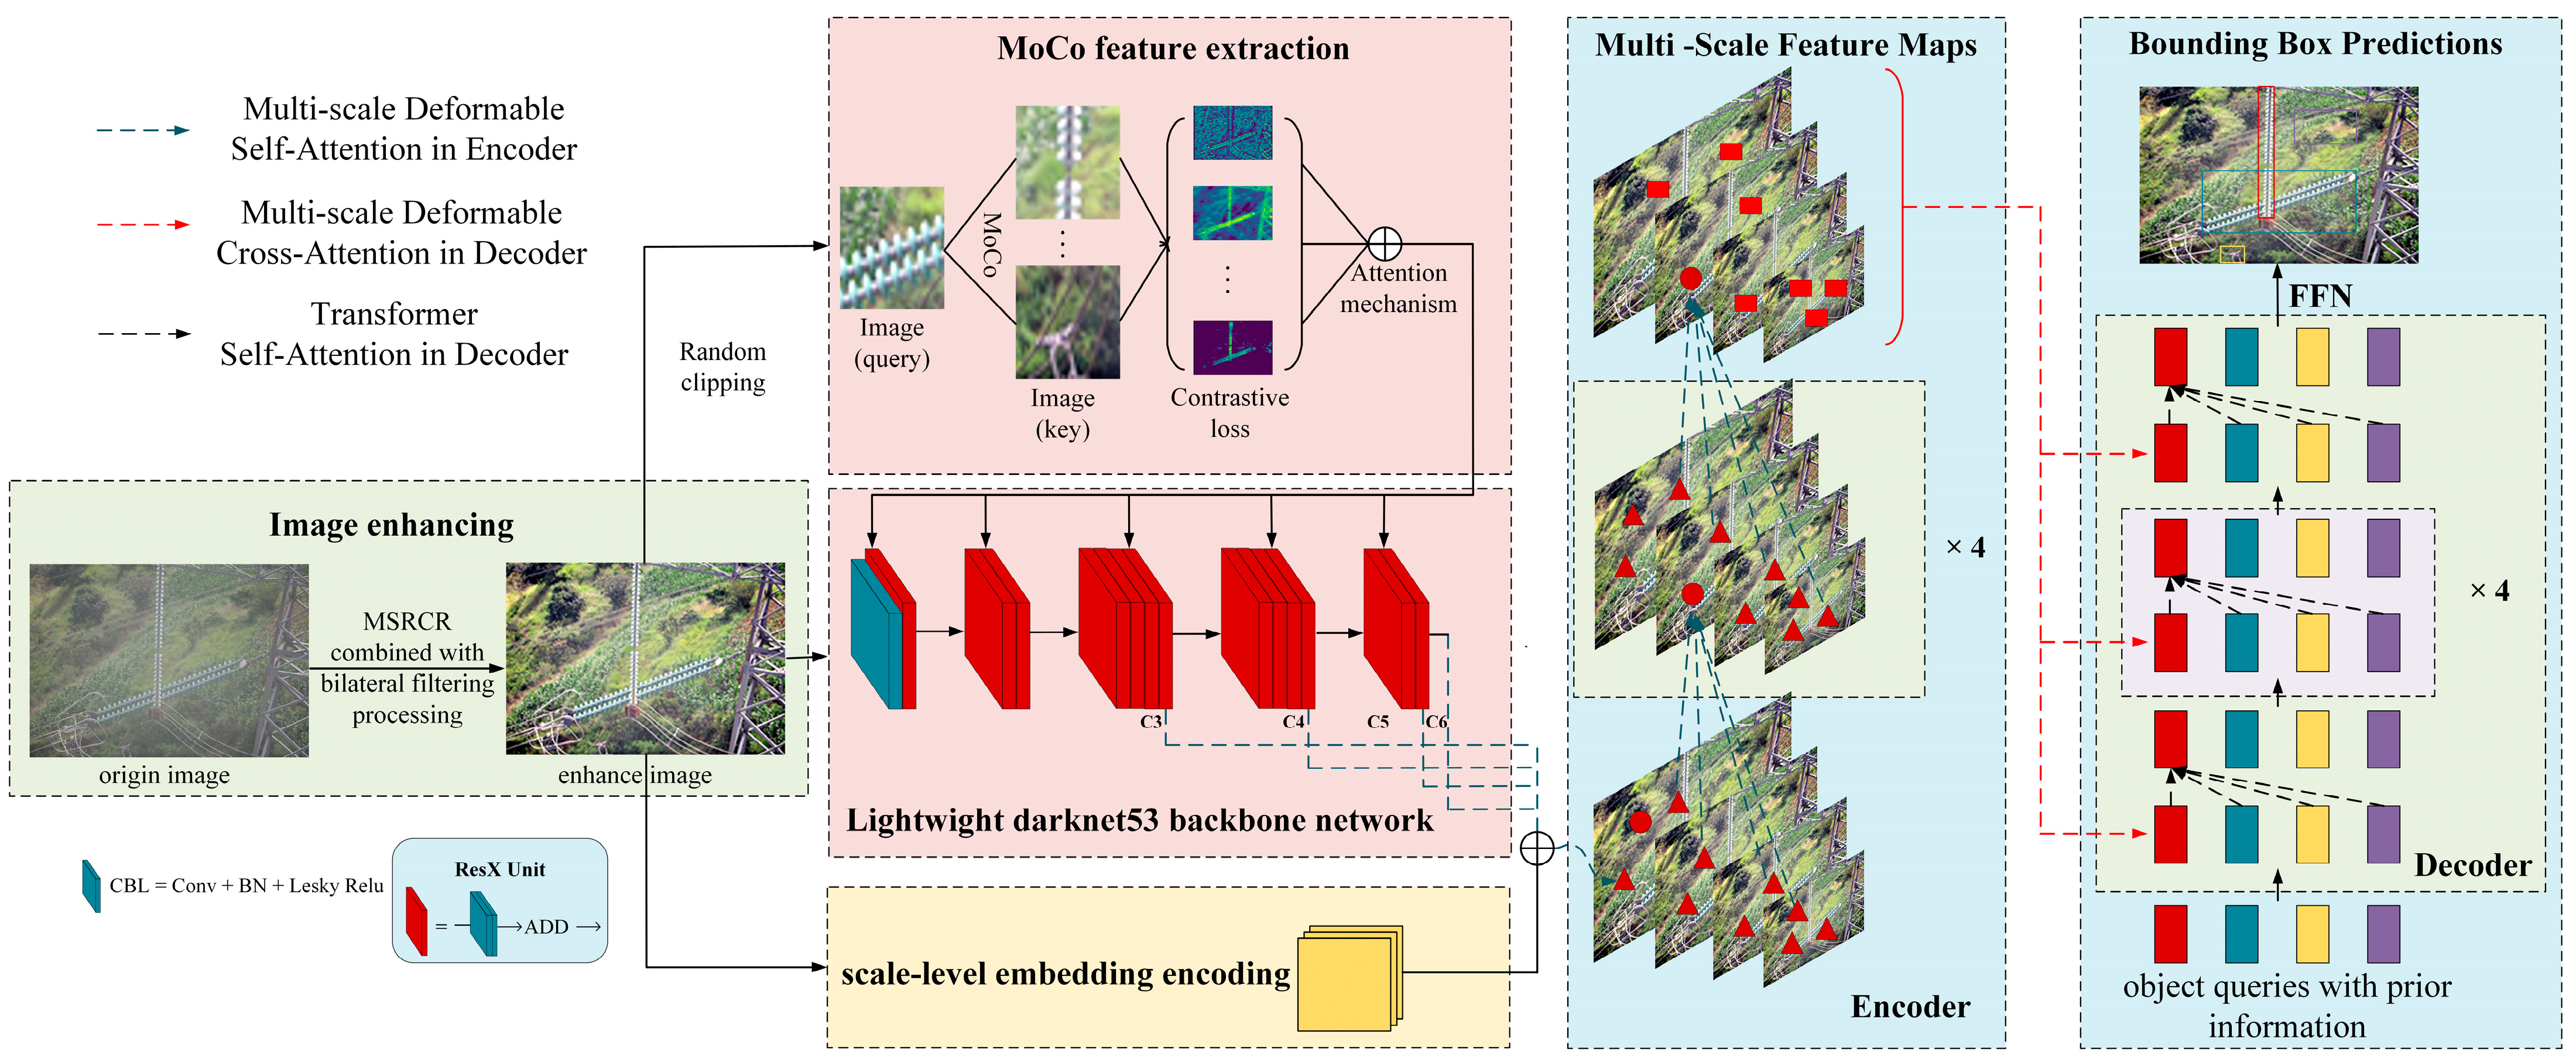
The transmission line inspection images of UAV aerial photography have complex backgrounds; the target occupies a small percentage and is easily occluded, making extracting the target features challenging. As depicted in Figure 1, this article constructs a convolutional neural network (CNN), a feature extraction network based on the Darknet53 [48], and an encoder and a decoder module based on the transformer. Finally, a detector based on DETR is used to construct the model. The TLI-DETR model in this research can explore subtle details in transmission line targets, which is beneficial for optimizing the model and providing a new approach for transmission line inspection work.
Target detection models often rely on backbone networks such as ResNet, VGG16, and Darknet53 to mine image feature information. Darknet effectively alleviates the common problems of gradient explosion and vanishing in network training by integrating residual structures and omitting the use of residual layers. Unlike the ResNet series, Darknet53 maintains excellent classification accuracy while streamlining the network architecture and accelerating the computing speed.
Consequently, this paper constructs the backbone network for the TLI-DETR model based on Darknet53. It is worth noting that this article focuses on small object detection for overhead transmission lines, which contrasts with the data characteristics of universal targets. The deeper the network layers are, the more abstract the extracted image features will be, which is unfavorable for small object detection. As shown in Table 1, the backbone network in this article significantly reduces the use of residual structures. In addition, a lightweight design can accelerate the inference speed of the model.
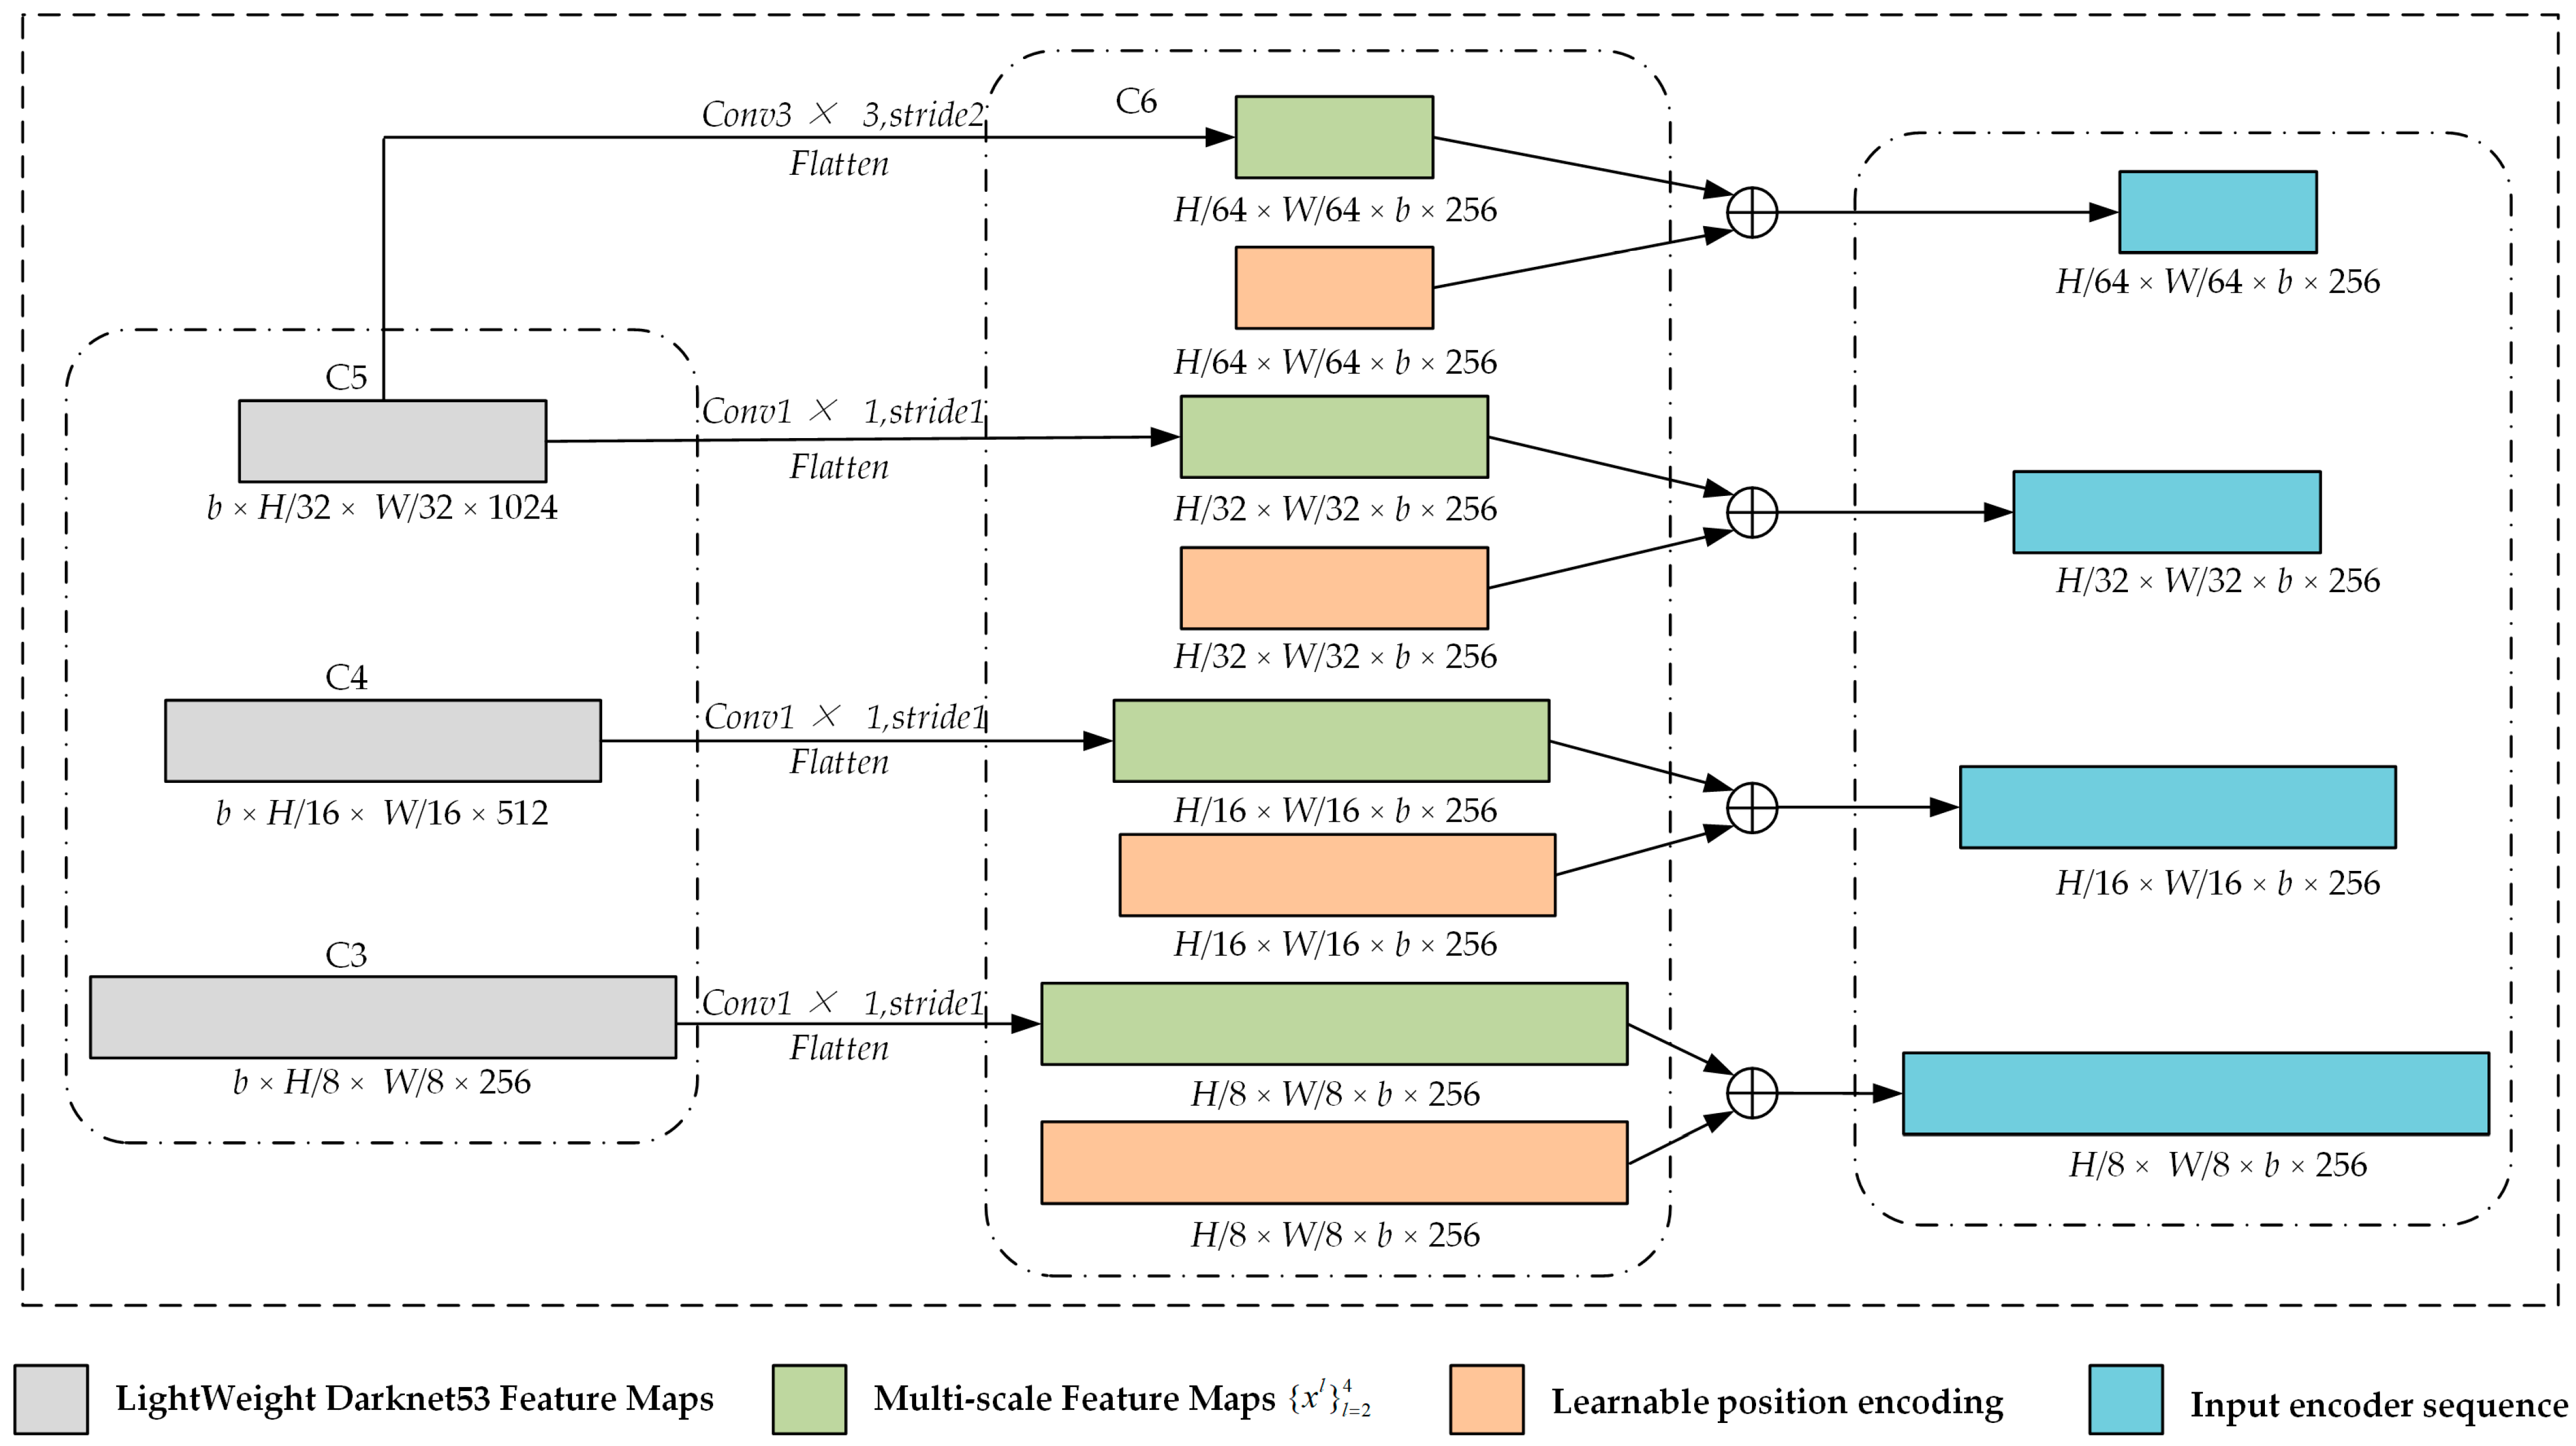
To detect the diversity of target sizes in transmission lines, as depicted in Figure 2, TLI-DETR extracts feature maps at different levels from the backbone network to obtain multi-scale and multi-semantic-level feature maps. Deeper-level feature maps have larger receptive fields and higher semantic information but lower spatial resolution while shallow-level feature maps have higher spatial resolution and more detailed local information.
This paper uses learnable positional encoding to embed global and local positional information to capture the target’s positional features. This assists the model in capturing the image features of transmission lines at different scales. Adding feature information and positional encoding features together and using the added result as input for the encoder effectively improves the feature extraction performance.
A multi-head deformable attention module, an encoder for the TLI-DETR model, can process features of different scales. By utilizing multi-scale deformable attention, we can concentrate on processing local regions closely related to the target, efficiently capture local features, and significantly reduce the resource consumption required for processing. Then, by designing multiple encoder layers, the model gradually integrates local and global information, effectively highlighting target feature information at different scales in complex backgrounds. The expression of the attention mechanism is as follows:
M S D e f o r m A t t n ( z q , p ^ q , { x l } l = 1 L ) = m = 1 M W m [ l = 1 L k = 1 K A m l q k . W m x l ( l ( p ^ q ) + Δ p m l q k ) ]
Among the above variables, M represents the number of multi-head attention points, K represents the number of points sampled from the feature map, and L represents the input feature level. In the i t h feature layer and the k t h sampling point in the j t h multi-head attention, A m l q k , p ^ q [ 0 , 1 ] 2 , and Δ p m l q k represent the attention weight, 2 d standardized coordinates, and coordinate offset, respectively. It is worth noting that the l = 1 L k = 1 K A m l q k = 1 normalization of attention weights A m l q k and l ( p ^ q ) means that the 2 d normalized coordinates are re-normalized to the input feature map of the l t h layer. In addition, the multi-scale deformable attention mechanism predicts the offset coordinates relative to the reference point rather than directly predicting the absolute coordinates, which is more conducive to model optimization and learning.
The decoder interacts with the encoder’s output features using the query vector and then progressively updates the target query vector through multi-layer decoding and attention mechanisms, ultimately generating a set of feature representations containing the target bounding box and category prediction.
The TLI-DETR model’s prediction head uses a binary matching algorithm to eliminate processes such as NMS processing. This significantly improves the model’s accuracy and reduces the detection time, thus meeting the demand for the real-time monitoring of transmission lines.
TLI-DETR considers the transmission line’s predicted and actual targets as independent sets with N elements. It includes all possible permutations and combinations of N elements (N is larger than the number of targets in the image. If the number of targets in an image is not enough to be N, it is acquiesced to be the background). Then, it uses the Hungarian algorithm for bipartite graph matching; that is, it compares each element of the predicted set y ^ and the actual set y individually, hoping to find an optimal arrangement and combination σ ^ to minimize the matching loss L m a t c h between the two sets.
σ ^ = arg min σ S N i N L m a t c h ( y i , y ^ σ ( i ) )
The matching loss L m a t c h considers the class prediction loss and the similarity between the predicted and actual boxes.
L m a t c h ( y i , y ^ σ ( i ) ) = 1 { c i } p ^ σ ( i ) ( c i ) + 1 { c i } L b o x ( b i , b ^ σ ( i ) )
Here, each element i of the labeling box is regarded as y i = ( c i , b i ) , c i represents the category number of the labeling target (which can be ), and b i [ 0 , 1 ] 4 represents the central coordinate of the annotation box and its width and height vector relative to the image size. The prediction set index element σ i defines its category c i probability as p ^ σ ( i ) ( c i ) and the prediction box as b ^ σ ( i ) .
Upon matching the predicted and actual sets, the Hungarian algorithm establishes a one-to-one correspondence between the transmission line bounding boxes and their corresponding predicted target boxes. Then, it calculates the loss function of DETR. The loss function of TLI-DETR consists of the loss of the prediction of the detection target categorization and the loss of the accuracy of the size of the prediction of the target detection boxes, which is shown in (4):
L H u n g a r i a n ( y , y ^ ) = i = 1 N [ log p ^ σ ^ ( i ) ( c i ) + μ X { c i } L b o x ( b i , b ^ σ ^ ( i ) ) ]
Here, σ ^ is the optimal match in Formula (2), and it is worth mentioning that to solve the issue of classification imbalance in the target detection of transmission lines, this paper adopts a reduction of the logarithmic probability value in its classification loss by a factor of 10 when predicting the category c i = .
In the regression loss of the predicted size of the detection box, most of the previous regression targets consist of calculating the offset between the predicted value and the actual value. At the same time, this paper uses the direct regression method, which positively impacts the accuracy of prediction boxes, simplifies the learning process, and improves computational efficiency. Additionally, considering that L 1 is sensitive to the size of the scale and G I o U is insensitive to the size of the scale, to mitigate the influence of the loss function on the prediction boxes of different scales, the regression loss of the target detection box in this paper uses the weighted sum of the L 1 loss and the G I o U loss.
L b o x ( b i , b ^ σ ^ ( i ) = λ g i o u L g i o u ( b i , b ^ σ ( i ) ) + λ L 1 b i b ^ σ ( i ) 1
Here, the weight value λ g i o u of the loss function between boxes is 2; the center coordinates, width, and height loss functions have weights ( λ L 1 ) of 5.

4. Transmission Line Detection Using TLI-DETR

Transmission line detection tasks using TLI-DETR have achieved good results, but there is still potential for improvement in the accuracy of small target detection. Therefore, as depicted in Figure 3, the transmission line detection task using TLI-DETR has achieved good results. However, there is still potential for improvement in the accuracy of small object detection. Consequently, the structured TLI-DETR model is more suitable for target detection tasks in transmission lines. As shown in Figure 3, the model can highlight details such as edges and suppress noise through IMSMCR. This paper, through MoCo, extracts small objects’ edge and texture details and inputs them as auxiliary features into TLI-DETR. It then conducts a statistical analysis of the area and aspect ratio of transmission line targets, generating an object query vector with prior information to more accurately match the task of detecting transmission line targets.

4.1. Image Enhancement

The image quality dramatically affects the detection accuracy of the TLI-DETR model. Transmission lines are located in complex environments such as mountainous forests, rivers, and lakes, with few differences between transmission line targets and backgrounds. This research adopts the IMSCRR algorithm to obtain cleaner and more accurate edges and then provide assurance for subsequent feature extraction.
Optical images will inevitably be disturbed by noise, and the process of removing noise is image denoising. Common image denoising methods include median filtering [49], Gaussian filtering [50], and bilateral filtering [51]. The effect of median filtering depends on the noise’s density; dense noise can cause problems such as blurred details and overlapping edges. The Gaussian filtering method has significant advantages in retaining image edge information and avoiding the ringing phenomenon; however, the adjustment process is very troublesome. Bilateral filtering usually requires similarity processing involving a certain pixel point in an image and its surrounding proximity pixels. Bilateral filtering can obtain corresponding Gaussian variance and preserve the image edge information better. The formula for bilateral filtering is presented in (6).
g ( x , y ) = i j f ( i , j ) ω ( x , y , i , j ) i j ω ( x , y , i , j )
Here, g ( x , y ) , ( x , y ) , and ( i , j ) refer to the output image after processing, the pixel value of the point, and the domain pixel value of the center pixel point, respectively. ω ( x , y , i , j ) is the multiplication of the distance template coefficient d ( x , y , i , j ) and the value domain template coefficient r ( x , y , i , j ) .
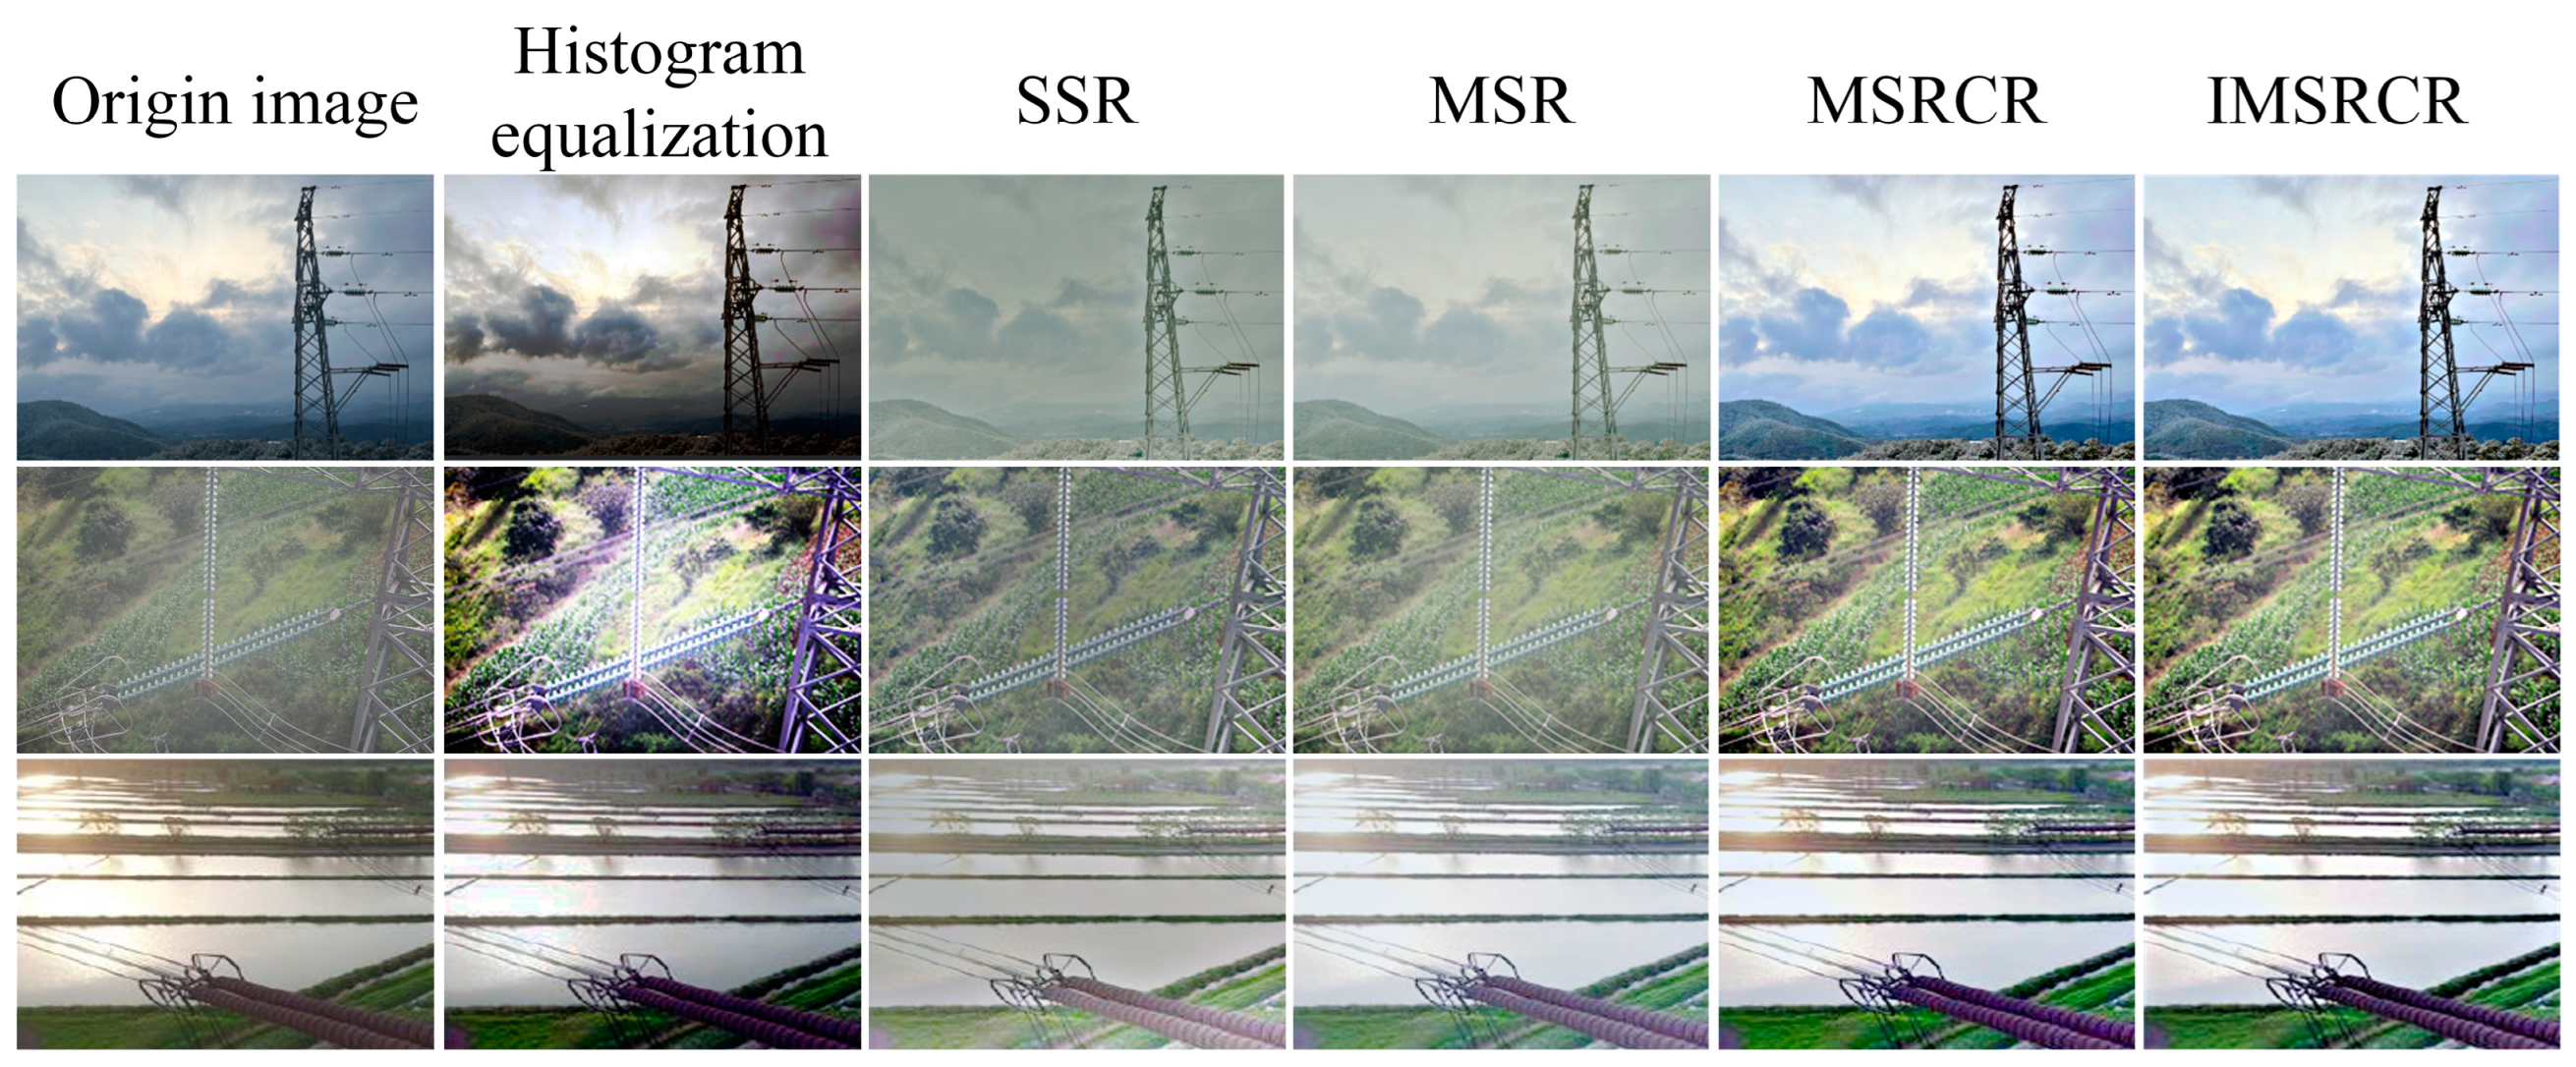
After image denoising, this paper performs enhancement operations on images to reduce the influence of complex backgrounds and other factors on the detection effect. Common image enhancement techniques include histogram equalization and the Retinex algorithm. As shown in Figure 4, the histogram equalization algorithm has an excellent overall enhancement effect. However, it is prone to problems such as the local over-enhancement of images, which leads to the loss of local details. Although MSR can solve the negative impact of local over-enhancement, it can also cause the problem of color distortion. The MSRCR [52] algorithm compensates for color information to represent details such as edges and textures better. The MSRCR processing result is as follows:
R M S R C R i ( x , y ) = C i ( x , y ) R M S R i ( x , y ) = β R M S R i ( x , y ) [ lg [ I i ( x , y ) ] lg [ i = 1 N I i ( x , y ) ] ]
Here, β refers to the gain constant and α is used to adjust the nonlinear transformation; Jobsen’s [52] experiment shows that when α = 125 and β = 46 , one can obtain more ideal results in most images. I i ( x , y ) refers to the pixel value of the original image and C i ( x , y ) represents the colorimetric transformation factor.
The MSRCR algorithm can make image details more prominent, but its shortcomings are also evident. For example, MSRCR fails to effectively enhance the entire image’s details and is often accompanied by “artifacts”. IMSCRR uses bilateral filtering to denoise the image, obtaining a rough denoised image divided by the original image to extract detailed images. The rough image is subjected to MSRCR processing and the detailed parts are restored to the processed image. IMSCRR not only leverages the advantages of MSRCR by preserving image color information but also effectively suppresses the impact of different lighting conditions on the image. Adding details can solve the problems of the reduced richness and clarity of image information caused by the loss of detail information in MSRCR. The processing is as follows:
1.
Bilateral filtering is used to denoise the input image P s r c and obtain the desired rough image P r o u g h .
P r o u g h = B I ( P s r c )
2.
The input image P s r c is divided by the rough image P r o u g h to obtain the desired detailed image P d e t a i l .
P d e t a i l = P s r c P r o u g h
3.
Using MSRCR to process the rough image P r o u g h after bilateral filtering denoising, the image enhancement is performed to obtain the enhanced image P M S R C R .
P M S R C R = M ( P r o u g h )
4.
The detail image P d e t a i l obtained in step (2) is multiplied with the MSRCR-enhanced image P M S R C R obtained in step (3) to obtain the final image P I M S R C R .
P I M S R C R = P M S R C R P d e t a i l
The purpose of IMSRCR is mainly to add the detailed information of the detail map P d e t a i l in P M S R C R . The edge details of P d e t a i l have a higher weight and the multiplication has a reinforcing effect on the details of P M S R C R .

4.2. Momentum Contrast (MoCo)

After image enhancement, transmission line images’ edge and semantic information will have been effectively enriched. This research aims to introduce this information into model training to boost the accuracy of the TLI-DETR model in the tasks of detecting transmission line insulators, anti-vibration hammers, and arc sags. As shown in Figure 5, this paper enhances the discrimination between the small target image and the background and the expressive ability of the model, which uses MoCo [53] to pre-extract the image features before sending the image of the transmission line into the feature extraction network and then enhances the robustness of the model.
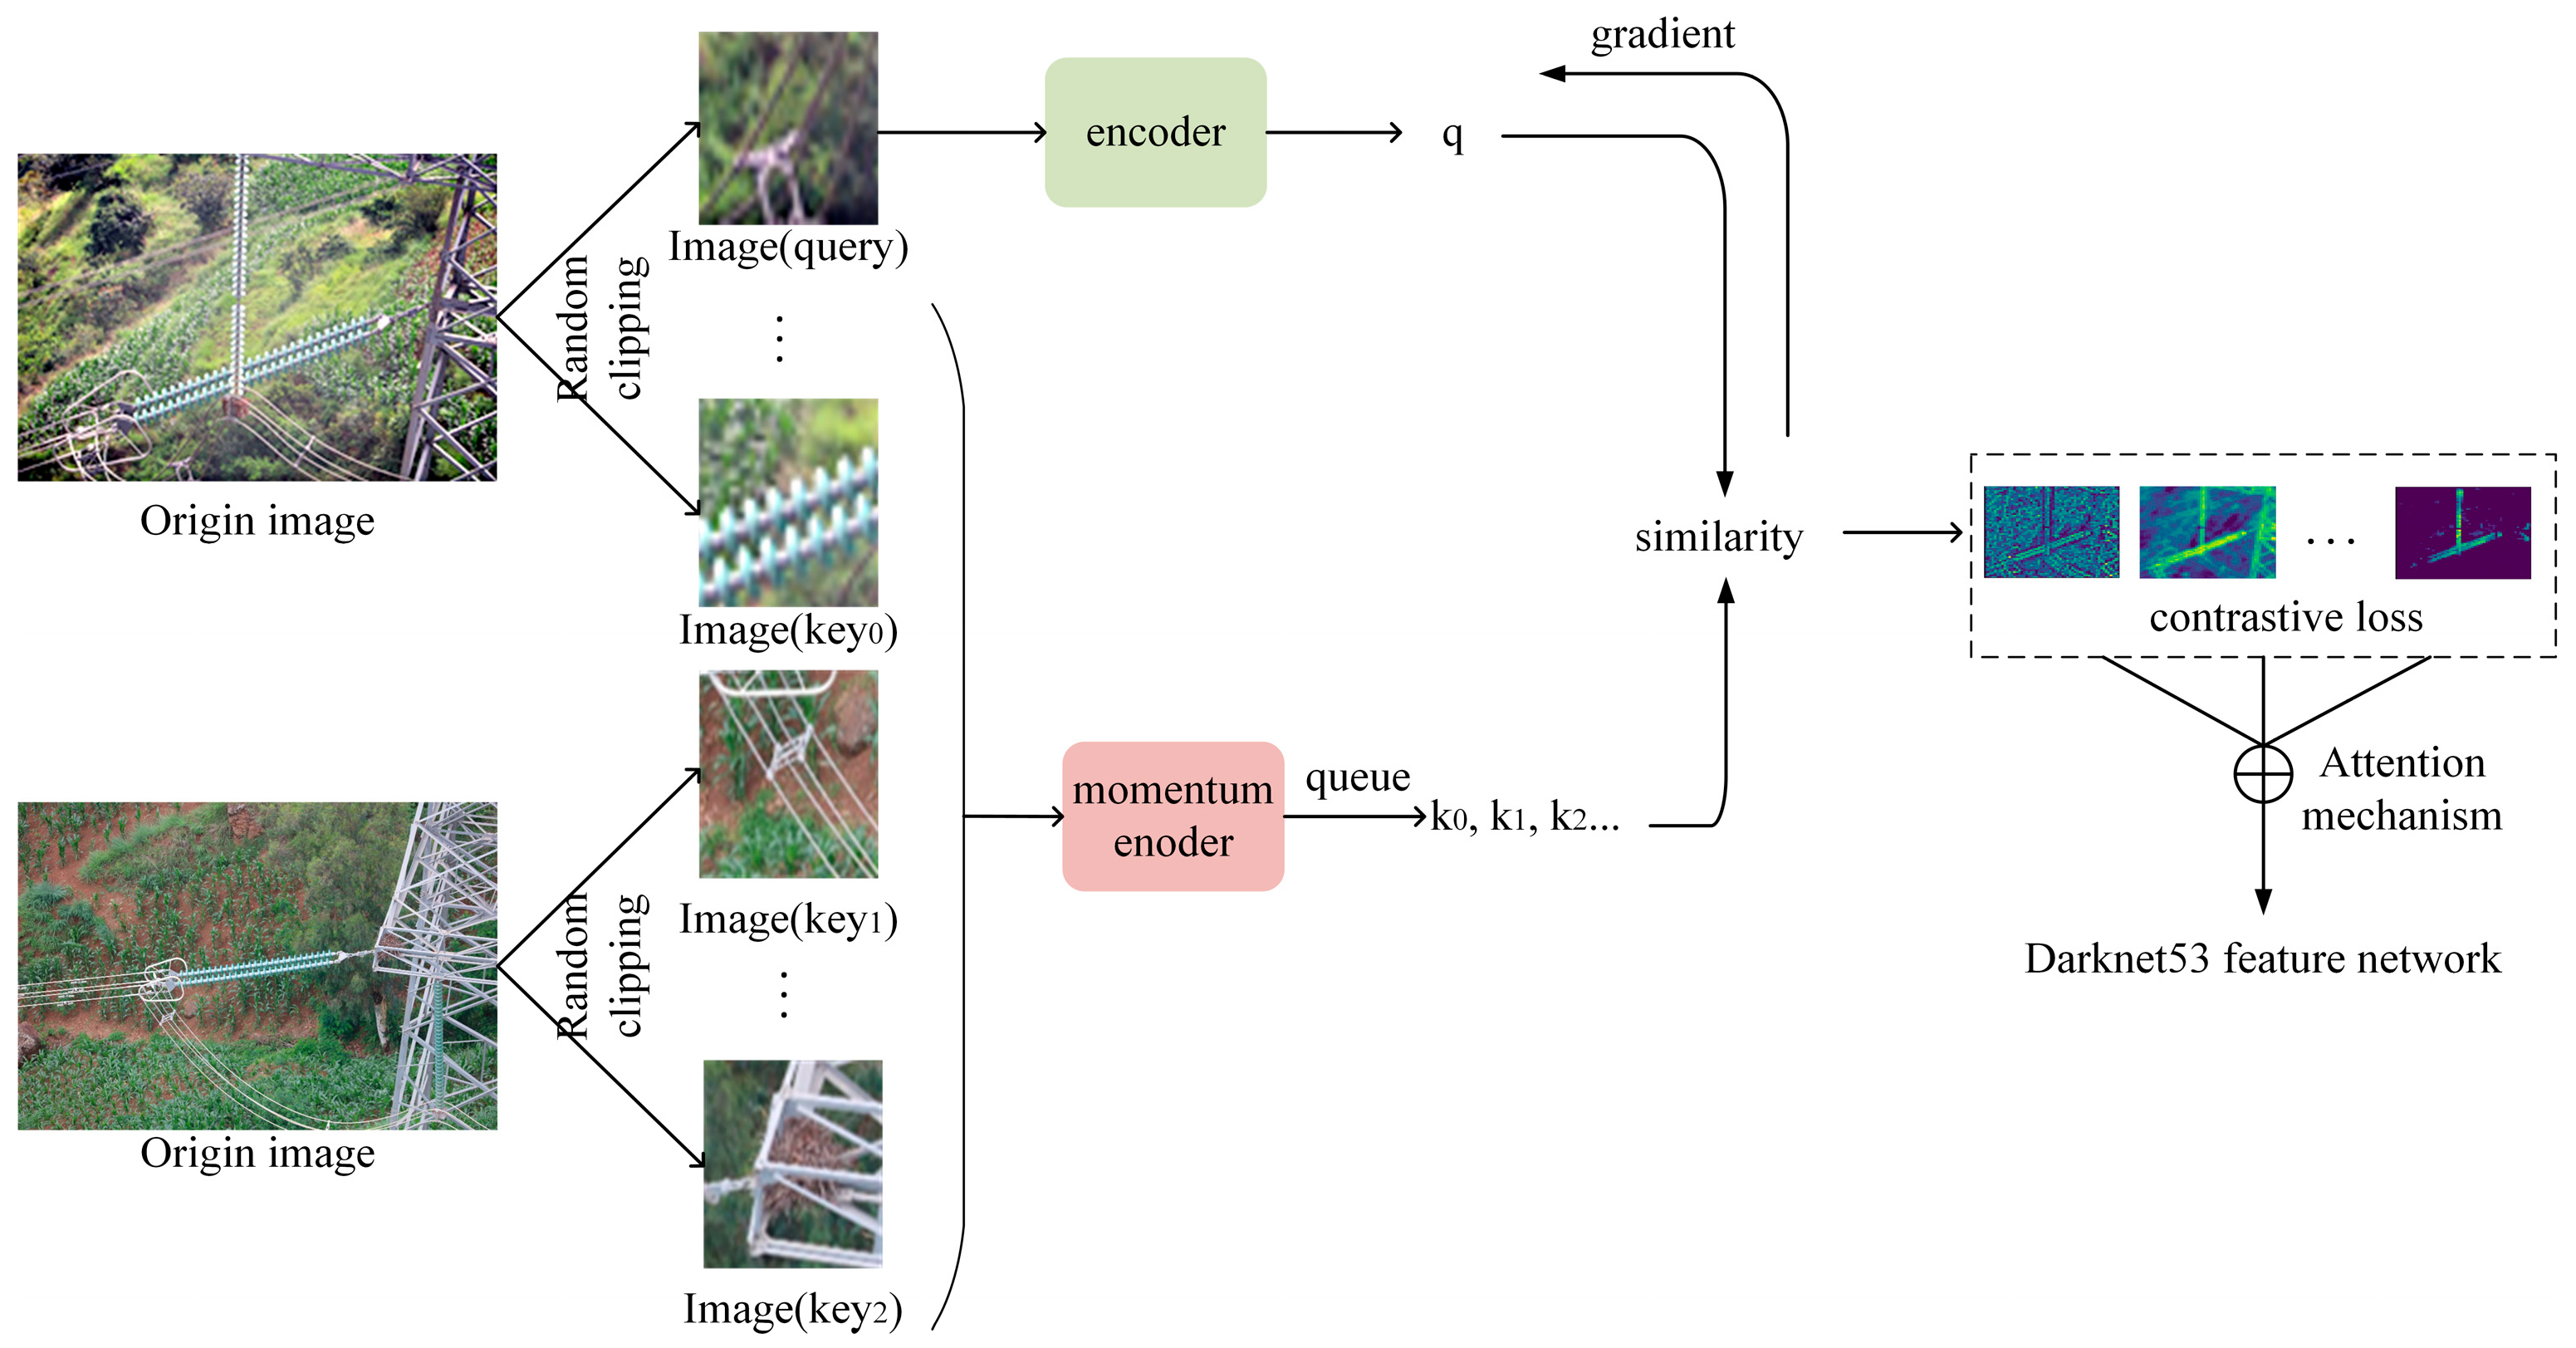
Through contrastive loss learning, the MoCo model makes positive sample pairs of image features as similar as possible in the feature space and negative sample feature pairs as far away as possible. In other words, it makes the features between similar objects as close as possible and those between dissimilar objects as far away as possible. MoCo includes a query encoder and a momentum encoder. The query encoder processes samples from the current batch while the momentum encoder processes historical samples and stores them in a dictionary. The parameter update of the momentum encoder is performed by querying the weighted average of the encoder parameters. The query encoder encodes query samples while the momentum encoder encodes key samples.
θ k m θ k + ( 1 m ) θ q
Here, m is a momentum parameter in the range of [0,1); backpropagation only updates the coding parameter of the image query. The encoding parameters of the current image key are slowly updated based on the previous key encoding parameters and the current query encoding parameters.
As depicted in Figure 6, MoCo randomly crops two images with the same scale (48 × 48) from any two images (512 × 512) in the transmission line and encodes them as the query and key, respectively. Among them, different views of the same image (such as image (query) and image (key0)) and views of other images (such as image (key1) and image (key2)) are referred to as positive sample pairs and negative sample pairs, respectively. MoCo uses momentum contrast loss to train the matching of the query and key and calculates the similarity between query samples and all key samples. It obtains different vectors by calculating the momentum contrast loss between two images. Then, an attention mechanism is used to compress this vector information, subjected to linear layer projection or dimension expansion operations. Finally, this vector information is used as a parameter for the residual layer in the lightweight Darknet53 network to help in model training.

4.3. Object Query Vector with Prior Information

Most detectors adopt pre-training strategies on ImageNet and COCO datasets to obtain prior information on generic targets. However, the insulators, anti-vibration hammers, and arc sags captured by drone aerial photography fall outside the scope of universal targets as they only appear in power systems. Considering the shape characteristics of transmission line targets, this paper generates an object query vector with prior information before network training, which makes it more suitable for the target detection task involving the UAV aerial photography of transmission lines.
The proportion and shapes of transmission line targets in the image are relatively low and long, respectively. As shown in Table 2, the statistical analysis of the area of the labeled box for power line targets reveals that the majority of transmission line target areas range from 30 to 300. As shown in Table 3, according to the aspect ratio statistics, most transmission line target aspect ratios are concentrated around 0.3 and 3.
Meanwhile, considering the impact of randomly initializing the target query vector on the difficulty and convergence speed of model optimization, we set [50, 80, 120, 240, 320] and [0.3, 1, 3] as the initial positions and biases of the target query vector to precisely narrow down the search space for the mapping relationship between the target query vector and the target truth.
Subsequently, the image is mapped into a feature map with dimensions of 16 × 16 × b × 256 through convolution operation. Then, the vector dimension is compressed by flattening operation to obtain o s F 256 × b × 256 · i. To ensure consistency between the target query vector and the decoder feature space, this paper uses a linear layer to map feature o s F :
o s T = G E L U ( W s o s F + ζ s )
Among the above variables, o s T denotes the prior target query vector of the final input decoder, G E L U represents the Gaussian-error linear unit activation function, and W s and ζ s represent the linear layer weight matrix and bias, respectively. By utilizing target query vectors with prior knowledge, the model accurately captures critical features of transmission line images, thereby efficiently identifying and detecting targets.

5. Experiments and Analysis

5.1. Experiment Description

Considering that the current publicly available transmission line dataset only has CPLID [26] and obtains most of the components inside through simple operations such as flipping and cropping, it cannot fully meet the application of the object detection model in actual transmission lines in this paper. This article uses the drone aerial photography of a 500KV overhead transmission line at a certain location in the Yunnan province of China as the data acquisition source. The line mainly includes critical components such as insulators, anti-vibration hammers, and arc sags, generally located at high altitudes and widely distributed in fields and forests. When drones photograph transmission line targets, we try to avoid obstruction caused by forests, towers, etc. The image resolution is 512 × 512 to verify the effectiveness and feasibility of the model.
In addition, we use LabelMe to label transmission line targets and to better separate the transmission line targets from the image background; this paper uses the magenta color to label the targets. This dataset has 3000 images; the training set contains 2500, and the test set includes 500. In addition, the dataset contains 3926 insulators, 1043 anti-vibration hammers, and 215 arc sags targets. The Yunnan province is in a high-altitude mountainous area with complex geological structures and a rainy and foggy climate. The test set includes transmission line images with uneven lighting and blurring to verify the robustness of the model proposed in this paper. Table 4 shows this research’s experimental environment configuration.
During training, the AdamW optimizer [54] attenuated the model’s weight and set the weight attenuation parameter to 1 × 10⁻⁴. The batch size is 8. The object queries are set to 100; each graph will eventually output 100 prediction classes and frames of prediction results, containing some empty sets. The backbone network and subsequent detection learning rates are 1 × 10⁻⁵ and 1 × 10⁻⁴, respectively.
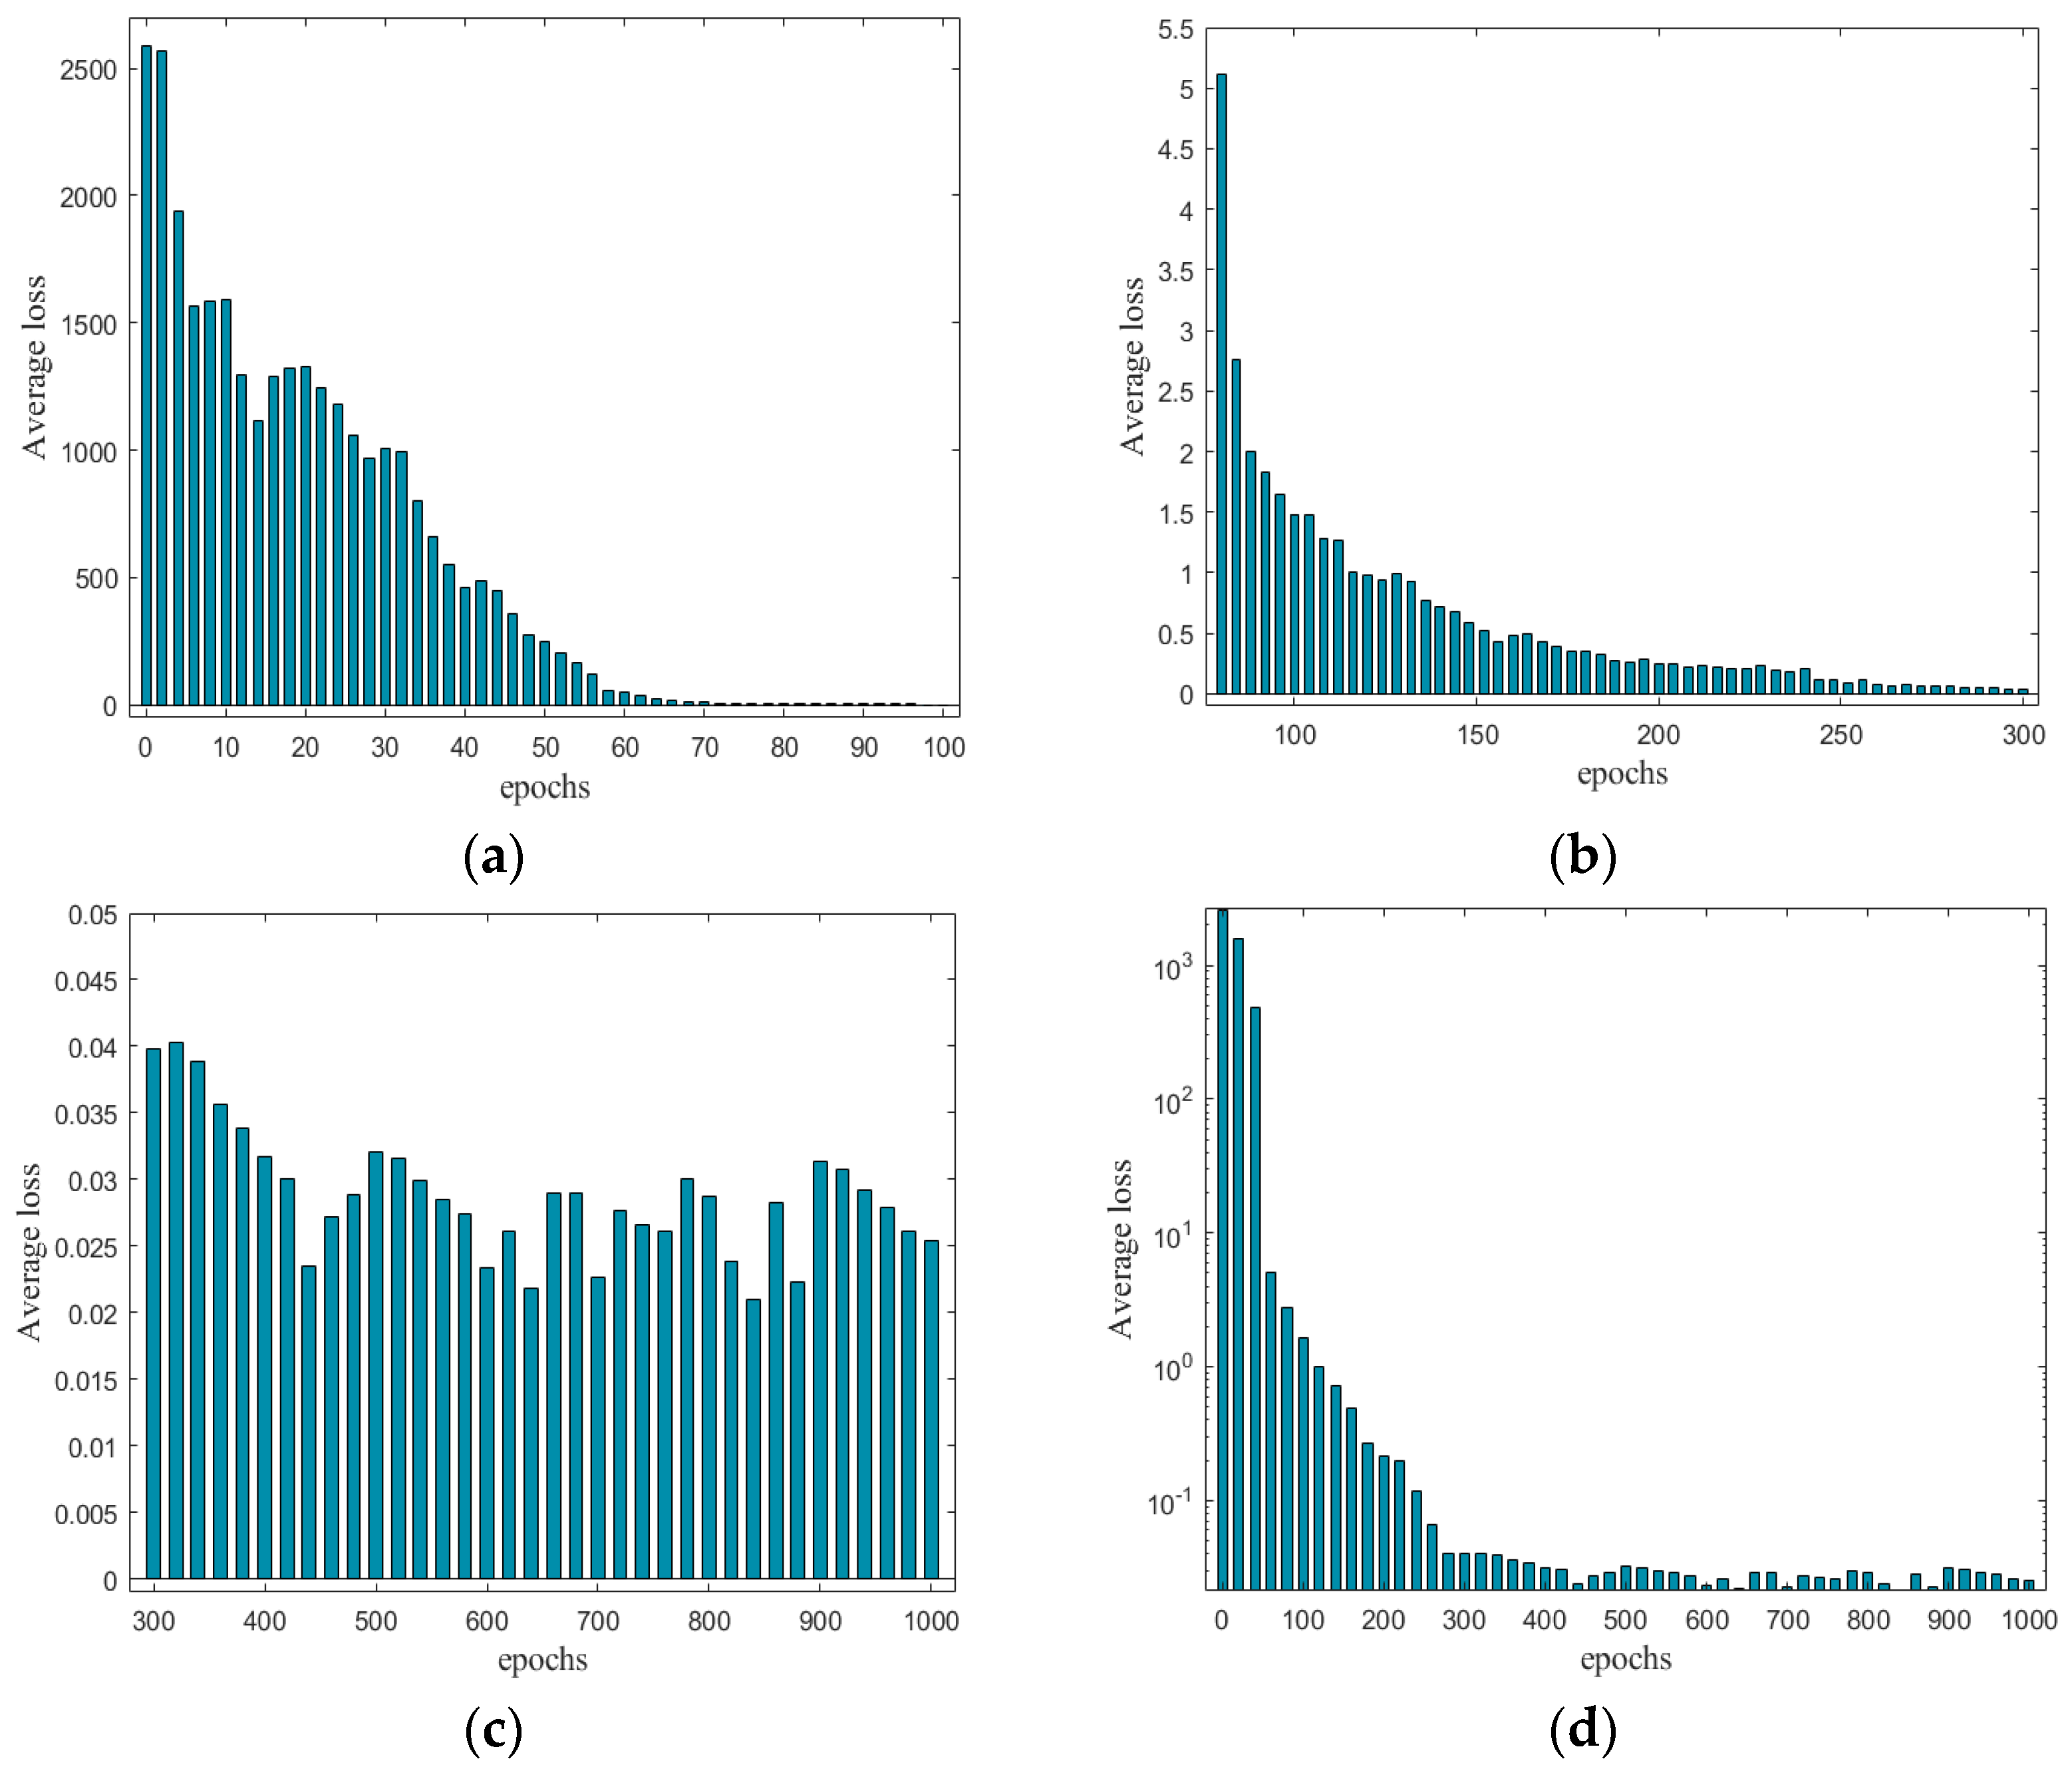
Figure 7 shows the loss function’s variation with the number of training epochs of the TLI-DETR network. When the numbers of epochs are 100, 300, and 400, the average loss value first sharply declines and then stabilizes. When the average loss is 0.03, the TLI-DETR model’s accuracy can already be guaranteed. To further ensure the accuracy of the TLI-DETR model, the weight files generated during training are saved every 100 epochs for subsequent model validation.

5.2. Quantitative Evaluation

The target localization of transmission lines can be summarized as a classification problem using the average accuracy (AP) of the COCO dataset [55] to measure the performance of the model. The traditional IoU is the intersection and union ratio between the predicted and actual boxes. Compared with the IoU, the GIoU additionally considers the minimum outer rectangle of the predicted and actual boxes and its difference region with the concatenation region, effectively alleviating the gradient disappearance problem under non-overlapping rectangular boxes. The correct and incorrect pixels in the detection classification are marked as true positives (TPs) and false positives (FPs). The detection classification result is the background and the actual detection target is marked as a false negative (FN). The number of image frames that the model can process per second is the FPS. The definitions for the IoU, GIoU, precision, recall, and FPS are as follows:
I o U ( b ^ i , b j ) = b ^ i b j b ^ i b j
G I o U ( b ^ i , b j ) = I o U ( b ^ i , b j ) | C \ b ^ i b j | | C |
P r e c i s i o n = T P T P + F P
R e c a l l = T P T P + F N
F P S = f r a m e t i m e
Considering that AP is targeted at a single category, and this research’s testing set includes three category labels—insulators, anti-vibration hammers, and arc sags—the average value or mean average precision (mAP) of multiple categories of AP is adopted as the measurement of the detection effect in this research. The number of image frames that the model can process per second is the FPS.
Table 5 shows the recognition performance of the proposed method on different target types of transmission lines. At the same time, other methods in the literature have also been provided, including the use of the two-stage Faster R-CNN network in reference [56], the DDN classifier in reference [26], the Faster R-Transformer model in reference [57], and the latest version of YOLOv8 [31] in the YOLO series. The four methods mentioned in the references are mainly used for insulator positioning, which requires preset analysis and the adjustment of hyperparameters such as model anchor boxes (rectangular), accounting for a relatively large proportion of the image in question. At the same time, arc sags, anti-vibration hammers, and bird nests mostly appear as squares in the picture and account for a relatively small proportion. More importantly, the background of high-voltage transmission line images captured by drones is complex, and the differences between target features such as insulators, shock absorbers, and spacers and the background are not significant, resulting in the unsatisfactory performance of these models. The self-attention mechanism in the DETR model based on a transformer calculates the relationship between each pixel and surrounding pixels without focusing on local areas closely related to small targets, resulting in room for improvement in the speed and accuracy of the model. However, the method proposed in this article achieves an accurate recognition rate of 91.65% in the target detection task involving transmission lines. In summary, the proposed method is more suitable for the multi-target detection of transmission lines without setting too many hyperparameters, such as anchor boxes, laying a solid foundation for subsequent fault diagnosis.

5.3. Sensitivity Analysis

In this section, this article conducts a sensitivity analysis of the improvements made to demonstrate that the improvements made to each part of the model are of practical significance. These include the selection of the image enhancement model, the choice of the feature extraction network, the selection of the multi-stage feature map, the decision of the value of the sampling point K, and the selection of the number of iterations.

5.3.1. The Selection of Image Enhancement Algorithm

This article selects the non-reference evaluation indicators called Information Entropy (EN) and the Average Gradient (AG) to evaluate the processing effect under different objects.
As shown in Table 6, After enhancing the images of transmission lines in this article, the EN obtained is slightly higher than the MSRCR results in insulator and anti-vibration hammer objects, and the increase is particularly significant in arc sag objects. The AG performs well in all three cases, increasing by 2.07, 6.02, and 3.14. In summary, the method proposed in this article can effectively restore the information of an image, and the image preprocessing method proposed is effective in three high-incidence scenarios, indicating that the adopted method has a certain degree of robustness.

5.3.2. The Selection of Backbone Network

While retaining the other TLI-DETR model improvements, we have conducted a sensitivity analysis of its backbone network.
As shown in Table 7, the VGG16 network has many hyperparameters and is too complex to compute. The backbone network based on Darknet53 used in this research references the idea of short connectivity in the ResNet network and has slightly better results than ResNet50 and ResNet101. However, considering that transmission line targets account for a relatively small portion of an image, we believe that streamlining the number of network layers can effectively avoid degradation problems. The Darknet53 network’s lightweight design reduces the accuracy of the mAP and FPS by 0.16 and 1 FPS, respectively. After introducing the MoCo-extracted image feature information into the model, the mAP and FPS increases by 4.3% and 4FPS. This paper ultimately uses the feature information extracted by the Darknet53 network and MoCo network in collaboration to feed into the encoder of the detection model.

5.3.3. The Selection of Multi-Stage Feature Map

This paper compares the experimental results of introducing varying stages of feature maps on the TLDD dataset to verify its effect on model performance. As shown in Table 8, our experiment shows that in the lightweight Darknet53 feature extraction network, the multi-scale feature map from stages C 3 to C 5 is extracted by a 1 × 1 convolution kernel and combined with the lowest resolution feature map C 6 obtained by convolution on stage C 5 using convolution kernels of 3 × 3 dimensions and a step size of 2, which is more conducive to effectively aggregating the feature information of transmission line images between multi-scale feature maps.
Table 8 shows that as the multi-scale feature map increases from C 3 to C 6 , the FPS decreases by 1FPS. In contrast, the mAP increases by 0.94, which indicates that the model extracts features with richer semantic details with excessive computational overhead to a lesser extent, which helps the TLI-DETR model locate and identify transmission line targets more accurately.

5.3.4. The Selection of K Value

To verify the impact of the sampling key point K value on the model performance in the deformable multi-scale mechanism, we have conducted a comparative analysis of the settings of different K values in the TLI-DETR model. The target detection effect is significantly improved when the K value is small. With an increase in the K value, the richer the contextual semantic information extracted by the model is, the more the detection accuracy is gradually improved, but the detection speed is also rapidly weakened; that is, the required time increases quickly. And beyond a certain point, increasing the “K” value may not result in significant performance improvements.
As shown in Table 9, with the increase in K from 2 to 4, the mAP increases from 0.75. However, when the K value increases from 3 to 4, the mAP only increases by 0.09, but the FPS decreases by 6FPS. Moreover, when the K value is 5, the mAP and FPS of the model decrease by 1.62 and 17, respectively. This is because the transmission line targets captured by UAVs account for a relatively small proportion of the image in question and have been partially occluded. Therefore, this paper sets K as 3.

5.3.5. The Selection of Object Query Vector with Prior Information

This paper considers introducing prior information, such as the target’s size and aspect ratio, in the target query vector to make the TLI-DETR model more suitable for object detection tasks in transmission lines. Based on the dataset’s statistical results, we use [50, 80, 120, 240, 320] and [0.3, 1, 3] as the anchor box’s area and aspect ratio, respectively.
As depicted in Table 10, the target query vector based on prior knowledge avoids using a completely random initialization method. This reduces the mapping space between the target query vector and the annotation box to accelerate the model’s convergence process. In addition, introducing prior knowledge of transmission line targets can help improve the model’s stability and generalization ability.

5.4. Ablative Analysis

On the transmission line dataset, this article conducts an ablation analysis of the TLI-DETR model, which helps analyze the influence of different components on the model. As shown in Table 11, compared with Model A, Model B feeds the post-enhanced images into the model for training and finds that the mAP and FPS have increased by 0.89% and 1FPS, respectively, effectively indicating that the enhanced images have positively improved the model’s accuracy. After the lightweight design of the Darknet53 model, the mAP of Model C has decreased by 0.31 compared with Model B, but the FPS has increased by 5FPS. Based on Model C, Model D feeds the feature information extracted by MoCo and the lightweight Darknet53 into the encoder. By reducing 2FPS, the mAP increases by 2.12%, effectively improving the model’s image color and edge information extraction, thereby further improving the detection accuracy of transmission line targets. With other conditions fixed, Model E’s mAP and FPS have increased by 1.29% and 5, respectively, indicating that the introduced multi-scale deformable attention mechanism has made the model pay more attention to the feature points around the sampling points, thereby improving the detection accuracy of the model for small and occluded targets.

6. Conclusions

This research proposes a transmission line detection model, TLI-DETR. To counteract interference in complex environments such as mountainous forests and lakes, this paper has used IMSRCR technology to enhance the stability of edge information and reduce the adverse effects of noise. Based on the feature extraction network, the MoCo method has been used to introduce this edge and semantic information into the model to enhance the ability to capture small target features. In addition, in response to the problem of small target proportion and occlusion caused by different angles and distances of drone shooting, this paper has statistically analyzed the areas and aspect ratios of transmission line targets, generated target query vectors containing prior information, and more accurately adapted to detection needs, especially in small target detection. The experimental results demonstrate that TLI-DETR performs well in high-voltage transmission line detection tasks, with accuracy and detection speed reaching 91.65% and 55FPS, respectively, providing solid technical support for the real-time online detection of transmission lines. This article has added further discussion on future research directions in its conclusion. This research has only identified insulators, anti-vibration hammers, and arc sags on high-voltage transmission lines. Our model is also applicable for identifying tunnel cracks and agricultural products. Therefore, in the following research, not only will the detection performance of the proposed method continue to be improved but experiments will also be conducted on faulty target components with sufficient data volumes. Of course, we will also focus on detecting and recognizing occluded targets to solve the problem of object occlusion detection in complex backgrounds.

Author Contributions

Conceptualization, J.W. and L.J.; methodology, J.W., L.J., Y.L., and P.C.; validation, J.W.; formal analysis, J.W. and L.J.; investigation, J.W., L.J., Y.L., and P.C.; resources, J.W., L.J., Y.L., and P.C.; writing—original draft preparation, J.W.; writing—review and editing, J.W., L.J., Y.L., and P.C.; visualization, J.W.; supervision, L.J.; project administration, L.J. All authors have read and agreed to the published version of the manuscript.

Funding

This research was supported by the National Natural Science Foundation of China under Grant 52277157 (funded by Jin Lijun) and the Key Projects of Yunnan Provincial Fund under Grant 202201AS070029 (funded by Li Yingna).

Data Availability Statement

The data in this paper are undisclosed due to the confidentiality requirements of the data supplier.

Acknowledgments

We thank the Yunnan Electric Power Research Institute for collecting transmission line UAV inspection data. At the same time, we would like to thank Zhikang Yuan, the reviewers, and the editors for their constructive comments to improve the quality of this article.

Conflicts of Interest

The authors declare no conflicts of interest.

References

  1. Zhou, M.; Li, B.; Wang, J.; He, S. Fault Detection Method of Glass Insulator Aerial Image Based on the Improved YOLOv5. IEEE Trans. Instrum. Meas. 2023, 72, 5012910. [Google Scholar] [CrossRef]
  2. Zhai, Y.; Yang, K.; Zhao, Z.; Wang, Q.; Bai, K. Geometric characteristic learning R-CNN for shockproof hammer defect detection. Eng. Appl. Artif. Intell. 2022, 116, 105429. [Google Scholar] [CrossRef]
  3. Song, J.; Qian, J.; Liu, Z.; Jiao, Y.; Zhou, J.; Li, Y.; Chen, Y.; Guo, J.; Wang, Z. Research on Arc Sag Measurement Methods for Transmission Lines Based on Deep Learning and Photogrammetry Technology. Remote Sens. 2023, 15, 2533. [Google Scholar] [CrossRef]
  4. Yang, Z.; Xu, Z.; Wang, Y. Bidirection-Fusion-YOLOv3: An Improved Method for Insulator Defect Detection Using UAV Image. IEEE Trans. Instrum. Meas. 2022, 71, 3521408. [Google Scholar] [CrossRef]
  5. Li, H.; Dong, Y.Q.; Liu, Y.X.; Ai, J. Design and implementation of UAVs for Bird’s nest inspection on transmission lines based on deep learning. Drones 2022, 6, 252. [Google Scholar] [CrossRef]
  6. Shuang, F.; Han, S.; Li, Y.; Lu, T. RSIn-Dataset: An UAV-Based Insulator Detection Aerial Images Dataset and Benchmark. Drones 2023, 7, 125. [Google Scholar] [CrossRef]
  7. Chen, M.L.; Li, J.; Pan, J.; Ji, C.; Ma, W. Insulator Extraction from UAV LiDAR Point Cloud Based on Multi-Type and Multi-Scale Feature Histogram. Drones 2024, 8, 241. [Google Scholar] [CrossRef]
  8. Zhao, Z.B.; Guo, G.; Zhang, L.; Li, Y. A new anti-vibration hammer rust detection algorithm based on improved YOLOv7. Energy Rep. 2023, 9, 345–351. [Google Scholar] [CrossRef]
  9. Wei, Z.; Lan, B.; Li, J.; Liu, B. Design and application of a UAV autonomous inspection system for high-voltage power transmission lines. Remote Sens. 2023, 15, 865. [Google Scholar] [CrossRef]
  10. Hao, K.; Chen, G.; Zhao, L.; Li, Z.; Liu, Y.; Wang, C. An Insulator Defect Detection Model in Aerial Images Based on Multiscale Feature Pyramid Network. IEEE Trans. Instrum. Meas. 2022, 71, 3522412. [Google Scholar] [CrossRef]
  11. Tang, J.; Pan, Q.; Chen, Z.; Liu, G.; Yang, G.; Zhu, F.; Lao, S. An Improved Artificial Electric Field Algorithm for Robot Path Planning. IEEE Trans. Aerosp. Electron. Syst. 2024, 60, 2292–2304. [Google Scholar] [CrossRef]
  12. Weisler, W.; Stewart, W.; Anderson, M.B.; Peters, K.J.; Gopalarathnam, A.; Bryant, M. Testing and Characterization of a Fixed Wing Cross-Domain Unmanned Vehicle Operating in Aerial and Underwater Environments. IEEE J. Ocean. Eng. 2018, 43, 969–982. [Google Scholar] [CrossRef]
  13. Tang, J.; Chen, X.; Zhu, X.; Zhu, F. Dynamic Reallocation Model of Multiple Unmanned Aerial Vehicle Tasks in Emergent Adjustment Scenarios. IEEE Trans. Aerosp. Electron. Syst. 2023, 59, 1139–1155. [Google Scholar] [CrossRef]
  14. Huang, X.; Wang, G.; Lu, Y.; Jia, Z. Study on a Boat-Assisted Drone Inspection Scheme for the Modern Large-Scale Offshore Wind Farm. IEEE Syst. J. 2023, 17, 4509–4520. [Google Scholar] [CrossRef]
  15. Wang, J.Y.; Li, Y.; Chen, W. Detection of Glass Insulators Using Deep Neural Networks Based on Optical Imaging. Remote Sens. 2022, 14, 5153. [Google Scholar] [CrossRef]
  16. Liu, X.; Miao, X.; Jiang, H.; Chen, J. Box-Point Detector: A Diagnosis Method for Insulator Faults in Power Lines Using Aerial Images and Convolutional Neural Networks. IEEE Trans. Power Deliv. 2021, 36, 3765–3773. [Google Scholar] [CrossRef]
  17. Zhang, X.; Zhang, Y.; Liu, J.; Zhang, C.; Xue, X.; Zhang, H.; Zhang, W. InsuDet: A Fault Detection Method for Insulators of Overhead Transmission Lines Using Convolutional Neural Networks. IEEE Trans. Instrum. Meas. 2021, 70, 5018512. [Google Scholar] [CrossRef]
  18. Giones, F.; Brem, A. From toys to tools: The co-evolution of technological and entrepreneurial developments in the drone industry. Bus Horiz. 2017, 60, 875–884. [Google Scholar] [CrossRef]
  19. Zhang, G.; Lu, S.; Zhang, W. CAD-Net: A Context-Aware Detection Network for Objects in Remote Sensing Imagery. IEEE Trans. Geosci. Remote Sens. 2019, 57, 10015–10024. [Google Scholar] [CrossRef]
  20. Shakhatreh, H.; Sawalmeh, A.H.; Al-Fuqaha, A.; Dou, Z.; Almaita, E.; Khalil, I.; Othman, N.S.; Khreishah, A.; Guizani, M. Unmanned Aerial Vehicles (UAVs): A Survey on Civil Applications and Key Research Challenges. IEEE Access 2019, 7, 48572–48634. [Google Scholar] [CrossRef]
  21. Lyu, X.; Li, X.; Dang, D. Unmanned Aerial Vehicle (UAV) Remote Sensing in Grassland Ecosystem Monitoring: A Systematic Review. Remote Sens. 2022, 14, 1096. [Google Scholar] [CrossRef]
  22. Fu, L.S.; Majeed, Y.; Zhang, X. Faster R-CNN-based apple detection in dense-foliage fruiting-wall trees using RGB and depth features for robotic harvesting. Biosyst. Eng. 2020, 197, 245–256. [Google Scholar] [CrossRef]
  23. Ramírez, I.S.; Márquez, F.P.G.; Chaparro, J.P. Convolutional neural networks and Internet of Things for fault detection by aerial monitoring of photovoltaic solar plants. Measurement 2024, 234, 114861. [Google Scholar] [CrossRef]
  24. Baik, H.; Valenzuela, J. Unmanned Aircraft System Path Planning for Visually Inspecting Electric Transmission Towers. J. Intell. Robot. Syst. 2019, 95, 1097–1111. [Google Scholar] [CrossRef]
  25. Jiang, S.; Jiang, W.S.; Huang, W.; Yang, L. UAV-Based Oblique Photogrammetry for Outdoor Data Acquisition and Offsite Visual Inspection of Transmission Line. Remote Sens. 2017, 9, 278. [Google Scholar] [CrossRef]
  26. Tao, X.; Zhang, D.; Wang, Z.; Liu, X.; Zhang, H.; Xu, D. Detection of Power Line Insulator Defects Using Aerial Images Analyzed with Convolutional Neural Networks. IEEE Trans. Syst. Man Cybern. Syst. 2020, 50, 1486–1498. [Google Scholar] [CrossRef]
  27. Ma, Y.P.; Li, Q.; Chu, L.; Zhou, Y.; Xu, C. Real-Time Detection and Spatial Localization of Insulators for UAV Inspection Based on Binocular Stereo Vision. Remote Sensing 2021, 13, 230. [Google Scholar] [CrossRef]
  28. Ren, S.; He, L.; Girshick, R.; Sun, J. Faster R-CNN: Towards Real-Time Object Detection with Region Proposal Networks. IEEE Trans. Pattern Anal. Mach. Intell. 2017, 39, 1137–1149. [Google Scholar] [CrossRef]
  29. He, K.; Gkioxari, G.; Piotr, D. Mask R-CNN. In Proceedings of the IEEE International Conference on Computer Vision (ICCV), Venice, Italy, 22–29 October 2017. [Google Scholar]
  30. Liu, W.; Anguelov, D.; Erhan, D.; Szegedy, C.; Reed, S.; Fu, C.; Berg, A. SSD: Single Shot MultiBox Detector. arXiv 2016, arXiv:1512.02325. [Google Scholar] [CrossRef]
  31. Varghese, R.; Sambath, M. YOLOv8: A Novel Object Detection Algorithm with Enhanced Performance and Robustness. In Proceedings of the 2024 International Conference on Advances in Data Engineering and Intelligent Computing Systems (ADICS), Chennai, India, 18–19 April 2024; pp. 1–6. [Google Scholar]
  32. Law, H.; Deng, J. Cornernet: Detecting Objects as Paired Keypoints. arXIv 2020, arXiv:2004.10934. [Google Scholar] [CrossRef]
  33. Zhou, X.; Wang, D.; Krhenbühl, P. Objects as Points. arXIv 2019, arXiv:1904.07850. [Google Scholar] [CrossRef]
  34. Lu, Z.; Li, Y.; Shuang, F. MGFNet: A Progressive Multi-Granularity Learning Strategy-Based Insulator Defect Recognition Algorithm for UAV Images. Drones 2023, 7, 333. [Google Scholar] [CrossRef]
  35. Varghese, A.; Gubbi, J.; Sharma, H.; Balamuralidhar, P. Power infrastructure monitoring and damage detection using drone captured images. In Proceedings of the 2017 International Joint Conference on Neural Networks (IJCNN), Anchorage, AK, USA, 14–19 May 2017; pp. 1681–1687. [Google Scholar]
  36. Carion, N.; Massa, F.; Synnaeve, G.; Usunier, N.; Kirillov , A.; Zagoruyko , S. End-to-End Object Detection with Transformers. arXIv 2020, arXiv:2005.12872. [Google Scholar]
  37. Lu, W.; Lan, C.; Niu, C.; Liu, W.; Lyu, L.; Shi, Q.; Wang, S. A CNN-Transformer Hybrid Model Based on CSWin Transformer for UAV Image Object Detection. IEEE J. Sel. Top. Appl. Earth Obs. Remote Sens. 2023, 16, 1211–1231. [Google Scholar] [CrossRef]
  38. Rao, W.; Gao, L.; Qu, Y.; Sun, X.; Zhang, B.; Chanussot, J. Siamese Transformer Network for Hyperspectral Image Target Detection. IEEE Trans. Geosci. Remote Sens. 2022, 60, 5526419. [Google Scholar] [CrossRef]
  39. Huang, J.W.; Zhou, J.; Yang, H.; Liu, Y.; Liu, H. A Small-Target Forest Fire Smoke Detection Model Based on Deformable Transformer for End-to-End Object Detection. Forests 2023, 14, 162. [Google Scholar] [CrossRef]
  40. DL/T 741-2019; Operating Code for Overhead Transmission Line. China National Standards: Shenzhen, China, 2019.
  41. Zhai, Y.J.; Wang, D.; Wang, M.L. Fault detection of insulator based on saliency and adaptive morphology. Multimed. Tools Appl. 2017, 76, 12061–12064. [Google Scholar] [CrossRef]
  42. Huang, X.; Zhang, X.; Zhang, Y. A Method of Identifying Rust Status of Dampers Based on Image Processing. IEEE Trans. Instrum. Meas. 2020, 69, 5407–5417. [Google Scholar] [CrossRef]
  43. Wu, X.; Yuan, P.; Peng, Q.; Ngo, C.W.; He, J.Y. Detection of bird nests in overhead catenary system images for high-speed rail. Pattern Recognit. 2016, 51, 242–254. [Google Scholar] [CrossRef]
  44. Shuang, F.; Wei, S.; Li, Y.; Gu, X.; Lu, Z. Detail R-CNN: Insulator Detection Based on Detail Feature Enhancement and Metric Learning. IEEE Trans. Instrum. Meas. 2023, 72, 2524414. [Google Scholar] [CrossRef]
  45. Dian, S.Y.; Zhong, X.K.; Zhong, Y.Z. Faster R-Transformer: An efficient method for insulator detection in complex aerial environments. Measurement 2022, 199, 111238. [Google Scholar] [CrossRef]
  46. Bao, W.X.; Rem, Y.X.; Wang, N.A.; Hu, G.S.; Yang, X.J. Detection of Abnormal Anti-vibration hammers on Transmission Lines in UAV Remote Sensing Images with PMA-YOLO. Remote Sens. 2021, 13, 4134. [Google Scholar] [CrossRef]
  47. Liao, J.; Xu, H.; Fang, X.; Miao, Q.; Zhu, G. Quantitative Assessment Framework for Non-Structural Bird’s Nest Risk Information of Transmission Tower in High-Resolution UAV Images. IEEE Trans. Instrum. Meas. 2023, 72, 5013712. [Google Scholar] [CrossRef]
  48. Redmon, J.; Farhadi, A. Yolov3: An Incremental Improvement. arXiv 2018, arXiv:1804.02767. [Google Scholar] [CrossRef]
  49. Justusson, B.I. Median filtering: Statistical properties. In Two-Dimensional Digital Signal Processing II; Huang, T.S., Ed.; Springer: Berlin/Heidelberg, Germany, 2006. [Google Scholar] [CrossRef]
  50. Ito, K.; Xiong, K. Gaussian filters for nonlinear filtering problems. IEEE Trans. Autom. Control. 2000, 45, 910–927. [Google Scholar] [CrossRef]
  51. Tomasi, C.; Manduchi, R. Bilateral filtering for gray and color images. In Proceedings of the 6th International Conference on Computer Vision (IEEE Cat. No.98CH36271), Bombay, India, 7 January 1998; pp. 839–846. [Google Scholar]
  52. Jobson, D.J.; Rahman, Z.; Woodell, G. A multiscale retinex for bridging the gap between color images and the human observation of scenes. IEEE Trans. Image Process. 1997, 6, 965–976. [Google Scholar] [CrossRef]
  53. He, K.; Fan, H.; Wu, Y.; Xie, S.; Girshick, R. Momentum contrast for unsupervised visual representation learning. In Proceedings of the IEEE/CVF Conference on Computer Vision and Pattern Recognition, Seattle, WA, USA, 13–19 June 2020; pp. 9729–9738. [Google Scholar]
  54. Loshchilov, I.; Hutter, F. Fixing Weight Decay Regularization in Adam. arXiv 2017, arXiv:1711.05101. [Google Scholar]
  55. Lin, T.; Maire, M.; Belongie, S.; Hays, J.; Perona, P.; Ramanan, D.; Dollár, P.; Zitnick, C. Microsoft COCO: Common Objects in Context. In Proceedings of the European Conference on Computer Vision-ECCV, Zurich, Switzerland, 6–12 September 2014; Volume 8693. [Google Scholar]
  56. Ling, Z.N. An Accurate and Real-time Method of Self-blast Glass Insulator Location Based on Faster R-CNN and U-net with Aerial Images. CSEE J. Power Energy Syst. 2019, 5, 474–482. [Google Scholar]
  57. Chen, J.W. Automatic Defect Detection of Fasteners on the Catenary Support Device Using Deep Convolutional Neural Network. IEEE Trans. Instrum. Meas. 2018, 67, 257–269. [Google Scholar] [CrossRef]
Figure 1. The network structure of TLI-DETR. The basic architecture of the TLI-DETR network mainly includes four parts: CNN feature extraction network, transformer encoder and decoder, and bipartite graph matching loss prediction of transmission line target’s category and position parameters based on the Hungarian algorithm.
Drones 08 00545 g001
Figure 2. Backbone network feature extraction flowchart. C 3 , C 4 , C 5 , and C 6 represent multi-scale extraction of target features for transmission lines. To capture the positional features of the target, learnable positional encoding obtains different levels of positional embeddings through dimensional transformation. The corresponding levels’ target features and positional embeddings are added to obtain the TLI-DETR model encoder input sequence.
Drones 08 00545 g002
Figure 3. Firstly, the model performs an image enhancement operation using bilateral filtering combined with MSRCR. Secondly, the image features extraction uses MoCo and the lightweight Darknet53 network. Considering that the input image features have permutation invariance, the model feeds the image features and position coding into the encoder. The encoder of TLI-DETR is then responsible for fusing the global image of the transmission line detection target and the decoder is responsible for receiving the output of the encoder and converting the position encoding of the target into the output embedding. Finally, the model decodes each category’s anchor box position and category score through FFN.
Drones 08 00545 g003
Figure 4. Comparison chart of processing results.
Drones 08 00545 g004
Figure 5. Comparison chart of feature maps. The first line ‘Input’ stands for the enhanced image, The second line ‘Original Feature Map (FM)’ represents the feature map of the third layer output of the lightweight Darknet53, and the third line ‘Augment FM’ represents the output of the third layer of the lightweight Darknet53 after being enhanced by the MoCo and attention mechanism. The features in the output images of Augment FM are more distinct, which is more conducive to the convergence of the TLI-DETR model.
Drones 08 00545 g005
Figure 6. The origin image represents the image processed by IMSCRR. The q-encoder and k-encoder use gradient update and momentum update, respectively. The steps taken are to calculate the similarity values of different image sample pairs, namely the contrastive loss information of query and other keys; compress and normalize them through the attention mechanism; and send them as parameters of the residual layer in the Darknet53 model to the TLI-DETR model for training.
Drones 08 00545 g006
Figure 7. “Loss−training number” curve. (a) Situation of the first 100 epochs. (b) Epochs 80 to 300. (c) Epochs 300 to 1000. (d) The first 1000 epochs.
Drones 08 00545 g007
Table 1. Designed kernels of backbone in TLI-DETR.
NumberLayer InformationInputOutput
CONV-(N32,K3 x 3,S1,P1),IN,Leaky ReLU(512,512,3)(512,512,32)
CONV-(N64,K3 x 3,S2,P1),IN,Leaky ReLU(512,512,32)(256,256,64)
Res1×CONV-(N32,K1 x 1,S1,P0),IN,Leaky ReLU(256,256,64)(256,256,32)
CONV-(N64,K3 x 3,S1,P1),IN,Leaky ReLU(256,256,32)(256,256,64)
CONV-(N128,K3 x 3,S2,P1),IN,Leaky ReLU(256,256,64)(128,128,128)
Res2×CONV-(N64,K1 x 1,S1,P0),IN,Leaky ReLU(128,128,128)(128,128,64)
CONV-(N128,K3 x 3,S1,P1),IN,Leaky ReLU(128,128,64)(128,128,128)
CONV-(N256,K3 x 3,S2,P1),IN,Leaky ReLU(128,128,128)(64,64,256)
Res4×CONV-(N128,K1 x 1S1,P0),IN,Leaky ReLU(64,64,256)(64,64,128)
CONV-(N256,K3 x 3,S1,P1),IN,Leaky ReLU(64,64,128)(64,64,256)
CONV-(N512,K3 x 3,S2,P1),IN,Leaky ReLU(64,64,256)(32,32,512)
Res4×CONV-(N256,K1 x 1,S1,P0),IN,Leaky ReLU(32,32,512)(32,32,256)
CONV-(N512,K3 x 3,S1,P1),IN,Leaky ReLU(32,32,256)(32,32,512)
CONV-(N1024,K3 x 3,S2,P1),IN,Leaky ReLU(32,32,512)(16,16,1024)
Res2×CONV-(N512,K1 x 1,S1,P0),IN,Leaky ReLU(16,16,1024)(16,16,512)
CONV-(N1024,K3 x 3,S1,P1),IN,Leaky ReLU(16,16,512)(16,16,1024)
Table 2. Statistics of results for various anchor sizes.
Anchor Size0–100100–200200–300300–480
Proportion37.9%28.9%17.0%16.2%
Table 3. Statistics of results for various anchor ratios.
Anchor Ratio0–0.30.3–11–33–12.5
Proportion14.9%48.8%19.7%16.6%
Table 4. The research’s experimental environment configuration.
Experimental EnvironmentConfiguration Information
CPUAMD R5-4400G
GPUNVIDIA RTX 3060Ti
Running systemUbuntu 18.04 64-bit
Experiment languagePython3.7
CUDA11.0
Pytorch1.7.0
Table 5. Comparative analysis of mAP and FPS values of different models.
ModelInsulatorAnti-Vibration HammersArc SagsmAP(%)FPS(F/s)
Faster R-CNN by Ling [56]79.6479.7377.8979.0932
DDN by Tao [26]84.8781.6679.7682.107
Faster R-Transformer by Chen [57]87.2986.0184.4185.9012
YOLOv8 [32]86.7583.3482.5284.2048
DETR [36]86.3384.2583.6784.7534
TLI-DETR93.2691.7489.9591.6555
Table 6. EN and AG of different image enhancement methods.
InsulatorAnti-Vibration HammersArc Sags
EN Original7.216.267.12
EN bilateral filtering7.266.757.17
EN MSRCR7.307.277.25
EN IMSRCR7.357.717.74
AG Original4.229.0310.52
AG bilateral filtering5.5411.7110.79
AG MSRCR6.9118.4914.93
AG IMSRCR8.9824.5118.07
Table 7. mAP values of different backbone networks.
Backbone NetworkmAP(%)FPS(F/s)
VGG1684.4941
Resnet5086.7249
Resnet10187.5847
Darknet5387.5152
Lightweight Darknet5387.3551
TLI-DETR91.6555
Table 8. mAP values of multi-stage feature map.
Multi-Stage Feature MapmAP(%)FPS(F/s)
C590.7156
C4, C590.8955.7
C3, C4, C591.2355.3
C3, C4, C5, C691.6555
Table 9. mAP values of different K values.
K ValuemAP(%)FPS(F/s)
290.9958
391.6555
491.7449
590.0338
Table 10. mAP values of different of prior information.
SizeScalemAP(%)FPS(F/s)
RandomRandom90.3650
[30, 100, 200, 300, 400][0.3, 1, 3, 6.0]90.9252
[50, 80, 120, 240, 320][0.3, 1, 3, 6.0]91.1754
[30, 100, 200, 300, 400][0.3, 1, 3]90.7453
[50, 80, 120, 240, 320][0.3, 1, 3]91.6555
Table 11. Contributions of different components to the TLI-DETR model.
ModelArchitecturemAP(%)FPS(F/s)
ATLI-DETR87.0446
BA + image enhancement87.9347
CB + Light weight Darknet5388.2452
DC + MoCo90.3650
ED + object query vector with prior information91.6555
Disclaimer/Publisher’s Note: The statements, opinions and data contained in all publications are solely those of the individual author(s) and contributor(s) and not of MDPI and/or the editor(s). MDPI and/or the editor(s) disclaim responsibility for any injury to people or property resulting from any ideas, methods, instructions or products referred to in the content.