
Assessment of Spatial Patterns of Backyard Shacks Using Landscape Metrics


Abstract
1. Introduction
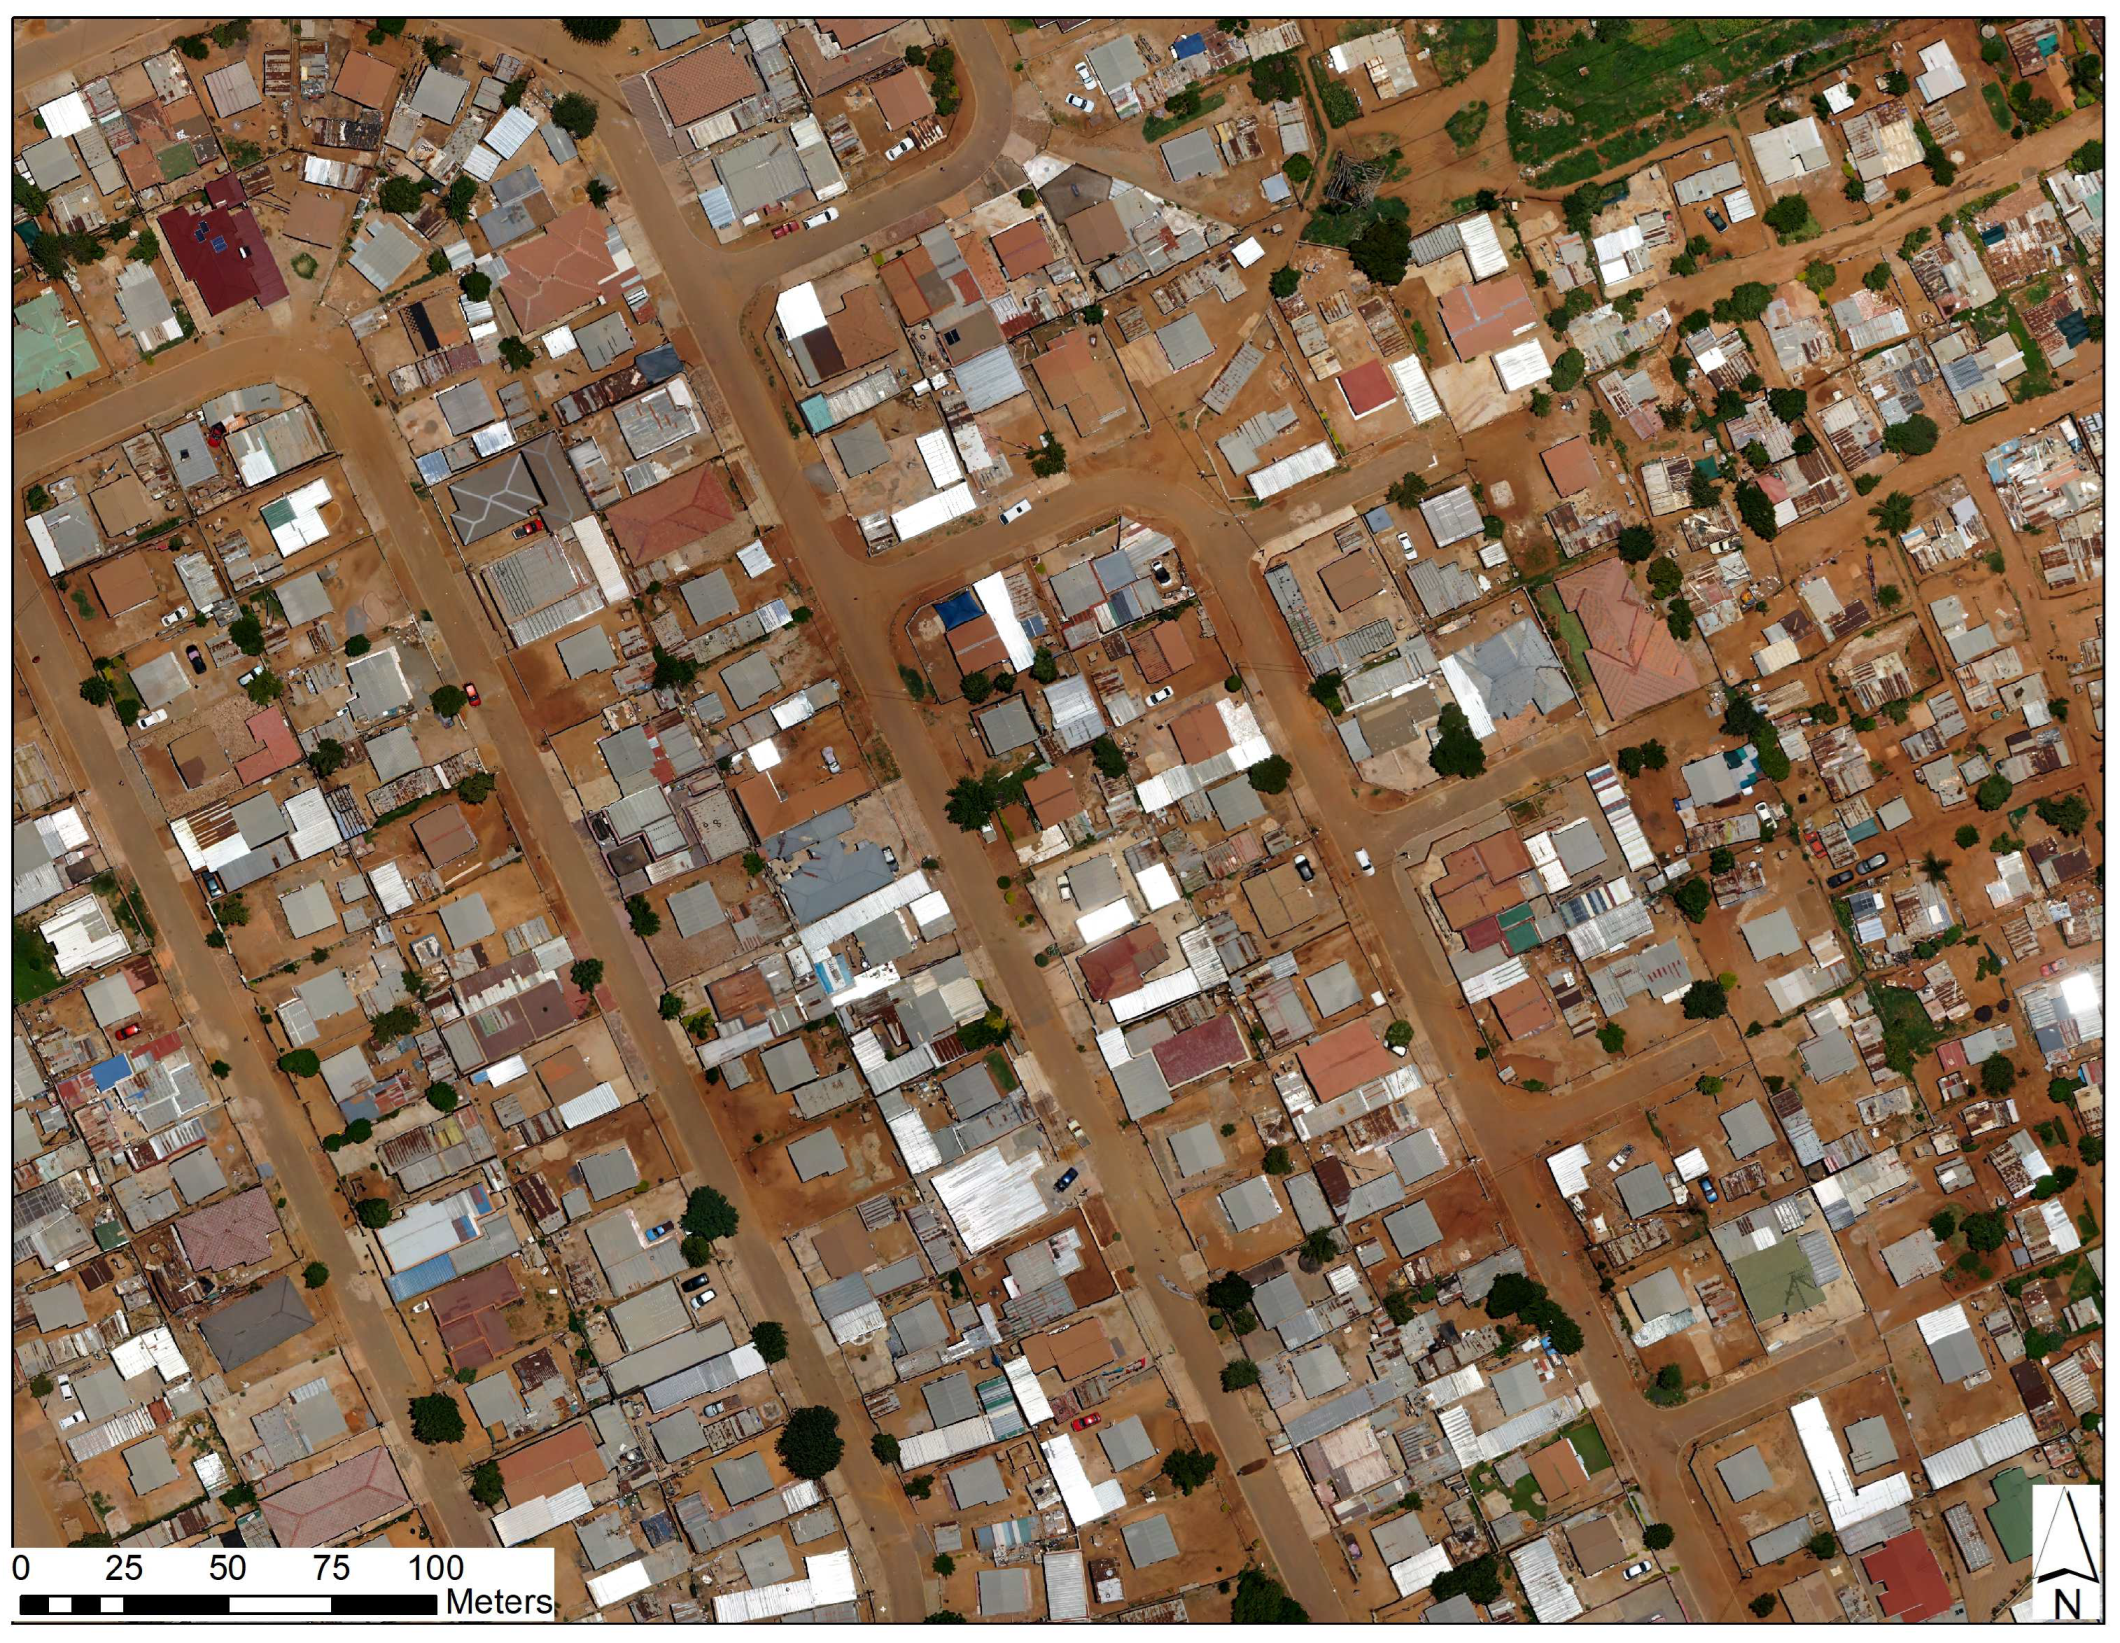
2. Study Area
3. Material and Methods
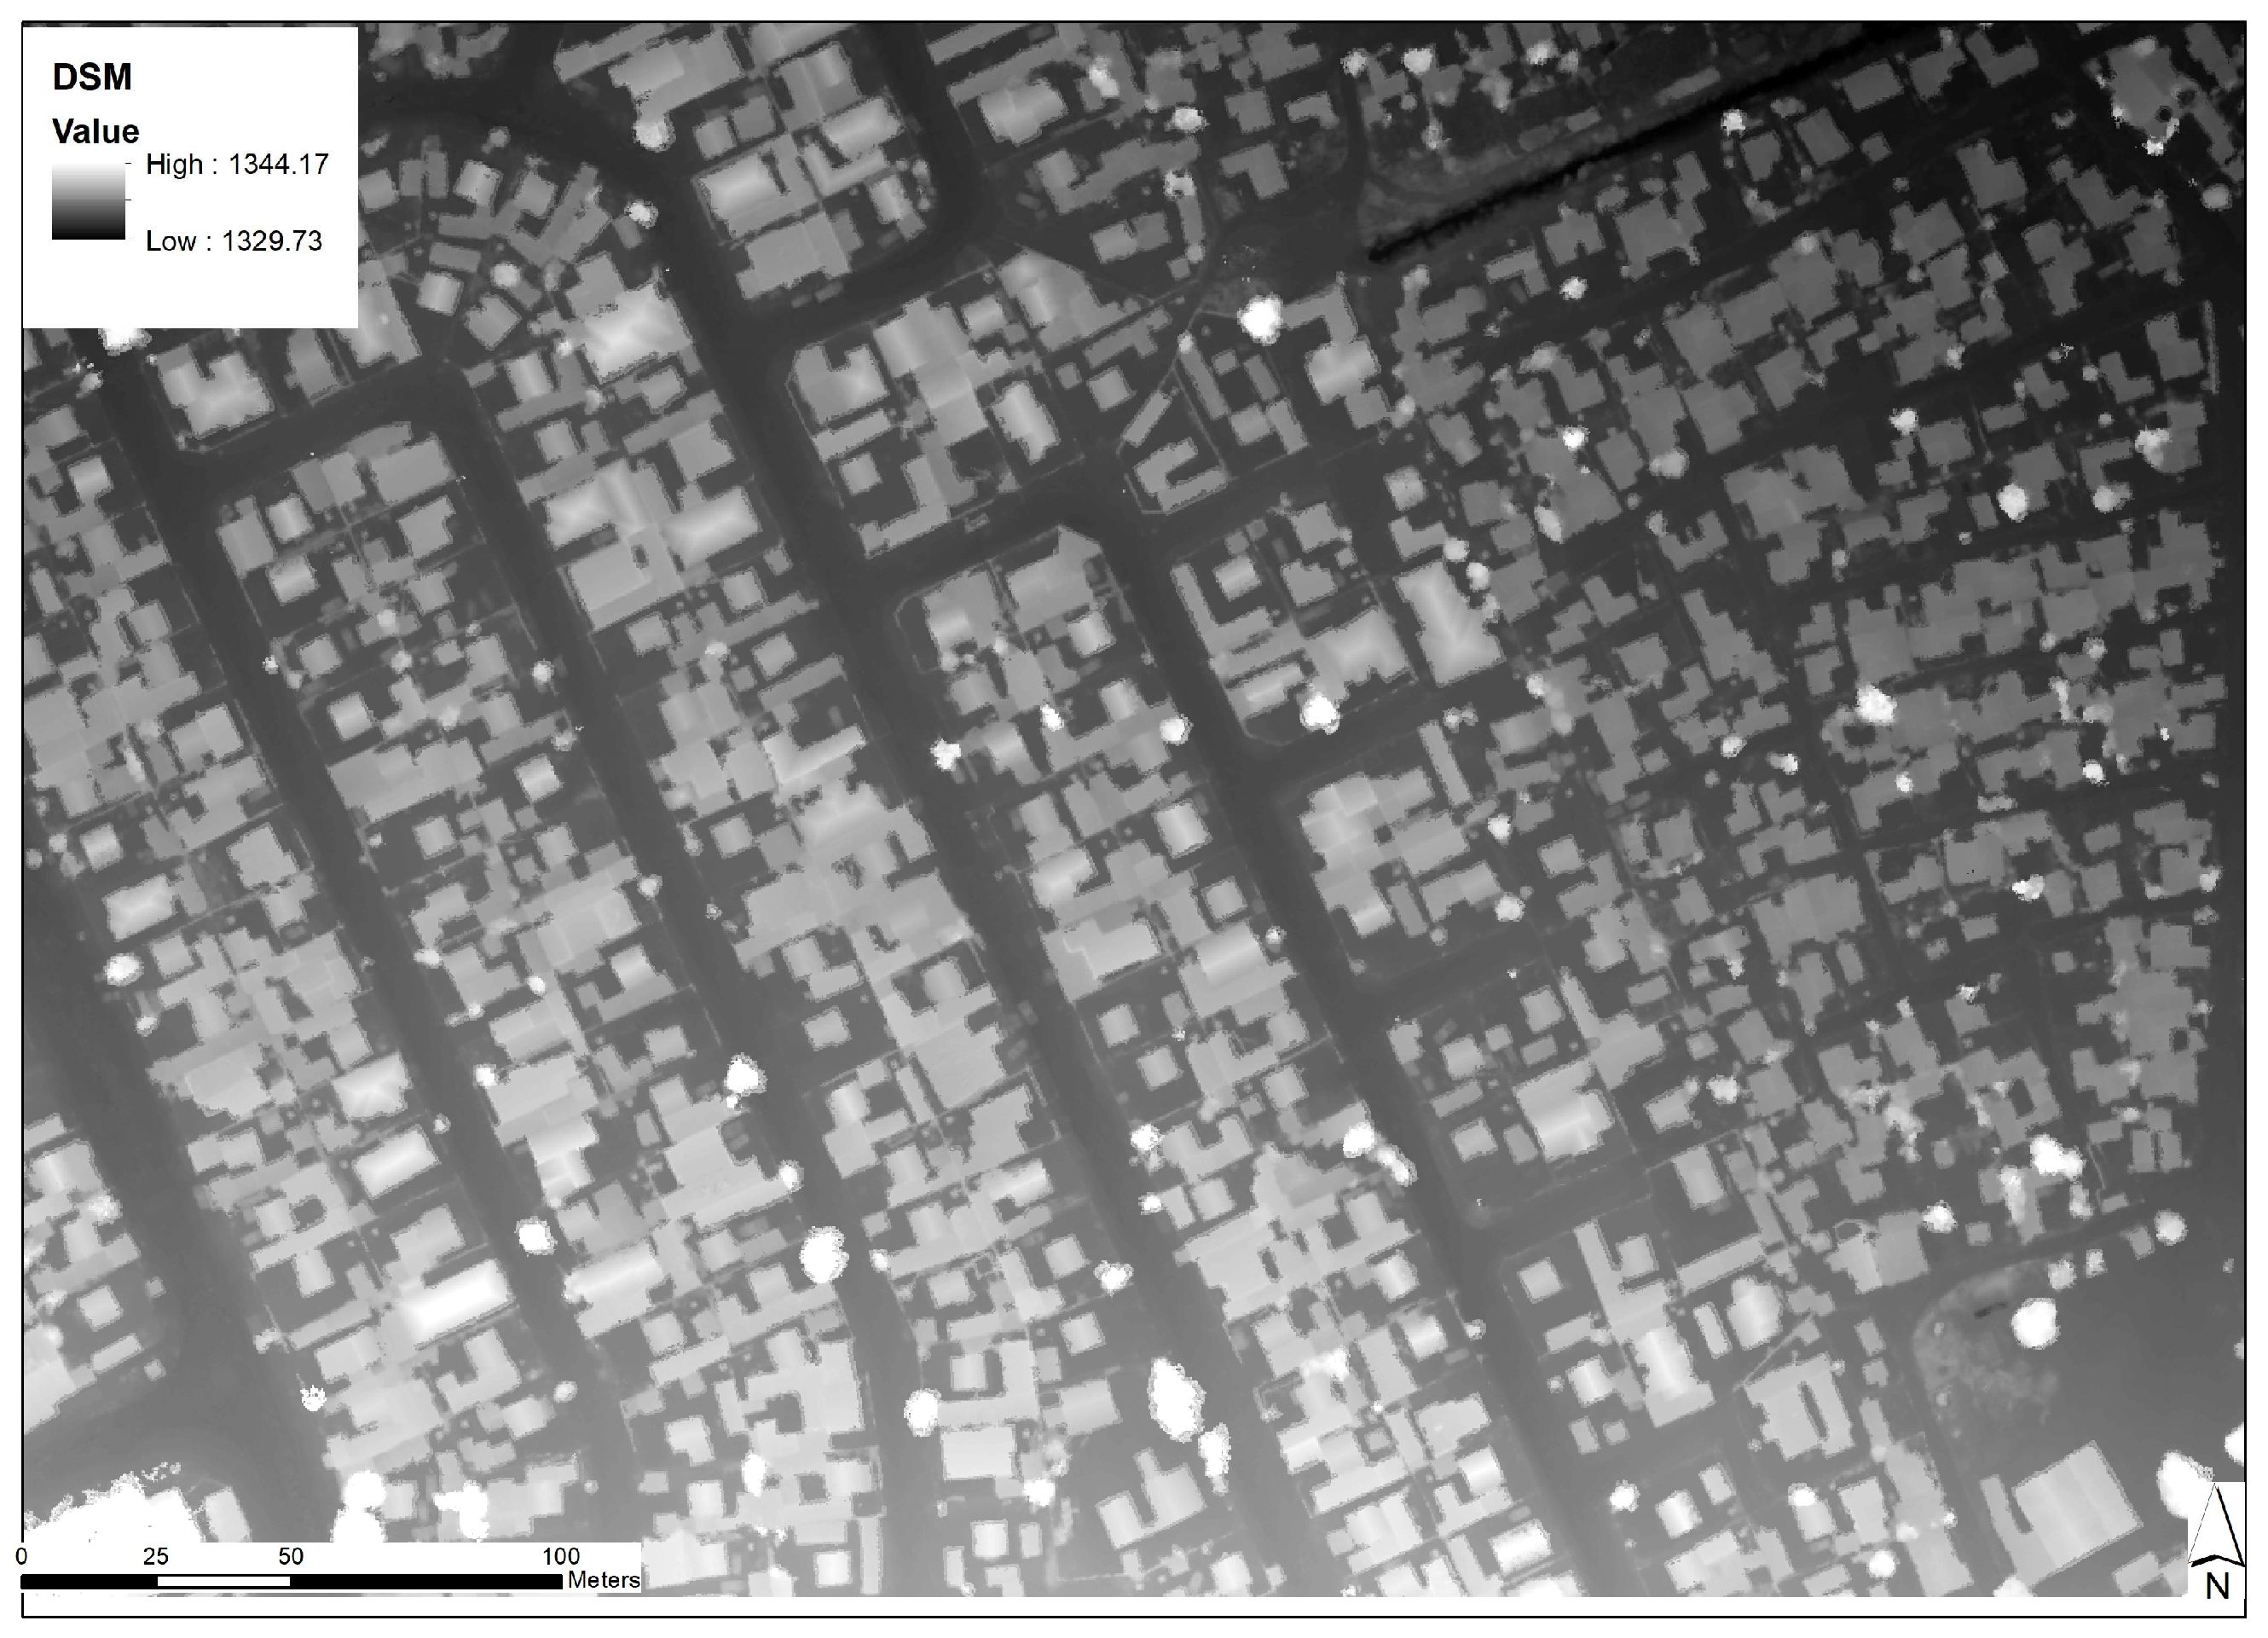
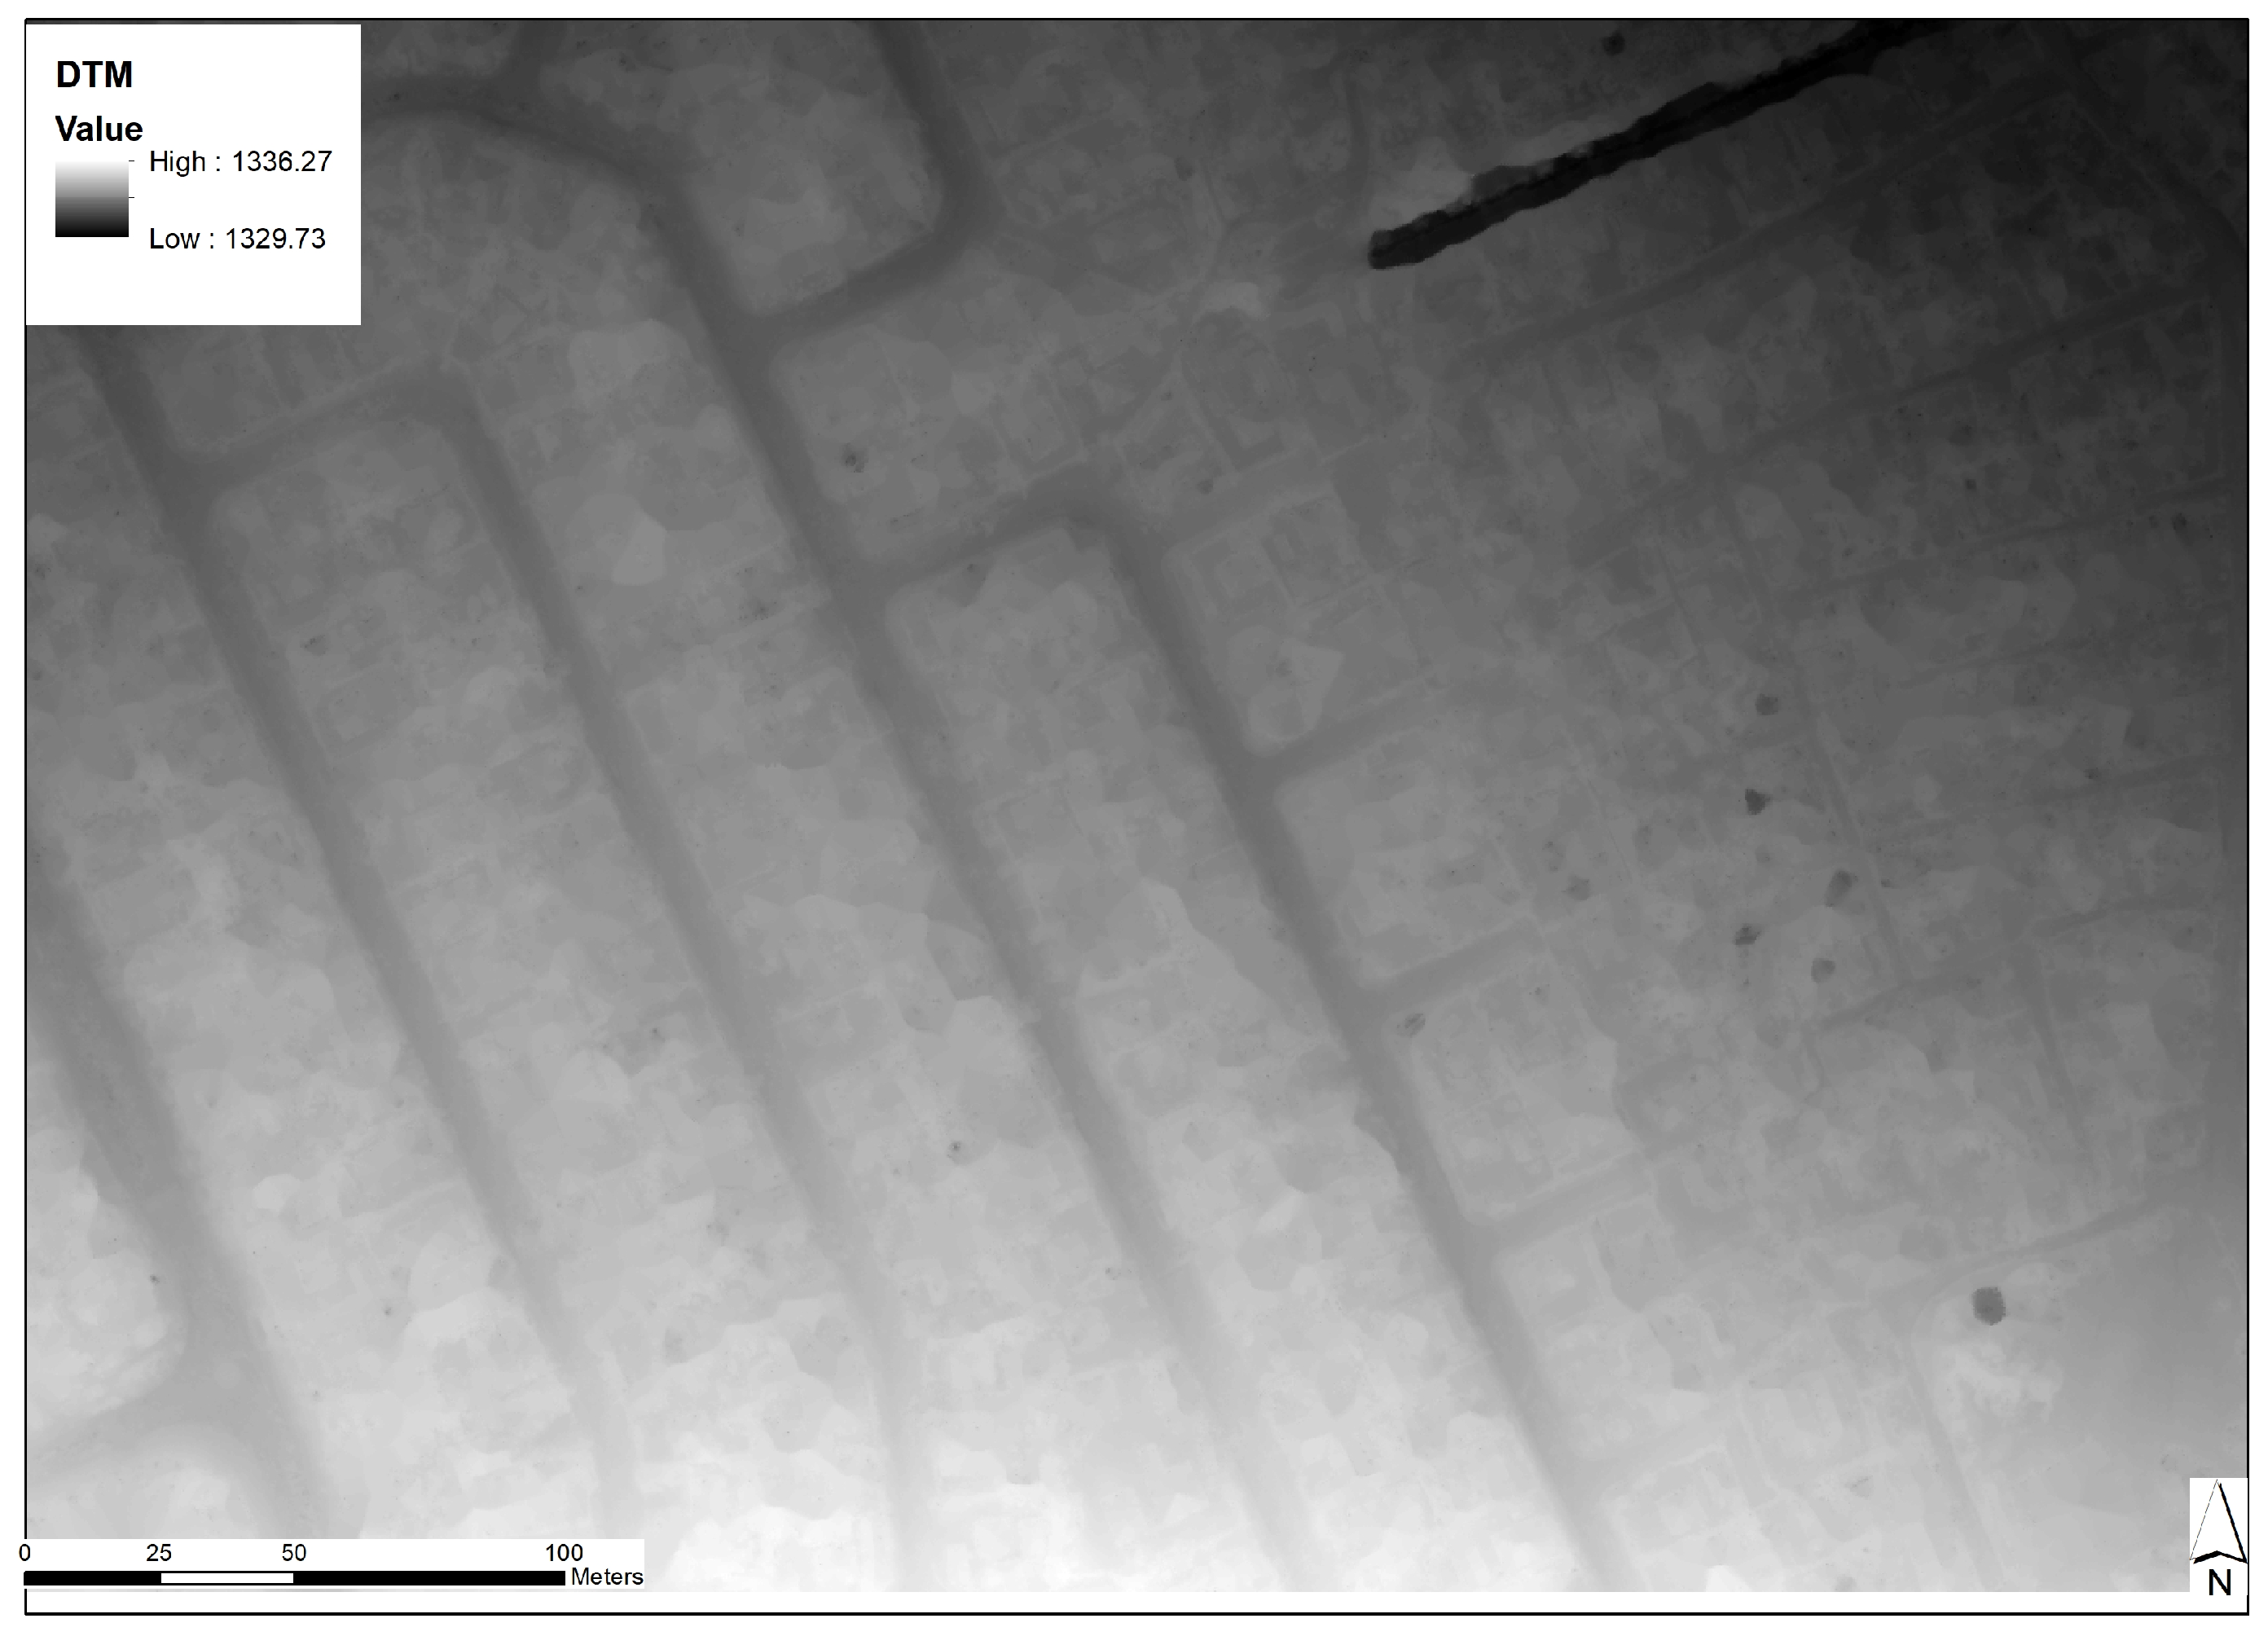
3.1. Materials
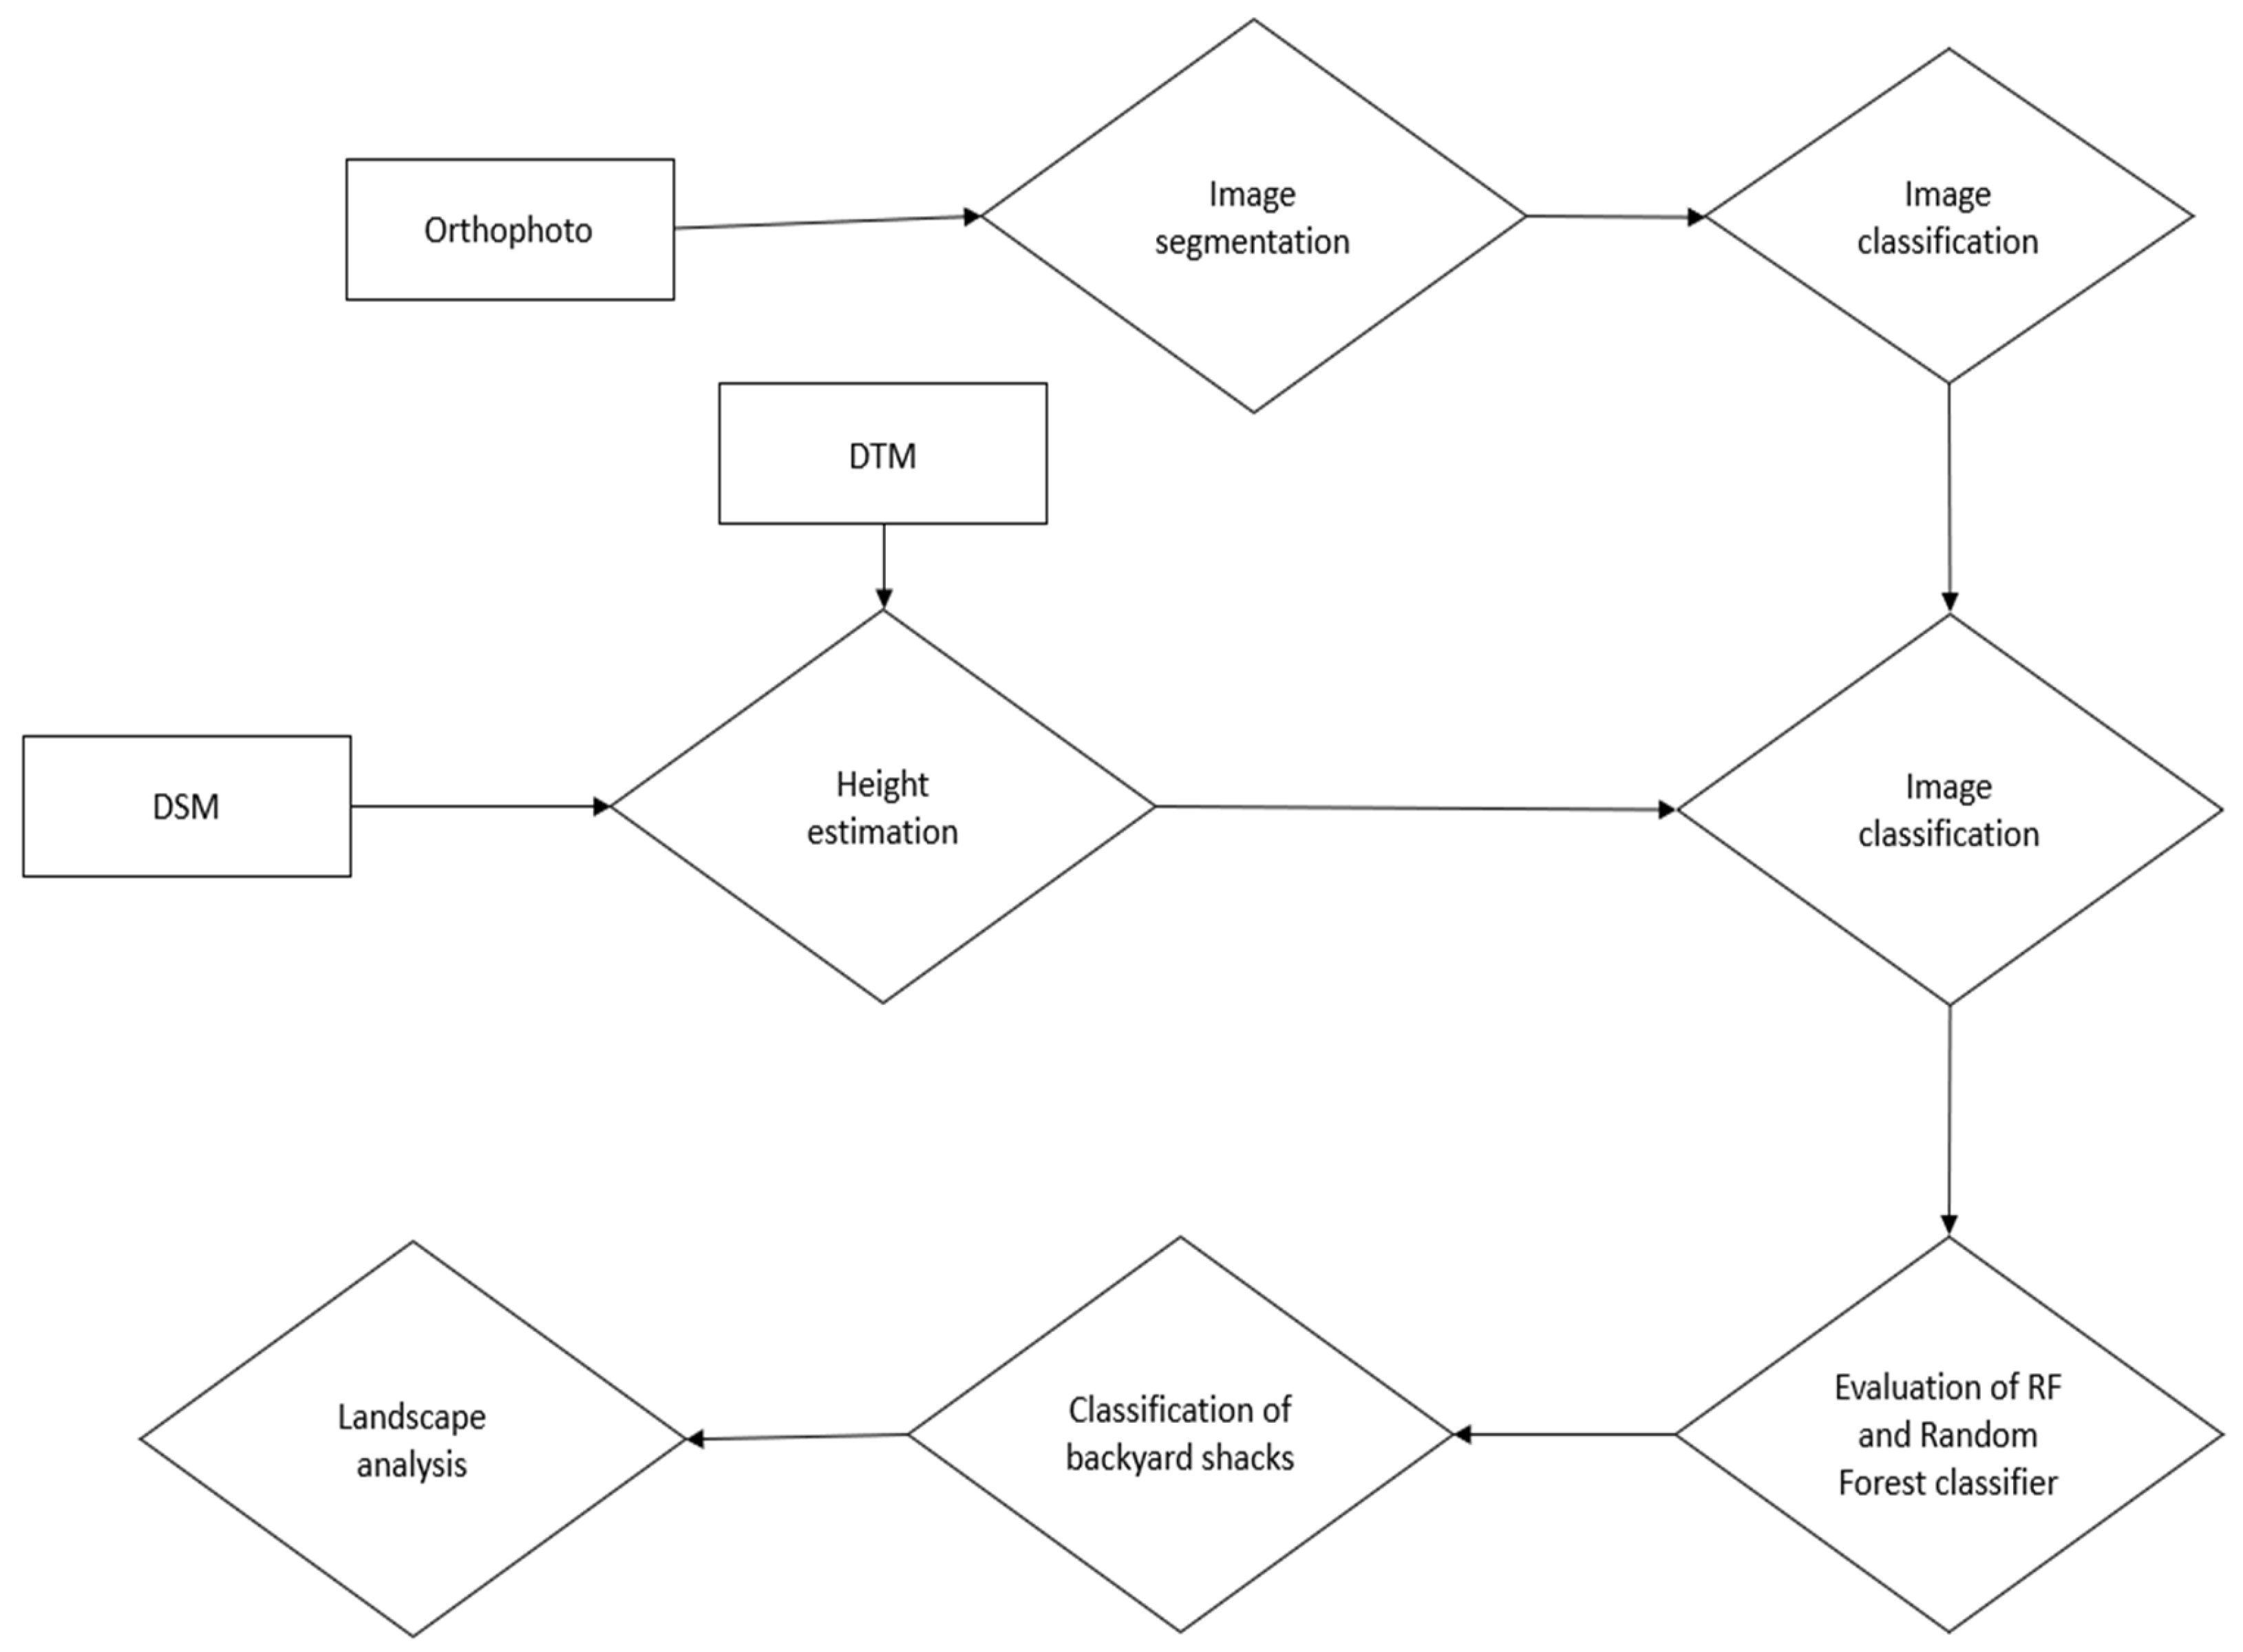
3.2. Methods
3.2.1. Classification of Formal and Informal Building Structures
Random Forest Classifier
Rule-Based Classifier
3.3. Classification of Backyard Shacks
3.4. Accuracy Assessment
3.5. Spatial Pattern Analysis
4. Results and Discussions
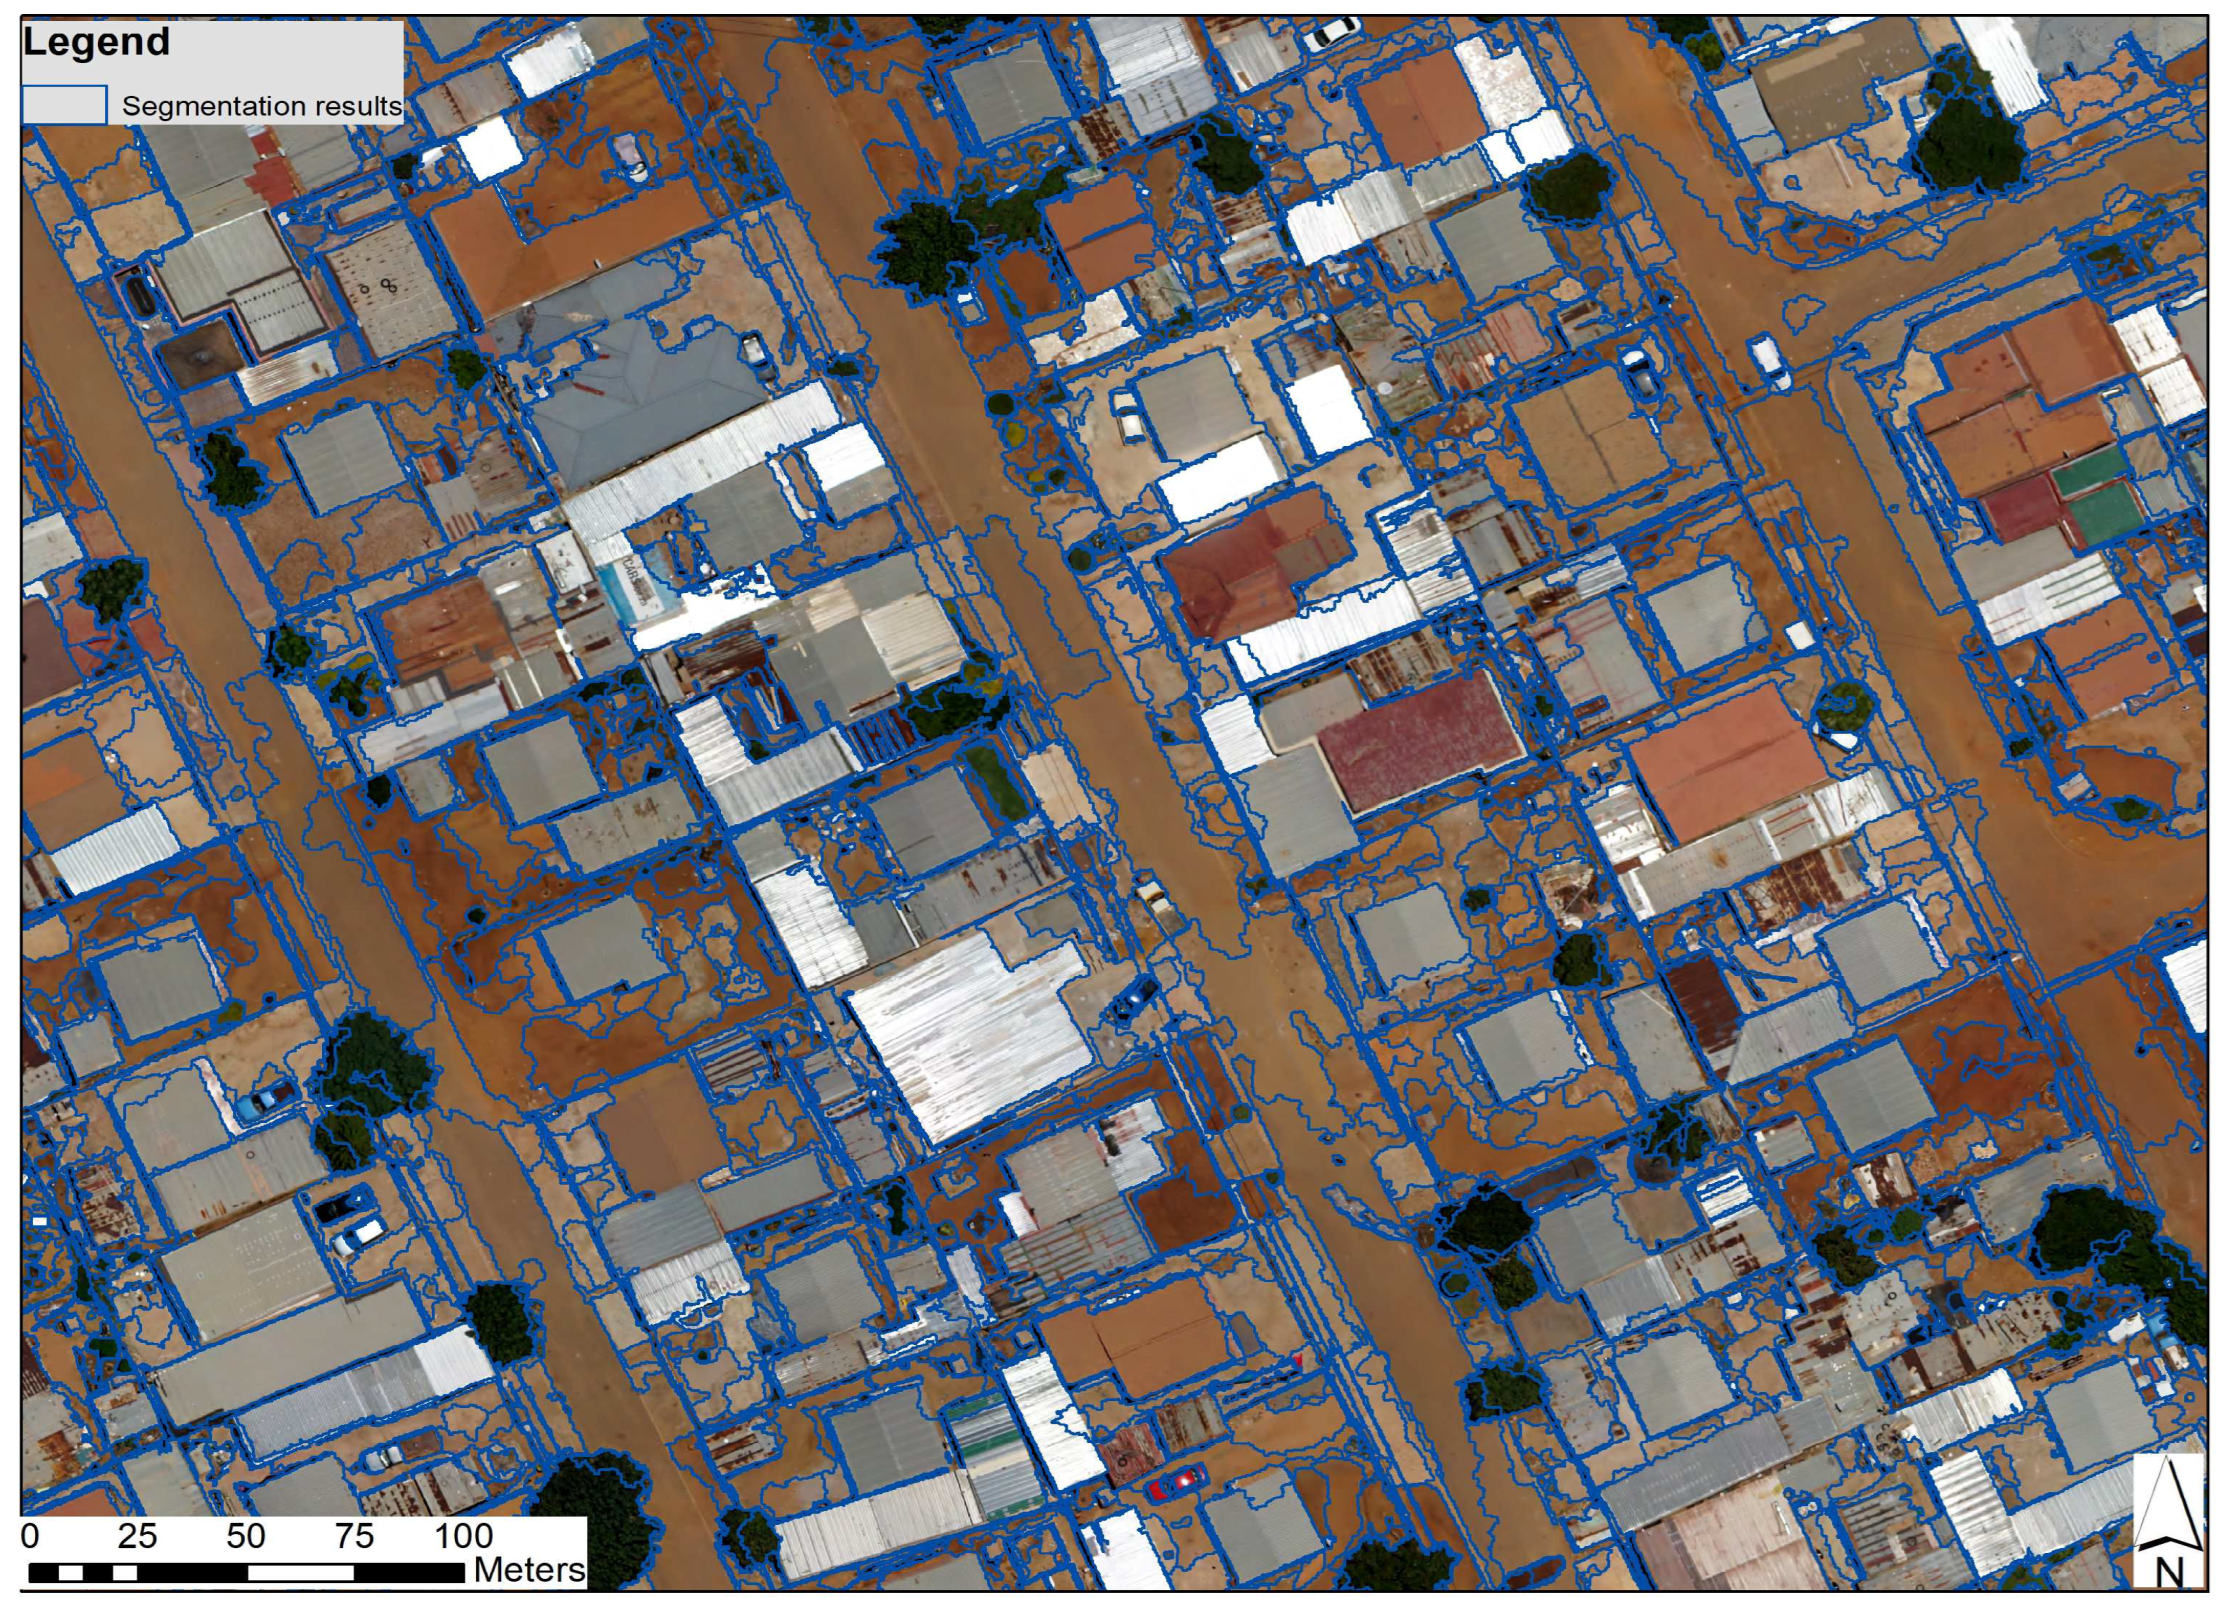
4.1. Segmentation Results
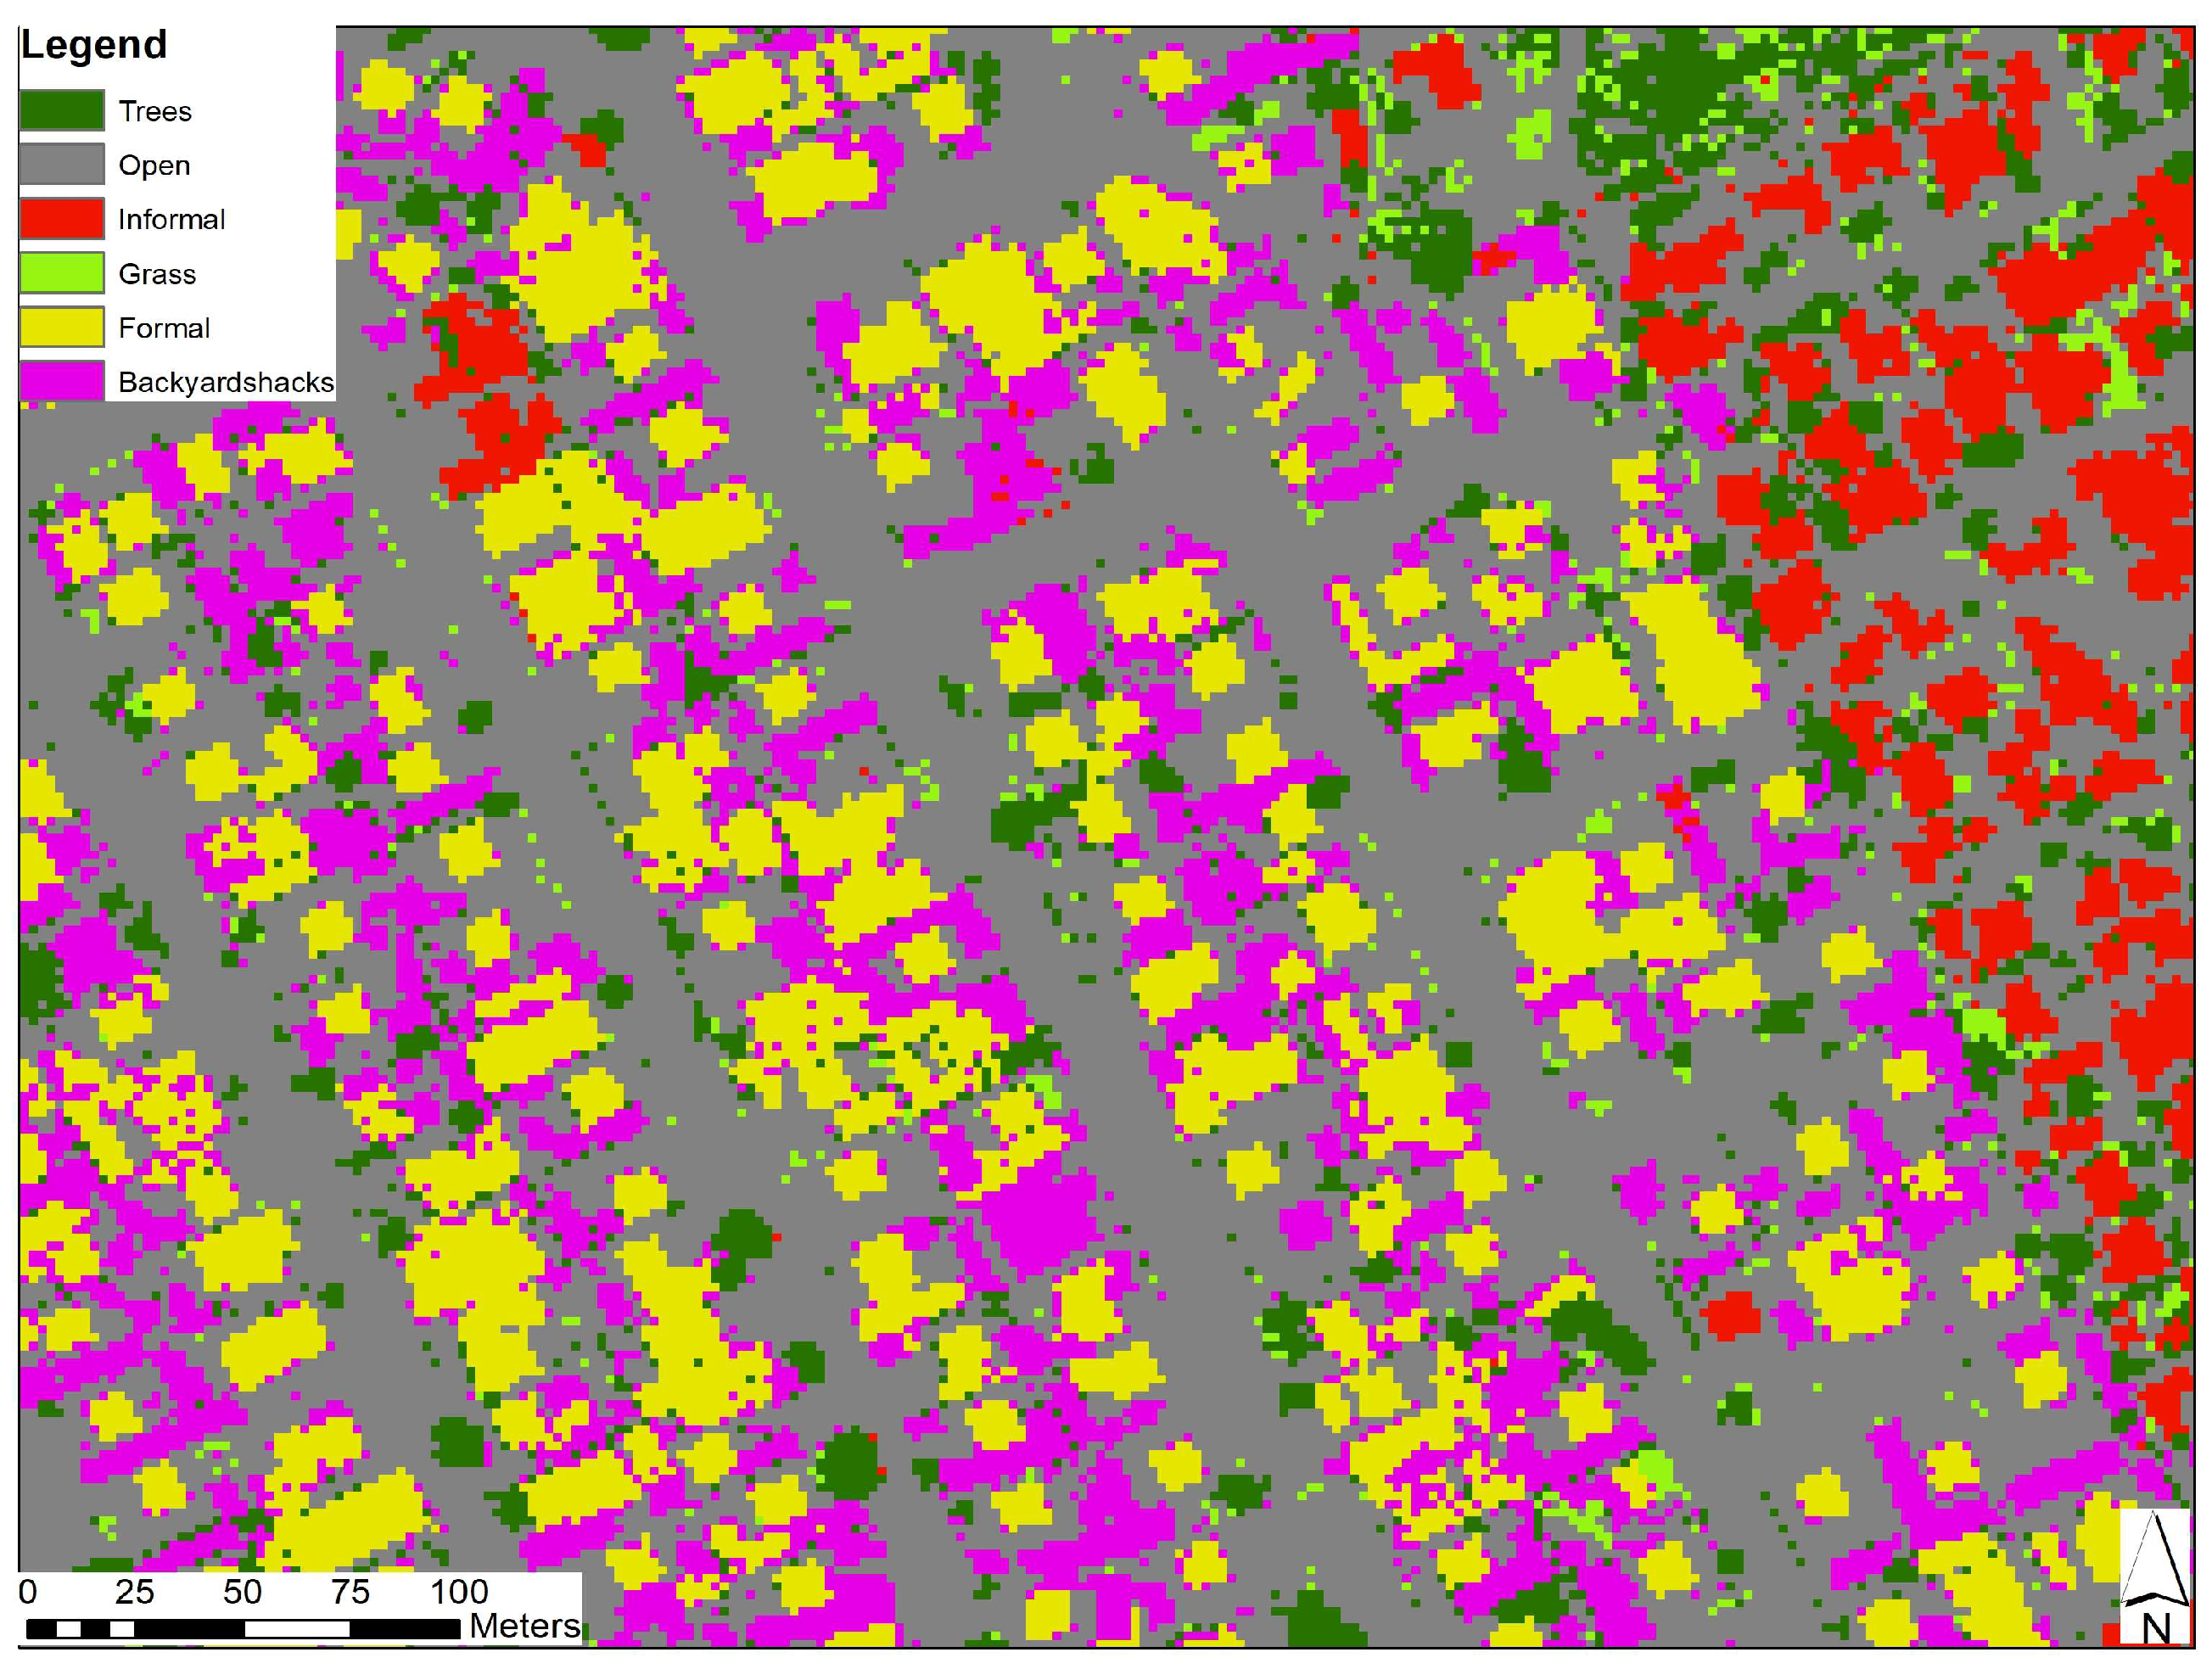
4.2. Classification Results
4.3. Accuracy Assessment
4.4. Spatial Pattern Analysis
4.4.1. Shape Metrics
4.4.2. Aggregation Metrics
4.4.3. Landscape Metrics
5. Conclusions
Author Contributions
Funding
Data Availability Statement
Conflicts of Interest
References
- UN-Habitat. World Cities Report: Envisaging the Future of Cities. 2022. Available online: https://unhabitat.org/wcr/ (accessed on 30 June 2023).
- Jing, Y.; Cui, J.; Chen, Y.; Ma, D. (Eds.) Towards Sustainable Urban Development: Use of Geographic Big Data for Spatial Planning; Frontiers Research Topics; Frontiers Media SA: Lausanne, Switzerland, 2023; Available online: https://www.frontiersin.org/research-topics/31109/towards-sustainable-urban-development-use-of-geographic-big-data-for-spatial-planning (accessed on 12 August 2012).
- Turok, I.; Borel-Saladin, J. Backyard shacks, informality and the urban housing crisis in South Africa: Stopgap or prototype solution? Hous. Stud. 2016, 31, 384–409. [Google Scholar] [CrossRef]
- Shapurjee, Y.; le Roux, A.; Coetzee, M. Backyard housing in Gauteng: An analysis of spatial dynamics. Town Reg. Plan. 2014, 64, 19–30. [Google Scholar]
- Mahlakanya, I.; Willemse, L. A living conditions index for main and backyard shacks and backyard rooms in Gauteng’s metropolitan municipalities: 2001 to 2011. Town Reg. Plan. 2022, 80, 21–39. [Google Scholar] [CrossRef]
- de Kadt, J.; Hamann, C.; Mkhize, S.P.; Parker, A. Quality of Life Survey 6 (2020/21): Overview Report Johannesburg. 2021. Available online: https://gcro.ac.za/outputs/data-briefs/detail/quality-life-survey-6-202021-overview-report/ (accessed on 30 June 2012).
- Tshangana, A. Local Government Position on Municipal Responses to Backyarders and Backyard Dwellings Specialist: Sustainable Human Settlements; South African Local Government Association (SALGA): Cape Town, South Africa, 2014.
- Bank, L. The Rhythms of the Yards: Urbanism, Backyards and Housing Policy in South Africa. J. Contemp. Afr. Stud. 2007, 25, 205–228. [Google Scholar] [CrossRef]
- Statistics South Africa. GHS Series Volume VII, Housing from a Human Settlement Perspective; Statistics South Africa: Cape Town, South Africa, 2016.
- Gevaert, C.; Sliuzas, R.; Persello, C.; Vosselman, G. Opportunities for UAV mapping to support unplanned settlement upgrading. Rwanda J. 2016, 1. [Google Scholar] [CrossRef]
- Preethi Latha, T.; Naga Sundari, K.; Cherukuri, S.; Prasad, M.V.V.S.V. Remote sensing uav/drone technology as a tool for urban development measures in apcrda. In International Archives of the Photogrammetry, Remote Sensing and Spatial Information Sciences—ISPRS Archives; International Society for Photogrammetry and Remote Sensing: Bethesda, MD, USA, 2019; pp. 525–529. [Google Scholar]
- Chaudhry, M.H.; Ahmad, A.; Gulzar, Q. Impact of UAV Surveying Parameters on Mixed Urban Landuse Surface Modelling. ISPRS Int. J. Geo-Inf. 2020, 9, 656. [Google Scholar] [CrossRef]
- Koeva, M.; Muneza, M.; Gevaert, C.; Gerke, M.; Nex, F. Using UAVs for map creation and updating. A case study in Rwanda. Surv. Rev. 2018, 50, 312–325. [Google Scholar] [CrossRef]
- Ruwaimana, M.; Satyanarayana, B.; Otero, V.; Muslim, A.M.; Syafiq, A.M.; Ibrahim, S.; Raymaekers, D.; Koedam, N.; Dahdouh-Guehbas, F. The advantages of using drones over space-borne imagery in the mapping of mangrove forests. PLoS ONE 2018, 13, e0200288. [Google Scholar] [CrossRef]
- Noor, N.M.; Abdullah, A.; Hashim, M. Remote sensing UAV/drones and its applications for urban areas: A review. IOP Conf. Ser. Earth Environ. Sci. 2018, 169, 012003. [Google Scholar] [CrossRef]
- Myint, S.W.; Gober, P.; Brazel, A.; Grossman-Clarke, S.; Weng, Q. Per-pixel vs. object-based classification of urban land cover extraction using high spatial resolution imagery. Remote Sens. Environ. 2011, 115, 1145–1161. [Google Scholar] [CrossRef]
- Mugiraneza, T.; Nascetti, A.; Ban, Y. WorldView-2 Data for Hierarchical Object-Based Urban Land Cover Classification in Kigali: Integrating Rule-Based Approach with Urban Density and Greenness Indices. Remote Sens. 2019, 11, 2128. [Google Scholar] [CrossRef]
- Mitra, S.; Aithal, D.B. Automatic Extraction of Buildings from UAV-Based Imagery Using Artificial Neural Networks. J. Indian Soc. Remote Sens. 2020, 49, 681–687. [Google Scholar]
- Huang, Y.; Zhuo, L.; Tao, H.; Shi, Q.; Liu, K. A Novel Building Type Classification Scheme Based on Integrated LiDAR and High-Resolution Images. Remote Sens. 2017, 9, 679. [Google Scholar] [CrossRef]
- Lu, Z.; Im, J.; Rhee, J.; Hodgson, M. Building type classification using spatial and landscape attributes derived from LiDAR remote sensing data. Landsc. Urban Plan. 2014, 130, 134–148. [Google Scholar] [CrossRef]
- Teng, Z.; Li, C.; Zhao, W.; Wang, Z.; Li, R.; Zhang, L.; Song, Y. Extraction and Analysis of Spatial Feature Data of Traditional Villages Based on the Unmanned Aerial Vehicle (UAV) Image. Mob. Inf. Syst. 2022, 2022, 4663740. [Google Scholar] [CrossRef]
- Sibaruddin, H.I.; Zulhaidi, H.; Shafri, M.; Pradhan, B.; Haron, N.A. UAV-based Approach to Extract Topographic and As-built Information by Utilising the OBIA Technique. J. Geosci. Geomat. 2018, 6, 103–123. [Google Scholar]
- Gevaert, C.M.; Persello, C.; Sliuzas, R.; Vosselman, G. Monitoring household upgrading in unplanned settlements with unmanned aerial vehicles. Int. J. Appl. Earth Obs. Geoinf. 2020, 90, 102117. [Google Scholar] [CrossRef]
- Ashilah, Q.P.; Rokhmatuloh; Hernina, R. Urban slum identification in Bogor Tengah Sub-District, Bogor City using Unmanned Aerial Vehicle (UAV) Images and Object-Based Image Analysis. IOP Conf. Ser. Earth Environ. Sci. 2021, 716, 012133. [Google Scholar] [CrossRef]
- Peeroo, U.; Idrees, M.O.; Saeidi, V. Building extraction for 3D city modelling using airborne laser scanning data and high-resolution aerial photo. S. Afr. J. Geomat. 2017, 6, 363. [Google Scholar] [CrossRef]
- Wu, Q.; Zhong, R.; Zhao, W.; Song, K.; Du, L. Land-cover classification using GF-2 images and airborne lidar data based on Random Forest. Int. J. Remote Sens. 2019, 40, 2410–2426. [Google Scholar] [CrossRef]
- Shih, H.-C.; Stow, D.A.; Chang, K.-C.; Roberts, D.A.; Goulias, K.G. From land cover to land use: Applying random forest classifier to Landsat imagery for urban land-use change mapping. Geocarto Int. 2022, 37, 5523–5546. [Google Scholar] [CrossRef]
- Touzani, S.; Pritoni, M.; Singh, R. Machine Learning for Automated Extraction of Building Geometry. 2023. Available online: https://escholarship.org/uc/item/4vr8r3vk (accessed on 30 June 2023).
- Housing Development Agency. HDA Informal Settlements Status South Africa; Housing Development Agency: Mahikeng, South Africa, 2012. [Google Scholar]
- Mudau, N.; Mhangara, P. Investigation of Informal Settlement Indicators in a Densely Populated Area Using Very High Spatial Resolution Satellite Imagery. Sustainability 2021, 13, 4735. [Google Scholar] [CrossRef]
- Fallatah, A.; Jones, S.; Mitchell, D. Object-based random forest classification for informal settlements identification in the Middle East: Jeddah a case study. Int. J. Remote Sens. 2020, 41, 4421–4445. [Google Scholar] [CrossRef]
- Hofmann, P. Detecting Informal Settlements from IKONOS Image Data Using Methods of Object Oriented Image Analysis—An Example from Cape Town (South Africa). In Remote Sensing of Urban Areas/Fernerkundung in Urbanen Räumen; Jürgens, C., Ed.; Institut für Geographie an der Universität Regensburg: Regensburg, Germany, 2001; pp. 41–42. Available online: https://www.academia.edu/16561882/Detecting_informal_settlements_from_IKONOS_image_data_using_methods_of_object_oriented_image_analysis_an_example_from_Cape_Town_South_Africa_ (accessed on 30 June 2023).
- Kohli, D. Identifying and Classifying Slum Areas Using Remote Sensing; University of Twente Faculty of Geo-Information and Earth Observation (ITC): Enschede, The Netherlands, 2015. [Google Scholar] [CrossRef][Green Version]
- Kuffer, M.; Barros, J. Urban morphology of unplanned settlements: The use of spatial metrics in VHR remotely sensed images. In Procedia Environmental Sciences; Elsevier B.V.: Amsterdam, The Netherlands, 2011; pp. 152–157. [Google Scholar]
- Leonita, G.; Kuffer, M.; Sliuzas, R.; Persello, C. Machine Learning-Based Slum Mapping in Support of Slum Upgrading Programs: The Case of Bandung City, Indonesia. Remote Sens. 2018, 10, 1522. [Google Scholar] [CrossRef]
- Abunyewah, M.; Gajendran, T.; Maund, K. Profiling Informal Settlements for Disaster Risks. Procedia Eng. 2018, 212, 238–245. [Google Scholar] [CrossRef]
- City of Tshwane. A City of Tshwane Integrated Development Plan: Revision for 2020/21 and Service Delivery and Budget Implementation (SDBIP) Scorecard. 2020. Available online: https://www.cogta.gov.za/cgta_2016/wp-content/uploads/2020/11/City-of-Tshwane-Approved-2020-2021-IDP-and-SDBIP-City-of-Tshwane-30-06-2020.pdf (accessed on 30 June 2023).
- City of Tshwane. Human Settlements. 2020. Available online: https://www.dffe.gov.za/sites/default/files/reports/environmentoutlook_chapter5.pdf (accessed on 30 June 2023).
- GCRO. Backyard and Informal Dwellings (2001–2016). 2018. Available online: https://www.gcro.ac.za/outputs/map-of-the-month/detail/backyard-and-informal-dwellings-2001-2016/#:~:text=However%20backyard%20dwellings%20grew%20at,600%20000%20informal%20settlement%20dwellings (accessed on 30 June 2023).
- Baatz, M.; Schäpe, A. Multi resolution segmentation: An optimum approach for high quality multi scale image segmentation. In Beutrage zum AGIT-Symposium Salzburg; Angewandte Geographische Informationsverarbeitung XII: Heidelberg, Germany, 2000; pp. 12–23. [Google Scholar]
- Fan, Y.; Ding, X.; Wu, J.; Ge, J.; Li, Y. High spatial-resolution classification of urban surfaces using a deep learning method. Build. Environ. 2021, 200, 107949. [Google Scholar] [CrossRef]
- Jovanović, D.; Gavrilović, M.; Sladić, D.; Radulović, A.; Govedarica, M. Building Change Detection Method to Support Register of Identified Changes on Buildings. Remote Sens. 2021, 13, 3150. [Google Scholar] [CrossRef]
- Norman, M.; Shahar, H.M.; Mohamad, Z.; Rahim, A.; Mohd, F.A.; Shafri, H.Z.M. Urban building detection using object-based image analysis (OBIA) and machine learning (ML) algorithms. IOP Conf. Ser. Earth Environ. Sci. 2021, 620, 012010. [Google Scholar] [CrossRef]
- Breiman, L. Random Forest. Mach. Learn. 2001, 45, 5–32. [Google Scholar] [CrossRef]
- Woebbecke, D.M.; Meyer, G.E.; Von Bargen, K.; Mortensen, D.A. Color indices for weed identification under various soil, residue, and lighting conditions. Trans. Am. Soc. Agric. Eng. 1995, 38, 259–269. [Google Scholar] [CrossRef]
- Kurfess, F.J. Artificial Intelligence. In Encyclopedia of Physical Science and Technology, 3rd ed.; Meyers, R.A., Ed.; Academic Press: New York, NY, USA, 2003; pp. 609–629. Available online: https://www.sciencedirect.com/science/article/pii/B0122274105000272 (accessed on 30 June 2023).
- Lizarazo, I. Accuracy assessment of object-based image classification: Another STEP. Int. J. Remote Sens. 2014, 35, 6135–6156. [Google Scholar] [CrossRef]
- Zhang, Y.; Liu, X.; Yang, Q.; Liu, Z.; Li, Y. Extracting Frequent Sequential Patterns of Forest Landscape Dynamics in Fenhe River Basin, Northern China, from Landsat Time Series to Evaluate Landscape Stability. Remote Sens. 2021, 13, 3963. [Google Scholar] [CrossRef]
- Street, G.M.; Fieberg, J.; Rodgers, A.R.; Carstensen, M.; Moen, R.; Moore, S.A.; Windels, S.K.; Forester, J.D. Habitat functional response mitigates reduced foraging opportunity: Implications for animal fitness and space use. Landsc. Ecol. 2016, 31, 1939–1953. [Google Scholar] [CrossRef]
- Andersson, E.; Colding, J. Understanding how built urban form influences biodiversity. Urban For. Urban Green. 2014, 13, 221–226. [Google Scholar] [CrossRef]
- Zambrano, L.; Handel, S.N.; Fernandez, T.; Brostella, I. Landscape spatial patterns in Mexico City and New York City: Contrasting territories for biodiversity planning. Landsc. Ecol. 2021, 37, 601–617. [Google Scholar] [CrossRef]
- Norton, B.A.; Evans, K.L.; Warren, P.H. Urban Biodiversity and Landscape Ecology: Patterns, Processes and Planning. Curr. Landsc. Ecol. Rep. 2016, 1, 178–192. [Google Scholar] [CrossRef]
- McGarigal, K.; Marks, B.J. Spatial pattern analysis program for quantifying landscape structure. In General Technical Report; PNW-GTR-351; US Department of Agriculture, Forest Service, Pacific Northwest Research Station: Portland, OR, USA, 1995; pp. 1–122. [Google Scholar]
- Christopher, J. The science of rule-based classifiers. In Proceedings of the 9th International Conference On Cloud Computing, Data Science and Engineering, Confluence, Noida, India, 10–11 January 2019; IEEE: Piscataway, NJ, USA, 2019; pp. 299–303. [Google Scholar]
- Zahidi, I.; Yusuf, B.; Hamedianfar, A.; Shafri, H.Z.M.; Mohamed, T.A. Object-based classification of QuickBird image and low point density LIDAR for tropical trees and shrubs mapping. Eur. J. Remote Sens. 2015, 48, 423–446. [Google Scholar] [CrossRef]


| Characteristic | Specification |
|---|---|
| Camera | Sony A6000, 20 mm lens |
| Altitude | 120 m |
| Side lap | 80% |
| Forward lap | 80% |
| Spatial resolution | 3 cm |
| Ground control points | 29 |
| Imagery bands | Red (R), Green (G), Blue (B) |
| Landscape Metric Type | Landscape Metrics Assessed * |
|---|---|
| Shape | Shape index (SHAPE) Fractal Dimension Index (FRAC) Continuity Index (CONTIG) |
| Landscape | Simpson’s diversity index (SIDI) Shannon’s Evenness Index (SEI) |
| Aggregation | Euclidean Nearest-Neighbour Distance Aggregation Index (AI) Cohesion Index |
| Category | Shape | Theme | Edge | Position |
|---|---|---|---|---|
| Backyard shacks | 0.28 | 0.86 | 0.59 | 0.29 |
| Formal | 0.27 | 0.49 | 0.33 | 0.34 |
| Grass | 0.07 | 0.10 | 0.07 | 0.08 |
| Informal | 0.35 | 0.67 | 0.41 | 0.46 |
| Trees | 0.44 | 0.84 | 0.49 | 0.73 |
| Category | Shape | Theme | Edge | Position |
|---|---|---|---|---|
| Backyard shacks | 0.22 | 0.74 | 0.50 | 0.34 |
| Formal | 0.42 | 0.83 | 0.57 | 0.43 |
| Grass | 0.44 | 0.61 | 0.43 | 0.46 |
| Informal | 0.33 | 0.71 | 0.42 | 0.49 |
| Trees | 0.48 | 0.85 | 0.49 | 0.75 |
| Random Forest Classifier | Rule-Based Classification | |||
|---|---|---|---|---|
| Producer Accuracy % | User Accuracy % | Producer Accuracy % | User Accuracy % | |
| Backyard shacks | 69 | 96 | 89 | 93 |
| Formal | 92 | 11 | 88 | 57 |
| Grass | 91 | 12 | 99 | 77 |
| Informal | 97 | 72 | 90 | 93 |
| Trees | 73 | 99 | 72 | 99 |
| Overall accuracy % | 60 | 82 | ||
| Class | Euclidean Nearest-Neighbour Distance | Cohesion Index | Aggregation Index |
|---|---|---|---|
| Formal | 142.023 | 83.39 | 80.75 |
| Backyard shacks | 147.610 | 73.71 | 57.7 |
| Informal | 116.553 | 89.54 | 80.74 |
Disclaimer/Publisher’s Note: The statements, opinions and data contained in all publications are solely those of the individual author(s) and contributor(s) and not of MDPI and/or the editor(s). MDPI and/or the editor(s) disclaim responsibility for any injury to people or property resulting from any ideas, methods, instructions or products referred to in the content. |
© 2023 by the authors. Licensee MDPI, Basel, Switzerland. This article is an open access article distributed under the terms and conditions of the Creative Commons Attribution (CC BY) license (https://creativecommons.org/licenses/by/4.0/).
Share and Cite
Mudau, N.; Mhangara, P. Assessment of Spatial Patterns of Backyard Shacks Using Landscape Metrics. Drones 2023, 7, 561. https://doi.org/10.3390/drones7090561
Mudau N, Mhangara P. Assessment of Spatial Patterns of Backyard Shacks Using Landscape Metrics. Drones. 2023; 7(9):561. https://doi.org/10.3390/drones7090561
Chicago/Turabian StyleMudau, Naledzani, and Paidamwoyo Mhangara. 2023. "Assessment of Spatial Patterns of Backyard Shacks Using Landscape Metrics" Drones 7, no. 9: 561. https://doi.org/10.3390/drones7090561
APA StyleMudau, N., & Mhangara, P. (2023). Assessment of Spatial Patterns of Backyard Shacks Using Landscape Metrics. Drones, 7(9), 561. https://doi.org/10.3390/drones7090561