Evaluation of Almond Harvest Dust Abatement Strategies Using an Aerial Drone Particle Monitoring System
Abstract
1. Introduction
2. Materials and Methods
2.1. Study Area
2.2. Harvester Operational Modifications
2.3. Airborne Drone Particle Monitoring System
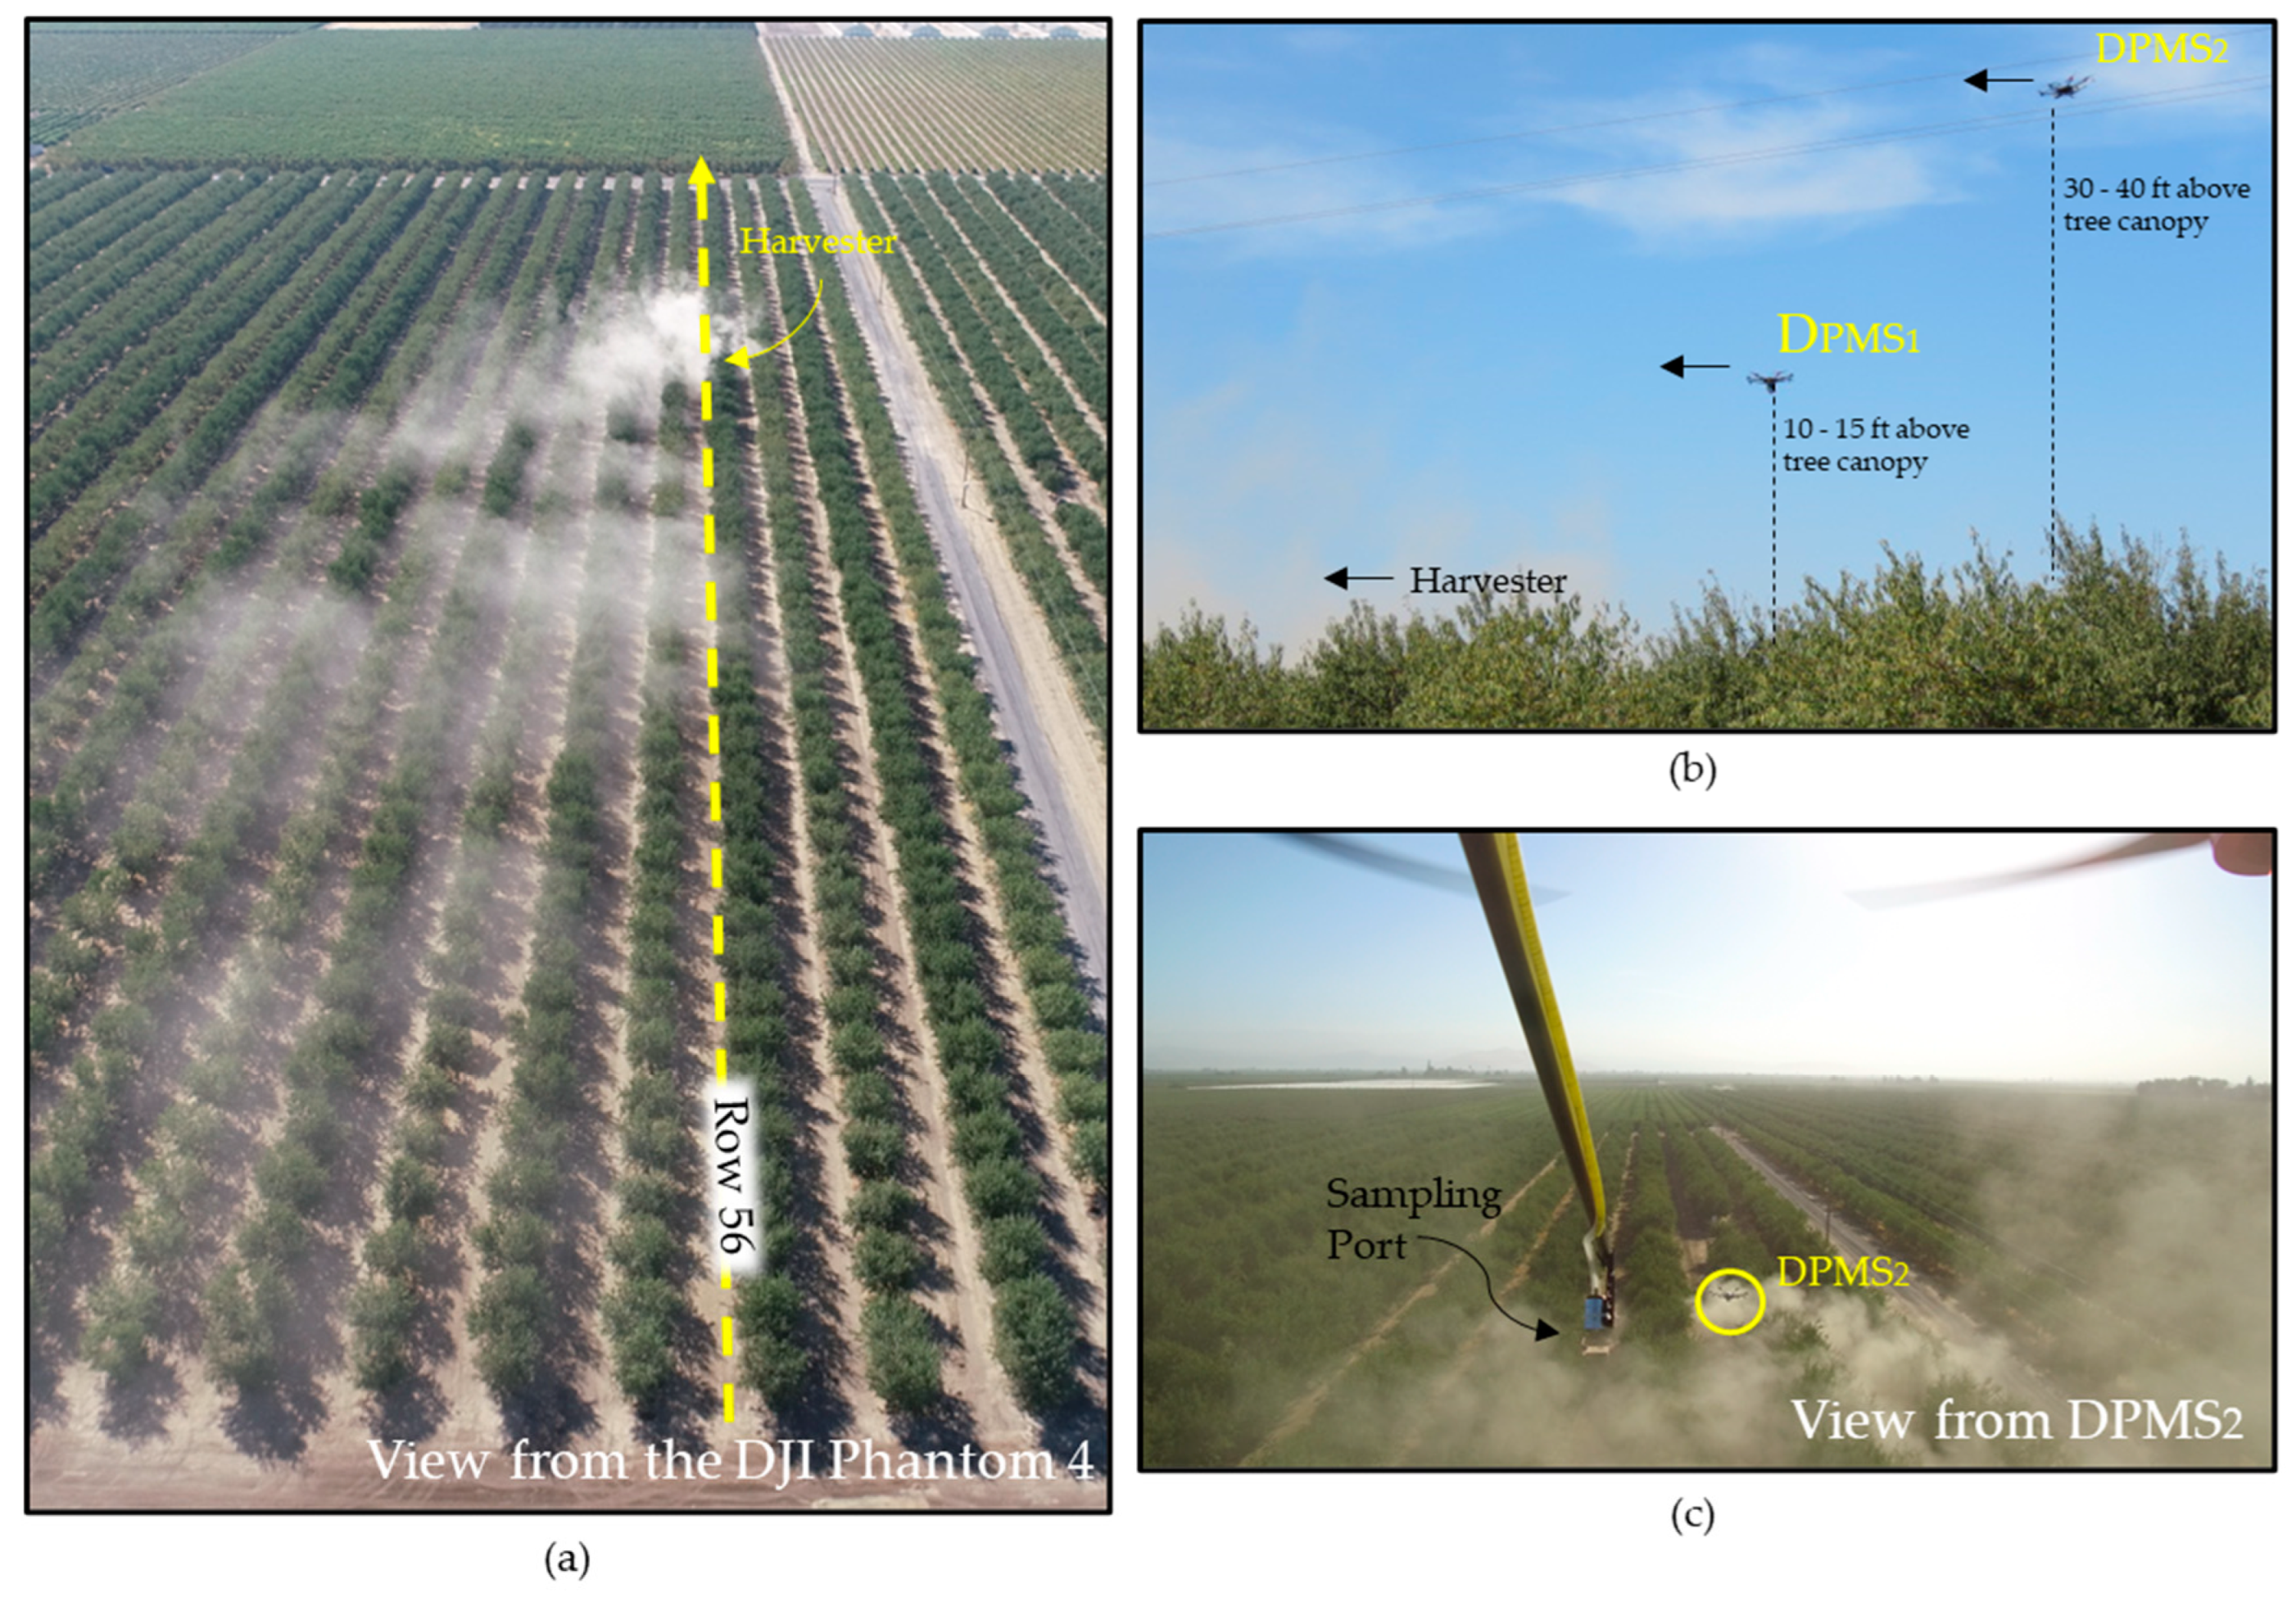
2.4. Flight Operations
2.5. Data Analyses
- i represents the treatment (T2–T6)
- j represents the specific PM cut (PM2.5, PM10, TSP)
3. Results and Discussion
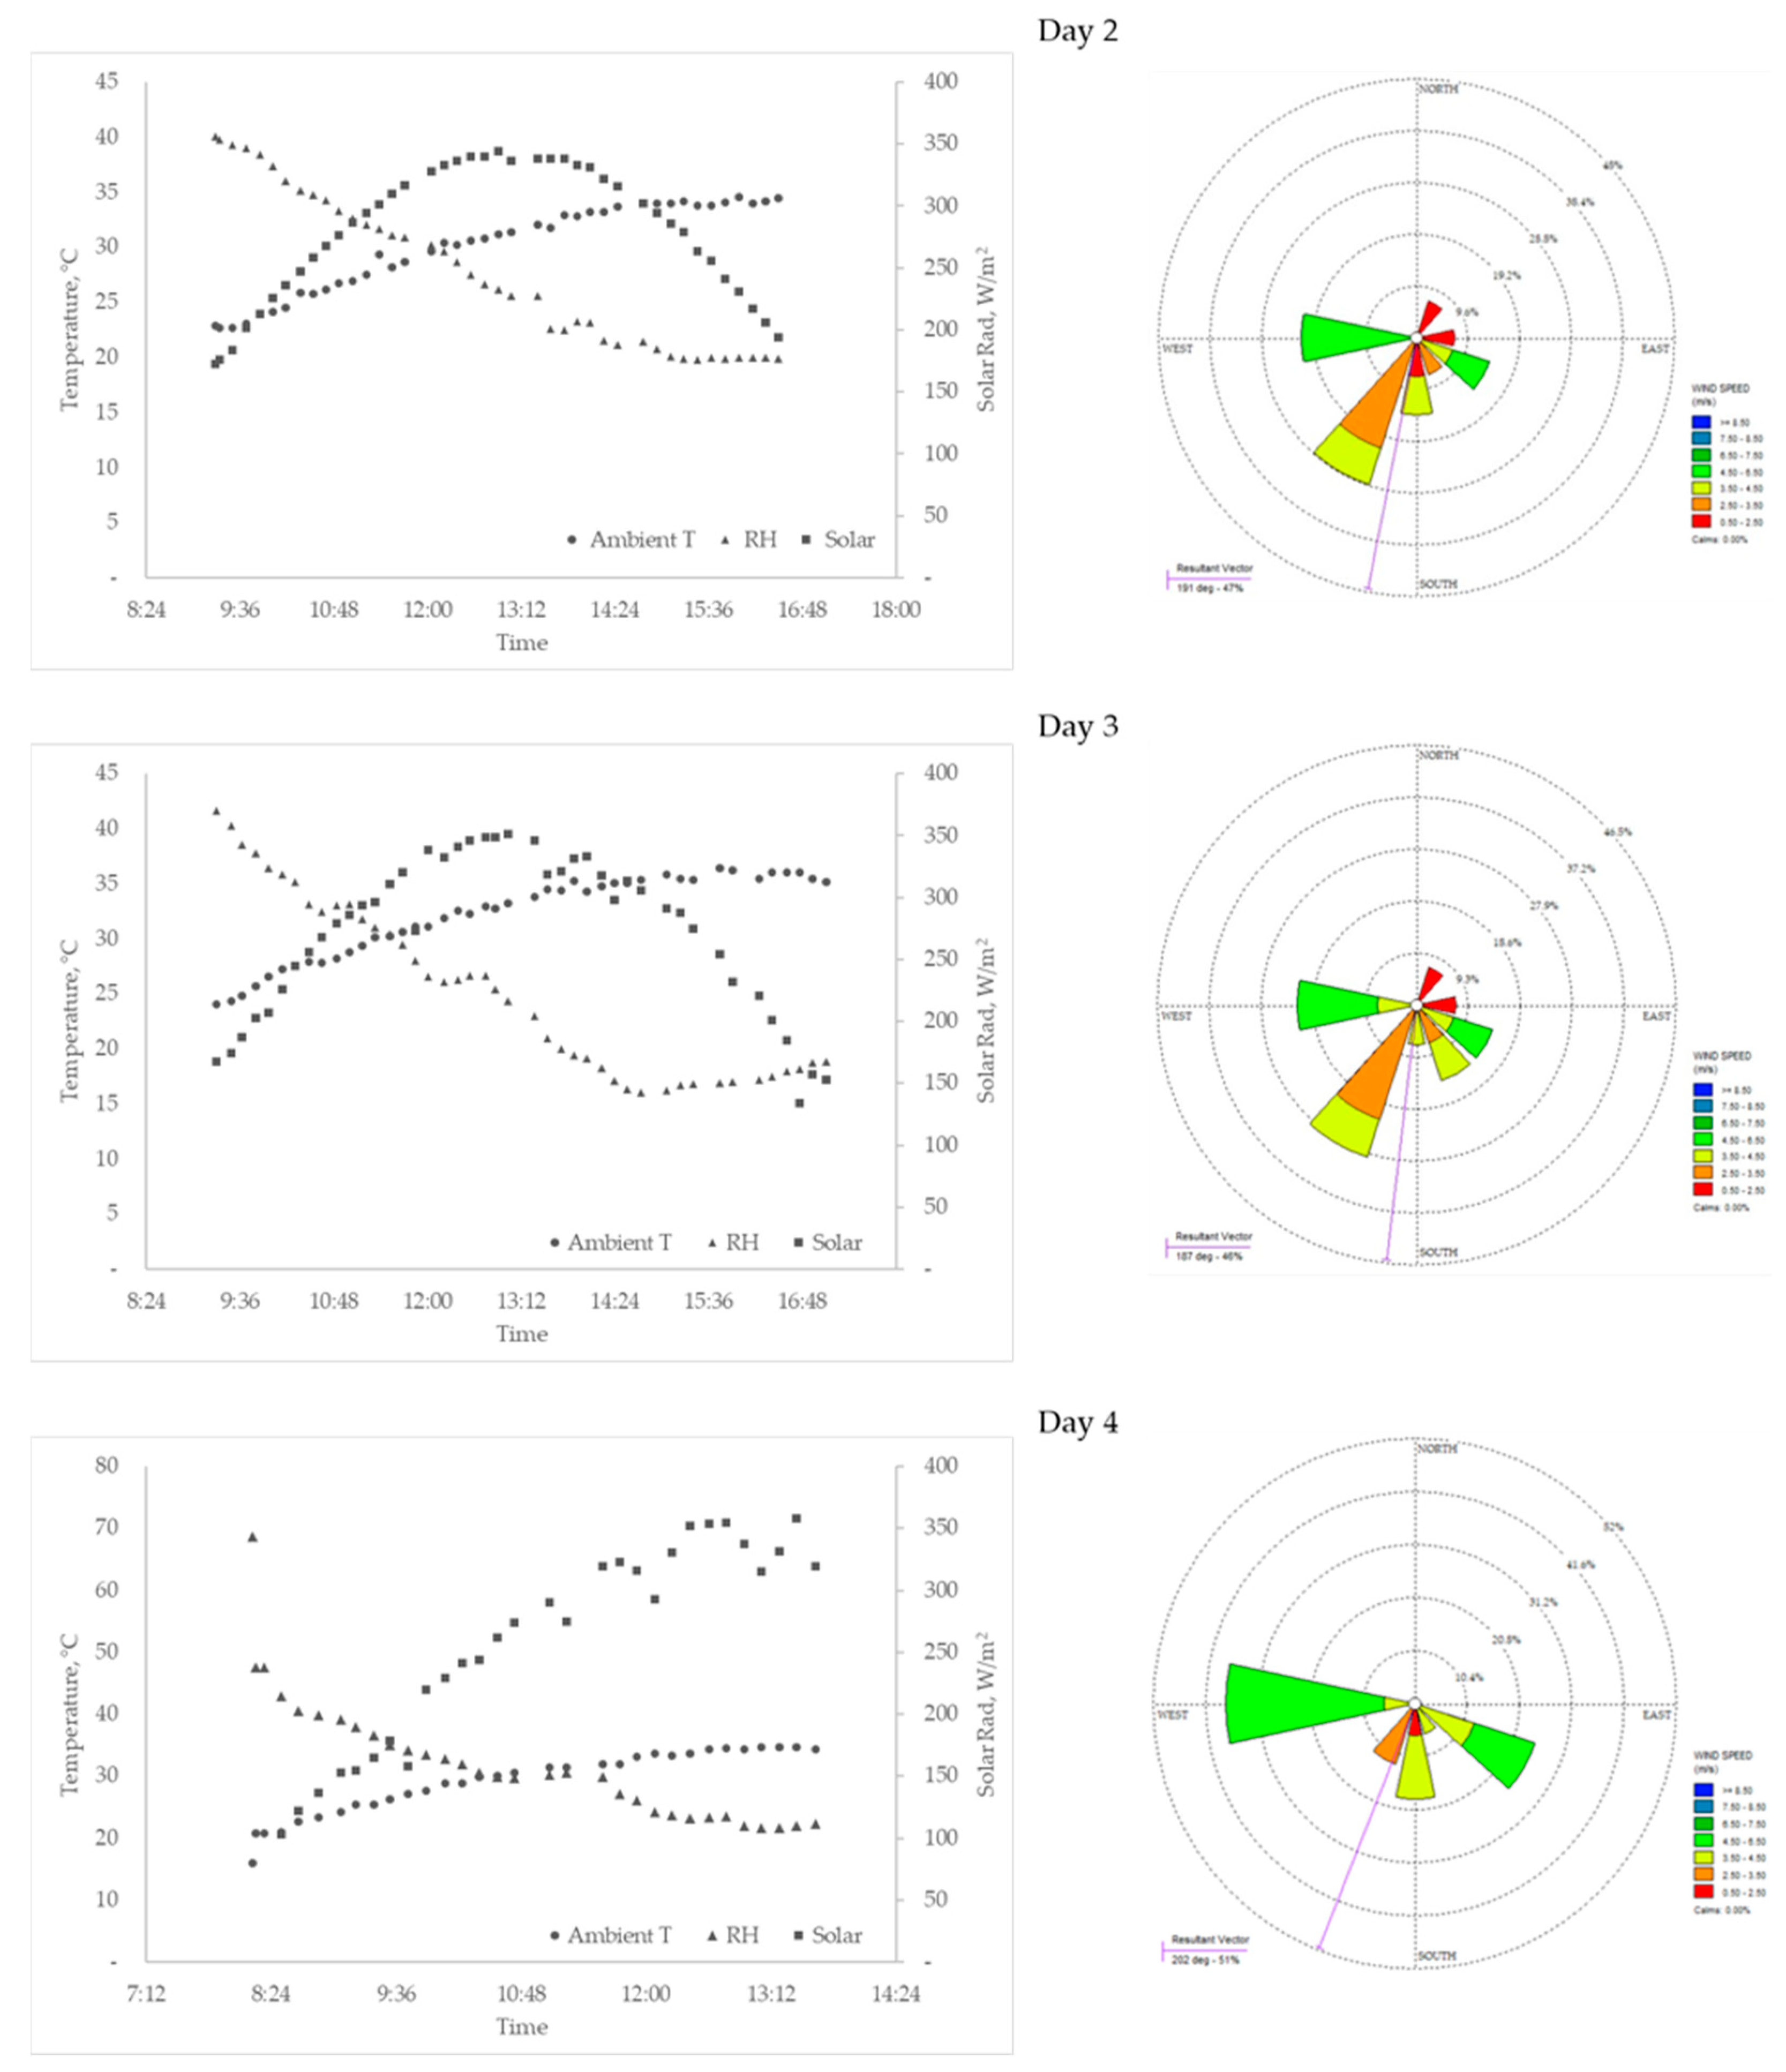
3.1. Daily Meteorological Variations
3.2. PM Levels at Various Harvester Operational Settings
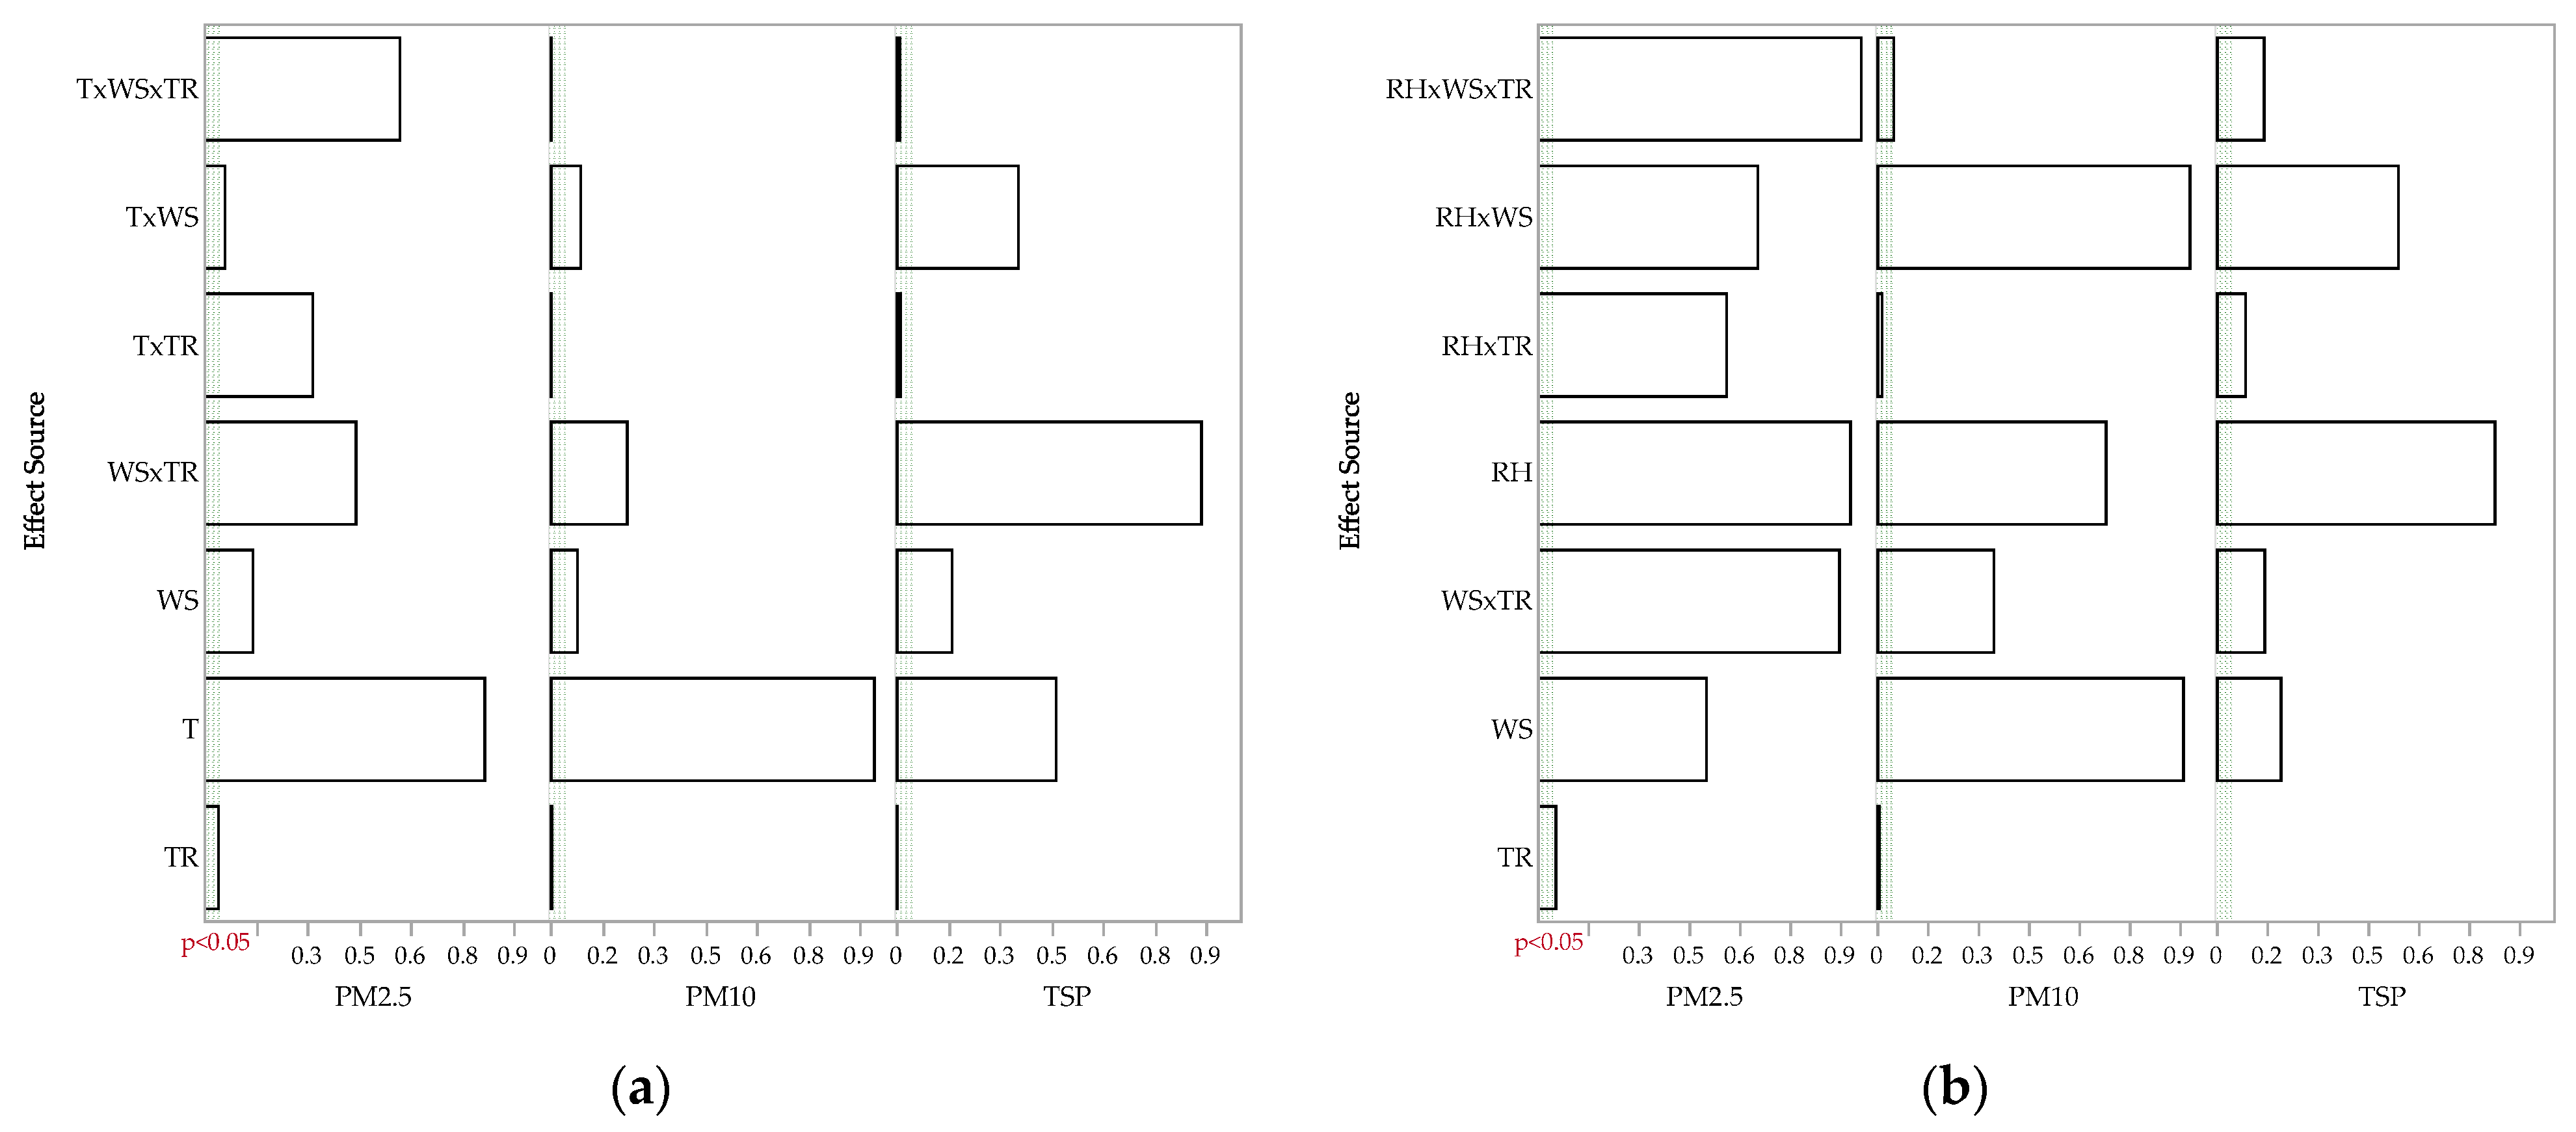
3.3. Effects Analysis of Meteorological Factors and Operational Changes to the DPMS Data
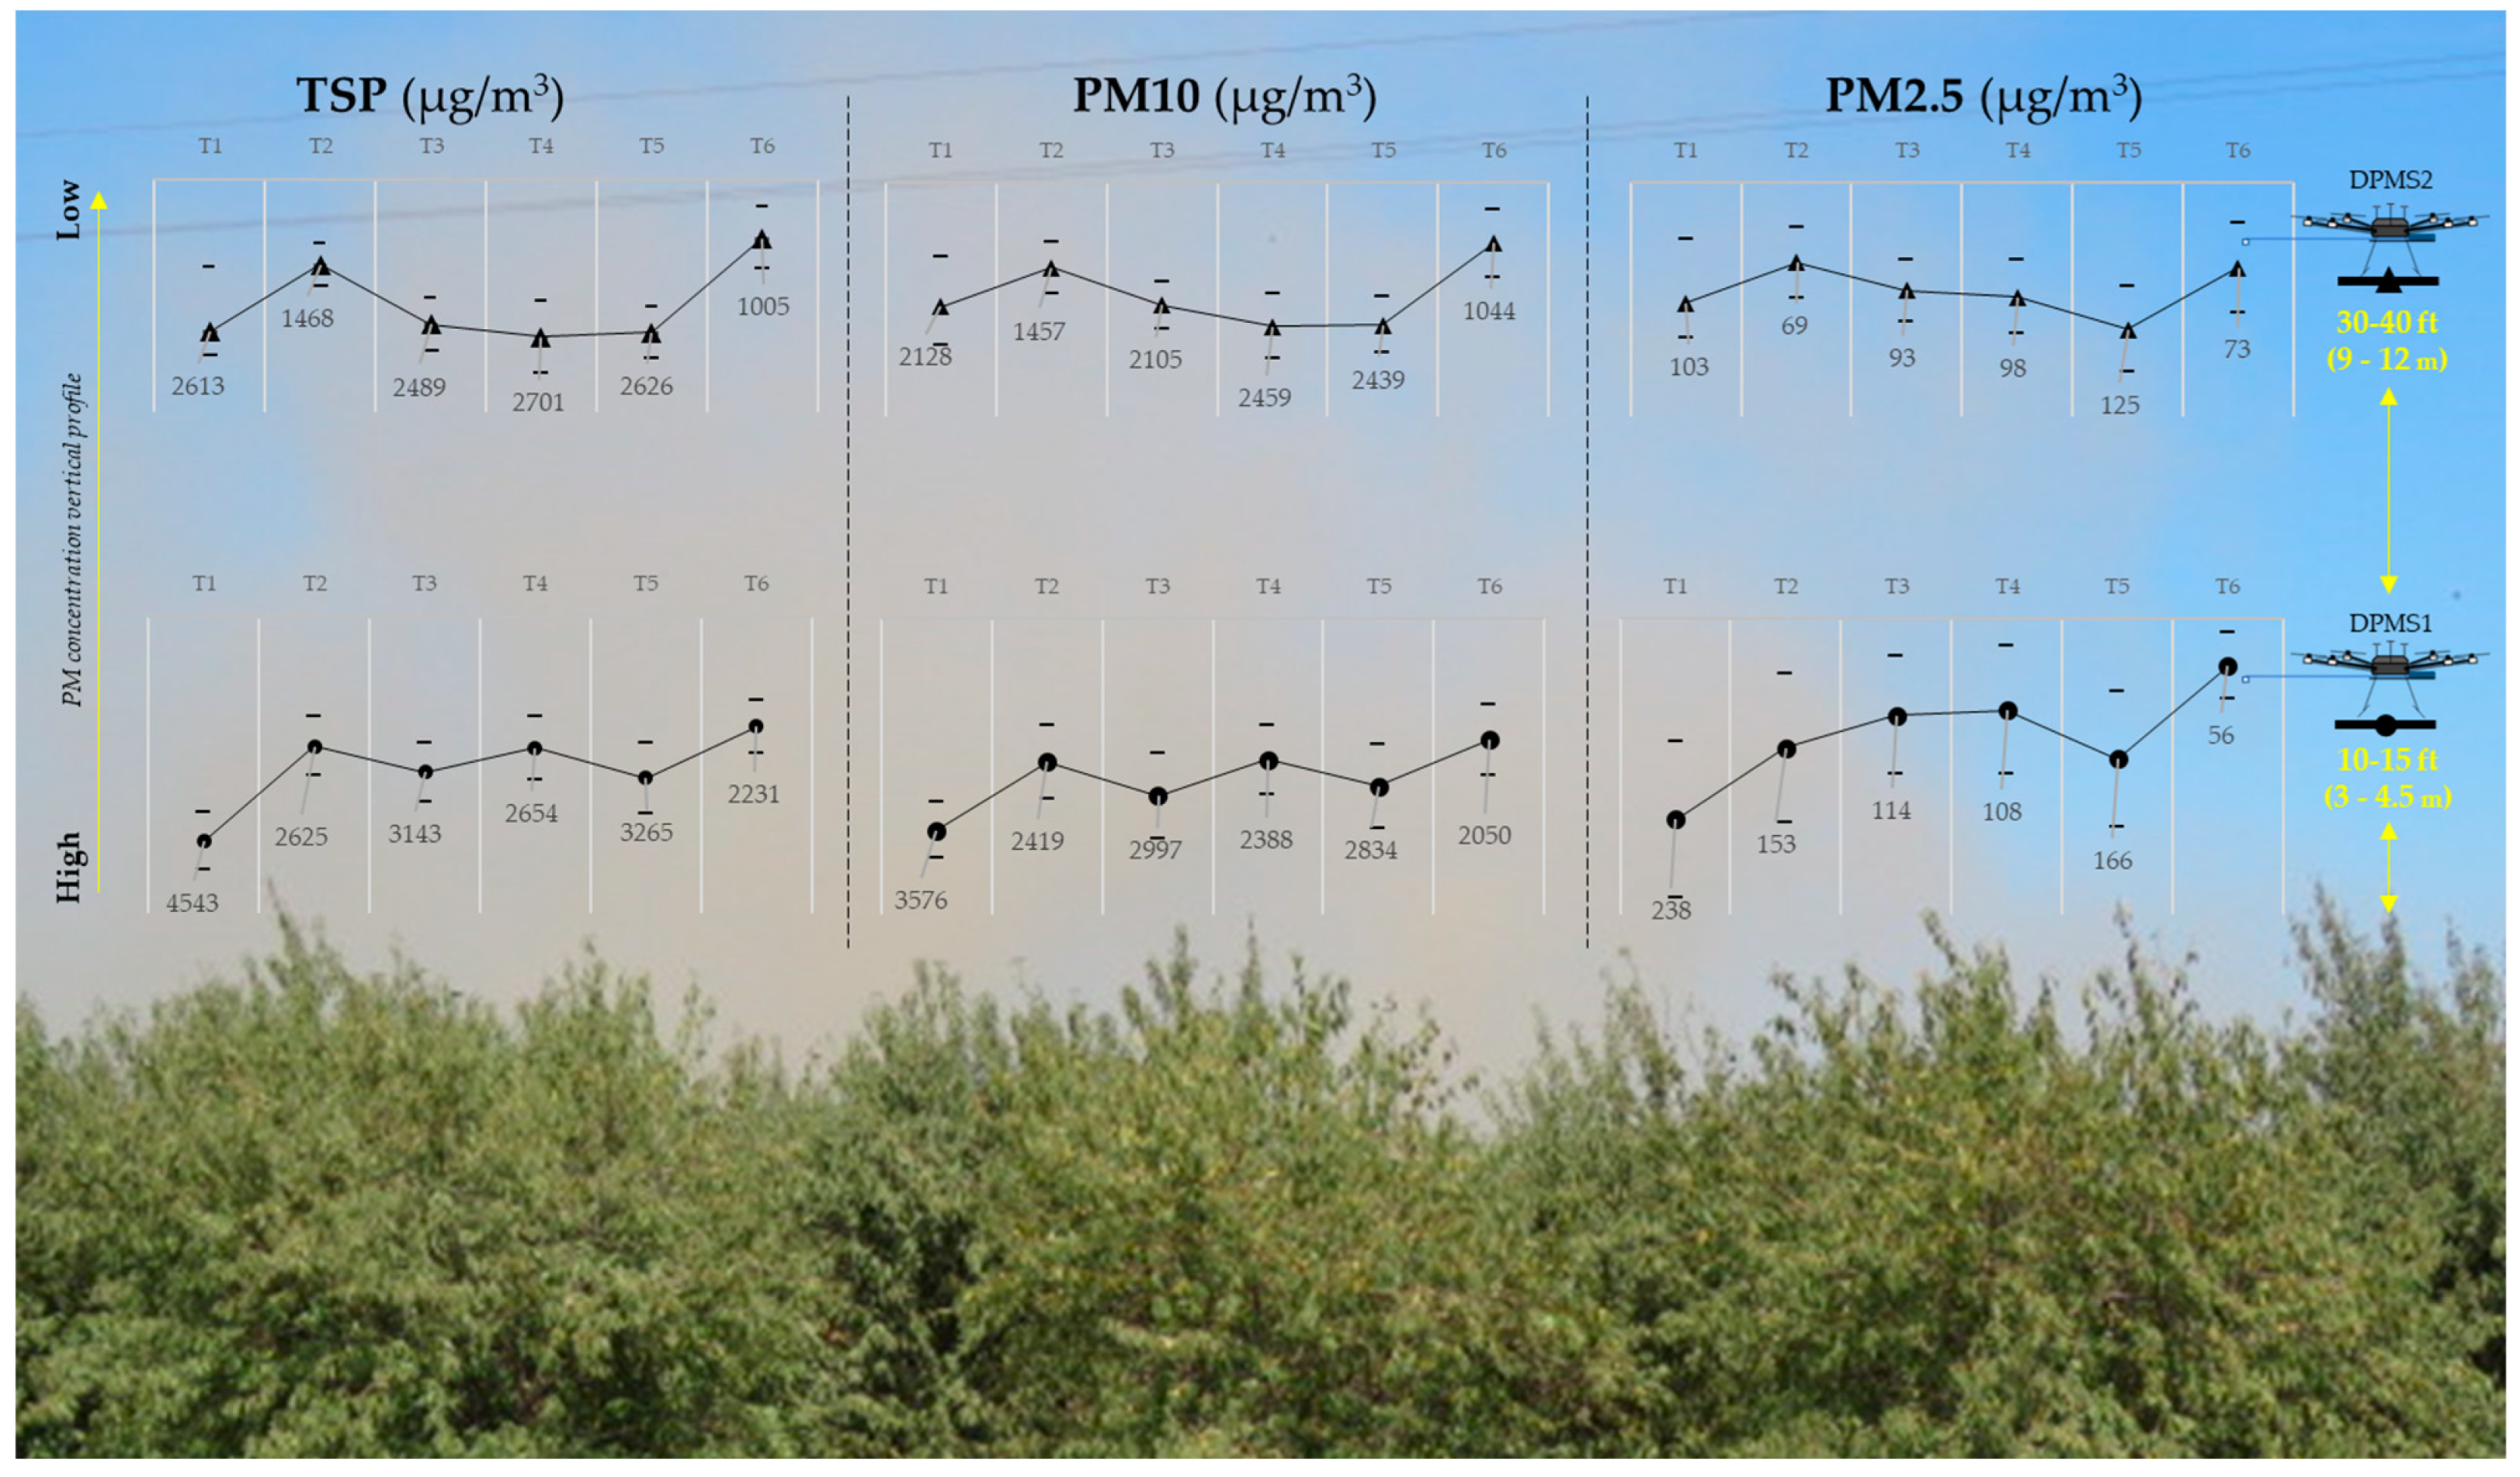
3.4. Vertical PM Concentration at Various Operational Settings
3.5. PM Reduction Estimate
4. Conclusions
Author Contributions
Funding
Data Availability Statement
Conflicts of Interest
References
- Almond Board of California. Almond Almanac; Almond Board of California: Modesto, CA, USA, 2021; pp. 1–25. [Google Scholar]
- Baticados, E.J.N.; Capareda, S.C.; Maglinao, A.L. Particulate matter emission factors using low-dust harvesters for almond nut-picking operations. J. Air Waste Manag. Assoc. 2019, 69, 1304–1311. [Google Scholar] [CrossRef] [PubMed]
- California Air Resource Board. Clean-Air Plan for San Joaquin Valley First to Meet All Federal Standards for Fine Particle Pollution: Integrated Approach Provides Range of Actions to Reduce PM2.5 Emissions. California State Implementation Plans 2019. Available online: https://ww2.arb.ca.gov/news/clean-air-plan-san-joaquin-valley-first-meet-all-federal-standards-fine-particle-pollution (accessed on 20 February 2023).
- Faulkner, W.B. Harvesting equipment to reduce particulate matter emissions from almond harvest. J. Air Waste Manag. Assoc. 2013, 63, 70–79. [Google Scholar] [CrossRef]
- Goodrich, L.B.; Faulkner, W.B.; Capareda, S.C.; Krauter, C.; Parnell, C.B. Particulate matter emission factors from reduced-pass almond sweeping. Trans. ASABE 2009, 52, 1669–1675. [Google Scholar] [CrossRef]
- Faulkner, W.B.; Goodrich, L.B.; Botlaguduru, V.S.V.; Capareda, S.C.; Parnell, C.B. Particulate Matter Emission Factors for Almond Harvest as a Function of Harvester Speed. J. Air Waste Manag. Assoc. 2009, 59, 943–949. [Google Scholar] [CrossRef]
- Faulkner, W.B.; Downey, D.; Giles, D.K.; Capareda, S.C. Evaluation of Particulate Matter Abatement Strategies for Almond Harvest. J. Air Waste Manag. Assoc. 2011, 61, 409–417. [Google Scholar] [CrossRef]
- Downey, D.; Giles, D.K.; Thompson, J.F. In Situ Transmissiometer Measurements for Real-Time Monitoring of Dust Discharge during Orchard Nut Harvesting. J. Environ. Qual. 2008, 37, 574–581. [Google Scholar] [CrossRef] [PubMed]
- Arzadon, E.L.; Baticados, E.J.N.; Capareda, S.C. Measurement of visible dust emissions during almond nut-picking operations at various harvester settings. J. Air Waste Manag. Assoc. 2023, 73, 212–224. [Google Scholar] [CrossRef] [PubMed]
- Waldherr, G.A.; Wylie, M.T.; Lin, H. Compact remote optical system for real time measurement of aerosol emissions. In Proceedings of the SPIE 9106, Advanced Environmental, Chemical, and Biological Sensing Technologies XI, Baltimore, MD, USA, 22 May 2014. [Google Scholar] [CrossRef]
- Jimenez, J.; Zanca, N.; Lan, H.; Jussila, M.; Hartonen, K.; Riekkola, M. Aerial drone as a carrier for miniaturized air sampling system. J. Chrom. A 2019, 1597, 202–208. [Google Scholar] [CrossRef]
- Peng, Z.-R.; Wang, D.; Wang, Z.; Gao, Y.; Lu, S. A study of vertical distribution patterns of PM2.5 concentrations based on ambient monitoring with unmanned aerial vehicles: A case in Hangzhou, China. Atmos. Environ. 2015, 123, 357–369. [Google Scholar] [CrossRef]
- Cichowicz, R.; Dobrzański, M. Spatial Analysis (Measurements at Heights of 10 m and 20 m above Ground Level) of the Concentrations of Particulate Matter (PM10, PM2.5, and PM1.0) and Gaseous Pollutants (H2S) on the University Campus: A Case Study. Atmosphere 2021, 12, 62. [Google Scholar] [CrossRef]
- Jumaah, H.J.; Kalantar, B.; Halin, A.A.; Mansor, S.; Ueda, N.; Jumaah, S.J. Development of UAV-Based PM2.5 Monitoring System. Drones 2021, 5, 60. [Google Scholar] [CrossRef]
- Bilyeu, L.; Bloomfield, B.; Hanlon, R.; Gonzalez-Rocha, J.; Jacquemin, S.J.; Ault, A.P.; Birbeck, J.A.; Westrick, J.A.; Foroutan, H.; Ross, S.D.; et al. Drone-based particle monitoring above two harmful algal blooms (HABs) in the USA. Environ. Sci. Atmos. 2022, 2, 1351–1363. [Google Scholar] [CrossRef]
- Yi, W.; Lo, K.; Mak, T.; Leung, K.; Leung, Y.; Meng, M. A Survey of Wireless Sensor Network Based Air Pollution Monitoring Systems. Sensors 2015, 15, 31392–31427. [Google Scholar] [CrossRef] [PubMed]
- Davies, L.; Gather, U. The Identification of Multiple Outliers. J. Am. Stat. Assoc. 1993, 88, 782–792. [Google Scholar] [CrossRef]
- Occupational Safety and Health Administration. Particulates Not Otherwise Regulated, Total and Respirable Dust (PNOR). 2021. Available online: https://www.osha.gov/chemicaldata/801 (accessed on 11 May 2023).
- Environmental Protection Agency. Timeline of Particulate Matter (PM) National Ambient Air Quality Standards (NAAQS). 2022. Available online: https://www.epa.gov/pm-pollution/timeline-particulate-matter-pm-national-ambient-air-quality-standards-naaqs (accessed on 11 May 2023).
- Guerra, S.A.; Lane, D.D.; Marotz, G.A.; Carter, R.E.; Hohl, C.M.; Baldauf, R.W. Effects of Wind Direction on Coarse and Fine Particulate Matter Concentrations in Southeast Kansas. J. Air Waste Manag. Assoc. 2006, 56, 1525–1531. [Google Scholar] [CrossRef]
- Birinci, E.; Deniz, A.; Özdemir, E.T. The relationship between PM(10) and meteorological variables in the mega city Istanbul. Environ. Monit. Assess. 2023, 195, 304. [Google Scholar] [CrossRef]
- Han, S.; Xu, J.; Yan, M.; Liu, Z. Using multiple linear regression and BP neural network to predict critical meteorological conditions of expressway bridge pavement icing. PLoS ONE 2022, 17, e0263539. [Google Scholar] [CrossRef]
- Liu, Y. Relationships of wind speed and precipitable water vapor with regional PM2.5 based on WRF-Chem model. Nat. Resour. Model. 2021, 34, e12306. [Google Scholar] [CrossRef]
- Kim, J.H. Multicollinearity and misleading statistical results. Korean J. Anesthesiol. 2019, 72, 558–569. [Google Scholar] [CrossRef]
- Cichowicz, R.; Wielgosiński, G.; Fetter, W. Effect of wind speed on the level of particulate matter PM10 concentration in atmospheric air during winter season in vicinity of large combustion plant. J. Atmos. Chem. 2020, 77, 35–48. [Google Scholar] [CrossRef]
- Kirešová, S.; Guzan, M. Determining the Correlation between Particulate Matter PM10 and Meteorological Factors. Eng 2022, 3, 343–363. [Google Scholar] [CrossRef]
- Uugwanga, M.N.; Kgabi, N.A. Dilution and dispersion of particulate matter from abandoned mine sites to nearby communities in Namibia. Heliyon 2021, 7, e06643. [Google Scholar] [CrossRef] [PubMed]


| Treatment ID * (A, B, C Stand for Replicates) | Ground Speed (m/s) | Fan Speed (rpm) |
|---|---|---|
| T1A, T1B, T1C | 1.34 | 900 |
| T2A, T2B, T2C | 1.34 | 900 |
| T3A, T3B, T3C | 2.23 | 900 |
| T4A, T4B, T4C | 2.23 | 600 |
| T5A, T5B, T5C | 1.34 | 600 |
| T6A, T6B, T6C | 1.34 | 0 (fan off) |
| Location | Row(s) | Date | Start Time (PDT) | Stop Time (PDT) | Sampling Time (min) | Replicate Code |
|---|---|---|---|---|---|---|
| Plot a | 13, 11, 12 | 24-Sep-18 | 11:42 AM, 02:05 PM, 02:10 PM | 11:48 AM, 02:09 PM, 02:15 PM | 4.2, 4.0 4.3 | T2A |
| Plot a | 4, 6, 5 | 24-Sep-18 | 03:27 PM, 03:32 PM, 03:40 PM | 03:31 PM, 03:36 PM, 03:44 PM | 4.0, 4.3, 4.0 | T3A |
| Plot a | 17, 19, 18 | 25-Sep-18 | 11:40 AM, 11:45 AM, 11:49 AM | 11:43 AM, 11:48 AM, 11:53 AM | 3.9, 4.0, 4.0 | T4A |
| Plot a | 20, 22, 21 | 25-Sep-18 | 01:23 PM, 01:30 PM, 01:43 PM | 01:27 PM, 01:34 PM, 01:47 PM | 4.2, 4.0, 4.1 | T5A |
| Plot a | 23, 25, 24 | 25-Sep-18 | 02:04 PM, 02:10 PM, 02:32 PM | 02:08 PM, 02:14 PM, 02:36 PM | 4.2, 4.0, 4.2 | T6A |
| Plot a | 26, 28, 27 | 25-Sep-18 | 3:12 PM, 3:19 PM, 3:21 PM | 3:16 PM, 3:24 PM, 3:25 PM | 4.2, 4.2, 4.1 | T1A |
| Plot a | 29, 31, 30 | 25-Sep-18 | 03:58 PM, 04:05 PM, 04:24 PM | 04:02 PM, 04:09 PM, 04:28 PM | 4.2, 4.0, 4.2 | T2B |
| Plot a | 32, 34, 33 | 26-Sep-18 | 8:45 AM, 8:50 AM, 9:01 AM | 8:48 AM, 8:53 AM 9:04 AM | 3.0, 2.9, 2.9 | T3B |
| Plot a | 35, 37, 36 | 26-Sep-18 | 09:48 AM, 9:56 AM, 10:02 AM | 9:52 AM, 10:00 AM, 10:06 AM | 4.1, 4.0, 4.2 | T5B |
| Plot a | 38, 40, 39 | 26-Sep-18 | 10:29 AM, 10:38 AM, 10:50 AM | 10:33 AM, 10:42 AM, 10:54 AM | 4.2, 4.2, 4.0 | T1B |
| Plot a | 41, 43, 42 | 26-Sep-18 | 11:14 AM, 11:19 AM, 11:24 AM | 11:17 AM, 11:22 AM, 11:27 AM | 3.0, 3.0, 2.9 | T4B |
| Plot a | 46, 45, 47 | 26-Sep-18 | 01:19 PM, 01:43 PM, 02:05 PM | 01:23 PM, 01:47 PM, 02:09 PM | 4.2, 4.2, 4.2 | T6B |
| Plot a | 50, 52, 51 | 26-Sep-18 | 03:03 PM, 03:09 PM, 03:28 PM | 03:07 PM, 03:11 PM, 03:32 PM | 4.1, 4.2, 4.2 | T1C |
| Plot a | 53, 55, 54 | 26-Sep-18 | 03:49 PM, 03:54 PM, 04:00 PM | 03:52 PM, 03:57 PM, 04:03 PM | 2.9, 3.0, 2.9 | T3C |
| Plot a | 56, 58 | 26-Sep-18 | 04:21 PM, 04:26 PM | 04:24 PM, 04:29 PM | 2.9, 3.0 | T4C |
| Plot b | 1, 3, 2 | 27-Sep-18 | 08:45 AM, 09:03 AM, 09:10 AM | 08:49 AM, 09:07 AM, 09:14 AM | 4.2, 4.1, 4.1 | T2C |
| Plot b | 4, 6, 5 | 27-Sep-18 | 09:24 AM, 09:30 AM, 09:35 AM | 09:28 AM, 09:34 AM, 09:39 AM | 4.1, 4.0, 4.1 | T6C |
| Plot b | 7, 9, 8 | 27-Sep-18 | 09:53 AM, 09:59 AM, 10:06 AM | 09:57 AM, 10:03 AM, 10:10 AM | 4.2, 4.1, 4.2 | T5C |
| Plot b | 10, 12, 11 | 27-Sep-18 | 10:43 AM, 10:53 AM, 11:07 AM | 10:46 AM, 10:56 AM, 11:10 AM | 2.9, 2.9, 2.9 | T1E * |
| Plot b | 13, 15, 14 | 27-Sep-18 | 11:23 AM, 11:33 AM, 11:45 AM | 11:27 AM, 11:37 AM, 11:49 AM | 4.2, 4.0, 4.2 | T1D * |
| TR Code | Operational Setting (Ground Speed, Fan Speed) | Aerial-Based, Mobile, Non-FRM | Method 9, Visual Opacity, Non-FRM c | Ground-Based, Stationary, FRM d | ||||
|---|---|---|---|---|---|---|---|---|
| PM2.5 | PM10 | TSP | TSP | PM2.5 | PM10 | TSP | ||
| T1 a | 1.34 m/s, 900 rpm b | — | — | — | - | - | - | - |
| T2 | 1.34 m/s, 900 rpm | 35.67 | 32.35 | 42.23 | 40.12% | 44% | 56% | 51% |
| T3 | 2.23 m/s, 900 rpm | 51.97 | 16.20 | 30.82 | 16.41% | n/a e | n/a | n/a |
| T4 | 2.23 m/s, 600 rpm | 54.45 | 33.22 | 41.59 | 57.86% | n/a | n/a | n/a |
| T5 | 1.34 m/s, 600 rpm | 30.16 | 20.75 | 28.15 | 14.99% | n/a | n/a | n/a |
| T6 | 1.34 m/s, fan off | 76.51 | 42.68 | 50.90 | 66.37% | n/a | n/a | n/a |
Disclaimer/Publisher’s Note: The statements, opinions and data contained in all publications are solely those of the individual author(s) and contributor(s) and not of MDPI and/or the editor(s). MDPI and/or the editor(s) disclaim responsibility for any injury to people or property resulting from any ideas, methods, instructions or products referred to in the content. |
© 2023 by the authors. Licensee MDPI, Basel, Switzerland. This article is an open access article distributed under the terms and conditions of the Creative Commons Attribution (CC BY) license (https://creativecommons.org/licenses/by/4.0/).
Share and Cite
Baticados, E.J.N.; Capareda, S.C. Evaluation of Almond Harvest Dust Abatement Strategies Using an Aerial Drone Particle Monitoring System. Drones 2023, 7, 519. https://doi.org/10.3390/drones7080519
Baticados EJN, Capareda SC. Evaluation of Almond Harvest Dust Abatement Strategies Using an Aerial Drone Particle Monitoring System. Drones. 2023; 7(8):519. https://doi.org/10.3390/drones7080519
Chicago/Turabian StyleBaticados, El Jirie N., and Sergio C. Capareda. 2023. "Evaluation of Almond Harvest Dust Abatement Strategies Using an Aerial Drone Particle Monitoring System" Drones 7, no. 8: 519. https://doi.org/10.3390/drones7080519
APA StyleBaticados, E. J. N., & Capareda, S. C. (2023). Evaluation of Almond Harvest Dust Abatement Strategies Using an Aerial Drone Particle Monitoring System. Drones, 7(8), 519. https://doi.org/10.3390/drones7080519


