Article

QEHLR: A Q-Learning Empowered Highly Dynamic and Latency-Aware Routing Algorithm for Flying Ad-Hoc Networks

1
Chengdu Fluid Dynamics Innovation Center, Chengdu 610031, China
2
China School of Aeronautics and Astronautics, University of Electronic Science and Technology of China, Chengdu 611731, China
3
School of Mechanical Engineering, Chongqing University of Technology, Chongqing 400054, China
4
Officers College of PAP, Chengdu 610213, China
*
Authors to whom correspondence should be addressed.
Drones 2023, 7(7), 459; https://doi.org/10.3390/drones7070459
Submission received: 29 May 2023 / Revised: 5 July 2023 / Accepted: 8 July 2023 / Published: 10 July 2023
(This article belongs to the Section Drone Communications)

Abstract

:
With the growing utilization of intelligent unmanned aerial vehicle (UAV) clusters in both military and civilian domains, the routing protocol of flying ad-hoc networks (FANETs) has promised a crucial role in facilitating cluster communication. However, the highly dynamic nature of the network topology, owing to the rapid movement and changing direction of aircraft nodes, as well as frequent accesses and exits from the network, has resulted in an increased interruption rate of FANETs links. While traditional protocols can satisfy basic network service quality (QoS) requirements in mobile ad-hoc networks (MANETs) with relatively fixed topology changes, they may fail to achieve optimal routes and consequently restrict information dissemination in FANETs with topology changes, which ultimately leads to elevated packet loss and delay. This paper undertakes an in-depth investigation of the challenges faced by current routing protocols in high dynamic topology scenarios, such as delay and packet loss. It proposes a Q-learning empowered highly dynamic, and latency-aware routing algorithm for flying ad-hoc networks (QEHLR). Traditional routing algorithms are unable to effectively route packets in highly dynamic FANETs; hence, this paper employs a Q-learning method to learn the link status in the network and effectively select routes through Q-values to avoid connection loss. Additionally, the remaining time of the link or path lifespan is incorporated into the routing protocol to construct the routing table. QEHLR can delete predicted failed links based on network status, thereby reducing packet loss caused by failed route selection. Simulations show that the enhanced algorithm significantly improves the packet transmission rate, which addresses the challenge of routing protocols’ inability to adapt to various mobility scenarios in FANETs with dynamic topology by introducing a calculation factor based on the QEHLR protocol. The experimental results indicate that the improved routing algorithm achieves superior network performance.

1. Introduction

In recent years, UAV clusters have become increasingly popular in harsh environments due to their low costs and fast response times. However, these applications face the challenge of high-quality data transmission. Flying ad-hoc networks (FANETs [1]), which are derived from traditional MANETs in Figure 1, offer advantages such as easy deployment, high mobility, self-organization, and decentralization, which make them well-suited for UAV cluster applications.
Node mobility in FANETs is typically greater than that in VANETs and MANETs [2]. The node’s speed in FANETs is highly variable, which can range from zero during aerial coverage to full flight in missions. These nodes are characterized by the ability to move randomly in three dimensions with the help of rotatory wings, which can rotate independently on three axes (roll, tilt, and yaw). In contrast, in MANETs, mobile nodes typically have low mobility (e.g., people walking at 6 km/h) and limited speed variation. In VANETs, nodes are vehicles that travel on the street with moderate speed variation (about 100 km/h on highways and 50 km/h on city roads) in a two-dimensional moving plane (horizontal plane). The random wandering movement model is more suitable for MANETs when the direction and speed of nodes are chosen randomly. When nodes move on streets or highways, the street random wandering model or Manhattan mobility model can be chosen to simulate VANETs. Table 1 shows comparisons among MANETs, VANETs, and FANETs.
Due to the three-dimensional environment in UAV ad-hoc networks, the network topology of FANETs exhibits highly dynamic characteristics, which poses significant challenges to the design of communication protocols. Therefore, it is essential to consider different mobility models to address these challenges [3]. By simulating the movement of UAVs in the network under various scenarios, mobility models provide valuable insights into the behavior of the network. These models enable researchers to design and evaluate protocols that are robust and efficient under different network conditions. Thus, considering different mobility models is crucial in designing protocols that can effectively cope with the dynamic nature of FANETs. Table 2 shows several basic mobility models and mission scenarios.
The wireless routing protocol plays a critical role in ensuring stable transmissions of data packets in the communication of FANETs. Each node simultaneously behaves as a source and a router. As the transmission path of data packets is typically composed of multi-hop routes, developing efficient and stable routing algorithms can significantly enhance network performance. However, the highly dynamic characteristics of the network topology resulting from the rapid movement of aircraft nodes in FANETs, as well as their random entries and exits from the network, can increase the interruption rate of transmission links and decrease the network quality of service (QoS). Consequently, to improve the QoS of moving ad-hoc networks, routing protocols must be comprehensively designed to exploit the unique advantages of FANETs.
Most of the existing traditional ad-hoc routing protocols are capable of meeting the basic requirements if topology changes are relatively fixed. However, in scenarios with nodes frequent entries and exits, leading to obvious topology changes, these protocols may restrict information dissemination in highly dynamic networks, ignore link stability, and easily select routes that fail to perform packet transmission. These issues weaken the protocol’s efficiency and eventually lead to increases in high packet loss rates and latency. New routing protocols based on intelligent algorithms tend to fix the mobility model, which has problems such as routing failure and computational complexity, leading to increasing in scenarios with low flight density.
Based on the above-mentioned issues, this paper focuses on the UAV ad-hoc network routing problem in highly dynamic 3D topology scenarios. The protocol designed in this paper needs to learn the network topology state adaptively, improve the stability of routing, and maintain high QoS at low complexity. Therefore, we employ a Q-learning method to learn the link status in the network and effectively select routes through Q-values to avoid connection loss. Additionally, the remaining time of the link or path lifespan is incorporated into the routing protocol to improve the routing table. QEHLR can delete predicted failed links based on network status, thereby reducing packet loss caused by failed route selection and improving link stability. This paper demonstrates that the enhanced algorithm significantly improves the packet transmission rate. It addresses the challenge of routing protocols’ inability to adapt various mobility scenarios in FANETs with dynamic topology by introducing a calculation factor based on the QEHLR protocol. Experimental results indicate that the improved routing algorithm achieves superior network performance.

1.1. Contribution of This Study

(1)
A Q-learning empowered highly dynamic and latency-aware routing algorithm for ad-hoc networks (QEHLR) is proposed, which combines Q-learning with end-to-end delay improvement to address the issue of ineffective packet routing in highly dynamic FANETs using traditional routing algorithms. The method of Q-learning is used to learn the link status in the network, and effective routing is selected through Q-value to avoid connection loss. The remaining time of the link, or the path lifespan, is included in the routing criteria to maintain the routing table. QEHLR can delete estimated failed links according to the network status, reducing packet loss caused by failed routing selection. Routing experiments designed in this paper show a significant improvement in the packet transmission rate of the improved algorithm.
(2)
A routing method based on topology change degree improvement is proposed to address the problem, where routing protocols cannot adapt to various mobile model task scenarios in FANET with high dynamic topology due to the diversification of task scenarios and the variability of tasks. The calculation factor for network topology change degree is introduced on the basis of the QEHLR protocol. The experimental results show that the improved routing algorithm can achieve a higher packet transmission rate and a lower delay.

1.2. Organization of This Article

The structure of this paper is as follows: Section 2 shows related works of the FANETs routing protocol. Section 3 introduces the modeling methodology for the communication structure of FANETs and reinforcement learning. Section 4 establishes the proposed multi-hop routing protocol for FANETs. Section 5 parametrically analyzes the protocol’s performance in the NS-3 simulation environment. The last section concludes this paper.

2. Related Works

Most of the ad-hoc routing protocols are developed for MANETs, whereas the FANETs protocol can be obtained by directly modifying MANETs routing protocols. References [4,5,6,7,8] have detailed analyses of current trends, challenges, and future prospects of routing protocols in FANETs. Generally speaking, traditional ad-hoc routing protocols fall into the following categories:
(1) Reactive routing protocols
In reactive routing protocols, routing information is created on demand, and the route discovery process executes when a transmission requirement is established. The main benefit of this approach is low costs in the case of low traffic, but it takes a long time to re-establish a new route in the case of failed routing packets. The typical protocols have Dynamic Source Routing (DSR) [9] and ad-hoc on Demand Distance Vector (AODV) [10]. The route request and reply processes are round trips, where all intermediate nodes of the route store the routing information in a particular format. Such routing protocols minimize overhead. The main disadvantage is that it takes a long time to find a route, causing congestion in the network.
(2) Proactive routing protocol
In proactive routing protocols, nodes periodically update and share routing tables; therefore, available routing information exists between each pair of nodes in the network. Typical routing protocols in this category mainly include Destination Sequenced Distance Vector (DSDV) [11]. This algorithm is a simple and loop-free table-driven routing algorithm. Each node maintains the IP address of the next hop, and the hop counts to all possible destinations. Its disadvantage is that updating the node’s routing table involves a lot of overhead, which is unsuitable for highly dynamic UAV network topologies. Optimized Link State Routing (OLSR) [12] is another typical proactive protocol. In this routing algorithm, each node obtains network topology information by using topology control (T.C.) information, named hello information. The original OSLR does not consider link quality, which may lead to suboptimal routing. Directional Optimized Link State Routing (DOLSR) [13] modifies OLSR by using directional antennas to minimize the number of multi-hop relays. Specifically, the UAV tests the distance of each packet to the destination. If the distance exceeds half of the maximum distance, which can be achieved through the use of directional antennas, the node adopts the DOLSR mechanism. On the other hand, if the distance is less than half of the maximum distance, the original OLSR of the omnidirectional antenna is used. This method reduces end-to-end delays; however, the large overhead generated by DOLSR is unsuitable for the rapidly changing UAV network.
(3) Hybrid routing protocol
The hybrid routing protocol combines proactive and reactive routing protocols, which allows the protocol to adjust routing modes according to real-time network conditions. Initially, a proactive protocol determines the route; meanwhile, a reactive routing protocol starts when broken routes are identified or a large number of network topologies change. Zone Routing Protocol (ZRP) [14] is a typical hybrid routing protocol containing the concept of a zone using the reactive method, which reduces the processing time and overhead of the route discovery mechanism. However, ZRP cannot easily maintain node and link information in highly dynamic UAV networks. The Temporarily Ordered Routing Algorithm (TORA) [15] is a routing protocol used in multi-hop networks where the router maintains only the information of adjacent nodes. However, it limits the dissemination of information in highly dynamic networks and weakens the efficiency of the protocol itself in UAV networks.
(4) AI-based routing protocol
Rovira-Sugranes et.al. [16] reviewed some AI applications in the overall domain of FANETs. The routing protocol based on machine learning focuses more on learning the whole network state than the traditional protocol; therefore, it is more suitable for dynamic FANETs. The optimal routing path selection is realized by using the learning ability of a machine learning algorithm based on an accurate perception of network topology, channel state, user behavior, and traffic mobility. These algorithms can better satisfy the service quality requirements of dynamic UAV networks. Liu proposed a Q-learning based multi-objective optimal routing algorithm, QMR [17], based on three routing protocols, QGrid [18], QLAR [19], and QGeo [20], which optimizes both end-to-end delay and energy consumption metrics. QMR obtains geolocation data through GPS and establishes the route exploration process by sending Hello packets. Based on QMR, a protocol [21] was also proposed. Yang proposed a multi-objective Q-learning routing protocol based on fuzzy logic [22], which considers metrics such as transmission power and hop count. This protocol uses fuzzy logic to identify reliable data links and Q-learning to calculate the payoff value given to the path. Similarly, the fuzzy logic routing protocol proposed by He [23] considers factors such as time delay, network stability, and bandwidth efficiency. Cedrik proposed the PARRoT [24] routing protocol, which is based on Benjamin’s B.A.T. Mobile [25] protocol. The learning rate of the protocol is fixed, while the discount factor is calculated based on the link failure time and the degree of aggregation of neighboring nodes. The packet delivery rate of the protocol is superior to that of B.A.T. Mobile and B.A.T.M.A.N. [26], but it faces significant computational complexity, and the actual protocol running time will increase sharply with the increase in the number of nodes. Rovira et al. utilized fuzzy logic [27] to determine neighboring nodes in real-time and designed a reinforcement learning-based future reward method that reduces the average hop count through continuous training. Compared with the Ant Colony Optimization (ACO) algorithm, this algorithm has a lower average hop count and higher link connectivity. Liu also proposed a protocol named AR-GAL [28] that selects the route with the minimum end-to-end delay based on the continuous network conditions of FANETs. The protocol formulates the routing decision process as a Markov Decision Process (MDP) and designs a new MDP state composed of the current node state and the neighbor environment state. Table 3 summarizes the main contributions and problems of the above protocols.

3. Modeling Analysis

3.1. FANETs Communication Structure

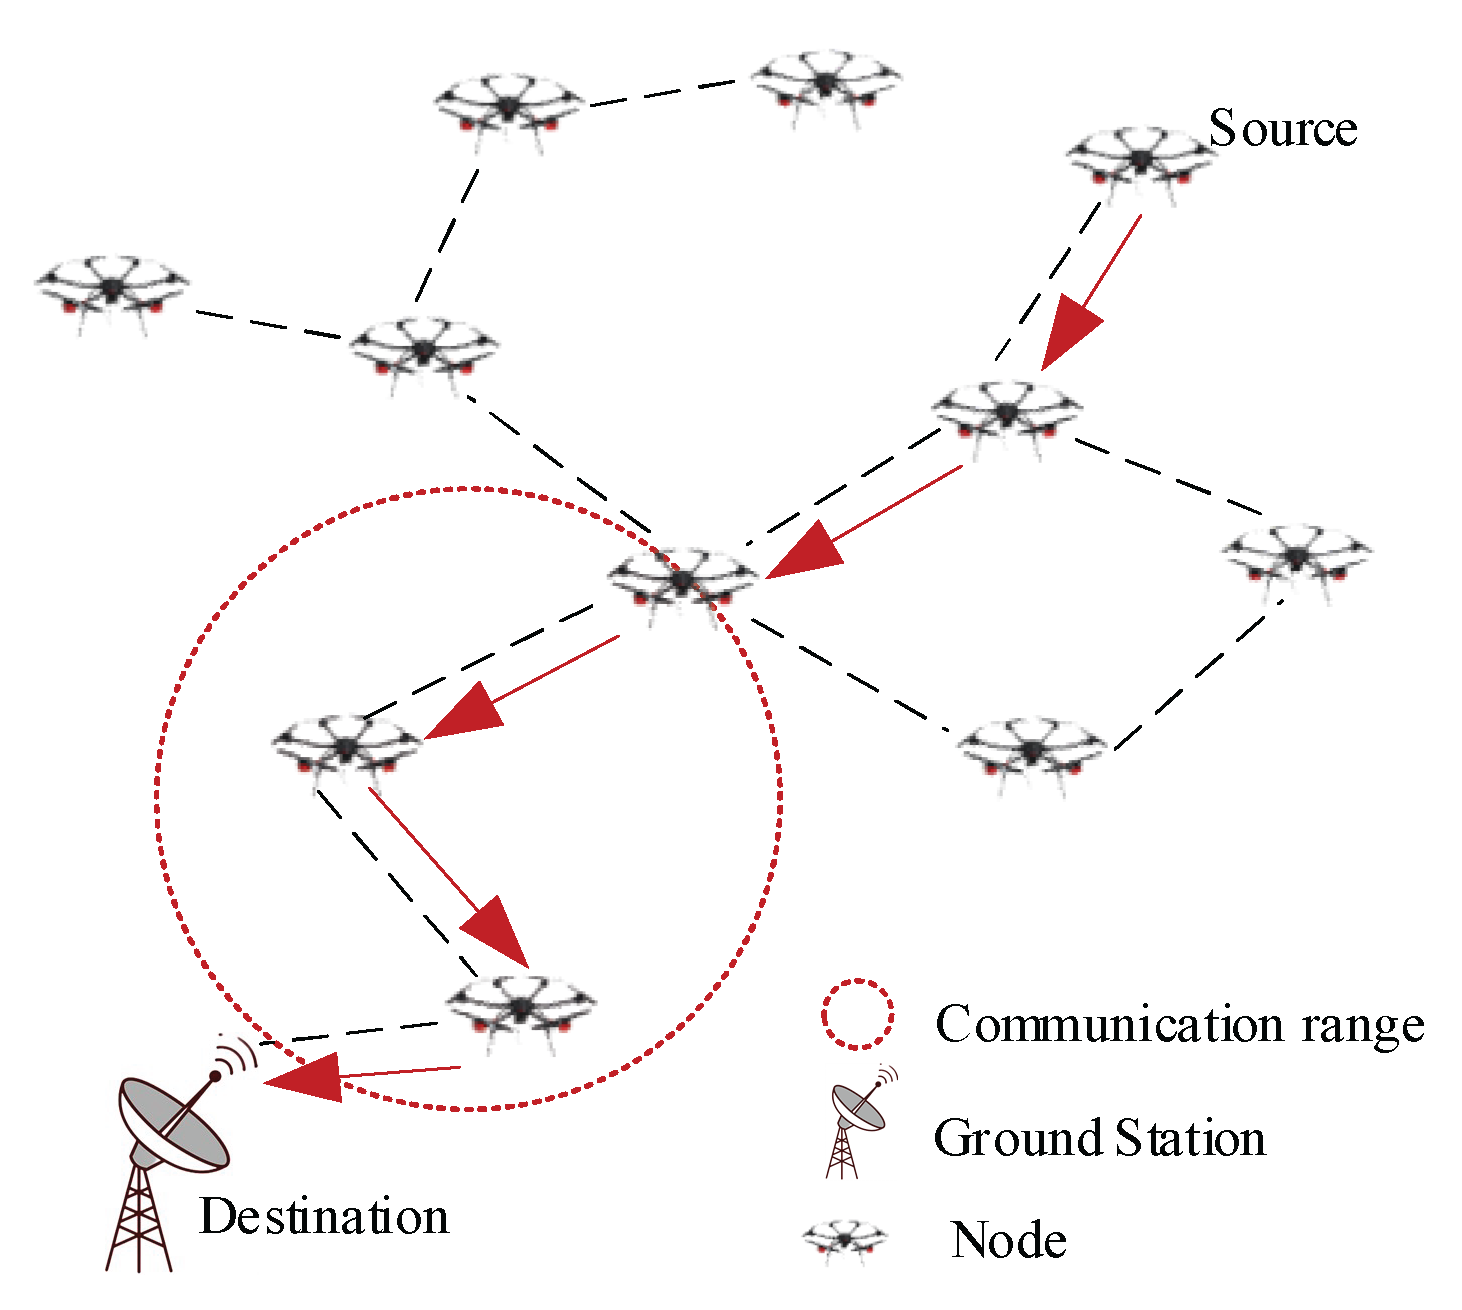
Figure 2 illustrates a typical example of a UAV ad-hoc network structure, which encompasses several common application scenarios for FANETs. In this network, each UAV serves as a node, with the ground station acting as the destination node. If a drone transmits a signal from the starting node (labeled “source” in Figure 2) to the ground station, other drones in motion act as relay nodes to forward the signal until it reaches the ground station, labeled by a red arrow in Figure 2. Communication is limited to nodes within the communication range. The primary challenge is to determine the optimal path for transmitting the signal to the destination without data loss while also optimizing the end-to-end delay.

3.2. Reinforcement Learning

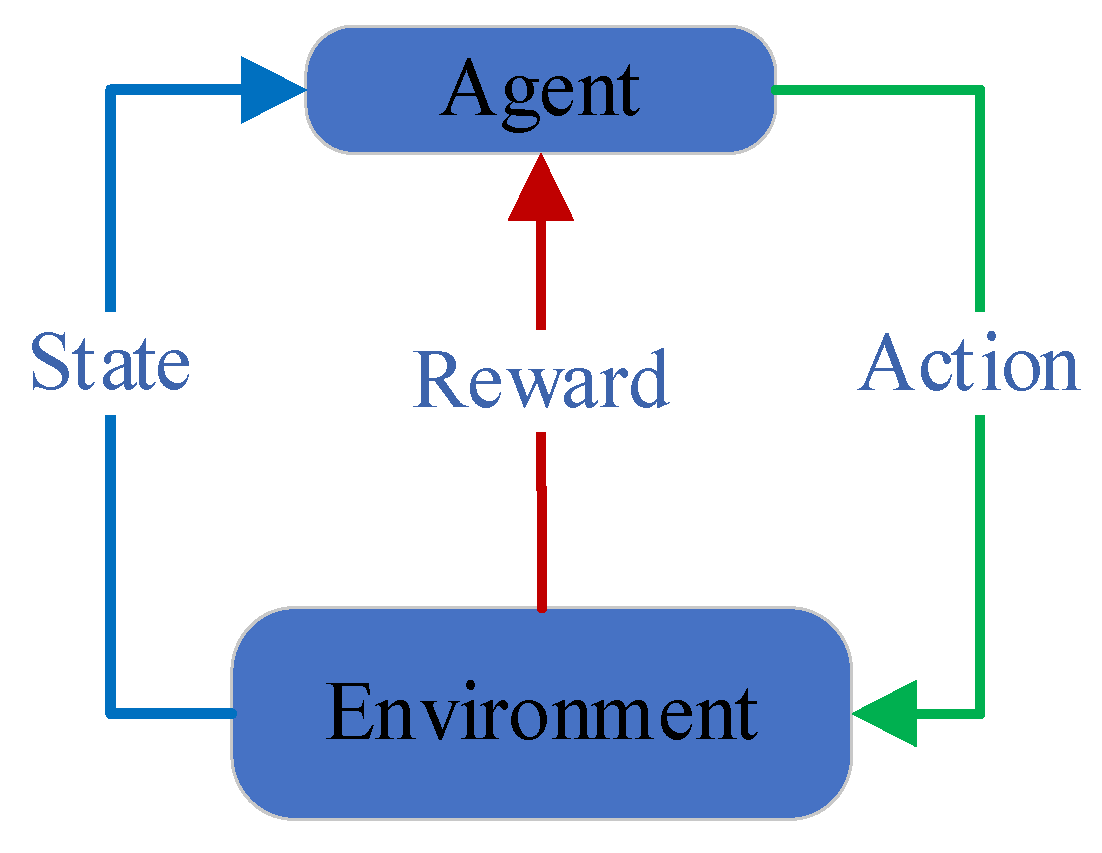
Reinforcement learning [29] is an unsupervised artificial intelligence approach that enables agents to observe and comprehend their environment without external guidance and subsequently determine optimal or near-optimal action selection to achieve optimal system performance. Figure 3 illustrates a simplified reinforcement learning process.
If an agent’s action in a given state results in a positive reward, the agent’s inclination to adopt this action in the future will be strengthened. Conversely, if the action leads to a negative reward, the agent’s inclination to adopt the action will be weakened. Since the agent does not have prior knowledge of which action is most beneficial to achieve the goal, it must actively test the environment. The environment will respond to the agent’s actions and provide feedback. Based on this feedback, the agent modifies its action strategy to adapt to the environment and then sends out probes to obtain new feedback, thus further optimizing its behavior to achieve the ultimate goal.
The Q-learning algorithm is a reinforcement learning technique that enables an agent to identify the optimal path to a target node with the highest return value. This is achieved by periodically updating the state activity value (Q-value) at different states. The algorithm is an unsupervised active learning approach that does not require a specific system model and can be adapted to different environments through real-time interactions.
Unlike other methods, Q-learning does not require the estimation of the environment model or the evaluation of intermediate costs. Instead, it directly optimizes an iteratively calculated Q-function. The Q-value is the result of long-term learning, which summarizes all the required information and stores it in a two-dimensional table in terms of state and action. When a decision is needed, the agent selects the action that can obtain the maximum benefit according to the Q-value, thus conducting a straightforward and efficient decision-making process. The core idea of the algorithm is to continuously update the Q-value. The state-action pair (s, a) at time t is denoted by (s, a, t), where s represents the state and a represents the action taken in the state. The Q-value for a state-action pair (s, a) is obtained by applying an action a in the state s, where a and s are bounded within the range [0, 1]. Upon performing an action in the state, the agent transitions to a new state s’ and receives a cumulative reward value denoted by max a Q ( s , a ) for performing the best action at this time. The Q-learning algorithm comprises the following steps:
Step 1: For each s and a , initialize Q ( s , a ) to 0;
Step 2: Select an action a according to the Q table and execute it;
Step 3: Get rewards and observe the new state s ;
Step 4: Update Q ( s , a ) based on rewards and Q ( s , a ) ;
Step 5: Set the new state s to the current state s ;
Step 6: Return to Step 1 to continue execution.

4. QEHLR Routing Protocol

As depicted in Figure 4, the protocol is segmented into routing establishment, routing maintenance, and routing decision. The routing establishment is responsible for establishing the network topology by periodically transmitting Hello packets (Protocol Data Units, or PDUs). Additionally, it is responsible for creating and maintaining the routing and neighbor tables for each node. The routing maintenance is primarily utilized to predict the link failure time, which is used to delete failed routes from the routing table, which is shown by cross marks in Figure 4. Finally, the routing decision is used to query the routing table for each outbound packet and determine the optimal transmission route, denoted by red arrows in Figure 4.
The establishment and maintenance of routing are integral processes throughout the entire protocol operation. They provide and sustain multiple real-time optional routes for each node. When transmitting data packets, the routing decision selects the most stable one-hop link for transmission based on the node’s routing table.
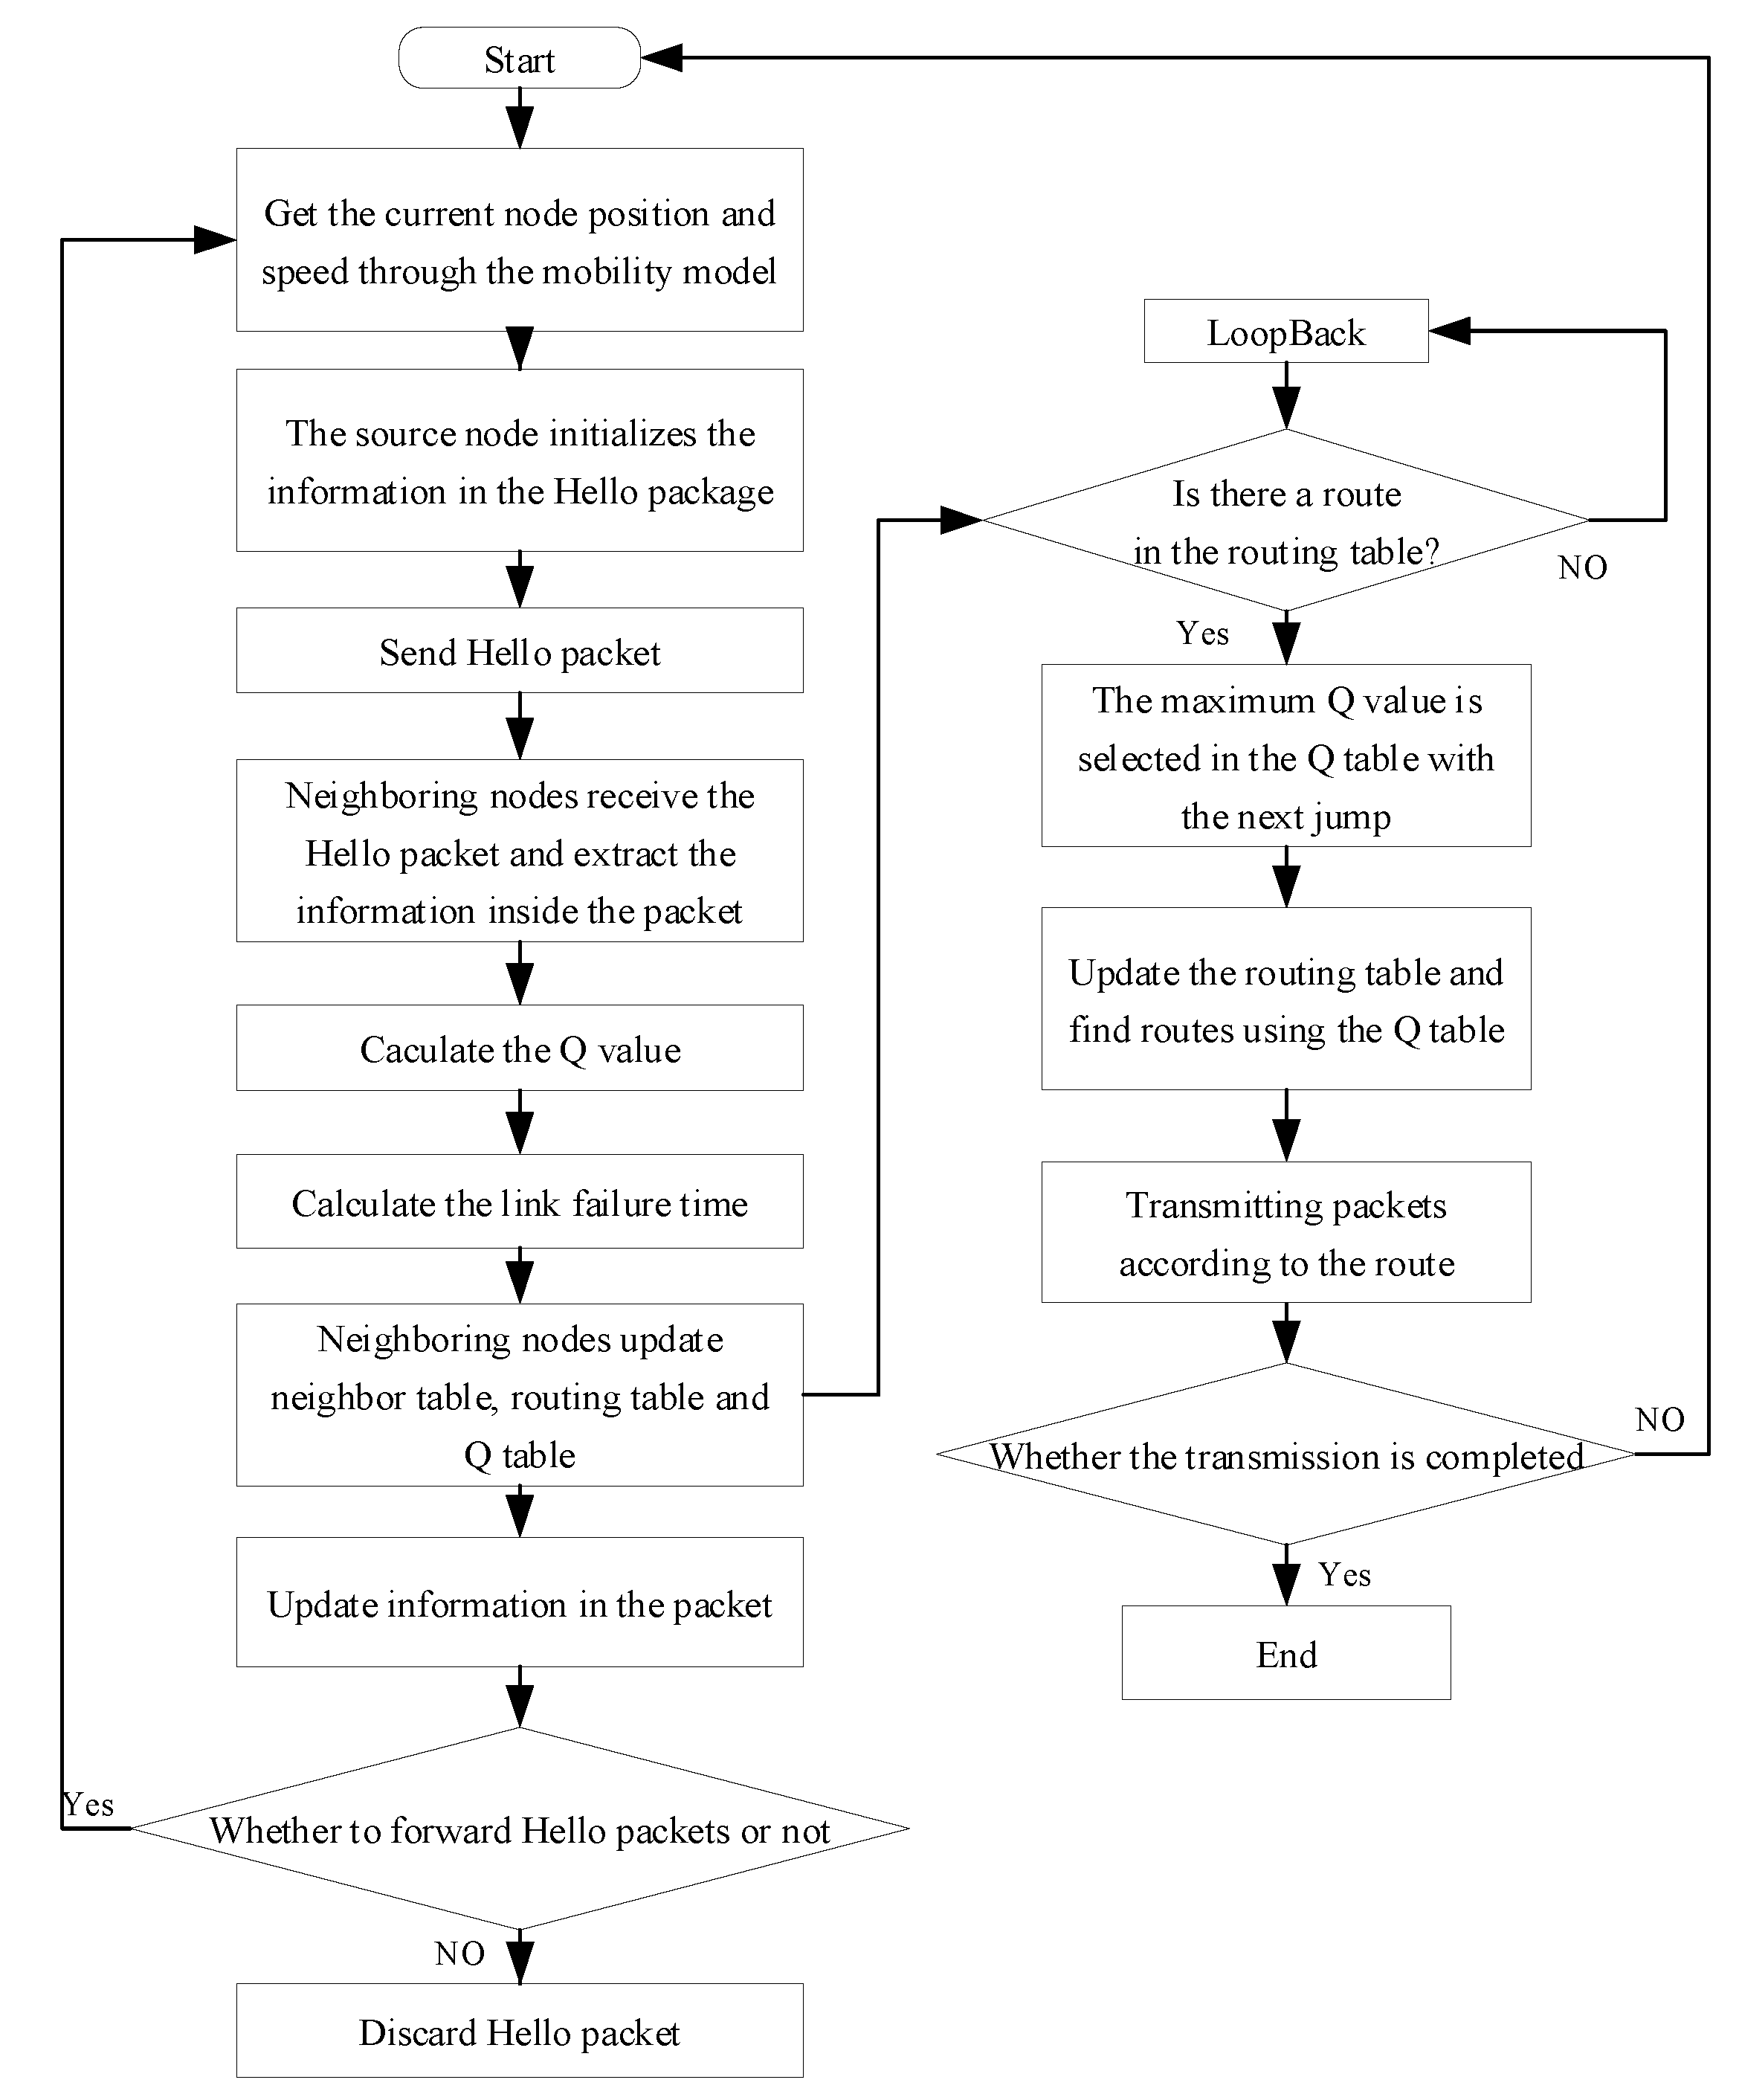
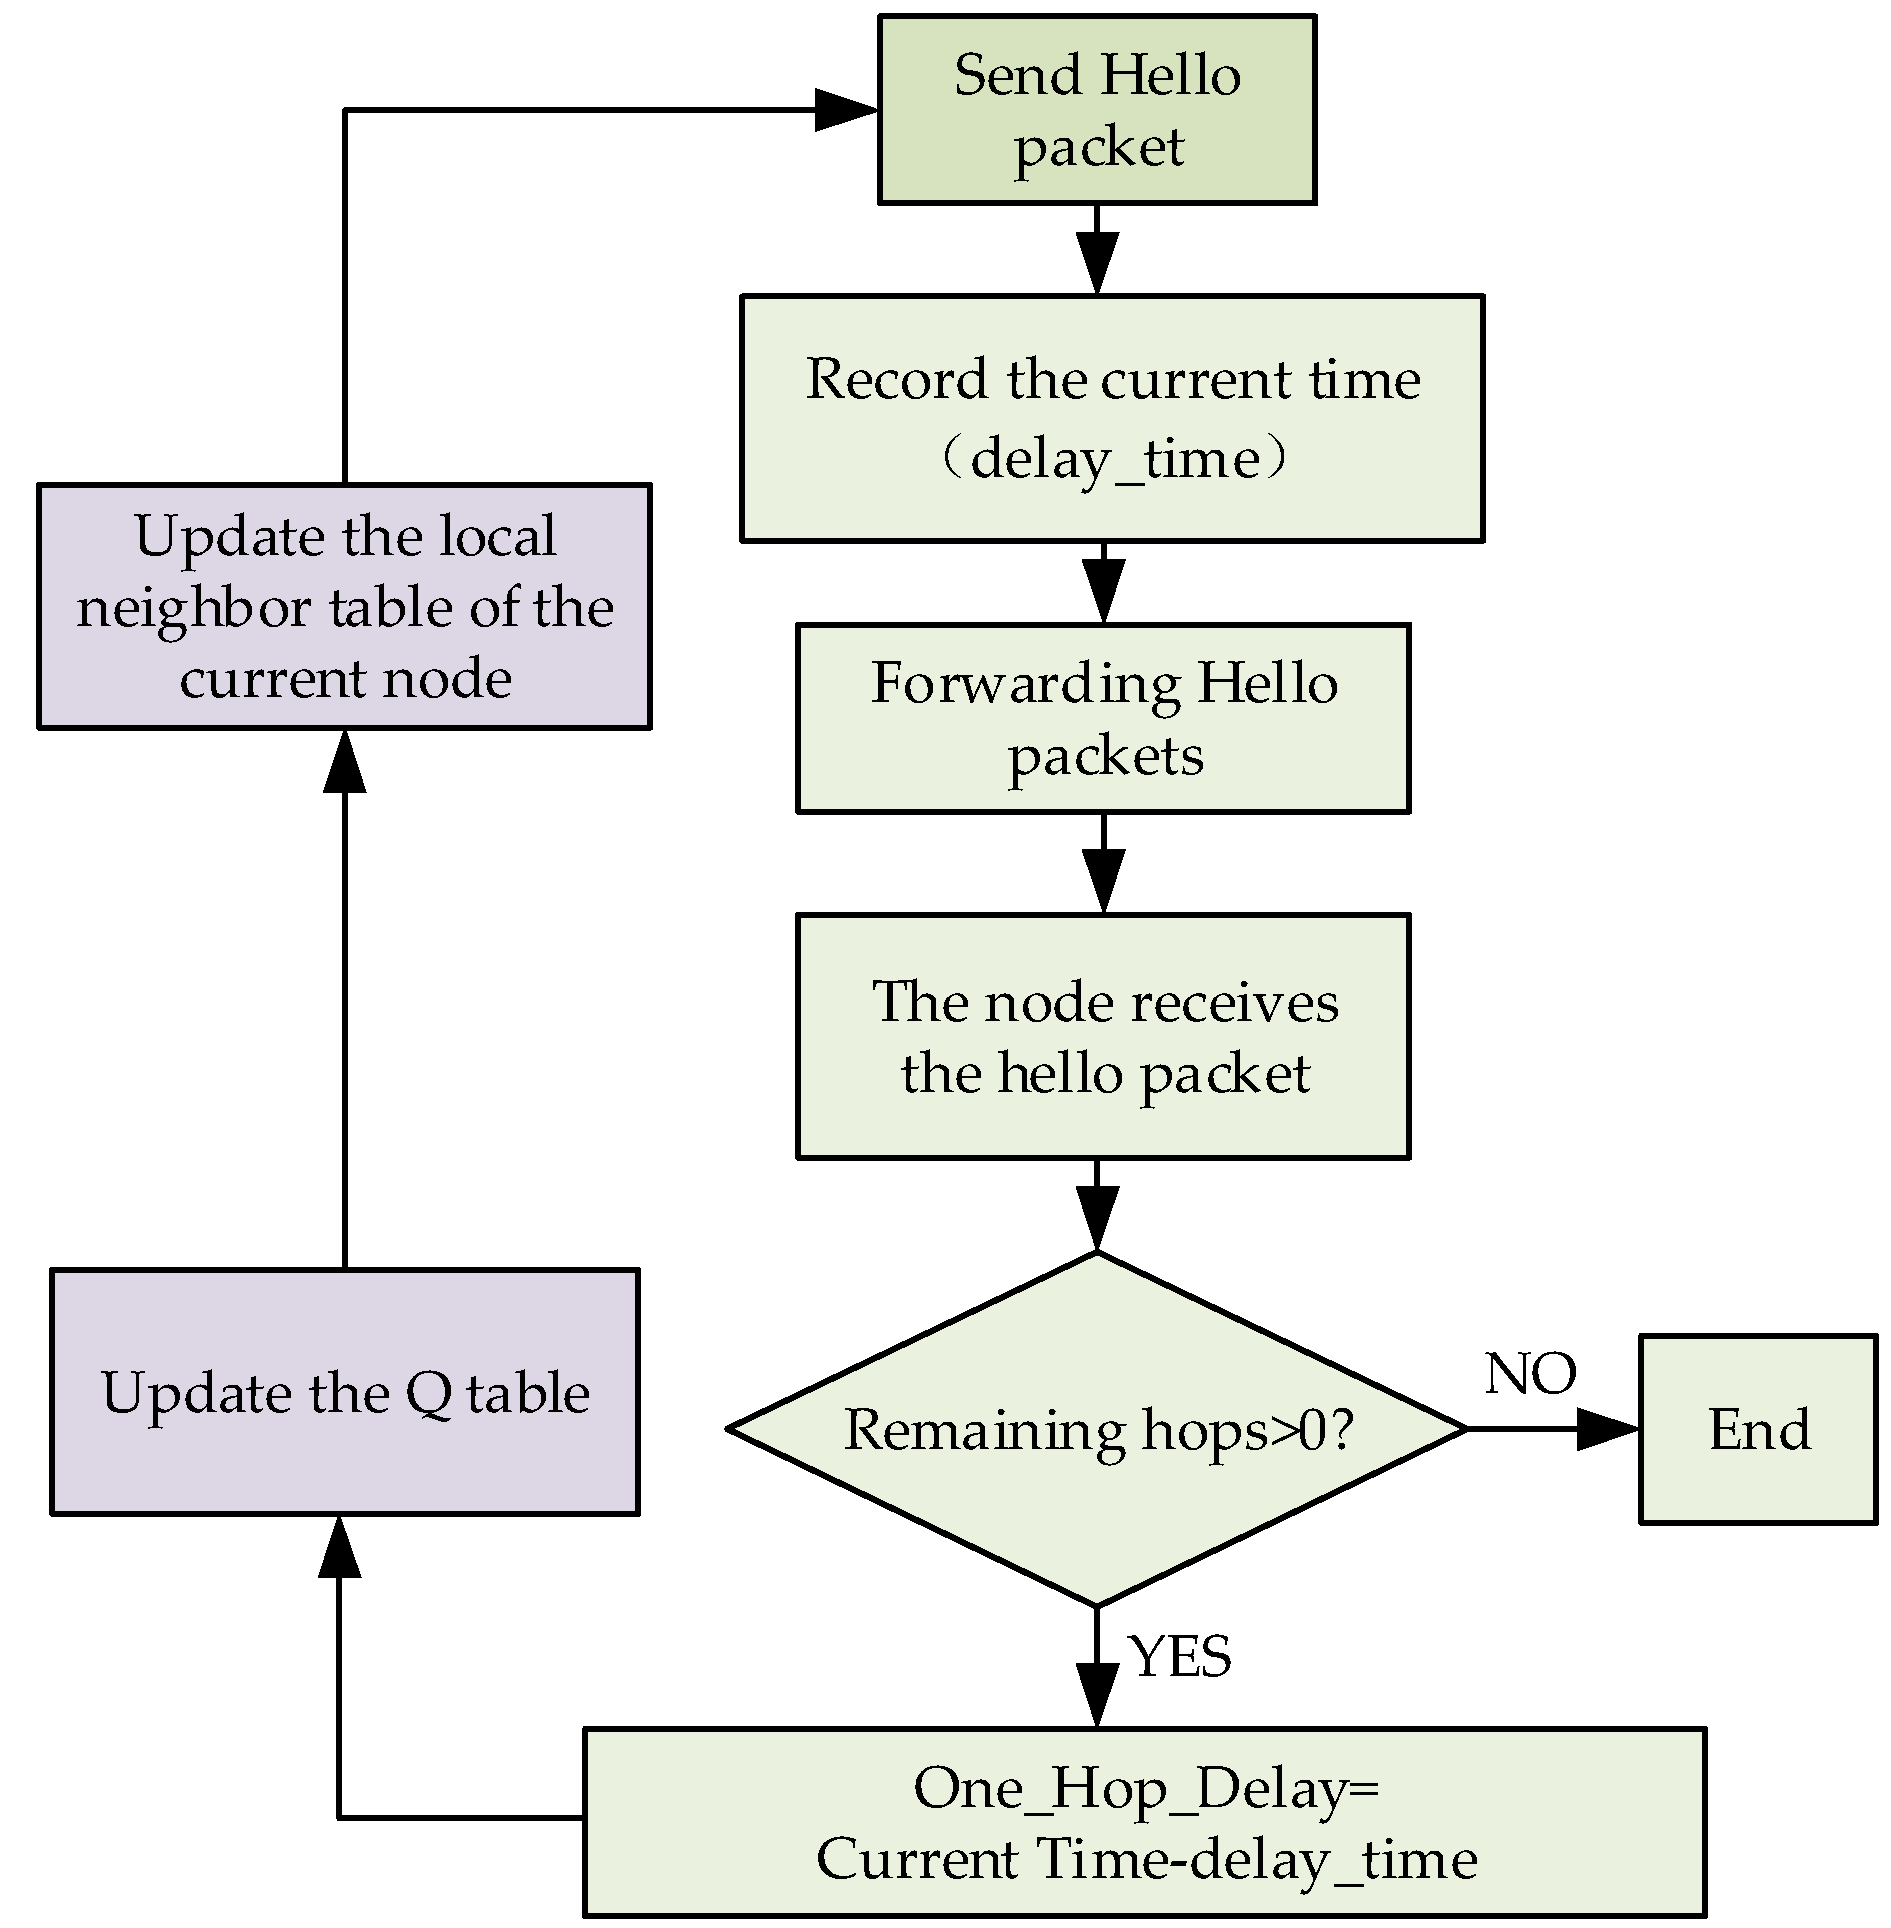
This protocol is a proactive one based on Q-learning. The route updating mechanism is suitable for ad-hoc wireless networks in dynamic network topologies or unreliable communication environments. The port for transmitting data packets differs from the port for transmitting Hello packets. To simulate the packet-sending process, this paper utilizes the Discard port (RFC863) and UDP port 9. Figure 5 depicts the flowchart of the entire protocol.

4.1. Routing Establishment

The routing establishment employs periodic flooding of Hello packets to construct and maintain the routing table. Each node periodically transmits and receives Hello packets from neighboring nodes, utilizing the contained information to establish the reverse link and continuously update the routing table and Q-table. The Q-learning algorithm is utilized in this protocol to calculate the Q-value and assess link stability. Each node transmits Hello packets containing routing information for route discovery and receives Hello packets from other nodes. The Q-value is then calculated based on the information extracted from these packets, and the corresponding nodes are added to the neighbor table and routing table.
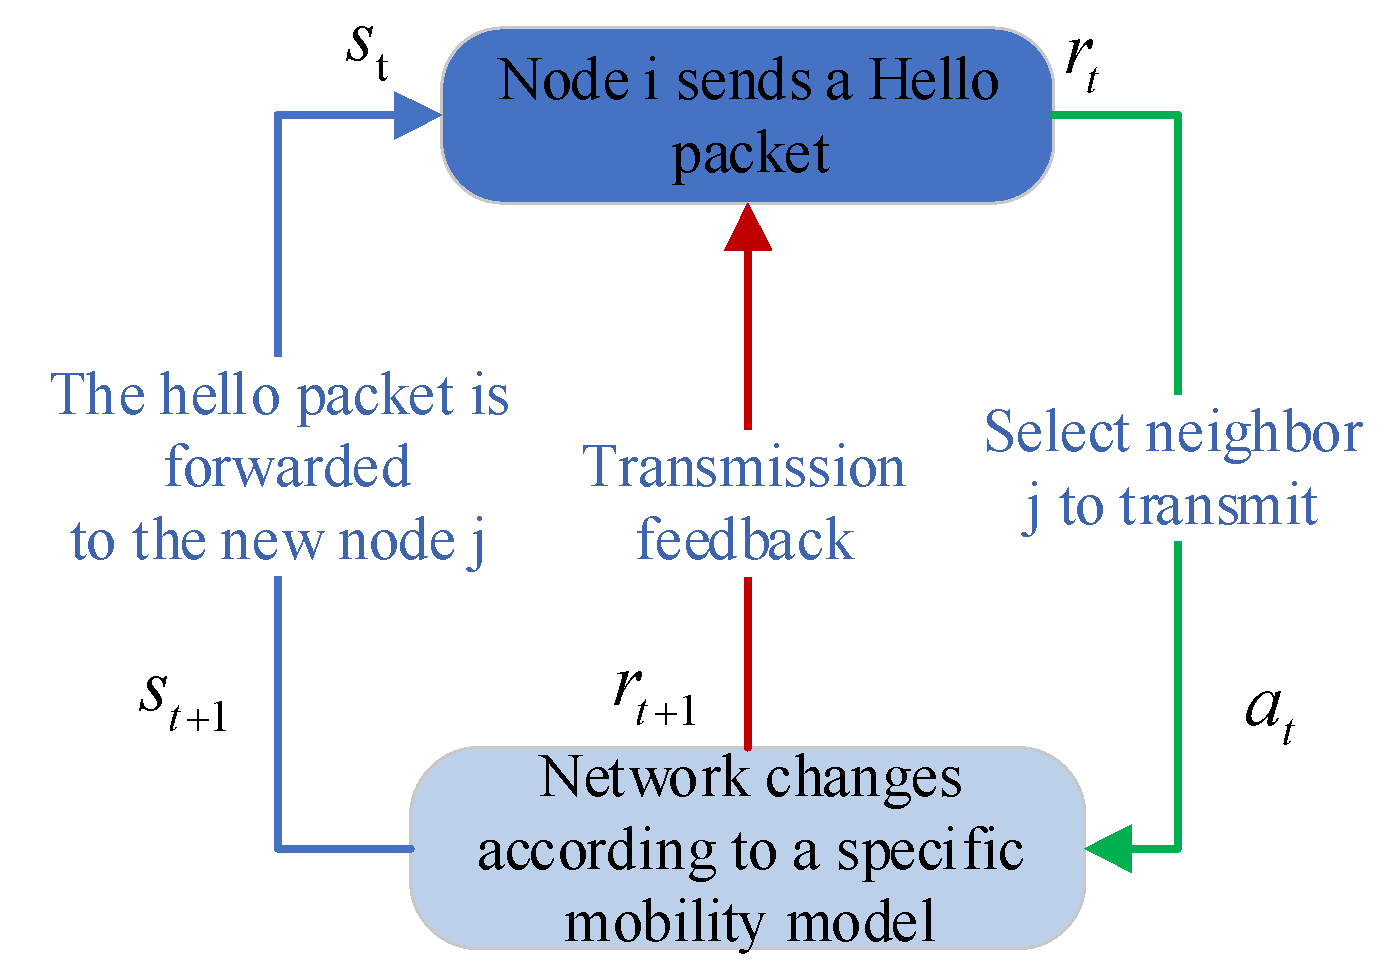
In the Q-model of this protocol, nodes initialize the Q-value to 1 and include it in the Hello message for transmission. The agent is the node that transmits the Hello packet in the network, and the action represents the selection of the neighbor to transmit the current Hello packet. The new state is the forwarding of the Hello packet to the neighboring node. As depicted in Figure 6, the Hello packet was just forwarded to node i from source d, and at this time, neighbor node j is selected for transmission.
The Hello packet is forwarded to node j, and the transmission feedback value is calculated based on the current network condition. The new feedback value is then utilized to compute the new Q value, using the Q value contained within the Hello message and the maximum Q value present in the Q table of node j. The updated Q value is subsequently employed to update the Hello message and disseminate it to other nodes in the network. This propagation process d i j k . involves the use of the Q value as a coefficient of reverse routing, which measures the suitability of node j to transmit data through the next hop i and the suitability of node k to receive data through node j. Equation (1) represents the formula for calculating the Q value during the route establishment process.
Q d ( i , j ) = ( 1 α ) Q d ( i , j ) + α ( r e w a r d ( i , j ) + γ × max Q d ( i , j ) ) ,
where Q d ( i , j ) is the reverse weight of node i choosing node j to transmit hello packets, which is the weight of j reaching source node d through i. The current reward obtained by node i when it selects node j for transmission, is denoted as r e w a r d ( i , j ) . The maximum Q value that can be achieved by the source node d through node i is denoted as max Q d ( i , j ) . The parameter γ is used to determine the relative ratio of delayed returns to immediate returns, with larger values indicating the higher importance of delayed returns. Specifically, γ is given by Equation (2)
γ = γ 0 × M F i × ε i , j ,
with the presence of node mobility M F i and the delay factor ε i , j provided by Equations (3) and (4),
M F i = 1 | ( N i ( t ) N i ( t Δ t ) ¯ ) ( N i ( t ) ¯ N i ( t Δ t ) ) | | N i ( t ) N i ( t Δ t ) | 0 , o t h e r w i s e , N i ( t ) N i ( t Δ t )
ε i , j = e d e l a y _ o n e h o p i , j .
The mobility of neighboring nodes M F i is utilized as a metric to quantify the change in node aggregation around node i over a given time period Δ t , thereby measuring the link stability factor around node i. The current neighbor set of node i is denoted as N i , while N i ( t Δ t ) represents the neighbor set of node i before time Δ t . The change in the neighbor set of nodes i after a period of time can be measured by performing corresponding calculations for these two sets of neighbor nodes. A relatively large value of M F i indicates that the current neighbor set of this node does not change frequently, thus implying that the neighbor set of nodes i is relatively fixed.
In Equation (4), d e l a y _ o n e h o p i , j represents the one-hop delay from node i to node j, which can be calculated as shown in Figure 7.
The reward function in Equation (5) can be derived by:
r e w a r d ( i , j ) = r max , j = des   or   dest N j   δ × N E R j + ( 1 δ ) × P D R i , o t h e r w i s e
In this protocol, the reward value is set to r max if the destination node of the data packet exists in the neighbor set of the next state after the Hello packet is forwarded, or if the next hop is the destination node of the packet. δ is a constant and N E R j is the number of new neighbor nodes that node j encounters per unit of time.
The routing metric in the reward is weighted by the contrasting values of the total number of packets lost by node i and the total number of packets sent by node i, denoted as P D R i .

4.2. Routing Maintenance

Routing maintenance serves as a crucial component in ensuring link stability by calculating link failure time and performing timely deletion operations of failed links in both the routing table and Q-table. Routing maintenance supplements the route establishment, enabling the routing decision to identify the most suitable and stable link for outbound packet transmission based on the route entries in the routing table. The Friis free loss model [30] is employed to simulate this protocol, allowing for the inference of the effective communication range based on this model.
P r = P t G t G r λ 2 ( 4 π d ) 2 L ,
In the following equation, P t represents the transmission power, P r denotes the receiving power, G t and G r are the antenna transmission and receiving gains, respectively. λ represents the wavelength ( λ = c / f , where c is the speed of light and f is the frequency), d is the communication radius, and L is the system loss factor. Specifically, the communication radius can be obtained using the following Equation (7):
d = 1 L P t G t G r P r ( c 4 π f ) 2 1 2
Upon receiving a hello packet from node j, node i can calculate the failure time of the link between them based on the location information provided in the hello message. If the time difference between the current time T i m e n o w and the last time on receiving the hello packet T i m e l a s t _ s e n t exceeds the minimum link failure time T i m e L i n k E x p i r y and packet interval value as defined in Equation (8), the link is deemed to be in an unstable state. As a result, the neighboring node is removed from both the current node’s neighbor table and Q table to ensure the stability of the final dynamic routing decision.
T i m e n o w T i m e l a s t _ s e n t > min ( T i m e L i n k E x p i r y , h e l l o int e r v a l )
The position of node i and node j can be represented by p i = ( x i , y i , z i ) and p j = ( x j , y j , z j ) with Δ p = p i p j representing the position change in two nodes, Δ v = v i v j being the speed change of two nodes, the following Equation (9) can represent the position change Δ p t o t a l between i and j,
Δ p t o t a l = p i p j + t × Δ v ,
where t is the link failure time between two nodes. Moreover, the communication distance between the two points is d. (Equations (7) and (10) have the same d)
d = | Δ p t o t a l |
The link failure time can be deduced as follows:
t = c ± c 2 a b a ,
where a, b, and c are:
a = | Δ v | 2
b = | Δ p | 2 d 2
c = k { x , y , z } Δ p k × Δ v k
If the two values of t in Equation (11) exhibit negative values, as depicted in Status 3 in Figure 8, or if both values are positive, as illustrated in Status 1, it indicates that the connection between i and j may have been valid in the past or may be valid in the future, but is presently disabled and the T i m e L i n k E x p i r y is set to 0. In Status 2, the failure time of the current link ( T i m e L i n k E x p i r y ) is set to the positive t in Equation (11).
The concept of node topology change degree, as introduced in [31], is a novel movement characteristic that integrates the relative position, relative movement direction, and relative rate of node movement to quantify the topology change between nodes.
At moment t, the position coordinates of node i are denoted as l o c a t i o n i t = ( x i t , y i t , z i t ) , while the position coordinates of node j are denoted as l o c a t i o n j t = ( x j t , y j t , z j t ) . The velocity vector of node i at moment t is represented by v i t , and that of node j by v j t . The rate of node i at moment t is indicated by v i t , and that of node j by v j t . The distance between node i and node j at moment t is expressed as d i , j t = ( x j t x i t ) 2 + ( y j t y i t ) 2 + ( z j t z i t ) 2 . The angle of the direction of motion between nodes i and j is then denoted by θ i , j t = arccos v i t v j t / v i t v j t . Finally, the relative rate of motion between nodes i and j at time t is denoted as r e l v i , j t = v j t v i t .
(1) Degree of Distance Change
The degree of distance change between node i and node j is denoted as D i s _ var i , which represents the difference in distance between the two nodes at time t + T compared to the distance at time t, taking into account the amount of change that occurred during this time interval. The amount of change in distance between the two nodes after T is denoted as d i , j t + T d i , j t and is calculated using Equation (15).
D i s _ var i = d i , j t + T d i , j t d i , j t
(2) Degree of Directional Change
The degree of directional change between node i and node j is D i s _ var i . This parameter reflects the degree of change in the direction of motion of the two nodes in time T and is calculated in Equation (16).
D i r _ var i = θ i , j t + T θ i , j t θ i , j t
(3) Degree of Relative Rate Change
The degree of relative rate change between the two nodes is represented by V e l o _ var i , which is defined as the ratio of the relative rate of the two nodes at time t + T to that at time t. This parameter captures the variation in the rate of the two nodes over the time period T, as expressed in Equation (17).
V e l o _ var i = r e l v i , j t + T r e l v i , j t r e l v i , j t
degree of topology change in two nodes is the topology change of two adjacent neighbors, i and j after experiencing time T. See the following Equation (18).
T C D i , j ( t , t + T ) = w 1 D i s _ var i + w 2 D i r _ var i + w 3 V e l o _ var i
The parameter T C D i , j ( t , t + T ) is defined as a linear combination of the three aforementioned degrees of variation. The coefficients w1, w2, and w3 are weight coefficients in the equation, and their values range from 0 to 1. These coefficients can be set based on the relative importance of the three factors in the topological change. In this paper, we assume that the three factors have equal importance and therefore set w1 = w2 = w3.
The speed variation, distance variation, and direction variation between nodes can be used to evaluate the network topology change. However, the mobility of neighboring nodes, represented by M F i , is an important factor in measuring the degree of node network topology. It is worth noting that M F i alone may not be sufficient to completely evaluate the node network state. Therefore, a calculation factor that combines the above factors can be designed to assess the degree of node topology change.
Once the node topology parameter T C D i , j has been calculated using the formula in Equation (18), it is incorporated into the discount factor used for Q-value calculation during route establishment, as shown in Equation (19).
γ T C D = γ 0 × 1 1 + e T C D i , j ( t , t + T ) × ε i , j
Subsequently, three metrics in the current node neighbor table are updated: d i , j t , θ i , j t and r e l v i , j t . The effectiveness of various discount factors proposed in this paper is compared and analyzed in the performance test of the routing protocol.

4.3. Routing Decision

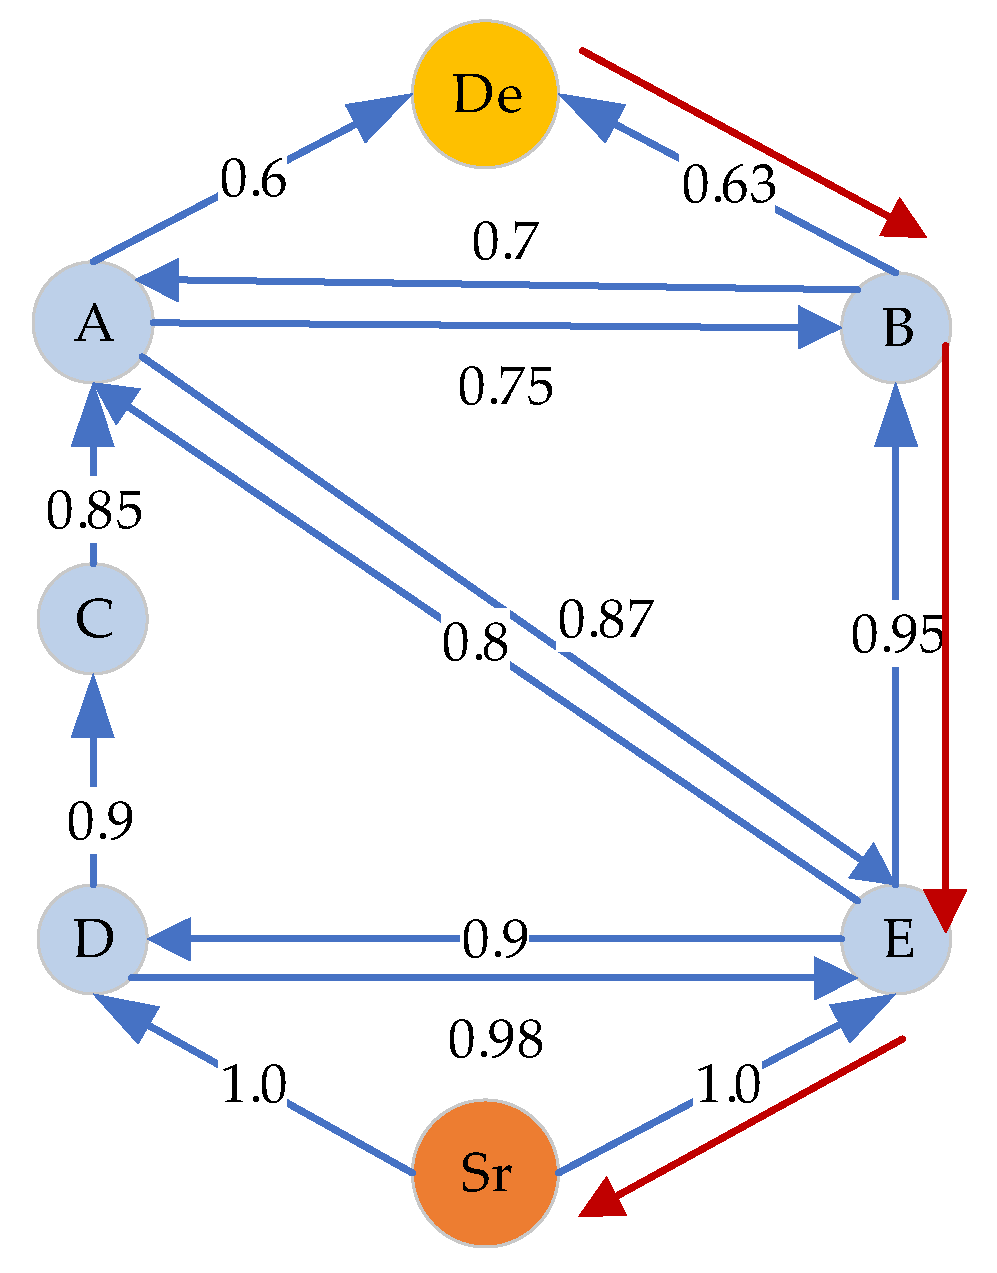
The following provides an illustrative example of a 7-node moving ad-hoc network to demonstrate the routing decision process. Figure 9 depicts a simplified illustration of the source node Sr propagating Hello packets.
Assuming that the source node Sr initiates the transmission of Hello packets to the destination node De, the Q-value is initialized to 1.0 at this stage. Upon receiving the Hello packets, the intermediate node establishes a reverse route based on the information contained in the message. The routing table is then updated, and the Q-value is calculated and added to the Hello message to facilitate multi-hop transmission to node De. At this point, node De is aware of the presence of source node Sr outside the intermediate node area, thereby simplifying the route establishment process.
Table 4 presents the information contained in the Hello message, which is used to maintain and establish the route. This information includes the originator and destination IP addresses, current and predicted positions, Q-value calculated based on the current routing information, observed real-time delay, sequence number, remaining hop count, and Mobility Factor (MF) of the current node’s neighbors.
When node D receives a Hello packet from node B, it first verifies whether B is registered in its neighbor table. If B is registered, D updates the neighbor table with information about this neighbor. If B is not registered, D needs to register the node in the neighbor table. The updated and registered information includes the time of the last received packet from B, the end-to-end delay on the last established link (De-B), the three-dimensional velocity of node B, the neighbor nodes’ aggregation degree of node B, and the estimated failure time of the (De-B) link.
The source IP address in the Hello message of node B belongs to source node Sr, which sent the Hello packet. The source node Sr passes through a series of intermediate nodes and finally hands the packet to De through node B. At this point, De knows that it can reach the destination Sr beyond an unknown region via B. The address of Sr is recorded as the destination address in the Q table of De. Then, De can establish the reverse path in the Q table based on this information. At this time, there is an additional record in the Q table, which is shown in Table 5. When De needs to transmit data packets to Sr, it will find multiple routes recorded in the Q table and transmit data packets according to the route with the largest Q value.
Upon establishing the Q-table, Node S is capable of forwarding data packets to Node D through either Node A or Node B. As a result, two records are created in the Q-table of Node D, corresponding to the destination address Sr. Node D selects the next hop for transmission based on the highest Q-value in the Q-table. In the configuration depicted in Figure 9, Node B is selected as the next hop for transmission. The red arrow in Figure 9 represents the routing path of the transmitted data packet from Node D to Sr, based on the reversed path.

5. Simulation Results

The latest work [32] estimates the cost of a given path in the network based on five criteria: adaptive network packet size, accurate packet count, overall required time interval, QoS (Quality of Service) link capacity (bandwidth), and shortest path in terms of hops. This paper also takes into account QoS. In this section, we construct a simulation testbed for FANETs based on the NS-3 network simulation platform and evaluate the performance of OLSR, AODV, DSDV, B.A.T. Mobile, PARRoT, and QEHLR. The evaluation metrics include packet delivery ratio, network throughput, average end-to-end delay, and average jitter. The definitions of these metrics are as follows.

5.1. Evaluation Indicators

(1) Packet Delivery Ratio
The Packet Delivery Ratio is defined as the ratio of the number of packets received by the destination node to the number of packets sent by the source node. This metric measures the integrity and correctness of the routing protocol. A higher PDR indicates better protocol performance. The formal definition of this metric is given by Equation (20).
PDR = ( DataPacket s r c v DataPacket s s e n t ) × 100 %
(2) Throughput
Throughput is defined as the number of bytes received by the destination node per unit of time. Throughput can be divided into node throughput and network throughput. Node throughput refers to the number of bytes of packets received by a single destination node, while network throughput refers to the number of bytes received by all destination nodes per unit of time. In this paper, we focus on network throughput in Kbps, which is calculated by Equation (21).
Throughput ( Kpbs ) = ( CBRbyt e r c v × 8 T i m e s i m u l a t i o n × 1000 )
(3) Average End-to-End Delay
Average End-to-End Delay is the average time taken for a packet to propagate from the source node to the destination node. It includes all delays that may occur throughout the routing process, such as queuing delays at the interface, retransmission delays at the MAC layer, and propagation delays. The definition of Average End-to-End Delay is shown in Equation (22).
A v e r a g e E n d T o E n d D e l a y = ( T i m e r c v T i m e s e n d ) D a t a P a c k e t s r c v
(4) Average Jitter
Jitter describes the degree of variation in packet delay. If the network is congested, queuing delays will affect the end-to-end delay and cause packets transmitted over the same connection to have different delays. Jitter is used to describe the extent of this delay variation and is an essential parameter for real-time transmission. It is usually triggered by network congestion or time drift. The smaller the jitter, the better the network performance. Equation (23) defines jitter as follows:
J i t t e r { P N } = D e l a y { P N } D e l a y { P N 1 }
where P N is the current packet and P N 1 is the previous packet in the data stream, the average jitter is the sum of all end-to-end delay jitter (delay variation) values for each received packet on average, as in Equation (24).
A v e r a g e J i t t e r = ( J i t t e r s u m ) D a t a P a c k e t s r c v
(5) Running Time
The running efficiency of a program can be measured specifically in terms of its running time. Time complexity is defined as the amount of time taken by an algorithm to run. The algorithm runs more efficiently when the program runs in less time and uses less memory during the runtime. Therefore, analyzing the running time and complexity of a program is crucial for evaluating its efficiency and performance.

5.2. Simulation Environment

The simulation scenario parameters for this protocol are presented in Table 6, where NS version 3.33 is utilized. The randomization operation is performed multiple times for each configuration using the random number seed (Random Seed) built into NS-3. Simulations are conducted using a random waypoint mobility model [33,34,35,36], where each node is moved from its current position to a new position by selecting the direction and velocity. Specifically, the new position is chosen randomly within the simulation area, while the new velocity is chosen uniformly from the velocity interval. Table 6 is designed to test the protocol in highly dynamic communication conditions.
NS-3 is a discrete-event network simulator, where each event has a scheduled simulation time that specifies its execution. Conceptually, the simulator keeps track of multiple events that are scheduled to be executed at a predetermined simulation time. The simulator works by executing events in the order of the scheduled simulation time, scheduling them sequentially. Once an event occurs and executes, the simulator moves on to the next event for execution.

5.3. Simulation Result and Analysis

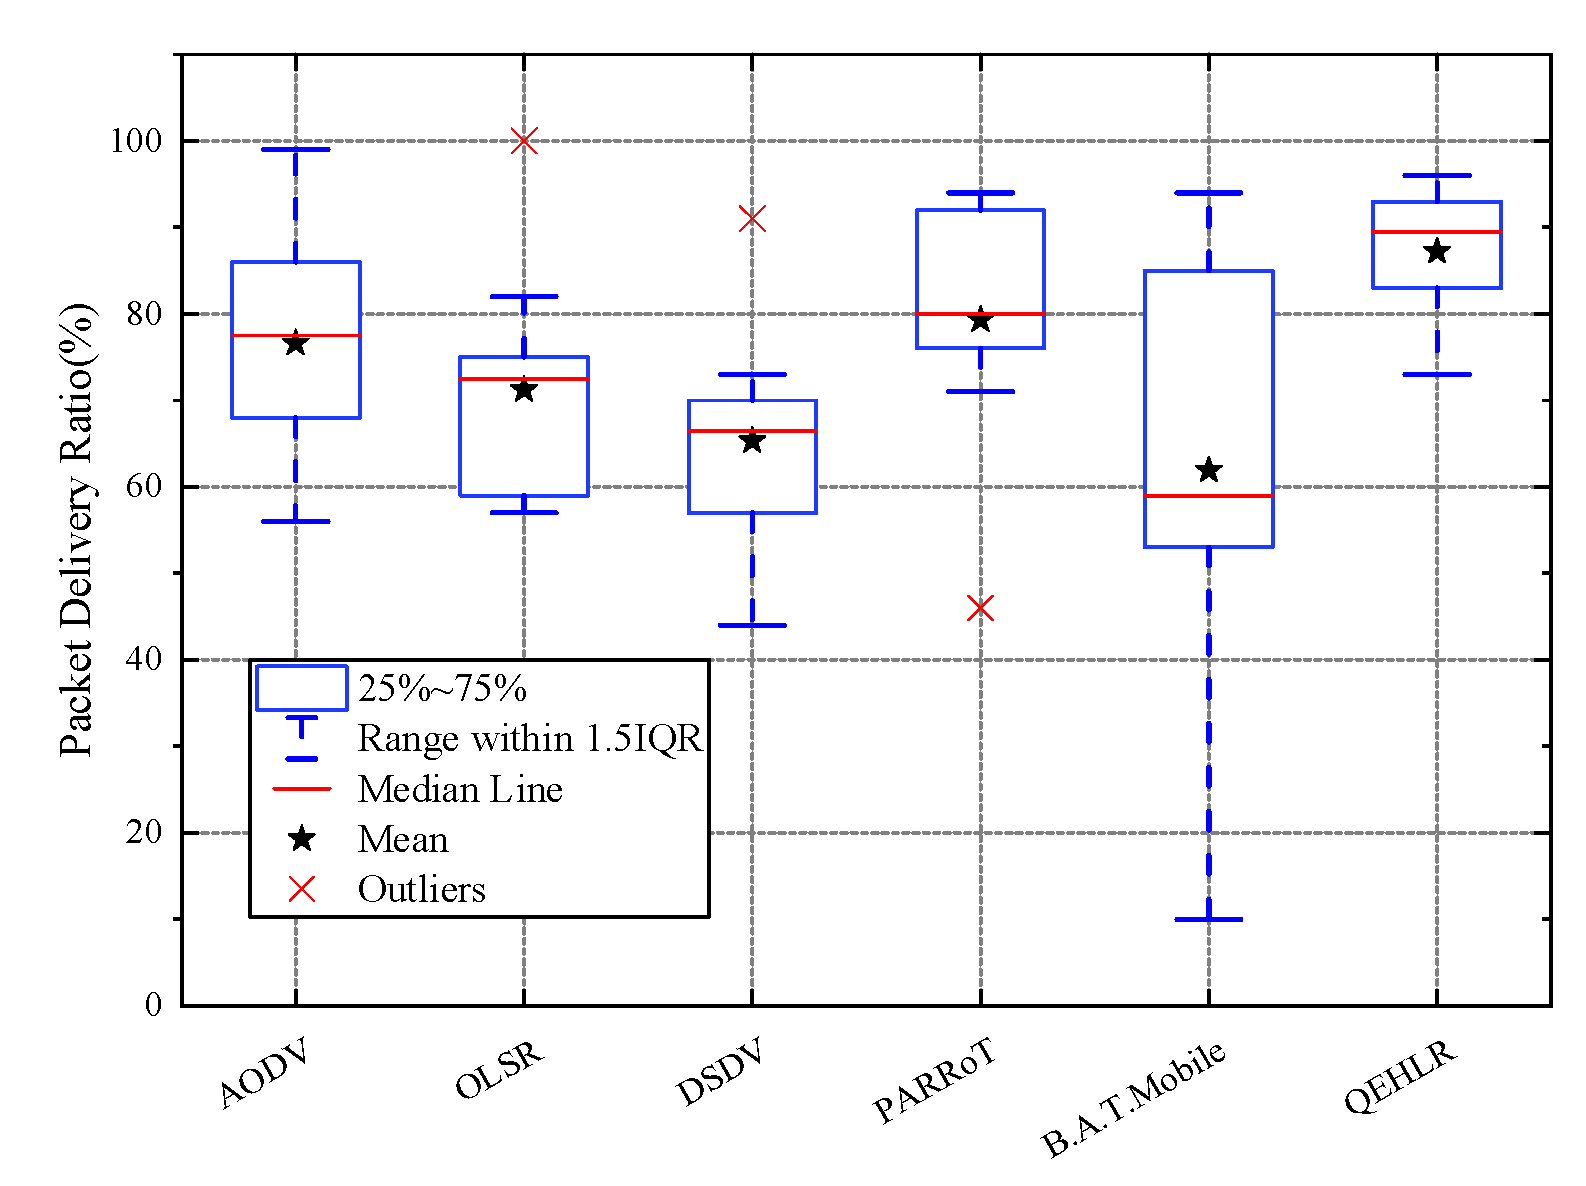
Figure 10 employs a box plot to compare the packet delivery ratios of OLSR, AODV, DSDV, B.A.T. Mobile, PARRoT, and QEHLR in the default simulation scenario, as presented in Table 6. The box plot displays the distribution of data using five horizontal lines, namely the upper edge, upper quartile, median, lower quartile, and lower edge, while the mean and outliers are marked in the figure. A higher packet delivery ratio indicates superior protocol performance in terms of integrity and correctness.
According to Figure 10, the improved protocol QEHLR proposed in this paper has the highest packet transmission rate, which is approximately 12% higher than AODV, 22% higher than OLSR, 20% higher than DSDV, 8% higher than PARRoT, and 25% higher than B.A.T. Mobile. AODV has the second highest packet transmission rate after PARRoT and this protocol. This is because AODV has a route recovery mechanism based on RRER and a reactive protocol structure, which enables it to quickly notify packet loss and rebuild routes. However, AODV’s routing mechanism based on hop count alone may result in unstable link transmission of data packets. As this protocol focuses on improving link stability and selects routes based on delay and mobility while retaining only stable routes, it is more suitable for high dynamic and unstable link scenarios.
Figure 11 presents a comparison of packet transmission rates as the number of nodes increases. It can be observed that some protocol curves exhibit oscillations, which is due to the use of a three-dimensional model in this paper. The three-dimensional scenario in NS-3 is more unstable than the two-dimensional scenario, making it difficult to achieve smooth increases or decreases in the two-dimensional scenario. When the number of nodes is small (10–20 nodes), most protocols show an improvement in packet transmission rates. This is because as the number of nodes increases, the control information exchanged between nodes gradually increases, resulting in an increase in the number of paths between source and destination nodes. It can be seen that this protocol has the highest packet success rate among the following protocols when the number of nodes changes. The second highest is PARRoT, followed by AODV and OLSR, and then B.A.T. Mobile and DSDV. The packet success rate of this protocol tends to be stable when the number of nodes is between 25 and 35, while AODV and PARRoT both show a downward trend. This is because the increase in the number of nodes can improve routing opportunities, but the higher periodic routing traffic increases the probability of data packet collision and loss. It can be seen that the established routing methods cannot adapt to the dynamic network topology, as some routing messages have a high degree of dependence, which prevents the protocol from utilizing more possible path routing for data packets.
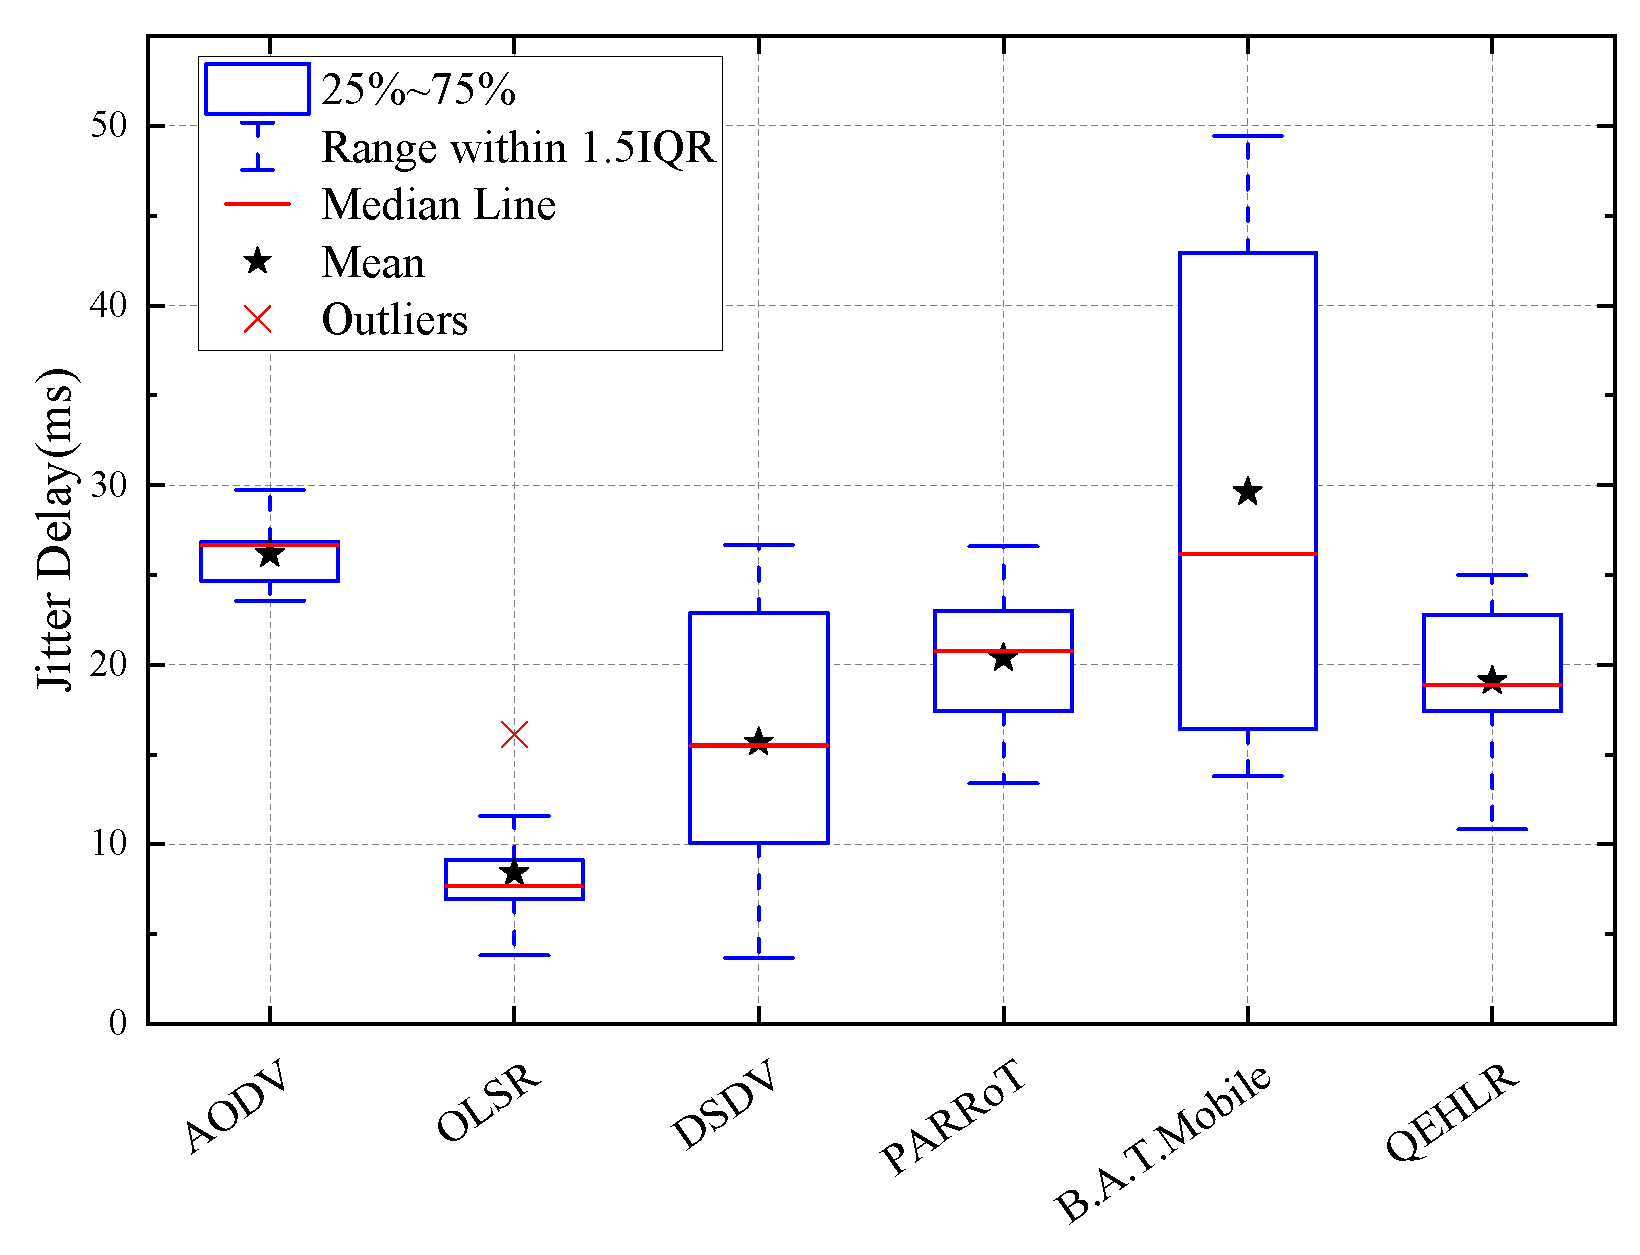
Figure 12 presents the average end-to-end delay of several protocols, with AODV exhibiting the highest delay due to frequent link breakage, router rediscovery, and reconstruction. Notably, QEHLR demonstrates the ability to maintain a low delay while ensuring a high packet delivery rate. This is attributed to the inclusion of end-to-end delay in the discount factor, which prioritizes links with low delay for transmission given their stability. As a result, QEHLR outperforms PARRoT in terms of both delay and jitter delay.
Figure 13 presents a comparison of jitter delay, which is an index used to measure delay stability. The results indicate that the protocol under consideration exhibits a more stable delay than PARRoT. The diagram reveals that the delay performance of this protocol is optimal, with the exception of OLSR. Readers should note that OLSR has a relatively low packet transmission rate and throughput, whereas QEHLR demonstrates the best performance in terms of delay stability.
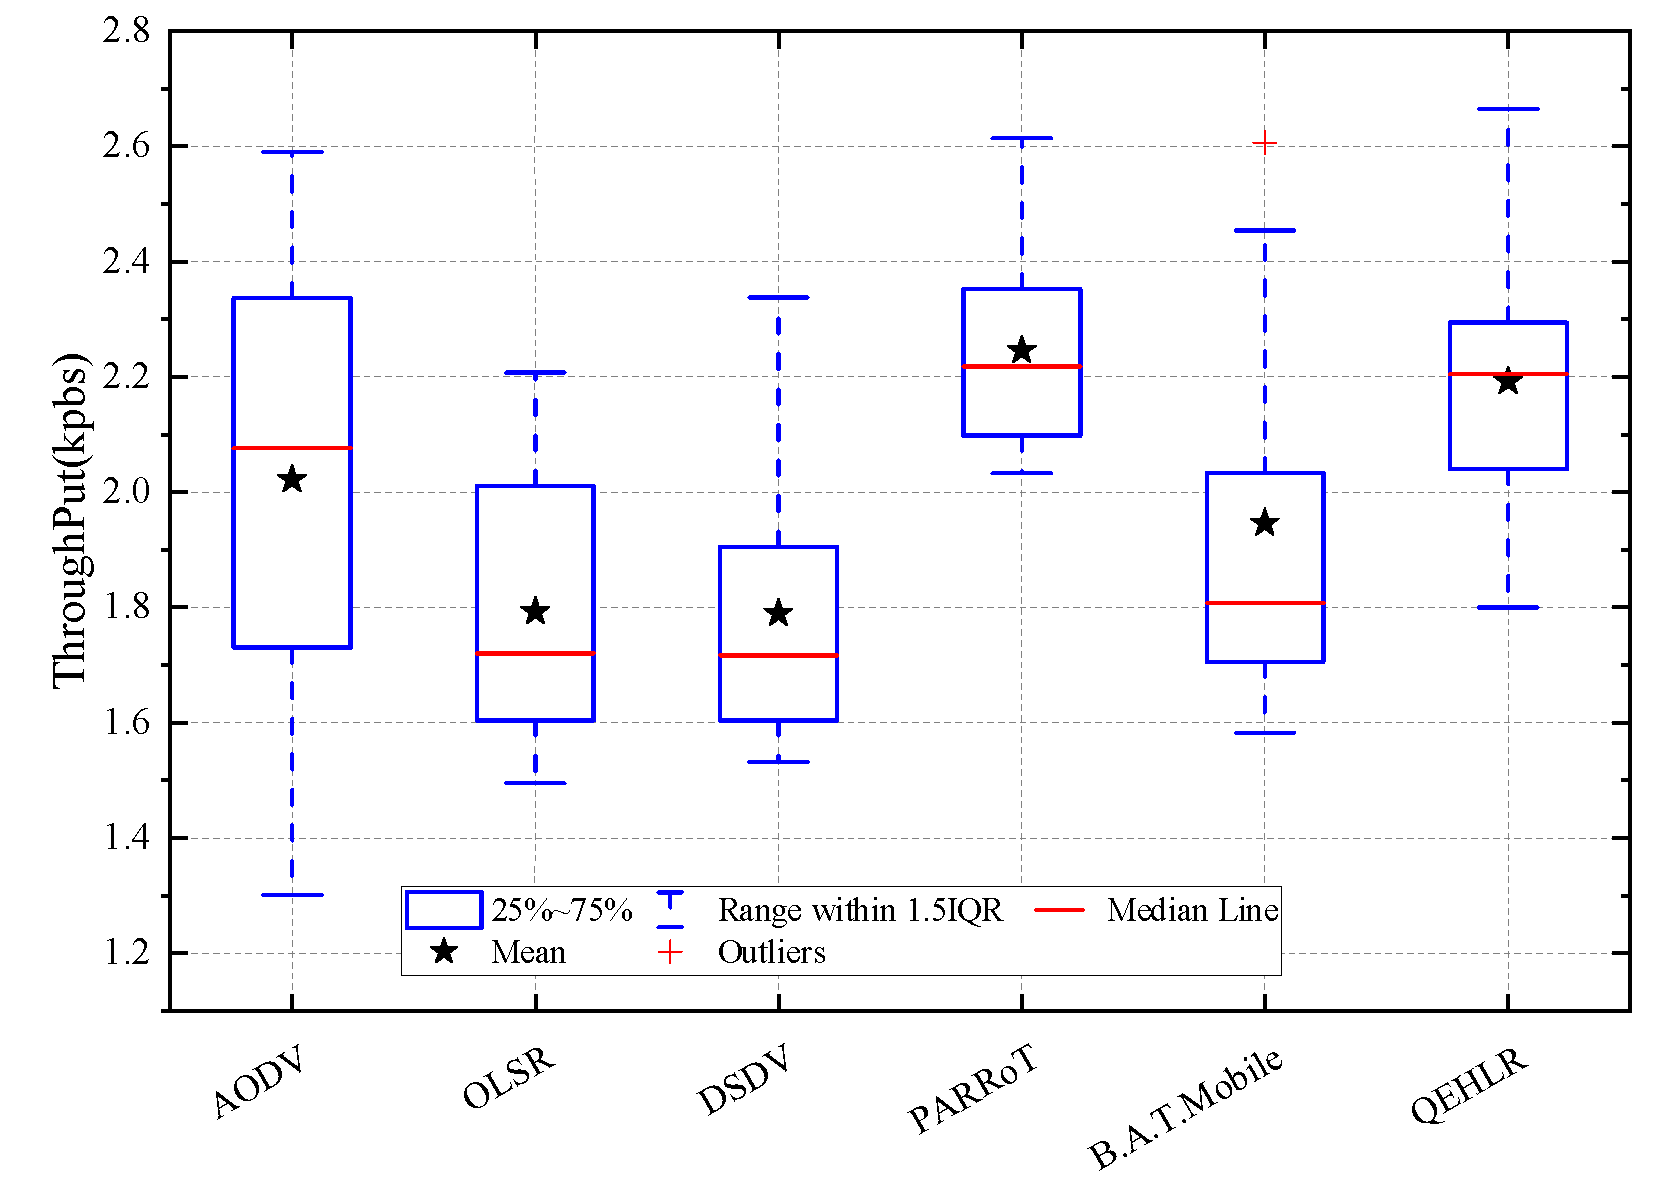
Figure 14 presents a comparison of the throughput of several protocols, which reflects the transmission efficiency of the protocol. A higher value of this indicator implies that the node can transmit more data per unit of time. The results indicate that the protocol under consideration is comparable to PARRoT in terms of throughput, with a value of approximately 2.2 kbps. Furthermore, the throughput rate of this protocol is higher than that of other protocols. However, it is worth noting that PARRoT suffers from the issue of large computational complexity and a long runtime for the program to execute once.
To evaluate the efficiency of the routing protocol in highly dynamic scenarios, this section examines its performance in scenarios involving node speed variation and multi-mobility models. The discount factor COH*Delay is calculated using node aggregation and delay, while COH*LET represents the discount factor calculated using node aggregation and link failure time. Additionally, TCD*Delay is the discount factor calculated using node topology change degree and delay, as discussed before. Figure 15 depicts a comparative analysis of the packet delivery rate under the Gauss Markov mobility model for the three routing factors (utilized to compute the discount factor in Q-value) mentioned in this paper. The protocols employed in both figures exhibit similar trends, with only variations in the discount factor settings in the routing mechanism. The routing factor that integrates the node topology change degree (TCD) demonstrates the best overall performance in terms of packet delivery rate under this mobility model. The results indicate that the TCD-based protocol can effectively learn the network topology characteristics by considering the degree of node topology variation. The simulation scenario was conducted under two node counts, and the protocol exhibited superior performance when the node count was set to 15.
Figure 15c,d present the average end-to-end delay comparison of nodes under the Gauss Markov mobility model, while Figure 15e,f show the jitter delay comparison. It is observed that both the end-to-end delay and jitter with TCD exhibit superior performance when the number of nodes is 15. However, the performance deteriorates when the number of nodes increases to 20, and the delay can be reduced by utilizing the calculation methods of node aggregation and link failure time. Based on the performance of the three routing coefficients, the calculation method with the node topology degree exhibits the best packet transmission performance for the Gauss Markov mobility model, and the delay performance is better when the number of nodes is 15. Figure 16a,b depict the comparison of packet delivery rates for three routing coefficients under a random waypoint mobility model. It can be observed that the protocol incorporating TCD for routing calculation gradually improves packet transmission rates, starting from a speed of 20 m/s for 15 nodes in this mobility model. However, for 20 nodes, the best packet transmission performance among the three is achieved at a speed of 25 m/s. In terms of delay and jitter metrics, speeds of 15 m/s, 20 m/s, and 35 m/s can ensure and maintain low delays for 15 nodes. For 20 nodes, speeds of 10 m/s, 15 m/s, 25 m/s, 35 m/s, and 40 m/s can ensure and maintain low delays. When using a combination of link expiration time (LET) and node aggregation degree (COH) for routing coefficients, the best packet delivery rate is achieved for 15 nodes at speeds of 15 m/s and 30 m/s, while low delays can be ensured and maintained at speeds of 10 m/s and 25 m/s. For 20 nodes, this combination achieves the best packet transmission rate at a speed of 20 m/s and low delays at 30 m/s.
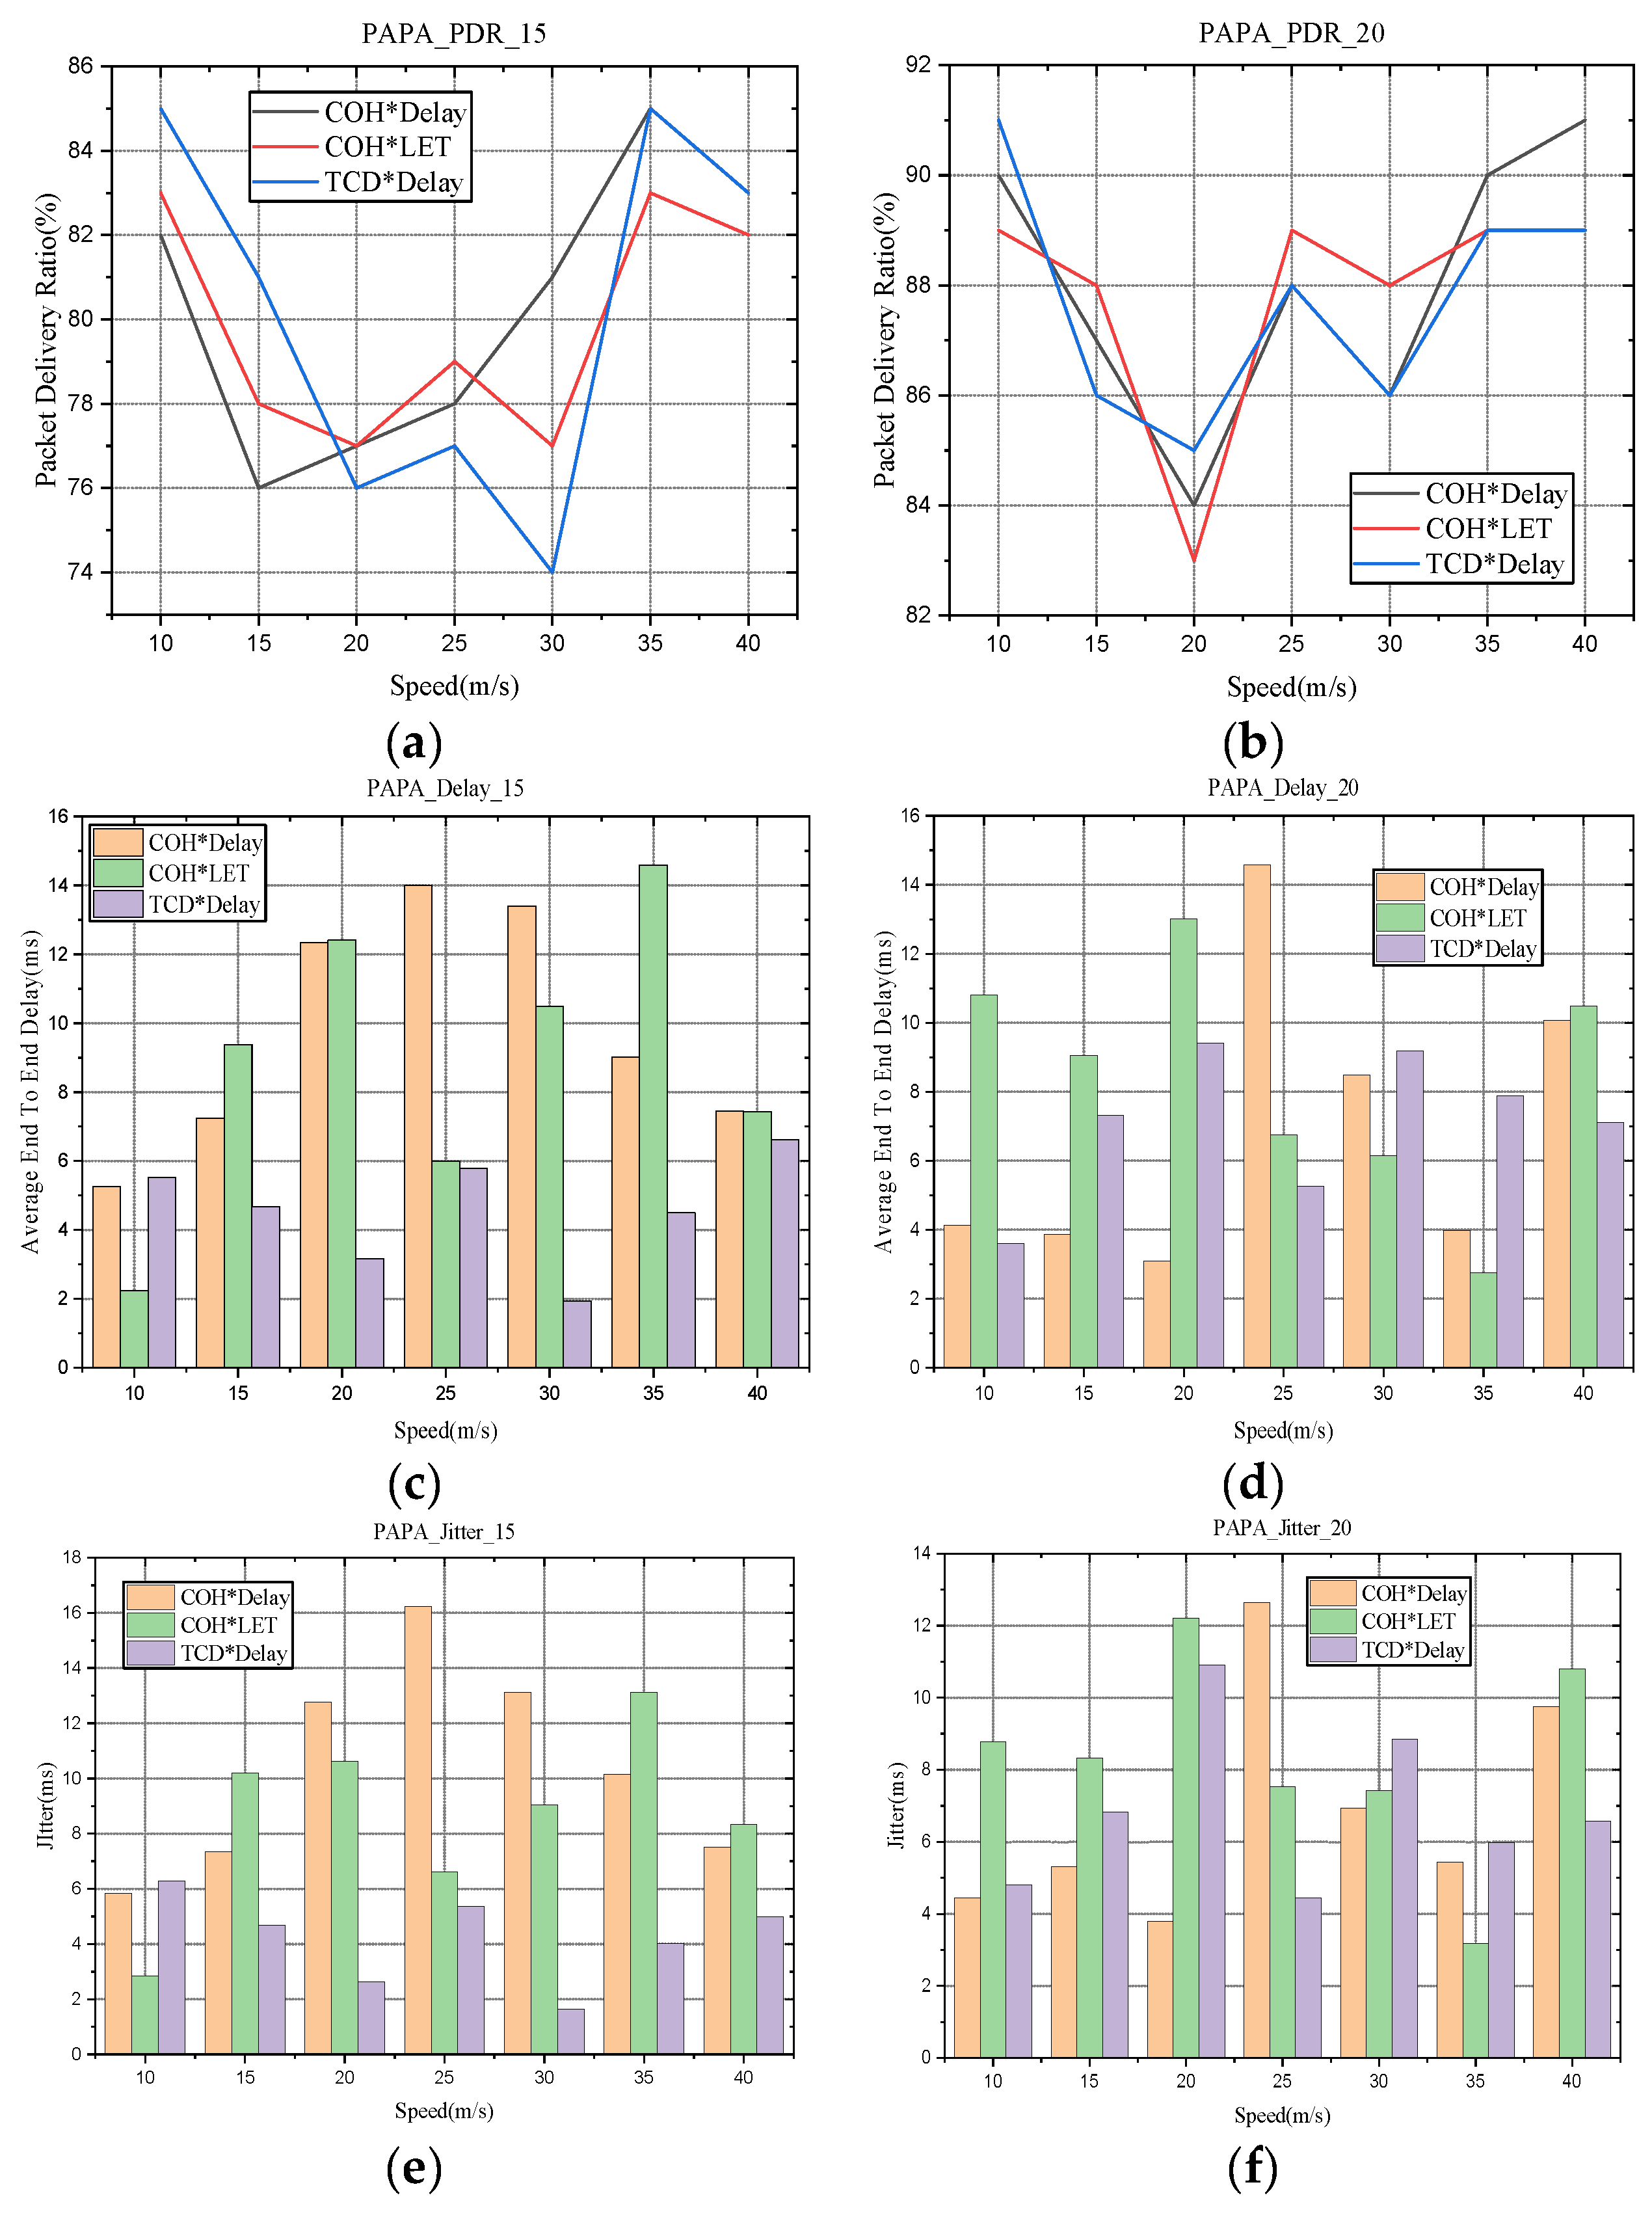
Figure 17 presents a comparative performance analysis of three routing coefficients under the Paparazzi mobility model. The results indicate that, at 15 nodes, the inclusion of node topology degree in the calculation under the Paparazzi mobility model yields the best performance in terms of both packet delivery rate and delay.
Figure 18 illustrates a runtime comparison between QEHLR and PARRoT. QEHLR exhibits significantly higher computational efficiency than PARRoT, while maintaining a throughput that is comparable to that of PARRoT. This is attributed to the fact that QEHLR reduces the prediction of 3D velocity to a single step and obtains velocity directly through the mobility model, thereby reducing the complexity of the algorithm and significantly decreasing the runtime.

6. Conclusions

This paper proposes a novel routing algorithm, QEHLR, to enhance the routing stability of highly dynamic FANETs. Simulation results demonstrate that the improved routing algorithm QEHLR has a packet delivery rate approximately 12% higher than AODV, approximately 22% higher than OLSR, approximately 20% higher than DSDV, approximately 8% higher than PARROT, and approximately 25% higher than B.A.T. Mobile, thus exhibiting the highest packet delivery rate. Furthermore, the Q-learning based algorithm offers a utility advantage by incorporating delay and mobility into the calculation of the discount in the Q-learning function. This adaptive learning method enables better prediction of the network status through long-term vision and interaction with the topology of dynamic networks. Therefore, the algorithm is a promising choice for providing QoS-integrated services in FANETs, particularly for users who prioritize stable transmission and a high packet delivery ratio. Additionally, the computational efficiency of the algorithm is greatly improved, making it more suitable for highly dynamic FANETs scenarios. The routing principle can be easily extended to various mobile networks and may be an attractive option for networks with high dynamic characteristics. The algorithm in this paper does indeed have computational overhead issues due to the real-time storage and maintenance of Q-tables for each node. This makes the protocol proposed in this paper more computationally complex compared to conventional routing protocols. Therefore, the protocol presented in this paper is only suitable for smaller-scale networks. The operation of the routing mechanism in the case of a fully expanded node scale has not been considered in this paper. However, the routing protocol for large-scale UAV network clustering is one of the incomplete research directions in the field of FANETs routing protocol. Therefore, in the future, this work will complete the design of a large-scale intelligent FANETs routing protocol under the premise of limited computing resources.

Author Contributions

Conceptualization, Q.X.; methodology, Q.X., J.Y. and Y.Y.; investigation, X.T., J.S.; resources, J.S. and Y.C.; writing—original draft preparation, Q.X.; writing—review and editing, Q.X. and Y.C.; supervision, Y.C.; project administration, G.L.; funding acquisition, Y.C. All authors have read and agreed to the published version of the manuscript.

Funding

The work described in this paper is funded by the National Natural Science Foundation of China (No. 52072408). The authors gratefully acknowledge the funding.

Data Availability Statement

Not applicable.

Conflicts of Interest

The authors declare no conflict of interest.

References

  1. Bekmezci, I.; Sahingoz, O.K.; Temel, S. Flying Ad-Hoc Networks (FANETs): A survey. Ad Hoc Netw. 2013, 11, 1254–1270. [Google Scholar] [CrossRef]
  2. Hong, J.; Zhang, D. TARCS: A Topology Change Aware-Based Routing Protocol Choosing Scheme of FANETs. Electronics 2019, 8, 274. [Google Scholar] [CrossRef] [Green Version]
  3. Ullah, S.; Mohammadani, K.H.; Khan, M.A.; Ren, Z.; Alkanhel, R.; Muthanna, A.; Tariq, U. Position-Monitoring-Based Hybrid Routing Protocol for 3D UAV-Based Networks. Drones 2022, 6, 327. [Google Scholar] [CrossRef]
  4. Shumeye Lakew, D.; Sa’ad, U.; Dao, N.N.; Na, W.; Cho, S. Routing in Flying Ad Hoc Networks: A Comprehensive Survey. IEEE Commun. Surv. Tutor. 2020, 22, 1071–1120. [Google Scholar] [CrossRef]
  5. Nawaz, H.; Ali, H.M.; Laghari, A.A. UAV Communication Networks Issues: A Review. Arch. Comput. Methods. Eng. 2020, 28, 1349–1369. [Google Scholar] [CrossRef]
  6. Sang, Q.; Wu, H.; Xing, L.; Xie, P. Review and Comparison of Emerging Routing Protocols in Flying Ad Hoc Networks. Symmetry 2020, 12, 971. [Google Scholar] [CrossRef]
  7. Alzahrani, B.; Oubbati, O.S.; Barnawi, A.; Atiquzzaman, M.; Alghazzawi, D. UAV assistance paradigm: State-of-the-art in applications and challenges. J. Netw. Comput. Appl. 2020, 166, 102706. [Google Scholar] [CrossRef]
  8. Nazib, R.A.; Moh, S. Routing Protocols for Unmanned Aerial Vehicle-Aided Vehicular Ad Hoc Networks: A Survey. IEEE Access 2020, 8, 77535–77560. [Google Scholar] [CrossRef]
  9. Johnson, D.B.; Maltz, D.A. Dynamic Source Routing in Ad Hoc Wireless Networks. Mobile. Comput. 1996, 353, 153–181. [Google Scholar]
  10. Murthy, S.; Garcia-Luna-Aceves, J.J. An efficient routing protocol for wireless networks. Mob. Netw. Appl. 1996, 1, 183–197. [Google Scholar] [CrossRef] [Green Version]
  11. Perkins, C.E.; Bhagwat, P. Highly dynamic destination-sequenced distance-vector routing (DSDV) for mobile computers. Comput. Commun. Rev. 1994, 24, 234–244. [Google Scholar] [CrossRef] [Green Version]
  12. Clausen, T.; Jacquet, P. Optimized link state routing protocol (OLSR). RFC 2003, 3626, 1–75. [Google Scholar]
  13. Alshabtat, A.I.; Dong, L. Low latency routing algorithm for unmanned aerial vehicles ad-hoc networks. Int. J. Electr. Eng. 2011, 5, 989–995. [Google Scholar]
  14. Haas, Z. The Zone Routing Protocol (ZRP) for Ad Hoc Networks. Available online: https://www.ietf.org/proceedings/55/I-D/draft-ietf-manet-zone-zrp-04.txt (accessed on 10 April 2023).
  15. Park, V.; Corson, S. Temporally-Ordered Routing Algorithm (tora). Available online: http://www.ietf.org/proceedings/52/I-D/draftietf-manet-tora-spec-04.txt (accessed on 10 April 2023).
  16. Rovira-Sugranes, A.; Razi, A.; Afghah, F.; Chakareski, J. A review of AI-enabled routing protocols for UAV networks: Trends, challenges, and future outlook. Ad Hoc Netw. 2022, 130, 102790. [Google Scholar] [CrossRef]
  17. Liu, J.; Wang, Q.; He, C.; Jaffrès-Runser, K.; Xu, Y.; Li, Z.; Xu, Y. QMR: Q-learning based Multi-objective optimization Routing protocol for Flying Ad Hoc Networks. Comput. Commun. 2020, 150, 304–316. [Google Scholar] [CrossRef]
  18. Li, R.; Li, F.; Li, X.; Wang, Y. QGrid: Q-learning based routing protocol for vehicular ad hoc networks. In Proceedings of the 2014 IEEE 33rd International Performance Computing and Communications Conference (IPCCC), Austin, TX, USA, 5–7 December 2014; pp. 1–8. [Google Scholar]
  19. Serhani, A.; Naja, N.; Jamali, A. QLAR: A Q-learning based adaptive routing for MANETs. In Proceedings of the 2016 IEEE/ACS 13th International Conference of Computer Systems and Applications (AICCSA), Agadir, Morocco, 29 November–2 December 2016; pp. 1–7. [Google Scholar]
  20. Jung, W.S.; Yim, J.; Ko, Y.B. QGeo: Q-Learning-Based Geographic Ad Hoc Routing Protocol for Unmanned Robotic Networks. IEEE Commun. Lett. 2017, 21, 2258–2261. [Google Scholar] [CrossRef]
  21. da Costa, L.A.L.F.; Kunst, R.; Pignaton de Freitas, E. Q-FANET: Improved Q-learning based routing protocol for FANETs. Comput. Netw. 2021, 198, 108379. [Google Scholar] [CrossRef]
  22. Yang, Q.; Jang, S.J.; Yoo, S.J. Q-Learning-Based Fuzzy Logic for Multi-objective Routing Algorithm in Flying Ad Hoc Networks. Wirel. Pers. Commun. 2020, 113, 115–138. [Google Scholar] [CrossRef]
  23. He, C.; Liu, S.; Han, S. A Fuzzy Logic Reinforcement Learning-Based Routing Algorithm For Flying Ad Hoc Networks. In Proceedings of the 2020 International Conference on Computing Networking and Communications (ICNC), Big Island, HI, USA, 17–20 February 2020; pp. 987–991. [Google Scholar]
  24. Sliwa, B.; Schuler, C.; Patchou, M.; Wietfeld, C. PARRoT: Predictive Ad-hoc Routing Fueled by Reinforcement Learning and Trajectory Knowledge. In Proceedings of the 2021 IEEE 93rd Vehicular Technology Conference (VTC2021-Spring), Helsinki, Finland, 25–28 April 2021; pp. 1–7. [Google Scholar]
  25. Sliwa, B.; Behnke, D.; Ide, C.; Wietfeld, C.B.A.T. Mobile: Leveraging Mobility Control Knowledge for Efficient Routing in Mobile Robotic Networks. In Proceedings of the 2016 IEEE Globecom Workshops (GC Wkshps), Washington, DC, USA, 4–8 December 2016; pp. 1–6. [Google Scholar]
  26. Neumann, A.; Aichele, C.; Lindner, M. Better Approach to Mobile Ad Hoc Networking (Batman). Available online: https://datatracker.ietf.org/doc/pdf/draft-wunderlich-openmesh-manet-routing-00.pdf (accessed on 10 April 2023).
  27. Rovira-Sugranes, A.; Afghah, F.; Qu, J.; Razi, A. Fully-Echoed Q-Routing With Simulated Annealing Inference for Flying Adhoc Networks. IEEE Trans. Netw. Sci. Eng. 2021, 8, 2223–2234. [Google Scholar] [CrossRef]
  28. Liu, J.; Wang, Q.; Xu, Y. AR-GAIL: Adaptive routing protocol for FANETs using generative adversarial imitation learning. Comput. Netw. 2022, 218, 109382. [Google Scholar] [CrossRef]
  29. Sutton, R.S.; Barton, A.G. Reinforcement learning: An introduction. Mach. Learn. 1992, 8, 225–227. [Google Scholar] [CrossRef] [Green Version]
  30. Johnson, R.; Jasik, H. Antenna Engineering Handbook, 2nd ed.; McGraw-Hill: New York, NY, USA, 1984; pp. 1–12. [Google Scholar]
  31. Hong, J.; Zhang, D. Topology Change Degree: A Mobility Metric Describing Topology Changes in MANETs and Distinguishing Different Mobility Patterns. Ad Hoc Sens. Wirel. Netw. 2019, 44, 153–171. [Google Scholar]
  32. Taha, M. An efficient software defined network controller based routing adaptation for enhancing QoE of multimedia streaming service. Multimed. Tools. Appl. 2023. [Google Scholar] [CrossRef]
  33. Camp, T.; Boleng, J.; Davies, V. A survey of mobility models for ad hoc network research. Wirel. Commun. Mob. Comput. 2002, 2, 483–502. [Google Scholar] [CrossRef]
  34. Broch, J.; Maltz, D.A.; Johnson, D.B.; Hu, Y.C.; Jetcheva, J. A performance comparison of multi-hop wireless ad hoc network routing protocols. In Proceedings of the 4th Annual ACM/IEEE International Conference on Mobile Computing and Networking, Dallas, TX, USA, 25–30 October 1998; pp. 85–97. [Google Scholar]
  35. Ye, Z.; Zhou, Q. Performance Evaluation Indicators of Space Dynamic Networks under Broadcast Mechanism. Space: Sci. Technol. 2021, 2021, 9826517. [Google Scholar] [CrossRef]
  36. Meng, Q.; Huang, M.; Xu, Y.; Liu, N.; Xiang, X. Decentralized Distributed Deep Learning with Low-Bandwidth Consumption for Smart Constellations. Space Sci. Technol. 2021, 2021, 9879246. [Google Scholar] [CrossRef]
Figure 1. MANETs, VANETs, and FANETs.
Drones 07 00459 g001
Figure 2. A simple FANET structure.
Drones 07 00459 g002
Figure 3. Reinforcement learning process.
Drones 07 00459 g003
Figure 4. Routing Process.
Drones 07 00459 g004
Figure 5. General flow chart of the protocol.
Drones 07 00459 g005
Figure 6. Q model of the protocol.
Drones 07 00459 g006
Figure 7. Flow chart for calculating the delay.
Drones 07 00459 g007
Figure 8. Link failure time. The red arrows represent invalid communication ranges while the green arrows represent valid communication ranges.
Drones 07 00459 g008
Figure 9. Hello propagation. Decimal fractions on the bule arrows represent the corresponding Q-value meanwhile red arrows represent optimal route obtained by the routing decision process.
Drones 07 00459 g009
Figure 10. Performance of packet delivery ratio among different protocols.
Drones 07 00459 g010
Figure 11. Impact of the number of nodes on the packet delivery ratio.
Drones 07 00459 g011
Figure 12. Comparison of QEHLR to several protocols in end-to-end delay.
Drones 07 00459 g012
Figure 13. Comparison of QEHLR to several protocols in jitter delay.
Drones 07 00459 g013
Figure 14. Comparison of QEHLR to several protocols in terms of throughput.
Drones 07 00459 g014
Figure 15. Contrastive illustration under the Gauss Markov model.
Drones 07 00459 g015
Figure 16. Contrastive illustration under the RWP model.
Drones 07 00459 g016
Figure 17. Contrastive illustration under the Paparazzi model.
Drones 07 00459 g017
Figure 18. The comparison of two Q-learning based protocols.
Drones 07 00459 g018
Table 1. Comparison among MANETs, VANETs, and FANETs.
CharacteristicsMANETsVANETsFANETs
MobilityLow(2D)Low(2D)FW-Med(3D)
RW-High(3D)
SpeedLow(6 km/h)Med-High(20–100 km/h)FW-High(100 km/h)
RW-Med(50 km/m)
Mobility ModelRandomManhattanFW-Paparazzi
RW-RWP
Topology VariationLowMedFW-Med
RW-High
FW: fixed wing, RW: rotatory wing.
Table 2. Mobility models and task scenarios applied to FANETs.
ClassificationMobility ModelUAV ClassificationMission Scenario
RandomizationRandom WaypointRWEnvironmental Sensing/
Traffic/City Monitoring
Time DependenceGauss MarkovRWEnvironmental Sensing/
Search/Detection and Rescue
Path PlanningPaparazziRW/FWAgricultural Management/
Transportation/Urban Monitoring
FW: fixed wing, RW: rotatory wing.
Table 3. The main contributions and problems.
ProtocolContributionsLimitations
QMR [17]Dynamic adjustment of Q-factor improves packet delivery rate and reduces latencyDesigning alternatives for routing decisions based on speed alone is not good enough
Q-FANET [21]QMR-based improvements to provide lower latency and jitterDid not verify protocol performance at different speeds
QLFLMOR [22]Maintain a lower hop count to reduce energy consumption and extend network survival timePoor performance with a low number of nodes
FLRLR [23]Reduce average hop count and improve link connectivityIt does not verify the number of hops versus packet delivery rate as the number of nodes increases
PARRoT [24]Enables robust data deliveryLarge computational complexity
Fully-echoed Q-routing [27]Introduced a new full echo Q protocol that avoids connection lossDoes not consider node mobility in the protocol
AR-GAL [28]A deeply reinforced routing protocol that introduces generative adversarial imitation learning can reduce latency and improve packet delivery rateRouting failure exists at low flight density
Table 4. The structure of the Hello message.
Packet Architecture (Total Bytes 48)
1234
Originator IP Address
Destination IP Address
Position Vector3D
Predict Vector3D
Q value
Observed Delay
MF (Mobility Factor)
Sequence NumberTTL
Table 5. Q-table for node De.
Gateway Node
Destination Node SrABCDE
SrNULL Q S r ( A , D e ) Q S r ( B , D e ) Q S r ( C , D e ) Q S r ( D , D e ) Q S r ( E , D e )
A Q A ( S r , D e ) NULL Q A ( B , D e ) Q A ( C , D e ) Q A ( D , D e ) Q A ( E , D e )
B Q B ( S r , D e ) Q B ( A , D e ) NULL Q B ( C , D e ) Q B ( D , D e ) Q B ( E , D e )
C Q C ( S r , D e ) Q C ( A , D e ) Q C ( B , D e ) NULL Q C ( D , D e ) Q C ( E , D e )
D Q D ( S r , D e ) Q D ( A , D e ) Q D ( B , D e ) Q D ( C , D e ) NULL Q D ( E , D e )
E Q E ( S r , D e ) Q E ( A , D e ) Q E ( B , D e ) Q E ( C , D e ) Q E ( D , D e ) NULL
Table 6. Simulation parameters.
ParametersSetting
SimulatorNS-3.33
Initialization time5 s
MAC802.11 g/2.4 G
Delay modelConstant speed propagation delay model
Transmitting power20 dbm
Receiver sensitivity−85 dbm
Transmission gain1 db
Reception gain1 db
Energy level1
Channel loss modelFriis
Mobility modelRandom way point
Simulation area500 m × 500 m × 500 m
Number of nodes25
Speed of nodes13.9 m/s
TrafficUDP
Rate controlIdeal WIFI manager
Disclaimer/Publisher’s Note: The statements, opinions and data contained in all publications are solely those of the individual author(s) and contributor(s) and not of MDPI and/or the editor(s). MDPI and/or the editor(s) disclaim responsibility for any injury to people or property resulting from any ideas, methods, instructions or products referred to in the content.