Article

Deep Learning-Based Robust Actuator Fault Detection and Isolation Scheme for Highly Redundant Multirotor UAVs

1
Department of Aerospace Engineering, Pusan National University, Busan 46241, Republic of Korea
2
Engineering Research Center for Innovative Technology on Advanced Forming, Busan 46241, Republic of Korea
*
Author to whom correspondence should be addressed.
Drones 2023, 7(7), 437; https://doi.org/10.3390/drones7070437
Submission received: 7 June 2023 / Revised: 29 June 2023 / Accepted: 30 June 2023 / Published: 1 July 2023

Abstract

:
This article presents a novel approach for detecting and isolating faulty actuators in highly redundant Multirotor UAVs using cascaded Deep Neural Network (DNN) models. The proposed Fault Detection and Isolation (FDI) framework combines Long Short-Term Memory (LSTM)-based fault detection and faulty actuator locator models to achieve real-time monitoring. The study focuses on a Hexadecarotor multirotor UAV equipped with sixteen rotors. To tackle the complexity of FDI resulting from redundancy, a partitioning technique is introduced based on system dynamics. The proposed FDI scheme is composed of a region classifier model responsible for detecting faults and fault locator models that precisely determine the location of the failed actuator. Extensive training and testing of the models demonstrate high accuracy, with the regional classifier model achieving 98.97% accuracy and the fault locator model achieving 99.107% accuracy. Furthermore, the scheme was integrated into the flight control system of the UAV, before being tested via both real-time monitoring in the simulation environment and analysis of recorded real flight data. The models exhibit remarkable performance in detecting and localizing injected faults. Therefore, using DNN models and the partitioning technique, this research offers a promising method for accurately detecting and isolating faulty actuators, thereby improving the overall performance and dependability of highly redundant Multirotor UAVs in various operational scenarios.
Keywords:
FDI; Multirotor UAV; UAM; LSTM; RNN; DNN

1. Introduction

Multirotor Unmanned Aerial Vehicles (UAVs) have revolutionized the field of aerial technology by introducing versatility and agility. These dynamic aircraft have been seamlessly integrated into our society and made remarkable advancements across numerous domains. They have transformed the fields of aerial photography, videography, search and rescue operations, infrastructure inspection, agricultural monitoring, delivery logistics, urban transportation, and environmental surveillance [1,2].
Multirotor UAVs belong to a category of unmanned aerial vehicles that are powered by multiple rotors, usually in the form of propellers. These UAVs consist of a central body or frame with three or more symmetrically placed rotor arms, with each arm supporting one or two motors and propellers, as depicted in Figure 1. The propulsion system, which comprises the propeller, motor, and ESC (Electronic Speed Controller), is responsible for generating the required thrust to lift and propel the UAV in the air. The propeller, which is a rotating blade, generates airflow, while the motor supplies mechanical power to rotate the propeller. The ESC controls the motor’s speed and direction. Together, these components collaborate to deliver the necessary force for the UAV’s vertical lift and control, allowing it to hover, take off vertically, and maneuver with remarkable agility. [3].
Nevertheless, the propulsion system used by multirotor UAVs is susceptible to unforeseen malfunctions during operation caused by various factors, encompassing mechanical issues, electrical problems, and environmental conditions. Instances of motor failures can stem from factors like overheating, mechanical wear, manufacturing defects, or electrical abnormalities, resulting in reduced thrust or complete operational breakdown [4]. Failures in Electronic Speed Controllers (ESCs) can be ascribed to electrical or communication problems, overheating, or component failures. Disruptions in the power distribution system, such as faulty wiring, loose connections, or inadequate power supply, can also compromise the functionality of the propulsion system [5]. Moreover, propeller-related complications, including imbalance, cracks, or detachment, can lead to diminished efficiency, vibrations, or even total propeller failure. Environmental elements, like adverse weather conditions, debris, water infiltration, or damage caused by foreign objects, further contribute to motor, ESC, and propeller failures or performance degradation. These faults can result in degraded performance, loss of control, or complete system failure, ultimately leading to service interruptions, decreased efficiency, and weakened reliability [6].
In contrast, researchers have proposed the Actuator Fault Tolerant System (AFTS) as a solution to mitigate the negative impact of actuator failure in redundant multirotor UAVs, enabling them to continue their mission or perform emergency landings. The AFTS consists of two key components: the Actuator Fault Detection and Isolation (FDI) system and the Actuator Fault Management (FM) system [7,8,9]. The FDI system actively monitors the actuators, continuously detecting any abnormal behavior or malfunctions that may occur [10]. On the other hand, the FM system is designed to effectively handle the recovery process to maintain flight stability and control. It compensates for the failed actuator by leveraging redundancy and redistributing control commands to the operational actuators, ensuring optimal utilization of the healthy actuators. Additionally, proper redundancy management can prevent adverse effects and potential risks, such as limited maneuverability, reduced disturbance rejection, torque imbalance, increased stress on the system, higher failure rates, or additional failures in motor ESCs, wires, and propellers, ultimately extending the flight time [11].
Nevertheless, the incorporation of redundant actuators into the system presents both advantages and drawbacks. On one hand, it enhances actuator fault tolerance by providing backup options, and it enables the UAV to carry a larger payload. However, it also introduces challenges in accurately detecting and isolating the location of a failed actuator. Therefore, it is crucial to design an effective Fault Detection and Isolation (FDI) system that can handle the increased complexity arising from higher levels of redundancy. This approach allows the Actuator Fault Management (FM) system to remove the failed actuator from the system and optimize the redistribution of control based on the specific scenario of actuator failure.
Numerous researchers have proposed diverse approaches to address actuator Fault Detection and Isolation (FDI) in UAVs, which fall into distinct categories, such as residual-based methods, analytical redundancy, signal processing, and machine learning/data-driven methods [12]. Residual-based methods involve monitoring the difference or residual between the expected behavior of the UAV and the actual measurements obtained via sensors. By comparing these residuals with pre-determined thresholds or employing statistical techniques, deviations caused by actuator faults can be detected. In contrast, analytical redundancy relies on using mathematical models and system dynamics to identify defects [13]. This technique compares the UAV’s predicted behavior, as determined using the model, with the actual behavior observed from the sensors. Any disparities between the predicted and observed values can indicate actuator faults. Analytical redundancy techniques may involve using Kalman filters [14] and observer-based approaches [15]. Signal processing methods focus on analyzing sensor measurements to detect and isolate actuator faults [16]. These techniques employ frequency analysis, wavelet transforms, or statistical signal processing methods to identify abnormal patterns or characteristics in the sensor data. Unusual or unexpected variations in sensor signals can indicate the presence of actuator faults. However, some of these methods are ineffective in real-world applications due to system parameter variations during operation and unknown disturbances, which can result in false alarms.
Another emerging approach that is gaining traction is the use of Machine Learning (ML) and Data-Driven Approaches, which utilize machine learning techniques to learn the normal behavior of UAV systems and detect deviations caused by actuator faults [17,18,19]. These methods employ supervised or unsupervised learning algorithms trained on historical data to identify patterns or anomalies associated with faulty actuators. Support Vector Machines (SVM) [20,21], Artificial Neural Networks (ANN), clustering algorithms [22], and advanced Deep Neural Network (DNN) learning approaches are encompassed within these techniques. The power of DNN lies in its ability to handle complex and nonlinear relationships between input variables and output predictions, capturing intricate patterns that traditional analytical methods may struggle to model or discover. Furthermore, these approaches excel in learning from large-scale and diverse datasets, automating complex tasks, and streamlining processes that would otherwise require manual effort or extensive rule-based systems [12]. For time series data classification, such as actuator FDI, recurrent networks, particularly Long–Short-Term Memory (LSTM) networks, prove highly efficient in capturing temporal dependencies within data sequences, surpassing the capabilities of classical RNN structures [23].
This study introduces a novel approach that utilizes DNNs to detect and isolate faulty actuators in highly redundant multirotor UAVs. The research focuses on a specific configuration that represents a highly redundant multirotor UAV, i.e., a hexadecarotor multirotor cargo drone with sixteen rotors, which is shown in Figure 1a, as the object of investigation. A cascaded DNN-based FDI framework is proposed, exploiting the capabilities of LSTM networks to capture the complex temporal behavior of the system. The proposed LSTM-based FDI scheme comprises two sections named the Region Classifier Model (RCM), which is designed to detect and identify the region where a fault exists, and the Fault Locator Model (FLM), which is designed to determine the specific failed motor within that suspected region. Rigorous testing and evaluation are conducted using both simulation and real-flight experimental data to validate the resilience and effectiveness of the proposed approach. The results demonstrate the reliability and efficiency of the proposed solution, positioning it as a crucial solution for ensuring the safety and reliability of operations in multirotor UAVs.
The remaining sections of this article are structured as follows. Section 2 provides a comprehensive review of multirotor UAVs, focusing on the impact of actuator failure and addressing the problem statement. In Section 3, an overview of DNN and LSTM is presented, along with the proposed scheme. In Section 4, the process begins with dataset preparation, followed by the presentation of results obtained from training the models and their deployment. Lastly, Section 5 concludes the article and discusses potential future work.

2. Review on Multirotor UAVs and Problem Definition

In multirotor UAVs, the spinning propellers play a crucial role in generating forces and moments that impact the system dynamics. The configuration of a multirotor UAV is determined by parameters such as the position, orientation, and number of propulsion systems [24]. Throughout this article, the term “actuator” is used interchangeably to refer to the propulsion system, particularly the motor and propeller components. In this section, we present the dynamic model of multirotor UAVs, and we consider the influence of actuator failure on the system dynamics. Furthermore, the final section outlines the specific problem addressed in this research work.

2.1. Multirotor UAV Dynamic Model

In Figure 2b, the arrangement of the propulsion system and the co-ordinate reference information for the investigated UAV is depicted. The Hexadecarotor structure is simplified as a multirotor UAV with eight symmetrically arranged arms, with each arm containing two coaxially arranged propellers (Figure 2a). To develop a mathematical model considering the UAV’s flight environment and motion complexity, certain assumptions are made. These assumptions include treating the centroid as the UAV’s center, considering it to be a rigid body without deformations or flexibility during flight, neglecting air resistance effects for low-speed flight scenarios, and disregarding the gyroscopic effect resulting from propeller rotation in the model [25].
The dynamic model of a UAV can be defined using two reference frames: the body frame F b , which is affixed to the UAV and moves with it, and the inertial frame, F i , which is fixed in space.
The UAV, being a rigid body with six degrees of freedom, utilizes sensors such as inertial measurement units (IMUs) to capture its state. The IMU provides measurements of the UAV’s angular velocity ( ξ b ) in the body frame F b and linear acceleration ( v ˙ ) in the inertial frame F i . The orientation and translational motion of the UAV can be described as follows:
v ˙ ξ b ˙ = 1 m R B I f f g I 1 ( τ ξ b × I ξ b
where τ represents the input torque applied through the rotational speed differential of the propellers, the total thrust force generated by the propellers is denoted as f , and f g represents the gravitational force acting on the UAV. The UAV’s inertial matrix is denoted as I , and R B I represents a rotation matrix used to transform a vector from the body frame of reference to the inertial frame of reference. Further details on Appendix A.
In multirotor UAVs, motion in space is achieved through the principle of differential thrust. This principle involves systematically increasing the speed of the rotors on one side while decreasing the speed of those on the other side, allowing the UAV to tilt and initiate a turn. The thrust f i generated by the ith propeller spinning at a rotational speed ω i , assuming a flat arrangement in the body frame, can be expressed as follows:
f i = 0 0 k i ω i 2 T
where k is a thrust coefficient related to the propellers’ parameters.
For i = 1, 2,… n, where n represents the number of propellers (in this case, n = 16), and the total thrust force f   ϵ   R 3 x n can be described by its components in the x, y, and z axes of the F b as follows:
f = f x f y f z T = i = 1 16 f i
The torque τ   ϵ   R 3 x n can be calculated as the sum of individual propeller torque contributions. It can be expressed as the cross product of the position vector L i of the ith propeller with respect to F b and the force generated by the ith propeller.
τ = τ ϕ τ θ τ ψ T = i = 1 16 L i × f i + τ d i
Each propeller’s position vector, which is denoted as L i , is determined by the arm length l i . These position vectors are arranged in a manner that influences the angular dynamics of the UAV, as characterized by the angle θ i . The specific expression for the propeller position vector L i can be given as follows:
L i = l i x l i y l i z T = cos θ i sin θ i 0 l i
where the reaction torque generated by the air resistance around the propeller, considering a constant drag coefficient k d defined by the propeller’s geometry characteristics, can be expressed as:
τ d i = k d ω i 2
By combining Equations (2)–(6), the generalized force and moment U produced by the system in the F b can be expressed as:
U = U 1 U 2 U 3 U 4 = f z τ ϕ τ θ τ ψ = k t 1 1 1 1 l x 1 l x k l x k + 1 l x n l y 1 l y k l y k + 1 l y n c c c c   ω 1 2 ω k 2 ω k + 1 2 ω n 2
where: c = k d / k t
The Equation (7) can be rewritten in terms of effectiveness matrix B as
U = B l i , θ i ω 2
However, for control tasks, an inertial co-ordinate system is utilized, necessitating the transformation of the UAV’s state to the F i of reference. This conversion is accomplished using Euler angles, which describe the rotation of the body-fixed frame in relation to the Earth-fixed frame. The process involves a sequence of rotations, which start at the yaw ( ψ ), which rotates about the z-axis of the inertial frame F i and results in a new co-ordinate frame F i 1 ; followed by the pitch ( θ ), which rotates about the y-axis of the new coordinate frame F i 1 and yields another transformed co-ordinate frame F i 2 ; and, finally, the roll ( ϕ ) , which rotates about the x-axis of the new co-ordinate frame F i 2 , ultimately leading to the F i 3 co-ordinate frame being equivalent to the body frame F b . By applying these sequential rotations, the UAV’s state can be effectively transferred from the body-fixed frame to the inertial frame, allowing easier control and co-ordination of the UAV’s motion with respect to the Earth [26]. For Euler angles given as
ξ = ϕ     θ     ψ T
whereas from Equation (9), the transformed Euler angle rate in F i given that the transformation matrix r b i becomes
ξ ˙ = r b i ξ b ˙
r b i = 1 sin ϕ tan θ cos ϕ tan θ 0 cos ϕ sin ϕ 0 sin ϕ cos θ cos ϕ cos θ
By transforming and expanding Equation (1), the generalized multirotor dynamic model can be summarized as follows:
x ˙ = v x y ˙ = v y z ˙ = v z v ˙ x = cos ψ sin θ cos ϕ + sin ψ sin ϕ U 1 m v ˙ y = cos ϕ sin θ sin ψ cos ψ sin ϕ U 1 m v ˙ z = g o + cos θ cos ϕ U 1 m ϕ ˙ = p + r tan θ cos ϕ + q tan θ sin ϕ θ ˙ = q cos ϕ r sin ϕ ψ ˙ = r cos ϕ cos θ + q sin ϕ cos θ ϕ ¨ = I y I z I x q r + U 2 m θ ¨ = I z I x I y p r + U 3 m ψ ¨ = I x I y I z q r + U 4 m
where I x , I y , and I z represent the moment of inertia along the x, y, and z directions, respectively, and ξ b = p ,   q ,   r is the angular velocity of the UAV in F b .

2.2. Effect of Actuator Failure on System Dynamics

In a multirotor UAV, actuator failure has a significant impact on control authority, resulting in reduced maneuverability and responsiveness. This problem is due to the imbalance of forces caused by the loss of effectiveness or complete stoppage of the affected actuators. This study assumes that the actuator experiences complete failure, which refers to the total loss of functionality. Other potential failure modes, such as effectiveness loss, which involves reduced performance, and intermittent failure, which is characterized by inconsistent behavior, are not considered in this study. The unexpected degradation in the UAV’s flight behavior is evident through transient deviations in the vehicle’s attitude from the desired attitude. Under normal conditions with all actuators functioning properly, the UAV closely follows the desired attitude, leading to residuals approaching zero. However, when there is a deviation in the vehicle state from the desired value, signed residuals arise, which can be quantified by calculating the difference between the reference attitude and the measured attitude of the UAV, as described in equation [17]:
ϕ r = ϕ d ϕ
θ r = θ d θ
The position of a failed actuator within the vehicle configuration has a significant influence on the force and moment generated, consequently affecting the magnitude and sign of the attitude residual, as described in Equations (13) and (14). This process can be observed by modifying the effectiveness matrix B in Equation (8). By removing the failed actuator from the system dynamics, the modified effectiveness matrix accurately accounts for the absence of the failed actuator and its impact on the overall dynamics of the system.
B f = B × d i a g ¬ f
where B f R 3 x n n f is effectiveness matrix resulting from the n f actuators being failed, and f Boolean vectors are the output of the FDI unit that indicate embedded information about the failed actuators.
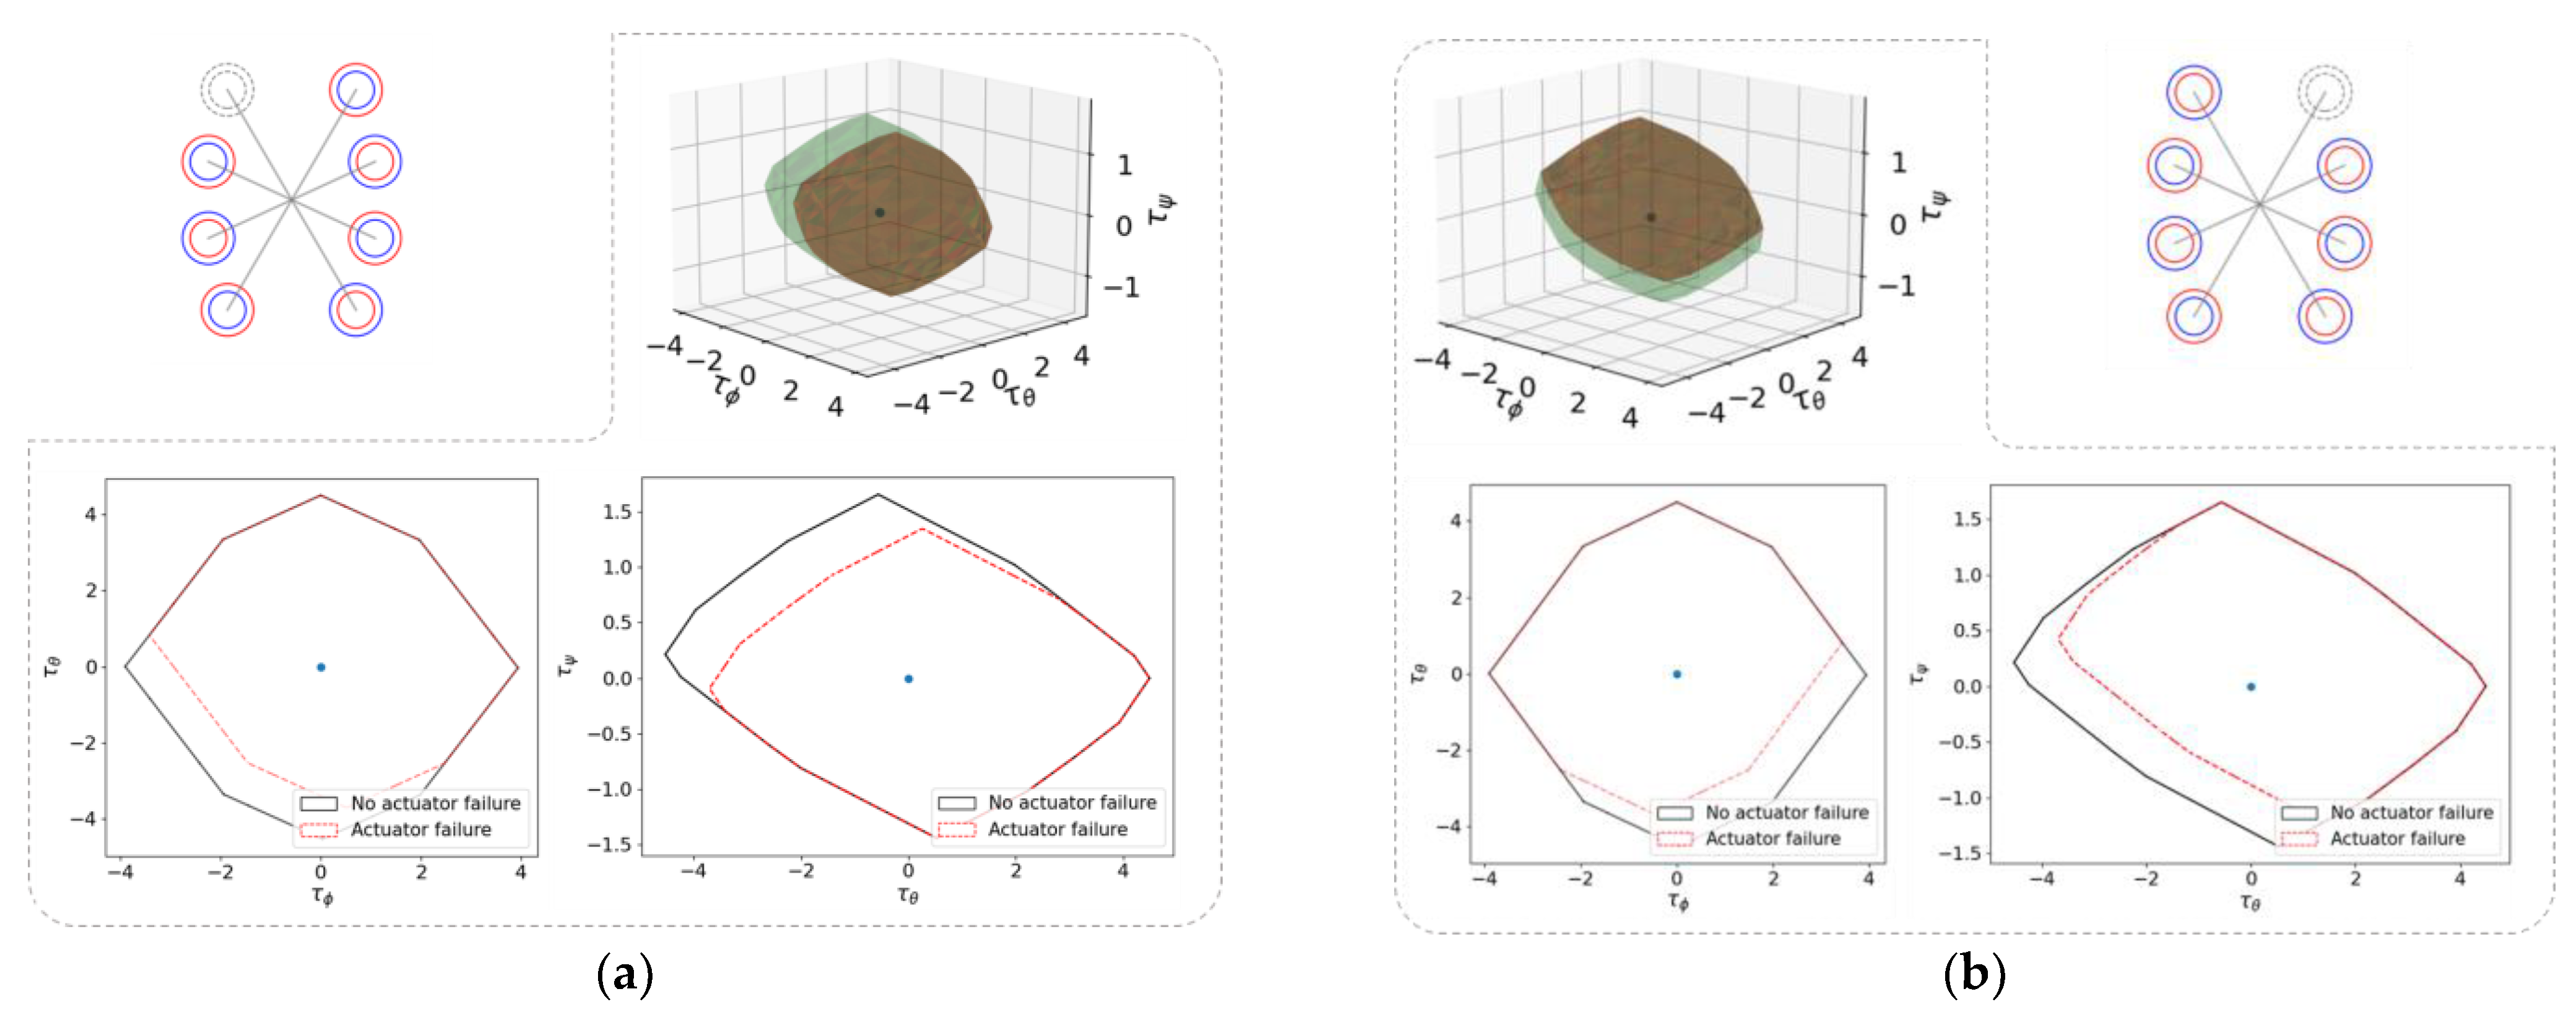
Figure 3 illustrates the impact of the failed actuator’s position on the attainable force and moment using the Attainable Moment Set (AMS) method. The AMS method is a powerful tool for understanding a system’s control authority [24]. It imposes constraints on the maximum attainable time derivative of states, such as accelerations, which, in turn, limits maneuverability, trajectory agility, and disturbance rejection capabilities. Consequently, this tool visually indicates the direction in which the control authority weakens because of actuator failure. Therefore, to uncover and locate rotor malfunctions, it is essential to investigate and comprehend the temporal pattern of the residual’s magnitude and sign.
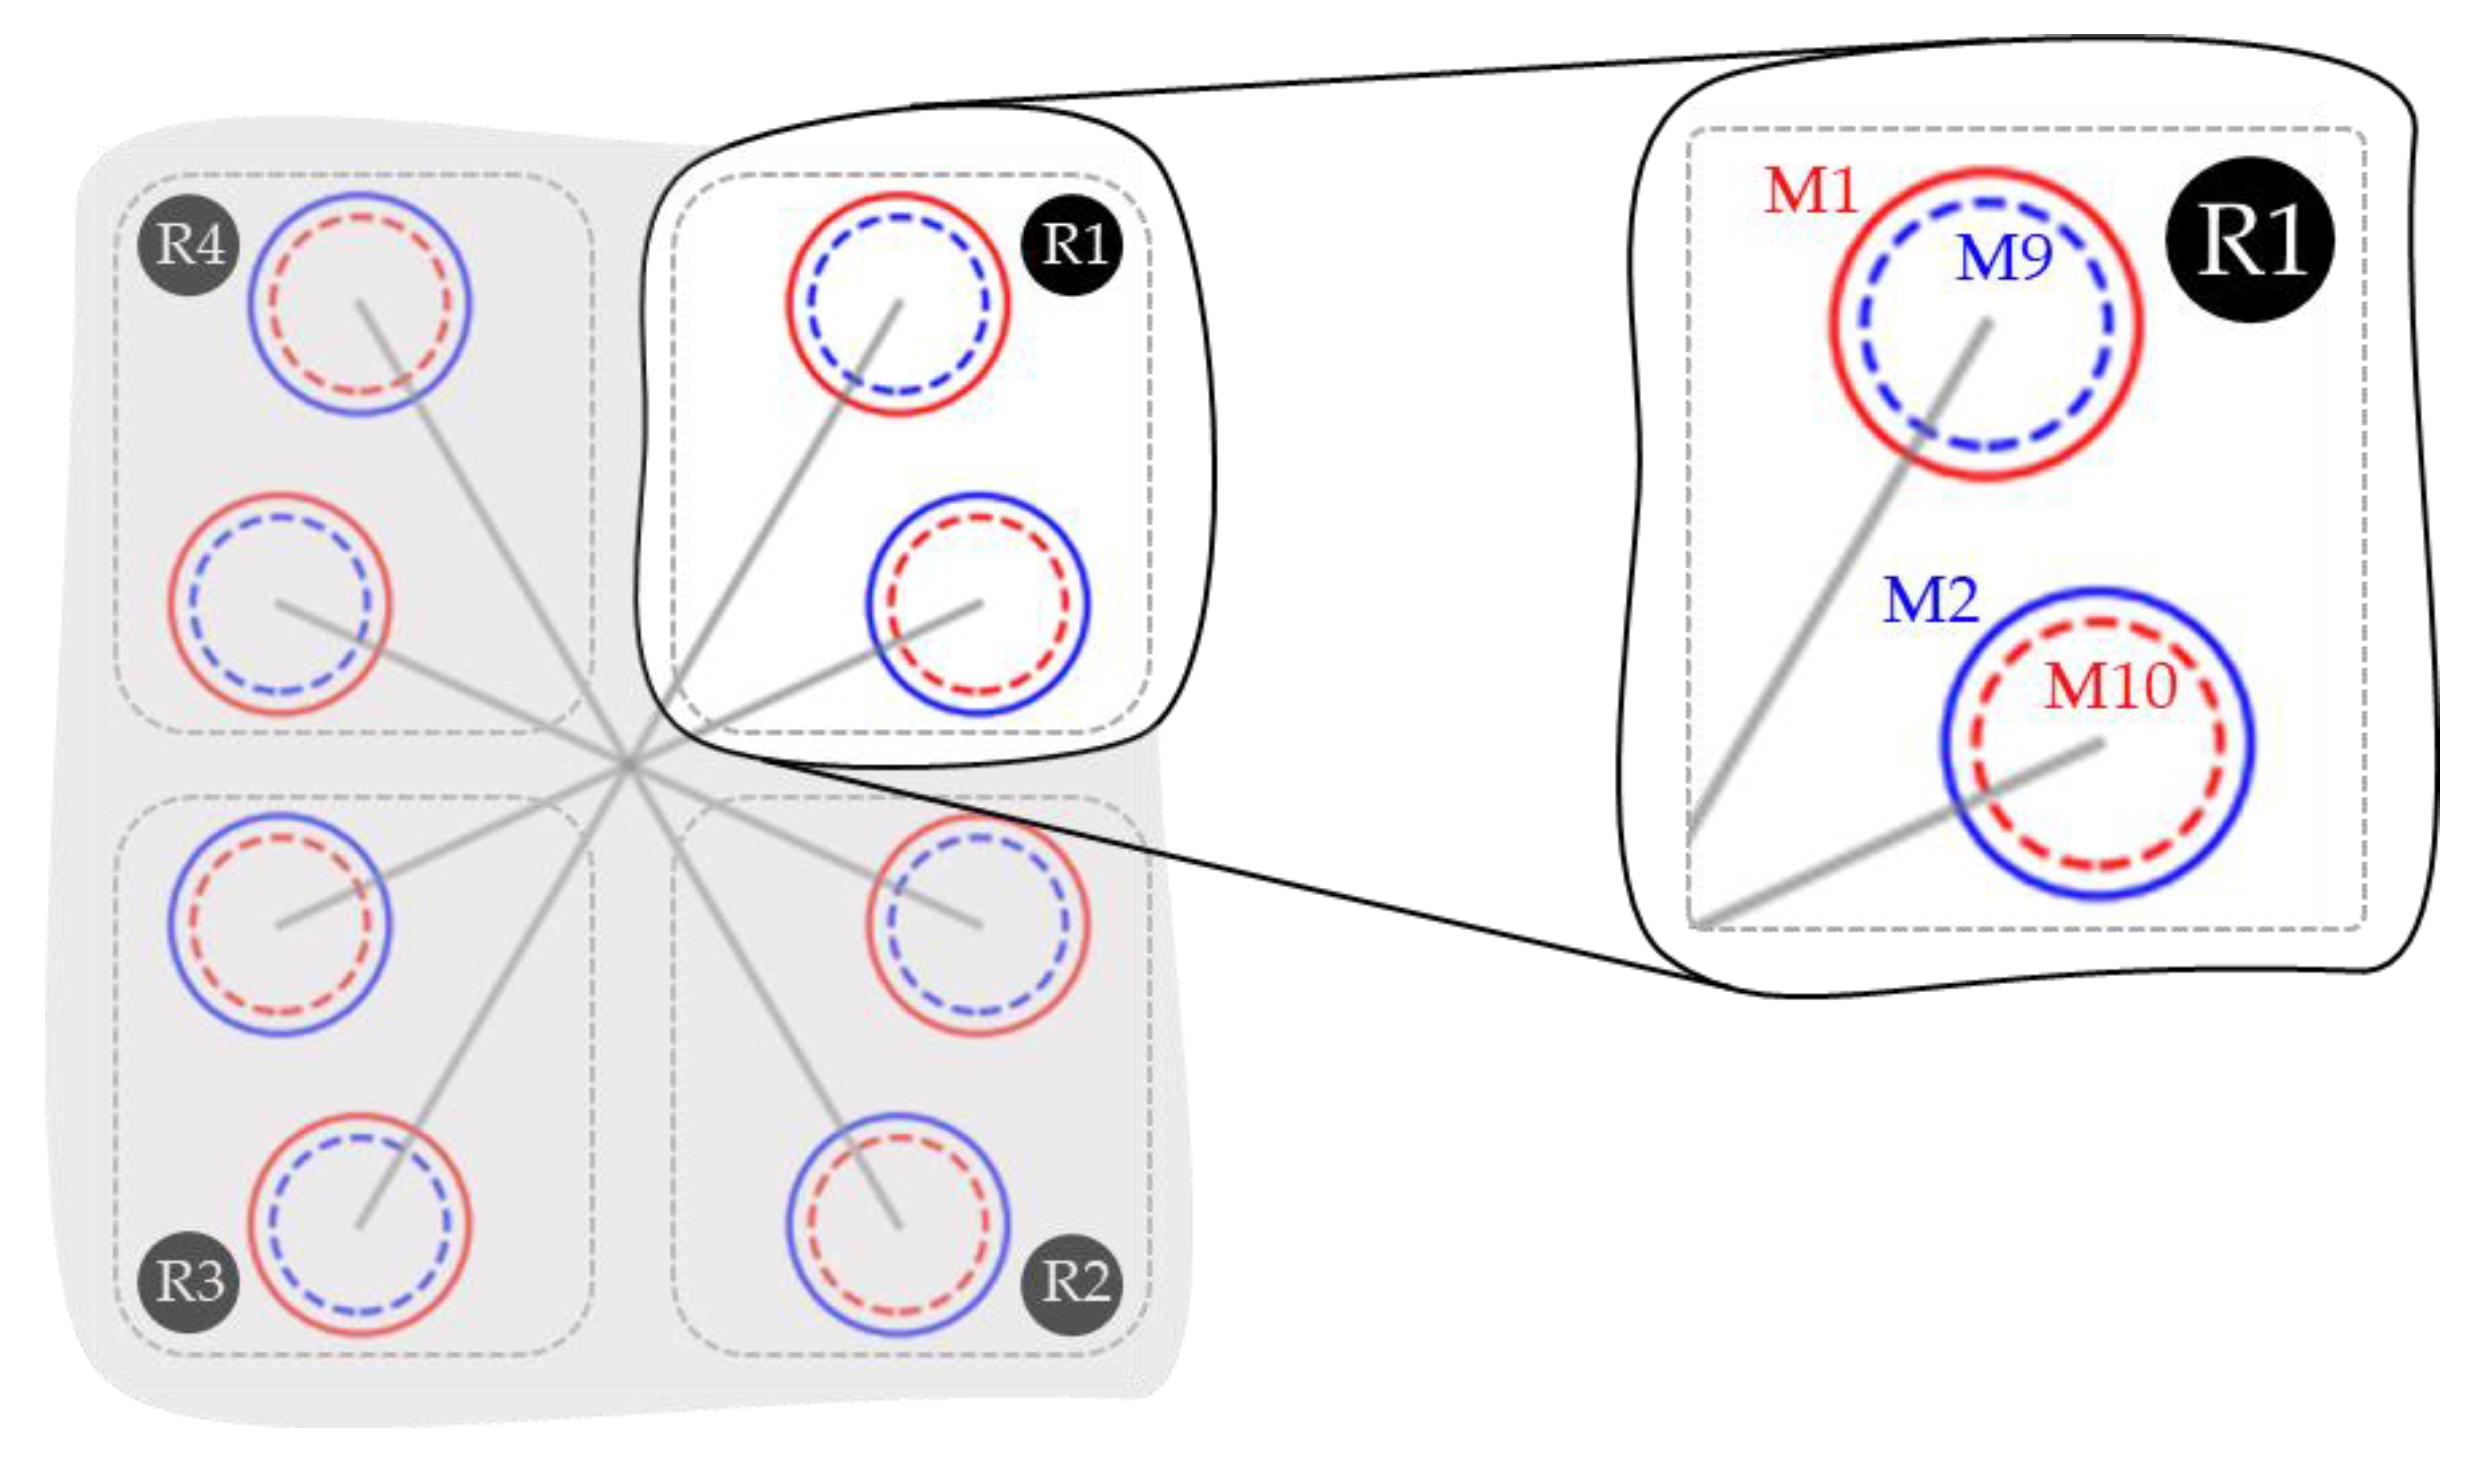
Through our investigations into the impact of an actuator’s position and orientations on system dynamics, we developed a partitioning approach to analyze multirotor layouts. This approach divides the layouts into four regions, which are characterized by their residual sign pattern. By grouping actuators within each region, we observed that the failure of any individual actuator within that region consistently produces an identical attitude residual sign. Thus, this regional categorization of the system’s actuators is both reasonable and valid. Table 1 provides a comprehensive summary of the sign patterns of failures for various multirotor layouts, further validating the effectiveness of our analysis method.
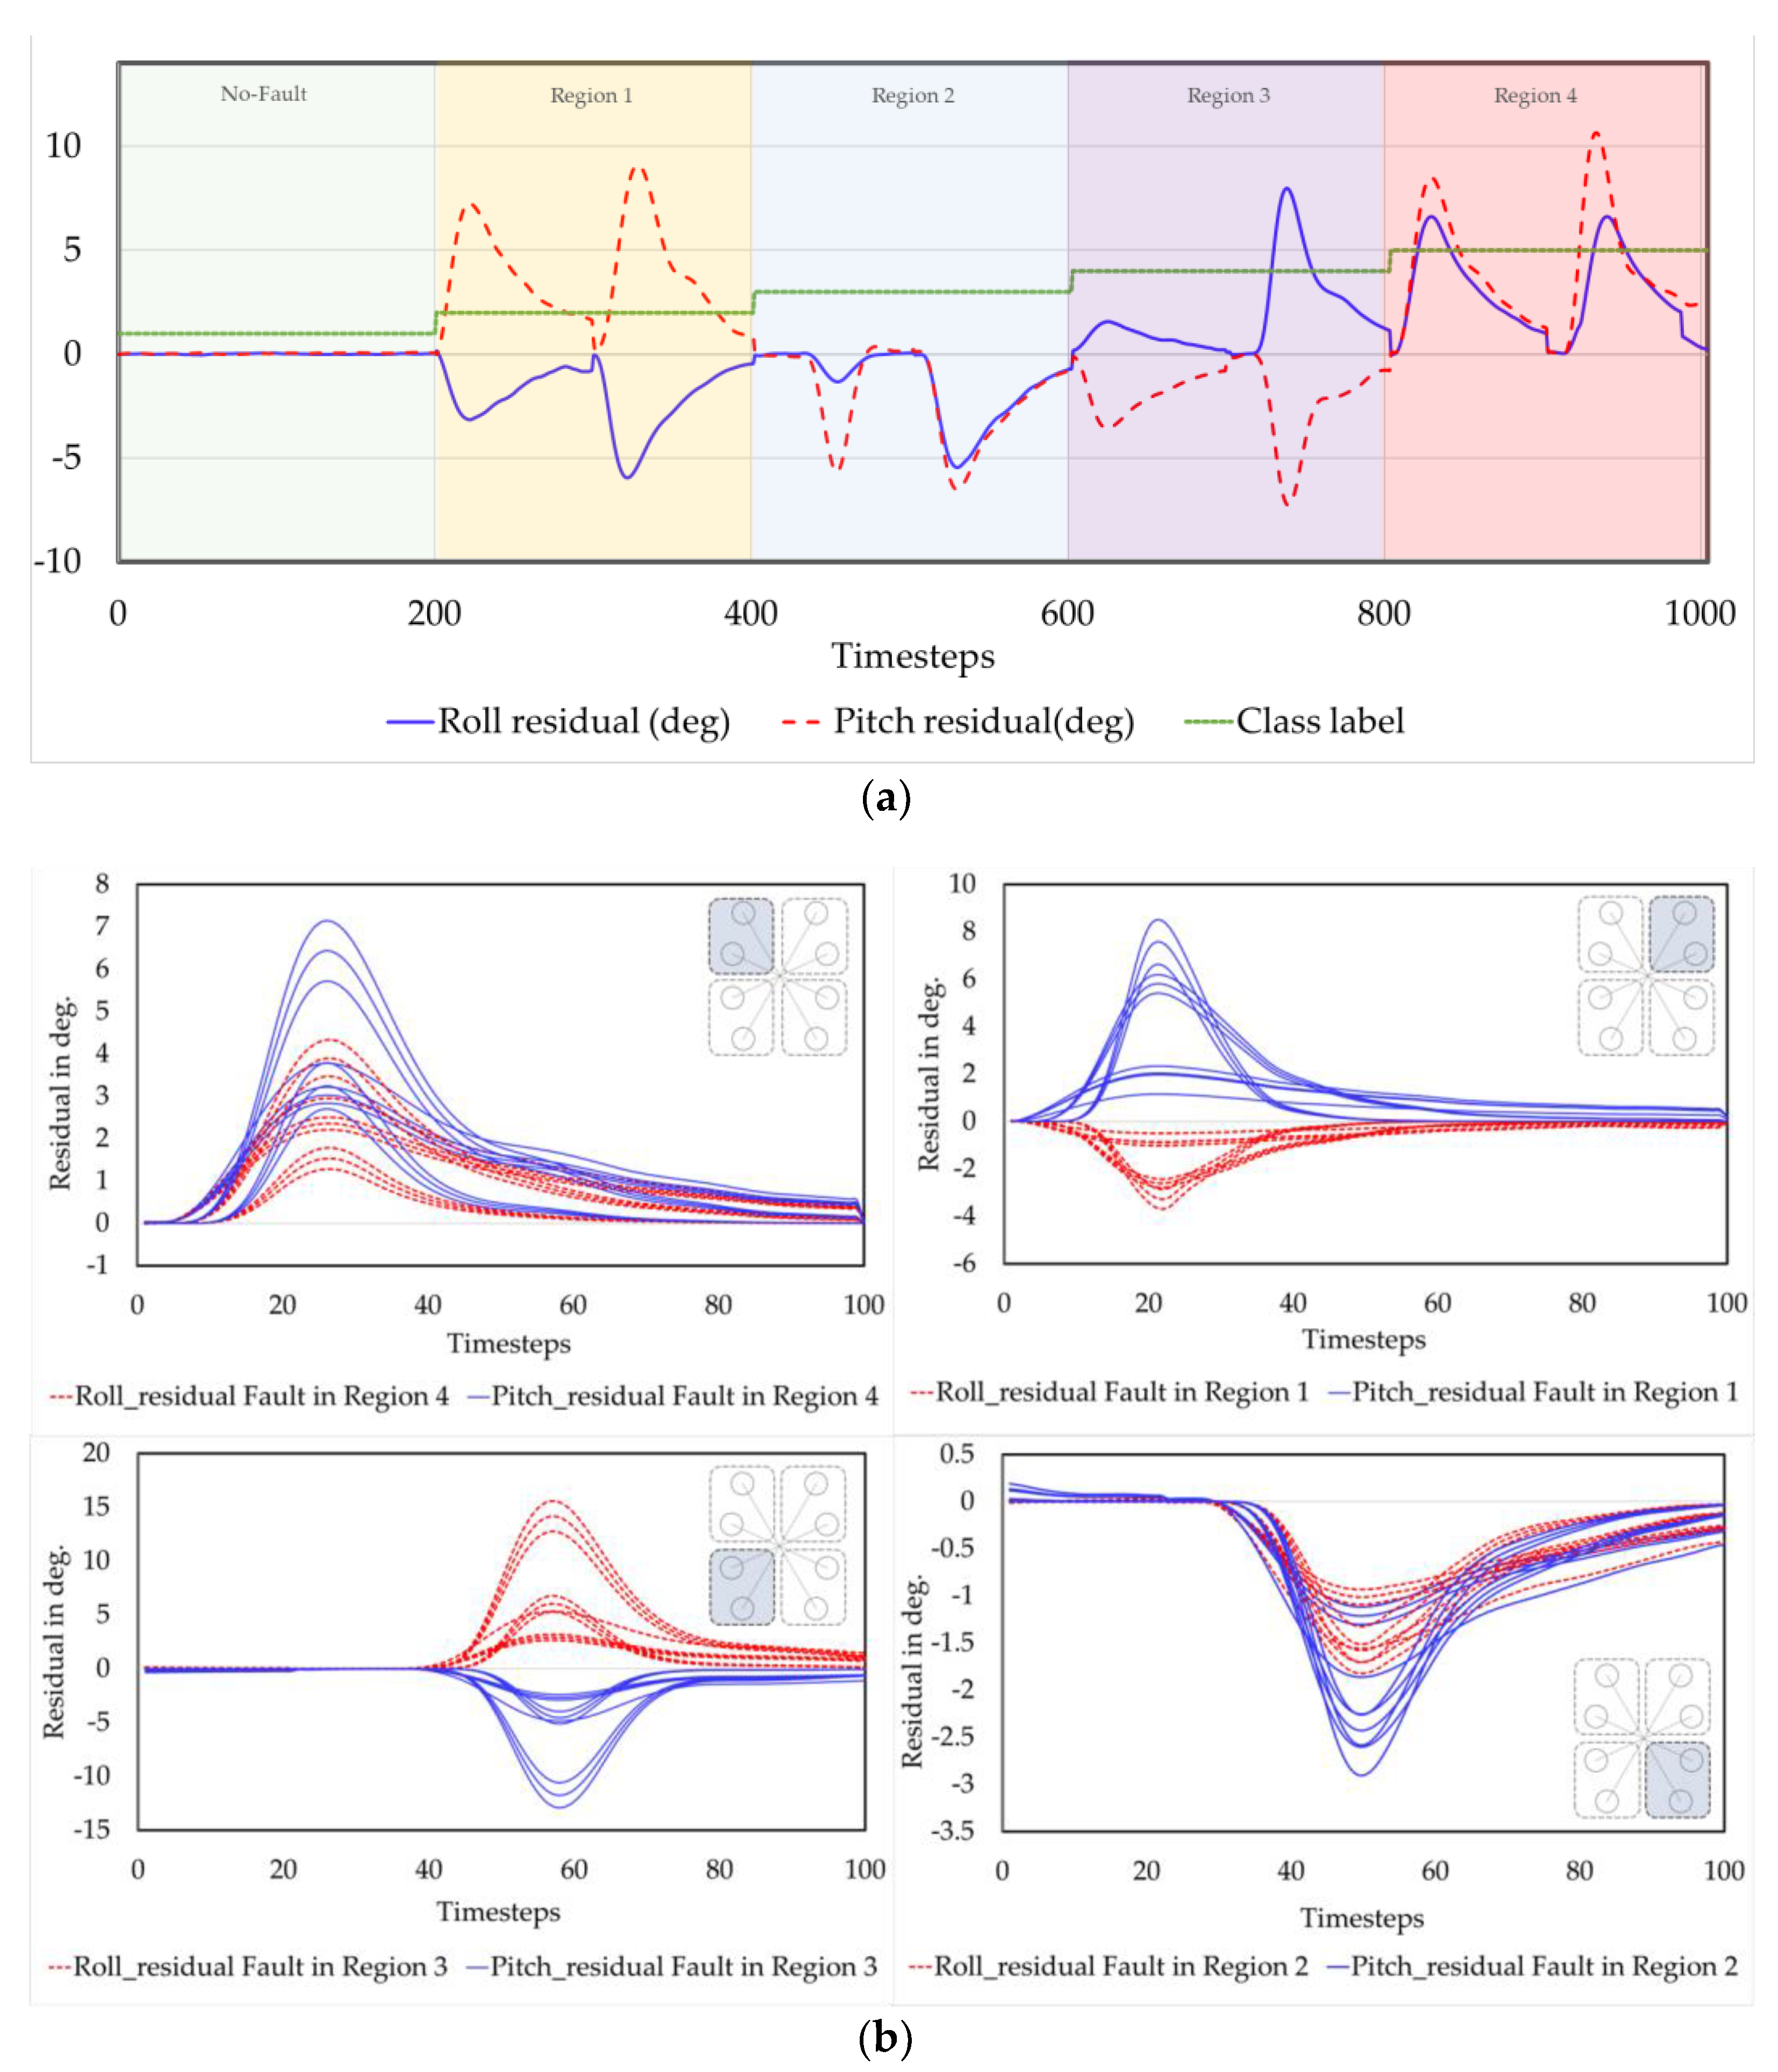
In this work, we conducted a case study on the MOBIDICK hexadecarotor multirotor UAV, which was designed by PNU Drone Co., Ltd, South Korea. This UAV is equipped with sixteen (16) motors, with eight motors located at the top and the remaining eight motors located at the bottom. The numbering of the top motors begins from the front right as motor 1 and continues up to the front left as motor 8. On the other hand, the numbering of the bottom motors starts from the front right as motor 9 and extends to the front left as motor 16. According to proposed partitioning approach , as depicted in Figure 4, we categorized the actuators into four regions. Specifically, Region-1 comprises Motor 1, Motor 2, Motor 9, and Motor 10; Region-2 includes Motor 3, Motor 4, Motor 11, and Motor 12; Region-3 consists of Motor 5, Motor 6, Motor 13, and Motor 14; and Region-4 encompasses Motor 7, Motor 8, Motor 15, and Motor 16. Notably, within each region, every actuator failure results in the same sign of roll and pitch residual.
With the understanding of the regional partitioning approach and its application to the detection and isolation faulty actuators in multirotor UAVs, it becomes relatively simple to identify the faulty region in configurations with a smaller number of actuators, such as the hexadecarotor. This result can be achieved by analyzing the combination of roll and pitch residual signs. However, as the number of actuators increases, the task of detecting and isolating faulty actuators becomes more challenging. In complex scenarios, such as the hexadecarotor configuration where each region has four actuators with the same sign of residuals, a more effective method is required to accurately locate malfunctioning actuators. This context necessitates the development of a method that can extract and comprehend the intricate pattern of residuals, allowing differentiation and isolation of the failed actuator. Figure 5 illustrates the complexity of this identification process.
In this study, we propose the utilization of DNN-based fault detection and isolation techniques to address the challenges in detecting and isolating faulty actuators in highly redundant multirotor UAVs. By employing DNNs and LSTM networks, we aim to enhance fault detection and isolation methods specifically tailored to these complex UAV configurations. This research contributes significantly to the field by leveraging DNNs and LSTM networks to effectively capture fine features that are unique to highly redundant multirotor UAVs. The findings of this study offer valuable insights for the development of advanced FDI systems in autonomous aerial systems, leading to improved performance and operational integrity.

3. LSTM and LSTM-Based Actuator Fault Detection and Isolation Scheme

3.1. Overview of LSTM

A neural network in artificial intelligence is a network of interconnected nodes, which are commonly referred to as artificial neurons, organized in layers where each node receives input signals, performs a mathematical computation on those inputs, and produces an output signal. These output signals are then passed through the network, with each layer processing and transforming the information until the final output is generated. These involve a method of learning weights using a training set, and the results are confirmed with a test set. Throughout the training process, the parameters, or weights, of the neural network are adjusted to extract features that are meaningful for real-world application.
A type of ANN known as DNN is a sophisticated model that consists of multiple hidden layers between the input and output layers, with each layer performing non-linear operations. The increased depth allows DNNs to capture complex relationships and functions that might be difficult for shallow networks to grasp.
There are several types of DNN, with each type designed to for specific problem and data structures. Among them, RNN are designed to handle sequential data by introducing feedback connections that allow information to be preserved over time, in addition to feature variation. However, RNN usually fails when learning long-term temporal dependencies of time series due to the vanishing and exploding gradient problems. Consequently, the Long–Short Term Memory (LSTM) network, which is the other type of RNN, is designed to prevent the vanishing and exploding gradient problems by employing memory cells. This method allows the LSTM to retain and propagate information over longer time intervals, enabling it to capture and learn dependencies over extended temporal ranges [27].
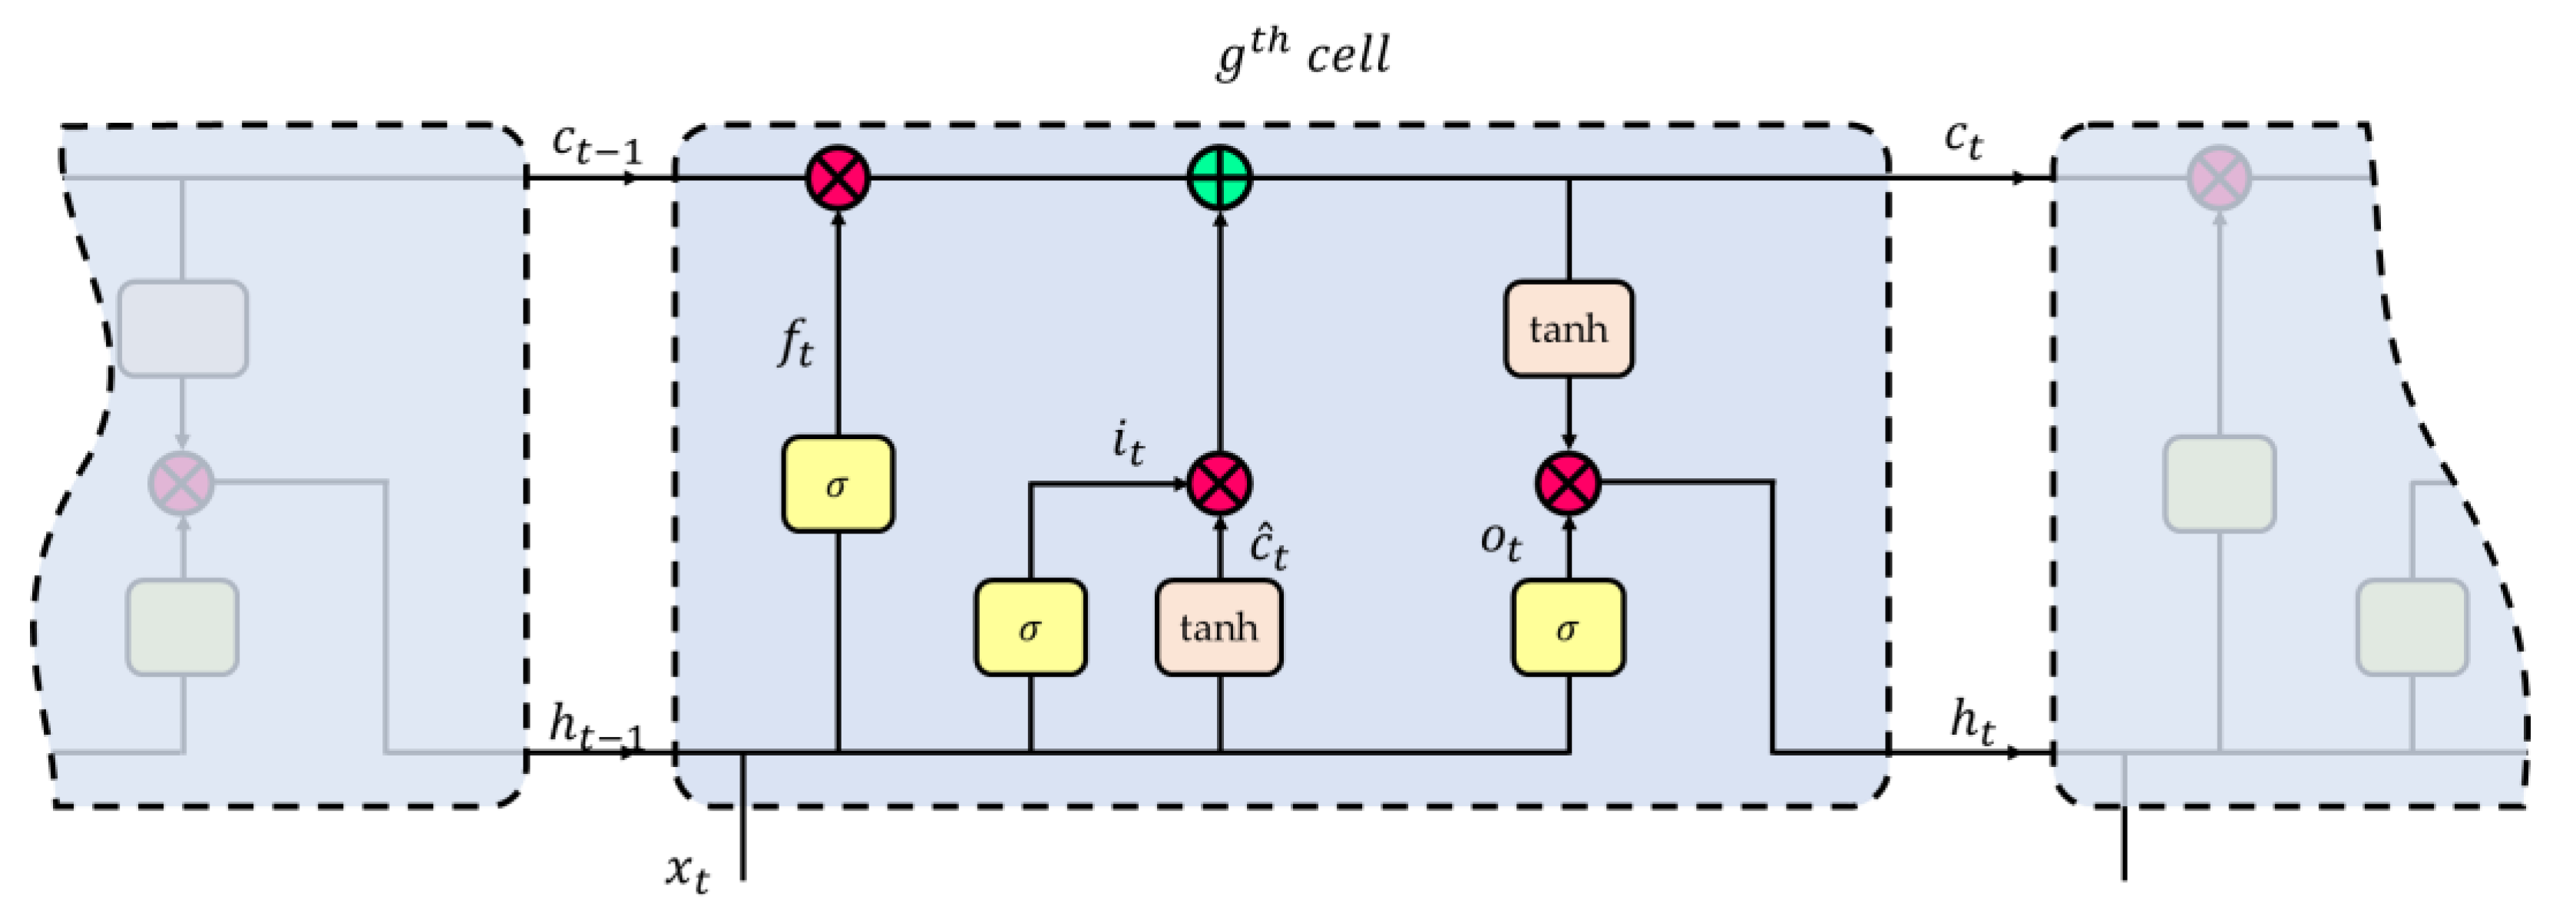
As shown on Figure 6, a single LSTM memory cell is composed of four main components [28]:
(a)
Input gate (i): this feature allows the LSTM to retain important information from previous time steps while discarding irrelevant or redundant information;
(b)
Output gate (o): this feature selectively filters and decides which information is relevant and should be passed on to the next layer or used as the final output;
(c)
Forget gate (f): this feature determines the proportion of the cell state value to be forgotten;
(d)
Cell candidate: this feature is responsible for collecting new information based on the current input and the previous hidden state.
As shown in Equations (15) and (16), each gate is equipped with an activation function and receives two weighted inputs.
The gate values at time t are computed as follows:
i t = σ w i , i × X t + w r , i × h t 1 + b i
f t = σ w i , f × X t + w r , f × h t 1 + b f
o t = σ w i , o × X t + w r , o × h t 1 + b o
c ^ t = t a n h w i , c × X t + w r , c × h t 1 + b c
where X t is the current input feature at the timestamp t, h t 1 is the previous hidden state, and w r , w i , and b are the recurrent weights, input weights, and biases, respectively.
The activation function is a smooth non-linear function that defines the output of the neuron based on an input or a set of inputs. Hyperbolic Tangent (tanh) and sigmoid functions are activation functions used for the LSTM structure, which is given as:
σ x = 1 1 + e x
t a n h x = e x e x e x + e x
The memory cell state c t and the LSTM hidden state h t are updated as follows:
c t = c t 1 f t + c ^ t i t
h t = o t tanh ( c t )
where c t 1 represents the previous memory cell state value, the operation × is matrix vector multiplication, and the operation ⊗ is the Element–Wise product [28,29,30,31].

3.2. Proposed LSTM Based Actuator Fault Detection and Isolation Approach

3.2.1. Overview of Proposed FDI System

As highlighted in Section 1, the FDI system addresses the crucial challenge of timely and accurate detection of faults in multirotor UAVs. The development of computationally efficient techniques with high levels of prediction accuracy and precision is paramount in enhancing the safety and reliability of these UAVs.
One of the main contributions of this study is the development of a DNN-based FDI approach that utilizes LSTM layers. This novel method aims to capture and analyze the temporal patterns exhibited in the attitude state of highly redundant multirotor UAVs in the event of actuator failure.
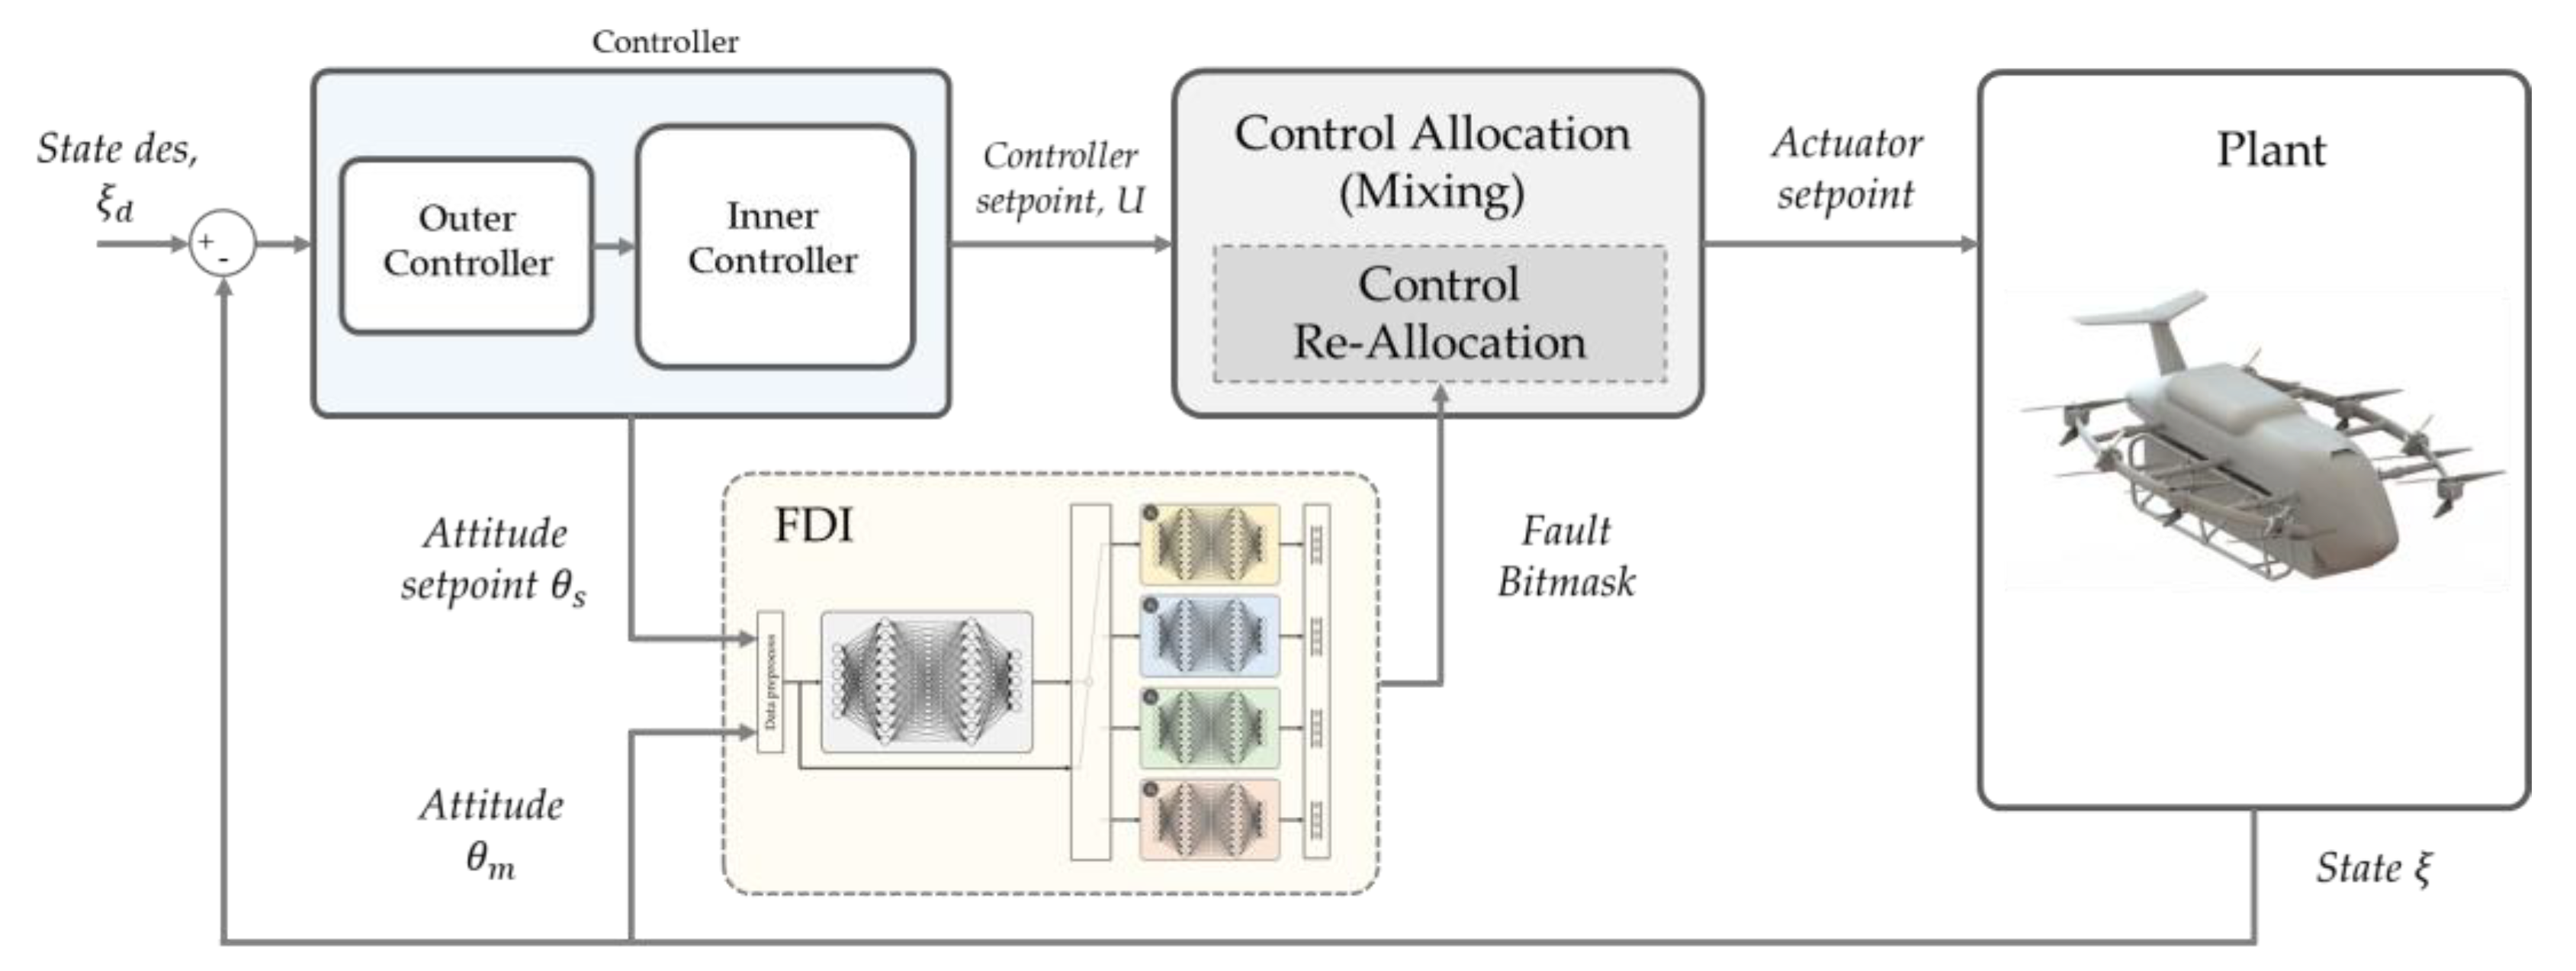
In the top-level view presented in Figure 7, the integration of the proposed system into the UAV flight management system is depicted. The proposed scheme receives the attitude setpoint ( θ s ) from the attitude controller and the measured attitude ( θ m ) from sensor. Based on this input, the system processes the data and generates an array of Boolean values f that indicate the ID of the failed actuator (see Equation (15) in Section 2). When a fault is detected in the system, the corresponding entry in the output array is set to 1, indicating the failed actuator. The remaining entries in the array are maintained as zero, representing the normal functioning actuators. For example, if motor 3 fails, the array would be represented as [0, 0, 0, 0, 0, 0, 0, 0, 0, 0, 0, 0, 0, 1, 0, 0]. This precise actuator identification allows seamless integration into fault-tolerant system schemes, enhancing the overall resilience and dependability of the multirotor UAVs.
The subsequent sections provide a low-level description of our proposed scheme, offering a detailed explanation of how this result is achieved.

3.2.2. Architecture of Proposed LSTM Based Models for Faulted Region Detection and Fault Classification

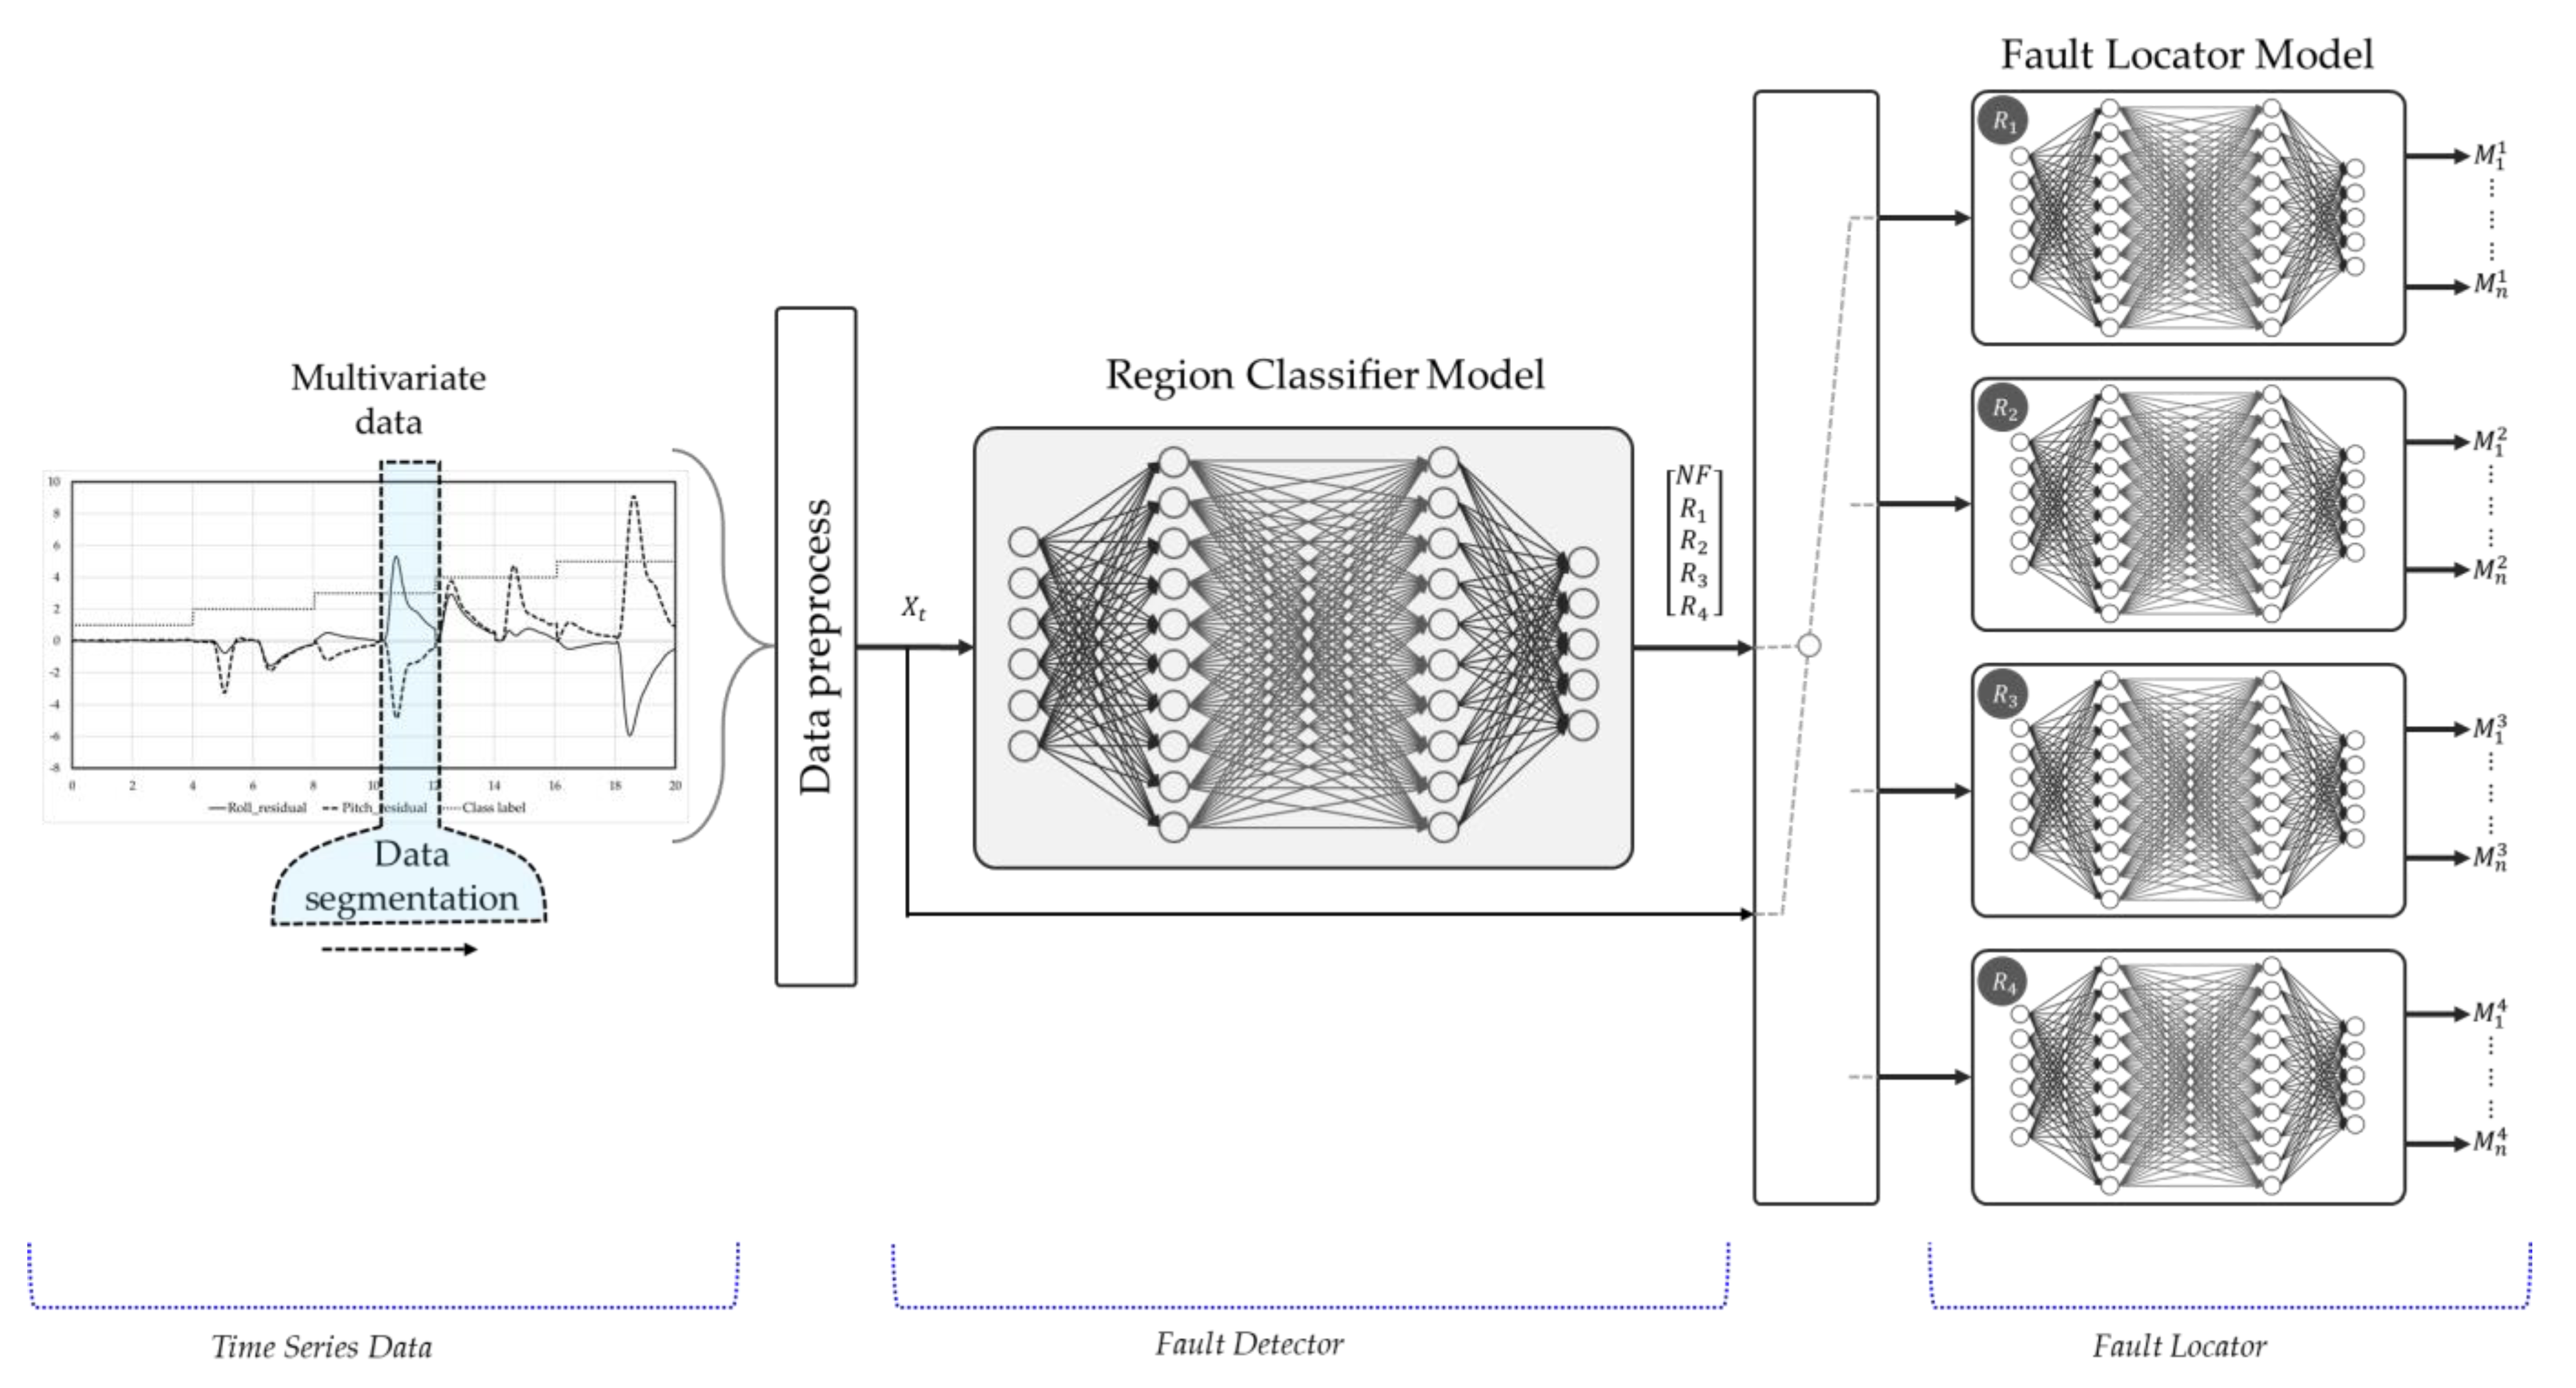
The proposed scheme consists of separate units, namely the fault detector and the fault locator units, which are designed to work together in identifying and precisely locating the failed motor in the system, as illustrated in Figure 8. This framework aims to address the challenges associated with misclassification of classes that have limited variation. By separating the detection and localization tasks, we can effectively mitigate the complexities involved, including increased training time, decreased performance, imbalanced data, and challenges in interpretation. This approach allows improved accuracy and efficiency in detecting and localizing faults in multirotor UAVs.
The proposed scheme consists of five independent DNN models that work together in a coordinated manner to detect and locate faulty actuators within the system. These models include a Region Classifier Model (RCM) as the fault detector unit and four Fault Locator Models (FLM) as the fault locator unit. The RCM is responsible for detecting and identifying the region that contains the faulty actuator, while the FLMs pinpoint the specific failed motor within the identified region.
The RCM utilizes the roll and pitch residuals, along with their rates, as inputs for classifying the faulty region. The model detects and identifies the region of failure by analyzing the sign pattern of these residuals, which simplifies the identification and differentiation of the faulty region from the healthy condition and disturbance. However, distinguishing the exact faulty motor within the same region is a more complex task. Subtle differences between the motors and the presence of disturbances and noise make it challenging for the RCM to handle. To address this complexity, our scheme logically activates each FLM separately for a specific region and does so only after the RCM successfully identifies the region containing the faulty motor. This process ensures that the fault pattern is accurately differentiated from disturbances and noise, leading to reduced computational power requirements and enabling real-time implementation. Therefore, the main role of the RCM is to detect the presence of a fault in the system, while the FLMs focus on precisely locating the source of the fault.
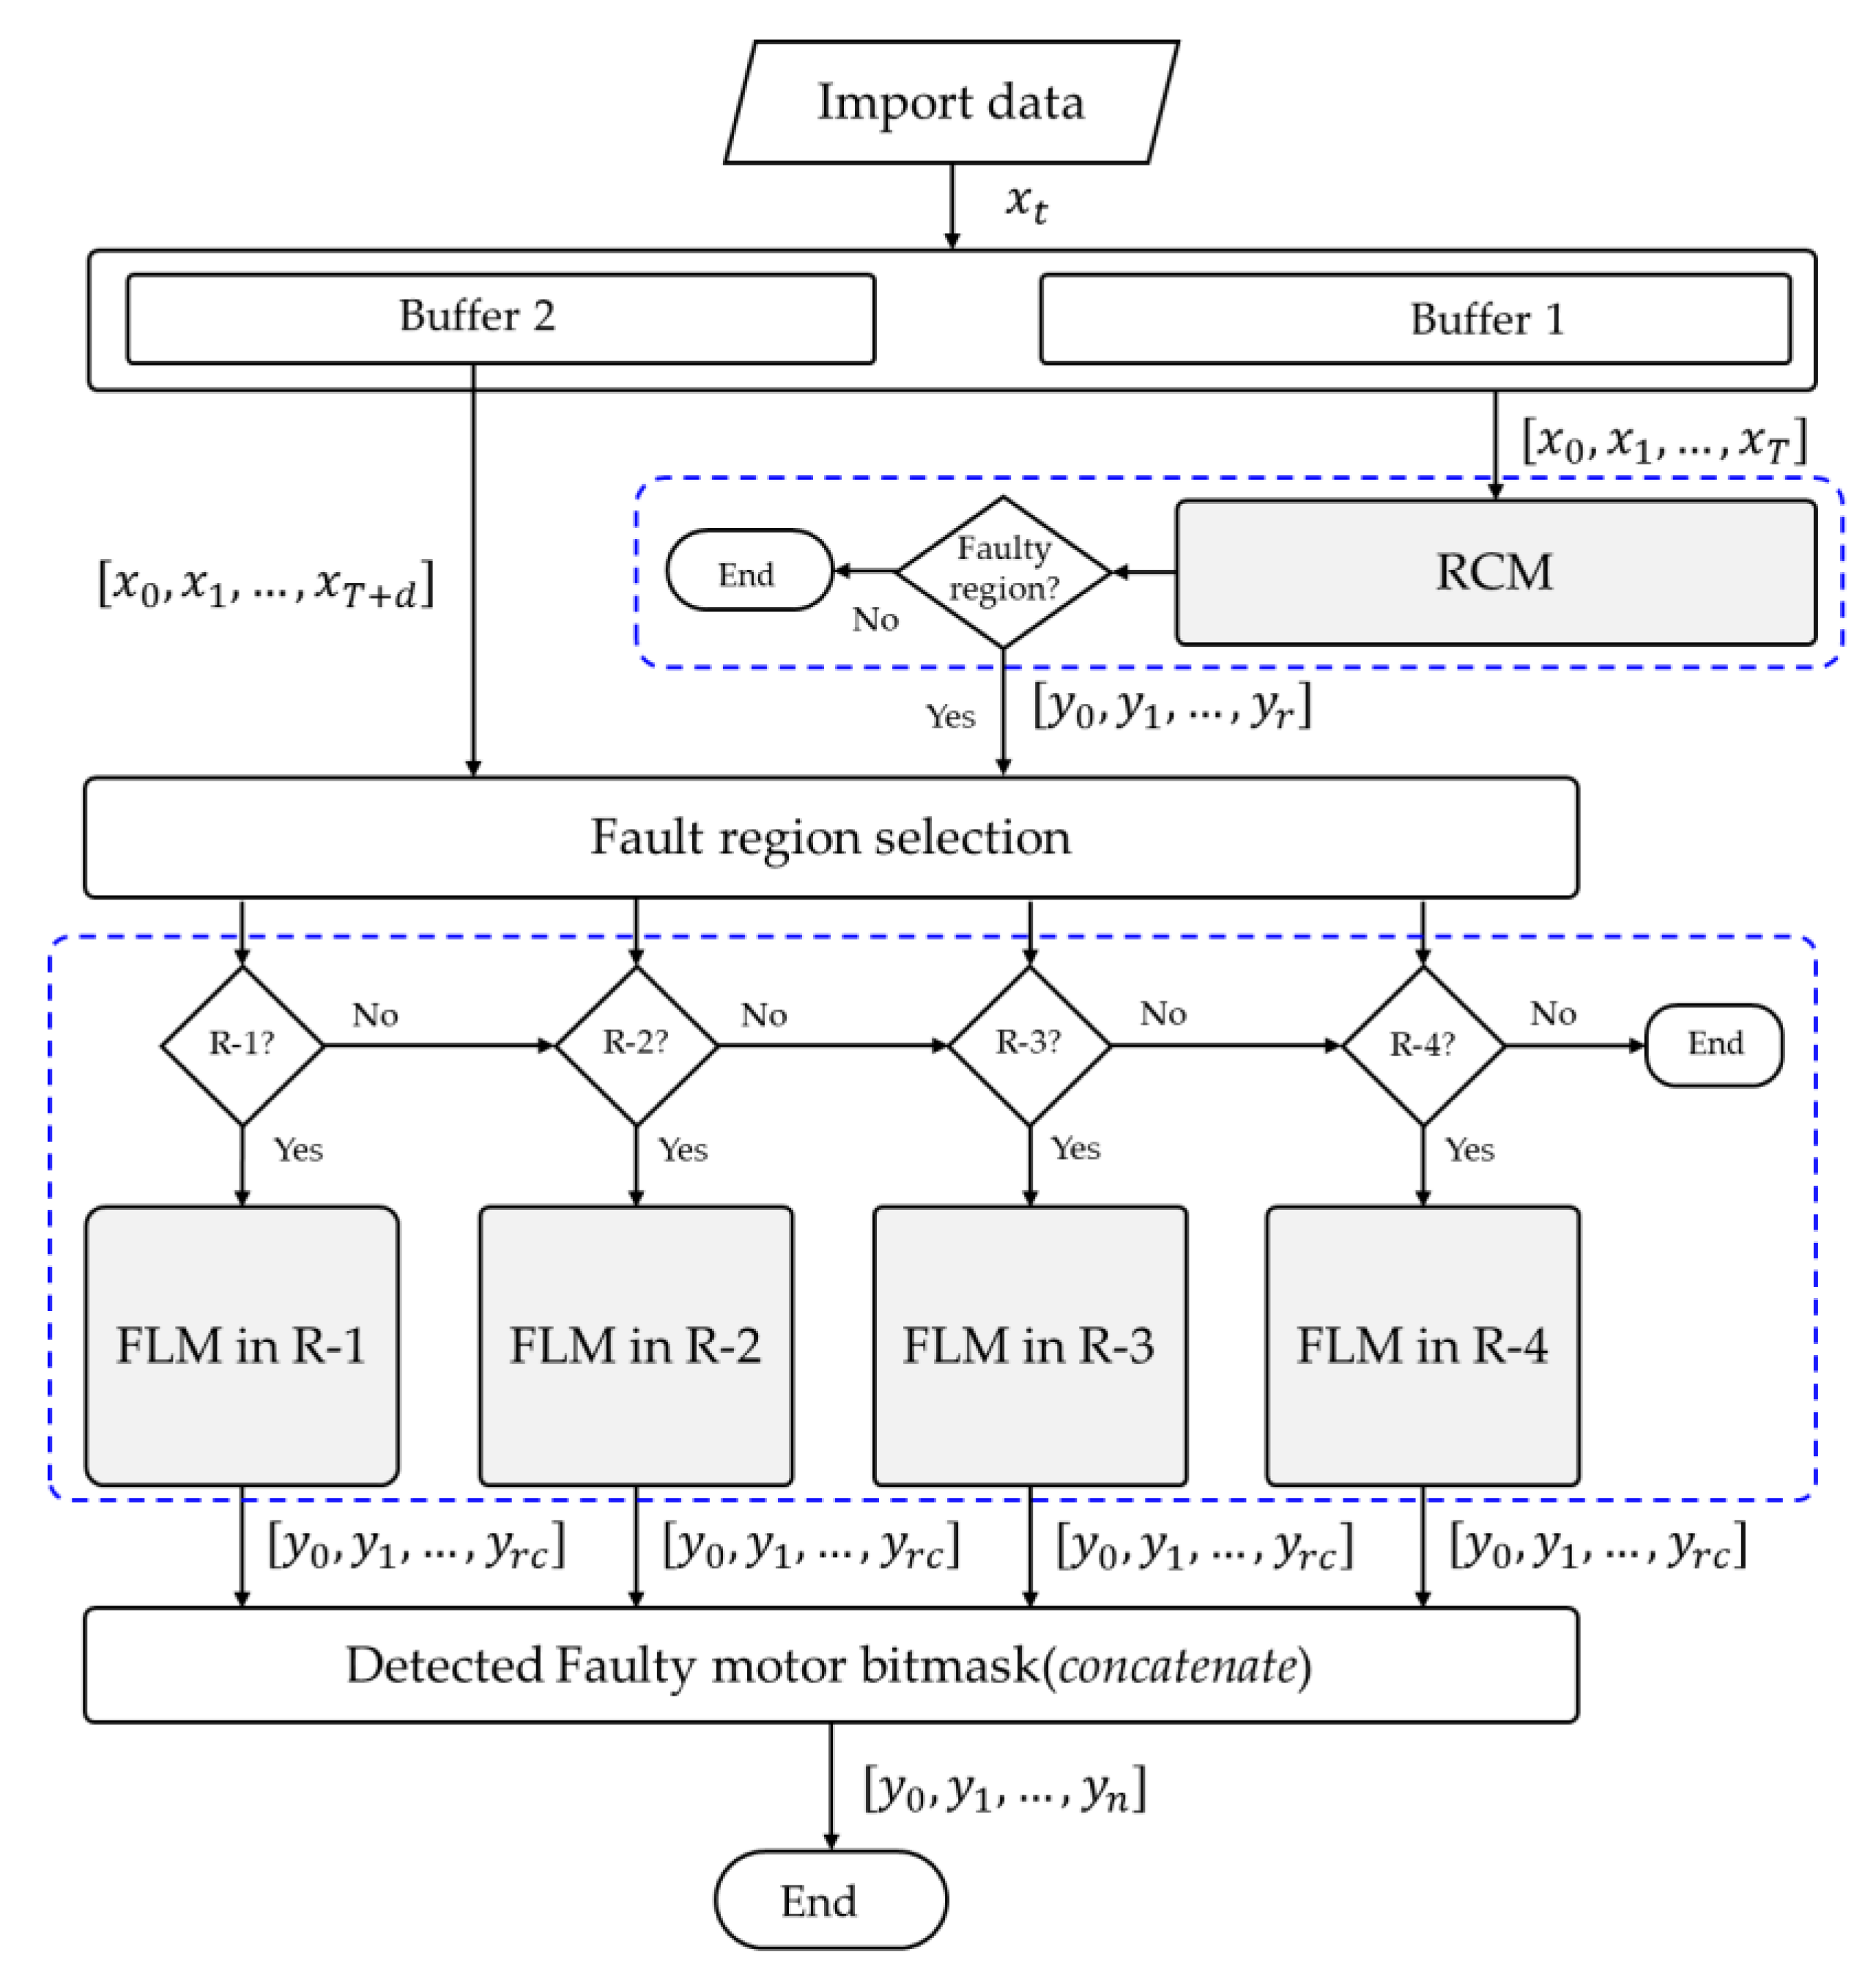
Each of the models in our scheme consists of five layers—Input, Hidden LSTM, LSTM, fully connected, and SoftMax—leading to the output layer. The flowchart in Figure 9 provides an overview of the overall process. In the RCM, the Input layer handles sequential inputs of roll and pitch residuals, along with their corresponding rate residuals. The sensor readings are down-sampled to 50 samples per second, while for time T, 2.6 s result in a sequence of 130 timesteps that captures essential temporal information. Thus, the Input layer becomes ϵ   R 4 × 130 . Similarly, the Input layer of each FLM has six neurons to handle multivariate sequential data of roll, pitch, and yaw residuals with their corresponding rate residuals and sampling time delay d, 0.4 s from RCM window length. Therefore, the sequence x T + d comprises 150 timesteps that form vector dimension ϵ   R 6 × 150 .
The LSTM layer sequentially processes input sequences using multiple LSTM cells. Each cell’s output is passed to the next cell, enabling sequential processing. The final LSTM cell’s output is then fed into a dense layer and the SoftMax activation function, subsequently producing class probabilities for different pre-defined classes. The RCM LSTM layer employs 130 LSTM cells, while each FLM uses 150 LSTM cells, treating the task as a full sequence multiclass classification problem.
Next, the output of the LSTM layer is connected to the fully connected layer in both the RCM and FLMs, as represented in Equation (23). The RCM’s fully connected layer has five neurons (corresponding to the number of classes: No fault, Region1, Region2, Region3, and Region4), while each FLMs has four neurons (representing the classes: First Actuator, Second Actuator, Third Actuator, and Fourth Actuator). In both models, the output of the fully connected layer is fed into a SoftMax layer (shown in Equation (24)). The output of the SoftMax layer is evaluated using the cross-entropy loss function (Equation (25)). Thus, the training process involves finding weight parameters that minimize this loss function.
Φ i = f ( j = 1 n w i , j × h j t + b i )
s o f t m a x Φ i = e Φ i t k = 1 i e Φ k t
L o s s = i = 1 n j = 1 m I i j l n s o f t m a x Φ i , j

4. Result and Discussion

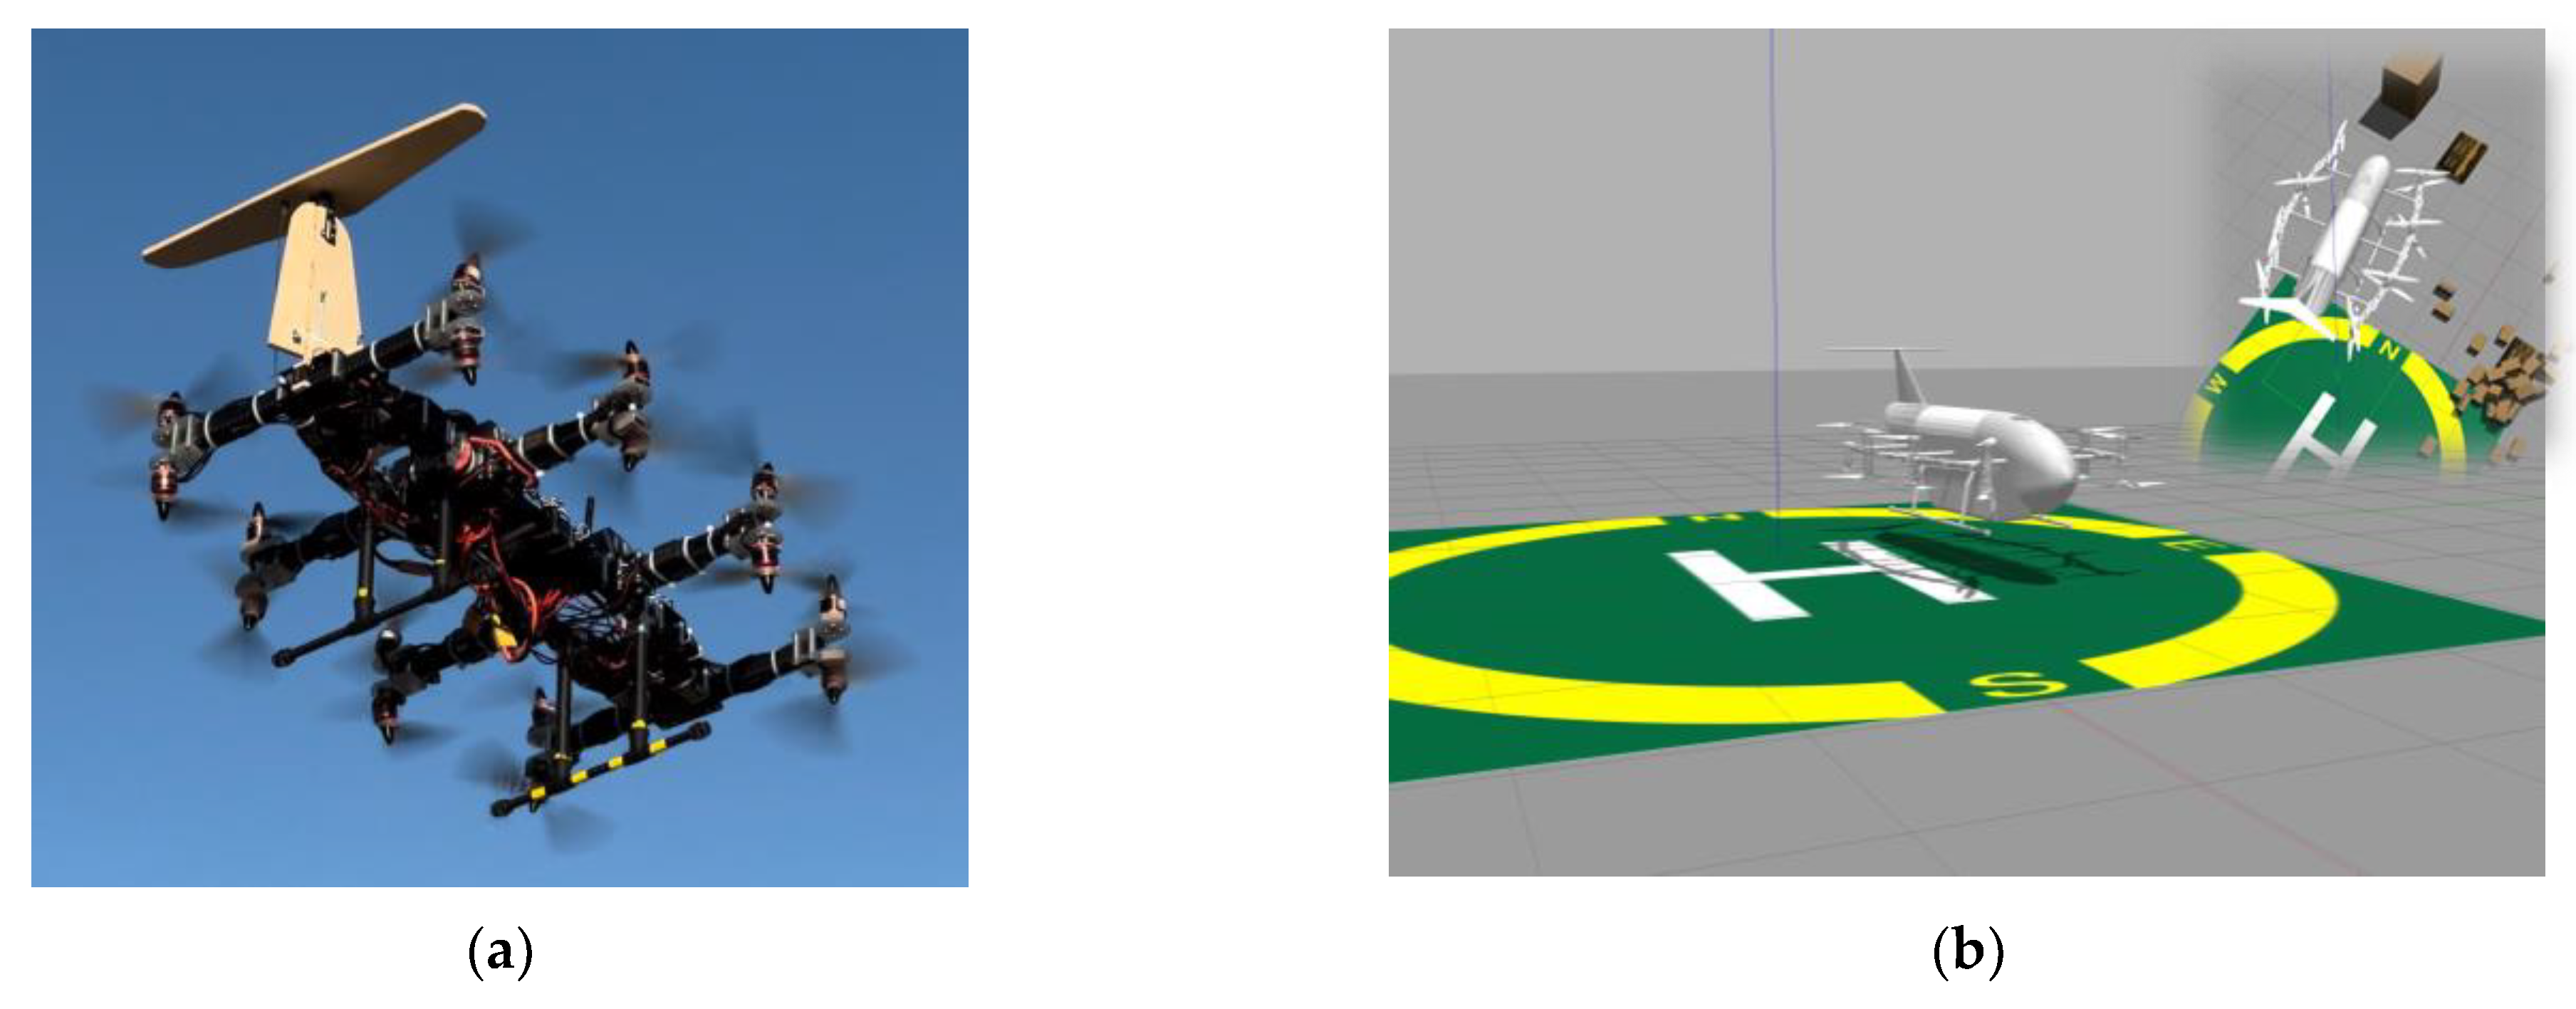
Figure 10 illustrates the research object model, which is known as the hexadecarotor highly redundant multirotor UAV. A prototype of the UAV weighing 5 kg and a CAD model for Gazebo simulation with similar structural properties were both prepared for data generation and testing. To generate a substantial amount of training data for various flight scenarios and fault types, a simulation platform was utilized. However, due to the potential risks associated with intentional stopping in the absence of robust FDI and FM, the amount of data collected from real flight was relatively limited. Nonetheless, the collected data were cured, augmented, and used to test the trained model.
The subsequent section provides a detailed account of the preparation of the data set, as well as the training, testing, and deployment of the models.

4.1. Training Data Collection and Preparation

A critical aspect of ML is the creation of a dataset that is both adequate and of high quality. This process involves ensuring comprehensive coverage of information while minimizing redundancy. Additionally, it is crucial to gather training data that are both informative and representative. Designing an FDI system based on deep learning for multirotor UAVs is a significant challenge, mainly because generating precise flight data in the presence of faulty actuators can be hazardous and impractical during real flights.
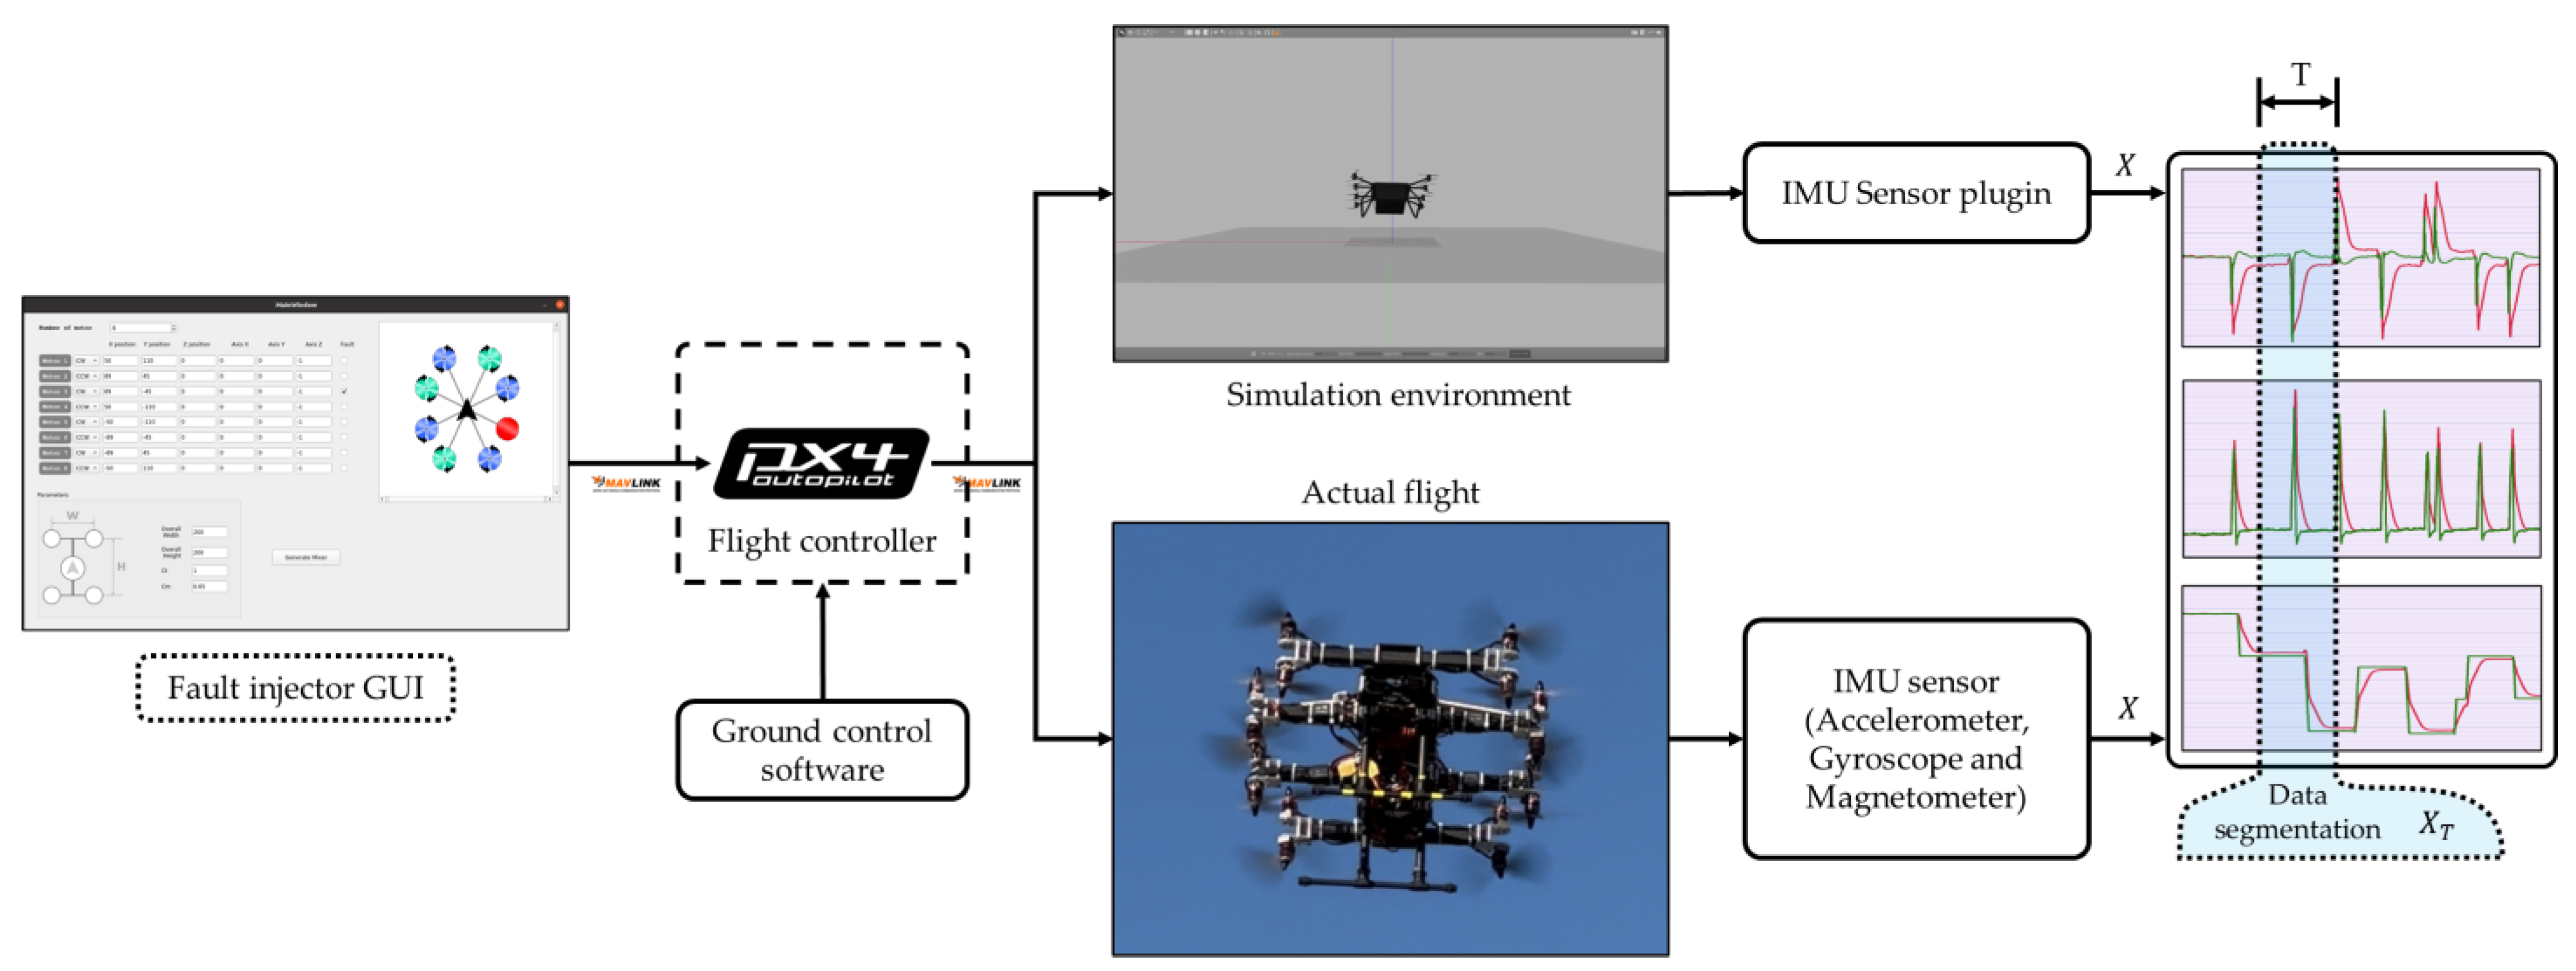
To overcome this challenge, we have devised an actuator fault tolerance test environment capable of injecting faults and implementing control reallocation features for both simulated and controlled flight scenarios. This system assumes the presence of a flawless FDI unit and utilizes user input injection commands to generate actuator fault flags f for the FM unit. After a reasonable detection time, the UAV system restructures itself and recovers from the fault. To facilitate the dataset preparation process, the tool facilitates the generation of data for various types of faults by injecting faults into actuators through a provided Graphical User Interface (GUI), as depicted in Figure 11.
A time series must be converted into samples with input and output components for supervised ML. One common approach to segmentation of time series data is to use sliding windows, which involves dividing elements into fixed-length windows that slide along the time axis. By dividing the time series data into smaller segments, sliding windows can help to capture local patterns and dependencies in the data, and each window is treated as a separate sequence that is fed into LSTM model.
We can define a multivariate time series datum x t as a sequence vector X R n × m that is made up of real values measured from the sensor or estimated via fusion of different sensors, as defined in
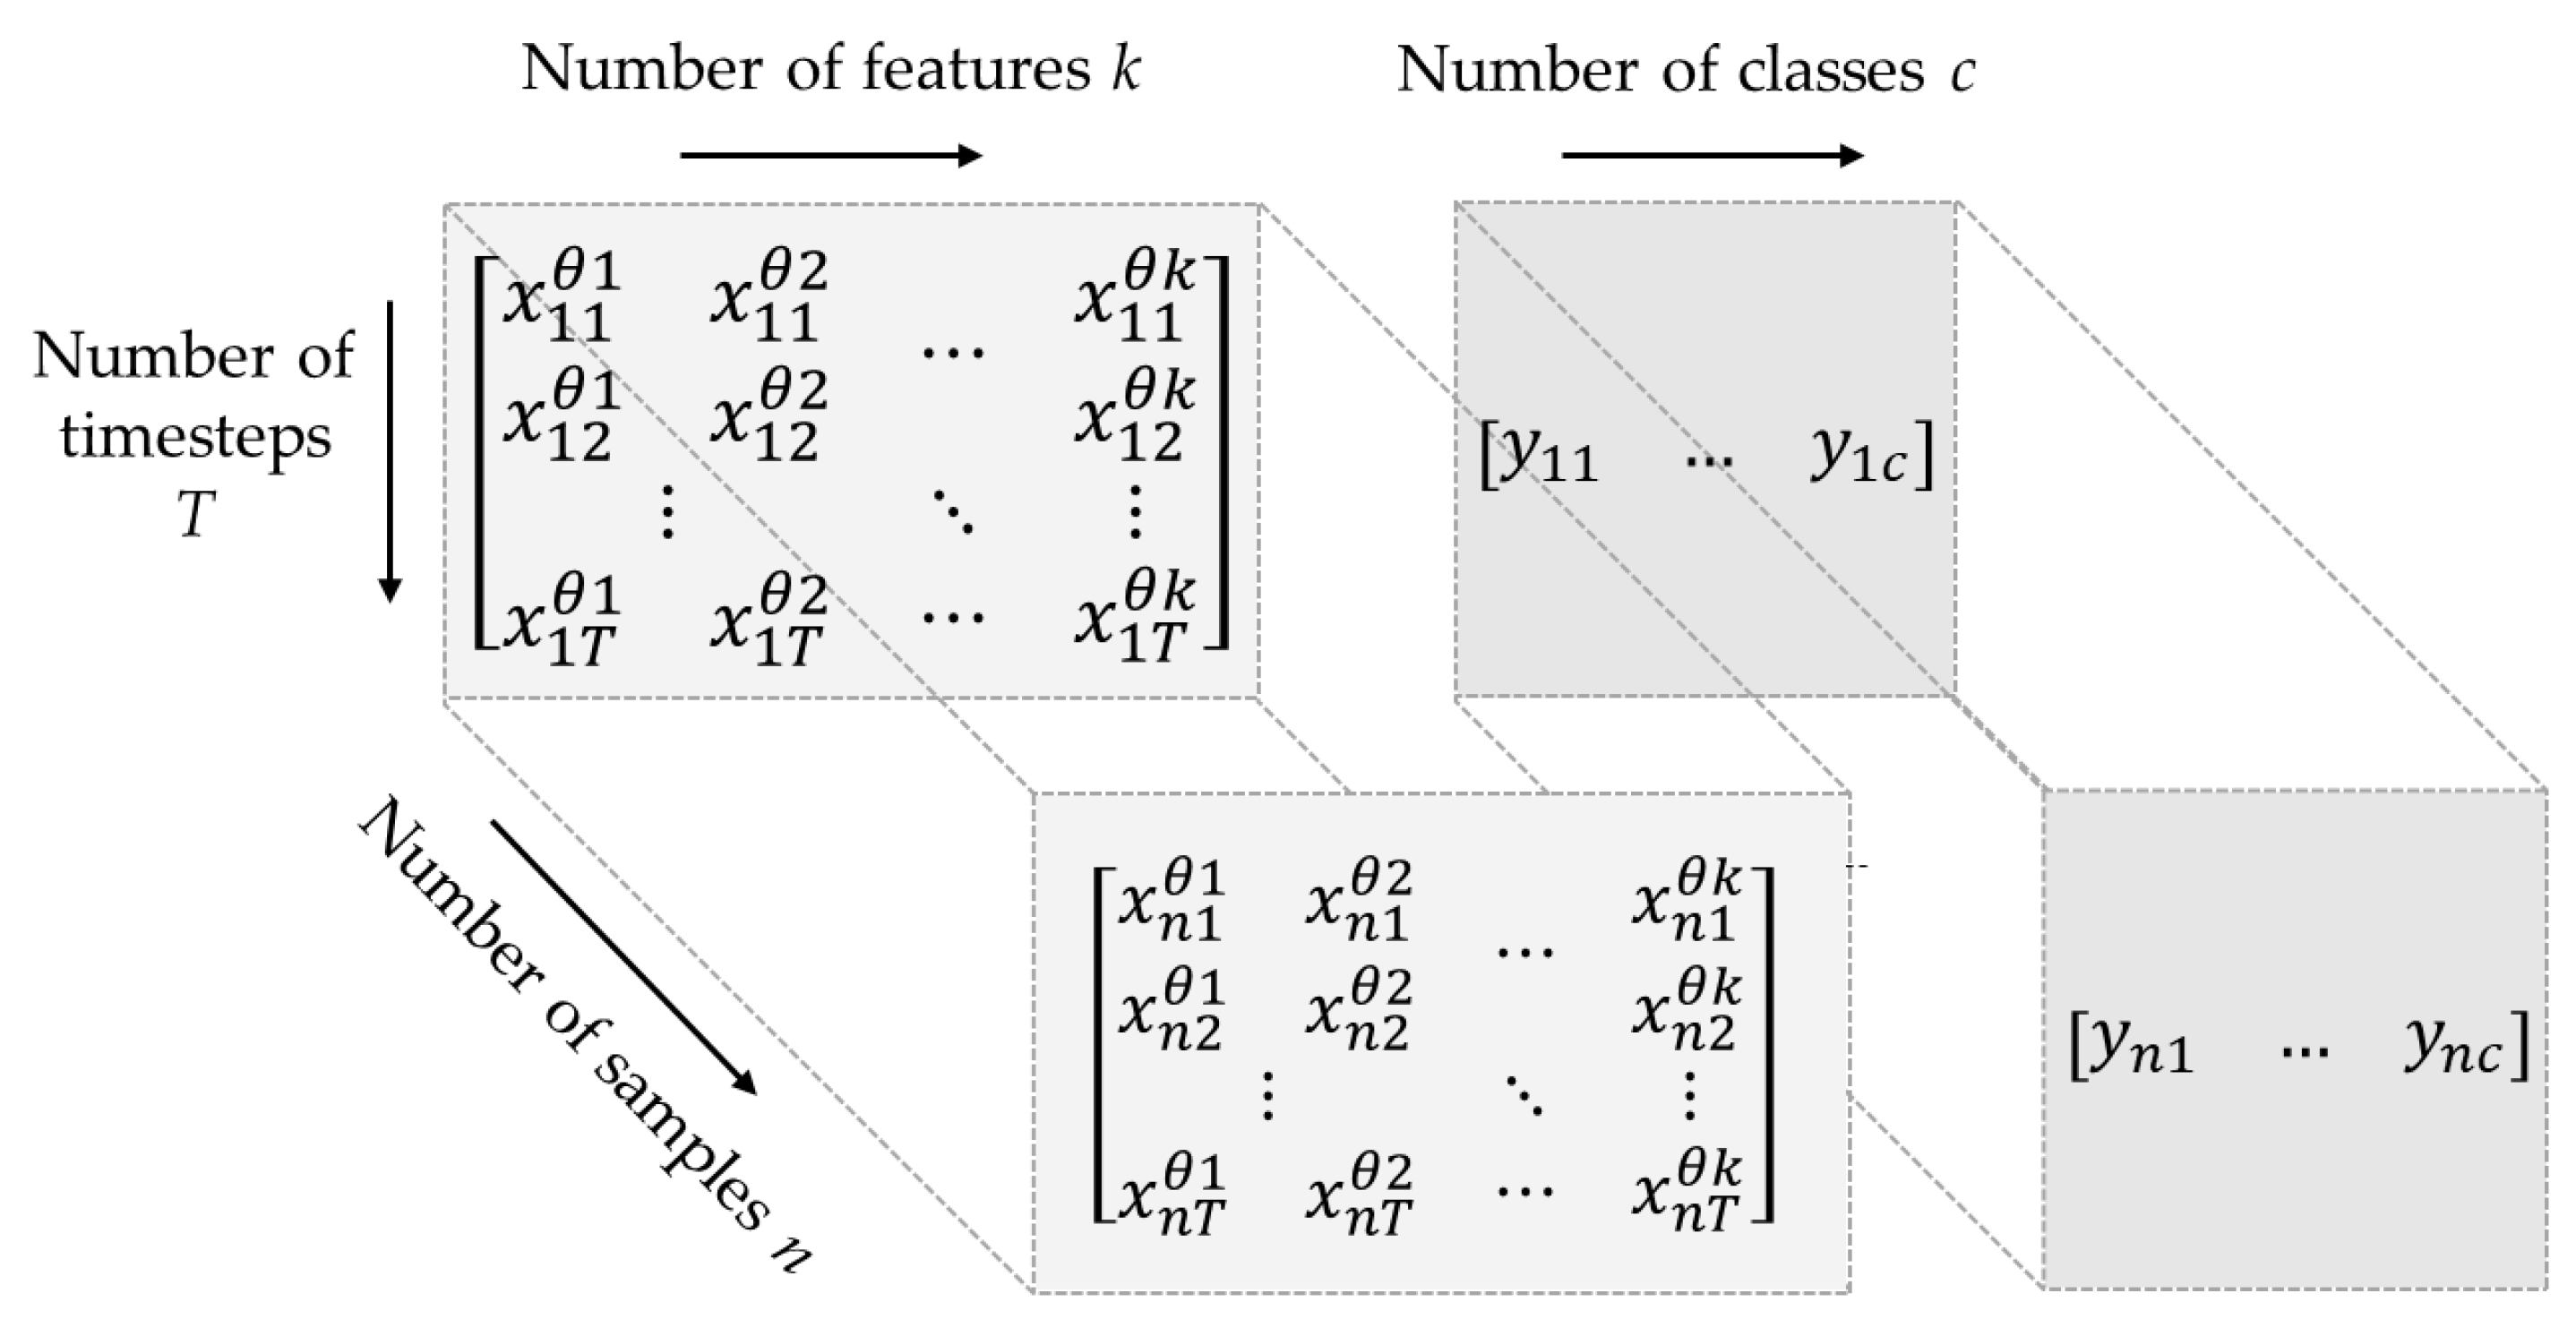
X = x 1 0 , x 2 0 , x k 0 x 1 n , x 2 n , x k n
where n is the number of samples, and k is the number of features.
Individual sequences were treated as samples and linked to specific classes. Additionally, the collected data comprised multivariate time series data, which entail recording multiple variables at regular time intervals. Figure 12 presents the overall data structure, depicting the slicing of the multivariate time series data into n samples, with k features, with windows of fixed-length T, along with their corresponding class labels c.
To train and test our proposed model, we acquired a dataset consisting of both real-time data from sensors installed onto UAVs, including accelerometers, gyroscopes, and magnetometers, and simulation data from sensor plugins were used to capture the UAV’s orientation in a simulated environment. The collected data encompassed roll, pitch, and yaw angles and rates, along with their corresponding setpoints. The data collection process involved various flight scenarios, such as hovering at different heights and mission flights with different vehicle orientations. Furthermore, to enhance the realism of our simulation, we incorporated real-world dynamics and external forces. By augmenting the collected data with random noises, we aimed to emulate the influence of factors like wind gusts and create a comprehensive simulation that closely resembled different flight scenarios. To ensure robustness and prevent overfitting, a diverse and sizable dataset was prepared. This dataset represented a range of complexities and variabilities, as well as a balanced distribution of classes.
For each combination of actuator fault scenarios (four faults per region for four actuators per region) and flight types (eight different scenarios), we recorded 20 s of flight simulation data at a sampling rate of 50 Hz. Subsequently, series data augmentation techniques were applied to enhance the dataset, which involved scaling the collected data. The augmentation process resulted in 2100 samples for the “No fault” class and 2000 samples for each region in the RCM. For the FLM, 600 samples were created for each class per region.
In the final step, we adopted a standard method to assign labels to the prepared data by selecting the majority class within each window as the corresponding label. To transform the categorical variables of the label classes into numerical features for analysis, we employed a widely used technique in ML, which is known as One Hot Encoding. The categorical and numerical representations of the classes can be found in Table 2 and Table 3 for their respective models.
The presented data in Figure 13 constitute a representative subset selected from the collected and processed dataset. They showcases samples from different classes, along with their corresponding labels, in Figure 13a, providing a visual representation of the prepared data.

4.2. Faulty Region Classifier Model Result

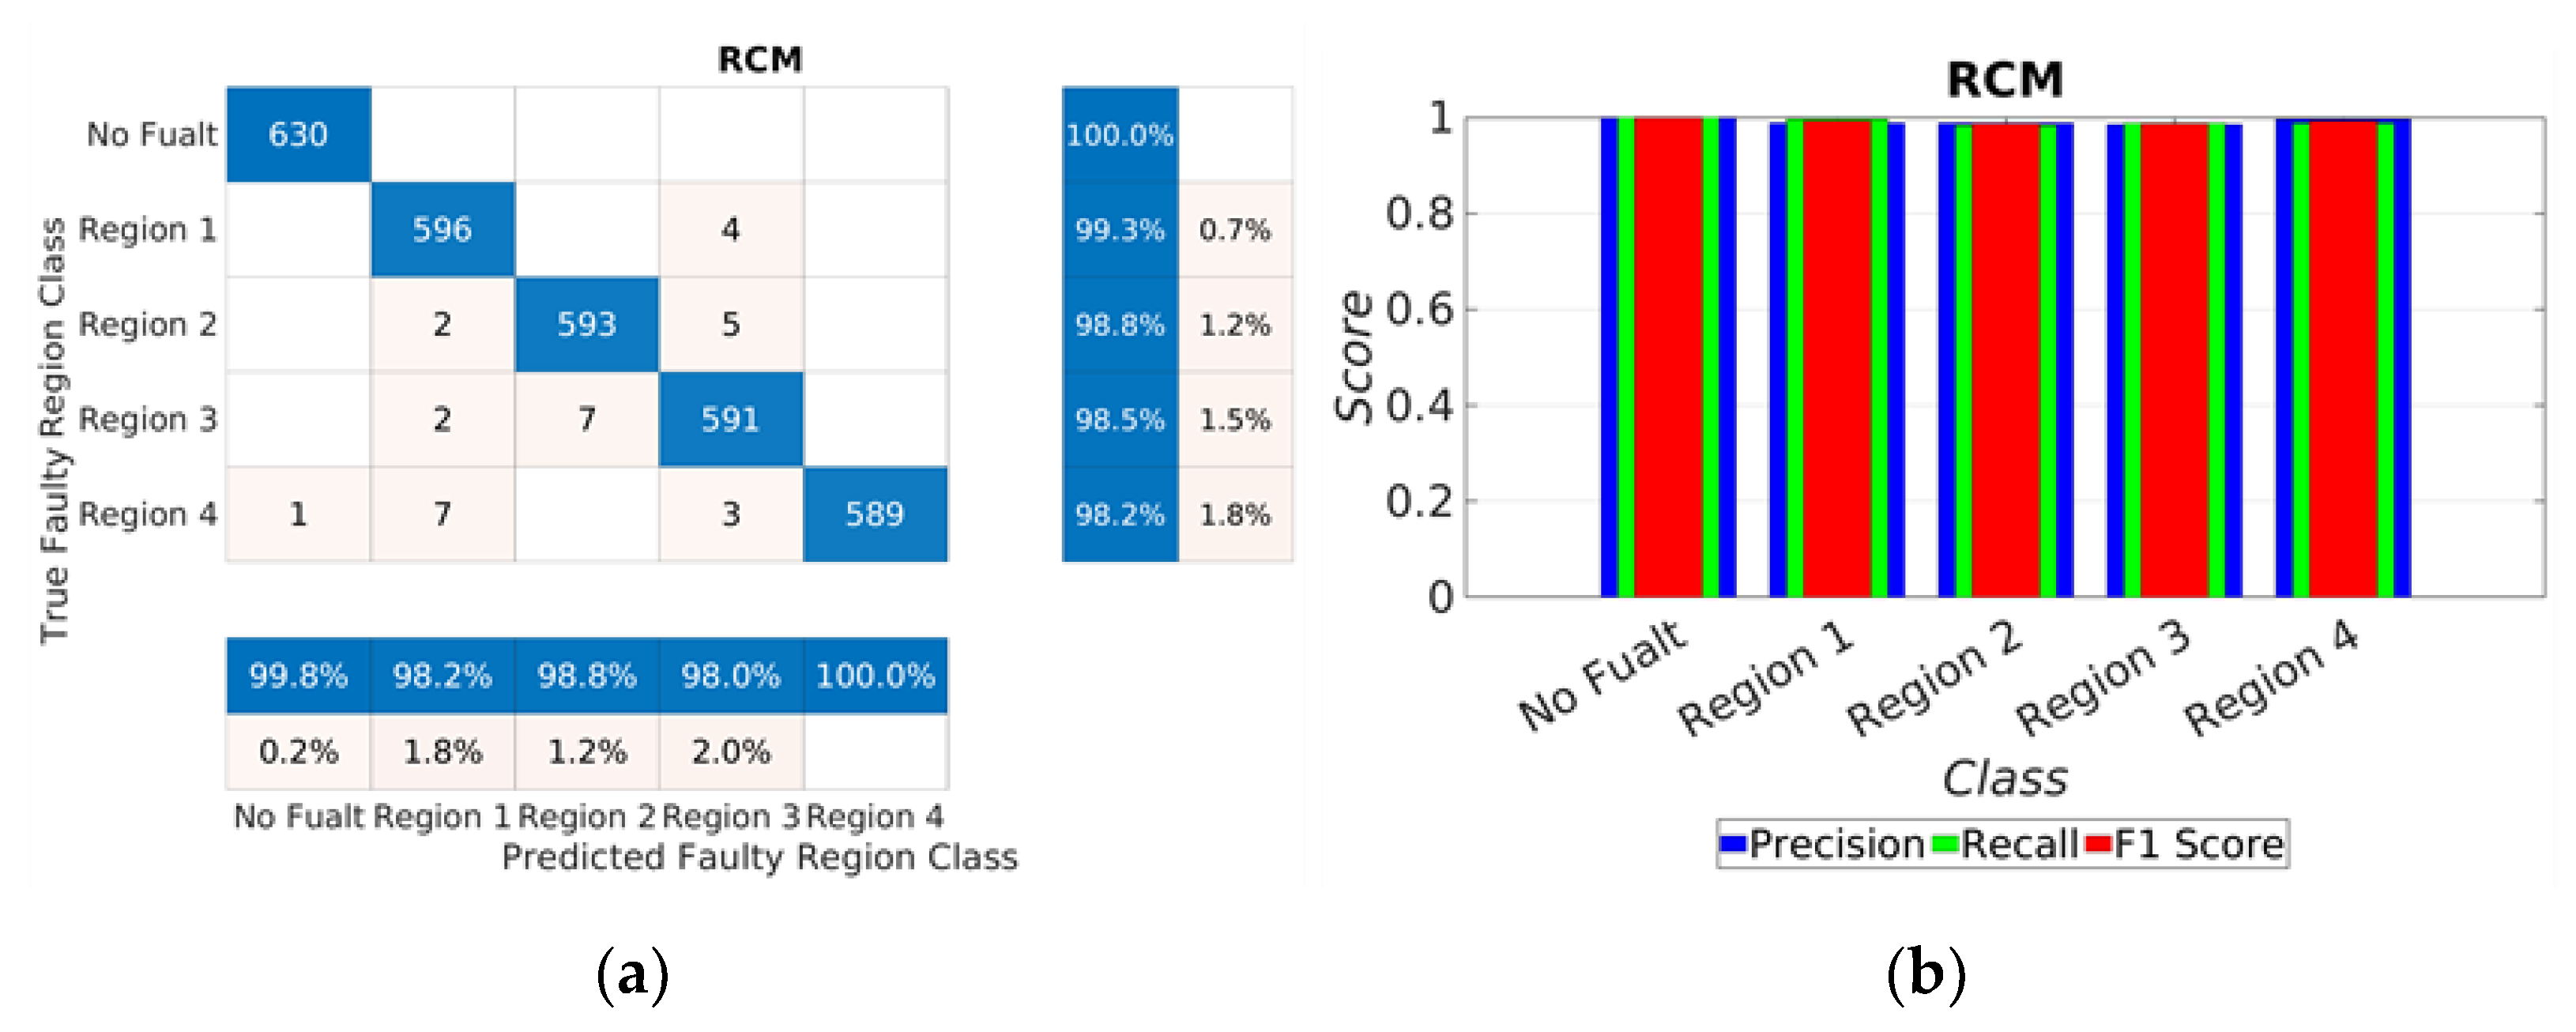
In Section 3, we presented the Region Classifier Model, which aimed to detect and classify the region that contained the faulty actuator(s). We also described the approach for dividing a multirotor UAV configuration into regions based on the behavior of attitude residual signs (roll and pitch) when specific actuators fail. The RCM is a multiclass classification model that produces five distinct output classes: “No Fault,” indicating the absence of any failed actuators; “Region1”; “Region2”; “Region3”; and “Region4,” indicating the presence of faults in the system and providing information about the specific fault group. These fault region labels are essential for activating the FLM.
During the training process, we used the following hyperparameters: 100 epochs, a maximum of 50 iterations per epoch, and an initial learning rate of 0.01. The input data had a format array of   R n × T × k , in which there were total of 10,100 samples (n), a sequence length of 130 timesteps (T), and 4 features (f), namely roll residual, pitch residual, and their respective rate residuals. The data were partitioned into 70% training data and 30% test data. We employed the “cross entropy” loss function and ‘adam’ as the optimizer for model training. To enhance the learning process, the hyperparameters were fine-tuned through an iterative process of experimentation and evaluation. The training was conducted on MATLAB 2023a using a single CPU.
During the training process, an impressive accuracy of 98.97% was attained, and the loss approached zero, after a learning time of 522 min, indicating the model’s strong performance. These results are depicted in the confusion matrix shown in Figure 14a. Additionally, for a visual representation of the outcome, Precision, Recall, and F1 score metrics were employed, as demonstrated in Figure 14b. A summary of the performance measures and the number of correctly classified samples can be found in Table 4.

4.3. Faulty Localization Model Result

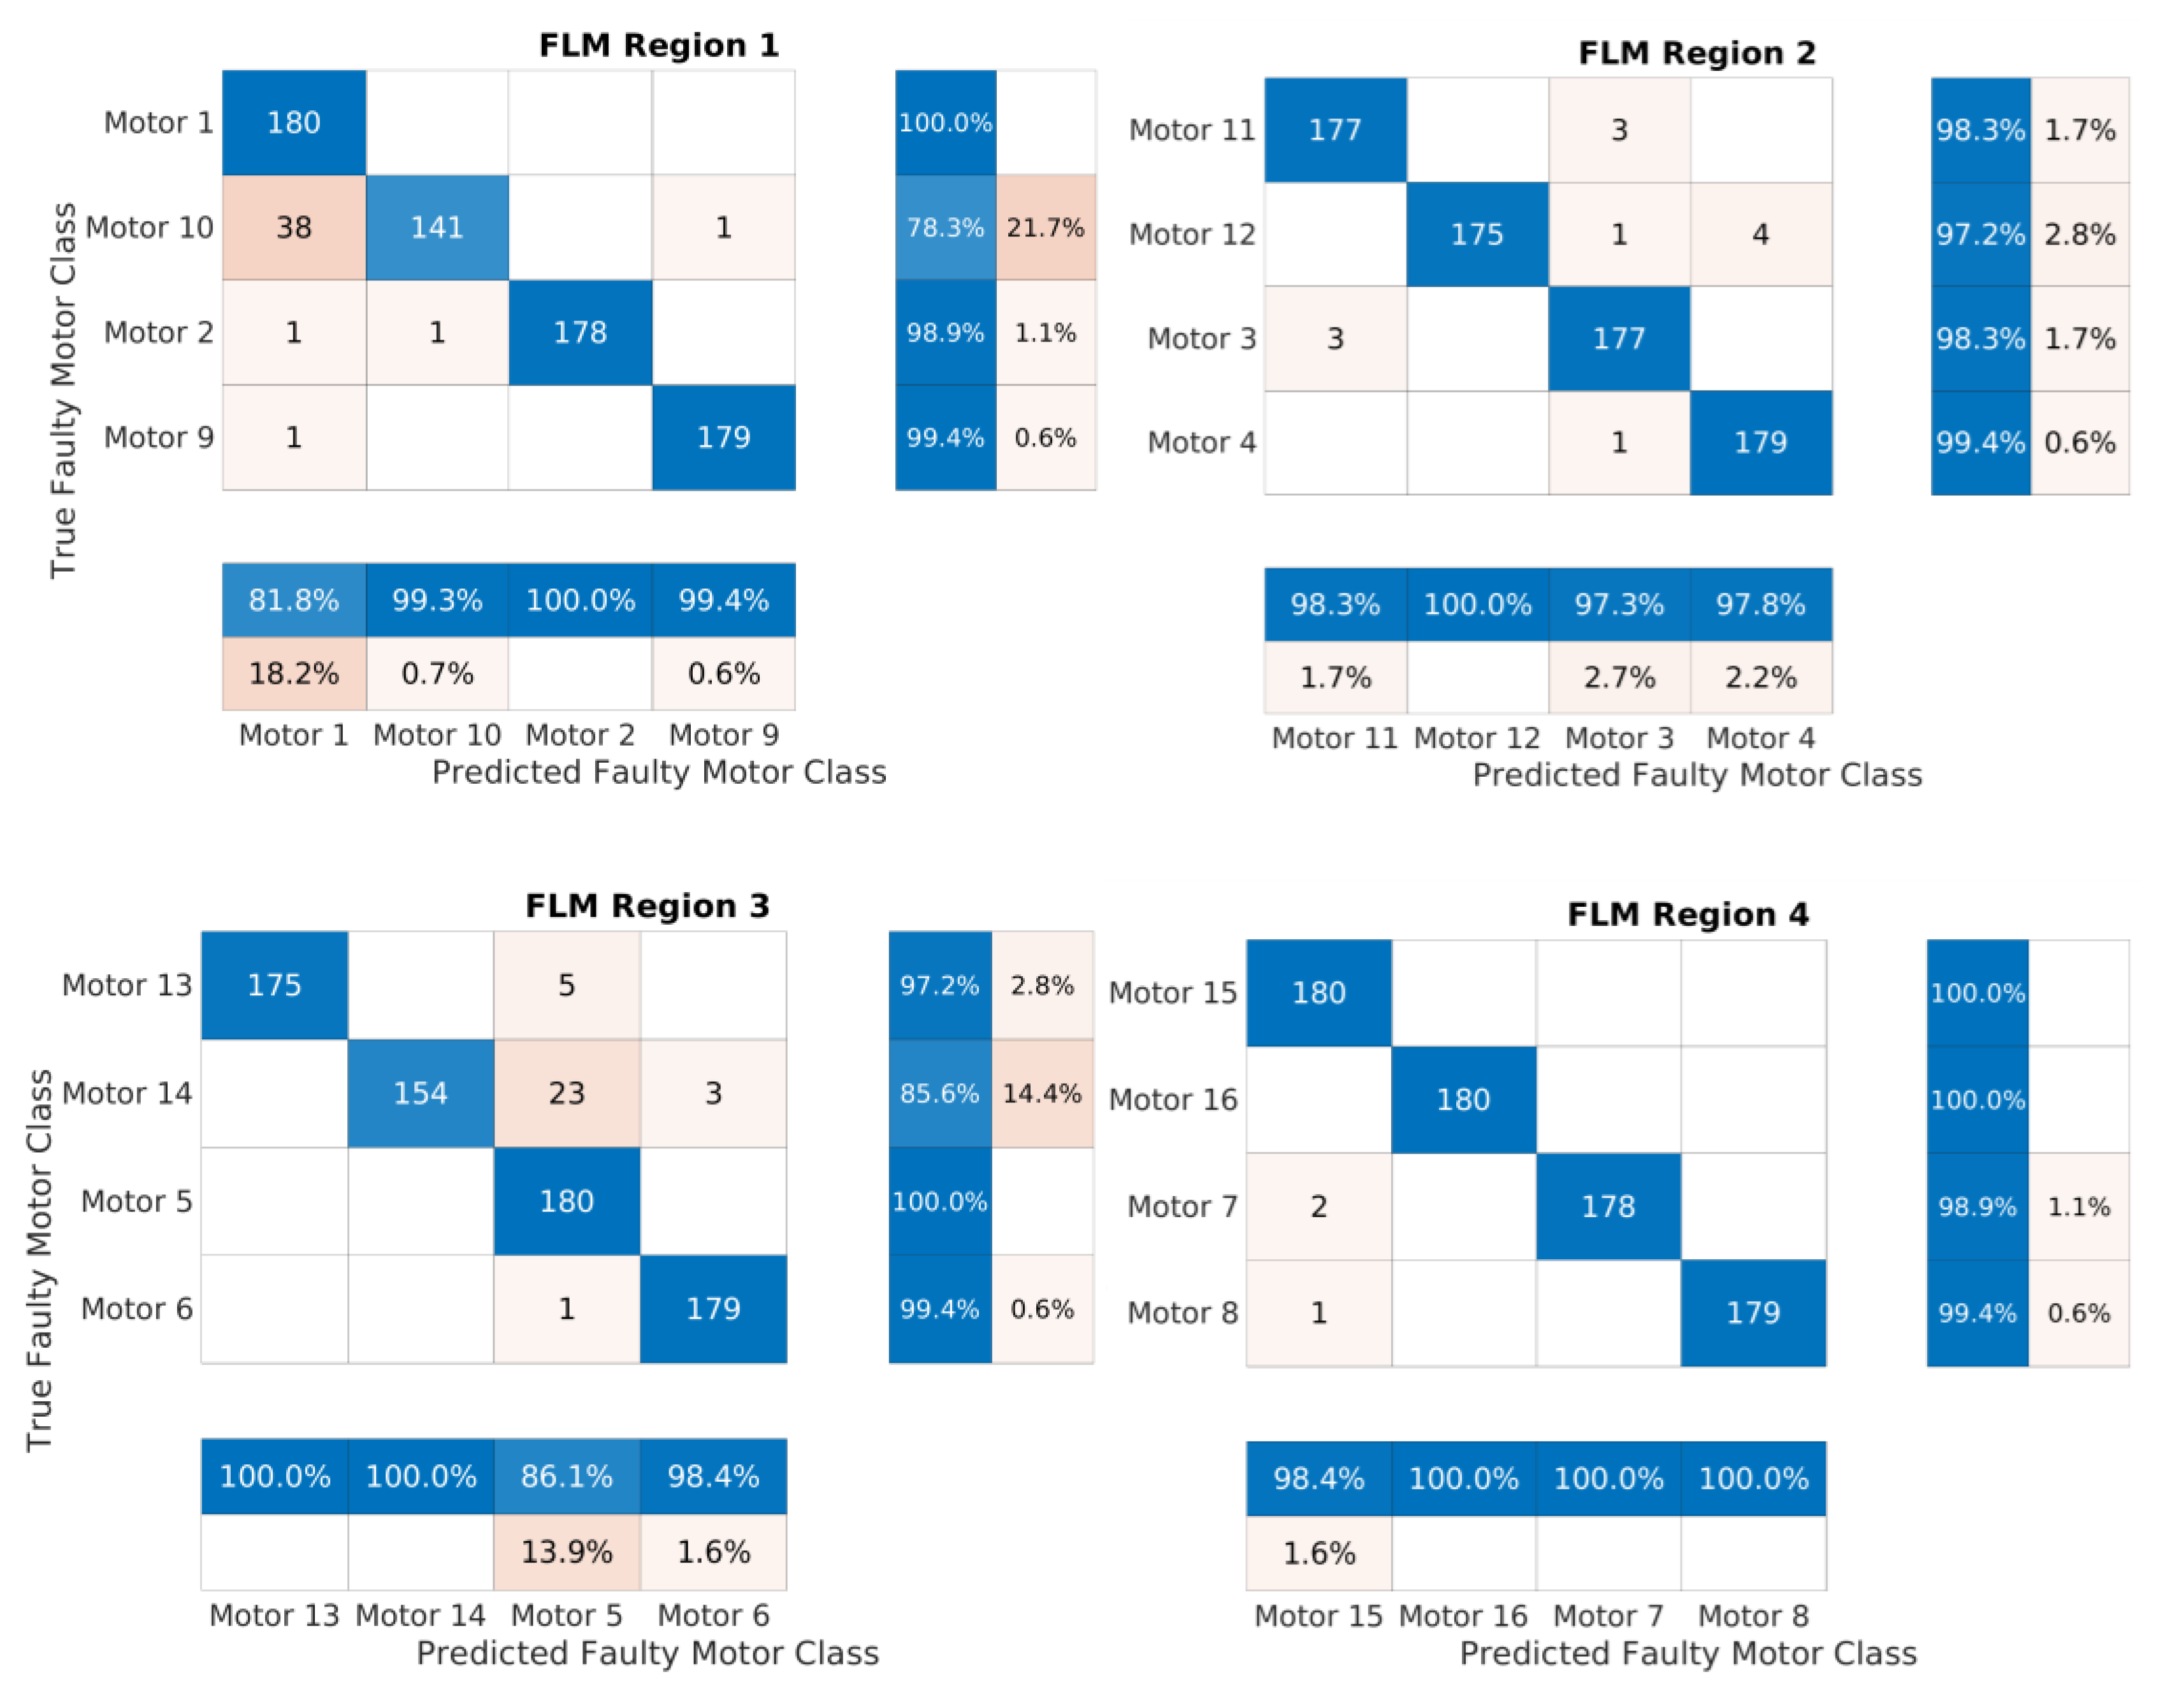
In this study, we introduced the FLM as another DNN model. The primary objective of the FLM was to precisely determine the specific source of a fault once the RCM successfully detected the presence of a fault in the system and provided hints regarding the fault group. In the case of our study object, each group consisted of four motors that produced attitudes (roll and pitch) in the same direction. LSTM-based DNN models with identical architectures were separately designed for each region. These models remained inactive until the RCM detected a fault and provided information about the specific region. Once activated, the corresponding FLM outputted the motor ID associated with the detected fault.
During the training process, the FLM model takes the three attitude angles and their respective rate residuals as inputs, along with the corresponding faulty motor class labels that match the input data patterns. Unlike that of RCM, FLM uses a longer sequence to accommodate detection time delay d via RCM. Consequently, the input data had a format array of   R n × T + d × k , having a total of 2400 samples (n), along with a sequence length of 150 timesteps (T+d) and 6 features (f), namely roll residual, pitch residual, yaw residual and their respective rate residuals. For each model training, after a few trial-and-error searches of the hyperparameters to identify the optimized result, the following method was used: 140 epochs, a maximum of 25 iterations per epoch, and a learning rate of 0.0154. Similarly, the data were partitioned into 70% training data and 30% test data. We employed the “cross entropy” loss function and ‘adam’ as the optimizer for model training, and the training was conducted via MATLAB 2023a using a single CPU.
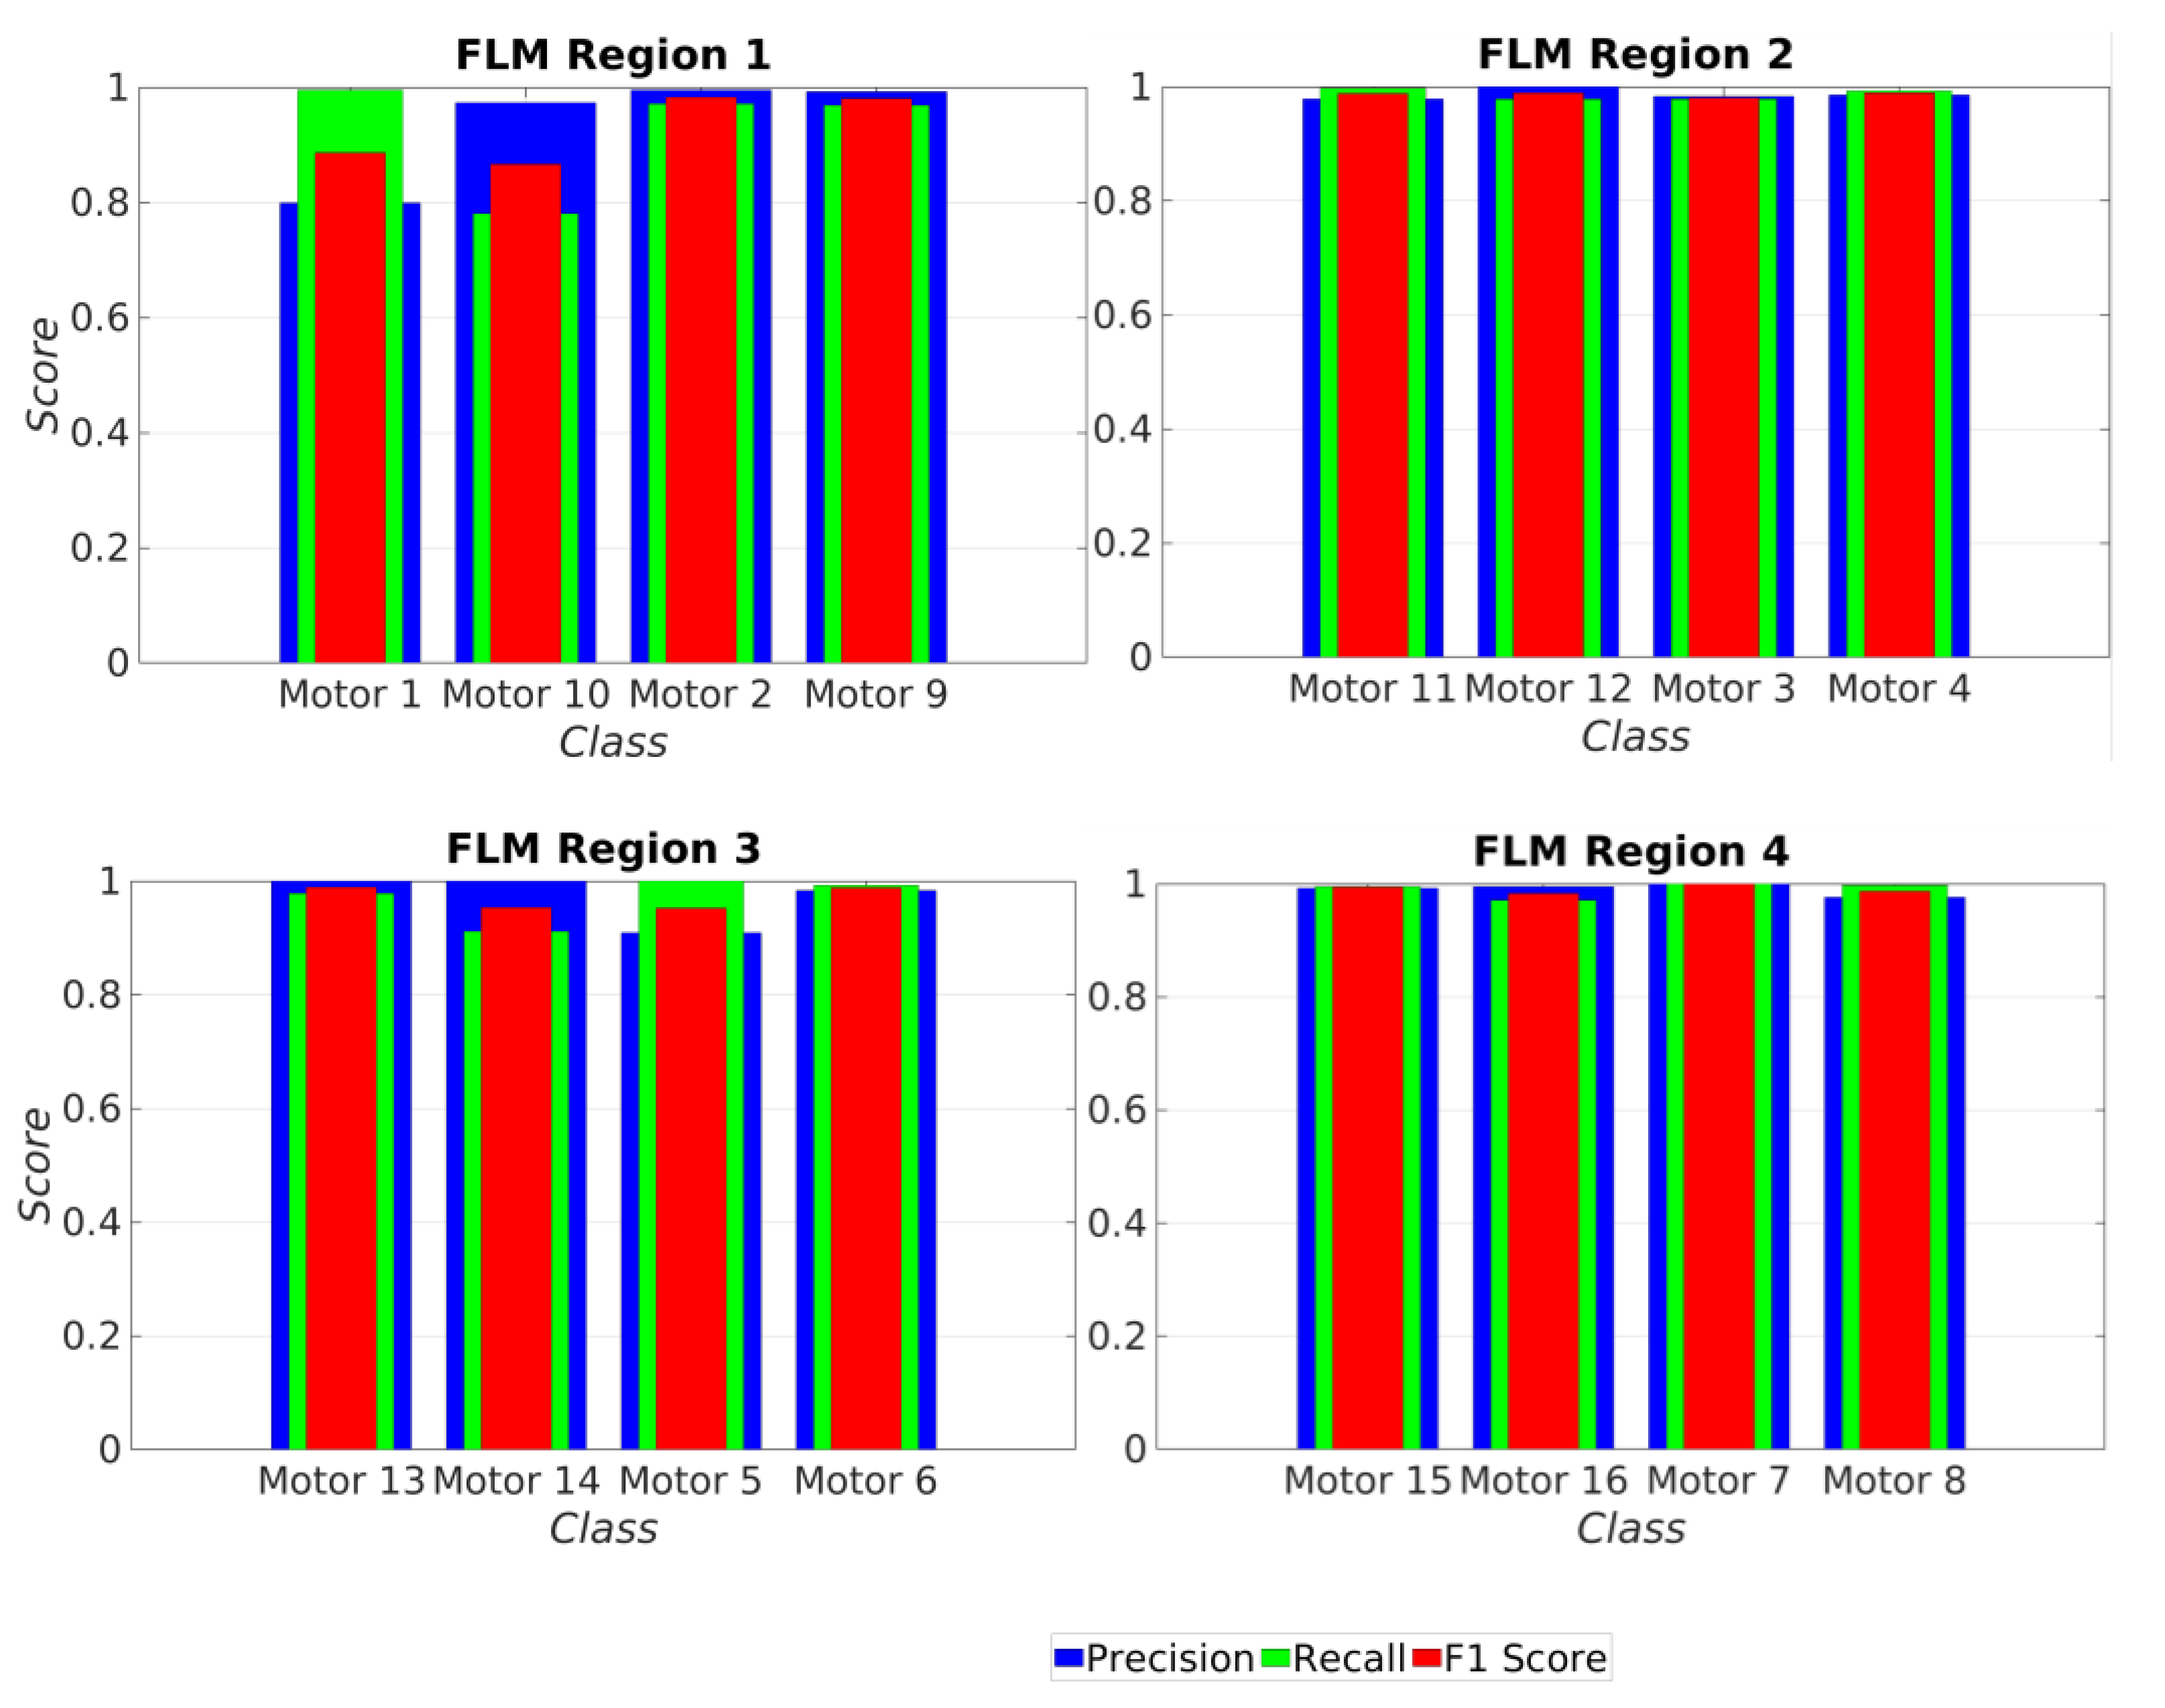
During the training process, impressive accuracy was achieved for each FLM after an average learning time of 368 min. The FLM for region 1 achieved an accuracy of 94.1667%, the FLM for region 2 achieved an accuracy of 98.333%, the FLM for region 3 achieved an accuracy of 95.556%, and the FLM for region 4 achieved an accuracy of 99.107%. Additionally, the loss for each model approached zero, indicating a good convergence during training. In our observation, the reason for identifying these different accuracy rates for each FLM was comes can be attributed to the data preparation process. The results of the training and evaluation process are visualized in the confusion matrix, as shown in Figure 15. Furthermore, Precision, Recall, and F1 score metrics were employed to assess the performance, as demonstrated in Figure 16.
A summary of the performance measures, including Accuracy, Precision, Recall, and F1 score, along with the number of correctly classified samples, can be found in Table 5. These results highlight the effectiveness of the proposed scheme in accurately detecting and locating faulty actuators within the multirotor UAV system.

4.4. Implemetation and Discusion

In this research paper, we employed LSTM-based DNN models to detect and localize actuator faults in highly redundant multirotor UAV systems. The objective was to achieve an accurate fault detection and identification scheme that can be integrated into control system of the UAV to enhance the reliability of the UAV. The trained models exhibited excellent performance in detecting and locating actuator faults within the system. The RCM achieved an impressive accuracy of 98.97%, indicating its effectiveness in identifying the presence of faults in specific regions. Furthermore, the FLM demonstrated even higher accuracy, with an average of 99.107%. This outcome highlights the potential for achieving high accuracy in FLM if appropriate and sufficient training data are provided for the FLM models. Although there may be slight variations in accuracy among the FLM models, overall, the results obtained from the models were highly satisfactory, indicating their effectiveness in fault detection and localization.
Based on the promising results obtained from the training and evaluation of the proposed scheme, it was integrated into the UAV control system. The integration process involved incorporating the fault detection and localization models into the existing control algorithms and logic. This integration allowed the system to continuously monitor the UAV’s sensor data in real time and identify any potential actuator failures. The implemented scheme was then tested and evaluated using both simulation flights and real flight data logged during actual UAV operations.
In order to evaluate the performance of the proposed scheme in terms of real-time actuator fault detection and isolation for highly redundant multirotor UAVs, a simulation testing process was conducted prior to hardware deployment. This simulation testing allows a comprehensive assessment of the scheme’s functionality and performance. The simulation testing was performed using the Gazebo simulation software, which provides a powerful platform for simulating UAV dynamics and environments. The selected UAV model, along with its structural parameters, was prepared in the Simulation Description Format (SDF) and a STL file for accurate representation. The control process and fault injection were carried out using the PX4 flight controller software, which provided the necessary control algorithms and interfaces required to complete the simulation. A Python code model was developed to interface with the trained models, including a subscriber to the vehicle state, data formatting for input, the inference section for fault detection and localization using the trained models, and a switching logic between the FLMs based on the output of the RCM. The integrated system was then tested in various scenarios, including hovering and mission flight modes, under both normal (no fault) and faulty conditions.
Furthermore, the scheme was also validated using real flight data logged during UAV operations. This validation process involved analyzing the sensor data collected during actual flight missions and comparing the scheme’s detected and localized faults with overall fault injection history. This real-world validation helped us to assess the scheme’s performance and reliability under practical operating conditions. The successful implementation of the proposed scheme using both simulation flight and real flight operation data demonstrates its potential for practical deployment in UAV systems. By effectively detecting and localizing failed actuators, the scheme contributes to enhancing the safety, reliability, and performance of multirotor UAVs during their operational missions.
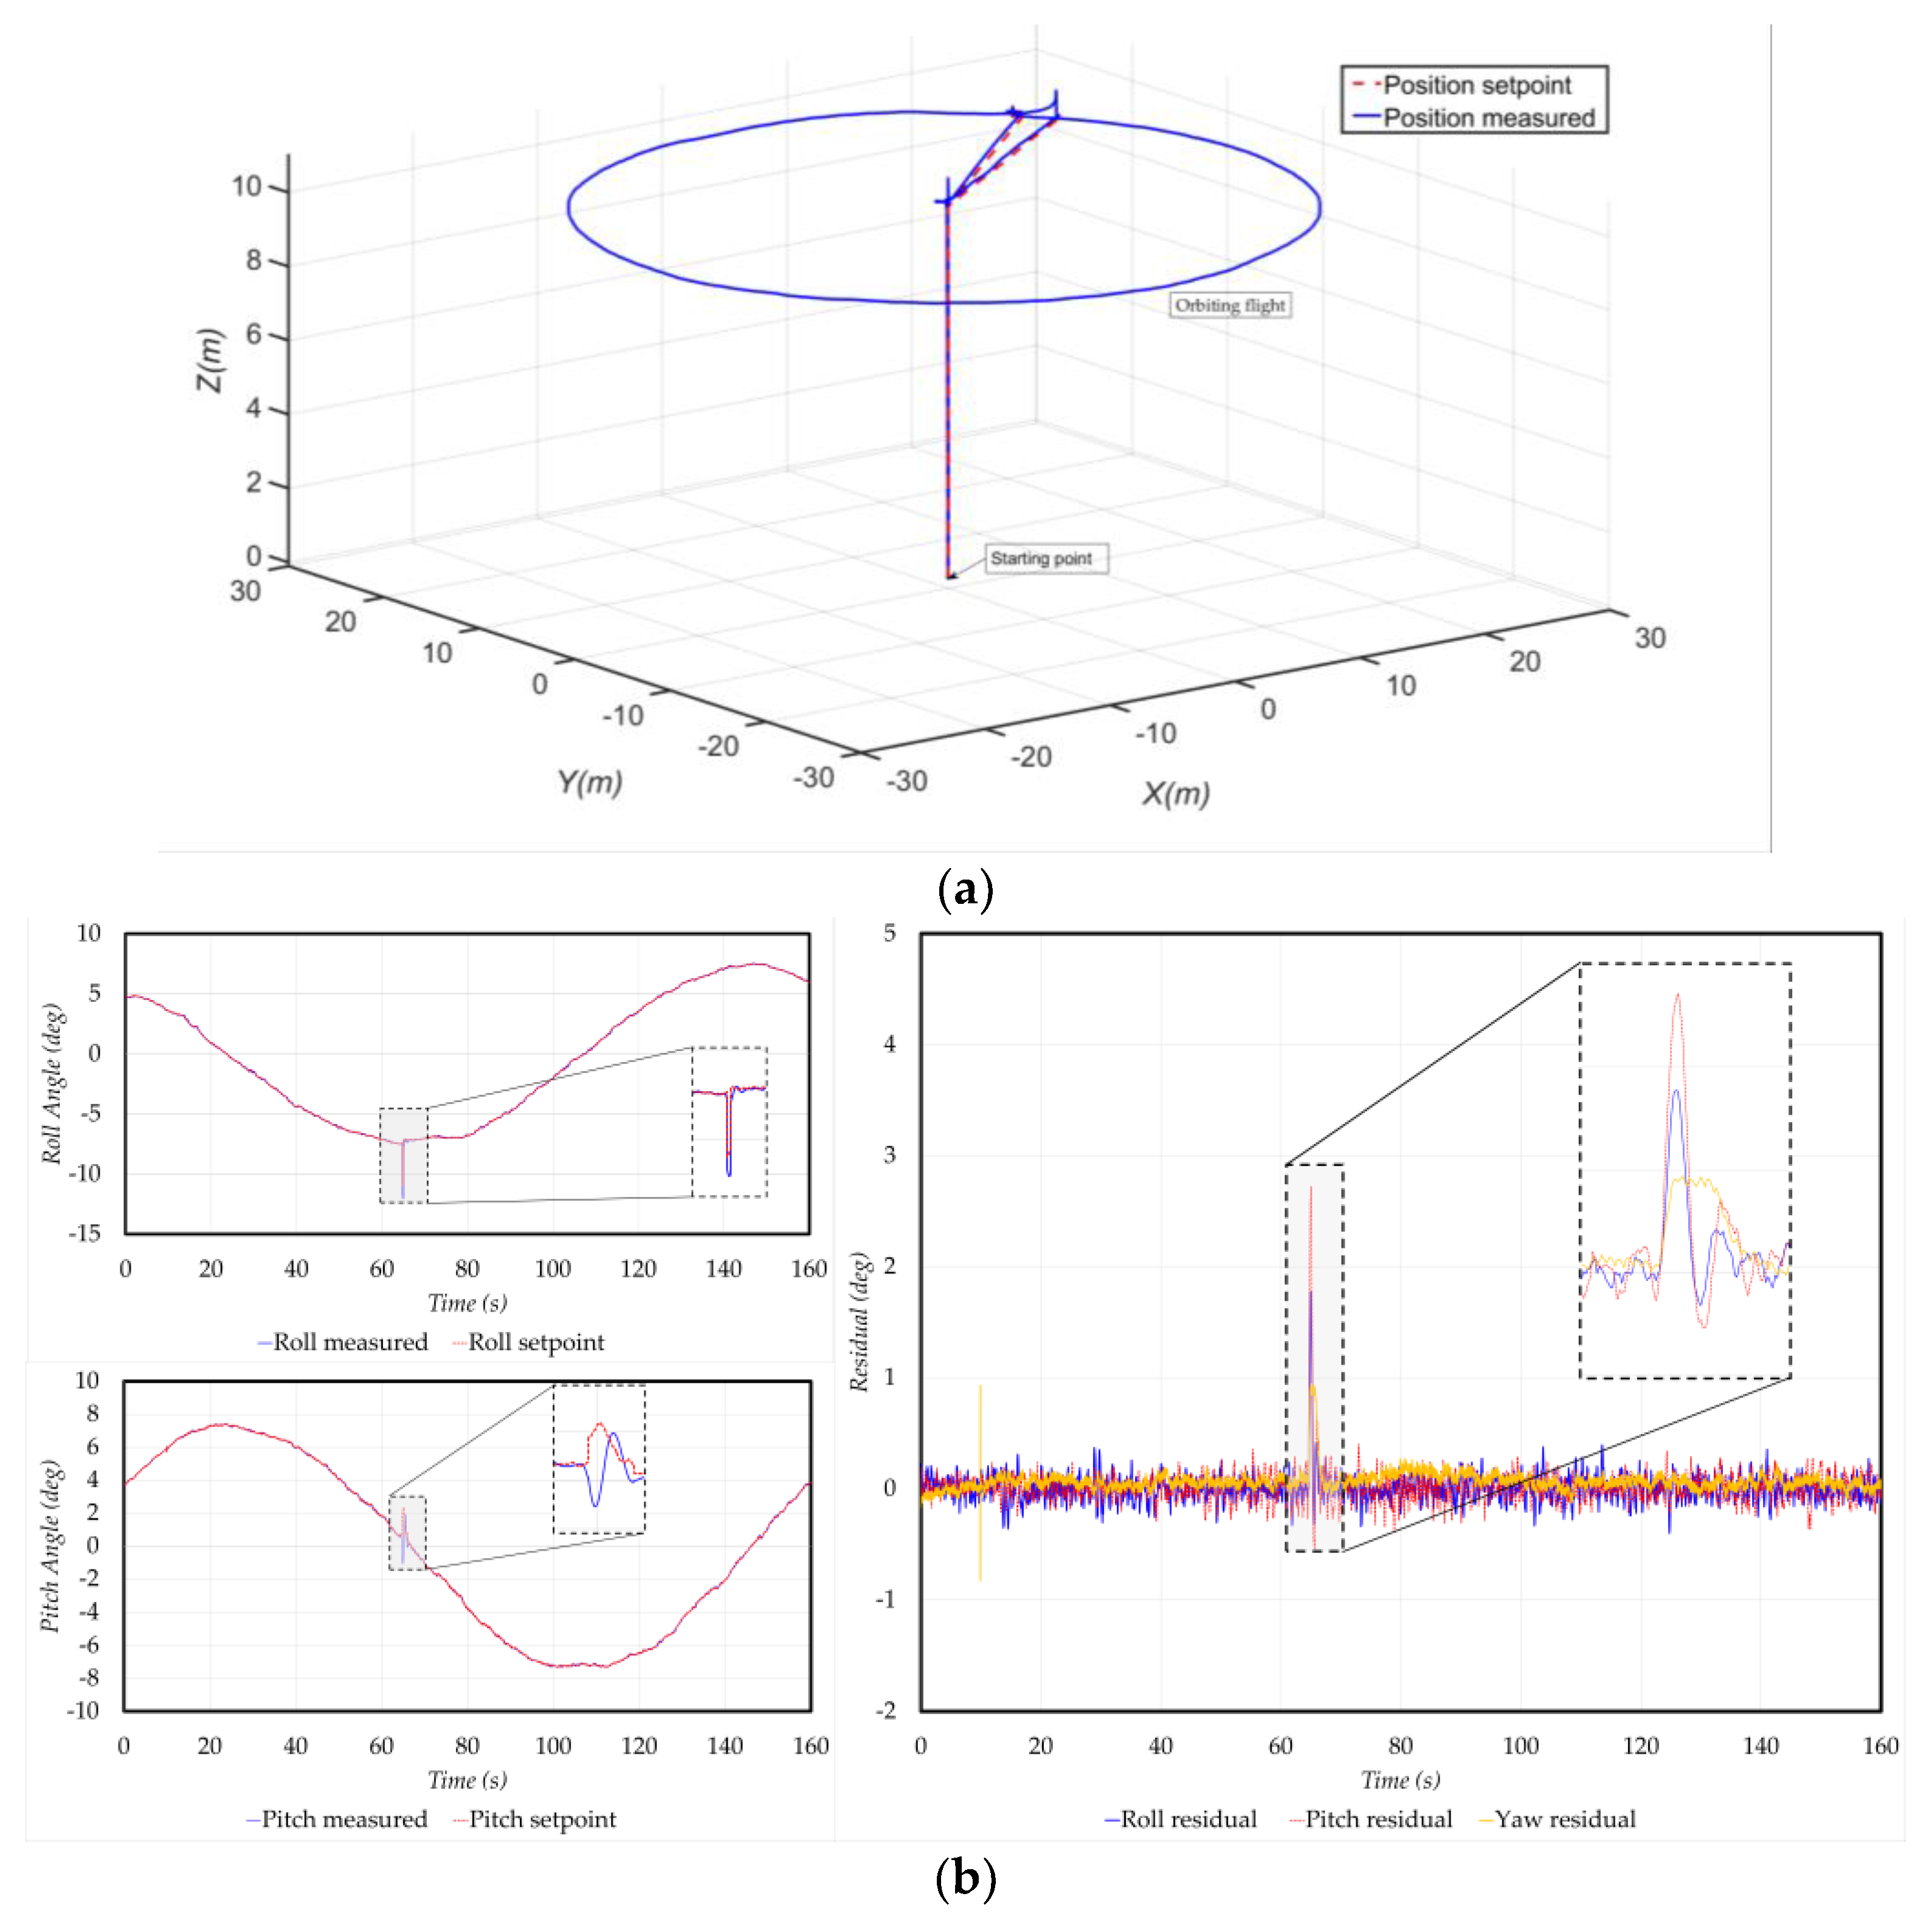
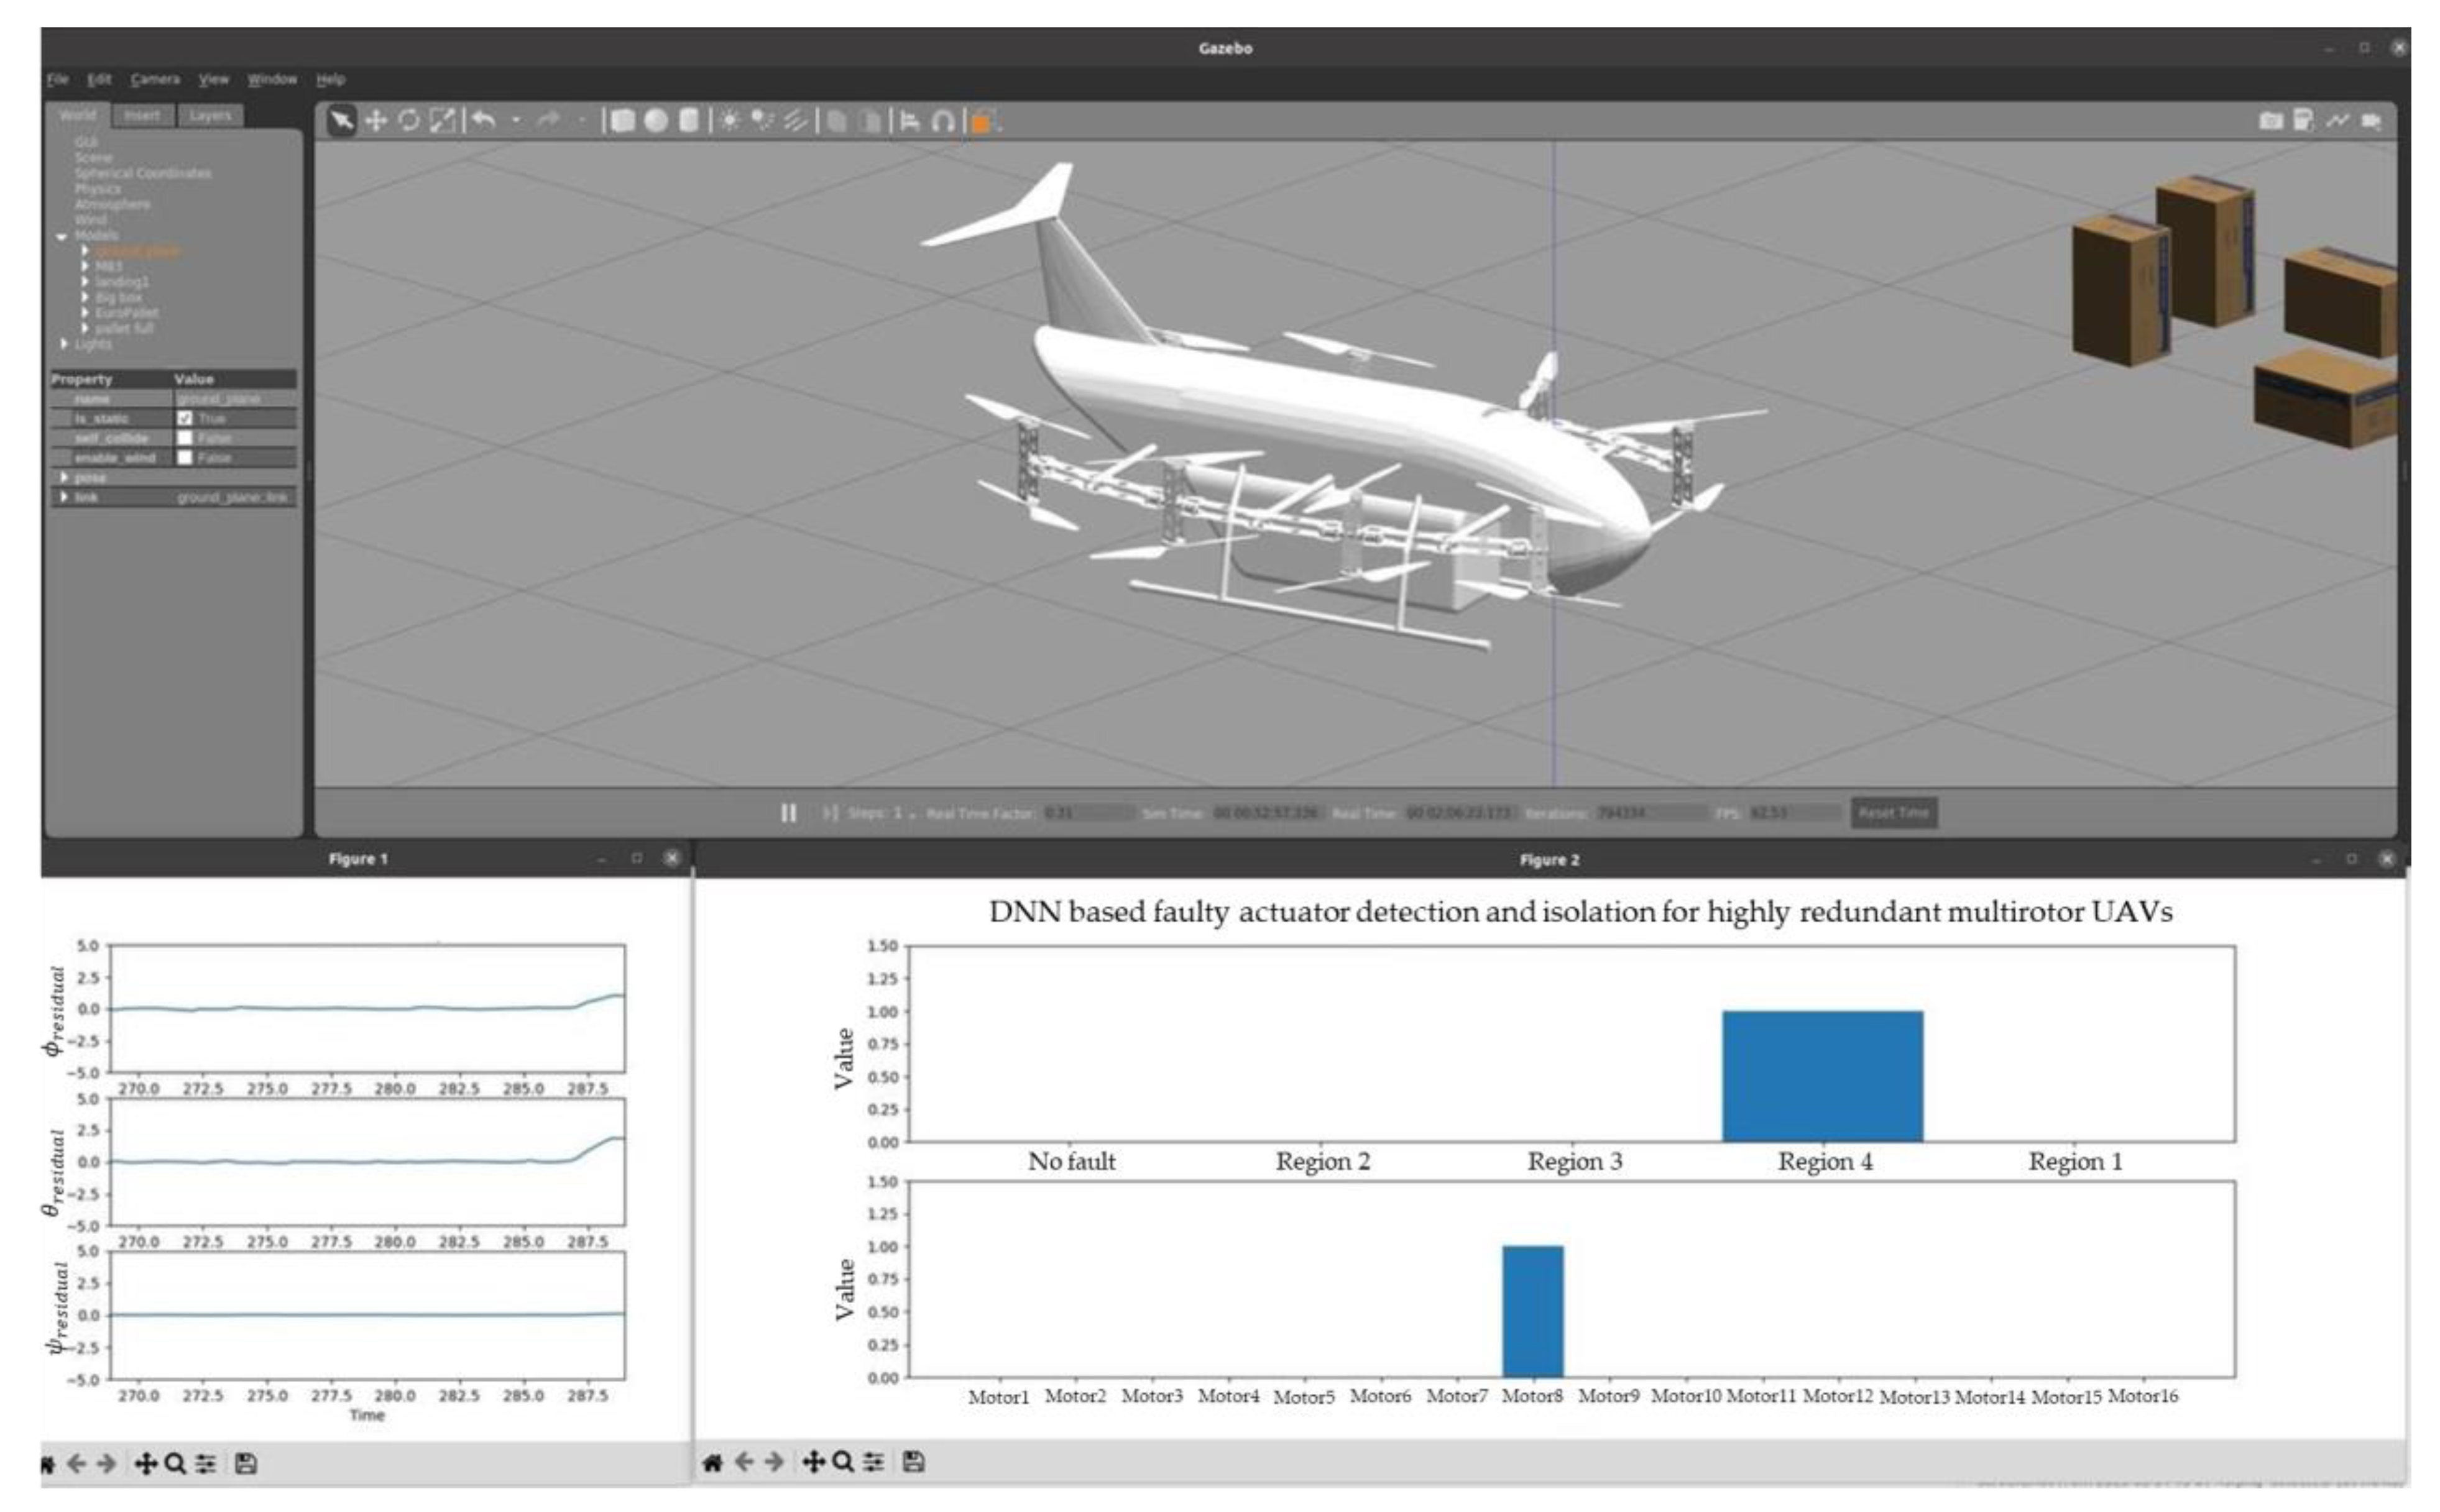
One of the mission flights performed is shown in Figure 15 and Figure 16, in which an orbiting flight was given from the ground controller software. The residual of the vehicle’s state, which captured any deviations from the expected behavior, was continuously monitored using the proposed actuator fault identification DNN model. The time series data of residual were passed through a window of 130 timesteps in length for RCM, while for FLM, it was extended to 150 timesteps. The experimental results indicate that the system was operating without any faults from 0 to 63 s, and the proposed scheme correctly outputted “No Fault” during this period. At 63 s, a fault was intentionally injected into motor 8 of the vehicle, causing it to stop functioning. As a result, the residual pattern exhibited a transient change, which is clearly observed in Figure 17. The proposed scheme successfully identified and categorized the fault by first outputting the “Region 4” flag from the RCM, indicating the region containing the faulty motor. This approach was followed by the FLM outputting the “Motor 8” flag, thus precisely pinpointing the failed motor, as shown in Figure 17.
These results demonstrate the effectiveness and accuracy of the proposed scheme in detecting and localizing actuator faults in real time during mission flights (Figure 18). By providing timely and precise fault identification, the scheme enhances the safety and reliability of multirotor UAVs, enabling prompt actions to mitigate the impact of actuator failures and maintain operational integrity.
The experimental showcase video Video S1, which illustrates the integration and real-world implementation of the proposed scheme in the control system of UAVs, is available in the Supplementary Materials section. The video showcases the practical application of the developed FDI framework, highlighting its effectiveness and performance in detecting and isolating faulty actuators in real-time scenarios. By presenting the integration of the FDI scheme into the UAV’s control system, the video offers visual evidence of its successful implementation and provides additional insight into its practical deployment. The Supplementary Materials section provides access to the video, enabling readers to observe the scheme in action and gain a deeper understanding of its functionality and potential applications.

5. Conclusions

In conclusion, our work presents a novel DNN–based scheme for effectively detecting and isolating actuator faults in highly redundant multirotor UAVs. The presence of backup in redundant UAVs helps to compensate for unexpected actuator malfunctions. However, identifying and localizing the failed actuator can be challenging. For the FM to optimize compensation, reduce stress on healthy actuators, and minimize power loss, a robust fault detection and locator scheme capable of handling the complexity of redundancy is essential. Our proposed DNN-based scheme addresses these challenges by enhancing the fault tolerance capabilities of multirotor UAVs through improved actuator fault detection and isolation in redundant systems. The scheme focuses on identifying and locating the faulty actuator and facilitating recovery by passing this information to the FM unit. We developed a robust method using a LSTM-based DNN model that utilizes the UAV’s attitude dynamic state for real-time fault detection and classification. We divided the multirotor configuration into four regions based on the vehicle’s attitude dynamics for analysis purposes. The framework consists of two separate models: the RCM and the FLM for each region. The RCM detects fault occurrences and provides high-level identification of the fault source, while the FLM accurately classifies the fault type in the suspected region identified via the RCM. To train the DNN models, we collected time series data containing the attitude dynamics (roll, pitch, and yaw) and their corresponding rates from a developed simulation environment and controlled flight experiments. The data were segmented into windows of length 130 timesteps for RCM and 150 timesteps for each FLM. Through training, we achieved an accuracy of 98.97% for RCM and a maximum accuracy of 99.107% for FLM. The results demonstrate that our models are capable of detecting and locating actuator faults within the system. We presented simulation results for integrating the proposed scheme into the control system, showcasing its effectiveness in monitoring the health of a hexadecarotor redundant multirotor UAV. Overall, the proposed scheme exhibits excellent performance in detecting and locating faulty actuators, irrespective of the configuration’s redundancy level.
The study’s scope is currently restricted to identifying and addressing one actuator failure at a time. In order to enhance performance and make the approach more widely applicable, our future plans involve training the models using larger and higher-quality datasets. These datasets will encompass not only single actuator failures but also combinations of two or more fault types. Moreover, we intend to harness improved computational resources to boost the scheme’s capabilities.

Supplementary Materials

The following supporting information can be downloaded at: https://www.mdpi.com/article/10.3390/drones7070437/s1, Video S1: Simulation of Deep Learning-Based Robust Actuator Fault Detection and Isolation Scheme for Highly Redundant Multirotor UAVs.

Author Contributions

Conceptualization, Y.D.; investigation, Y.D. and H.-Y.S.; methodology, Y.D.; software, Y.D. and H.-Y.S.; supervision, B.-S.K.; validation, Y.D. and A.W.; visualization, Y.D. and H.-Y.S.; writing—original draft, Y.D.; writing—review and editing, Y.D., H.-Y.S. and T.-W.K. All authors have read and agreed to the published version of the manuscript.

Funding

This work was supported by a Two-Year Research Grant of Pusan National University (No. 202309790001).

Data Availability Statement

Not applicable.

Conflicts of Interest

The authors declare no conflict of interest.

Appendix A. Transformation Matrix

Rotation matrix for transforming vectors. For Euler angles
ξ = ϕ θ ψ T
A transformation matrix from F b to F i is given as
R i b = R x ϕ R y θ R z ψ
R x ϕ = 1 0 0 0 cos ϕ sin ϕ 0 sin ϕ cos ϕ
R y θ = cos θ 0 sin θ 0 1 0 sin θ 0 cos θ
R z ψ = cos ψ sin ψ 0 sin ψ cos ψ 0 0 0 1
R i b = cos θ cos ψ cos θ sin ψ sin θ sin ϕ sin θ cos ψ cos ϕ sin ψ sin ϕ sin θ sin ψ + cos ϕ cos ψ sin ϕ cos θ cos ϕ sin θ cos ψ + sin ϕ sin ψ cos ϕ sin θ sin ψ + sin ϕ cos ψ cos ϕ cos θ
The reverse transformation can be computed from R i b using the property of orthogonal matrix as
R i b = R i b T

References

  1. Villa, D.K.D.; Brandão, A.S.; Sarcinelli-Filho, M. A Survey on Load Transportation Using Multirotor UAVs. J. Intell. Robot. Syst. 2019, 98, 267–296. [Google Scholar] [CrossRef]
  2. Mohsan, S.A.H.; Othman, N.Q.H.; Li, Y. Unmanned aerial vehicles (UAVs): Practical aspects, applications, open challenges, security issues, and future trends. Intell. Serv. Robot. 2023, 16, 109–137. [Google Scholar] [CrossRef] [PubMed]
  3. Piljek, P.; Kotarski, D.; Krznar, M. Method for Characterization of a Multirotor UAV Electric Propulsion System. Appl. Sci. 2020, 10, 8229. [Google Scholar] [CrossRef]
  4. Xuan, J.; Wang, X.; Lu, D.; Wang, L. Research on the safety assessment of the brushless DC motor based on the gray model. Adv. Mech. Eng. 2017, 9, 1–15. [Google Scholar] [CrossRef] [Green Version]
  5. Gorospe, G.-E.; Kulkarn, C.-S.; Edward, H.; Andrew, H.; Natalie, O. A Study of the Degradation of Electronic Speed Controllers for Brushless DC Motors. In Proceedings of the Conference of the Prognostics and Health Management Society, Jeju, Republic of Korea, 12–15 July 2017. [Google Scholar]
  6. Ambroziak, L.; Ołdziej, D.; Koszewnik, A. Multirotor Motor Failure Detection with Piezo Sensor. Sensors 2023, 23, 1048. [Google Scholar] [CrossRef]
  7. Songming, J.; Haiyue, G.; Xiaokun, Z.; Dengpan, L. Fault Tolerant Control Algorithm of Hexarotor UAV. J. Robot. 2020, 2020, 8829329. [Google Scholar] [CrossRef]
  8. Sadeghzadeh, I.; Zhang, Y. A Review on Fault-Tolerant Control for Unmanned Aerial Vehicles (UAVs); AIAA: St. Louis, MI, USA, 2011. [Google Scholar]
  9. Nguyen, N.P.; Mung, N.X.; Hong, S.K. Actuator Fault Detection and Fault-Tolerant Control for Hexacopter. Sensors 2019, 19, 4721. [Google Scholar] [CrossRef] [Green Version]
  10. Puchalsk, R.; Bondyra, A.; Giernacki, W.; Zhang, Y. Actuator fault detection and isolation system for multirotor unmanned aerial vehicles. In Proceedings of the 2022 26th International Conference on Methods and Models in Automation and Robotics (MMAR), Międzyzdroje, Poland, 22–25 August 2022; pp. 364–369. [Google Scholar] [CrossRef]
  11. Wang, B.; Zhang, Y. An Adaptive Fault-Tolerant Sliding Mode Control Allocation Scheme for Multirotor Helicopter Subject to Simultaneous Actuator Faults. IEEE Trans. Ind. Electron. 2017, 65, 4227–4236. [Google Scholar] [CrossRef] [Green Version]
  12. Puchalski, R.; Giernacki, W. UAV Fault Detection Methods. State-of-the-Art. Drones 2022, 6, 330. [Google Scholar] [CrossRef]
  13. Freddi, A.; Longhi, S.; Monteriu, A. A Model-Based Fault Diagnosis System for Unmanned Aerial Vehicles. IFAC Proc. 2009, 42, 71–76. [Google Scholar] [CrossRef]
  14. Hallouzi, R.; Verdult, V.; BabuŜka, R.; Verhaegen, M. Fault detection and identification of actuator faults using linear parameter varying models. IFAC Proc. 2005, 38, 119–124. [Google Scholar] [CrossRef] [Green Version]
  15. Aguilar-Sierra, H.; Flores, G.; Salazar, S. Fault Estimation for a Quad-Rotor MAV Using a Polynomial Observer. J. Intell. Robot. Syst. 2014, 73, 455–468. [Google Scholar] [CrossRef] [Green Version]
  16. Bondyra, A.; Gasior, P.; Gardecki, S.; Kasi’nski, A. Fault diagnosis and condition monitoring of UAV rotor using signal processing. In Proceedings of the 2017 Signal Processing: Algorithms, Architectures, Arrangements, and Applications (SPA), Poznan, Poland, 20–22 September 2017; pp. 233–238. [Google Scholar]
  17. Park, J.; Jung, Y.; Kim, J.H. Multiclass Classification Fault Diagnosis of Multirotor UAVs Utilizing a Deep Neural Network. Int. J. Control. Autom. Syst. 2022, 20, 1316–1326. [Google Scholar] [CrossRef]
  18. Bondyra, A.; Kołodziejczak, M.; Kulikowski, R.; Giernacki, W. An Acoustic Fault Detection and Isolation System for Multirotor UAV. Energies 2022, 15, 3955. [Google Scholar] [CrossRef]
  19. Tong, J.; Zhang, W.; Liao, F.; Li, C.F.; Zhang, Y.F. Machine Learning for UAV Propeller Fault Detection based on a Hybrid Data Generation Model. arXiv 2023, arXiv:2302.01556. [Google Scholar]
  20. Ayhan, A.; Ferhat, Y.; Orhan, Y. A sound-based method for fault detection with statistical feature extraction in UAV motors. Appl. Acoust. 2021, 183, 108325. [Google Scholar] [CrossRef]
  21. Baskaya, E.; Bronz, M.; Delahaye, D. Fault detection & diagnosis for small UAVs via machine learning. In Proceedings of the 2017 IEEE/AIAA 36th Digital Avionics Systems Conference (DASC), St. Petersburg, FL, USA, 17–21 September 2017; pp. 1–6. [Google Scholar] [CrossRef]
  22. Wang, B.; Liu, D.; Peng, Y.; Peng, X. Multivariate Regression-Based Fault Detection and Recovery of UAV Flight Data. IEEE Trans. Instrum. Meas. 2019, 69, 3527–3537. [Google Scholar] [CrossRef]
  23. Jalayer, M.; Orsenigo, C.; Vercellis, C. Fault detection and diagnosis for rotating machinery: A model based on convolutional LSTM, Fast Fourier and continuous wavelet transforms. Comput. Ind. 2020, 125, 103378. [Google Scholar] [CrossRef]
  24. Debele, Y.; Shi, H.-Y.; Wondosen, A.; Kim, J.-H.; Kang, B.-S. Multirotor Unmanned Aerial Vehicle Configuration Optimization Approach for Development of Actuator Fault-Tolerant Structure. Appl. Sci. 2022, 12, 6781. [Google Scholar] [CrossRef]
  25. Kotarski, D.; Kasać, J. Generalized Control Allocation Scheme for Multirotor Type of UAVs. In Drones—Applications; InTech: Bayern, Germany, 2018. [Google Scholar] [CrossRef] [Green Version]
  26. Giernacki, W.; Gośliński, J.; Goślińska, J.; Espinoza-Fraire, T.; Rao, J. Mathematical Modeling of the Coaxial Quadrotor Dynamics for Its Attitude and Altitude Control. Energies 2021, 14, 1232. [Google Scholar] [CrossRef]
  27. José-Torres, F.; Hadjout, D.; Sebaa, A.; Martínez-Álvarez, F.; Troncoso, A. Deep Learning for Time Series Forecasting: A Survey. Big Data 2021, 9, 3–21. [Google Scholar] [CrossRef] [PubMed]
  28. Smagulova, K.; James, A.P. A survey on LSTM memristive neural network architectures and applications. Eur. Phys. J. Spéc. Topics 2019, 228, 2313–2324. [Google Scholar] [CrossRef]
  29. Ordóñez, F.J.; Roggen, D. Deep Convolutional and LSTM Recurrent Neural Networks for Multimodal Wearable Activity Recognition. Sensors 2016, 16, 115. [Google Scholar] [CrossRef] [Green Version]
  30. Sanchez, O.D.; Martinez-Soltero, G.; Alvarez, J.G.; Alanis, A.Y. Real-Time Neural Classifiers for Sensor and Actuator Faults in Three-Phase Induction Motors. Machines 2022, 10, 1198. [Google Scholar] [CrossRef]
  31. Belagoune, S.; Bali, N.; Bakdi, A.; Baadji, B.; Atif, K. Deep learning through LSTM classification and regression for transmission line fault detection, diagnosis and location in large-scale multi-machine power systems. Measurement 2021, 177, 109330. [Google Scholar] [CrossRef]
Figure 1. Two concepts of multirotor UAVs developed by PNU Drone Ltd. The first concept (a) represents the MOBBYDICK cargo drone model v1.0, while the second concept (b) represents the Hexadecarotor UAM model.
Drones 07 00437 g001
Figure 2. Hexadecarotor multirotor cargo drone model: (a) simplified layout showing propulsion system distribution; (b) co-ordinate system visualization.
Drones 07 00437 g002
Figure 3. Effect of actuator failure location on the vehicle attainable moment using 2D (roll vs. pitch, pitch vs. yaw) and 3D (roll vs. pitch vs. yaw, green for No Fault, gold for faulty) AMS; (a) front right motor failure by computing Equation (8) with B f (b) front left motor failure by computing Equation (8) with B f .
Drones 07 00437 g003
Figure 4. Hexadecarotor multirotor UAV airframe configuration regional portioning.
Drones 07 00437 g004
Figure 5. Effect of actuator redundancy on fault tolerance and FDI of faulty actuators.
Drones 07 00437 g005
Figure 6. LSTM memory cells and their gates’ descriptions in LSTM layer.
Drones 07 00437 g006
Figure 7. UAV integrated control framework.
Drones 07 00437 g007
Figure 8. Proposed LSTM-based models.
Drones 07 00437 g008
Figure 9. LSTM-based actuator FDI framework.
Drones 07 00437 g009
Figure 10. Test platform; (a) hexadecarotor prototype; (b) CAD model gazebo simulation.
Drones 07 00437 g010
Figure 11. Training data collection framework.
Drones 07 00437 g011
Figure 12. Data preparation.
Drones 07 00437 g012
Figure 13. A representative subset of the collected data: (a) each region class with their corresponding labels; (b) each region dataset after augmentation and cleaning.
Drones 07 00437 g013
Figure 14. RCM test data performance results: (a) confusion matric; (b) Precision, Recall, and F1 scores.
Drones 07 00437 g014
Figure 15. Performance result of each FLM using the confusion matrix.
Drones 07 00437 g015
Figure 16. Performances of each FLM in terms of Precision, Recall, and F1 score.
Drones 07 00437 g016
Figure 17. The proposed scheme test flight simulation: (a) orbiting mission profile; (b) the resulting residuals.
Drones 07 00437 g017
Figure 18. The output of the proposed scheme test flight that shows the residual with its RCM and FLM result.
Drones 07 00437 g018
Table 1. A regional partitioning of multirotor UAVs, along with their corresponding residual sign patterns.
AirframeAirframe composition in number of rotors
Region 1Region 2Region 3Region 4
Hexarotor1111
Octarotor2222
Dodecarotor2222
Hexadecarotor4444
Attitude residual sign
ϕ r ++
θ r ++
Table 2. Fault label for RCM.
LabelEncodingDescription
No Fault[0 0 0 0 1]No faulty actuator
Region1[0 0 0 1 0]Fault in region 1
Region2[0 0 1 0 0]Fault in region 2
Region3[0 1 0 0 0]Fault in region 3
Region4[1 0 0 0 0]Fault in region 4
Table 3. Fault label for FLM.
LabelEncodingDescription
Motor1[0 0 0 1]First Actuator Fault in a region 1
Motor2[0 0 1 0]Second Actuator Fault in a region 1
Motor9[0 1 0 0]Third Actuator Fault in a region 1
Motor10[1 0 0 0]Fourth Actuator Fault in a region 1
Motor3[0 0 0 1]First Actuator Fault in a region 2
Motor4[0 0 1 0]Second Actuator Fault in a region 2
Motor11[0 1 0 0]Third Actuator Fault in a region 2
Motor12[1 0 0 0]Fourth Actuator Fault in a region 2
Motor5[0 0 0 1]First Actuator Fault in a region 3
Motor6[0 0 1 0]Second Actuator Fault in a region 3
Motor13[0 1 0 0]Third Actuator Fault in a region 3
Motor14[1 0 0 0]Fourth Actuator Fault in a region 3
Motor7[0 0 0 1]First Actuator Fault in a region 4
Motor8[0 0 1 0]Second Actuator Fault in a region 4
Motor15[0 1 0 0]Third Actuator Fault in a region 4
Motor16[1 0 0 0]Fourth Actuator Fault in a region 4
Table 4. Classification performance of RCM.
ClassNo. of SamplesCorrectly IdentifiedIncorrectly IdentifiedAcc. (%)Pre.RecallF1 Score
No Fault63063001001.001.001.00
Region 1600596499.30.991.000.99
Region 2600593798.80.990.980.99
Region 3600591998.50.990.990.99
Region 46005891198.21.000.990.99
Table 5. Classification performance of FLM.
RegionClassNo. of SamplesCorrectly Identified Incorrectly Identified Acc. (%)Prec.RecallF1 Score
Region 1Motor 118018001000.801.000.89
Motor 21801413978.31.000.970.98
Motor 9180178298.90.990.970.98
Motor 10180179199.40.970.780.87
Region 2Motor 3180177398.30.980.980.98
Motor 4180175597.20.990.990.99
Motor 11180177398.30.981.000.99
Motor 12180179199.41.000.980.99
Region 3Motor 5180175597.20.911.000.95
Motor 61801542685.60.980.990.99
Motor 1318018001001.000.980.99
Motor 14180179199.41.000.910.95
Region 4Motor 718018001001.001.001.00
Motor 818018001000.981.000.99
Motor 15180178298.90.991.000.99
Motor 16180179199.41.000.970.98
Disclaimer/Publisher’s Note: The statements, opinions and data contained in all publications are solely those of the individual author(s) and contributor(s) and not of MDPI and/or the editor(s). MDPI and/or the editor(s) disclaim responsibility for any injury to people or property resulting from any ideas, methods, instructions or products referred to in the content.