Article

Construction of an Orthophoto-Draped 3D Model and Classification of Intertidal Habitats Using UAV Imagery in the Galapagos Archipelago

1
Department of Animal Sciences and Aquatic Ecology, Faculty of Bioscience Engineering, Ghent University, Coupure Links 653, 9000 Ghent, Belgium
2
Department of Geography, Faculty of Sciences, Ghent University, 9000 Ghent, Belgium
3
Facultad de Ingeniería Marítima y Ciencias del Mar, Escuela Superior Politécnica del Litoral ESPOL, Guayaquil ECO90211, Ecuador
4
Galapagos Marine Research and Exploration, GMaRE, Joint ESPOL-CDF Program, Charles Darwin Research Station, Puerto Ayora 200102, Ecuador
5
Facultad de Ingeniería Eléctrica y Computación, Escuela Superior Politécnica del Litoral (ESPOL,) Campus Gustavo Galindo Km 30.5 Vía Perimetral, Guayaquil 090101, Ecuador
6
Department of Industrial Systems Engineering and Product Design, Ghent University, 9052 Ghent, Belgium
7
FlandersMake@UGent—Corelab ISyE, 3920 Lommel, Belgium
*
Author to whom correspondence should be addressed.
Drones 2023, 7(7), 416; https://doi.org/10.3390/drones7070416
Submission received: 17 May 2023 / Revised: 19 June 2023 / Accepted: 21 June 2023 / Published: 23 June 2023
(This article belongs to the Section Drones in Ecology)

Abstract

:
Worldwide, an increasing number of marine islands suffer from various pressures on the environment, driven by climate change and increasing land demands. The Galapagos Archipelago is one of the most iconic group of islands, yet population growth and tourism have resulted in a rising need for efficient environmental monitoring of its fragile ecosystems, such as the intertidal zone which harbors diverse and unique fauna. The purpose of this study was to investigate the image classification opportunities for these intertidal habitats using Uncrewed Aerial Vehicle (UAV) imagery. The data for this research were collected in Puerto Ayora on Santa Cruz in August 2017, the most urbanized island of the Galapagos. An orthophoto, a digital elevation model (DEM), and an orthophoto-draped 3D model of the intertidal zone were obtained using image registration software. Based on the orthophoto, an initial classification of the intertidal zone was performed using the spectral angle mapper algorithm. A habitat map with four classes (water, sand, rock, and vegetation) was created with an overall classification accuracy of 77%, indicating the suitability of UAV high resolution aerial imagery for the classification of intertidal habitats. The developed method could be applied to map and monitor other coastal regions and islands systems.

1. Introduction

The fragile ecosystems of coastal regions worldwide are endangered by population growth, tourism, and economic development of the region [1]. The environmental challenges are even more critical for small island countries, because their entire territory typically consists of coastal areas [2]. According to the most recent geographical mapping assessments, more than 340,000 marine islands may exist [3]. Islands are among the most vulnerable systems to climate change and suffer substantially from the pressures originating from the worldwide population growth and its increasing land demands [4,5]. It is expected that in the near future, applied research that assesses the effect of anthropogenic environmental changes on ecosystem dynamics will become more important [6]. The need for efficient environmental monitoring of sensitive coastal ecosystems worldwide is rising in order to support successful management strategies. A better understanding and visualization of the spatial and temporal variability of coastal and intertidal habitats may improve the resilience to natural and anthropogenic disturbances through the support of decision-making processes, such as prioritization of the management of endangered areas [7] and urban planning. Intertidal areas are highly dynamic and complex ecosystems with a large biodiversity over small areas, consisting of mosaics of different habitats, shaped by complex interactions of biotic and abiotic variables [8]. For this reason, the description of the physical extent of habitats is highly important and should be available at a relatively fine scale (several meters). Especially for those habitats that are known to be important for the distribution of biodiversity. Rocky reefs are globally found at more than one-third of the coastlines most frequently at islands on hot spots, island arcs, and convergent-plate margins associated with subduction [9]. Shallow reef habitats are most severely disturbed by human activities (e.g., bathing and fishing) given their limited depth, global warming, and ocean acidification, which may lead to species composition shifts and functional collapse in reefs in the near future [10,11]. Considering the global changes and local pressures, these valuable ecosystems should be sustainably managed through the assessment of their ecological status using spatially explicit observations and models [7]. Different types of uncrewed vehicles such as uncrewed aircraft systems, autonomous underwater vehicles, and unmanned surface vehicles can be used for data collection purposes [12]. Each of those systems has its respective strengths and restraints. Recently, the usefulness of Uncrewed Aerial Vehicle (UAV) imagery for habitat classification has become apparent, mainly because of its high resolution and lower cost compared to satellite imagery [13,14]. In situ collected data of water and ecosystem quality from UAVs can be beneficial in closing spatial data gaps through obtaining near-real-time, fine resolution, and spatially explicit information [15]. UAV imagery is commonly used in coastal zones due to being less time-consuming and labor-intensive compared to other coastal habitat mapping methods such as in situ sampling techniques, acoustic system techniques, underwater video monitoring techniques, and other remote sensing techniques [16]. Remote sensing platforms based on UAVs present an alternative to traditional approaches that can quickly and inexpensively monitor coastal areas. Moreover, drones can support conservation actions and reinforce effective management in protected areas [17]. Hitherto, the number of studies on the application of UAV imagery for intertidal habitat monitoring has been limited [18]. UAVs offer a flexible, intermediary spatial scale between satellite imagery and photographic surveys conducted on the ground [19]. Furthermore, they offer the possibility to acquire imagery at different altitudes and therefore different spatial resolutions [19]. High-resolution imagery is of interest because of its ability to capture the typical fine-scale heterogeneity of intertidal areas. Globally, scientists have been recognizing those advantages of UAV use and during the last years the use of UAV imagery to perform fast, accurate, and detailed biological scans, covering large spatial areas of intertidal habitats has been increasing [18]. Examples include European researchers mapping large algae communities in Ireland and France [20,21], Chinese and Japanese researchers mapping 3D morphological characteristics of the intertidal zone [22,23], North American researchers quantifying eelgrass wasting disease on the Pacific coast [24], and Australian scientists using UAV multispectral imaging to map intertidal salt marshes to prevent mosquito-borne diseases [25]. The current study was performed along the coastline of Puerto Ayora, a small town situated on Santa Cruz island, which forms part of the Galapagos Archipelago. The predominant habitat type along the Galapagos coastlines is shallow subtidal rocky reef habitat. Since in the Galapagos Islands, 97% of the land is protected and ecosystem dynamics are highly vulnerable, methods to collect information in a timely and accurate way are essential for sustainable management and decision making [26]. In this research, we examined the suitability of UAV high resolution aerial imagery for the classification of intertidal areas of coastal regions of the Galapagos archipelago by developing an orthophoto, a digital elevation model (DEM), and an orthophoto-draped 3D model of the intertidal zone [27]. Additionally, the accuracy of the created operational framework was studied and future optimizations and recommendations were discussed. The generated visual outputs can be used in various environmental monitoring and modeling (e.g., climate change) applications and might function as a baseline for restoration projects as well. For example, the provided data could be used for sea level rise predictions, habitat deterioration follow-ups, hydrodynamic models, and sediment transport models. These in turn can aid safeguarding the local municipalities through improved coastal defenses and can protect intertidal zone ecosystems from the effects of climate change.

2. Materials and Methods

2.1. Study Area

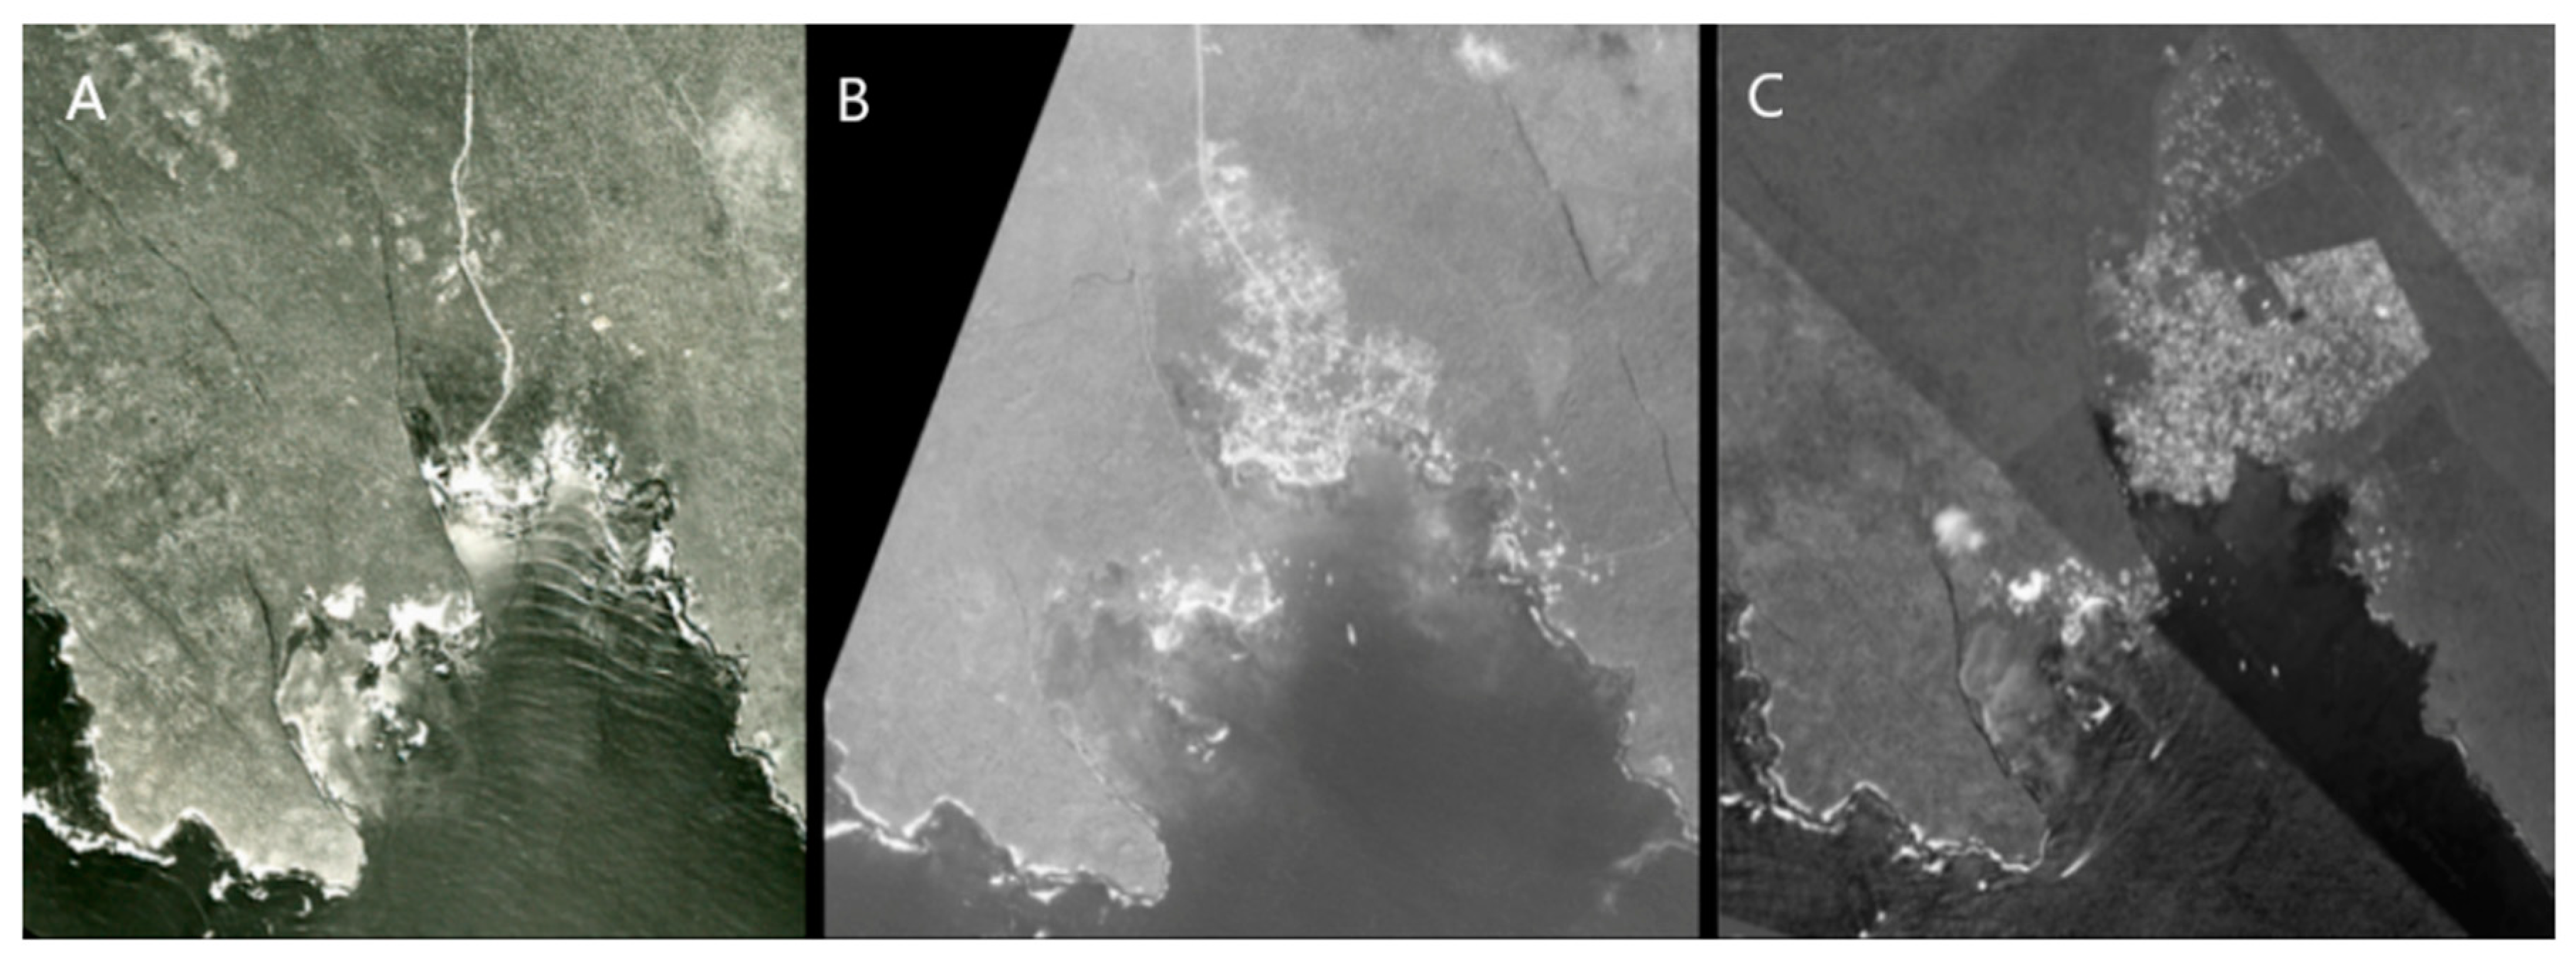
The Galapagos archipelago consists of 13 major volcanic islands and more than 300 islets and rocks. It is located approximately 1000 km from the Ecuadorian mainland and characterized by high levels of biodiversity and endemism [28]. Santa Cruz is one of the major inhabited islands in Galapagos and it is the main island for tourism. The island has an area of 1794 km2 and about 15,701 inhabitants [29]. This study was performed along the coastline of Puerto Ayora, a small town situated on Santa Cruz island (Figure 1). The port area of Puerto Ayora has been changing throughout the years due to urbanization (Figure A1). The increasing urbanization intensifies the pressures on the Galapagos ecosystems. For example, the discharge of ballast water coming from tourism cruises has already resulted in the introduction of non-endemic fauna and flora species to the coasts of the Galapagos Islands [30]. Moreover, as more waste is created and no sewage treatment is present yet in Puerto Ayora, the demand increases [1].

2.2. GNSS Measurements for Georeferencing

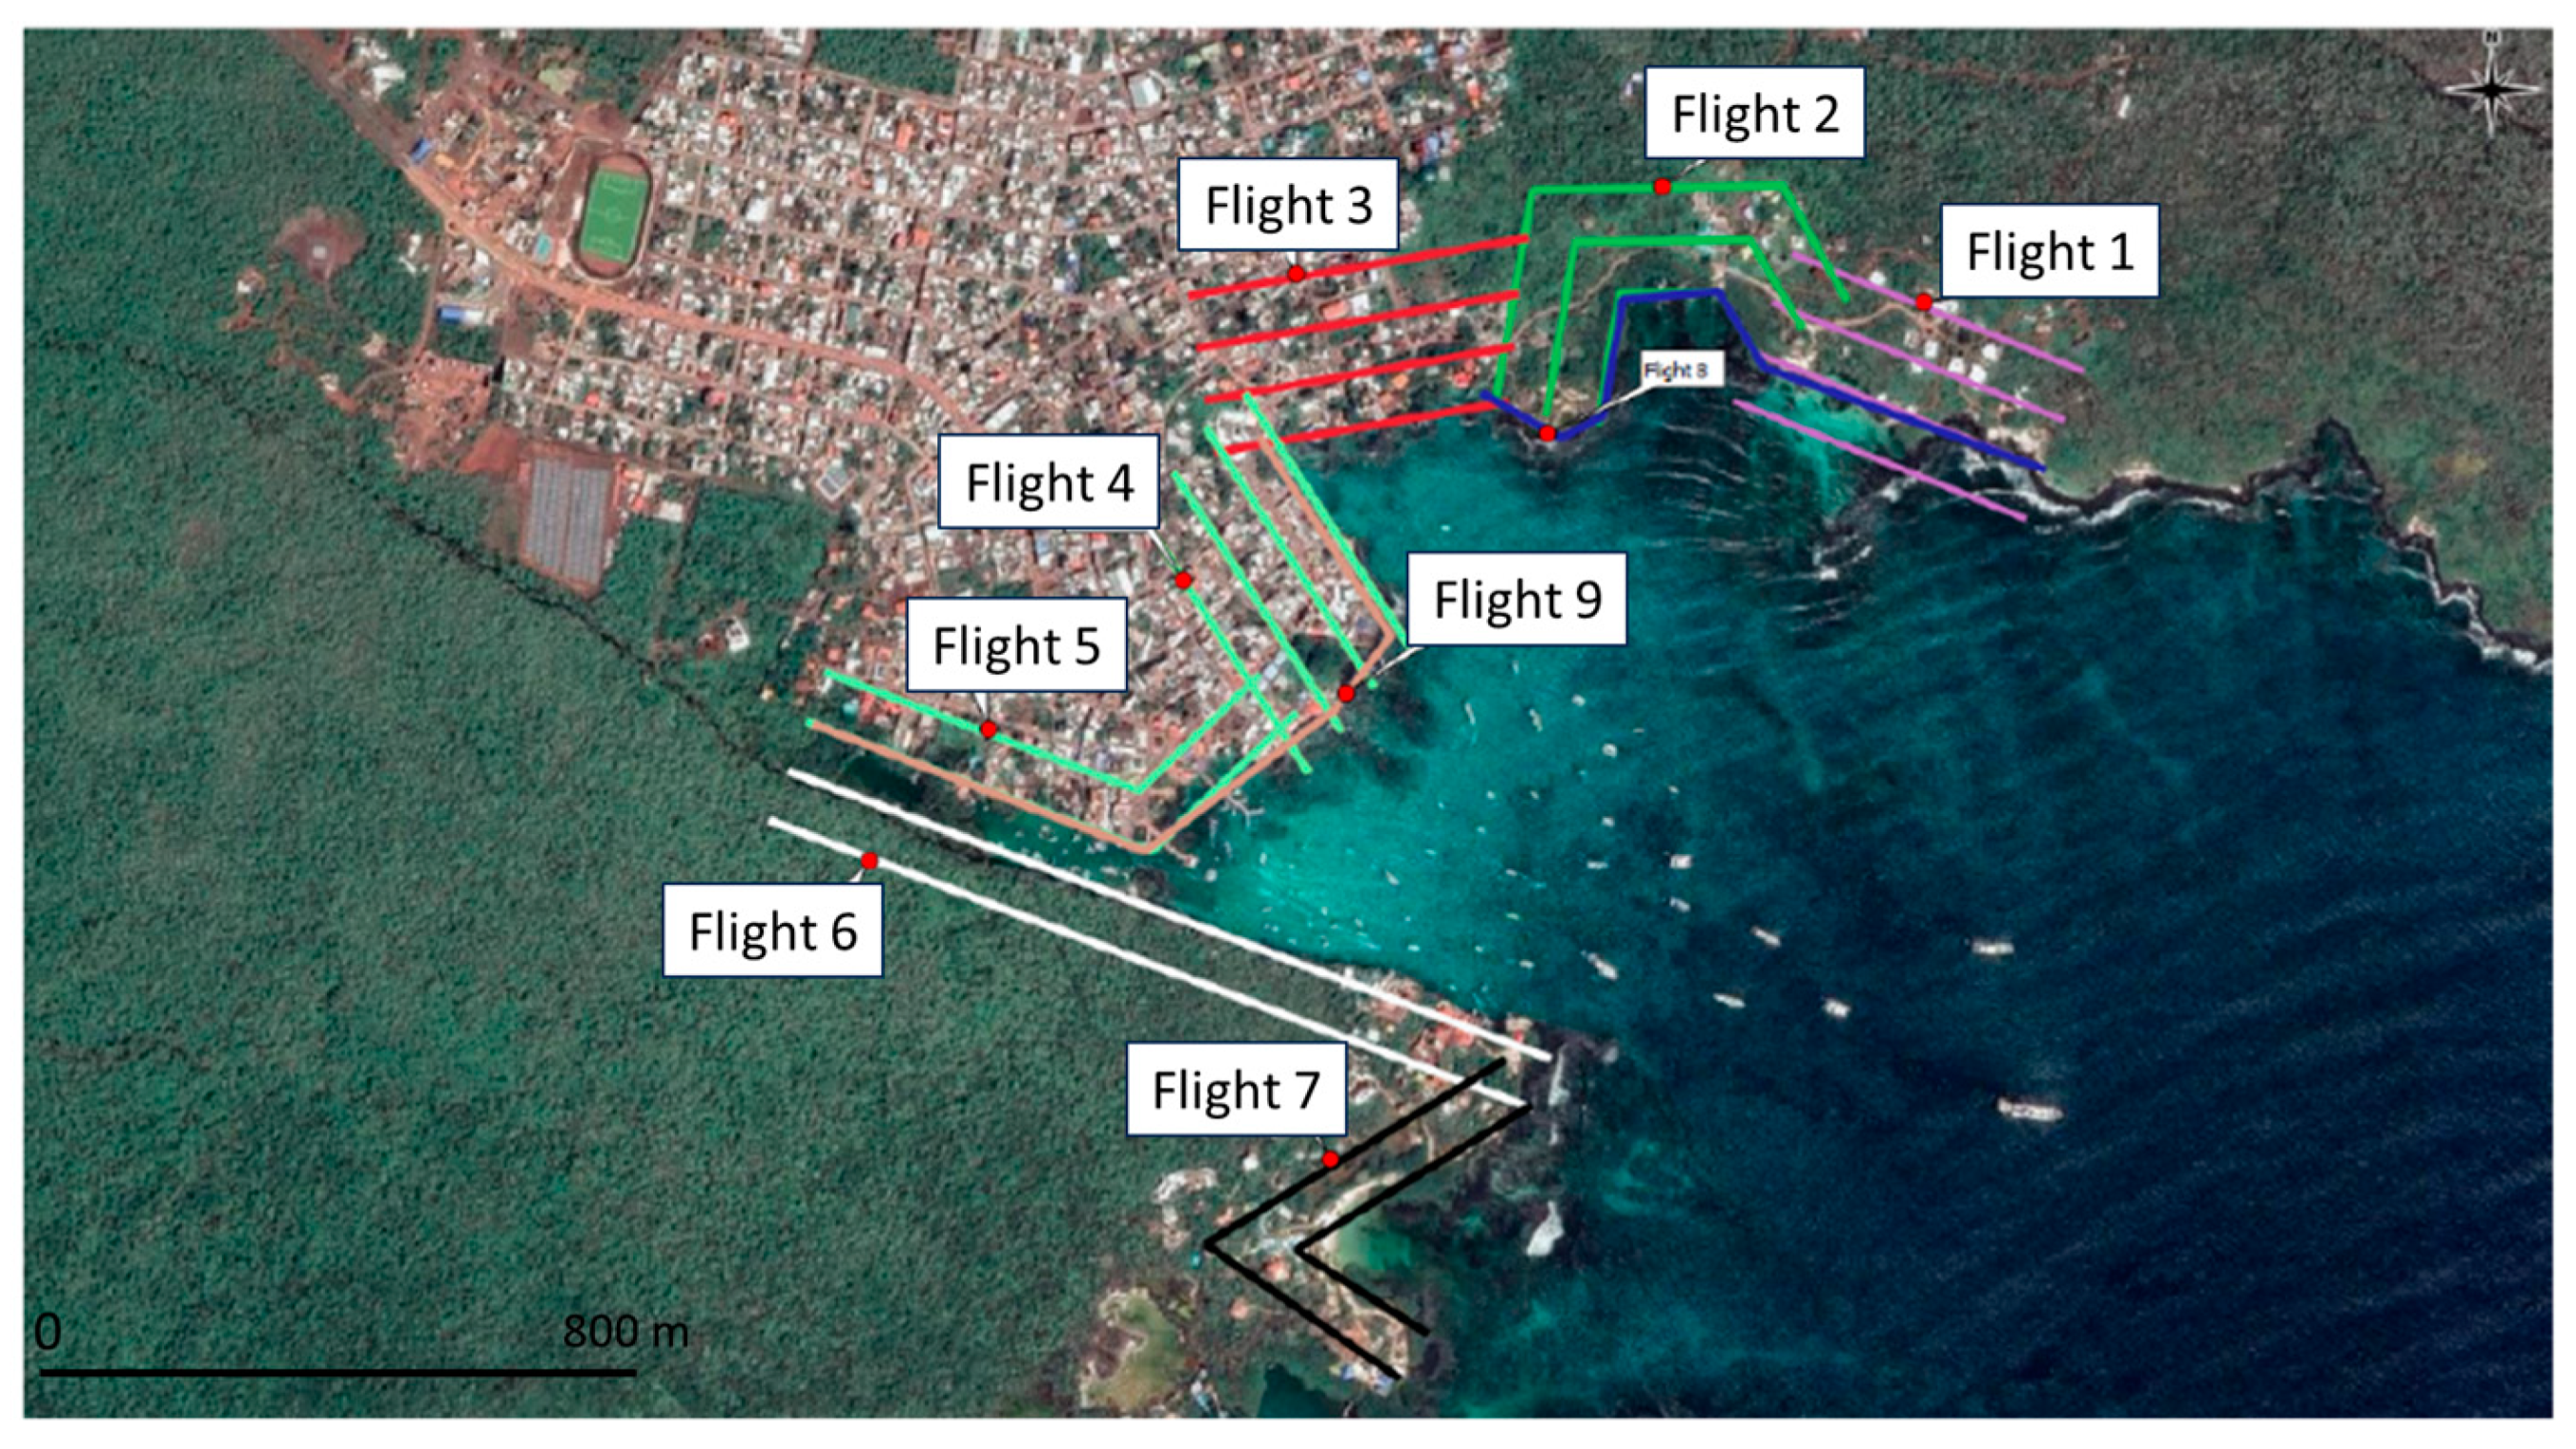
Ground control points (GCPs) were placed to serve as base for georeferencing the model through the use of UAV imagery. To mark the GCPs, squared sheets of light color were used. With black paint, we assured that the middle of the sheet could be easily recognized on the aerial pictures. On the days before the UAV flights, twenty targets were placed in the field. Most GCPs were placed on the roofs of houses and hotels for optimal visibility, accurate GPS measurements, and to avoid disturbance of the targets by tourists or inhabitants during the flight period. Possible interference of wind was taken into account by placing heavy stones on the sides of the sheets. Because of the densely built and crowded location, little accessible roofs and roof top terraces were preferred. Several easily identifiable points, such as street corners and paintings on the road, were chosen as additional GCPs to ensure sufficient coverage of the whole study area. Seventeen easily identifiable points were selected based on the aerial pictures of flights with insufficient GCP coverage (Figure A3). Twenty of the GCP target sheets were placed along the coastline; however, six of the targets were not used for georeferencing due to movement by wind, inhabitants, etc. To compensate, an additional easily identifiable point on the corner of a roof was measured. In total, 14 targets and 18 easily identifiable points were suitable for further use in this study.
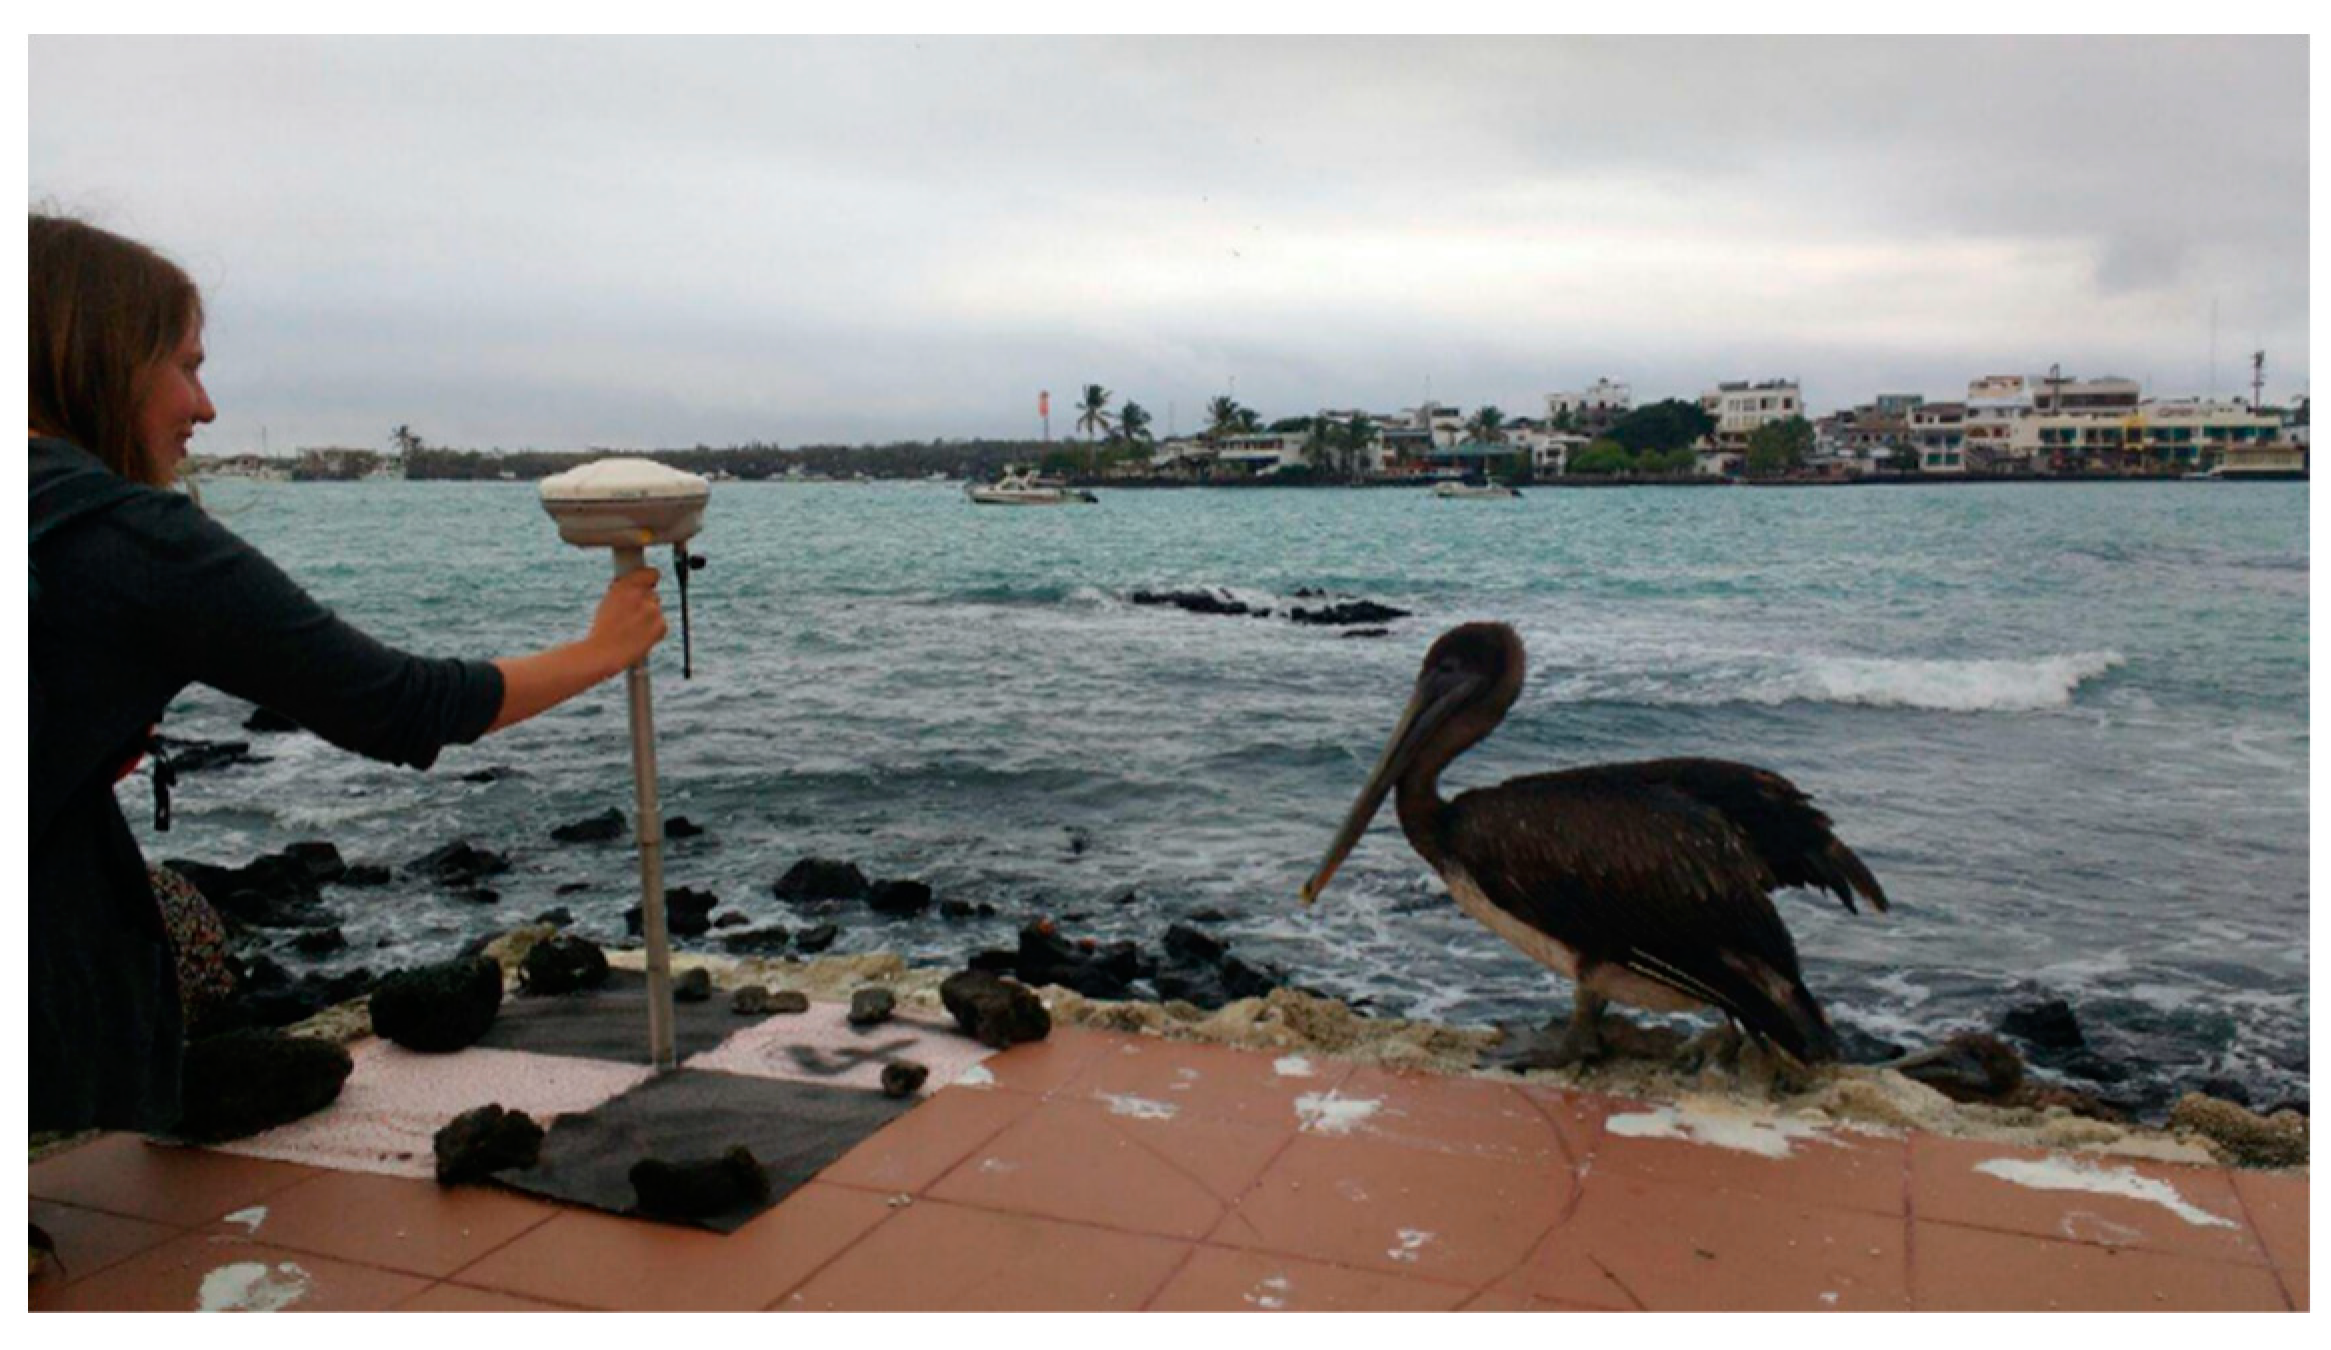
The coordinates of all GCPs were measured with a global navigation satellite system (GNSS) receiver. The geodetic materials used in this study were the Trimble 8 and Trimble 10 [31]. The Trimble 8 was used as rover and was taken to all the GCPs, whereas the Trimble 10 was used as base station by being placed on the exact same location during all GNSS measurements (Figure 2). That particular location was chosen to be central in the study area on a roof of a high hotel building (gcp53 in Figure A3). The coordinates of the GCP were obtained in four steps. Firstly, the position of the base station was logged during a short time period (ca. 1 min) to determine a rough estimate to save time and to be able to start the measurements shortly after the set-up. Secondly, the coordinates of all GCPs were measured with the rover and corrected by simultaneous measurements of the base station, using the real time kinematic (RTK) method [32]. Regardless of the apt position of the base station, occasionally it was not possible to make a radio connection between rover and base station. In that case, the coordinates of the GCP were determined without real-time corrections from the base, using the post processing kinematic (PPK) method. In a third step, the position of the base station was logged for several hours and its accurate position was calculated via use of the AUSPOS web service of Geoscience Australia [33]. Finally, the rough estimate of the base coordinates, used for obtaining the corrections for RTK and PPK, were replaced in post-processing by the accurate coordinates. All rover measurements were shifted according to the correct base position and corrections were applied for the points that were measured via PPK, which was the case for three points (gcp51, x8, and x9). This process was executed in Leica Geo Office. The precision of the measurements for both RTK and PPK is shown in Table A1. The corrected coordinates of all GCPs in the UTM 15S coordinate reference system are found in Table A2.

2.3. Imagery Collection with Uncrewed Aerial Vehicle

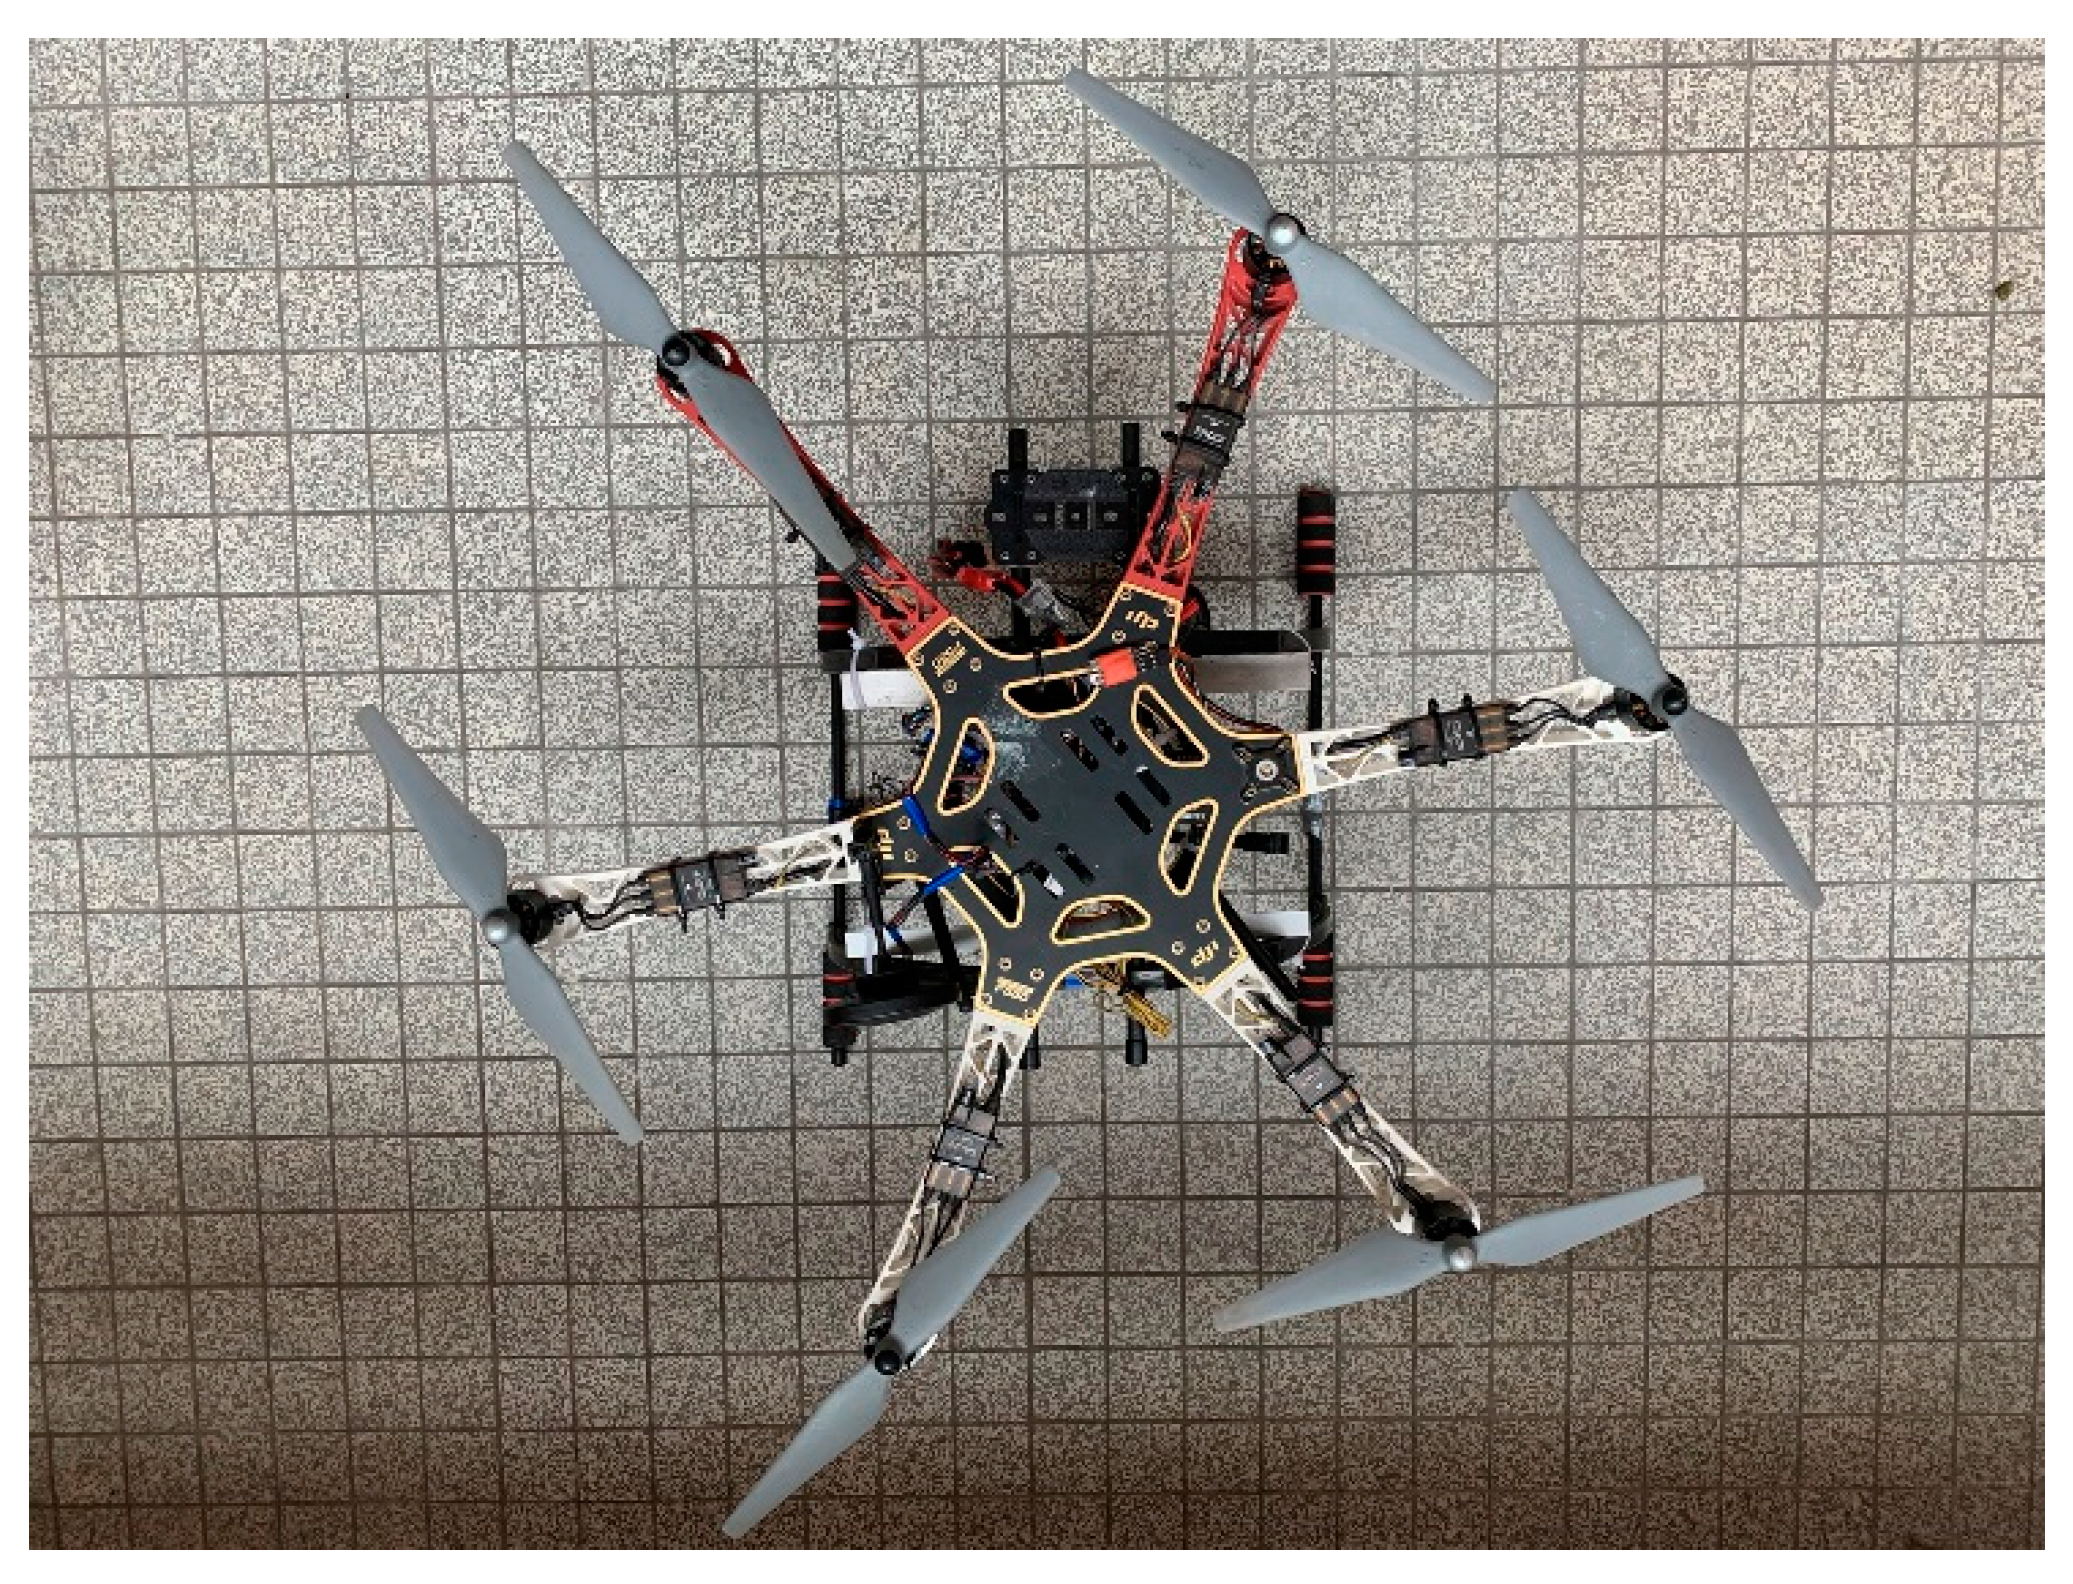
The DJI 550, a small rotary-wing UAV with 6 motors, was used for the study (Figure A2 and Table A3). The small size of this UAV was considered to be practical for transportation by plane and by boat. Aerial pictures were taken with a RGB camera: the Sony NEX 5R (Table A4). The flight routes were drawn in QGIS 2.18.16 and a Python script was used to transform the shapefiles into waypoint files. The waypoints were imported in the flight control software, Mission Planner. By using QGIS together with Mission Planner, we had more control over the complex flight plan. Images were captured on the 9th and 10th of August 2017 at 120 m.a.s.l. (meters above sea levels) with an image pixel size of 2.86 cm. The tidal information of those days is summarized in Table A5. Nine flights were executed to obtain imagery of the whole shoreline of the study area (Figure 3 and Table A6). The parameters used for the flight planning of all nine flights via Mission Planner are described in Table A7. The nine flights that were executed for this research resulted in nine sets of RGB images. After deleting several pictures during tests, take off, and touch down, 1172 images were retained. Only areas not covered by water at the time of flight were considered. Therefore, all images were scanned and the water was masked manually on the images which had not been collected during low tide flights. Additionally, several moving boats were masked. Six images were fully masked, because they only showed water surface taken in a non-low tide flight. Those were not incorporated in the creation of the model. Finally, 1166 images were retained and used for the orthophoto-draped 3D modeling. The used drone covered a total area of 1.19 km2.

2.4. D Modeling of the Coastal Region

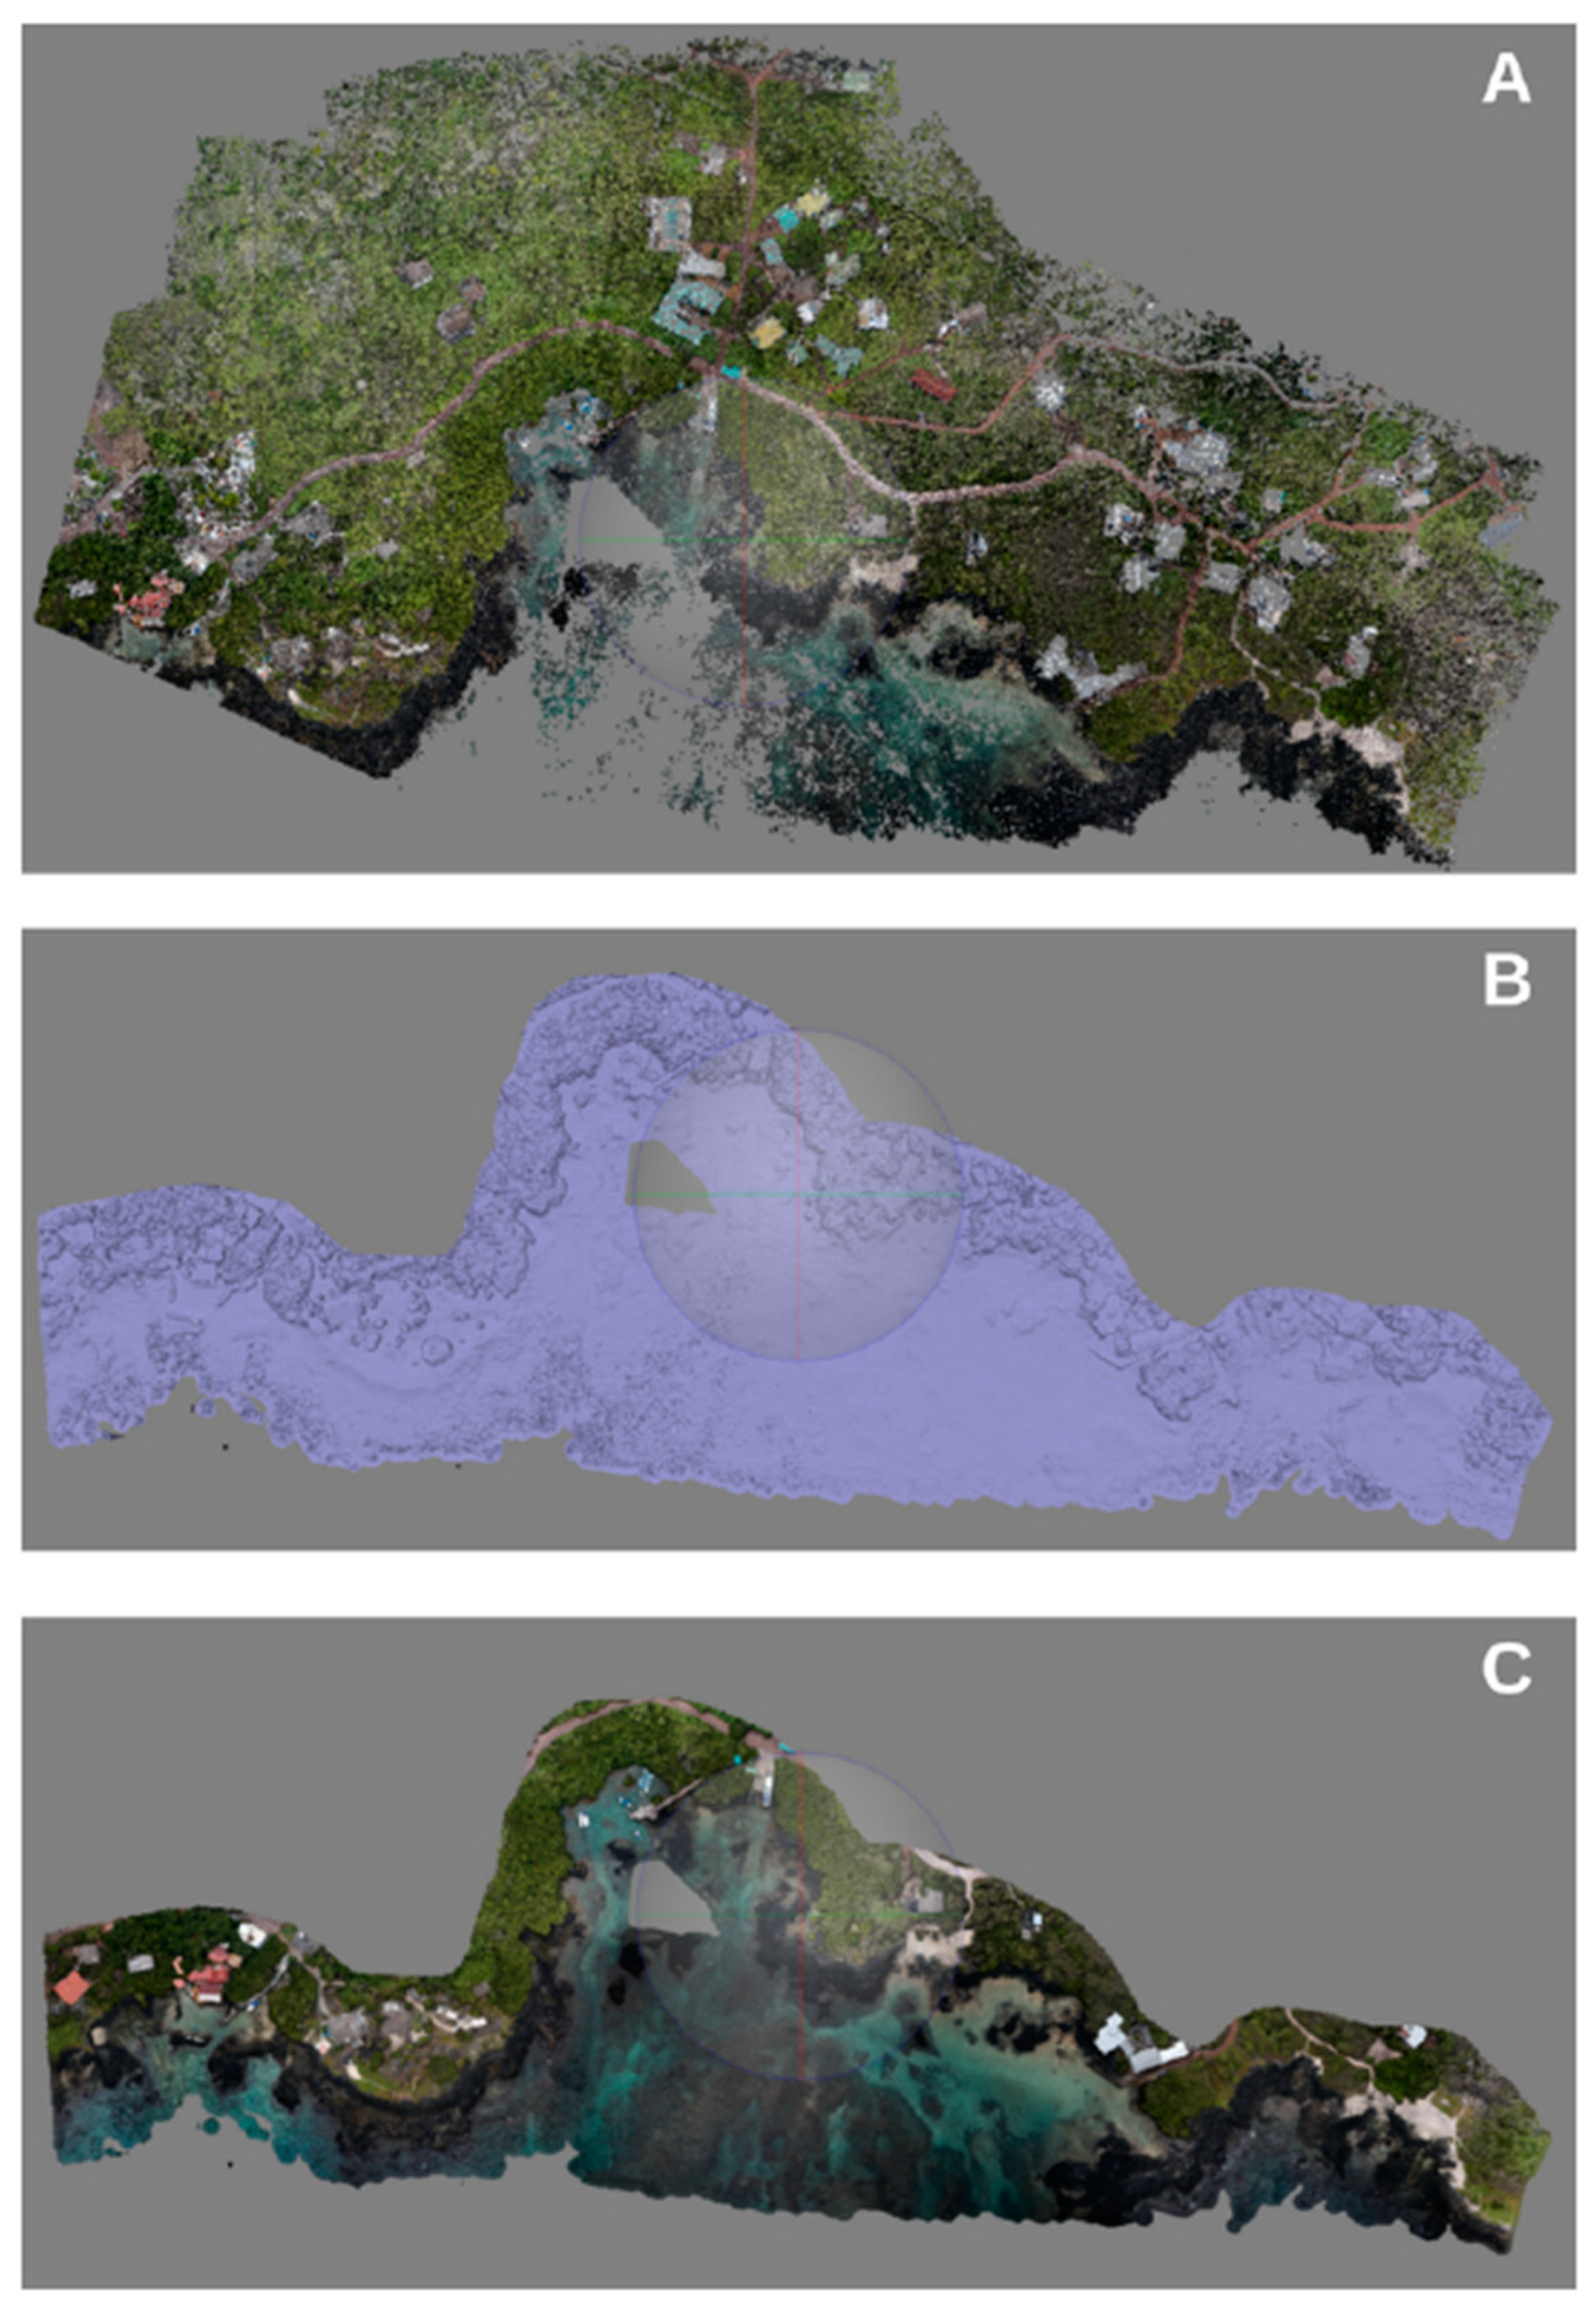
The processing of the UAV imagery was done via Agisoft Metashape (version 1.2.5 build 2735), which is a commercially available software package for automated photogrammetry based on image matching and bundle adjustment [34]. In a pre-processing step, the UAV camera is calibrated to determine the parameters of the interior orientation of the camera: focal length, frame size, pixel size, coordinates of principal point, and values of lens distortions. This is supported in Metashape on a procedure based on chessboard patterns [14]. With this information, Metashape combined all images via an aligning process based on pixel-based stereo image matching [35]. Firstly, all photographs of the nine flights were aligned and fused into one model. Matching points between the photographs were searched for. GCP coordinates were added to the project and GCPs were manually tied to the corresponding images for the production of the georeferenced outputs. The guided approach was used to predict the UAV images showing the same GCP.
Secondly, the model was georeferenced by applying a seven-parameter similarity transformation (three parameters for translation, three for rotation, and one for scaling). Georeferencing corrected for linear errors. During this optimization, Metashape adjusted the estimated point coordinates and camera parameters by minimizing the sum of the reprojection error and the reference coordinate misalignment error. Due to this optimization, the georeferencing accuracy improved from around 33 cm to 2.65 cm (Table A8). Thirdly, a dense cloud and a mesh were built and texture was added. To start, the process was tested and optimized for a subarea of the study area, the coastline of the Charles Darwin Research Station (Figure 4). After the creation of a dense point cloud, we deleted all points that were not of interest. To reduce the computing time, we clipped out the points that were too far from the intertidal zone. This step was done by manual drawing of polygons while taking into account a safety margin. Afterwards, orthophoto-draped 3D models were created using all the UAV imagery, including those further away from the intertidal zone. Table A9 summarizes the selected parameters for the creation of the model. After optimization of the process for the subarea, the complete study area was processed with the same parameters, excluding the building of the mesh. Separately, the mesh of the complete study area was computed with a lower polygon count than the subarea. Finally, three outputs were created: a rectified image or orthophoto, a DEM, and an orthophoto-draped 3D model. The orthophoto and the DEM were both developed for a subarea of the study area, the coastline of the Charles Darwin Research Station, and for the complete coastline. The area around the research station was considered to be relatively pristine and therefore the number of anthropogenic structures (i.e., landscape elements we were not interested in) was limited. That is the reason why the classification and its validation were focused on this specific area. The final orthophoto-draped 3D models have been shared open-access: 10.5281/zenodo.7924523 (accessed on 15 May 2023).

2.5. Automatization of the Habitat Classification

2.5.1. Preprocessing of the Orthophoto

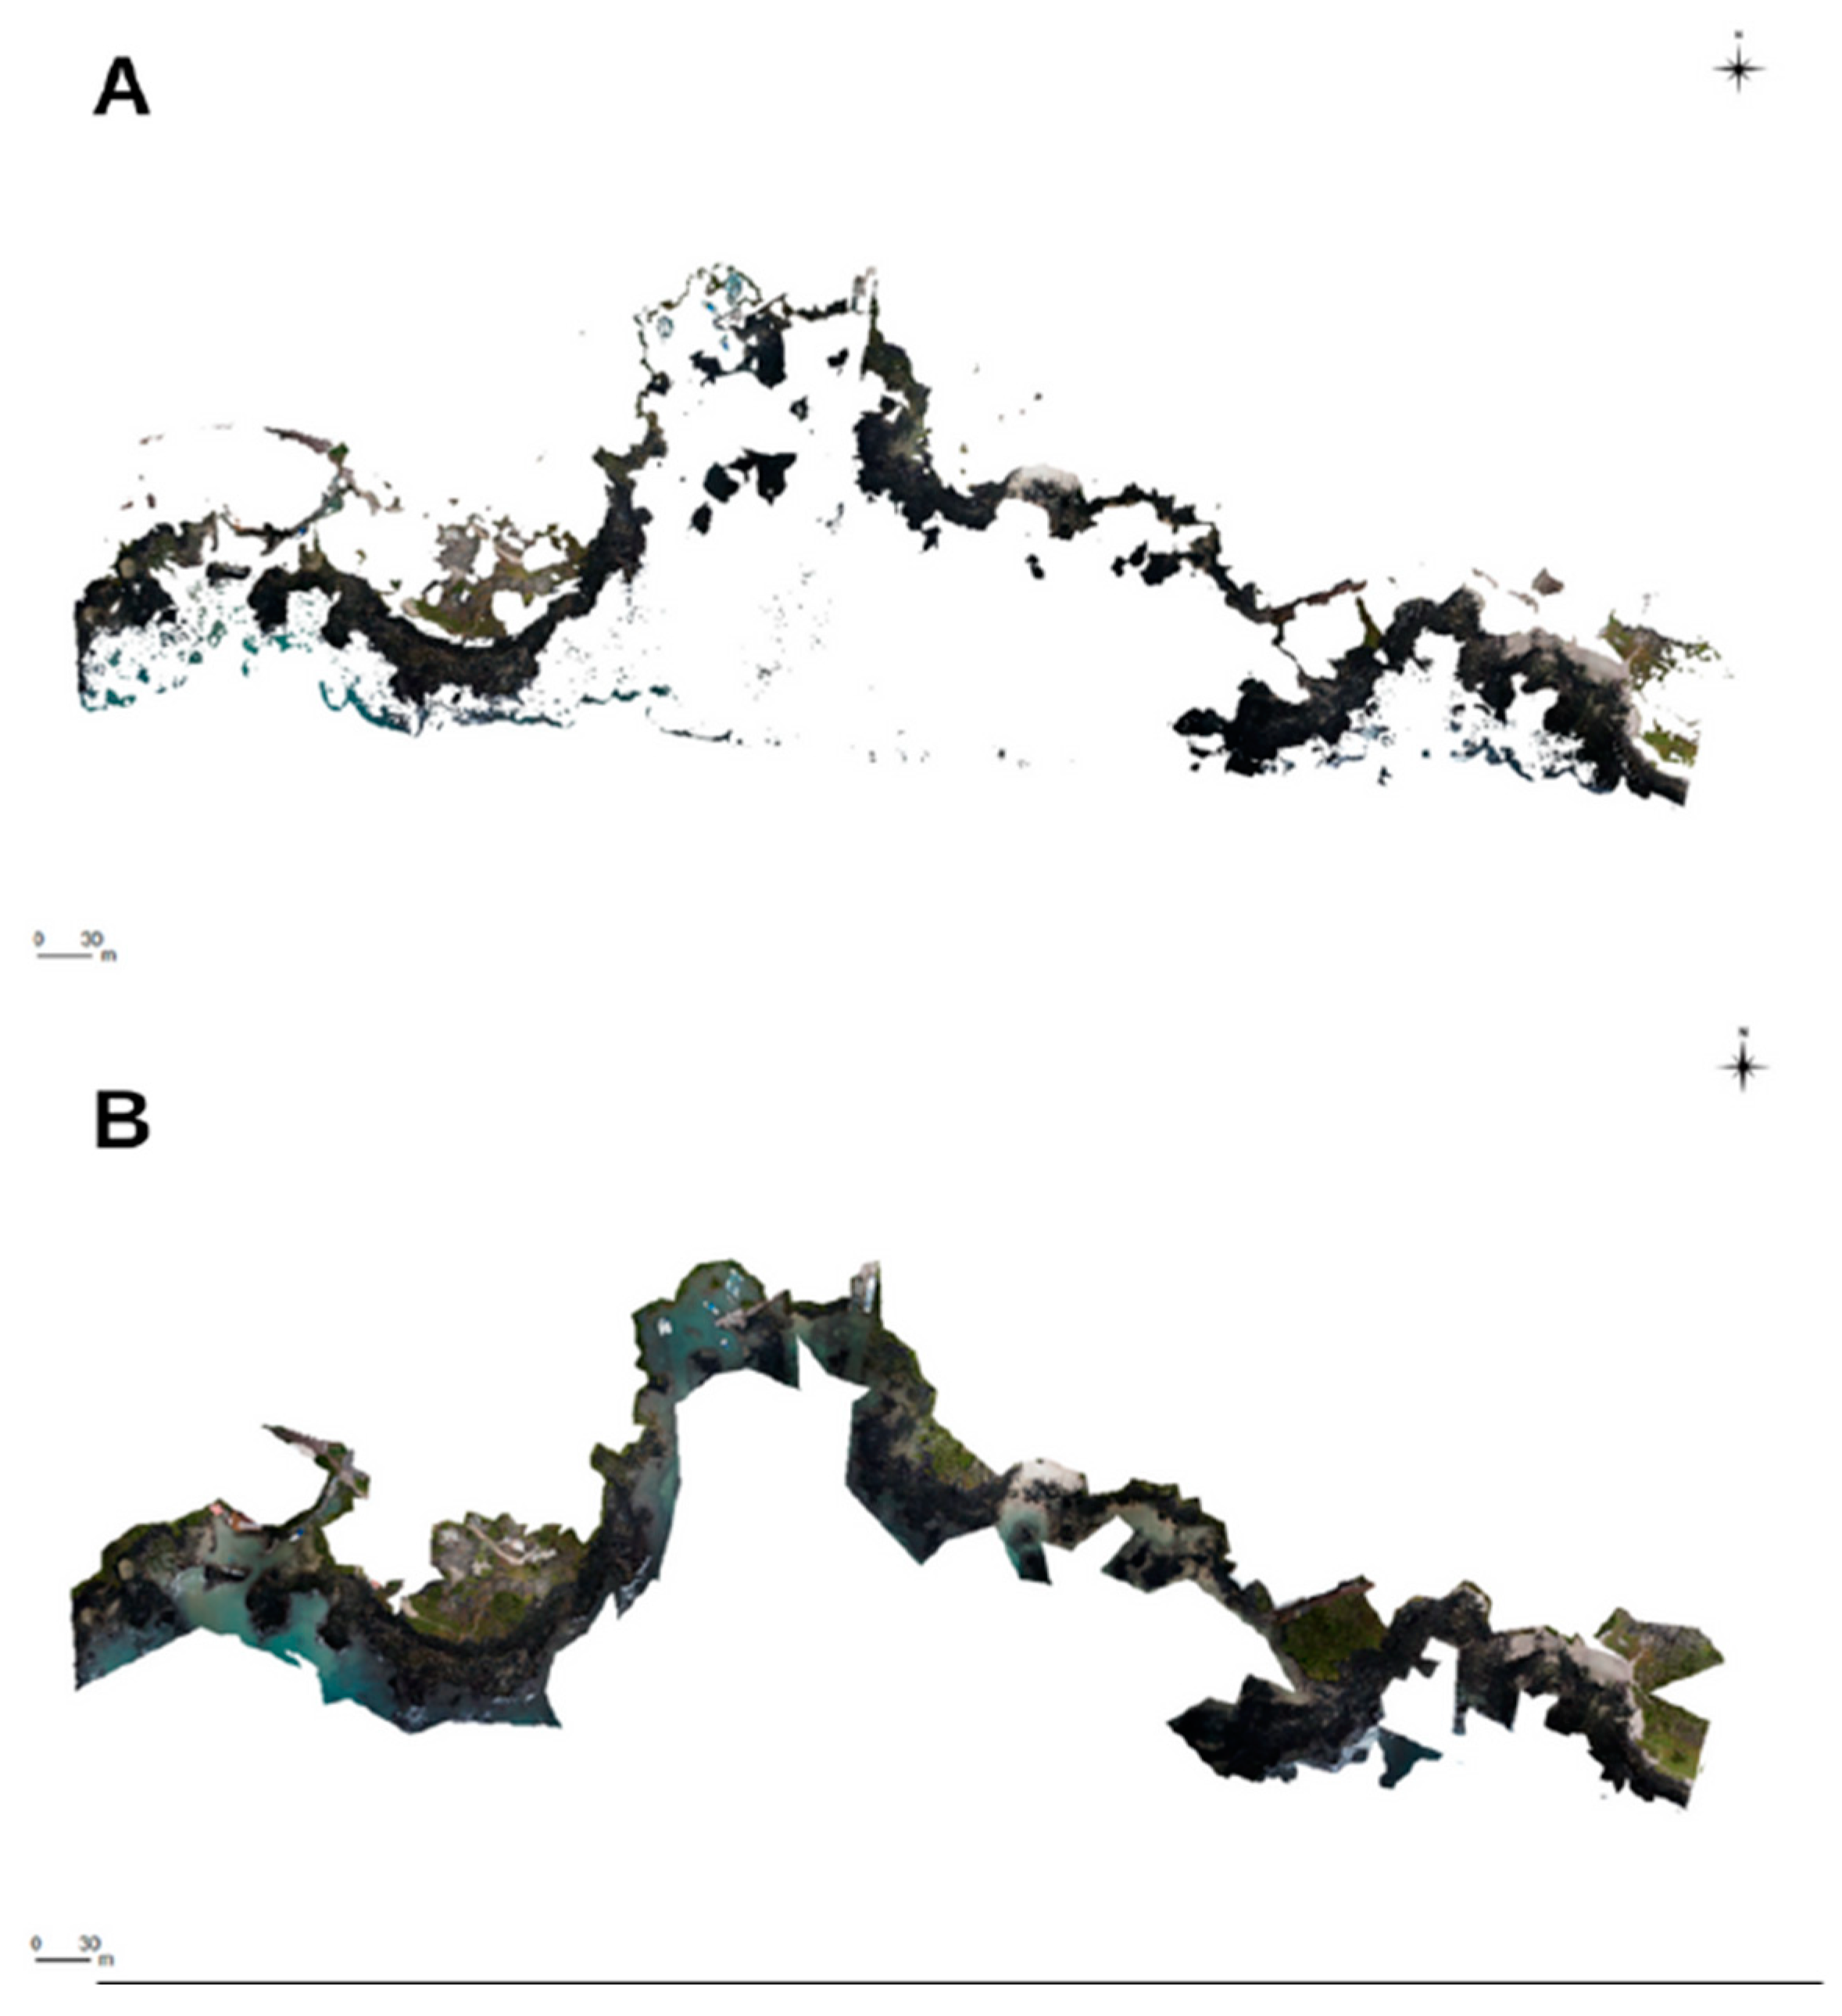
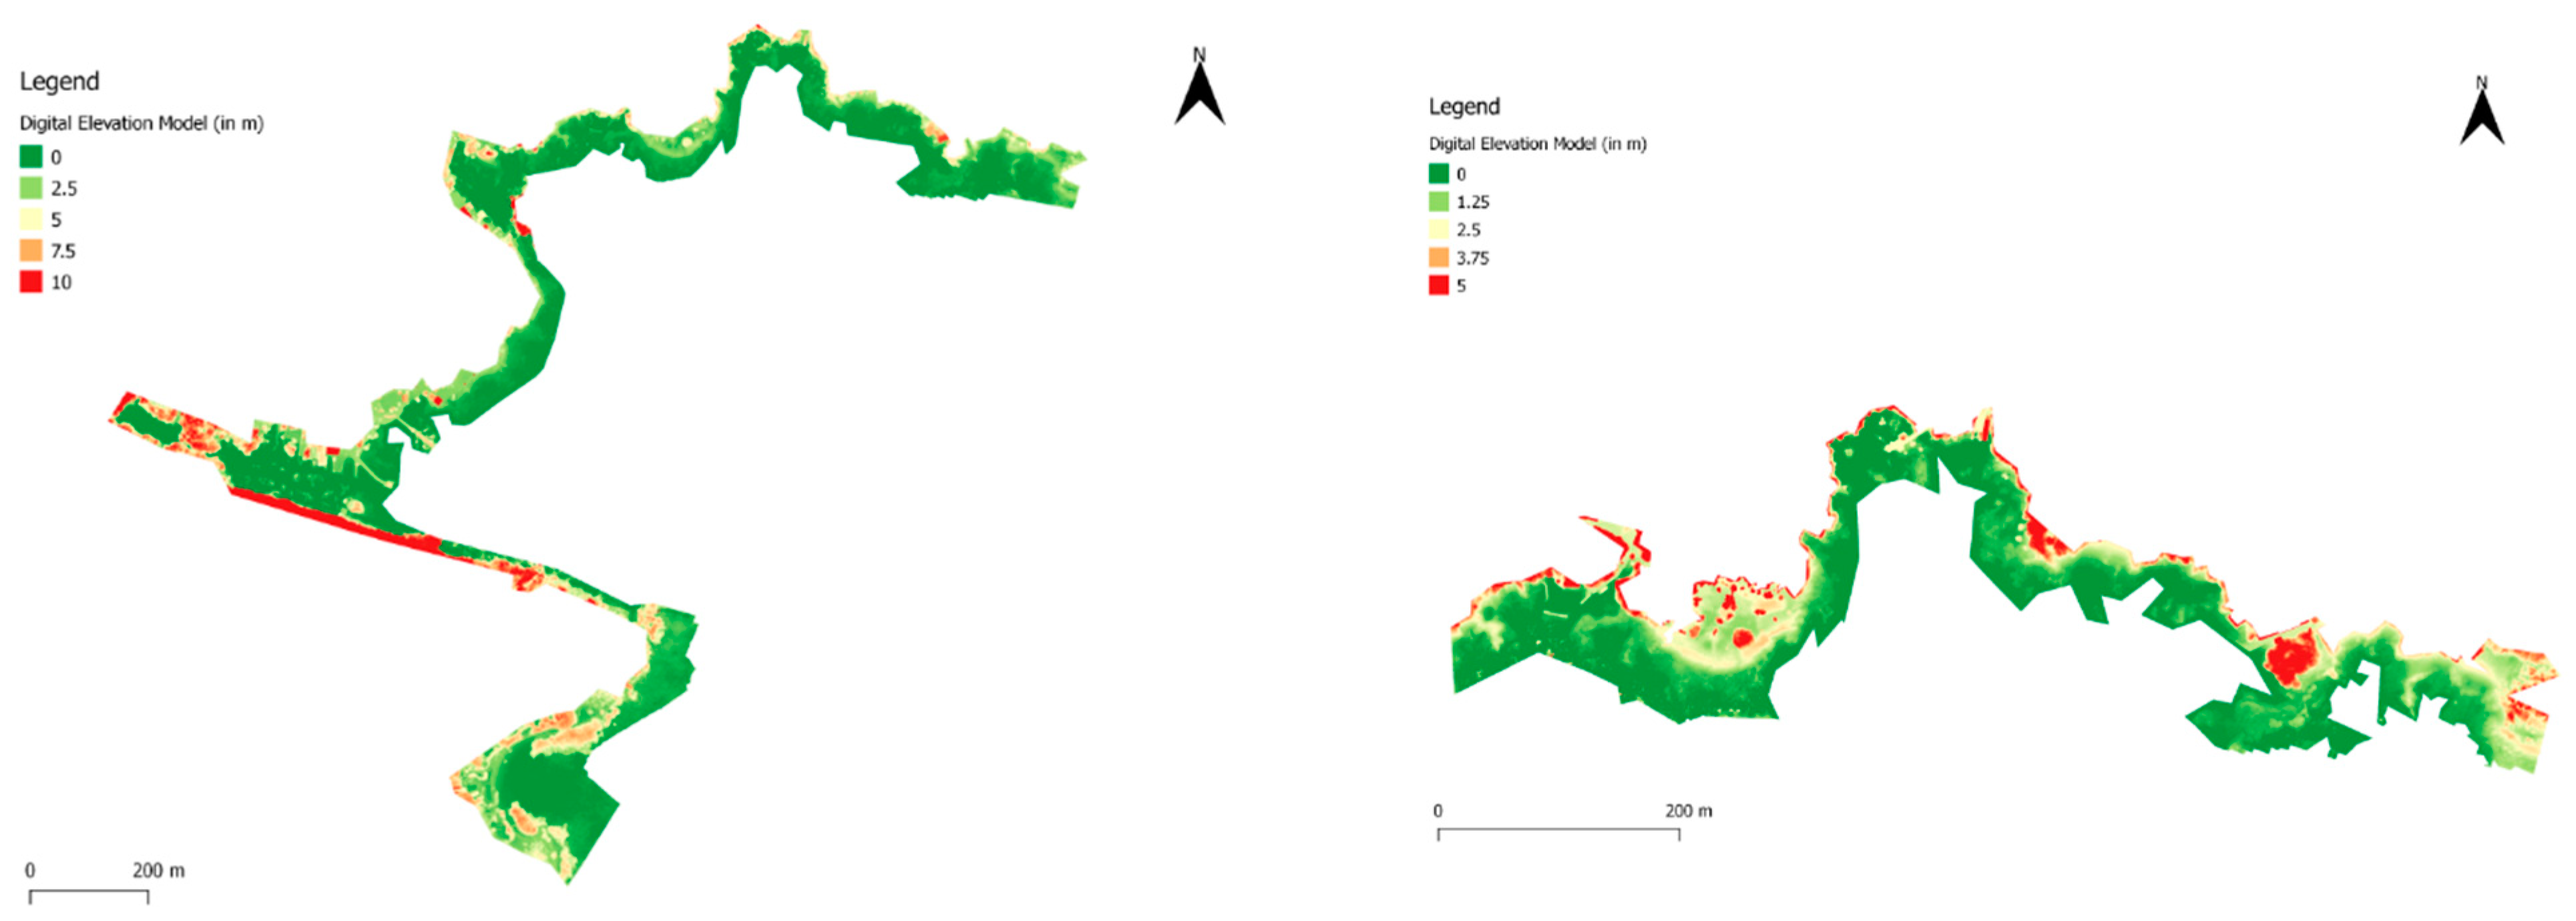
The created orthophoto and DEM were processed in order to perform habitat classification using GIS software [36]. All the areas on the orthophoto that were not included in the intertidal zone were cut out of the image by use of GIS software (ArcMap 10.5.1 and QGIS 2.18.16). As most imagery was captured at low tide, the DEM and orthophoto resulting from the modeling also shows the area at low tide. From the tidal forecast of Puerto Ayora, a maximum tidal range of 2.42 m was derived [37]. Therefore, the intertidal zone could be identified on the DEM as the area between sea level at low tide and about 2.50 m above that level. To extract the intertidal zone from the DEM, the following expression was used in the ArcMap 10.5.1 raster calculator: ‘(“DEM.tif >= 0”) & (“DEM.tif” <= 2.5)’, which resulted in a binary raster. This binary raster was multiplied with the three bands of the orthophoto in the QGIS raster calculator to extract the cells that correspond with the DEM cells between 0 and 2.5 m. The bands were afterwards recombined using the tool ’Build Virtual Raster’ in QGIS. The obtained output (Figure 5A) was used to manually draw the upper and lower bound of the intertidal area in ArcMap.
The extraction tool ’Clipper’ was used to extract the intertidal zone between these boundaries from the orthophoto (Figure 5B). This last step was necessary as in the result of the DEM extraction (Figure 5A), the neighboring pixels of the DEM, with values between 0 and 2.5 m, were not retained. This made the image less suited as a base layer for classification [19]. This effect could have been caused by water or vegetation covering the surface or by errors in the DEM. Due to the manual process, several buildings were included in the image. However, those were eventually excluded prior to the classification.

2.5.2. Classification Procedure

In line with ecological habitat monitoring and assessment protocol, a distinction was made between four physical habitat classes: sand, vegetation, rock, and water. The latter class was used for deeper sites that remained under water during the flights. Buildings and boats on the images are strictly seen as not part of the intertidal zone, but some were still present on the intertidal orthophoto. Those vary highly in spectral characteristics, so it was decided to not include them as a separate class. They are expected to be classified as another class or to remain ’unclassified’. A choice for supervised object-based classification was made based on promising results in previous research [38,39,40] and because no extra post-processing steps are required with this technique. The segmentation process in the object-based image analysis (OBIA) approach involves grouping adjacent pixels based on their similarity, considering both color and shape characteristics [41]. This approach effectively averages the pixel values while incorporating geographic information, resulting in the creation of objects that closely resemble real-world features in the imagery. As a result, segmentation produces cleaner classification results [42]. Different segmentation procedures were tested in order to find one that was acceptable in terms of computing time and effectiveness. Although different segmentation algorithms were already available in the open source software QGIS, they all occupied longer computing times or a higher computing memory compared to the ‘Segment Mean Shift’ algorithm (ArcMap® software 10.5.1) [43]. Therefore, in this study, it was chosen to work with the latter. The tool ‘Segment Mean Shift’ grouped adjacent pixels with similar spectral characteristics together. It allowed for controlling the amount of spatial and spectral smoothing via three input parameters (Table A10). The parameters for spectral and spatial detail could vary from 0 to 20. For spatial detail, a high number was desired because some features were small (e.g., small rocks on sandy parts). The minimum size of the segments was found to be optimal at a value of 3 pixels. Once a segmented image was created, the supervised classification process could start using the ‘Semi-Automatic Classification’ (SCP) plug-in (QGIS ® Software 2.18.16) [44]. The objective of SCP is to provide a set of intertwined tools for raster processing in order to make an automatic workflow and ease the land cover classification, which can also be performed by researchers outside of the remote sensing field [45]. Firstly, the segmented image was selected as the input image. Subsequently, a new training signature file was created. For the creation of a training set, ROIs (regions of interest) were selected. Ten ROIs per class were created by the automatic region growing algorithm. The parameters used for the application of the algorithm (Table A11) were optimized through use of the classification preview option. For the vegetation and the water classes, a greater maximum spectral distance was used compared to the sand and rock classes, due to the spectral variety within those last two classes. To both classes, five extra manually drawn and more spectral varied polygons were added as training data, as it was noticed that rock and water were often misclassified. While creating the ROIs, a warning often mentioned that the selected ROI was too homogeneous, meaning that the ROI had a singular covariance matrix and the maximum likelihood classifier could not be used. The other available options in the ‘Semi- Automatic Classification’ plug-in were the minimum distance technique and the spectral angle mapper (SAM). The spectral angle mapper (SAM) was chosen due to its relative insensitivity to illumination and albedo effects.

2.6. Validation

A validation was applied based on the UAV imagery and the derived orthophoto. To obtain an independent validation dataset, 40 ROIs were randomly created and an automatic region growing algorithm was used (Table A12). All of the ROIs were manually assigned to their class based on a visual inspection of the orthophoto. This process is facilitated by adding the validation ROIs as a semi-transparent layer on the original orthophoto. Several ROIs were replaced by new random ROIs because they selected a part of a building or boat. The overall accuracy was calculated by dividing the total number of correctly classified pixels by the total number of reference pixels [38]. The producer’s accuracy is expressed as the conditional probability of an area classified as a type of category when the reference data are classified into the same category by the map. The user’s accuracy, on the contrary, is the conditional probability of an area classified by the map as a type of category while being classified into the same category by the reference data [46]. The kappa coefficient of agreement allowed for comparison of the used classification method with a random assignment of the pixels into the categories [38]. In case the kappa coefficient is close to 0, the classification can be assessed as very bad. In contrast, values close to 1, indicate a quasi-perfect classification [47]. The classification accuracy was subsequently calculated through the ‘Semi-Automatic Classification’ plug-in in QGIS.

3. Results

3.1. D Modeling of the Coastal Region

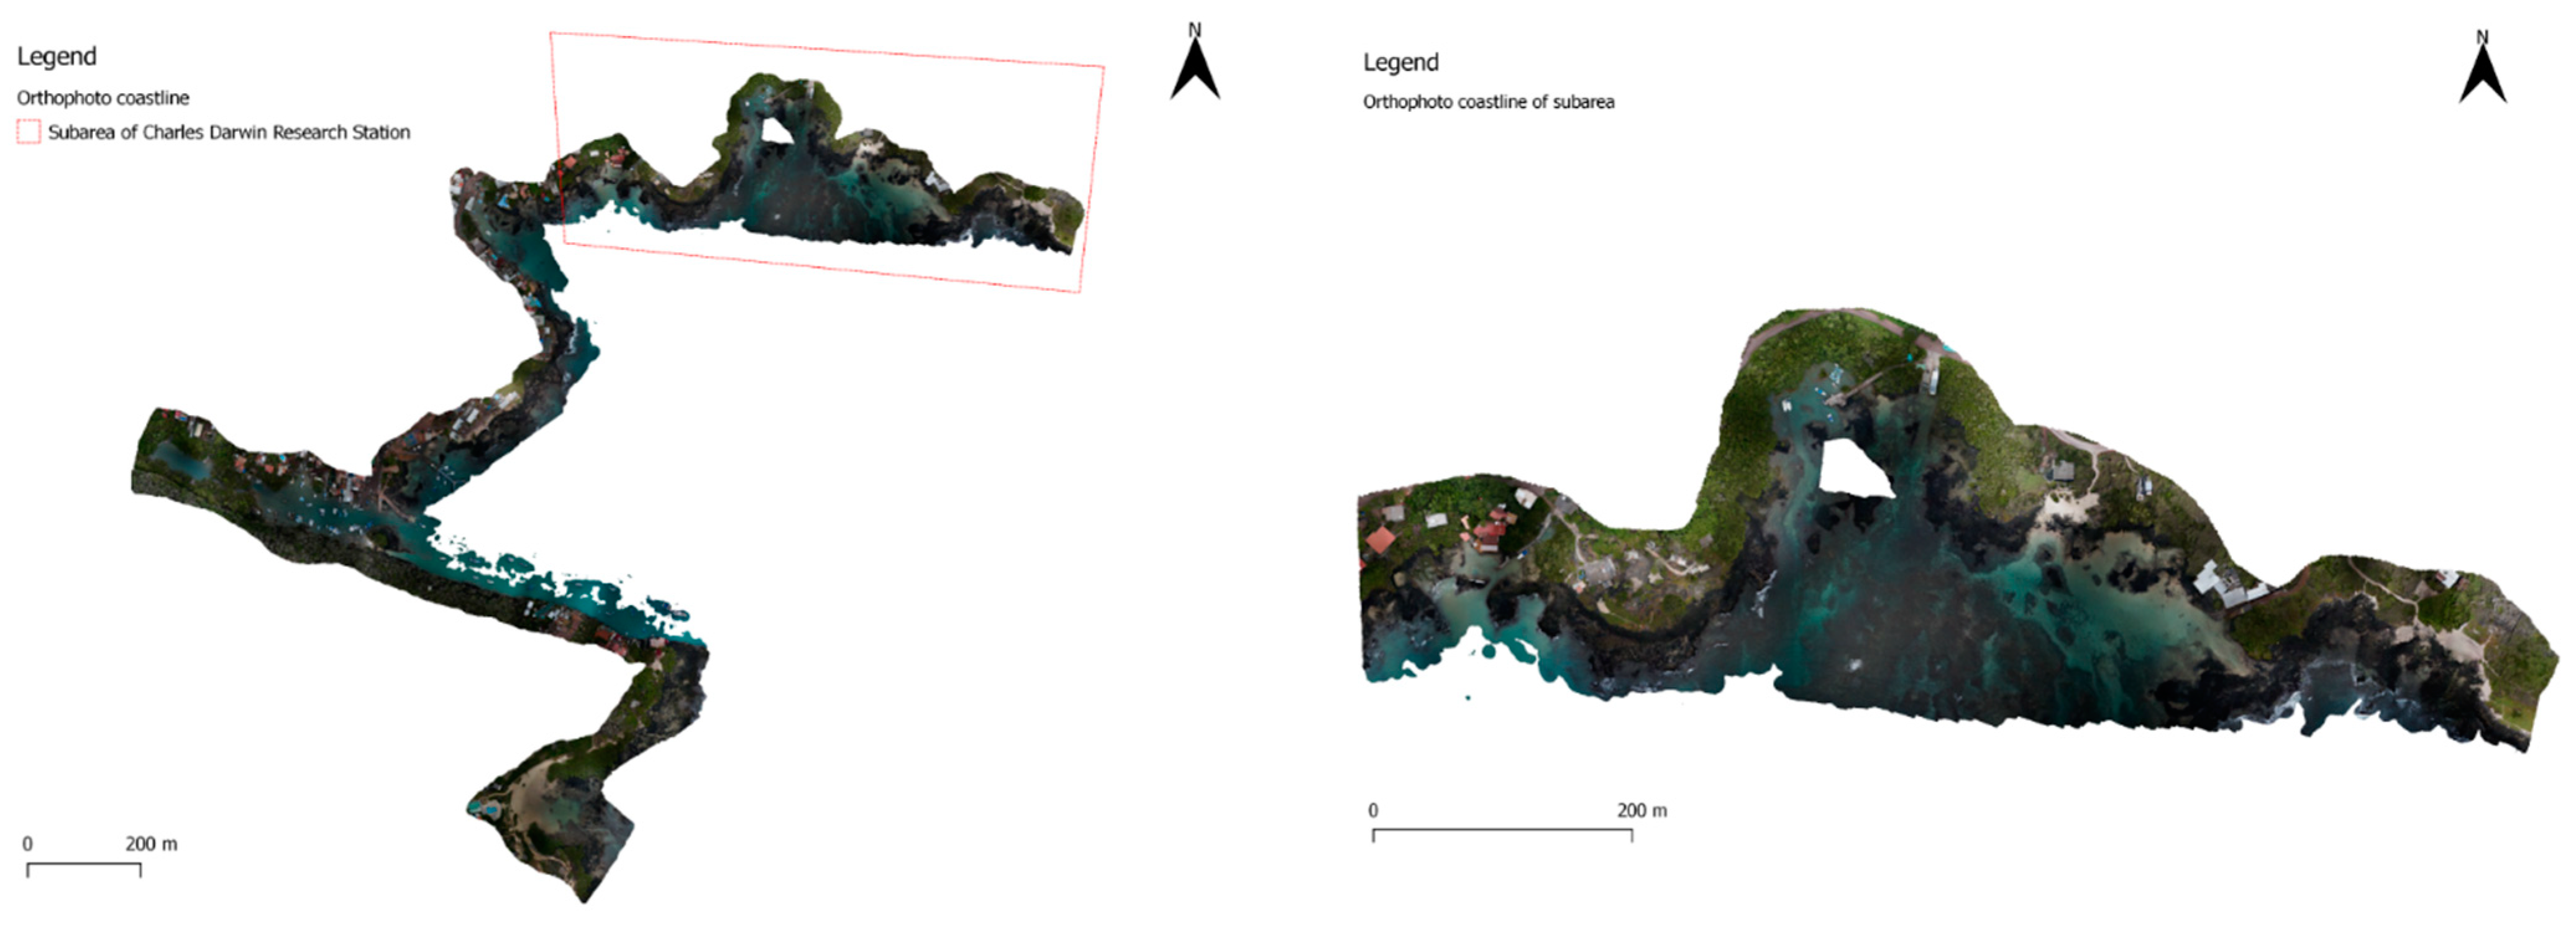
After the allocation of the GCPs on the UAV images, a georeferencing accuracy or root mean square (RMS) error, indicating the difference between the actual location and the modeled location, was calculated in Agisoft Metashape (Table A8). The total georeferencing accuracy (RSME) was 0.027 m. The largest RMSE was found for GCP ‘x9’ (0.062 m). The orthophotos (Figure 6), DEMs (Figure 7), and orthophoto-draped 3D model (open access: 10.5281/zenodo.7924523 (15 May 2023)) were successfully constructed for the Charles Darwin Research Station sub area and the complete study area. The orthophoto-draped 3D model was developed for the complete study area. Computing times of the different modeling steps can be found in Table A13. The steps for building the dense cloud were similar for the subarea and the complete study area. For the creation of the mesh and adding its texture, fewer face counts were included for the complete study area (Table A9). The two DEMs had a resolution of 11.2 cm per pixel and a point density of 80.4 points per m2. The obtained orthophotos (Figure 6), DEMs (Figure 7), and the orthophoto-draped 3D model (open access: 10.5281/zenodo.7924523 (15 May 2023)) are considered to be useful for further applications.

3.2. Automatization of the Habitat Classification

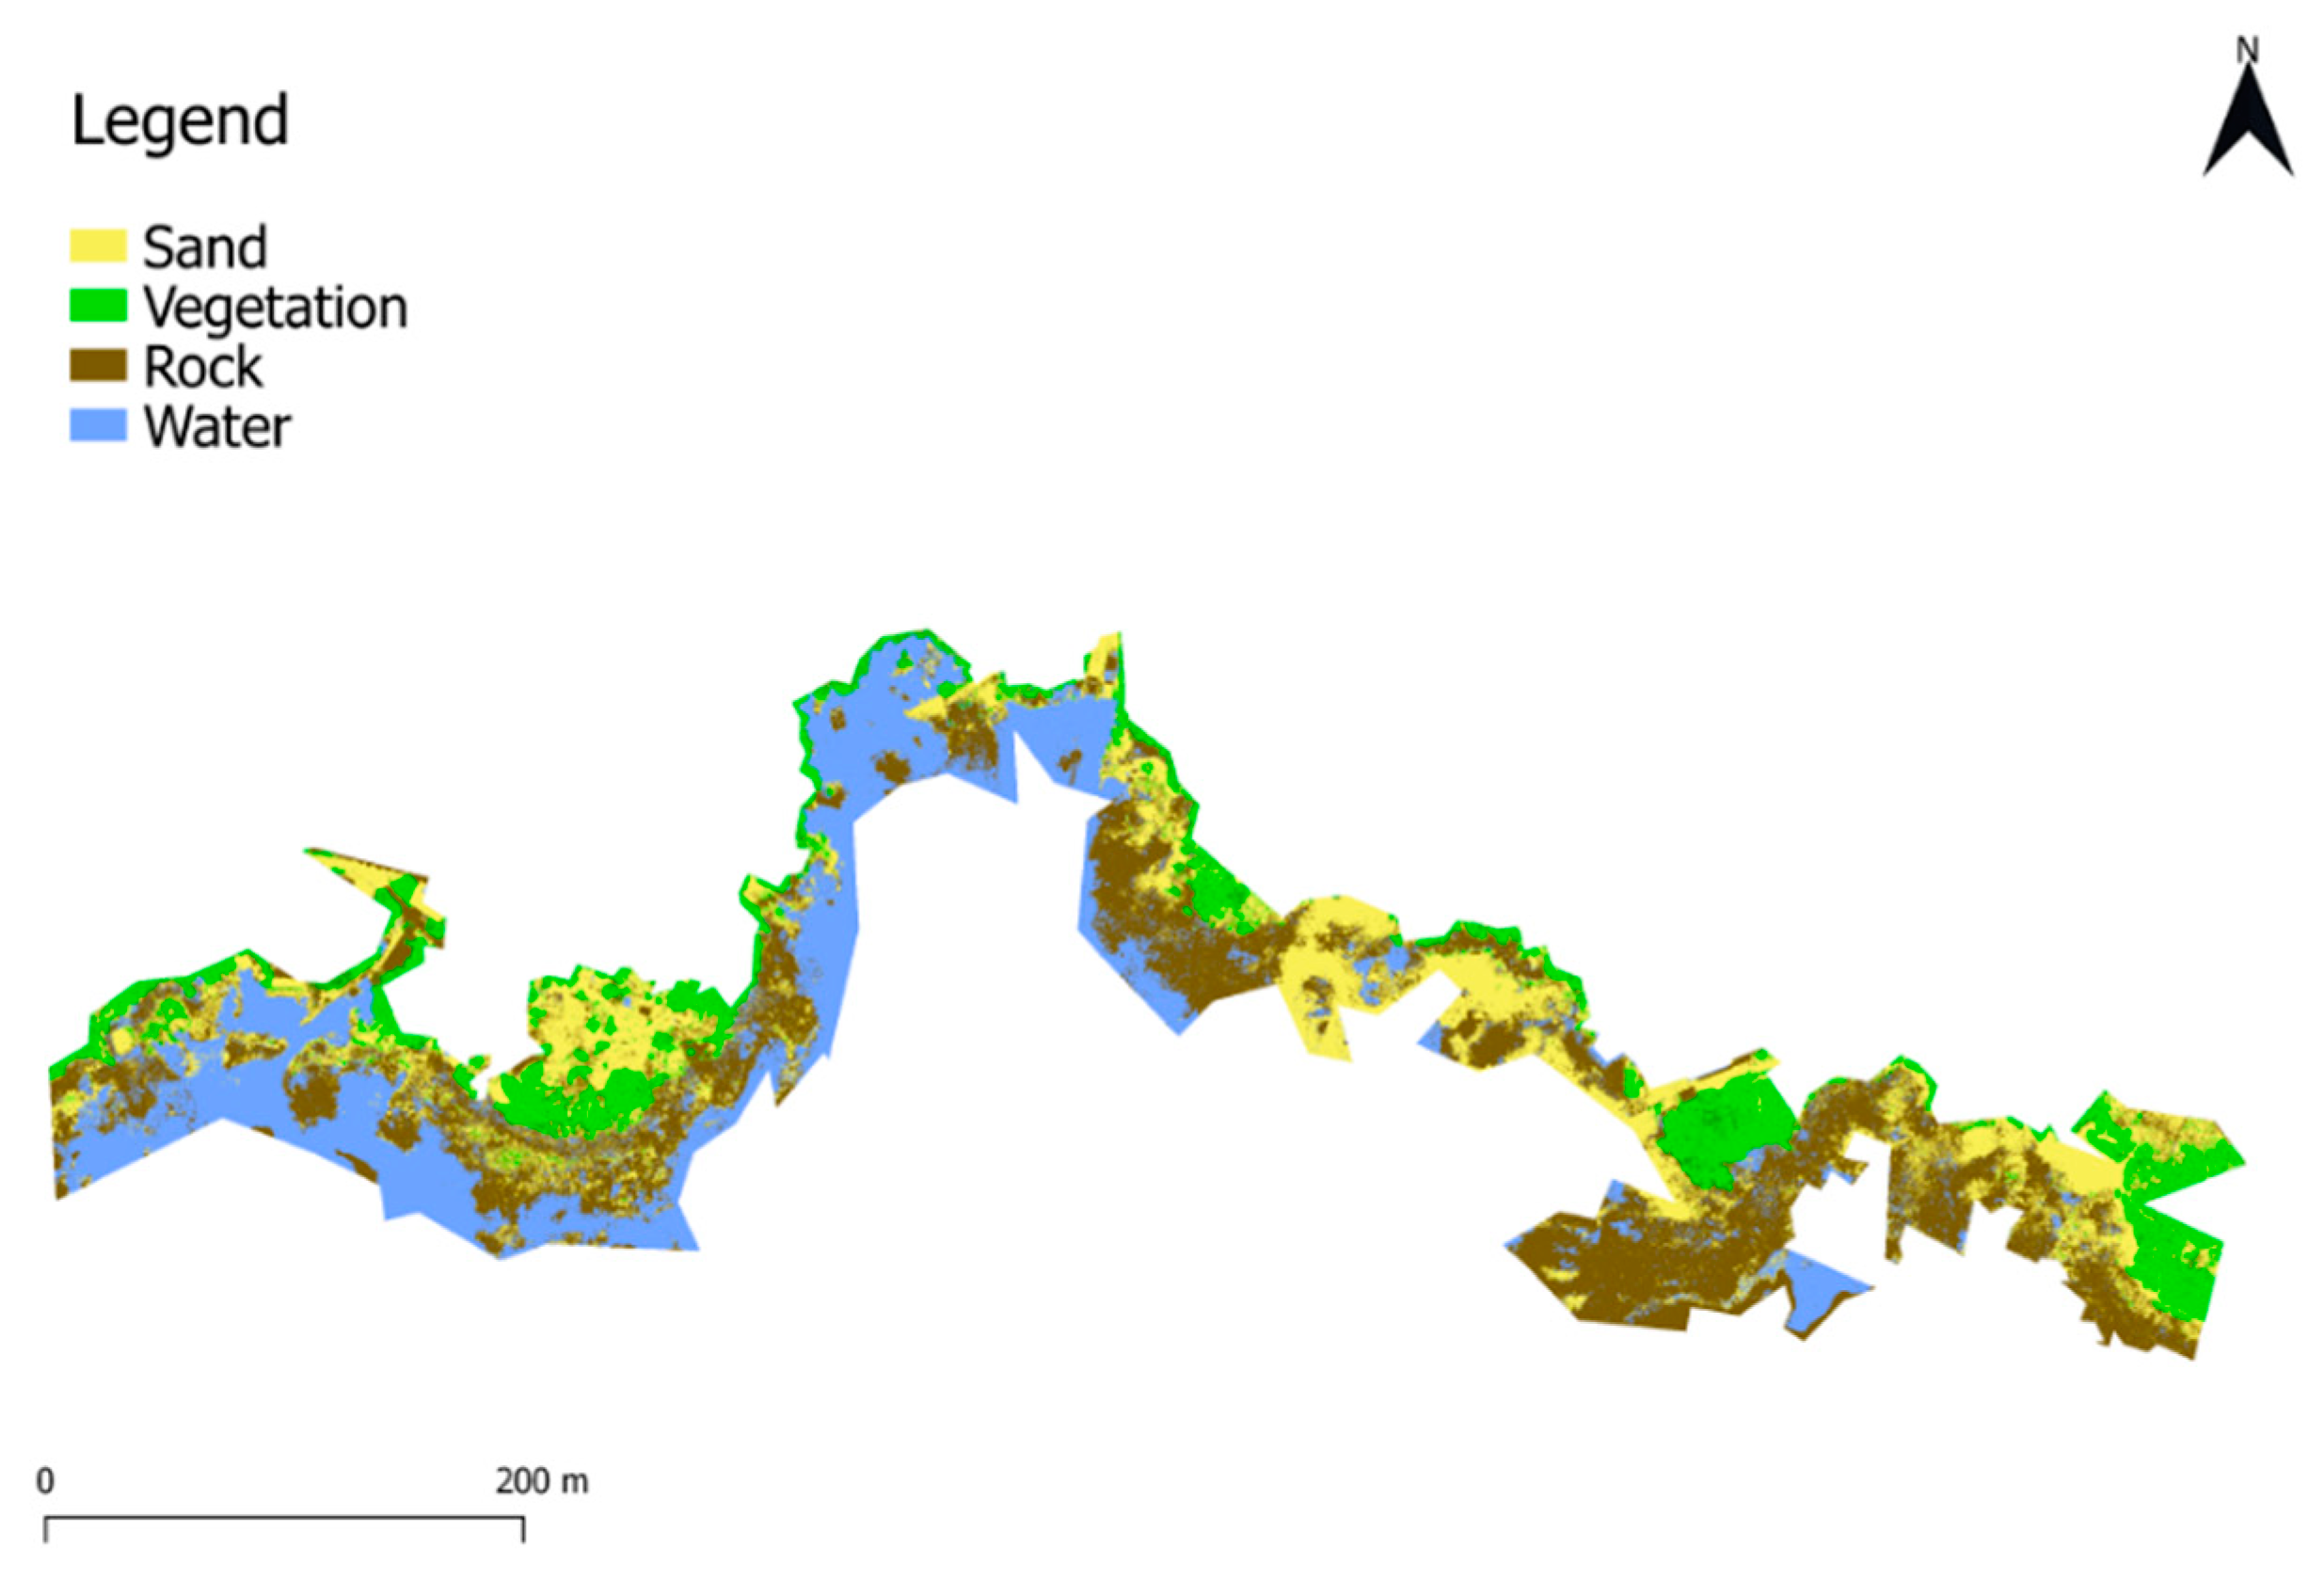
The intertidal habitat map of the coastline of the Charles Darwin Research Station using the spectral angle mapper classifier was obtained (Figure 8). Out of the four classes that were considered, the area of rock habitat appeared to be the largest with 20,496 m2 and the vegetated habitat the smallest with 9807 m2 (Table A14).

3.3. Validation

Based on the validation datasets, an error matrix and classification accuracies could be computed in QGIS. Concerning the pixel-based validation (Table 1), the sand pixels were all correctly classified. However, only 60% of the rock pixels were correctly classified and 33% were misclassified as water. Vegetation pixels were well classified, considering a few exceptions. Based on the classified areas (Table 2), an overall kappa of 0.66 and an overall classification accuracy of 77% was obtained, indicating a relatively good classification by the model. When each class is given an equal weight in the calculation of the overall accuracy, a value of 83.64% is obtained.

4. Discussion

4.1. GNSS Measurements for Georeferencing

The coordinates of the GCPs were determined efficiently, except for six targets that had been moved by the wind and/or inhabitants or that became inaccessible. Trimble 8 and 10 delivered high precision outcomes (Table A1). Due to the universal use and time-efficiency of the UTM coordinate system, the applied method is applicable at any other study area. Direct georeferencing using the accurate positioning capability of the UAV itself has the potential to make the use of GCPs unnecessary [48]. This alternative would allow for geotagging of the images using onboard RTK-GNSS measurements. Problems with unreachable target sheets could be avoided. However, direct georeferencing requires obtaining the coordinates of a GNSS receiver at the exact moment the image is acquired, and there might be distortions in signals from satellite constellations and interruptions in RTK connections for a fast-flying UAV [48]. Thus, further optimization of the proposed technology is needed before use.

4.2. Data Collection with Uncrewed Aerial Vehicle

Due to pre-programming of the flights and the use of the Mission Planner software, the UAV flights could be executed within two days. In this study, due to the unstable weather conditions, limited battery life of UAVs, and relocation of materials to new take-off points, several flights were delayed and took place outside the tidal period of interest. Future applications should look into the use of waterproof materials for fast-changing weather. According to Murrfit et al. [7], this could even make emergency landings in the oceans possible.

4.3. D modeling of the Coastal Region

The documentation of GCPs immediately after the execution of the flights appeared to be highly useful during the allocation process. The guided approach for marker placement is recommended for use in future studies. Furthermore, the largest georeferencing error (RMSE) was found for GCP ‘x9’ (0.062 m) (Table A8), which could be explained by its difficult allocation (Figure A3). The accuracy of the georeferenced orthophoto appeared to depend mainly on the accuracy of the manual allocation of GCPs on the UAV imagery. By increasing the number of GCPs, accuracy can be increased. We consider that the 31 GCPs used in this study were sufficient since the total RSME amounted to 0.027 m, which, according to the conventional requirements for georeferencing accuracy, meets the requirement of a value below 1 pixel [49]. Moreover, to improve the accuracy of the classification, it has been recommended to adjust the RGB values according to the thickness of the water package above the area [40]. All images could be aligned after masking the boats and water surfaces in the images that were not taken at low tide. Parameter testing for a subarea was essential to obtain valuable results. The obtained DEM, orthophoto, and orthophoto-draped 3D model could potentially be used for a variety of applications. For example, the data could be used for spatial planning of monitoring efforts and spatial analysis of the environment of Puerto Ayora such as modeling of biodiversity changes related to climate change impacts [50]. Moreover, the developed DEMs could be used for prediction of habitat loss under different scenarios of sea-level rise [51]. Those estimations of sea-level rise for the next decennia could be used to investigate the potential loss of intertidal habitats.

4.4. Automatization of the Habitat Classification

The ‘Semi-Automatic Classification’ plug-in proved to be a user-friendly plug-in with a useful classification preview option. Aside from the applied classification algorithm, other classification algorithms software exist, such as ArcMap and eCognition, which can be applied depending on the required result [52]. Moreover, we advise further study to obtain a sufficiently high number of ground-truth data in order to improve the classification and validation processes, and also to measure in the near-infrared (NIR) part of the spectrum. This could facilitate the classification of boats and buildings. Studies have been performed using UAV imagery for intertidal area mapping for a wide range of applications, e.g., to map large algae communities [21] or to show the distribution patterns and patchiness of seagrass [18]. To the best of our knowledge, this study is the first one which aimed to classify UAV imagery of intertidal habitats on the Galapagos archipelago [26,53]. Comparing the overall accuracy of intertidal habitat classifications is challenging as the results strongly depend on the study area. Each biotope has unique characteristics and different land cover types around the globe [41]. Therefore, instead of comparing the overall accuracy, a focus was put on the individual categories. The results indicated that the category with the highest error rate was ‘water’. Various pixels that were identified as water during the validation were classified as rocks by the model. The reason for this can be that these two categories physically overlapped most, the water washed over the rocky coastline. It is often the case in tropical coast areas that no clear boundaries exist between the different types of land cover. Additionally, most land cover types in those areas have similar spectral signatures, which is a challenge for automated image classification [54]. More recently developed classification methods, which capture images in the near-infrared band and enable the calculation of the normalized difference water index (NDWI), can be applied to detect the presence of water [55]. In addition, to correct the RGB values for the presence of water, the collection of bathymetric data can be considered [7,40]. For the intertidal area of the Charles Darwin Research Station, the least represented habitat class was vegetation. As the intertidal area was delineated based on the DEM, it might be that parts of the vegetated area could have been cut out. In conclusion, the visual outputs produced in this study can have diverse applications in environmental monitoring and modeling for climate change, serving as a fundamental source of data for restoration initiatives. One such application could be the utilization of data to predict sea-level rise, monitor habitat deterioration, and develop hydrodynamic and sediment transport models. These models can contribute to strengthening coastal defenses and safeguarding local communities, as well as protecting intertidal zone ecosystems from the detrimental impacts of climate change. Furthermore, biological studies on underwater surveys enabling the mapping of biological communities’ distribution across habitats with potentially varying conditions could benefit from combining and integrating the obtained visual results [56].

4.5. Validation

The quality of the obtained habitat map depended on the quality of the UAV imagery, the photogrammetry process, the quality of ground-truth, and the applied classification algorithm [57]. The error matrix (Table 1) showed a high accuracy of classifying the vegetation due to its spectral differences. The classification of awash rock systems was the hardest due to misclassification as rocks instead of water. The limitations of UAV imagery technology could be attributed to various environmental factors, including light, weather, and wind. These factors can have a significant impact on image clarity and stability, ultimately affecting the accuracy and reliability of image analysis [58]. Moreover, human intervention, including drone take off and landing, data calibration, and verification, could also affect the autonomy of the technology [59]. Additionally, issues such as battery capacity, high cost, and insufficient computing power due to large data samples should also be fully considered in future research [60,61]. Future validation could be made via underwater monitoring based on camera systems on underwater vehicles, autonomous underwater vehicles (AUVs), or remotely operated underwater vehicles (ROV), and snorkeling [12,58]. Extensive review has shown the potential of current UAV technologies for monitoring and tracking alterations in coastal environments at high spatial and temporal resolution [13]. The combined use of different UAV technologies that are generating spatially linked information can be of high added value for both the validation as well as the generation of complementary data that are useful to obtain a more complete picture of these ecosystems and their physical, chemical, and biological conditions [12]. The complementary advantages of various types of uncrewed vehicle systems could partially resolve the challenges or limitations of one single type to advance system stability and efficiency [12]. An equilibrium has to be found between innovation and feasibility.
The legal and policy-related challenges of UAV technology need to receive sufficient attention and regulation. This involves addressing privacy protection, security concerns, data collection and usage, environmental protection, intellectual property ownership, and airspace management [62,63,64]. For future research, it is important to take into account the previous elements to strengthen regulation and control on the use of UAV technology [65].

5. Conclusions

The processing of UAV photographs of the coastline of the Charles Darwin Research Station via photogrammetry resulted in orthophoto-draped 3D models, DEMs, and orthophotos of the coastal zone (open access: 10.5281/zenodo.7924523 (15 May 2023)). The generated visual outputs had high resolutions and were considered to be highly valuable for visualization of the study area. A classified habitat map was achieved with an overall accuracy of 77%. The results indicated that the category with the highest error rate was ‘water’. It can be concluded that the UAV high-resolution aerial imagery collected on the Galapagos Islands was valuable to classify intertidal habitats of its coastal regions. The developed method could be applied to map coastal regions all over the world. The data obtained can be applied in environmental monitoring and modeling for climate change, serving as a fundamental source of data for restoration initiatives.

Author Contributions

Conceptualization, P.D.M., B.D.W., S.G. and P.L.M.G.; experimental design, L.D.C., B.D.W., R.V., N.V. and P.L.M.G.; methodology, L.D.C., B.D.W., S.B., R.V., N.V. and P.L.M.G.; software, P.D.M. and S.G.; logistics, L.D.C., B.D.W., R.V. and N.V.; permit arrangement, R.B. and P.L.M.G.; field work, L.D.C., B.D.W., R.V., N.V. and S.B.; data analysis, L.D.C., R.V., S.B. and S.G.; writing—original draft preparation, A.D.C., R.V. and P.L.M.G.; writing—review and editing, S.B., L.D.C., X.L., R.B., N.V., D.O., P.D.M., B.D.W., S.G. and P.L.M.G.; project administration and funding acquisition, P.D.M., R.B., and P.L.M.G. All authors have read and agreed to the published version of the manuscript.

Funding

The research was partly funded by VLIR-UOS Biodiversity Network Ecuador, Special Research Fund of UGent and VLIR-UOS Global Minds. Travelling scholarships for staff and students were provided by FWO, CWO (Ugent), VLIR-UOS (Global Minds), and VLIR-UOS Biodiversity Network Ecuador.

Data Availability Statement

Publicly available datasets were analyzed in this study. These data can be found here: [https://doi.org/10.5281/zenodo.7924523 (15 May 2023)].

Conflicts of Interest

The authors declare no conflict of interest.

Permits

Some parts of the study area are managed by the municipality or the Galapagos National Park, others are private domain of the Charles Darwin Research Foundation or owned by Galapagos residents. For legality of the data sampling, it was ensured that necessary permits were approved. All methods were carried out in accordance with the relevant guidelines and regulations of the Galapagos National Park Directorate under research permit PC-02-19. All experimental protocols were reviewed and approved by the Galapagos National Park Directorate Applied Research Department, which assesses animal care in research activities.

Appendix A

Figure A1. Growth of Puerto Ayora: military aerial photographs of 1963 (A) and 1981 (B); satellite image of 2018 (C). Source: Charles Darwin Foundation Library, 2017 (A,B); Google Earth, 2018 (C).
Drones 07 00416 g0a1
Figure A2. Hexacopter DJI 550. Source: DJI, 2017, www.myfirstdrone.com (15 May 2023). Tile measurements: 5 cm × 5 cm.
Drones 07 00416 g0a2
Figure A3. Ground control point (GCP) coverage along the coastline of Puerto Ayora.
Drones 07 00416 g0a3
Table A1. Precision of RTK and PPK measurements (RMS = root mean square). Source: R8 and R10 User Guides, 2018, www.trimble.com (15 May 2023).
DeviceHorizontalVertical
Trimble 8—RTK8 mm + 1 ppm RMS15 mm + 1 ppm RMS
Trimble 8—PPK8 mm + 1 ppm RMS15 mm + 1 ppm RMS
Trimble 10—RTK8 mm + 1 ppm RMS15 mm + 1 ppm RMS
Trimble 10—Static and Fast Static3 mm + 0.5 ppm RMS5 mm + 0.5 ppm RMS
Table A2. GCP coordinates after processing: labels with ‘gcp’ for the target sheets; labels with ‘x’ for the extra easily identifiable points.
Labelx (m)y (m)z (m)
gcp31799,051.5729,917,348.44412.495
gcp33799,167.1339,917,438.82313.911
gcp34799,286.2029,917,562.0737.574
gcp35799,321.4829,917,795.99410.908
gcp39799,872.9059,917,850.4485.525
gcp40799,607.3039,917,900.8047.143
gcp41799,511.0319,917,762.8443.326
gcp42798,964.0229,917,263.03113.240
gcp43799,369.0419,916,998.4237.375
gcp45799,213.9779,917,625.27910.077
gcp46799,611.3879,917,781.7243.148
gcp50799,404.8369,916,934.67816.418
gcp51799,042.4489,916,630.2575.030
gcp52799,280.2909,917,471.07011.390
gcp53799,190.8599,917,608.68017.326
x1799,104.5969,917,340.4203.181
x2799,178.3859,916,663.1767.001
x3798,992.0519,917,221.79111.980
x4799,086.8719,917,326.7352.211
x5799,197.1619,917,333.5382.588
x6799,061.0979,917,179.4762.971
x7798,706.7029,917,273.9552.032
x8798,589.2259,917,522.3397.357
x9799,359.3939,916,832.7731.910
x10799,114.9139,916,440.2132.908
x11800,049.9479,917,852.9166.058
x101800,213.7699,917,682.0331.917
x102800,215.2039,917,848.7956.686
x103799,805.4559,918,081.1765.227
x104799,341.4359,917,942.7606.648
x105799,091.3629,917,880.3908.327
x106799,008.3219,917,614.7197.487
Table A3. Specifications of Hexacopter DJI 550 Source: Flame Wheel Arf Kit, 2017, www.dji.com (15 May 2023).
Total Weight2583 g
Diameter550 mm
Batteries2 × (4 Ah, 16,8 V)
Flight ControllerPixhawk with GPS (uBLOXNEO-M8N)
Hexacopter DJI 5501673 g
2 Batteries2 × 283 g
Camera with Lens344 g
Table A4. Specifications of Sony NEX 5R Source: Sony NEX 5R, 2018, www.dpreview.com (15 May 2023).
Sensor TypeCMOS
Sensor Size15.6 mm × 23.4 mm
Camera Resolution16 MP
Shutter Speed30 s—1/4000 s
Focus Distance20 mm
Weight276 g
Table A5. Tidal information of Santa Cruz island during the flights Source: Isla Baltra—Galapagos Islands Tide Chart, 2017, tides.mobilegeographics.com.
DateHigh TideLow Tide
9 August 2017 a.m.3:37 a.m. GALT/2.03 m9:43 a.m. GALT/0.34 m
9 August 2017 p.m.3:46 p.m. GALT/1.99 m9:57 p.m. GALT/0.22 m
10 August 2017 a.m.4:11 a.m. GALT/2.06 m10:20 a.m. GALT/0.31 m
10 August 2017 p.m.4:23 p.m. GALT/1.99 m10:33 p.m. GALT/0.22 m
Table A6. Flight schedule.
Flight NumberDateTake OffTouchdownTide
Flight 19 August 20171:23:44 p.m. GALT1:29:40 p.m. GALTRising
Flight 29 August 20171:59:34 p.m. GALT2:07:28 p.m. GALTRising
Flight 39 August 20173:03:46 p.m. GALT3:09:30 p.m. GALTRising
Flight 49 August 20173:36:10 p.m. GALT3:42:42 p.m. GALTRising/High
Flight 510 August 20179:39:32 a.m. GALT9:44:44 a.m. GALTFalling
Flight 610 August 201710:32:00 a.m. GALT10:39:12 a.m. GALTLow/Rising
Flight 710 August 201710:50:46 a.m. GALT10:59:30 a.m. GALTLow/Rising
Flight 810 August 201711:43:20 a.m. GALT11:49:44 a.m. GALTLow/Rising
Flight 910 August 201711:58:02 a.m. GALT12:03:28 p.m. GALTLow/Rising
Table A7. Parameters used for flight planning via Mission Planner.
Altitude120 m
Ground Sampling Distance2.86 cm
Ground Width140.4 m
Ground Length96.6 m
Distance between Flight Lines55 m
Overlap between Flight Lines33 m, 60%
Distance between Image-Centers10 m
Overlap within Flight Lines8 m, 80%
Table A8. Accuracy of georeferencing: root mean square errors.
Labelx Error (m)y Error (m)z Error (m)Total Error (m)
gcp31−0.02970.03330.01110.0460
gcp330.00930.0028−0.00110.0098
gcp340.00300.0043−0.00300.0060
gcp350.0128−0.0035−0.00110.0133
gcp39−0.0005−0.0013−0.00270.0031
gcp40−0.02960.01160.00290.0320
gcp41−0.00650.00290.00120.0072
gcp42−0.0038−0.00740.00540.0099
gcp43−0.00990.0034−0.00670.0125
gcp45−0.01390.01830.00820.0244
gcp460.0204−0.0117−0.00170.0236
gcp500.0294−0.0412−0.00490.0509
gcp510.00890.00030.00630.0109
gcp52−0.0102−0.00170.00300.0108
gcp530.0064−0.0049−0.00760.0110
x10.0258−0.02750.01470.0405
x2−0.0123−0.0188−0.01010.0247
x30.00690.0216−0.00950.0246
x40.0210−0.0119−0.02300.0334
x5−0.02820.0013−0.00250.0284
x6−0.0009−0.01760.00380.0180
x70.0005−0.0009−0.00040.0011
x8−0.00360.0090−0.00830.0127
x9−0.01440.05820.01640.0622
x110.0450−0.01160.00090.0465
x101−0.0139−0.0235−0.00220.0274
x102−0.02180.0342−0.00190.0406
x103−0.0046−0.00480.00060.0067
x1040.00470.0038−0.00140.0061
x1050.0009−0.00210.00210.0031
x1060.0054−0.0123−0.00120.0135
Total0.01700.01890.00750.0265
Table A9. Parameters for modeling process in Agisoft Metashape.
Align Photos
AccuracyMedium
Pair selectionDisabled
Keypoint limit0 (infinite number of points)
Tiepoint limit10,000
Constrain features by maskYes
Build dense cloud
QualityMedium
Depth filteringMild (not filtering out too many details)
Build mesh
Surface typeArbitrary
Source dataDense cloud
Polygon countMedium for subarea; low for full area
InterpolationEnabled
Point classesAll
Add texture
Mapping modeGeneric
Texture size20,000 × 20,000
Create orthophoto
Pixel size2.79 cm × 2.79 cm
Table A10. The parameters for segmentation process in ArcMap.
Segment Mean Shift
Spectral Detail18
Spatial Detail18
Minimum Segment Size In Pixels3
Table A11. Parameters and numbers of ROIs (for subarea around Charles Darwin Research Station) for creation of training data with automatic region growing algorithm (ARGA) and by manual drawing of polygons (MDP) in QGIS.
General Parameters for ARGA
Minimum number of pixels60
Maximum number of pixels400
Class 1: sand
Maximum spectral distance10
Number of ROIs with ARGA10
Number of ROIs with MDP0
Class 2: vegetation
Maximum spectral distance20 (needed for diverse vegetation reflectance)
Number of ROIs with ARGA10
Number of ROIs with MDP0
Class 3: rock
Maximum spectral distance10
Number of ROIs with ARGA10
Number of ROIs with MDP5
Class 4: water
Maximum spectral distance20 (needed for stormy water)
Number of ROIs with ARGA10
Number of ROIs with MDP5
Table A12. Parameters and number of ROIs (for subarea around Charles Darwin Research Station) for creation of validation data with automatic region growing algorithm in QGIS.
General Parameters
Maximum spectral distance10
Minimum number of pixels60
Maximum number of pixels400
Number of ROIs40
Table A13. Computing times for modeling process in Agisoft Metashape.
Align Photos
All19 h 36 min
Build Dense Cloud
All52 min
Build Mesh
Subarea12 h 35 min
Full study area7 h 35 min
Eastern part4 h 43 min
Western part3 h 50 min
Add Texture
Subarea15 min
Full study area9 min
Eastern part23 min
Western part10 min
Table A14. Overview of classified map of intertidal habitats.
ClassNumber of PixelsPercentageArea (m2)
Sand21,712,07225.6316,895
Vegetation12,603,25914.879807
Rock26,339,65231.0920,496
Water24,073,98728.4118,733

References

  1. Creel, L. Ripple Effects: Population and Costal Regions; Population Reference Bureau: Washington, DC, USA, 2003. [Google Scholar]
  2. Curran, S.; Kumar, A.; Lutz, W.; Williams, M. Interactions between coastal and marine ecosystems and human population systems: Perspectives on how consumption mediates this interaction. Ambio 2002, 31, 264–268. [Google Scholar] [CrossRef]
  3. Sayre, R.; Noble, S.; Hamann, S.; Smith, R.; Wright, D.; Breyer, S.; Butler, K.; Van Graafeiland, K.; Frye, C.; Karagulle, D. A new 30 meter resolution global shoreline vector and associated global islands database for the development of standardized ecological coastal units. J. Oper. Oceanogr. 2019, 12, S47–S56. [Google Scholar] [CrossRef] [Green Version]
  4. Veron, S.; Mouchet, M.; Govaerts, R.; Haevermans, T.; Pellens, R. Vulnerability to climate change of islands worldwide and its impact on the tree of life. Sci. Rep. 2019, 9, 14471. [Google Scholar] [CrossRef] [Green Version]
  5. Steibl, S.; Laforsch, C. Disentangling the environmental impact of different human disturbances: A case study on islands. Sci. Rep. 2019, 9, 13712. [Google Scholar] [CrossRef] [PubMed] [Green Version]
  6. Damgaard, C. Integrating hierarchical statistical models and machine-learning algorithms for ground-truthing drone images of the vegetation: Taxonomy, abundance and population ecological models. Remote Sens. 2021, 13, 1161. [Google Scholar] [CrossRef]
  7. Murfitt, S.L.; Allan, B.M.; Bellgrove, A.; Rattray, A.; Young, M.A.; Ierodiaconou, D. Applications of unmanned aerial vehicles in intertidal reef monitoring. Sci. Rep. 2017, 7, 10259. [Google Scholar] [CrossRef] [Green Version]
  8. Airoldi, L. Effects of patch shape in intertidal algal mosaics: Roles of area, perimeter and distance from edge. Mar. Biol. 2003, 143, 639–650. [Google Scholar] [CrossRef]
  9. Johnson, M.E. Why are ancient rocky shores so uncommon? J. Geol. 1988, 96, 469–480. [Google Scholar] [CrossRef]
  10. Edgar, G.; Banks, S.; Fariña, J.; Calvopiña, M.; Martínez, C. Regional biogeography of shallow reef fish and macro-invertebrate communities in the Galapagos archipelago. J. Biogeogr. 2004, 31, 1107–1124. [Google Scholar] [CrossRef]
  11. Couce, E.; Ridgwell, A.; Hendy, E.J. Future habitat suitability for coral reef ecosystems under global warming and ocean acidification. Glob. Chang. Biol. 2013, 19, 3592–3606. [Google Scholar] [CrossRef] [PubMed] [Green Version]
  12. Ubina, N.A.; Cheng, S.-C. A Review of Unmanned System Technologies with Its Application to Aquaculture Farm Monitoring and Management. Drones 2022, 6, 12. [Google Scholar] [CrossRef]
  13. Adade, R.; Aibinu, A.M.; Ekumah, B.; Asaana, J. Unmanned Aerial Vehicle (UAV) applications in coastal zone management—A review. Environ. Monit. Assess. 2021, 193, 154. [Google Scholar] [CrossRef] [PubMed]
  14. Douterloigne, K.; Gautama, S.; Philips, W. On the accuracy of 3D landscapes from UAV image data. In Proceedings of the 2010 IEEE International Geoscience and Remote Sensing Symposium, Honolulu, HI, USA, 25–30 July 2010; pp. 589–592. [Google Scholar]
  15. Ndlovu, H.S.; Odindi, J.; Sibanda, M.; Mutanga, O.; Clulow, A.; Chimonyo, V.G.; Mabhaudhi, T. A comparative estimation of maize leaf water content using machine learning techniques and unmanned aerial vehicle (UAV)-based proximal and remotely sensed data. Remote Sens. 2021, 13, 4091. [Google Scholar] [CrossRef]
  16. Coggan, R.; Populus, J.; White, J.; Sheehan, K.; Fitzpatrick, F.; Piel, S. Review of Standards and Protocols for Seabed Habitat Mapping; Mapping European Seabed Habitats (MESH): Peterborough, UK, 2007. [Google Scholar]
  17. Yang, Z.; Yu, X.; Dedman, S.; Rosso, M.; Zhu, J.; Yang, J.; Xia, Y.; Tian, Y.; Zhang, G.; Wang, J. UAV remote sensing applications in marine monitoring: Knowledge visualization and review. Sci. Total Environ. 2022, 2022, 155939. [Google Scholar] [CrossRef]
  18. Konar, B.; Iken, K. The use of unmanned aerial vehicle imagery in intertidal monitoring. Deep. Sea Res. Part II Top. Stud. Oceanogr. 2018, 147, 79–86. [Google Scholar] [CrossRef]
  19. Azhar, M.; Schenone, S.; Anderson, A.; Gee, T.; Cooper, J.; van der Mark, W.; Hillman, J.R.; Yang, K.; Thrush, S.F.; Delmas, P. A framework for multiscale intertidal sandflat mapping: A case study in the Whangateau estuary. ISPRS J. Photogramm. Remote Sens. 2020, 169, 242–252. [Google Scholar] [CrossRef]
  20. Diruit, W.; Le Bris, A.; Bajjouk, T.; Richier, S.; Helias, M.; Burel, T.; Lennon, M.; Guyot, A.; Ar Gall, E. Seaweed Habitats on the Shore: Characterization through Hyperspectral UAV Imagery and Field Sampling. Remote Sens. 2022, 14, 3124. [Google Scholar] [CrossRef]
  21. Rossiter, T.; Furey, T.; McCarthy, T.; Stengel, D.B. UAV-mounted hyperspectral mapping of intertidal macroalgae. Estuar. Coast. Shelf Sci. 2020, 242, 106789. [Google Scholar] [CrossRef]
  22. Chen, C.; Zhang, C.; Schwarz, C.; Tian, B.; Jiang, W.; Wu, W.; Garg, R.; Garg, P.; Aleksandr, C.; Mikhail, S. Mapping three-dimensional morphological characteristics of tidal salt-marsh channels using UAV structure—From-motion photogrammetry. Geomorphology 2022, 407, 108235. [Google Scholar] [CrossRef]
  23. Koyama, A.; Hirata, T.; Kawahara, Y.; Iyooka, H.; Kubozono, H.; Onikura, N.; Itaya, S.; Minagawa, T. Habitat suitability maps for juvenile tri-spine horseshoe crabs in Japanese intertidal zones: A model approach using unmanned aerial vehicles and the Structure from Motion technique. PLoS ONE 2020, 15, e0244494. [Google Scholar] [CrossRef]
  24. Yang, B.; Hawthorne, T.L.; Aoki, L.; Beatty, D.S.; Copeland, T.; Domke, L.K.; Eckert, G.L.; Gomes, C.P.; Graham, O.J.; Harvell, C.D. Low-Altitude UAV Imaging Accurately Quantifies Eelgrass Wasting Disease From Alaska to California. Geophys. Res. Lett. 2023, 50, e2022GL101985. [Google Scholar] [CrossRef]
  25. Sarira, T.V.; Clarke, K.; Weinstein, P.; Koh, L.P.; Lewis, M. Rapid identification of shallow inundation for mosquito disease mitigation using drone-derived multispectral imagery. Geospat. Health 2020, 15. [Google Scholar] [CrossRef] [PubMed]
  26. Ballari, D.; Orellana, D.; Acosta, E.; Espinoza, A.; Morocho, V. UAV monitoring for environmental management in Galapagos Islands. In Proceedings of the International Archives of the Photogrammetry, Remote Sensing & Spatial Information Sciences, Prague, Czech Republic, 2–19 July 2016; Volume 41. [Google Scholar]
  27. Vandeputte, R.; Sidharta, G.; Goethals, P. Classification of Intertidal Habitats Using Drone Imagery in the Galapagos Archipelago; Ghent University: Ghent, Belgium, 2018. [Google Scholar]
  28. Riascos-Flores, L.; Bruneel, S.; Van der Heyden, C.; Deknock, A.; Van Echelpoel, W.; Forio, M.A.E.; De Saeyer, N.; Berghe, W.V.; Spanoghe, P.; Bermudez, R.; et al. Polluted paradise: Occurrence of pesticide residues within the urban coastal zones of Santa Cruz and Isabela (Galapagos, Ecuador). Sci. Total Environ. 2021, 763, 142956. [Google Scholar] [CrossRef]
  29. INEC. Censo de Población y Vivienda Galápagos 2015 (CPVG Noviembre 2015); INEC: Abeokuta, Nigeria, 2015. [Google Scholar]
  30. IMO/FAO/UNESCO/WMO/WHO/IAEA/UN/UNEP Joint Group of Experts on the Scientific Aspects of Marine Pollution. Protecting the Oceans from Land-Based Activities: Land-Based Sources and Activities Affecting the Quality and Uses of the Marine, Coastal and Associated Freshwater Environment; GESAMP: Norwich, UK, 2001. [Google Scholar]
  31. Trimble. Trimble. Available online: https://www.trimble.com/en (accessed on 30 March 2023).
  32. Landau, H.; Chen, X.; Klose, S.; Leandro, R.; Vollath, U. Trimble’s RTK and DGPS solutions in comparison with precise point positioning. In Observing Our Changing Earth; Springer: Berlin/Heidelberg, Germany, 2009; pp. 709–718. [Google Scholar]
  33. Jia, M.; Dawson, J.; Moore, M. AUSPOS: Geoscience Australia’s on-line GPS positioning service. In Proceedings of the 27th International Technical Meeting of The Satellite Division of the Institute of Navigation (ION GNSS+ 2014), Tampa, FL, USA, 8–12 September 2014; pp. 315–320. [Google Scholar]
  34. Hartley, R.; Zisserman, A. Multiple View Geometry in Computer Vision; Cambridge University Press: Cambridge, UK, 2003. [Google Scholar]
  35. Remondino, F.; Spera, M.G.; Nocerino, E.; Menna, F.; Nex, F.; Gonizzi-Barsanti, S. Dense image matching: Comparisons and analyses. In Proceedings of the 2013 Digital Heritage International Congress (DigitalHeritage), Marseille, France, 28 October–1 November 2013; pp. 47–54. [Google Scholar]
  36. Steiniger, S.; Bocher, E. An overview on current free and open source desktop GIS developments. Int. J. Geogr. Inf. Sci. 2009, 23, 1345–1370. [Google Scholar] [CrossRef]
  37. METEO365. Meteo365.com. Available online: Meteo365.com (accessed on 15 August 2022).
  38. Lillesand, T.; Kiefer, R.W.; Chipman, J. Remote Sensing and Image Interpretation; John Wiley & Sons: Hoboken, NJ, USA, 2015. [Google Scholar]
  39. Weih, R.C.; Riggan, N.D. Object-based classification vs. pixel-based classification: Comparative importance of multi-resolution imagery. Int. Arch. Photogramm. Remote Sens. Spat. Inf. Sci. 2010, 38, C7. [Google Scholar]
  40. Ventura, D.; Bruno, M.; Lasinio, G.J.; Belluscio, A.; Ardizzone, G. A low-cost drone based application for identifying and mapping of coastal fish nursery grounds. Estuar. Coast. Shelf Sci. 2016, 171, 85–98. [Google Scholar] [CrossRef]
  41. Ventura, D.; Bonifazi, A.; Gravina, M.F.; Belluscio, A.; Ardizzone, G. Mapping and classification of ecologically sensitive marine habitats using unmanned aerial vehicle (UAV) imagery and object-based image analysis (OBIA). Remote Sens. 2018, 10, 1331. [Google Scholar] [CrossRef] [Green Version]
  42. ArcGIS Pro. Overview of Image Classification. Available online: https://pro.arcgis.com/en/pro-app/latest/help/analysis/image-analyst/overview-of-image-classification.htm#:~:text=The%20object%2Dbased%20approach%20groups,deciding%20how%20pixels%20are%20grouped (accessed on 3 March 2023).
  43. Visalli, R.; Ortolano, G.; Godard, G.; Cirrincione, R. Micro-Fabric Analyzer (MFA): A new semiautomated ArcGIS-based edge detector for quantitative microstructural analysis of rock thin-sections. ISPRS Int. J. Geo-Inf. 2021, 10, 51. [Google Scholar] [CrossRef]
  44. Congedo, L. Semi-automatic classification plugin for QGIS. Sapienza Univ. 2013, 1, 25. [Google Scholar]
  45. Congedo, L. Semi-automatic classification plugin documentation. Release 2016, 4, 29. [Google Scholar]
  46. Chust, G.; Galparsoro, I.; Borja, A.; Franco, J.; Uriarte, A. Coastal and estuarine habitat mapping, using LIDAR height and intensity and multi-spectral imagery. Estuar. Coast. Shelf Sci. 2008, 78, 633–643. [Google Scholar] [CrossRef]
  47. Ukrainski, P.; Classification Accuracy Assessment. Confusion Matrix Method. Available online: http://www.50northspatial.org/classification-accuracy-assessment-confusion-matrix-method/ (accessed on 24 January 2023).
  48. Liu, X.; Lian, X.; Yang, W.; Wang, F.; Han, Y.; Zhang, Y. Accuracy assessment of a UAV direct georeferencing method and impact of the configuration of ground control points. Drones 2022, 6, 30. [Google Scholar] [CrossRef]
  49. Rozenstein, O.; Karnieli, A. Comparison of methods for land-use classification incorporating remote sensing and GIS inputs. Appl. Geogr. 2011, 31, 533–544. [Google Scholar] [CrossRef]
  50. McMahon, S.M.; Harrison, S.P.; Armbruster, W.S.; Bartlein, P.J.; Beale, C.M.; Edwards, M.E.; Kattge, J.; Midgley, G.; Morin, X.; Prentice, I.C. Improving assessment and modelling of climate change impacts on global terrestrial biodiversity. Trends Ecol. Evol. 2011, 26, 249–259. [Google Scholar] [CrossRef]
  51. Young, S.S.; Wamburu, P. Comparing Drone-Derived Elevation Data with Air-Borne LiDAR to Analyze Coastal Sea Level Rise at the Local Level. Pap. Appl. Geogr. 2021, 7, 331–342. [Google Scholar] [CrossRef]
  52. Papakonstantinou, A.; Topouzelis, K.; Pavlogeorgatos, G. Coastline zones identification and 3D coastal mapping using UAV spatial data. ISPRS Int. J. Geo-Inf. 2016, 5, 75. [Google Scholar] [CrossRef] [Green Version]
  53. Laso, F.J.; Benítez, F.L.; Rivas-Torres, G.; Sampedro, C.; Arce-Nazario, J. Land cover classification of complex agroecosystems in the non-protected highlands of the Galapagos Islands. Remote Sens. 2019, 12, 65. [Google Scholar] [CrossRef] [Green Version]
  54. Szuster, B.W.; Chen, Q.; Borger, M. A comparison of classification techniques to support land cover and land use analysis in tropical coastal zones. Appl. Geogr. 2011, 31, 525–532. [Google Scholar] [CrossRef]
  55. Ismail, A.; Rashid, A.S.A.; Sa’ari, R.; Mustaffar, M.; Abdullah, R.A.; Kassim, A.; Yusof, N.M.; Abd Rahaman, N.; Apandi, N.M.; Kalatehjari, R. Application of UAV-based photogrammetry and normalised water index (NDWI) to estimate the rock mass rating (RMR): A case study. Phys. Chem. Earth Parts A/B/C 2022, 127, 103161. [Google Scholar] [CrossRef]
  56. Monteiro, J.G.; Jiménez, J.L.; Gizzi, F.; Přikryl, P.; Lefcheck, J.S.; Santos, R.S.; Canning-Clode, J. Novel approach to enhance coastal habitat and biotope mapping with drone aerial imagery analysis. Sci. Rep. 2021, 11, 1–13. [Google Scholar] [CrossRef]
  57. Casado, M.R.; Gonzalez, R.B.; Kriechbaumer, T.; Veal, A. Automated identification of river hydromorphological features using UAV high resolution aerial imagery. Sensors 2015, 15, 27969–27989. [Google Scholar] [CrossRef] [Green Version]
  58. de Lima, R.L.P.; Boogaard, F.C.; de Graaf-van Dinther, R.E. Innovative water quality and ecology monitoring using underwater unmanned vehicles: Field applications, challenges and feedback from water managers. Water 2020, 12, 1196. [Google Scholar] [CrossRef] [Green Version]
  59. Sun, Z.; Wang, X.; Wang, Z.; Yang, L.; Xie, Y.; Huang, Y. UAVs as remote sensing platforms in plant ecology: Review of applications and challenges. J. Plant Ecol. 2021, 14, 1003–1023. [Google Scholar] [CrossRef]
  60. Harsh, S.; Singh, D.; Pathak, S. Efficient and Cost-effective Drone–NDVI system for Precision Farming. Int. J. New Pract. Manag. Eng. 2021, 10, 14–19. [Google Scholar] [CrossRef]
  61. Verfuss, U.K.; Aniceto, A.S.; Harris, D.V.; Gillespie, D.; Fielding, S.; Jiménez, G.; Johnston, P.; Sinclair, R.R.; Sivertsen, A.; Solbø, S.A. A review of unmanned vehicles for the detection and monitoring of marine fauna. Mar. Pollut. Bull. 2019, 140, 17–29. [Google Scholar] [CrossRef] [PubMed]
  62. Hassija, V.; Chamola, V.; Agrawal, A.; Goyal, A.; Luong, N.C.; Niyato, D.; Yu, F.R.; Guizani, M. Fast, reliable, and secure drone communication: A comprehensive survey. IEEE Commun. Surv. Tutor. 2021, 23, 2802–2832. [Google Scholar] [CrossRef]
  63. Kumar, A.; Jain, S. Drone-based monitoring and redirecting system. Dev. Future Internet Drones (IoD): Insights Trends Road Ahead 2021, 2021, 163–183. [Google Scholar]
  64. Lin, C.; He, D.; Kumar, N.; Choo, K.-K.R.; Vinel, A.; Huang, X. Security and privacy for the internet of drones: Challenges and solutions. IEEE Commun. Mag. 2018, 56, 64–69. [Google Scholar] [CrossRef]
  65. Maddikunta, P.K.R.; Hakak, S.; Alazab, M.; Bhattacharya, S.; Gadekallu, T.R.; Khan, W.Z.; Pham, Q.-V. Unmanned aerial vehicles in smart agriculture: Applications, requirements, and challenges. IEEE Sens. J. 2021, 21, 17608–17619. [Google Scholar] [CrossRef]
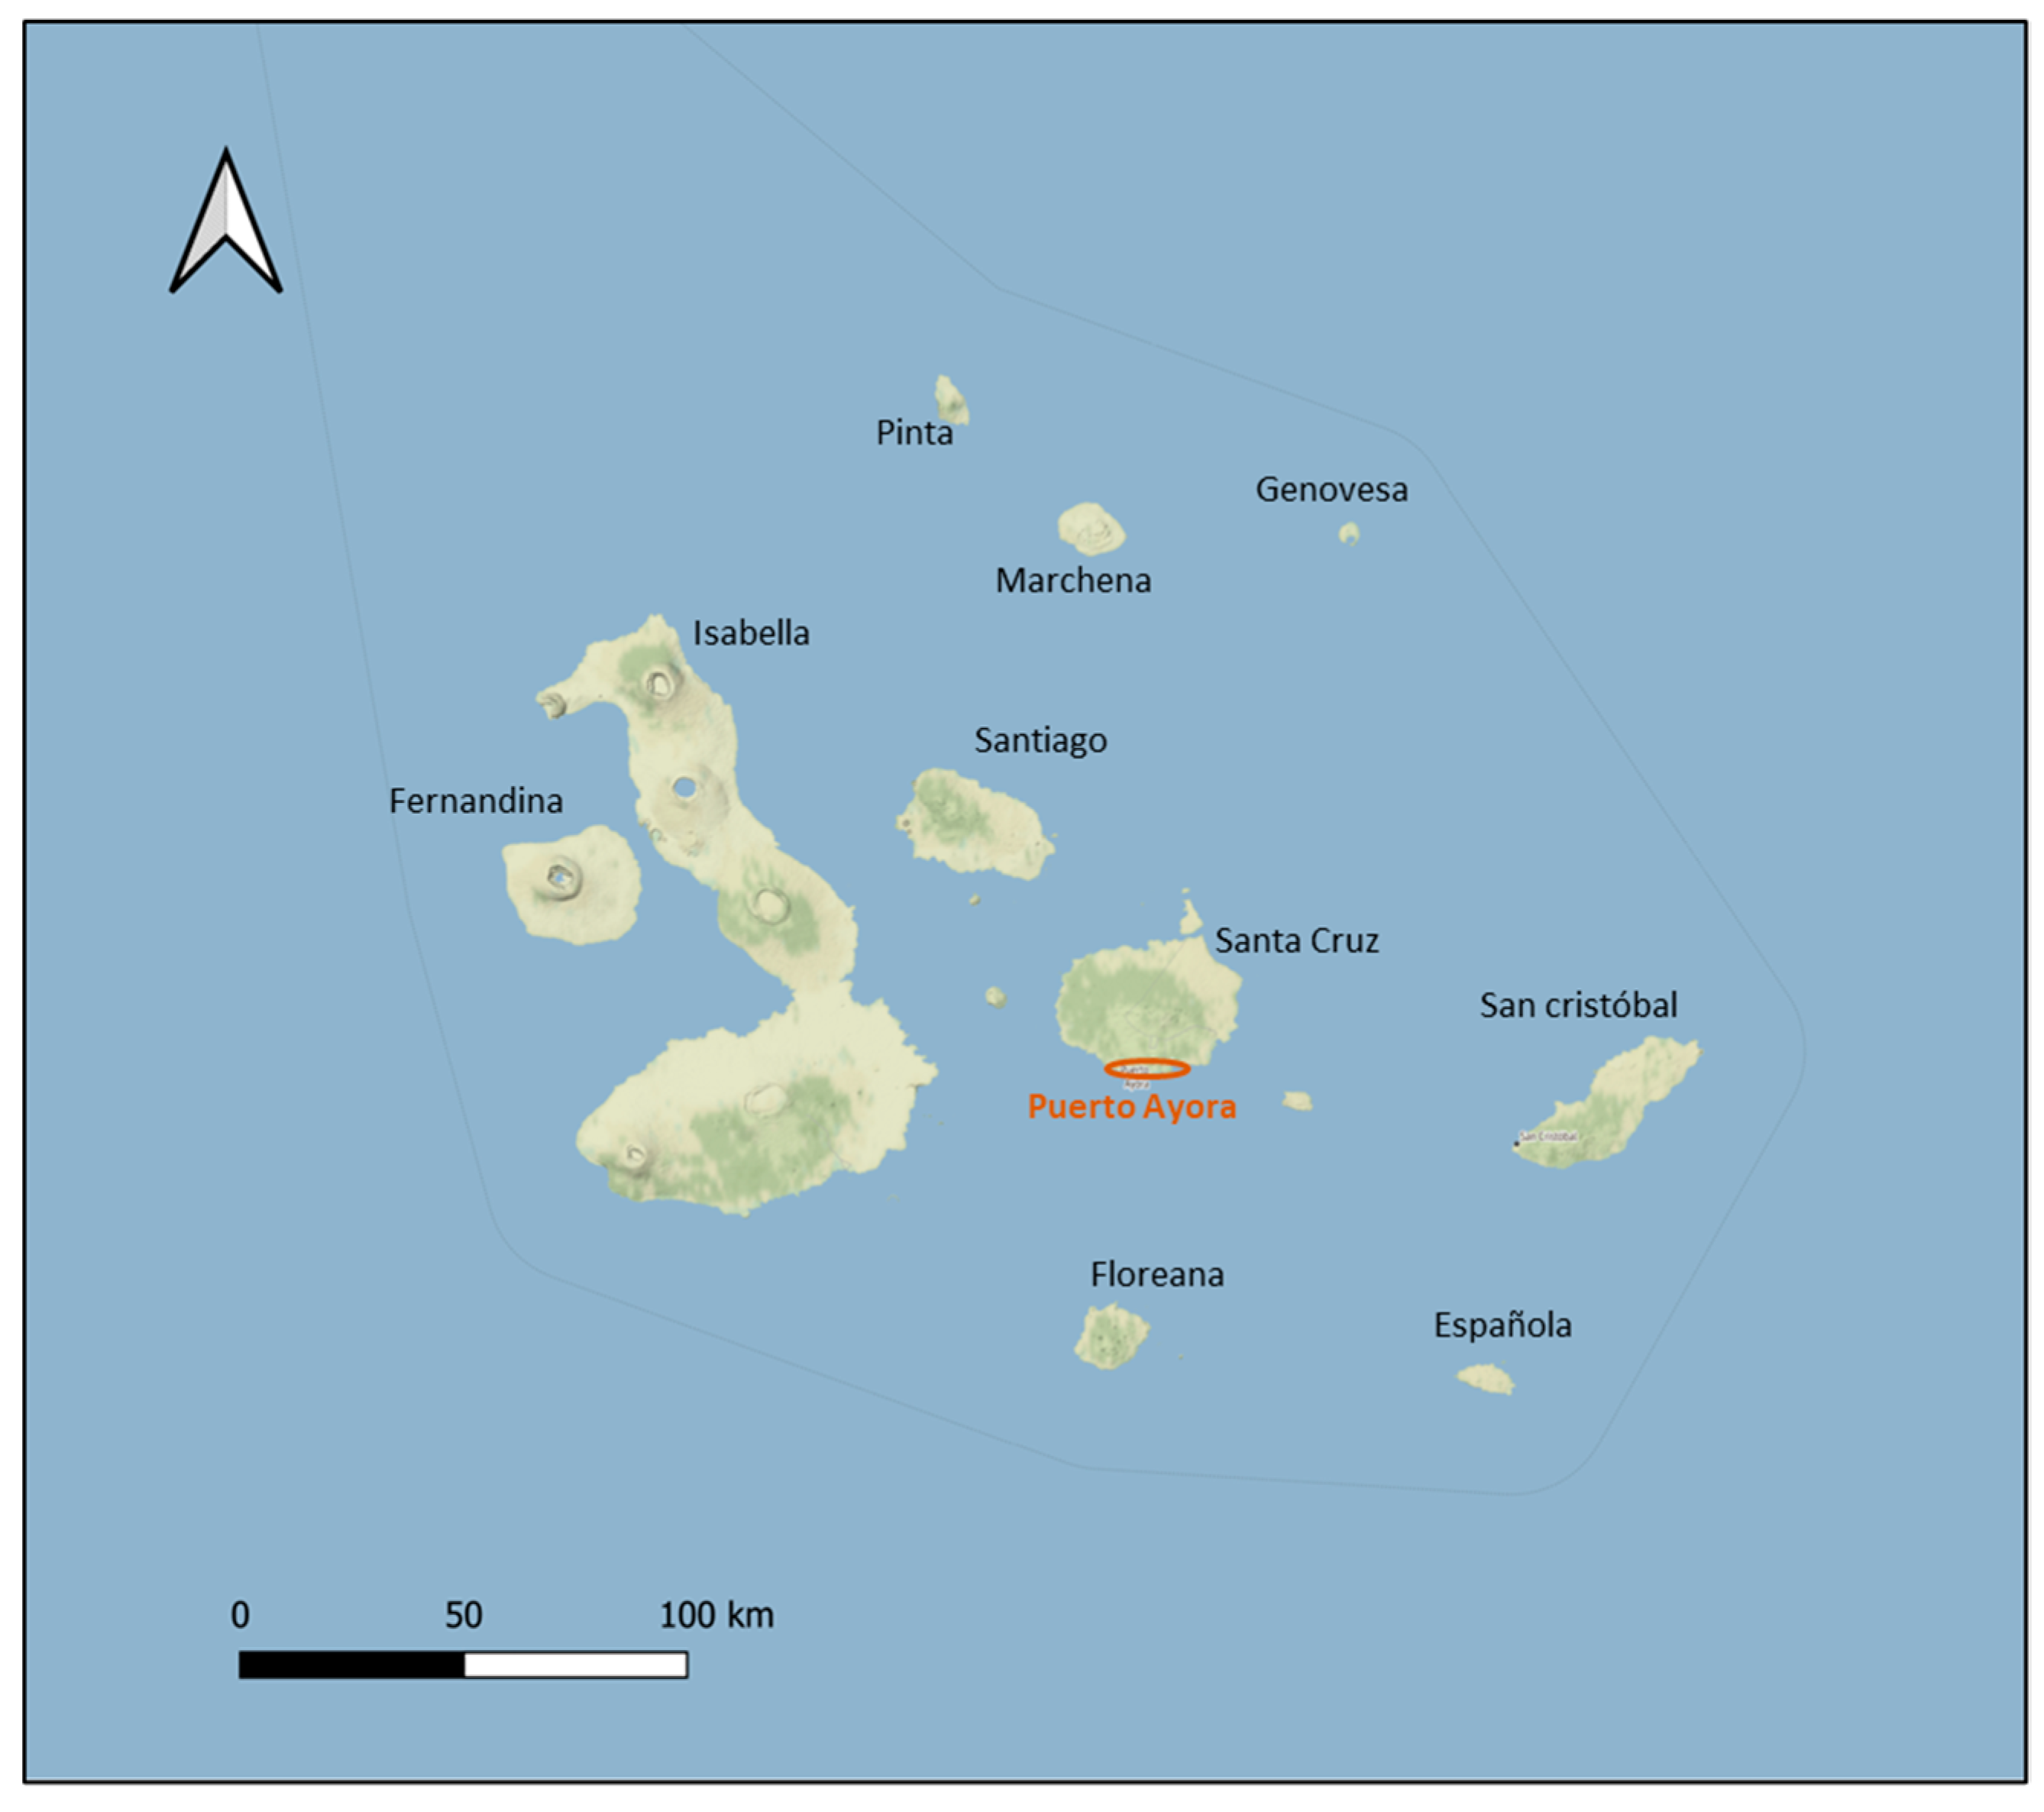
Figure 1. Map of the Galapagos Archipelago with indication of Puerto Ayora on Santa Cruz island.
Drones 07 00416 g001
Figure 2. GCP measurement with Trimble 8 on a target sheet.
Drones 07 00416 g002
Figure 3. Visualization of the flight routes of all nine flights.
Drones 07 00416 g003
Figure 4. Visualization of the modelling process in Agisoft Metashape for area of the Charles Darwin Research Station: dense point cloud (A), mesh (B), and texture (C).
Drones 07 00416 g004
Figure 5. Clipped area of the Charles Darwin Research Station to obtain the intertidal zone: output automated process based on information from DEM (A) and output from manual process guided by information from DEM (B).
Drones 07 00416 g005
Figure 6. Orthophoto for the full coastline (left) and for the coastline of the Charles Darwin Research Station (right).
Drones 07 00416 g006
Figure 7. Digital elevation model clipped analogue to the manual guided method used in Figure 5B, for the full coastline (left) and for the coastline of the Charles Darwin Research Station (right).
Drones 07 00416 g007
Figure 8. Intertidal habitat map of the coastline of the Charles Darwin Research Station, classified using the spectral angle mapper classifier.
Drones 07 00416 g008
Table 1. Error matrix of the intertidal habitat classification (in pixels) (the first column refers to ground truth data and the upper row refers to model data).
SandVegetationRockWaterTotal
Sand34,30713076289242,157
Vegetation0805811808176
Rock0065,790751473,304
Water0036,37067,146103,516
Total34,3078188109,90674,752227,153
Table 2. Classification accuracy of intertidal habitat classification.
ClassProducer’s Accuracy (%)User’s Accuracy (%)Kappa Hat
Sand100.0081.380.78
Vegetation98.4198.560.99
Rock59.8689.750.80
Water89.8364.870.48
Overall accuracy (%)77.17
Kappa hat0.66
Disclaimer/Publisher’s Note: The statements, opinions and data contained in all publications are solely those of the individual author(s) and contributor(s) and not of MDPI and/or the editor(s). MDPI and/or the editor(s) disclaim responsibility for any injury to people or property resulting from any ideas, methods, instructions or products referred to in the content.