Article

Systematically Improving the Efficiency of Grid-Based Coverage Path Planning Methodologies in Real-World UAVs’ Operations

by
Savvas D. Apostolidis
1,2,*,
Georgios Vougiatzis
1,2,
Athanasios Ch. Kapoutsis
2,
Savvas A. Chatzichristofis
3 and
Elias B. Kosmatopoulos
1,2
1
Department of Electrical and Computer Engineering, Democritus University of Thrace, 67100 Xanthi, Greece
2
Information Technologies Institute, Centre for Research & Technology Hellas, 57001 Thessaloniki, Greece
3
Intelligent Systems Laboratory, Department of Computer Science, Neapolis University Pafos, Pafos 8042, Cyprus
*
Author to whom correspondence should be addressed.
Drones 2023, 7(6), 399; https://doi.org/10.3390/drones7060399
Submission received: 4 May 2023 / Revised: 11 June 2023 / Accepted: 13 June 2023 / Published: 15 June 2023

Abstract

:
This work focuses on the efficiency improvement of grid-based Coverage Path Planning (CPP) methodologies in real-world applications with UAVs. While several sophisticated approaches are met in literature, grid-based methods are not commonly used in real-life operations. This happens mostly due to the error that is introduced during the region’s representation on the grid, a step mandatory for such methods, that can have a great negative impact on their overall coverage efficiency. A previous work on UAVs’ coverage operations for remote sensing, has introduced a novel optimization procedure for finding the optimal relative placement between the region of interest and the grid, improving the coverage and resource utilization efficiency of the generated trajectories, but still, incorporating flaws that can affect certain aspects of the method’s effectiveness. This work goes one step forward and introduces a CPP method, that provides three different ad-hoc coverage modes: the Geo-fenced Coverage Mode, the Better Coverage Mode and the Complete Coverage Mode, each incorporating features suitable for specific types of vehicles and real-world applications. For the design of the coverage trajectories, user-defined percentages of overlap (sidelap and frontlap) are taken into consideration, so that the collected data will be appropriate for applications like orthomosaicing and 3D mapping. The newly introduced modes are evaluated through simulations, using 20 publicly available benchmark regions as testbed, demonstrating their stenghts and weaknesses in terms of coverage and efficiency. The proposed method with its ad-hoc modes can handle even the most complex-shaped, concave regions with obstacles, ensuring complete coverage, no-sharp-turns, non-overlapping trajectories and strict geo-fencing. The achieved results demonstrate that the common issues encountered in grid-based methods can be overcome by considering the appropriate parameters, so that such methods can provide robust solutions in the CPP domain.

1. Introduction

The use of UAVs for remote sensing operations has become increasingly popular in recent years, as they provide a powerful, low-cost tool to acquire high-resolution data in designated regions of interest (ROIs). Recently, enterprise domains have been exploiting UAVs to collect specific types of data and perform some specialized tasks. Currently, some of the most common applications of UAVs’ remote sensing are (i) precision agriculture [1,2,3], (ii) search and rescue [4,5], (iii) infrastructure inspection [6,7] and (iv) surveillance operations [8,9]. To make such operations more efficient in terms of resources’ usage and quality of gathered data, the UAV missions are usually automated with a mission planner (such as Ardupilot Mission Planner (http://ardupilot.org/planner, accessed on 14 June 2023), Pix4DCapture (https://www.pix4d.com/product/pix4dcapture, accessed on 14 June 2023), Drone Harmony (https://droneharmony.com, accessed on 14 June 2023) and DJI Flight Planner (https://www.djiflightplanner.com, accessed on 14 June 2023) generating paths for the vehicle(s) participating in the mission, indicating the route to be followed and the specific points where data should be collected. The most common type of path planning used for remote sensing operations with unmanned vehicles is Coverage Path Planning (CPP) [10], where the objective of the missions is to collect data out of the whole designated ROI, respecting the motional capabilities and limitations of the vehicle(s) used and taking into account the specifications of the sensor(s), while at the same time usually trying to increase the missions’ efficiency by minimizing some metric (e.g., number of turns, paths’ length, operational duration, etc.).
Most commercial mission planners use simple back-and-forth coverage patterns (boustrophedon) [11]. This CPP approach is the simplest one available, making it easy to use, and provides almost complete coverage for all shapes of ROIs. However, the CPP domain is an active research field, and thus there are several other approaches available [10,12,13], offering significantly increased operational efficiency while still ensuring complete coverage or providing solutions to more specialized problems and applications that coverage missions are needed. There are several categories of CPP methods which are divided based on different criteria (i.e., cellular decomposition/grid-based, single/multi-robot, on-line/off-line, energy-aware/non-energy-aware, etc.). This work focuses on the grid-based methods, i.e., methods that use a grid (matrix) to design the coverage trajectories.

1.1. Related Work

Out of the numerous grid-based CPP works, in this section, we have selected to present some of the most interesting, relatively recent ones. The works are presented in ascending chronological order and some of the advantages and disadvantages of each work are highlighted.
The authors in [14] propose an offline flight planner for a quad-rotor UAV that calculates coverage trajectories to ensure qualitative data gathering for image mosaicking. The presented solution segments the workspace (ROI) using approximate cellular decomposition, with the size of each cell determined by the UAV’s sensor reading and the desired overlap between two sequential images, to facilitate post-processing of the data for image mosaicking. Next, the wavefront algorithm is applied to the grid graph generated in the previous step, to calculate the path that optimally covers all graph nodes. To generate a smooth trajectory, cubic interpolation is used. The resulting trajectory can be sent to any quad-rotor equipped with a trajectory tracking controller, to execute the coverage mission. While the proposed approach seems promising, the paper lacks a significant evaluation of the generated paths with metrics. Additionally, the method is not presented to handle No-Go-Zones (NGZs) inside the ROI or geo-fenced flight areas, which may limit its applicability in certain scenarios.
In [15] a grid-based methodology for multi-robot Coverage Path Planning (mCPP) is presented. The key idea in this work is that the multi-robot problem can be solved efficiently by dividing the overall ROI to exclusive sub-regions, equal to the number of robots that will be utilized for the coverage procedure, and then solve a typical CPP problem for each sub-region. For this work, the “Divide Areas Algorithm for Optimal Multi-Robot Coverage Path Planning” (DARP) algorithm is introduced to undertake the area allocation procedure. As a next step, the Spanning Tree Coverage [16] (STC) algorithm is applied to all sub-regions to generate the coverage paths inside them. The methodology presented in the paper offers a simple, efficient and safe solution to the multi-robot problem, eliminating the possibility of intersecting trajectories, that can contribute to the development of more efficient and effective mCPP solutions for various applications. However, the paper’s evaluation is limited to simple simulated environments and further modifications and preparatory steps are necessary for the methodology to be applicable to real-world coverage missions.
In [17], the authors propose a grid-based CPP method for scanning “irregular-shaped areas” with UAVs, intending to minimize the energy consumption both during the trajectory’s generation (reduced computational time and consumption) and during the execution of the actual mission (energy-efficient paths). The authors argue that the traditional back-and-forth coverage patterns are inefficient for complex-shaped ROIs and that existing grid-based methods demand high computational time, resulting in “inefficient and expensive paths” that may not be practical for real-world operations. The presented method supports non-convex polygon ROIs with No-Go Zones (NGZs) defined inside them, as demonstrated by examples from simulated runs and the computational time analysis. The results indicate that the claimed energy improvement, compared to what the authors consider to be state-of-the-art, has been achieved. However, the generated trajectory contains intersecting points, introducing unnecessary overlap that does not contribute to the coverage procedure, showing that there is potential for further efficiency improvement. Moreover, the generated path does not strictly adhere to the defined ROI or avoids NGZs, a common issue with grid-based methods due to the discretization process.
In [18], a different grid-based energy-aware CPP approach for UAVs is proposed, which aims to find an optimal path that fully covers the designated ROI with minimum energy consumption and reduced completion time. The methodology starts by using a cellular decomposition technique to represent the ROI on a grid and generate a heatmap where the heat of each cell, in a range of [0, 1], indicates the percentage of the cell that belongs to the ROI. The size of each cell corresponds to the footprint of the sensor. Next, a “tractor mobility pattern” that covers all nodes without leaving any gap is generated, and the heatmap created in the previous step is used to determine the turning points to avoid adding distance to the path that does not contribute to coverage. The scanning direction is selected to be parallel to the longest side of the grid, reducing the number of turns and energy consumption. However, the method does not handle the relative placement of the ROI and the grid, which can lead to unnecessary turns for certain topologies. The resulting trajectory follows a typical back-and-forth pattern that completely covers the designated ROI but does not strictly adhere to the region’s boundaries and cannot support the definition of NGZs inside it.
In [19], the authors extend the work presented in [18] to allow for the definition of NGZs inside the ROI and enable multi-UAV operations, by proposing an area partitioning method called “Parallel Partitioning along a Side (PPS)”. This work aims to completely cover a ROI that includes NGZs without passing over them, utilizing multiple UAVs, while ensuring minimal energy consumption. The methodology’s main steps include area representation on a grid, partitioning the area around the NGZ and generating paths in each separate partition. The resulting trajectories inherit the advantages mentioned in [18], however, the same stands for the limitations excluding the handling of NGZs. The paper presents promising results but lacks examples of very complex-shaped polygon ROIs with complex NGZs, that could expose disadvantages deriving from the common discretization issues often met in grid-based methodologies, as mentioned above as well.
In [20] the authors present a mCPP algorithm for operations in environments with multiple land cover types. As they mention, the complexity of the outdoor environments can reduce the task execution efficiency with the utilized robots, especially in emergency search and rescue operations. To deal with this issue, the authors propose coverage operations with variable distance among the scanning trajectories, depending on the land type of the ground below. The presented algorithm first describes the “visual fields” of the robots in different land cover types, then performs an “approximately balanced task assignment” to the robots, considering the moving speeds in different land cover types, and finally applies a modified version of the STC algorithm in each of the exclusive sub-regions, to generate the coverage trajectories. The presented solution is applied in a ROI—deriving from a remote sensing image—where a comparison with different CPP methods is performed as well. While this work introduces a very interesting concept to the CPP research domain, it is not clearly presented how it could benefit specific types of operations, and it seems that several additional parameters should be taken into consideration before applying it in real-world operations.
The authors in [21] present a grid-based mCPP method to acquire high-quality images suitable for precise 3D reconstructions. The proposed CPP method provides complete coverage of the ROI, with reduced energy consumption for the UAVs, while ensuring the required overlap among the collected images for a qualitative 3D reconstruction. To segment the overall ROI and fairly allocate exclusive sub-regions to each UAV, the authors adopt a ray-scan-based area division technique, overcoming the operational limitation imposed by the small battery capacity of common commercial multi-coptered UAVs. Finally, a simulated annealing algorithm is used to find “near-optimized paths” for each sub-region. The proposed system was validated through a single site experiment, achieving considerable reduction in energy consumption and paths’ length, compared to the traditional back-and-forth coverage pattern. Although the generated paths include a relatively large number of turns, which increases the time required to complete the mission and the energy consumption, this “complexity” in the paths may provide better results for 3D reconstructions, as it allows for the collection of data from multiple angles. It should be noted that the selected take-off position in the single real-world experiment does not complement the back-and-forth method, as the UAVs have a considerable distance to cross back to that position after completing the mission.
In [22] a work for search and rescue operations with multiple UAVs in the maritime domain is proposed, based on hexagonal grid decomposition. The main objective of this work is to generate search paths that cover all the generated nodes, in the shortest amount of time possible, since in such operations time is critical. Based on the idea that the cells’ shape and placement can lead to very different generated trajectories, the authors present a method where multiple heterogeneous UAVs can operate simultaneously to cover a ROI, that has been previously represented on a hexagonal grid. In the presented solution, the cell’s size is determined by the sensor’s footprint to ensure effective coverage. While this work does not present any significant breakthrough, it demonstrates how the grid’s type can affect the generated trajectories and possibly benefit specific types of applications, something that is not usually taken into account by researchers.
In [23] the authors propose a CPP algorithm called Parallel Self-Adaptive Ant Colony Optimization Algorithm (PSAACO), that supports the definition of NGZs inside the given ROI. To avoid NGZs, the authors propose a Dynamic Floyd Algorithm (DFA), which can dynamically add deviation points to the generated trajectory without significantly increasing the overall computational cost. The simulated evaluations performed prove that the proposed method has the smallest energy consumption and completion time compared to the alternative CPP solutions used in the study. While this work proves the claimed benefits through simulated experiments, all of the example ROIs (both the boundaries of the region and the NGZs inside them) conveniently coincide with the grid’s cells, showing that the features of the presented work mostly refer to the representation of the ROI on the grid and not necessary the ROI itself.
In [24], the authors build upon the base methodology presented in [15] and propose an end-to-end platform for remote sensing operations with multiple UAVs, optimized for real-world applications. This work presents all the necessary steps to apply a grid-based method in real-world scenarios, such as coordinates’ transformation, ROI’s representation on grid, task allocation and path generation. The authors package all the components required to deploy a multi-UAV coverage mission into an end-to-end, user-friendly platform, including a graphical user interface (GUI) and a database, allowing to define, store, launch and manage the missions, and a custom application to execute the generated paths with commercial coptered UAVs. The main contribution of this work is an optimization procedure that calculates the optimal relative placement between the grid and the ROI, using simulated annealing algorithm, to ensure an increased percentage of coverage for STC and grid-based CPP methods in general. In addition to that, the base methodology [15] is extended to allow for proportional area allocation and to reduce the number of turns in the paths, to make them more efficient. A comparison with a powerful state-of-the-art method demonstrates the high efficiency of the paths in terms of turns’ number and path’s length, which become reflected in completion time and energy consumption, and overall coverage scores. A multi-robot marginal utility study demonstrates the benefits of multi-UAV missions in terms of operational time and costs for certain missions. Finally, two real-life experiments demonstrate the applicability and robustness of the proposed solution in indicative use cases, such as precision agriculture and search and rescue. The proposed mCPP method manages to provide efficient paths even in the most complex-shaped ROIs with NGZs inside them, something that is not very common in the CPP domain. However, while the optimization procedure significantly improves the percentage of coverage achieved, it does not completely solve the discretization issues caused by the representation of a continuous ROI on a grid. In rare cases, the paths can cross a NGZ or the boundaries of the ROI and the percentage of coverage is high enough but not always complete (∼100%) for the benchmark ROIs used in the evaluation.
Table 1 summarizes the works presented in this section. In this table, N/A stands for not-applicable and N/E stands for not-evaluated. At a glance, it is clear that while several works are applied, or at least easily applicable to real-world scenarios, the quantitative evaluation of a method’s coverage performance is not (yet) a very popular practice among CPP research works. In addition to that, while about half of the works allow the definition of NGZs inside the ROI, the generation of strictly geo-fenced paths (either regarding the ROI, or the NGZs) is a matter that does not seem to particularly concern the domain’s researchers. Overall, although several interesting ideas are presented in the recent grid-based CPP works, almost none of them deal with the efficient representation of the ROI on grid first. The features of the introduced methodologies apply to the representation of the actual ROI on a grid, with the researchers neglecting the fact that this representation may differ significantly, depending on the shape of the ROI and the mission’s specifications. Out of the presented works, only [24] considers such issues, however, it still does not manage to completely eliminate the problems caused by them.
1.2. Contributions

This work exploits [24] as a basis and goes one step further to solve the issues that are usually faced when applying grid-based CPP methods in real-world scenarios. Taking advantage of the coordinates’ transformation and the optimization procedure introduced in [24], we introduce three different methods to represent the ROI on the grid and generate the STC paths, resulting in three CPP modes with features that make them more appropriate for specific operations. Specifically:
  • Geo-fenced Coverage Mode (GCM) which guarantees no crossing of the paths with the NGZs or the boundaries of the ROI.
  • Better Coverage Mode (BCM) which guarantees no crossing of the paths with the NGZs but allows the paths to get slightly outside the ROI to provide better coverage in the marginal areas.
  • Complete Coverage Mode (CCM) which guarantees no crossing of the paths with the NGZs or the boundaries of the ROI but also ensures complete coverage even for the most complex-shaped regions, by modifying the principals of the STC algorithm.
The result is a CPP method which can face a wide range of challenging real-world operations, appropriate for use with any (commercial or custom) UAV capable of following pre-defined trajectories, and highly efficient in remote sensing operations, since it ensures data collection with the demanded overlaps for various applications.
The efficiency and robustness of [24] in real-world operations have been proven through simulated evaluations and on-the-field demonstrations. The new path planning modes introduced in this work are thoroughly evaluated using the same publicly available methodology and benchmark ROIs, to provide a direct comparison with the state-of-the-art CPP alternative.
The three major contributions of this work are:
  • The presented ideas and introduced methods for the representation of the ROI on grid, which manage to address the issues usually faced in real-world operations with grid-based CPP methods.
  • A highly efficient in UAVs’ real-world operations CPP method, with the three aforementioned ad-hoc coverage modes.
  • A quantitative simulated evaluation performed using publicly available ROIs, method, and metrics, which proves our method’s claimed benefits and sets a new benchmark for CPP methods in general (grid-based or not).

1.3. Paper Outline

The rest of the paper is organized as follows: Section 2 explains the parameters that should be considered in coverage missions with UAVs and the peculiarities met in grid-based methods that deal with this problem, Section 3 introduces the three novel path planning modes developed in the context of this work, explaining them both from a technical and a functional perspective, Section 4 presents the simulated evaluation performed for the newly introduced modes and finally, Section 5 summarizes the presented work.

2. Problem Formulation

2.1. CPP for UAVs’ Remote Sensing Operations

The CPP problem for UAVs’ remote sensing operations lies in the calculation of trajectories which can provide complete coverage for the selected ROI, respecting all the hardware, legal and user-defined specifications, and limitations. Many approaches try to provide that by simultaneously minimizing the demanded time and energy to perform a specific mission. With the objective to collect data out of the whole region, one or more UAV(s) that could be multi-rotor, fixed-wing, single-rotor or hybrid-VTOL [25] are utilized, each of them carrying a sensor with certain specifications (e.g., horizontal and vertical resolution ( r e s h , r e s v ) and field of view (HFOV, VFOV, usually provided by the sensors’ manufacturers in degrees)). The post-processing data analysis required for a specific application (e.g., generation of orthomosaics, elevation models, 3D representations, etc.) indicates the desired overlap between two sequential image captures (sidelap and frontlap), usually defined in percentages (percentage of sidelap p s and percentage of frontlap p f ).
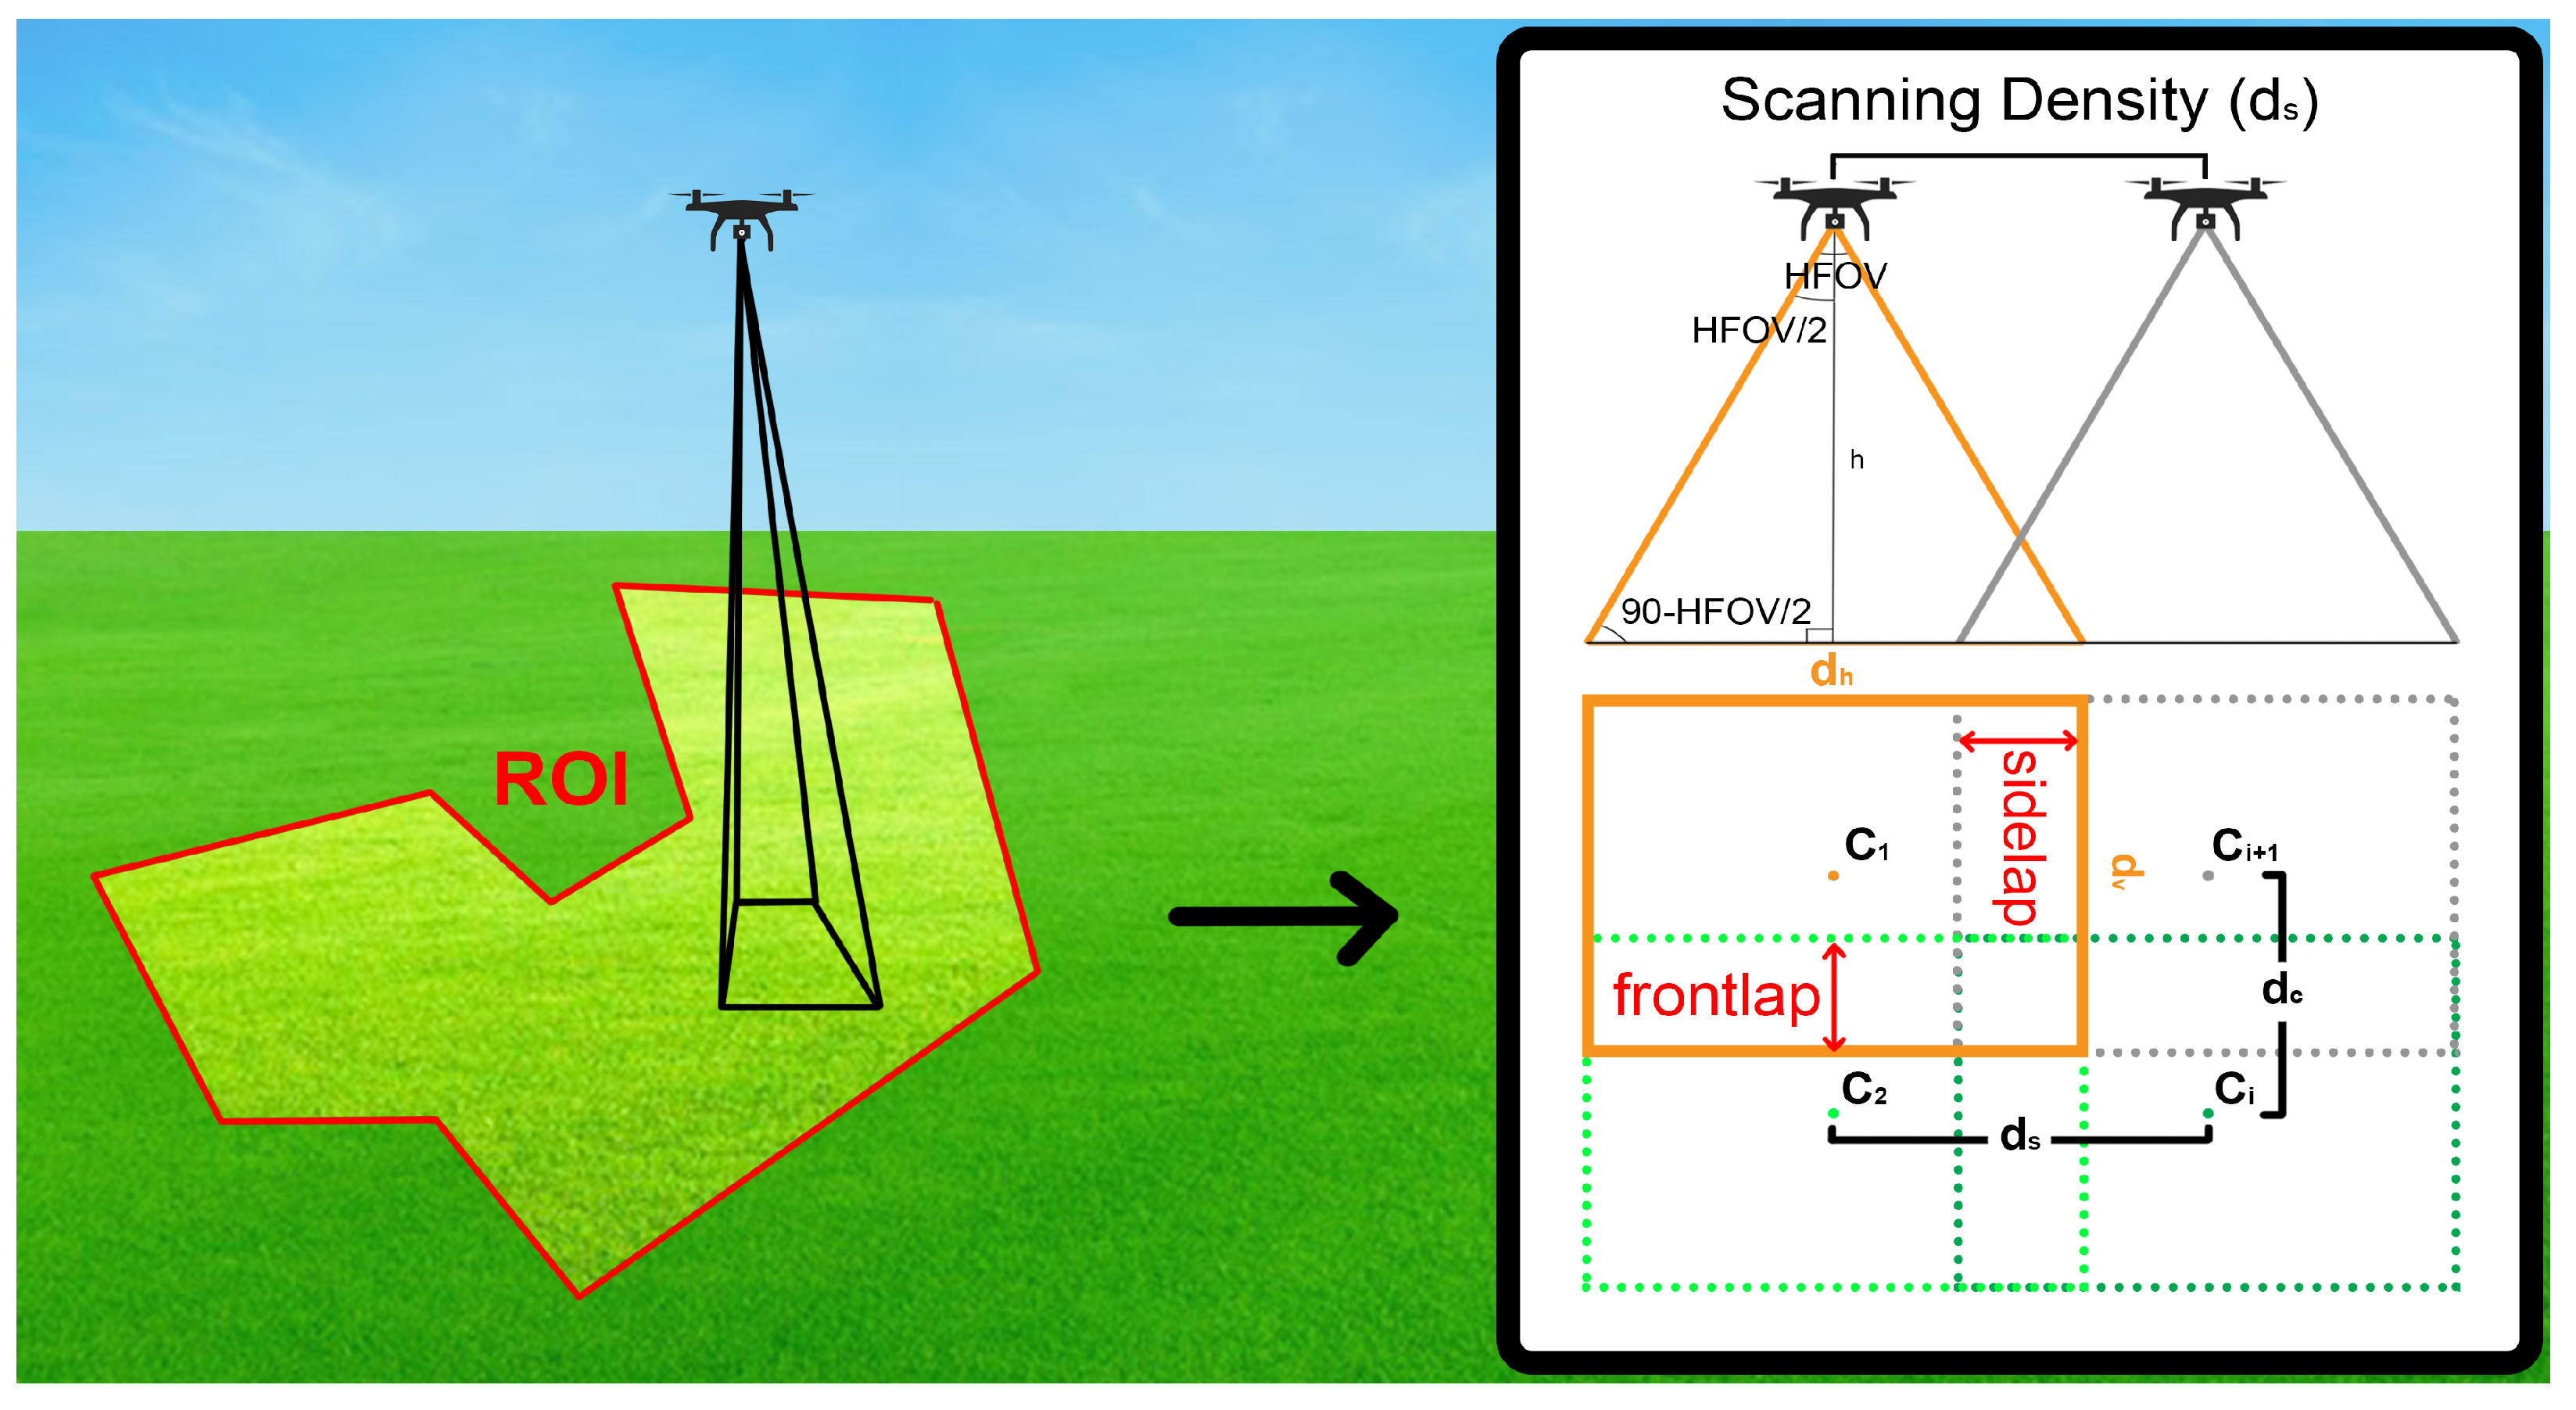
The area of land covered in a single image capture from the UAV, at an altitude h, is d h · d v , where:
d h = 2 h sin ( H F O V / 2 ) sin ( 90 H F O V / 2 ) d h = 2 h tan ( H F O V / 2 )
d v = 2 h sin ( V F O V / 2 ) sin ( 90 V F O V / 2 ) d v = 2 h tan ( V F O V / 2 )
Having calculated d h and d v , a quantity that is of great importance for remote sensing applications is the Ground Sampling Distance (GSD), that corresponds to the length of land captured in each pixel (usually counted in cm/pixel for UAV missions):
G S D = min d h r e s h , d v r e s v
The altitude along with the desired sidelap defines the distance that two sequential coverage trajectories should have, a quantity that in this work will be referred as scanning density ( d s ) from now on:
d s = d h s i d e l a p = d h p s d h = ( 1 p s ) d h
Finally, the desired frontlap indicates the specific capturing positions, or along with the UAV’s speed, the capturing frequency. From now on, in this work, we will refer to the distance between two sequential capturing positions as capturing density ( d c ):
d c = d v f r o n t l a p = d v p f d v = ( 1 p f ) d v
Figure 1 visually summarizes the parameters met in UAVs’ remote sensing operations, where C i corresponds to the UAVs’ capturing positions. In this figure, the variables that refer to the longer side of the sensor are mentioned as horizontal ( H F O V , d h ) , while the ones that refer to the shorter side of sensor are mentioned as vertical ( V F O V , d v ) .

2.2. Representation of the ROI on Grid

As mentioned in introduction, a family of methods utilizes a grid for the calculation of the coverage trajectories, to provide a solution to the CPP problem. In this case, everything mentioned in Section 2.1 is still valid, however, there is one additional step that should be performed before calculating the trajectories. The ROI in such coverage operations is usually a user-defined polygon, formatted in WGS84 (World Geodetic System—1984) coordinates [26], using latitude (lat) and longitude (lon) to describe its vertices, that depending on the method may also include NGZs inside it:
R O I = { ( l a t 1 , l o n 1 ) , ( l a t n , l o n n ) }
N G Z s = { { ( l a t N G Z 1 | 1 , l o n N G Z 1 | 1 ) , ( l a t N G Z 1 | n 1 , l o n N G Z 1 | n 1 ) } , { ( l a t N G Z m | 1 , l o n N G Z m | 1 ) , ( l a t N G Z m | n m , l o n N G Z m | n m ) } }
where n is the count of polygon vertices, N G Z i   ( i = 0 , m ) stands for the NGZ’s number (pointer), n i   ( i = 0 , m ) is the count of vertices for each NGZ and m the count of NGZs. For a grid-based method to deal with such ROIs, each ROI should be first represented on the respective grid. However, this task is not always trivial and can significantly affect the performance of the overall method for the CPP problem. That is because the ROI is a continuous polygon shape and its representation on a grid corresponds to a discretization procedure that, by nature, introduces an error, meaning that the original ROI and its representation on the grid cannot be identical. Given the fact that the discretization scale (i.e., the size of the grids’ cells), in most cases, cannot be small enough to minimize this error (since it is dependent on the specifications of each respective CPP methodology), the discretization error can be high enough to hinder the application of such methods to real-world problems.
For the efficient application of grid-based methods on real-world problems, two different factors should be considered during the representation of the ROI on a grid (taking as granted that the ROI itself and the discretization scale cannot be changed): (i) the criterion(-a) that will be used to characterize each cell of the grid (obstacle/free space) and (ii) the relative placement between the ROI and the grid. From now on, when we refer to the actual region we will use the terms ROI and NGZs and when we refer to the representation on grid, we will use the terms free space and obstacle.
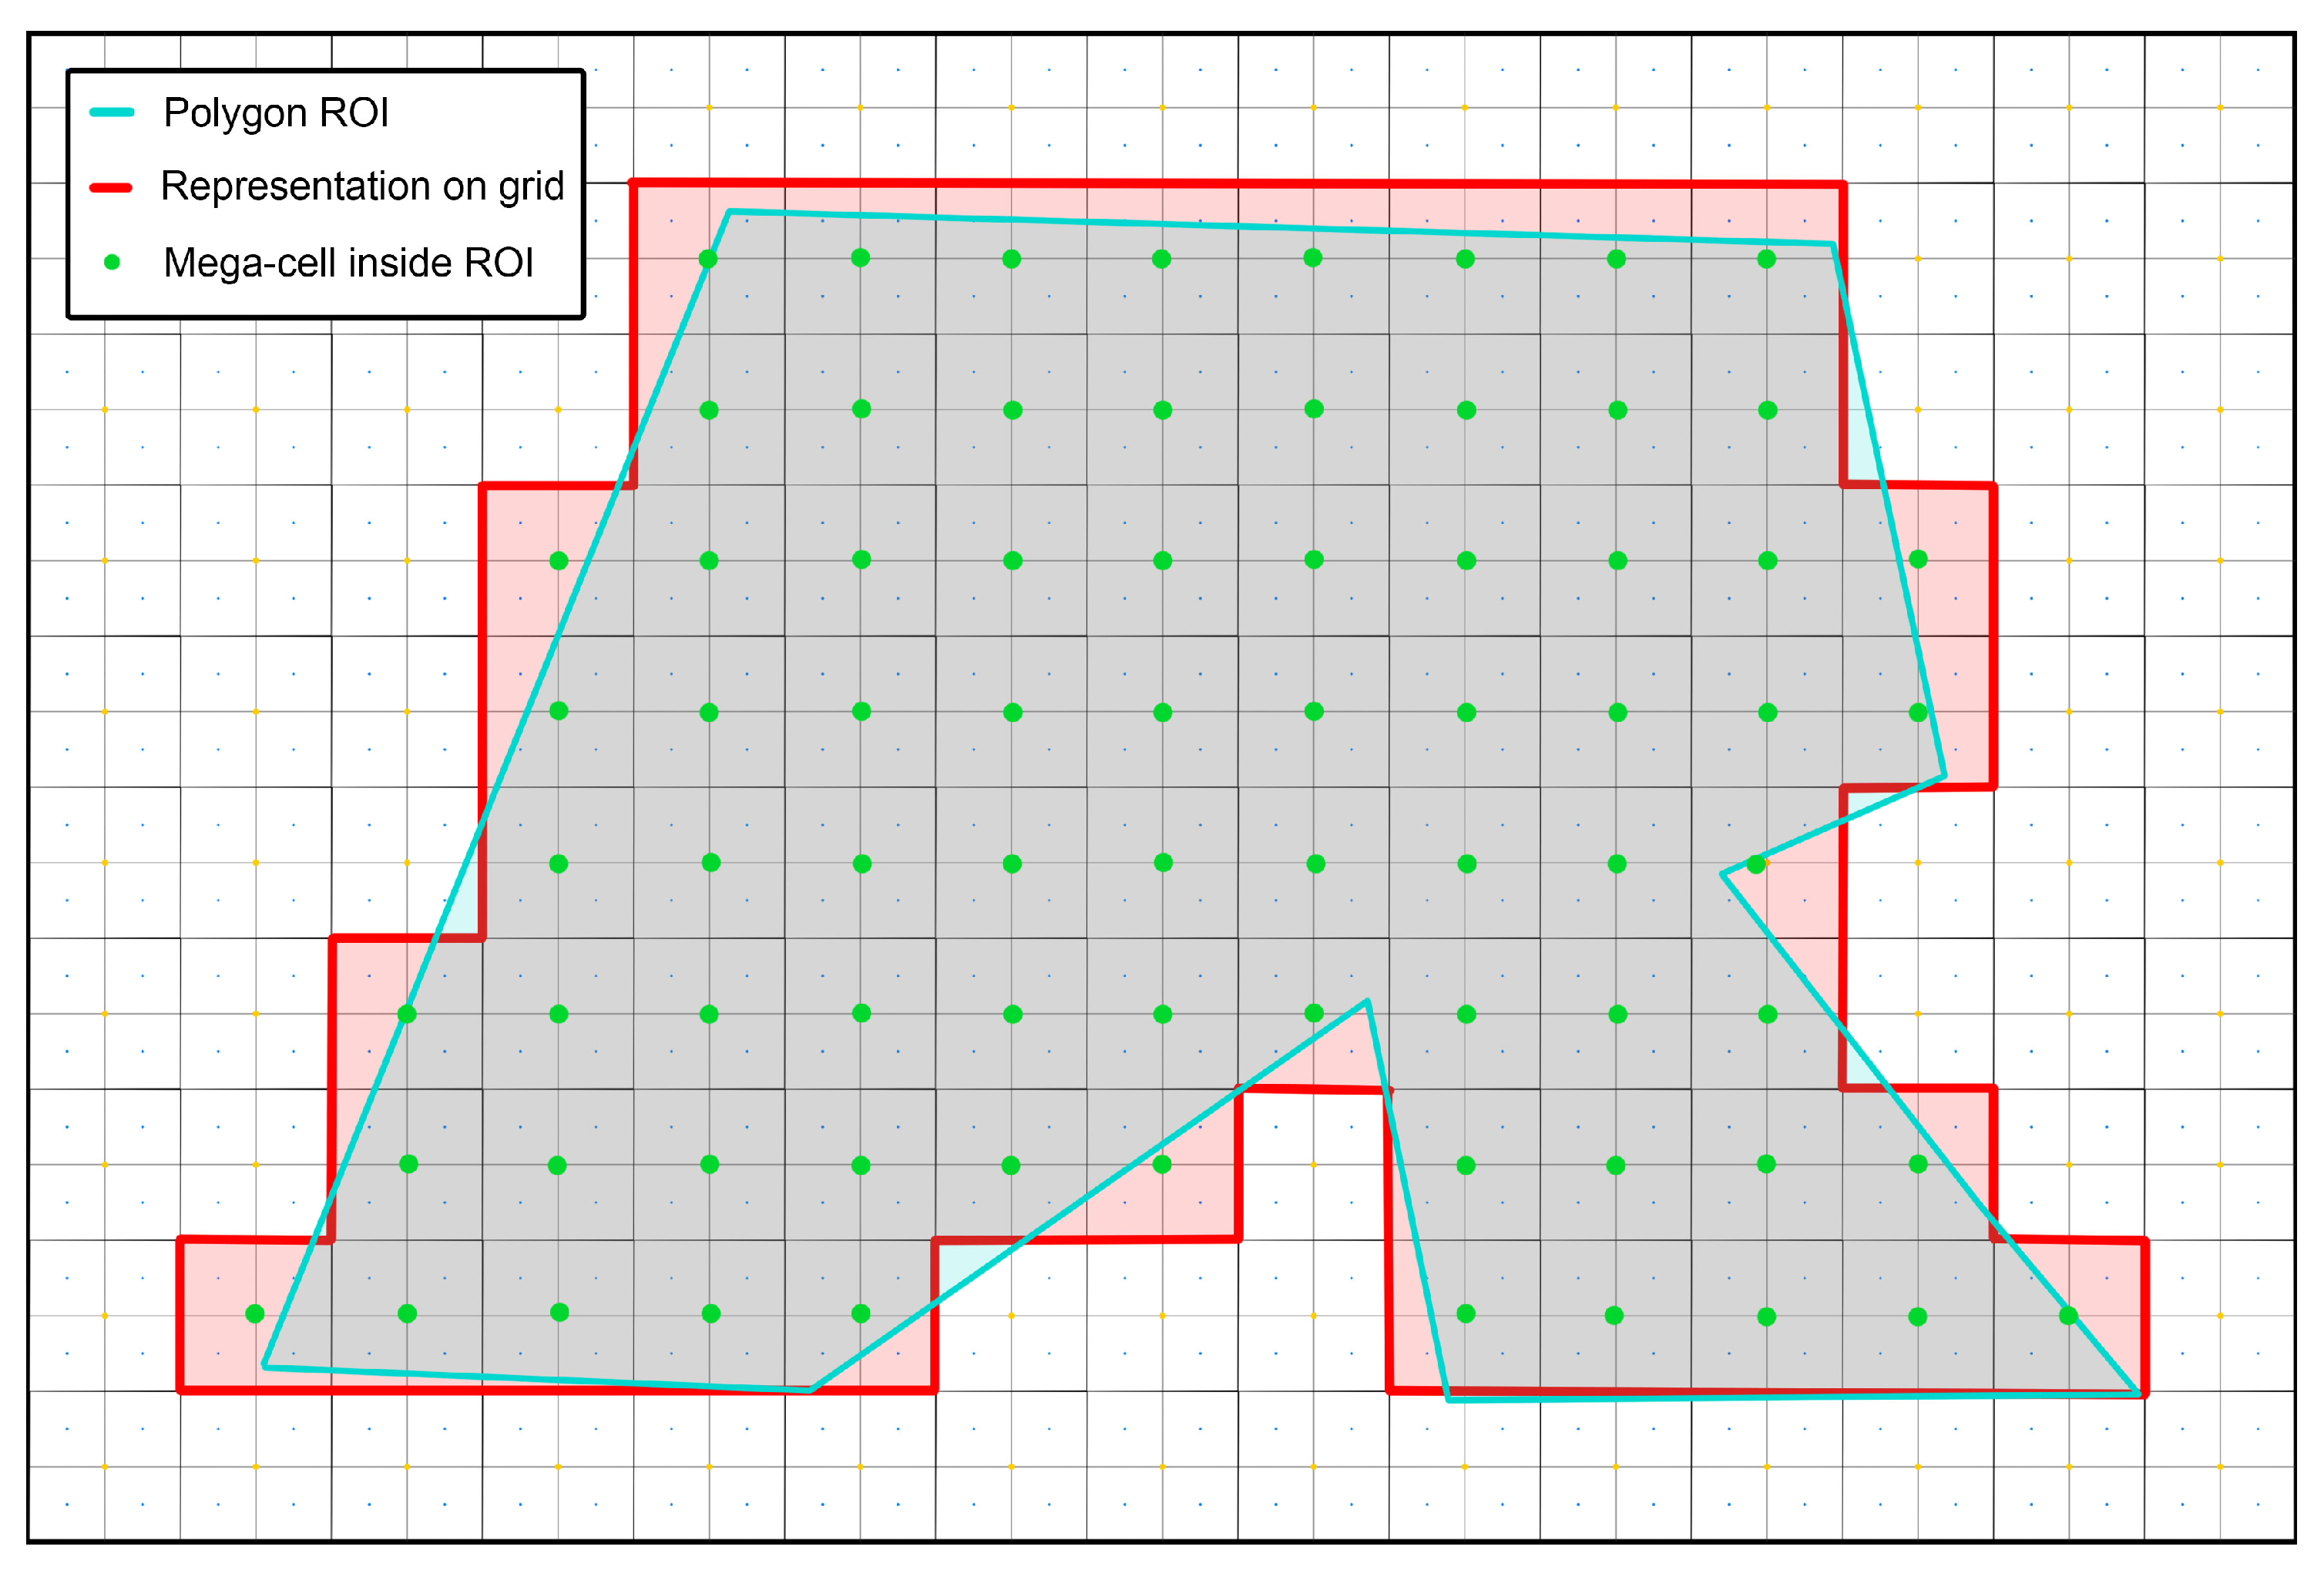
Regarding the first factor, the simplest way to decide whether a cell of the grid belongs to the ROI is to check if its center is placed inside the ROI. A different approach is to determine based on the percentage of the cells’ area that belongs to the ROI (i.e., if the cell’s area inside the ROI > 50%, then the cell belongs to the ROI). However, in both cases, the discretization procedure does not consider the specificities of the respective path-planning approach that will be applied as the next step. To explain why this can be an issue, Figure 2 shows an example of a ROI’s representation on the grid, having as a criterion the placement of the cells’ centers. From this figure, it is clear that (i) the representation of the ROI on the grid is not identical to the ROI itself and (ii) depending on the CPP method that will be used, it is likely that one of the following will happen:
  • There will not be achieved complete coverage or the ROI, as parts of it are considered “obstacles”.
  • Coverage paths can be generated outside the actual ROI since there are parts outside of it that are represented as ROI.
  • Coverage paths can be generated so that they will cross the user-defined NGZs, for the same reason.
While the above points may not always be that important, depending on the type of application, they could have a very negative impact (i.e., if an NGZ contains an obstacle that the UAV can crash, the generated trajectories should never cross them).
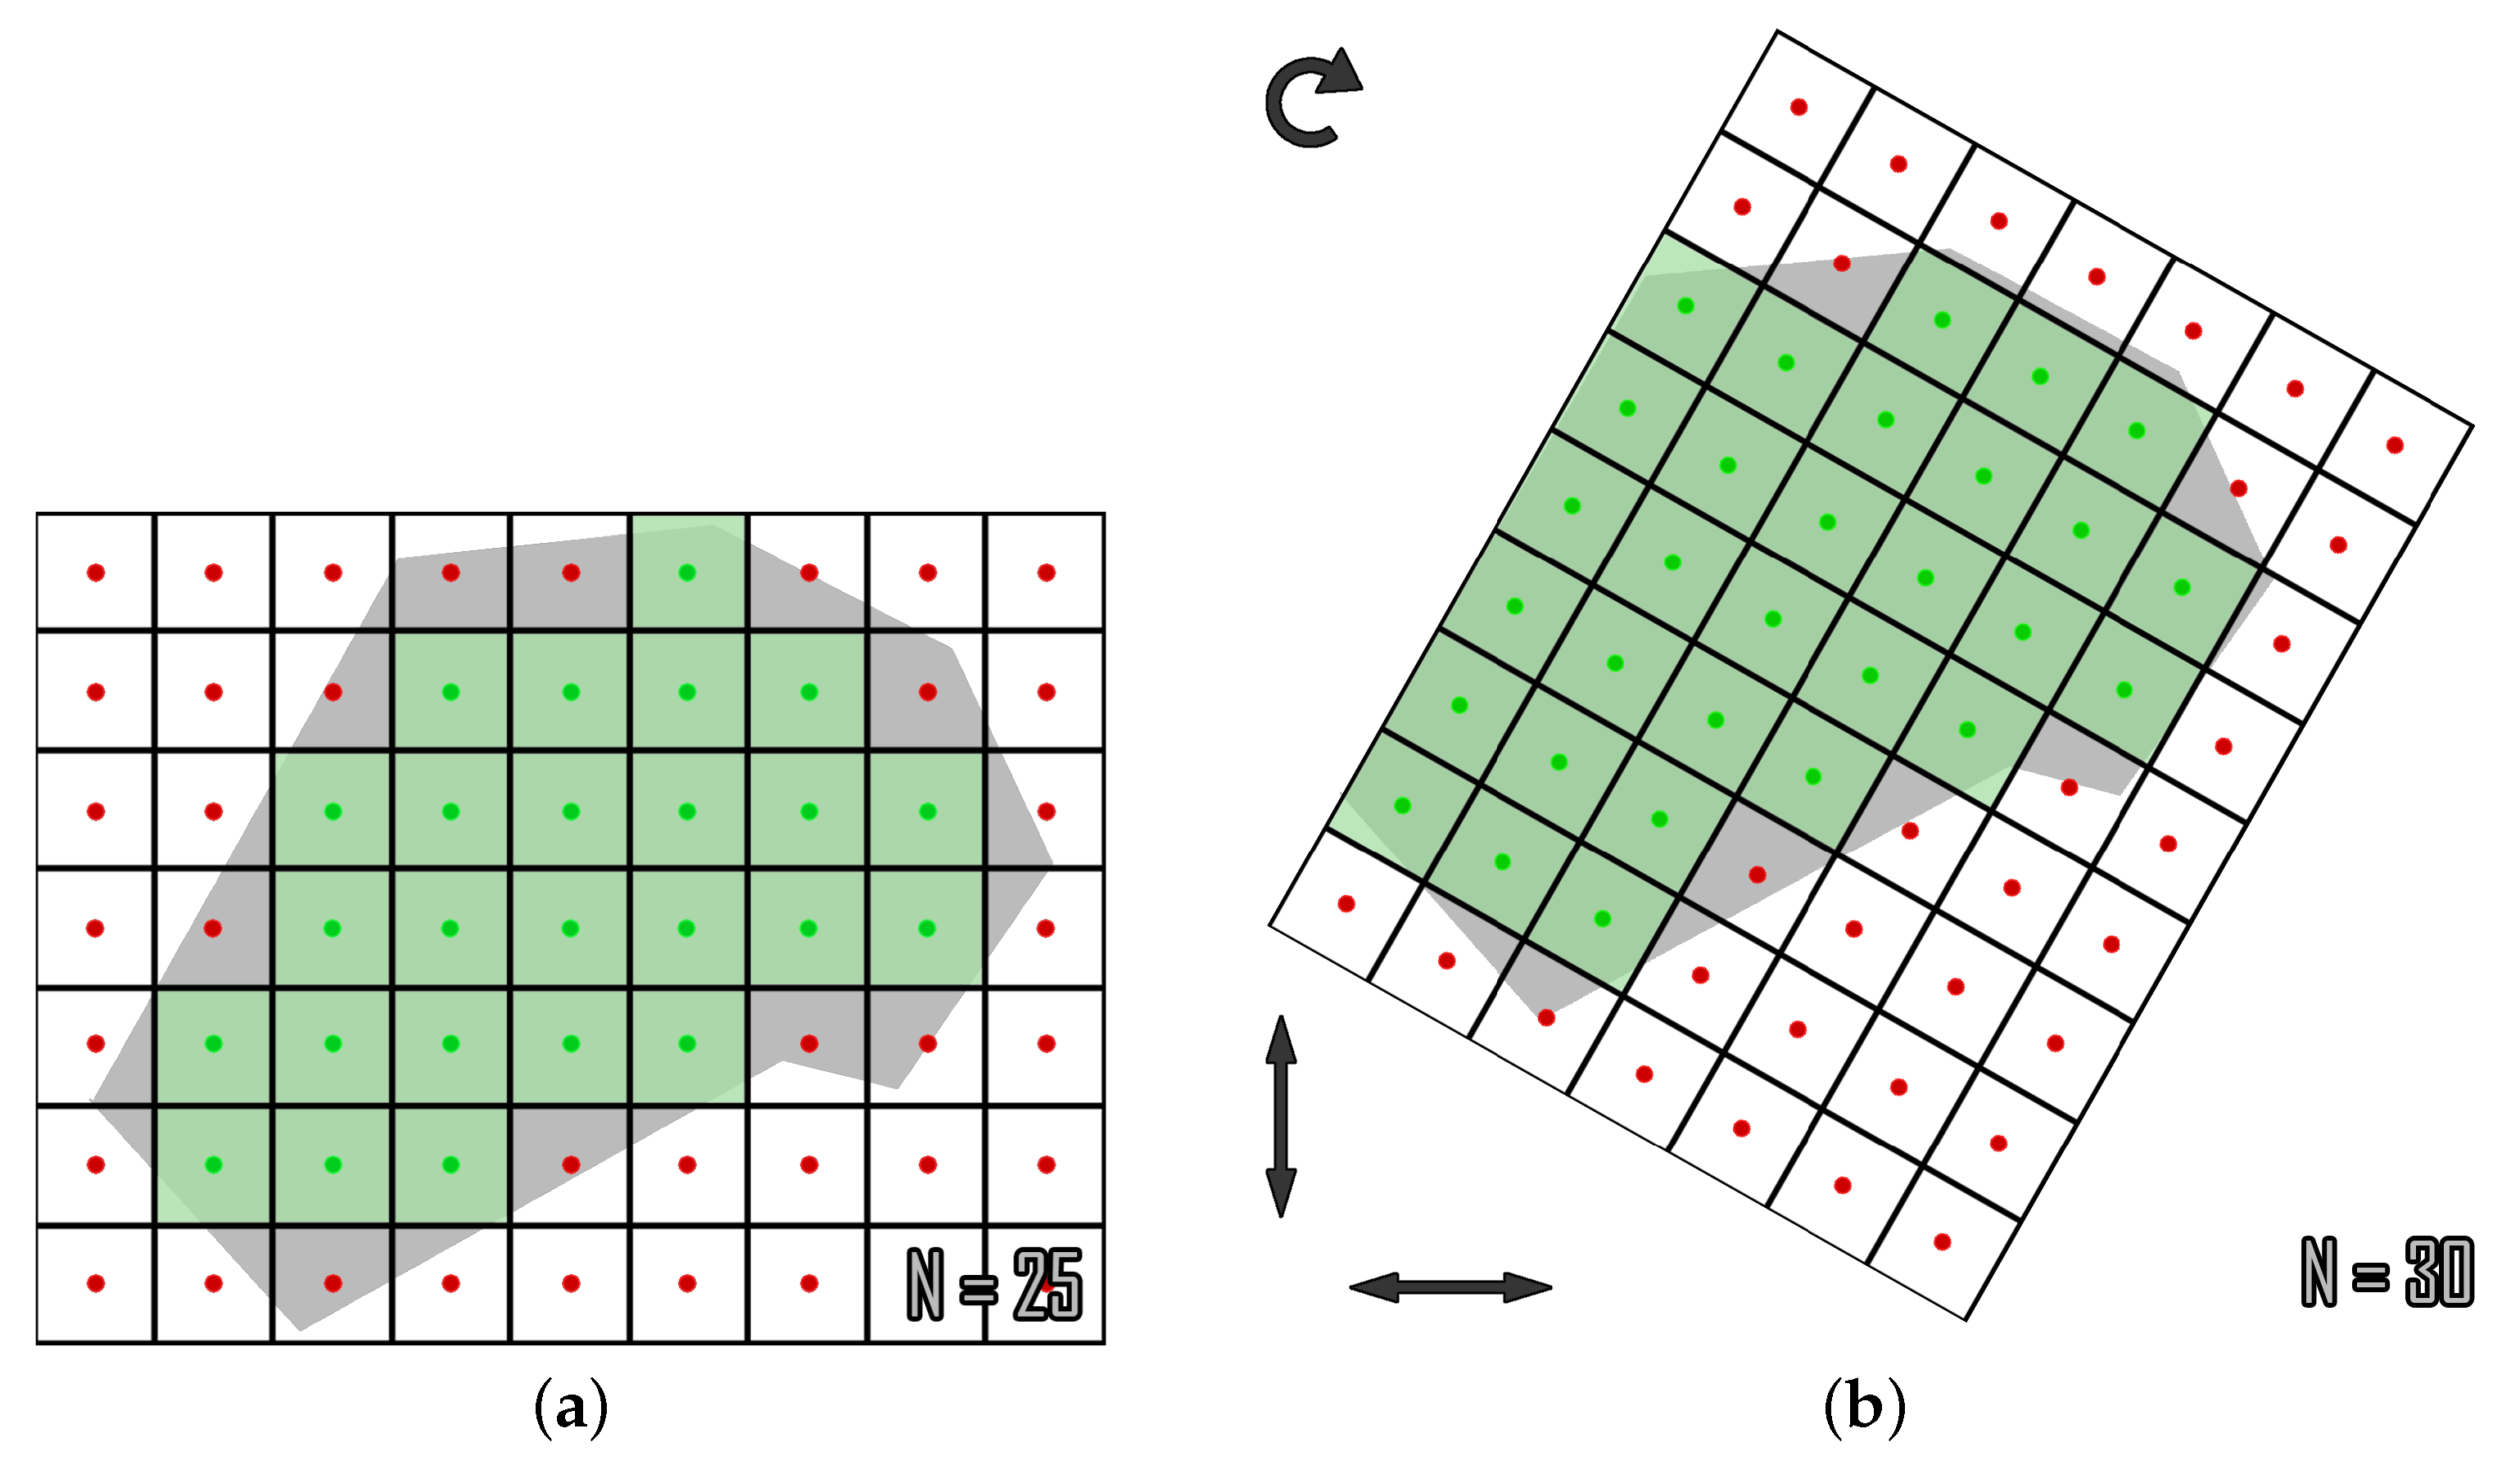
Moreover, the second factor mentioned above, as identified in [24], can significantly impact the discretization error produced from the representation procedure, directly related to the coverage results that will be achieved during the mission. Specifically, it was identified that the relative placement between the grid and the ROI could lead to many different states that can be more or less favorable for the coverage of the ROI during real-world missions. Figure 3 shows an example of the same ROI represented on a grid that Figure 3a has not been transformed (25 nodes can be used for trajectories’ generation) and Figure 3b has been rotated and shifted over two axes (30 nodes can be used for trajectories’ generation). In this example, it is clear that for the rotated and shifted grid, the relative placement between it and the ROI is more favorable for the coverage procedure since, not only the area that is considered to belong to the ROI is larger (5 additional nodes), but also, the representation is a lot closer to the actual shape of the region. Based on this idea, in [24] a novel “Node Placement Optimization” procedure was introduced which, as proved through an extensive simulated evaluation, significantly increases the achieved percentage of coverage (PoC) and improves the “qualitative” features of the paths, referring primarily to the number of turns and generated paths’ length.
For the representation of the ROI on the grid, in [24], the check of whether all four STC sub-nodes’ centers are placed inside the ROI or not is used as a criterion for the characterization of each cell as obstacle or free space (in case you are not familiar with STC algorithm, you will find a short explanation of the method in the Appendix A, as the understanding of certain aspects of the method is important for the understanding of this work as well). If all sub-nodes’ centers are placed inside the ROI, then the cell will be labeled as free space and will participate in the coverage trajectories generation procedure without any limitations. This way, the authors manage to incorporate some of the specificities of the STC algorithm into the ROI representation procedure; however, the provided solution is not flawless, as there are few cases where the generated paths can cross the user-defined NGZs or the margins of the ROI. A specific example ROI (testbed 1), carefully selected to highlight the problems that this approach can cause in certain cases, is presented in Section 3.2. In this ROI are generated coverage trajectories with [24] and all three coverage modes introduced in this work, to demonstrate how each of them deals with such cases.

3. Methodology

In this work, building upon [24], a coverage method with three ad-hoc coverage modes is presented, each tailored to serve different missions with specific requirements. Following the pipeline introduced in [24], our method receives as input a user-defined ROI formatted in WGS84 coordinates and the mission’s specifications, and produces as output coverage trajectories that are directly executable by any type of UAV, able to follow a pre-defined path formatted in WGS84 coordinates. Furthermore, building upon the standard CPP problem, this work addresses challenges such as strictly geo-fenced coverage of a ROI, generating paths without sharp turns or intersecting trajectories and guaranteeing complete coverage for any possible shape of ROI.
Since it is not feasible to provide a single solution that combines all the aforementioned benefits, the separate coverage modes are introduced, each with a unique combination of features that make it more suitable for specific types of operations. The following coverage modes are extensively described in this section: (i) Geo-fenced Coverage Mode (GCM), (ii) Better Coverage Mode (BCM) and (iii) Complete Coverage Mode (CCM). All three modes ensure that the generated trajectories do not pass through any NGZ and the special features of each coverage mode are presented in detail in Table 2. These coverage modes represent significant advancements in grid-based CPP methods and provide solutions to the remaining limitations associated with them.
Figure 4 presents the flowchart of the overall CPP method. The left part of the figure refers to the components of [24] used in this work, including the input parameters, the coordinates’ transformation and the optimization procedure that calculates the optimal grid for each specific ROI. The right part of the figure refers to the ad-hoc coverage modes, introduced in this work, including the specific checks that are performed for the ROI’s representation on grid (the numbers refer to the sections that describe these checks), and the trajectory generation procedure.
In order to arrive at the three distinct coverage modes, this work introduces novel approaches for labeling the grid’s cells, taking into consideration the application of STC in the next step. Additionally, information acquired during the labeling stage is utilized during the path-generation process to ensure compliance with each mode’s specific features.
To better organize the presented methodology, Section 3.1 outlines the various checks performed while labeling nodes. Section 3.2 then describes the three coverage modes, with references made to the previous subsection as necessary.
The careful consideration given to the labeling of nodes and its incorporation into the path generation process is a significant contribution to the field of grid-based CPP methods. This work offers a detailed and organized presentation of its methodology, making it more accessible to researchers and practitioners alike. Further research can continue to build upon and expand the presented coverage modes.

3.1. Grid’s Cells Labeling Methods

To perform the representation of the ROI on grid, as a first step, it is checked which of the grid’s cells belong to the ROI. As a next step, for each cell belonging to the ROI, it is checked if it also belongs to an NGZ; thus, should be excluded from the ROI. Section 3.1.1 presents the two different checks that can be performed for the polygon, and Section 3.1.2 presents the other two that can be performed for the NGZs afterward.

3.1.1. Polygon

(1) Sub-nodes checking method
This is the simpler of the two checks. According to this one, if at least one of the four STC sub-cells’ centers (Figure 5a) is placed inside the polygon of the ROI, the respective mega-cell is labeled as free space and will be used for path generation. To label a mega-cell as obstacle, all of the four sub-cells’ centers should be outside of the ROIs’ polygon. Figure 6 shows an example of such checks to provide a better understanding.
(2) Cross checking method
This check includes three separate steps. Specifically:
  • Step 1: the first check performed is whether the center of each mega-cell of the grid (Figure 5a) is placed inside the polygon of the ROI. The ones that are placed outside of the ROI are labeled at this step as obstacle.
  • Step 2: for the remaining mega-cells (that are not labeled as obstacle in the previous step), it is checked if the rectangle whose vertices are the centers of the four sub-cells (Figure 5b) is intersected by the polygon of the ROI. If an intersection is detected, then the mega-cell is labeled as an obstacle.
  • Step 3: for the remaining mega-cells, a final additional check is performed. For each mega-cell a cross-shaped polygon is created, such as the one shown in Figure 5c. This polygon has strictly 90 angles, the vertices inside the mega-cell are the sub-cells’ centers and the “external” sides of it are part of the sides of the mega-cell. The sides of the cross-shaped polygon are classified into four groups, specifically:
    Group A: sides (1), (2), (3)
    Group B: sides (4), (5), (6)
    Group C: sides (7), (8), (9)
    Group D: sides (10), (11), (12)
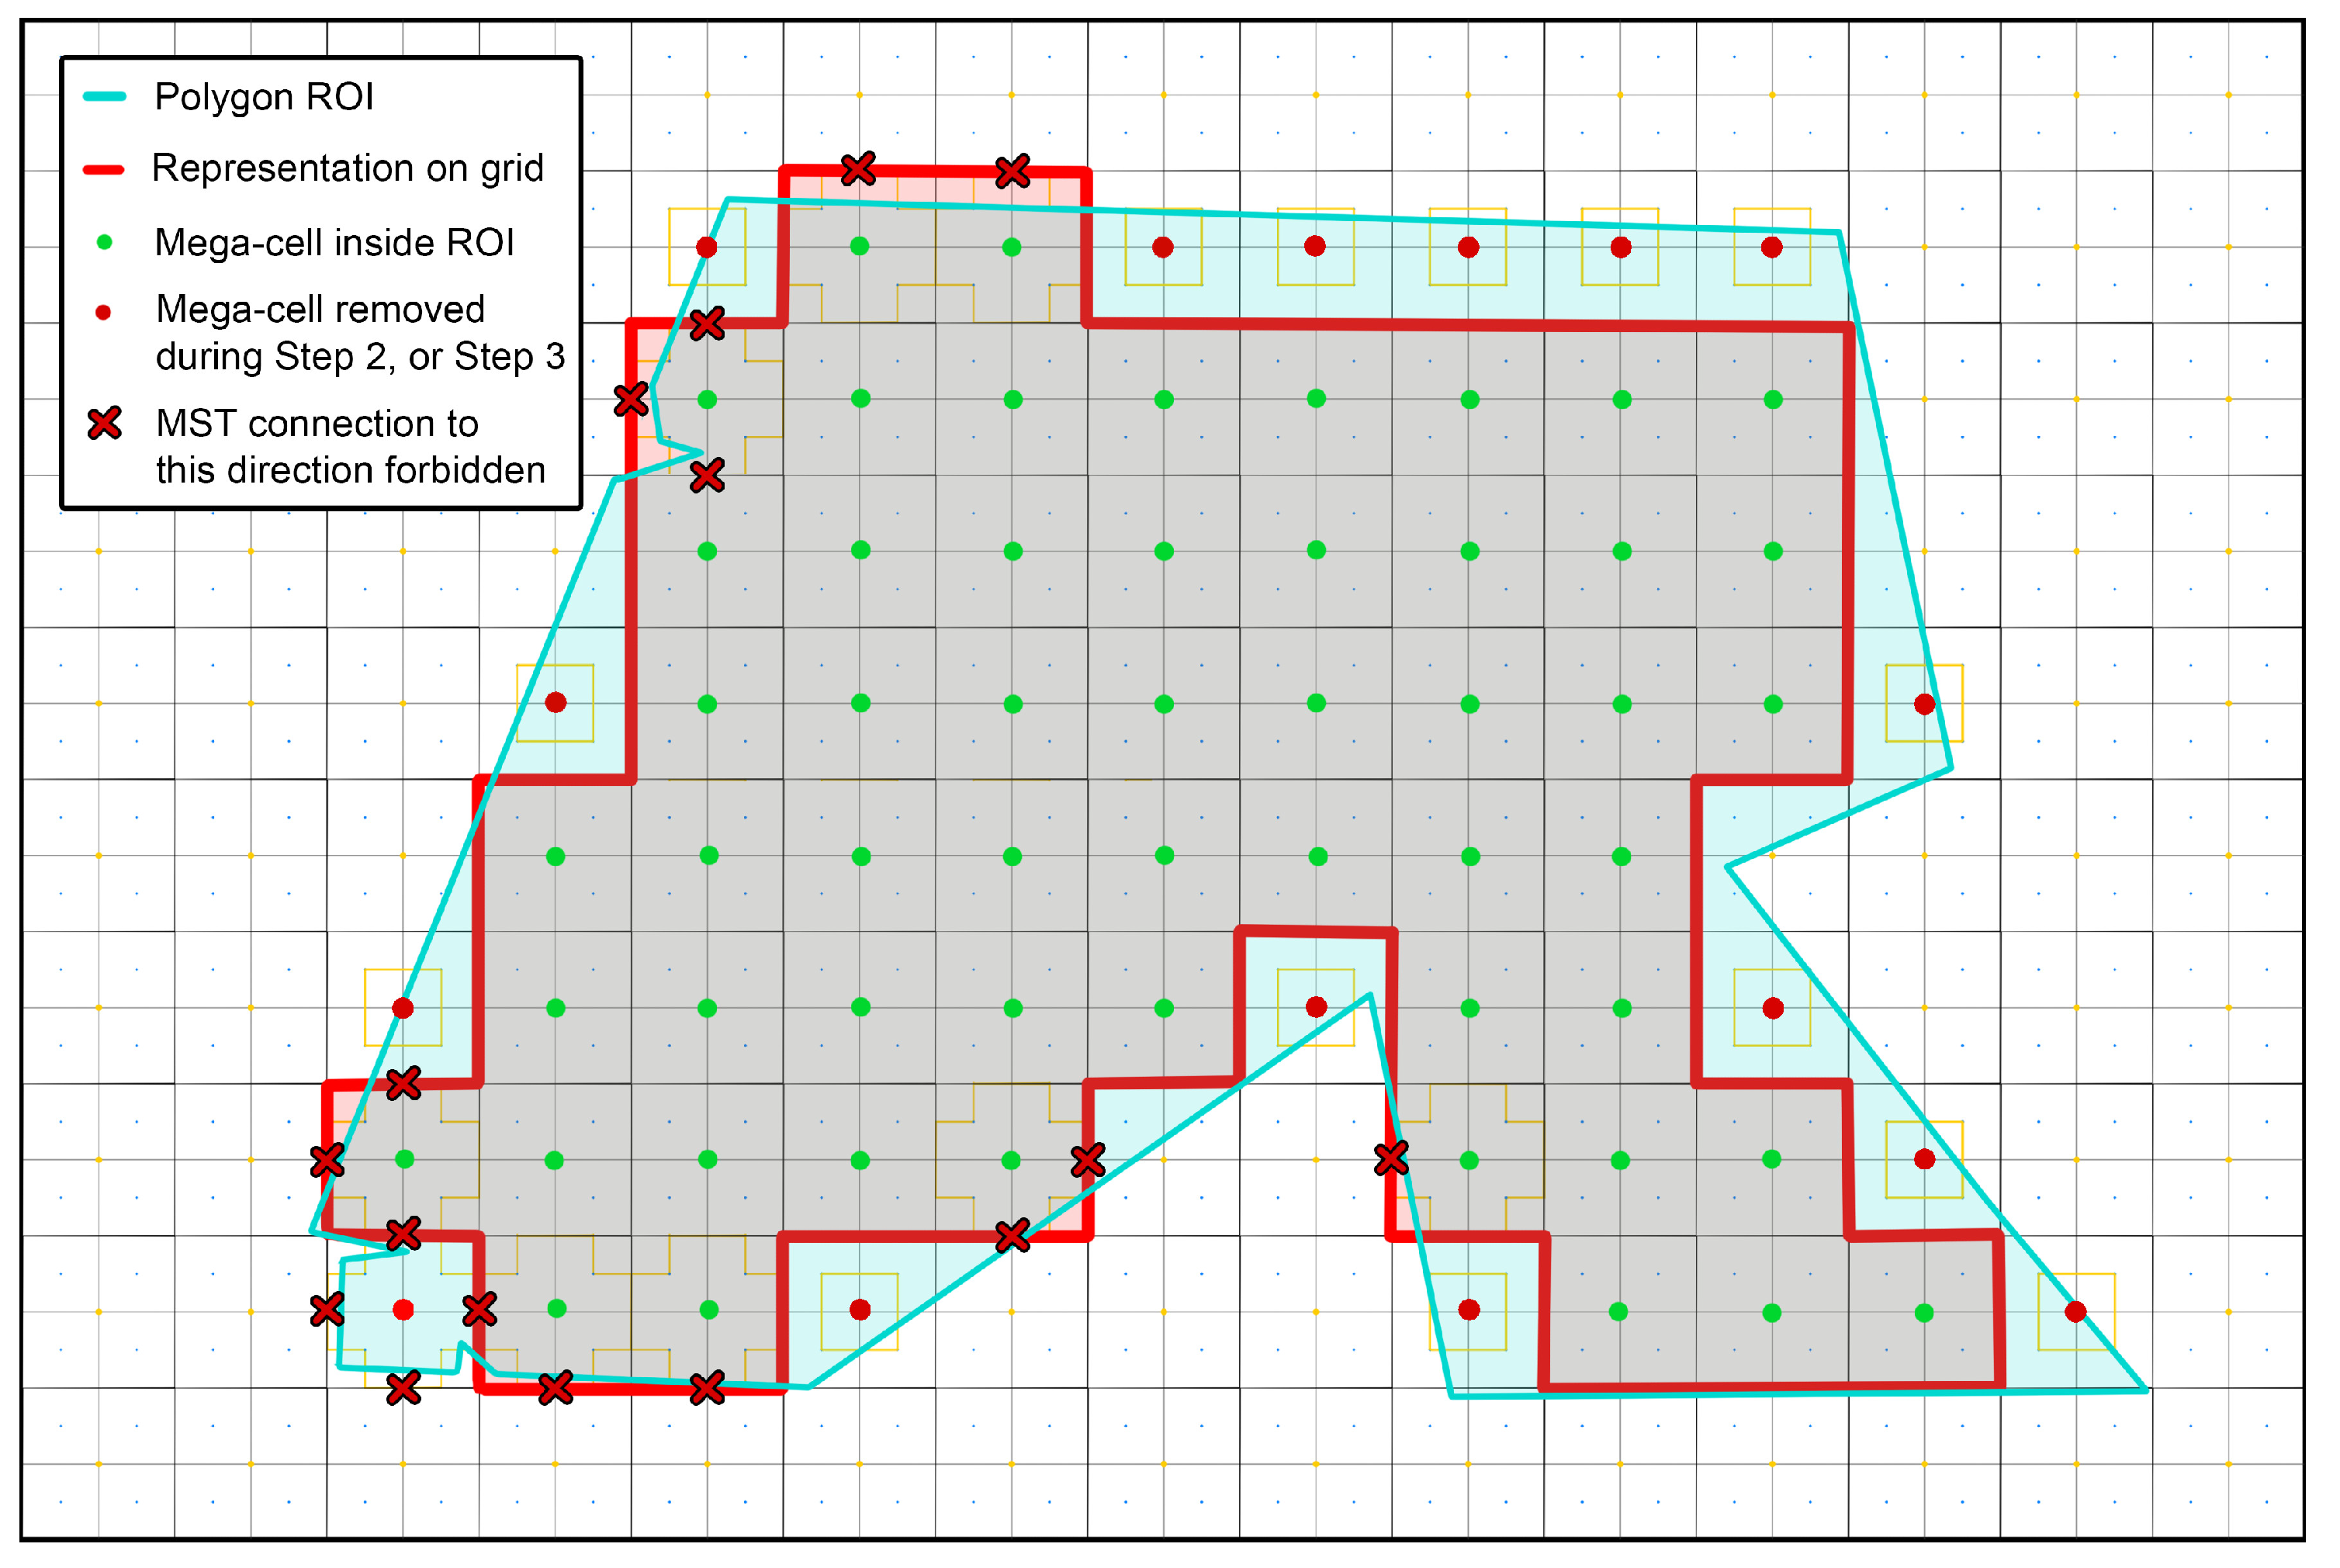
Separately for each group, it is checked whether there is an intersection between the polygon of the ROI and the sides of each group. If an intersection is detected for all four groups, the mega-cell is labeled as obstacle because there is no way to generate a path inside this cell that will not cross the boundaries of the ROI. However, if there is no intersection, the mega-cell is labeled as free space and can be used for path generation. To prevent path generation that intersects the polygon, the cost for connecting the nodes in the graph is changed to an extremely high value for directions where an intersection with the ROI’s polygon would occur. This ensures that there will not be a connection in the minimum spanning tree (MST) with the respective neighbor node, preventing the generation of a path in that direction. An example of grid representation using this method is shown in Figure 7.

3.1.2. No-Go-Zones

(1) Sub-nodes checking method
This check has the same rationale as Section 3.1.1-(1), however, this time it is performed for the NGZs instead of the ROI. To exclude a mega-cell from the ROI (label it as obstacle), according to this criterion, all of the sub-cells’ centers should be placed inside an NGZ. Otherwise, it is still considered to be free space, and it can be used for path generation.
(2) Cross checking method
This check is almost identical to Section 3.1.1-(2). The major change refers to Step 1, where this time it is checked whether the center of the mega-cell is placed inside an NGZ to change the labeling of the mega-cell to obstacle and for Step 2 and Step 3 the exact same checks are performed, but instead of trying to detect intersections with the polygon of the ROI, the checks are performed for the polygons of each NGZ.

3.2. Coverage Modes

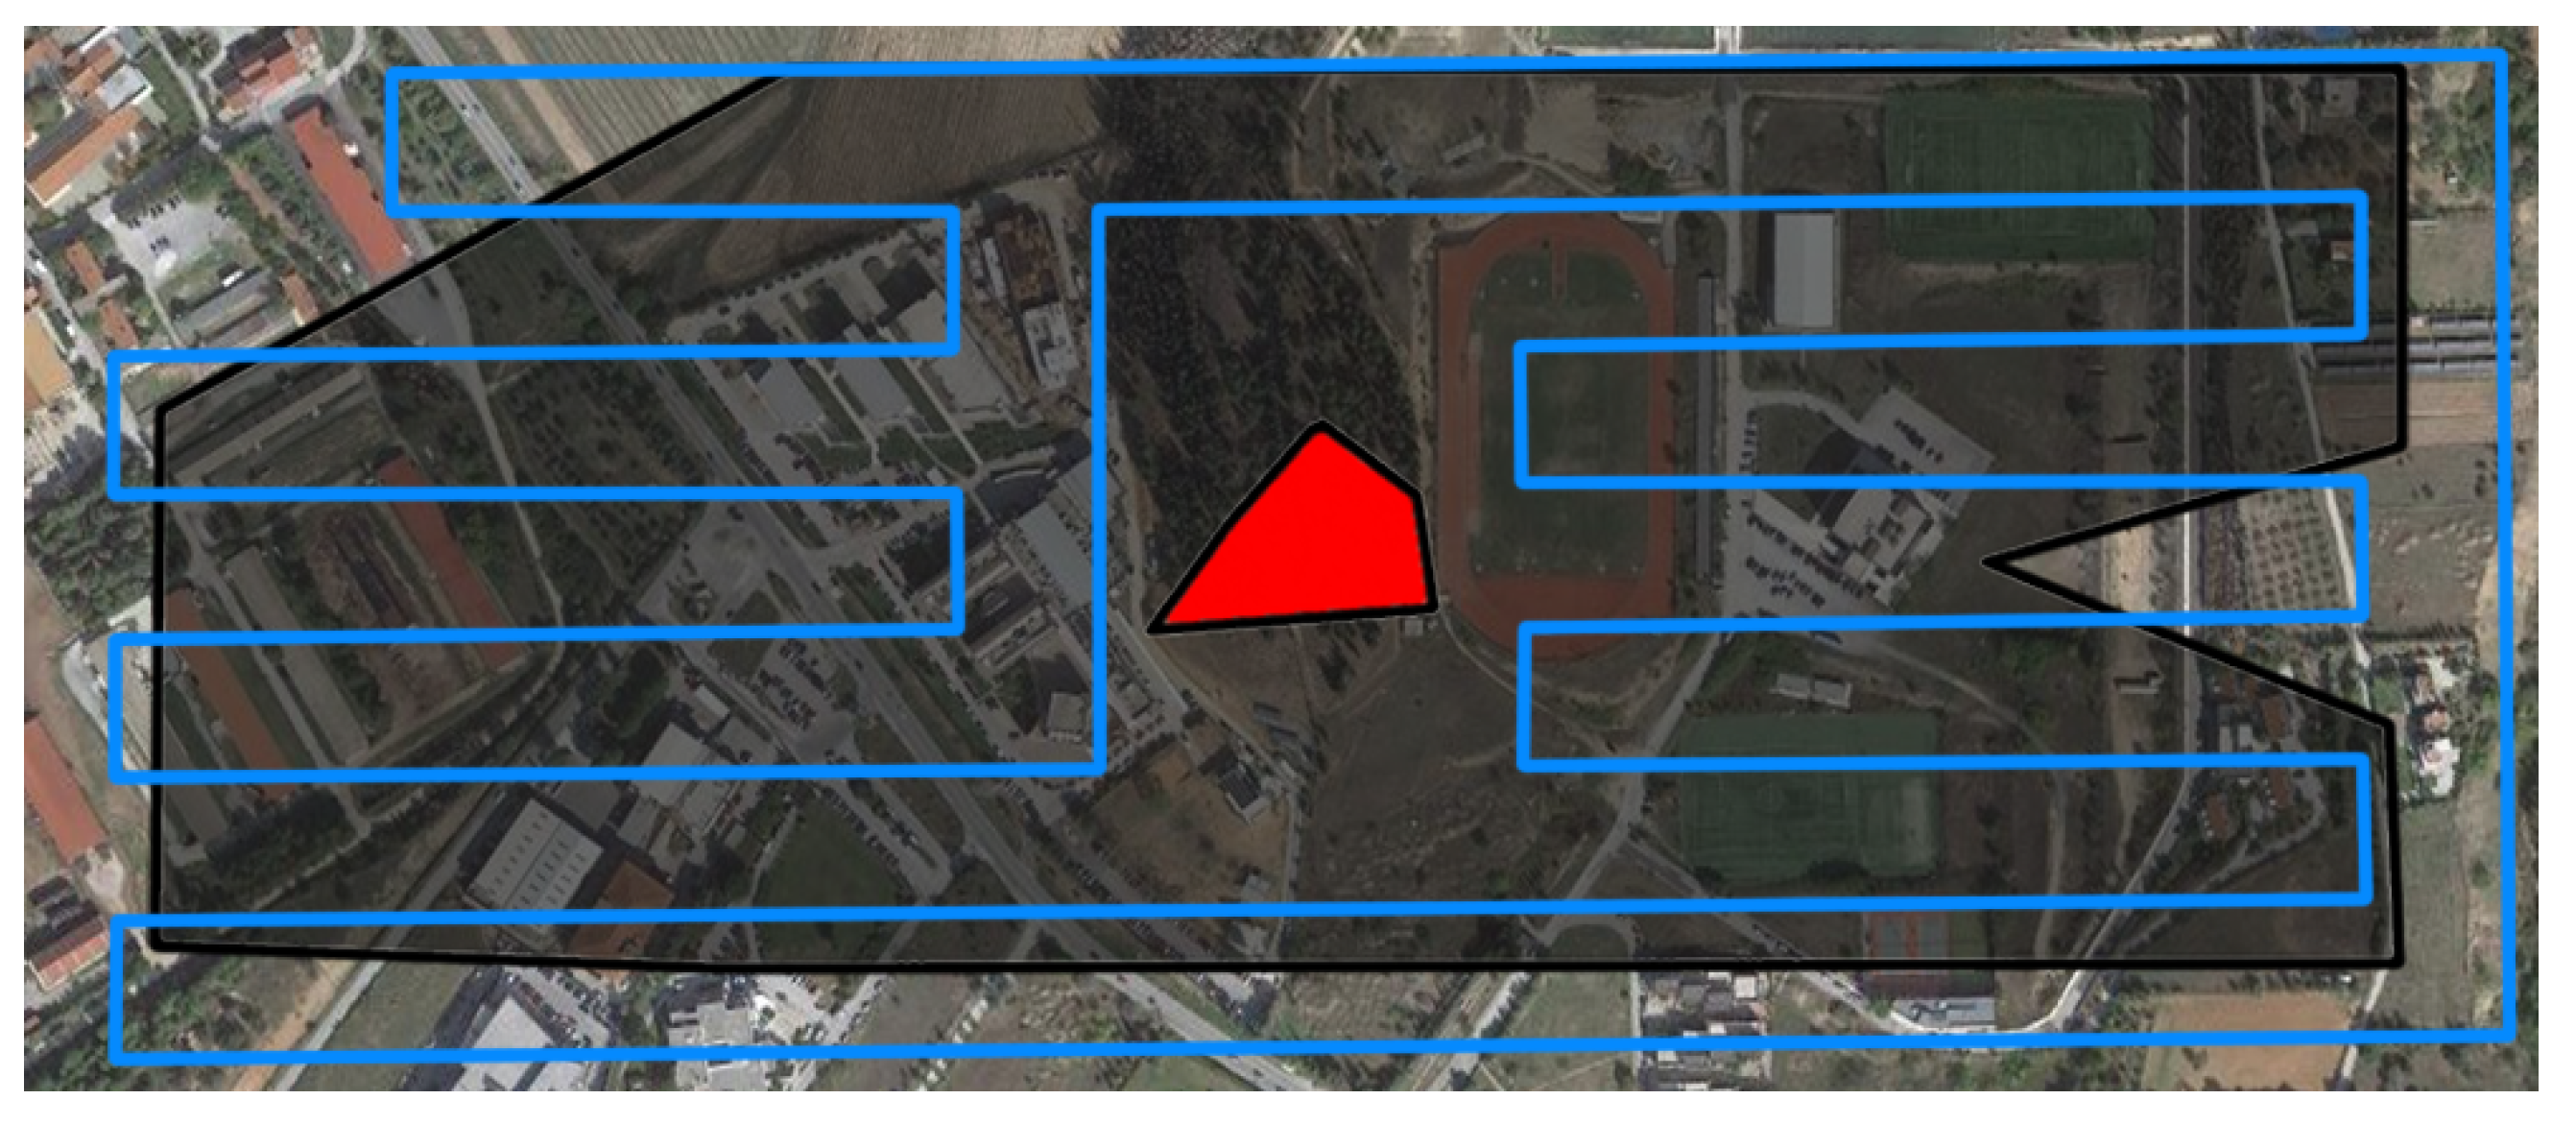
For a better understanding of the modes, a specific ROI (testbed #1) has been carefully selected to demonstrate the way that each mode handles such cases, as it highlights the disadvantages of the original implementation presented in [24] and emphasizes the impact that the methodology used for representing a ROI on the grid can have to the output trajectory. In this example, given (i) the non-convex ROI and an NGZ that both have sharp edges and (ii) the defined d s , the check of whether all four centers of the sub-cells are placed inside the ROI, used by [24], is not sufficient to prevent the generation of a trajectory that does not cross the boundaries of the ROI and NGZ as shown in Figure 8.

3.2.1. Geo-Fenced Coverage Mode (GCM)

The objective of GCM is to provide coverage paths that are strictly geo-fenced in the ROI, never enter NGZs, do not violate the STC principles and given these restrictions provide the maximum coverage possible for the given ROI. An example of the coverage path generated by GCM, in testbed #1, is shown in Figure 9. To implement this mode, the methods described in Section 3.1.1-(2) and Section 3.1.2-(2) are used for the representation of the ROI on grid. As a next step, STC is applied without any modifications, but the alteration of the graph’s costs during step 3 (if any intersections were detected), ensures that the coverage path will be generated in a way that will never intersect the ROI or the NGZs. GCM provides an implementation that fulfills the objectives advertised in [24]; however, they are fulfilled for any possible shape or ROI, no matter how complex it is or how sharp edges it may have. This coverage mode is ideal for missions where the operation in a strictly geo-fenced environment is desired, and the vehicles utilized cannot perform sharp turns. The generated path has reduced the length and number of turns, making it efficient from a time and energy perspective.

3.2.2. Better Coverage Mode (BCM)

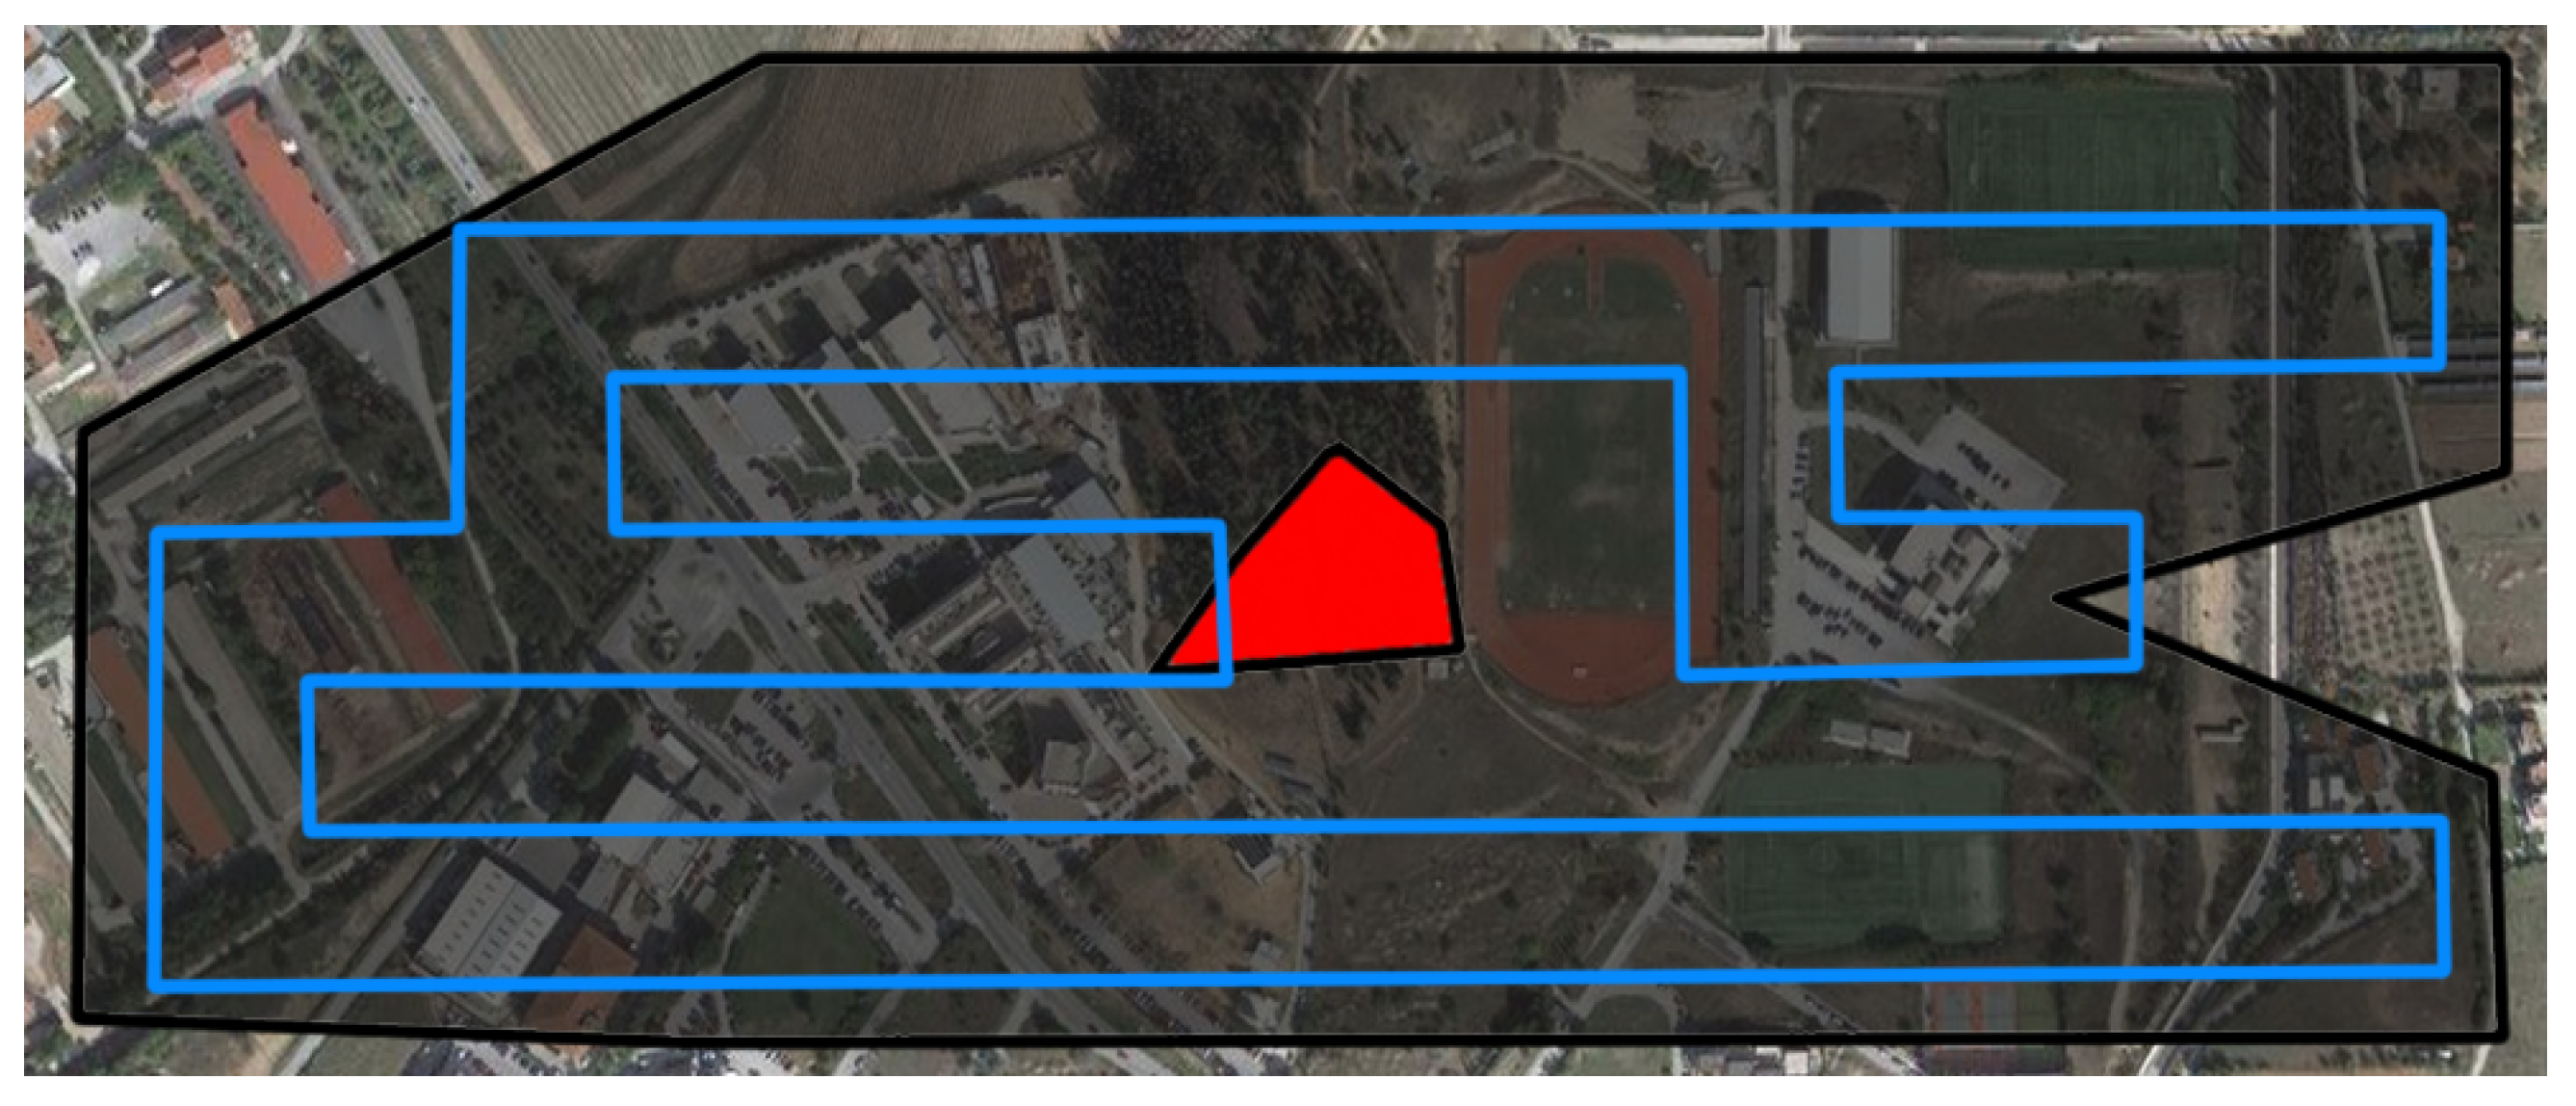
BCM still does not violate the STC principles and guarantees no intersections of the generated path with the NGZs, however, in order to provide better coverage for the marginal areas of the ROI, it allows the path to get outside of the boundaries of the region. An example of the coverage path generated by BCM, in testbed #1, is shown in Figure 10. For the implementation of this mode Section 3.1.1-(1) and Section 3.1.2-(2) checks are used during the representation of the ROI on the grid, guaranteeing that the generated path will never intersect the NGZs but it will be able to get outside of the ROI, providing this way increased marginal coverage. This mode is ideal for missions where covering the largest amount of area possible is critical, and the utilized vehicles cannot perform sharp turns. While this mode provides increased marginal coverage, to achieve that, it has slightly increased the path’s length and the number of turns, compared to BCM.

3.2.3. Complete Coverage Mode (CCM)

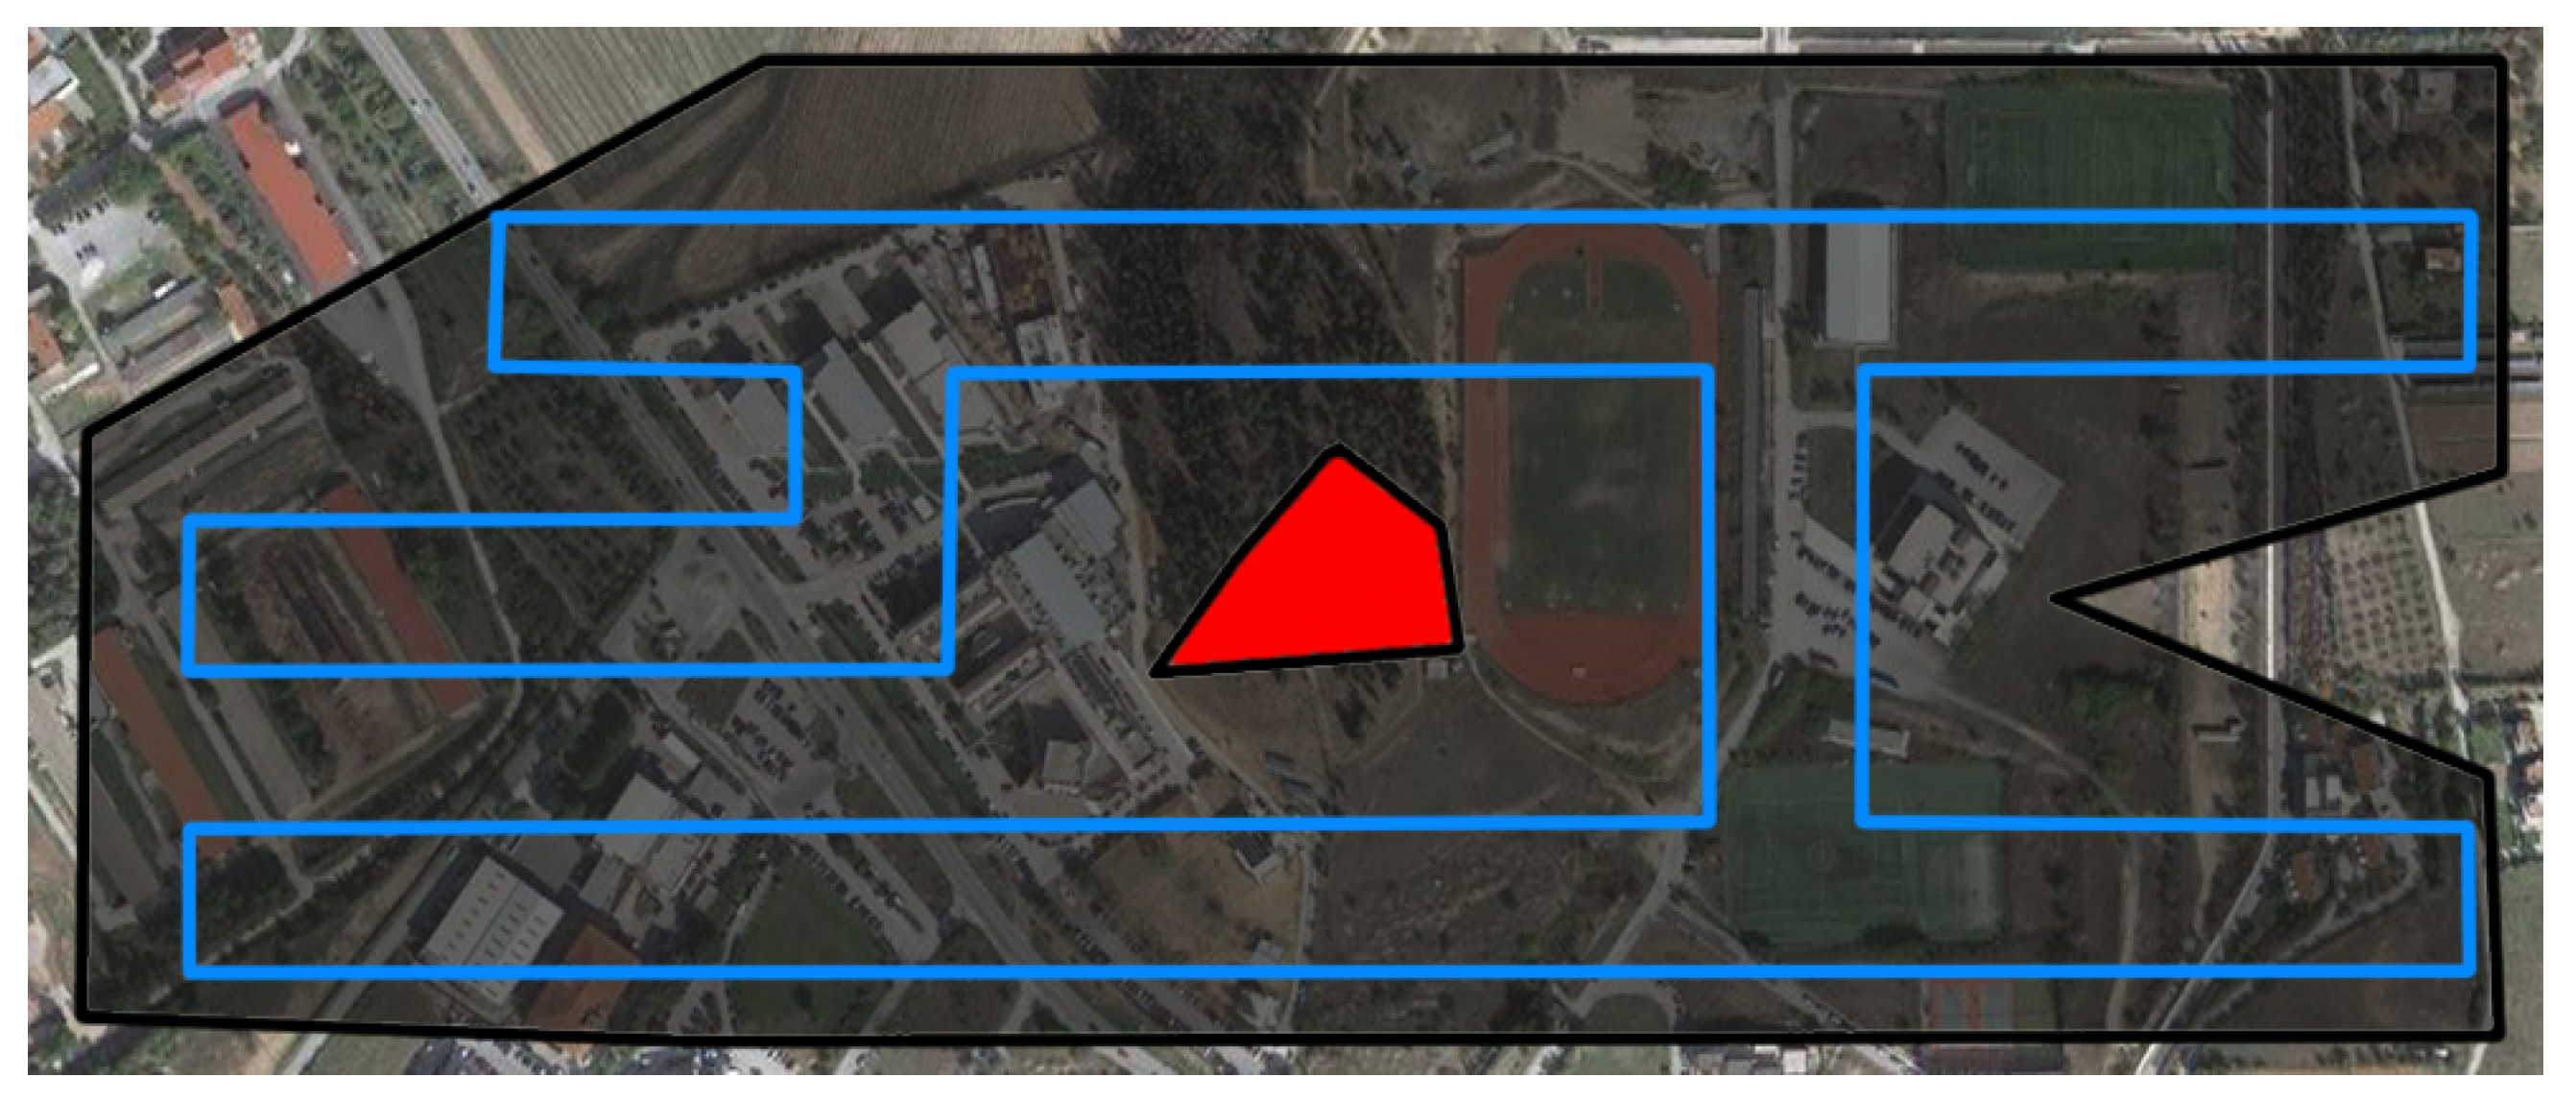
CCM has the main objective of providing complete coverage while being strictly geo-fenced, no matter how complex the ROI may be. An example of the coverage path generated by CCM, in testbed #1, is shown in Figure 11. For the representation of the ROI on the grid in this mode Section 3.1.1-(1) and Section 3.1.2-(1) checks are used. This way, the STC path is generated during the next step both outside of the margins of the region and inside the NGZs. To fix this issue, the next post-processing step is applied. Specifically, the points where the generated trajectory intersects the ROI or an NGZ are detected, and the path placed outside the ROI or inside an NGZ is “cropped” on the boundaries of the respective polygon. This way, it is ensured that the generated path will be strictly geo-fenced. To achieve that, however, several STC principles are violated. Specifically, the generated trajectory does not have a constant d s in the whole ROI, it includes turns that are not 90 and it can have intersecting points and backtracking. This coverage mode is ideal for cases where complete coverage of a ROI in a strictly geo-fenced environment is critical and the vehicle(s) utilized in the mission can handle sharp turns. The trajectories generated by this mode have a significantly increased number of turns compared to the other two, as additional turns are added for every “path cropping”. In addition to that, it has a slightly increased path length. This way, CCM, in order to provide complete coverage, can be slightly less efficient in terms of time and energy.

4. Evaluation

4.1. Evaluation Methodology

To provide a direct comparison with alternative state-of-the-art CPP approaches, the same methodology and benchmark ROIs (https://github.com/savvas-ap/cpp-simulated-evaluations, accessed on 14 June 2023) used in [24] were used for the evaluation study of the newly introduced modes. These 20 ROIs correspond to real-world areas of different shapes and sizes, with some of them containing one or more NGZs. As in [24], for all missions, the paths are calculated with a d s of 40 m and a fixed altitude for the UAV of 40 m. The UAV is considered to be equipped with an RGB sensor with an HFOV of 73.4 ° . This HFOV was selected as a typical specification for commercial UAVs, based on the sensor that one of the most popular commercial UAVs is equipped with (DJI phantom 4 pro: https://www.dji.com/phantom-4-pro/info#specs, accessed on 14 June 2023). The selected mission parameters for this sensor lead to the collection of images with a p s of 25% (at each side of the photo), with their neighbor images.
For the evaluation of the paths, each ROI is divided into separate coverage cells, ranging in area from 0.25 to 4 square meters, depending on the ROI size. After the simulated execution of a proposed plan, the number of scans achieved in each coverage cell is counted. The cells are then grouped into one of the following categories based on this number:
  • 0: Not covered
  • 1: Covered—unique coverage
  • ≥2: Covered—overlapping coverage
Table 3 presents the metrics used for the simulated evaluation procedure. For these metrics, averages are computed out of all 20 benchmark ROIs. In addition to them, for each ROI a heatmap of coverage was generated, visualizing the number of visitations performed at each coverage cell. Finally, out of the average results a radar chart was generated to provide a qualitative presentation of the modes at a glance. For the five non-normalized metrics, each mode is ranked in a scale of [1, 5], where 1 corresponds to the worst value among them (not necessarily the smallest) and 5 to the best one (not necessarily the largest). This chart helps to better understand where each coverage mode outmatches the others and what is sacrificed to achieve that. Out of them, PoC is better when the value is higher, Turns, Length, and Time are better when the value is smaller and PoOC is better when it is closer to the user-defined 50% ( 2 p s ).

4.2. Modes Evaluation

Table 4 presents the average metrics out of the simulated evaluation in the 20 benchmark ROIs, for all modes. From these results, it becomes clear that GCM manages to achieve almost identical scores to [24], while fixing the issue of the generated trajectories crossing the boundaries of the ROIs or the NGZs. As expected, BCM achieves higher PoC than [24] and GCM. To do that, since the paths are allowed to get out of the boundaries of the ROIs, it is rational that the Turns and Length are increased, something that has also impact on the missions’ Time, which is also increased. Finally, the PoOC also presents a small increase, something that is caused by the excessive length of paths in the marginal areas of the ROI. Regarding CCM, it manages to fulfill its main objective, i.e., to provide complete coverage for any type of ROI, no matter how complex-shaped it is. Due to the cropping of paths and the violation of the constant d s , the PoOC and the Turns are significantly increased compared to the other coverage modes. The overall paths’ Length and operational Time is increased compared to [24] and GCM, something that was expected due to the rationale of the methodology, however, it is smaller than the one for BCM. This happens mostly because of the larger areas’ ROIs, where the cropping and the increased complexity of paths met in CCM have a smaller impact on Length and Time than the excessive paths’ length generated in BCM, that gets outside of the boundaries of the ROI.
From the average evaluation’s results, the radar chart is generated (Figure 12), which qualitatively presents the features of each coverage mode. At a glance, one can see that [24] and GCM have almost identical features and outmatch the other two modes in terms of resources’ efficiency, but they fall short in the achieved coverage (which, however, even for them is higher than 95.5%). On the other hand, CCM and BCM are significantly improved in terms of achieved coverage, however, to achieve that they have to sacrifice part of the resource-efficiency features.
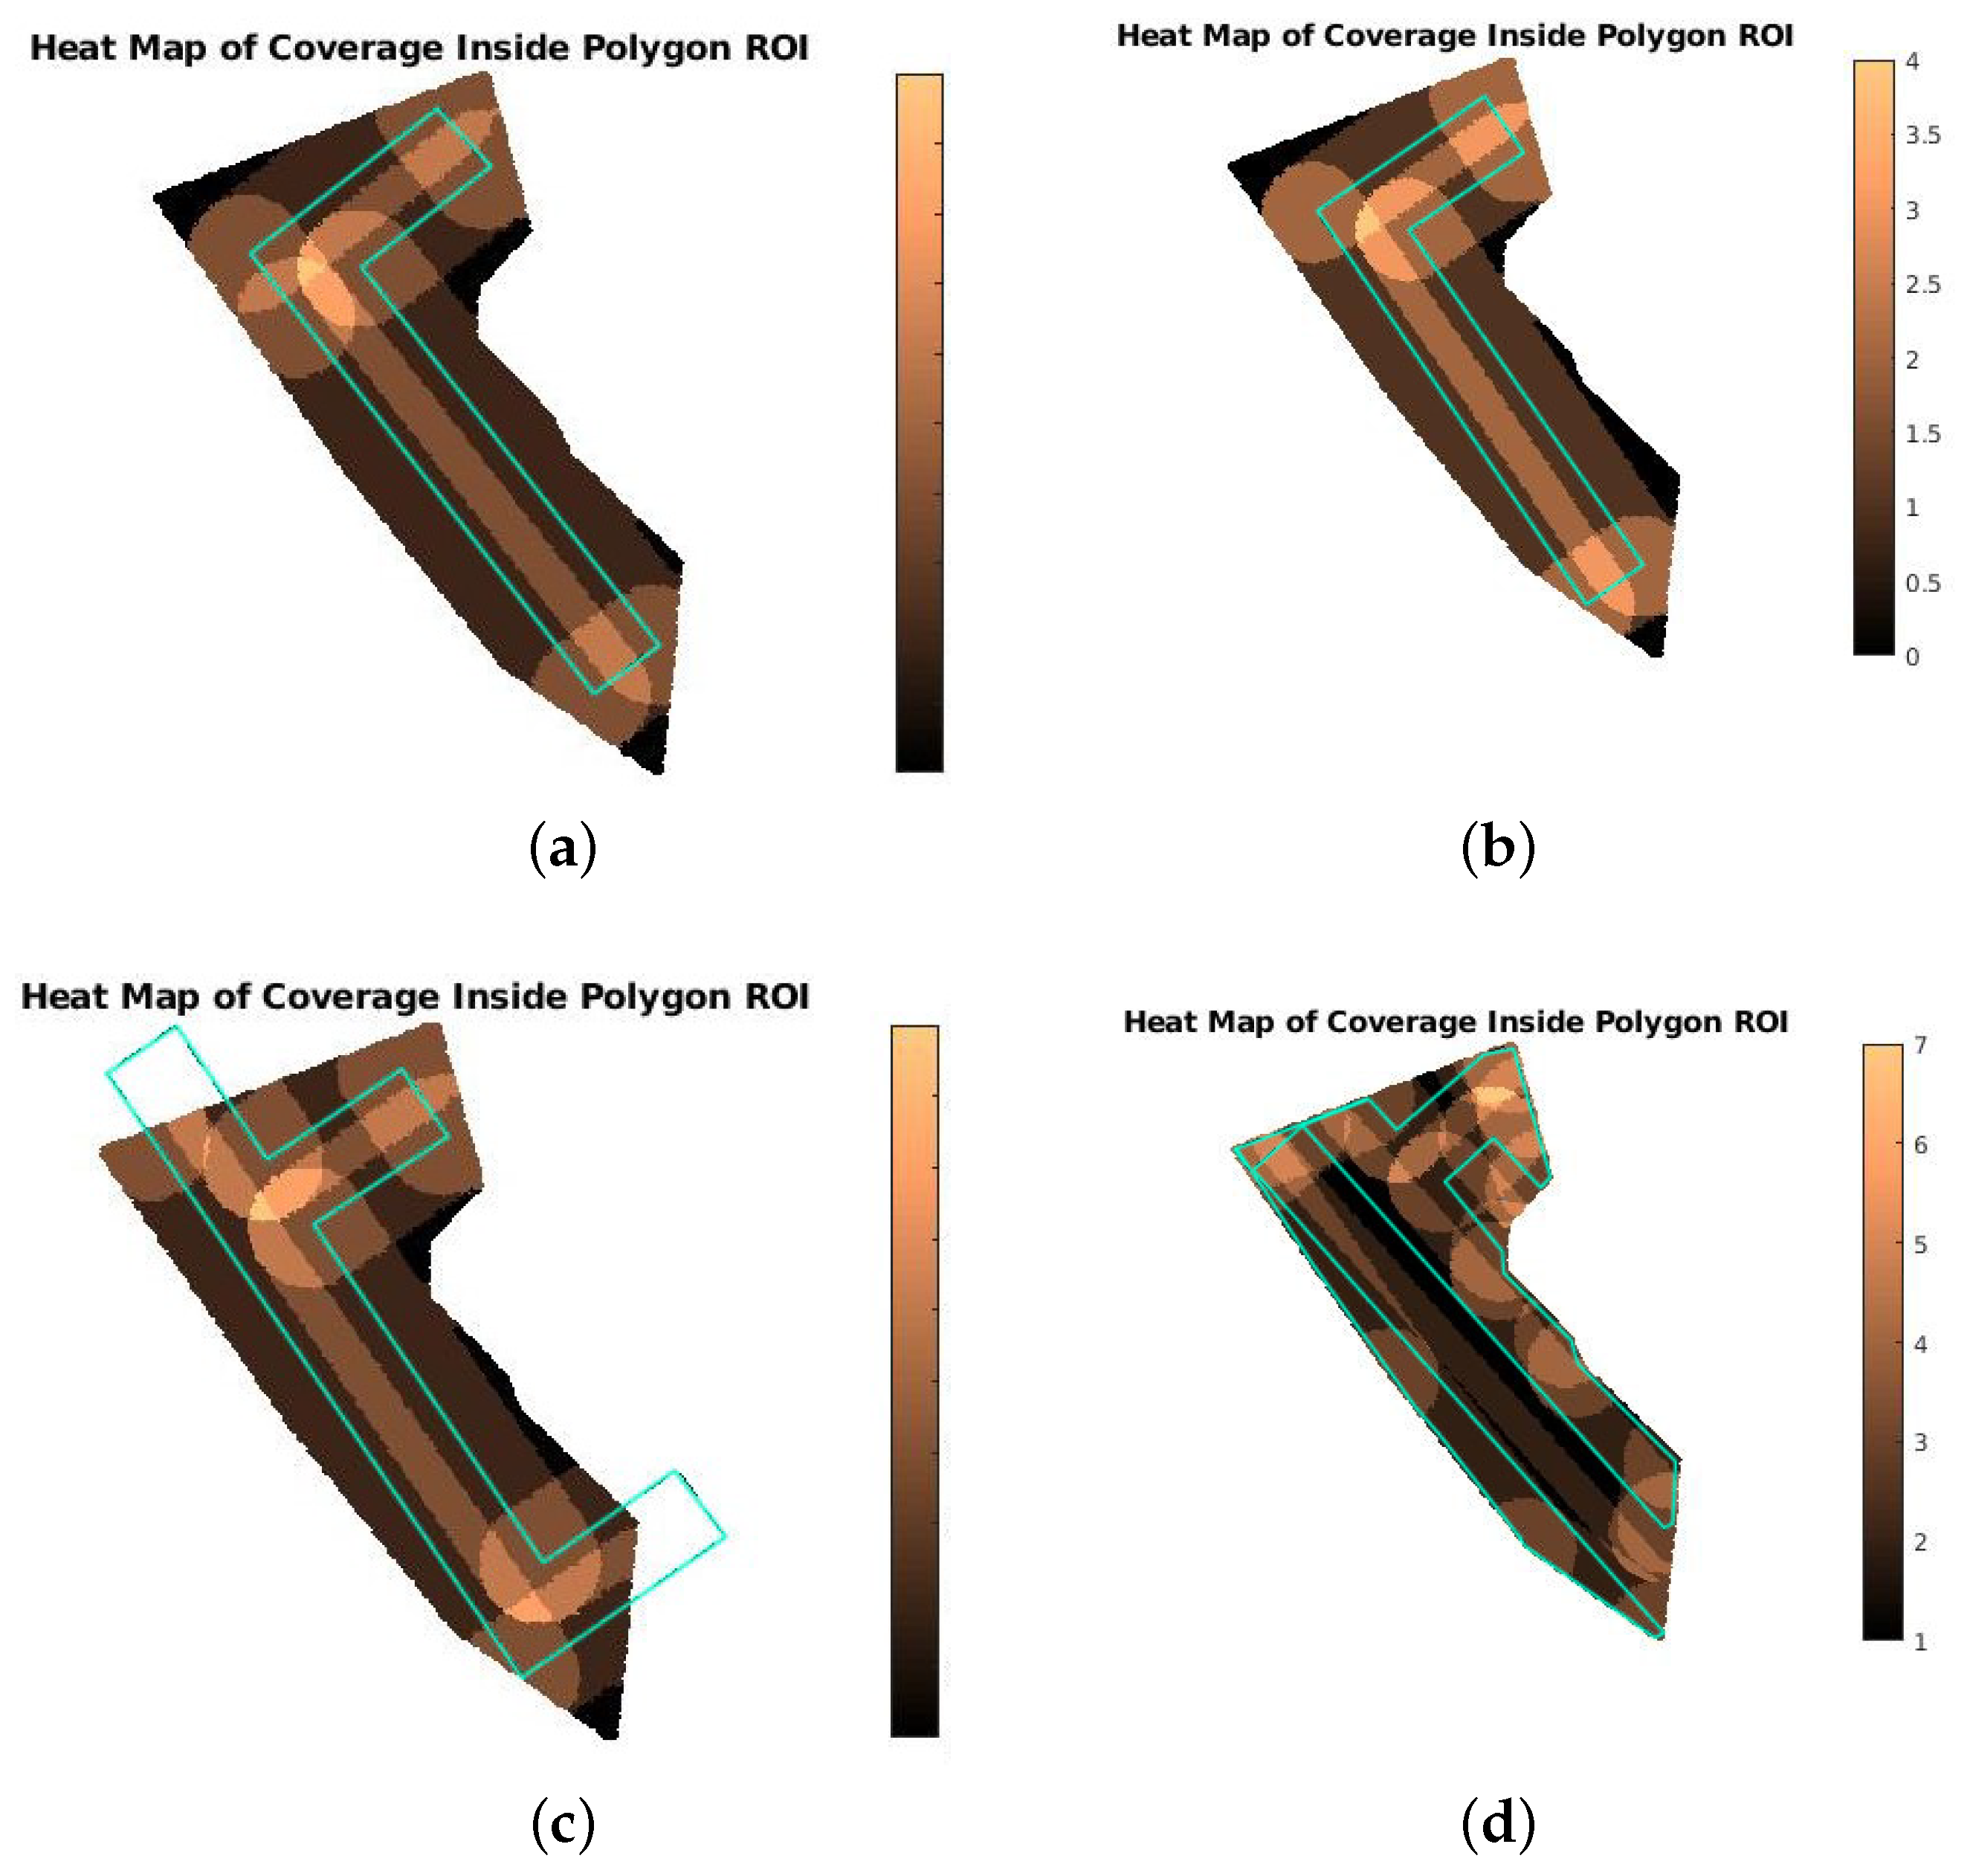
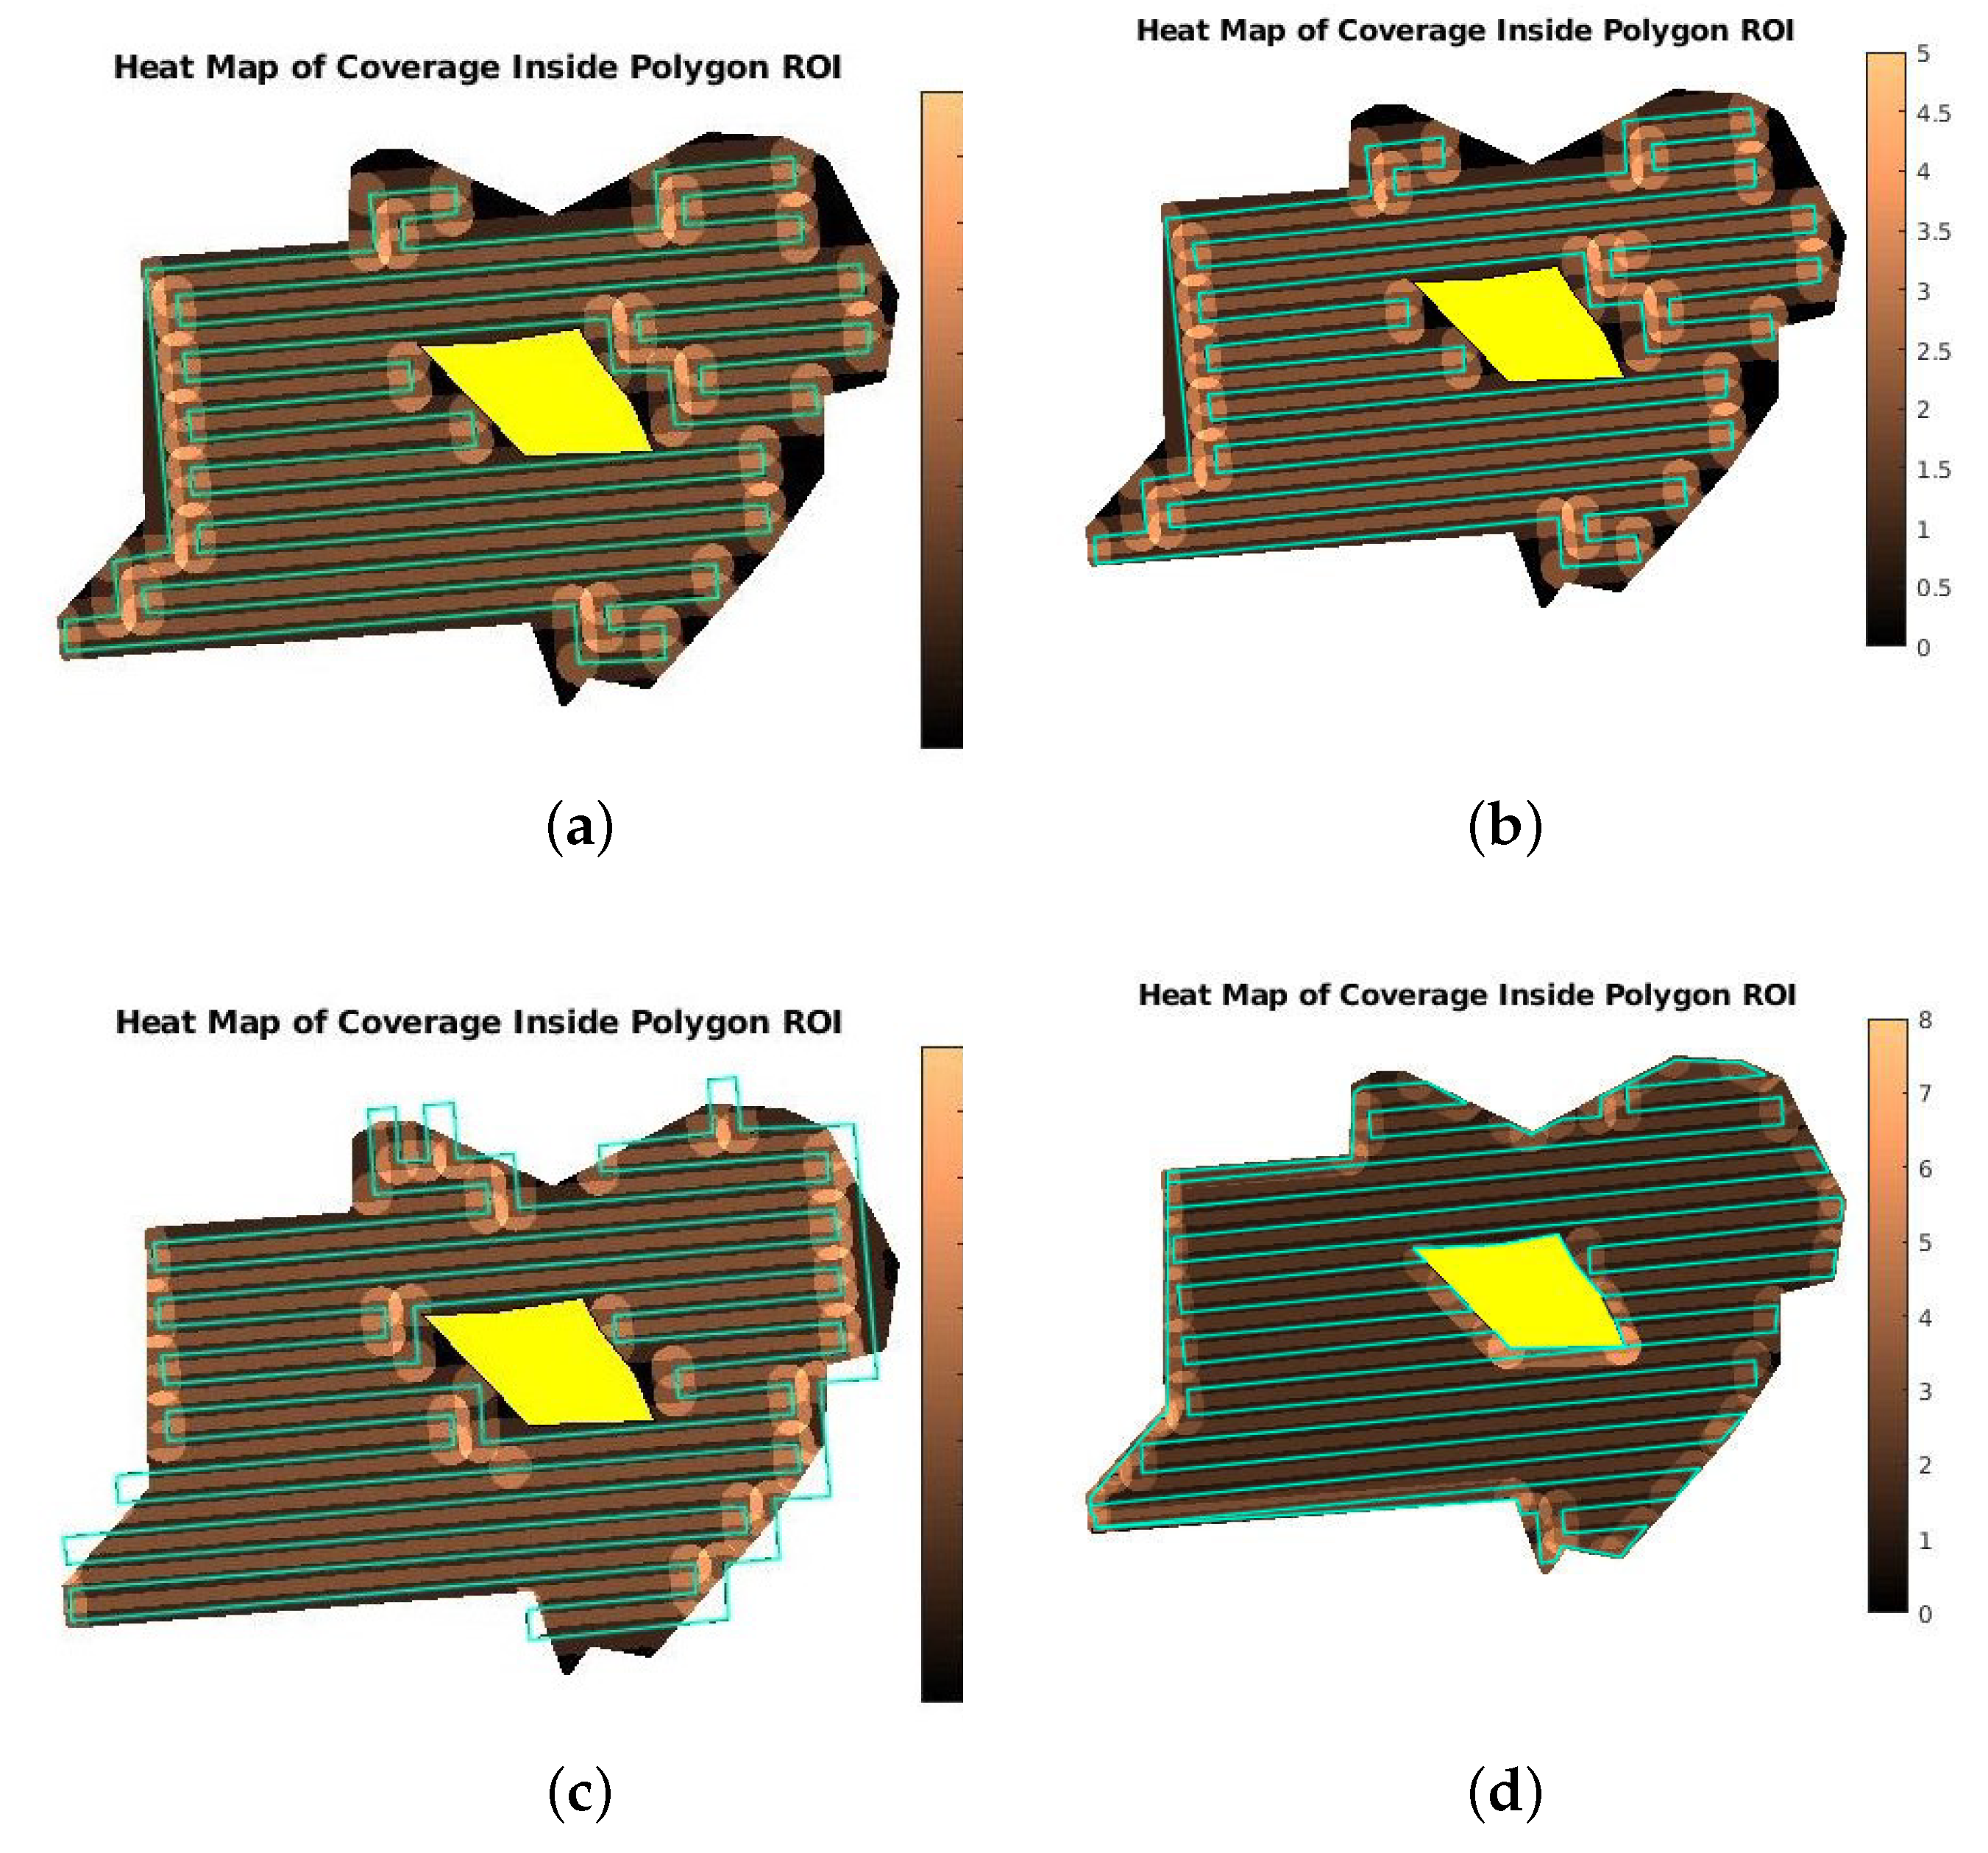
Table 5 and Figure 13 present the evaluation results in testbed #2 and Table 6 and Figure 14 the results in testbed #3. For these ROIs all conclusions discussed above for the average metrics of the overall evaluation are valid, except for the last one, i.e., the one regarding the Length and Time comparison between BCM and GCM. In both examples, the area of the ROI and specifically the perimeter of the boundaries is small enough, so the excessive paths’ length generated in BCM has a smaller impact than CCM’s path complexity on these two metrics. It can be seen though, that for testbed #3, which is a lot larger than testbed #2, the gap between these metrics for CCM and BCM is smaller than the one met in testbed #2. As the area and perimeter of a ROI get larger, CCM takes the lead and achieves a smaller path’s length than BCM. Figure 13 and Figure 14 present the heatmaps of coverage for the two benchmark ROIs and are very indicative examples of how each mode handles such cases to achieve the targeted results and objectives.

5. Conclusions and Future Work

This work has presented the development of three novel coverage modes, building upon [24]. The introduction of these new modes intends to show that the common problems faced when applying grid-based methods in real-world conditions can be overcome and lays the path towards a wider application of such methods in real-life applications. The performance and efficiency of the modes are proved via extensive simulated evaluations and a comparison with another state-of-the-art CPP method. The outcome of this work is a CPP method with three ad-hoc coverage modes, each incorporating features that make it more appropriate for specific types of operations, which build upon the state-of-the-art and improve it in certain aspects. This CPP method is appropriate for use with any UAV capable of following a pre-defined route, and ensuring the demanded overlap in the collected data makes it highly efficient for remote sensing operations. In addition to that, the elaborate presentation of the methodology and the ideas used to reach the expected outcome can work as a guide for the application of different grid-based path-planning approaches in real-world problems.
As the next step, we plan to develop a system, utilizing fuzzy systems theory, that will automatically assign the appropriate path planning mode based on the user preferences and the specifics of the application at hand. Ultimately, the path planning system should be capable of changing the path online, based on several parameters such as: (i) current progress, (ii) discovered morphology, (iii) need to speed-up the mission, (iv) focus on specific part of the scanned terrain, etc. We only scratched the surface of the extra optimization that could be achieved on top of a CPP method to further enhance the UAV performance. More specifically, a more application-oriented mode could also be designed to tackle a specific variant of the CPP, e.g., 3D coverage of structures [27], heterogeneous UAVs [28], etc.

Author Contributions

Conceptualization, S.D.A.; Methodology, S.D.A.; Software, G.V.; Validation, G.V.; Investigation, G.V.; Writing—original draft, S.D.A.; Writing—review & editing, A.C.K., S.A.C. and E.B.K.; Supervision, S.D.A., A.C.K., S.A.C. and E.B.K.; Project administration, A.C.K. and E.B.K.; Funding acquisition, E.B.K. All authors have read and agreed to the published version of the manuscript.

Funding

This project has received funding from the European Commission under the European Union’s Horizon 2020 research and innovation programmes under grant agreements no 101021851 (NESTOR), no 101004152 (CALLISTO) and no 101073952 (PERIVALLON).

Data Availability Statement

The data used in this study are not public, but available upon request.

Conflicts of Interest

The authors declare no conflict of interest.

Nomenclature

AbbreviationsMeaning
3DThree Dimensional
BCMBetter Coverage Mode
CCMComplete Coverage Mode
CPPCoverage Path Planning
DARPDivide Areas Algorithm for Optimal Multi-Robot Coverage Path Planning
DFADynamic Floyd Algorithm
GCMGeo-fenced Coverage Mode
GUIGraphical User Interface
mCPPMulti-robot Coverage Path Planning
MSTMinimum Spanning Tree
N/ANot Applicable
N/ENot Evaluated
NEDNorth East Down (Coordinate System)
NGZNo Go Zone
PPSParallel Partitioning along a Side
PSAACOParallel Self-Adaptive Ant Colony Optimization Algorithm
ROIRegion of Interest
STCSpanning Tree Coverage
UAVUnmanned Air Vehicle
VTOLVertical Take-off and Landing
WGS84World Geodetic (Coordinate) System 1984
MetricsMeaning
LengthPath Length
N-LenghtNormalized Path Length
N-TurnsNormalized Number of Turns
PoCPercentage of Coverage
PoOCPercentage of Overlapping Coverage
TimeEstimated execution time
TurnsNumber of Turns/Waypoints
VariablesMeaning
d c Capturing Density
d h Length of land covered by the horizonal side of the sensor
d s Scanning Density
d v Length of land covered by the vertical side of the sensor
hFlying Altitude
H F O V Horizontal Field of View
G S D Ground Sampling Distance
l a t WGS84 latitude
l o n WGS84 longitude
p f Percentage of Frontlap
p s Percentage of Sidelap
r e s h Horizontal Resolution
r e s v Vertical Resolution
V F O V Vertical Field of View

Appendix A. Spanning Tree Coverage (STC)

The STC algorithm [16] is one of the most popular grid-based CPP methods at the moment, as many works have used it as a basis to extend it for specific applications. The key idea of the method is that for the path’s generation a minimum spanning tree (MST) [29] is constructed first and as a next step a trajectory that circumnavigates the MST is created. This way, the output trajectory goes through the whole region, without backtracking (i.e., passing through a certain point more than once) and this “closed-loop” path allows the robot to have as a starting/ending position any point of the grid. Thanks to these features, STC paths in real-world conditions can save time and energy, as the robot does not need to cross the unnecessary distance that does not contribute to the coverage procedure (e.g., to reach the first or return from the last waypoint) and does not cover multiple times the same parts of the ROI for no reason.
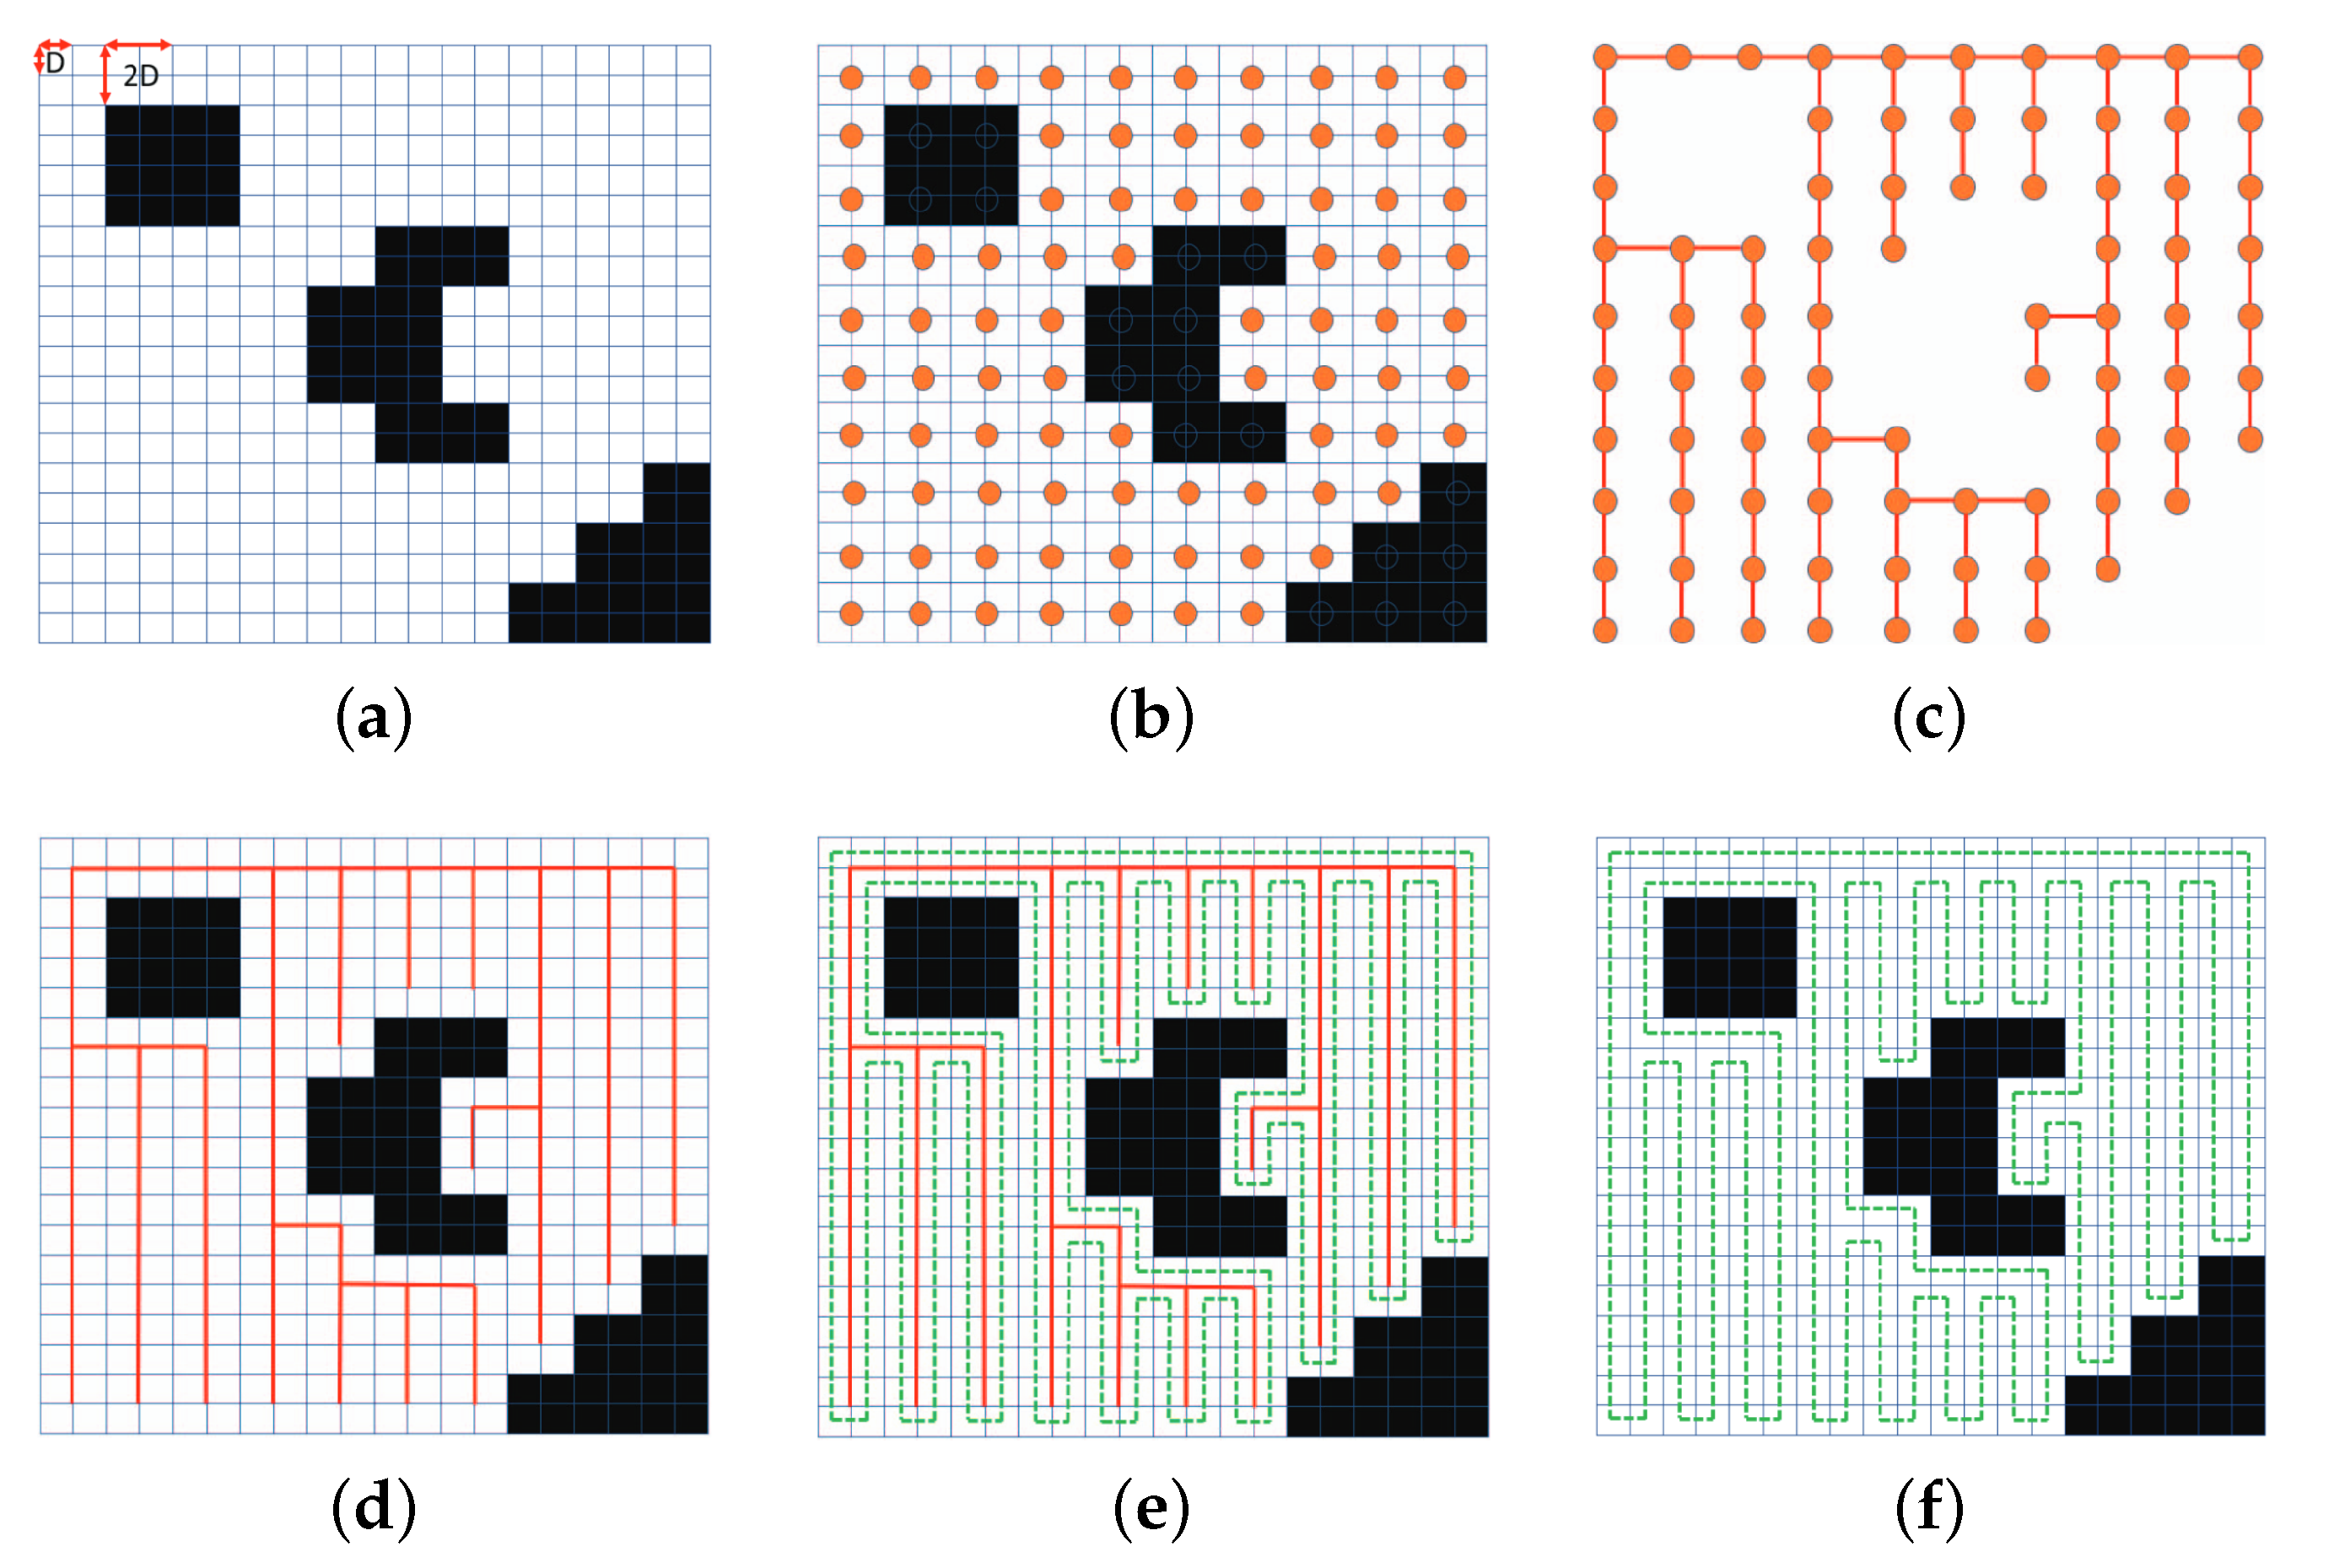
One of the peculiarities of this method is that it uses two different grids, one for the representation of the ROI and the MST generation and one for the trajectory’s generation. Specifically, the first grid has (square) cells with sides of length 2D (Figure A1a), where D corresponds to the d s that the generated trajectories should have (as shown in Figure 1). From now on we will refer to these cells as mega-cells. This grid of mega-cells is used for the representation of the ROI. The nodes that will be used for the MST generation (Figure A1b) are placed in the center of the mega-cells and a standard methodology is applied (e.g., Prim or Kruskal algorithms) to construct the MST (Figure A1c). This MST is then used as a navigation guide for the coverage trajectory. For this reason, each mega-cell is split into four equal (square) sub-cells, with sides of length D. The centers of these sub-cells will be connected to create a line that circumnavigates the MST. This line corresponds to the output coverage trajectory that is used for the scanning of the whole region (Figure A1d–f), and can be followed both clockwise or counter-clockwise.
Figure A1. Spanning Tree Coverage algorithm explained. (a) Area representation on grid. (b) From cells to nodes. (c) MST generation. (d) MST as a navigation guide. (e) Circumnavigating path. (f) Final coverage trajectory.
Drones 07 00399 g0a1
One of the disadvantages of STC method is that while the d s corresponds to D distance, the discretization step for the representation of the ROI on the grid corresponds to 2D distance. This can create larger discretization error compared to other grid-based methods, something that can have a negative impact to the method’s coverage performance in real-world applications. In addition to that, if no measures are taken during the generation of the MST, the output path may have an increased number of turns, something that is not desirable from a time and energy efficiency perspective. However, by controlling the costs for the connection among the nodes in the graph, before the generation of the MST, it is feasible to not only fix this issue, but achieve near-optimal results.

Appendix B. Pseudocode

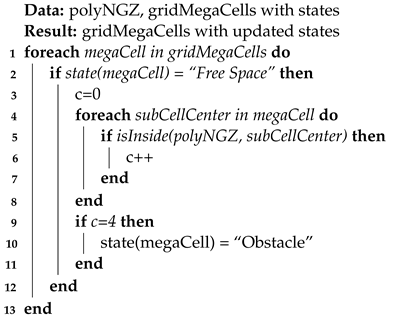
Algorithm A1: A-ROICheck1 (Section 3.1.1-(1))
Drones 07 00399 i001
Algorithm A2: A-ROICheck2 (Section 3.1.1-(2))
Drones 07 00399 i002
Algorithm A3: A-NGZCheck1 (Section 3.1.2-(1))
Drones 07 00399 i003
Algorithm A4: A-NGZCheck2 (Section 3.1.2-(2))
Drones 07 00399 i004
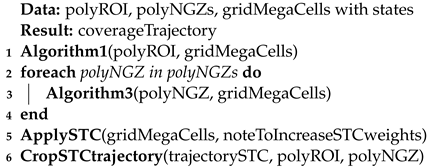
Algorithm A5: A-GCM (Section 3.2.1)
Drones 07 00399 i005
Algorithm A6: A-BCM (Section 3.2.2)
Drones 07 00399 i006
Algorithm A7: A-CCM (Section 3.2.3)
Drones 07 00399 i007

References

  1. Tsouros, D.C.; Bibi, S.; Sarigiannidis, P.G. A review on UAV-based applications for precision agriculture. Information 2019, 10, 349. [Google Scholar] [CrossRef] [Green Version]
  2. Raptis, E.K.; Krestenitis, M.; Egglezos, K.; Kypris, O.; Ioannidis, K.; Doitsidis, L.; Kapoutsis, A.C.; Vrochidis, S.; Kompatsiaris, I.; Kosmatopoulos, E.B. End-to-end Precision Agriculture UAV-Based Functionalities Tailored to Field Characteristics. J. Intell. Robot. Syst. 2023, 107, 23. [Google Scholar] [CrossRef]
  3. Karatzinis, G.D.; Apostolidis, S.D.; Kapoutsis, A.C.; Panagiotopoulou, L.; Boutalis, Y.S.; Kosmatopoulos, E.B. Towards an integrated low-cost agricultural monitoring system with unmanned aircraft system. In Proceedings of the 2020 International Conference on Unmanned Aircraft Systems (ICUAS), Athens, Greece, 1–4 September 2020; pp. 1131–1138. [Google Scholar]
  4. Alotaibi, E.T.; Alqefari, S.S.; Koubaa, A. Lsar: Multi-uav collaboration for search and rescue missions. IEEE Access 2019, 7, 55817–55832. [Google Scholar] [CrossRef]
  5. Zhang, N.; Nex, F.; Vosselman, G.; Kerle, N. Training a Disaster Victim Detection Network for UAV Search and Rescue Using Harmonious Composite Images. Remote Sens. 2022, 14, 2977. [Google Scholar] [CrossRef]
  6. Banić, M.; Miltenović, A.; Pavlović, M.; Ćirić, I. Intelligent machine vision based railway infrastructure inspection and monitoring using UAV. Facta Univ. Ser. Mech. Eng. 2019, 17, 357–364. [Google Scholar] [CrossRef]
  7. Kapoutsis, A.C.; Michailidis, I.T.; Boutalis, Y.; Kosmatopoulos, E.B. Building synergetic consensus for dynamic gas-plume tracking applications using UAV platforms. Comput. Electr. Eng. 2021, 91, 107029. [Google Scholar] [CrossRef]
  8. Koutras, D.I.; Kapoutsis, A.C.; Kosmatopoulos, E.B. Autonomous and cooperative design of the monitor positions for a team of uavs to maximize the quantity and quality of detected objects. IEEE Robot. Autom. Lett. 2020, 5, 4986–4993. [Google Scholar] [CrossRef]
  9. Scherer, J.; Rinner, B. Multi-UAV surveillance with minimum information idleness and latency constraints. IEEE Robot. Autom. Lett. 2020, 5, 4812–4819. [Google Scholar] [CrossRef]
  10. Galceran, E.; Carreras, M. A survey on coverage path planning for robotics. Robot. Auton. Syst. 2013, 61, 1258–1276. [Google Scholar] [CrossRef] [Green Version]
  11. Choset, H.; Pignon, P. Coverage path planning: The boustrophedon cellular decomposition. In Field and Service Robotics; Springer: Berlin/Heidelberg, Germany, 1998; pp. 203–209. [Google Scholar]
  12. Cabreira, T.M.; Brisolara, L.B.; Paulo R, F.J. Survey on coverage path planning with unmanned aerial vehicles. Drones 2019, 3, 4. [Google Scholar] [CrossRef] [Green Version]
  13. Almadhoun, R.; Taha, T.; Seneviratne, L.; Zweiri, Y. A survey on multi-robot coverage path planning for model reconstruction and mapping. SN Appl. Sci. 2019, 1, 847. [Google Scholar] [CrossRef] [Green Version]
  14. Nam, L.; Huang, L.; Li, X.J.; Xu, J. An approach for coverage path planning for UAVs. In Proceedings of the 2016 IEEE 14th International Workshop on Advanced Motion Control (AMC), Auckland, New Zealand, 22–24 April 2016; pp. 411–416. [Google Scholar]
  15. Kapoutsis, A.C.; Chatzichristofis, S.A.; Kosmatopoulos, E.B. DARP: Divide areas algorithm for optimal multi-robot coverage path planning. J. Intell. Robot. Syst. 2017, 86, 663–680. [Google Scholar] [CrossRef] [Green Version]
  16. Gabriely, Y.; Rimon, E. Spanning-tree based coverage of continuous areas by a mobile robot. Ann. Math. Artif. Intell. 2001, 31, 77–98. [Google Scholar] [CrossRef]
  17. Cabreira, T.M.; Ferreira, P.R.; Di Franco, C.; Buttazzo, G.C. Grid-based coverage path planning with minimum energy over irregular-shaped areas with UAVs. In Proceedings of the 2019 International Conference on Unmanned Aircraft Systems (ICUAS), Atlanta, GA, USA, 11–14 June 2019; pp. 758–767. [Google Scholar]
  18. Ghaddar, A.; Merei, A. Energy-aware grid based coverage path planning for UAVs. In Proceedings of the SENSORCOMM, Nice, France, 27–31 October 2019; pp. 34–45. [Google Scholar]
  19. Ghaddar, A.; Merei, A.; Natalizio, E. PPS: Energy-Aware grid-based coverage path planning for UAVs using area partitioning in the presence of NFZs. Sensors 2020, 20, 3742. [Google Scholar] [CrossRef]
  20. Huang, X.; Sun, M.; Zhou, H.; Liu, S. A multi-robot coverage path planning algorithm for the environment with multiple land cover types. IEEE Access 2020, 8, 198101–198117. [Google Scholar] [CrossRef]
  21. Xiao, S.; Tan, X.; Wang, J. A simulated annealing algorithm and grid map-based UAV coverage path planning method for 3D reconstruction. Electronics 2021, 10, 853. [Google Scholar] [CrossRef]
  22. Cho, S.W.; Park, J.H.; Park, H.J.; Kim, S. Multi-uav coverage path planning based on hexagonal grid decomposition in maritime search and rescue. Mathematics 2021, 10, 83. [Google Scholar] [CrossRef]
  23. Gong, Y.; Chen, K.; Niu, T.; Liu, Y. Grid-Based coverage path planning with NFZ avoidance for UAV using parallel self-adaptive ant colony optimization algorithm in cloud IoT. J. Cloud Comput. 2022, 11, 29. [Google Scholar] [CrossRef]
  24. Apostolidis, S.D.; Kapoutsis, P.C.; Kapoutsis, A.C.; Kosmatopoulos, E.B. Cooperative multi-UAV coverage mission planning platform for remote sensing applications. Auton. Robot. 2022, 46, 373–400. [Google Scholar] [CrossRef]
  25. Kakarla, S.C.; Ampatzidis, Y. Types of Unmanned Aerial Vehicles (UAVs), Sensing Technologies, and Software for Agricultural Applications. Available online: https://edis.ifas.ufl.edu (accessed on 3 May 2023).
  26. Cai, G.; Chen, B.M.; Lee, T.H. Coordinate systems and transformations. In Unmanned Rotorcraft Systems; Springer: Berlin/Heidelberg, Germany, 2011; pp. 23–34. [Google Scholar]
  27. Englot, B.; Hover, F. Sampling-based coverage path planning for inspection of complex structures. In Proceedings of the International Conference on Automated Planning and Scheduling, Sao Paulo, Brazil, 25–19 June 2012; Volume 22, pp. 29–37. [Google Scholar]
  28. Chen, J.; Du, C.; Zhang, Y.; Han, P.; Wei, W. A clustering-based coverage path planning method for autonomous heterogeneous UAVs. IEEE Trans. Intell. Transp. Syst. 2021, 23, 25546–25556. [Google Scholar] [CrossRef]
  29. Gower, J.C.; Ross, G.J.S. Minimum Spanning Trees and Single Linkage Cluster Analysis. Appl. Stat. 1969, 18, 54. [Google Scholar] [CrossRef] [Green Version]
Figure 1. Summary of UAVs’ remote sensing operations—parameters explained.
Drones 07 00399 g001
Figure 2. Discretization procedure—representation of the ROI on grid.
Drones 07 00399 g002
Figure 3. Representation of the ROI on two different grids. (a) Representation on a non-transformed grid. (b) Representation on rotated and shifted grid.
Drones 07 00399 g003
Figure 4. Flowchart of the introduced CPP method with three ad-hoc coverage modes. Note: Core Method refers to [24].
Drones 07 00399 g004
Figure 5. Mega-cell and sub-cells—checks performed. (a) Step 1: mega-cell’s and sub-cells’ centers. (b) Step 2: rectangle with sub-cells’ centers vertices. (c) Step 3: cross shaped polygon.
Drones 07 00399 g005
Figure 6. Representation of the ROI on the grid with the sub-nodes checking method.
Drones 07 00399 g006
Figure 7. Representation of the ROI on the grid with the cross-checking method.
Drones 07 00399 g007
Figure 8. Example of coverage paths with [24] in testbed #1.
Drones 07 00399 g008
Figure 9. Example of coverage paths with GCM in testbed #1.
Drones 07 00399 g009
Figure 10. Example of coverage paths with BCM in testbed #1.
Drones 07 00399 g010
Figure 11. Example of coverage paths with CCM in testbed #1.
Drones 07 00399 g011
Figure 12. Modes’ ranking. Note: SotA refers to [24].
Drones 07 00399 g012
Figure 13. Modes evaluation in testbed #2. (a) [24]. (b) GCM. (c) BCM. (d) CCM.
Drones 07 00399 g013
Figure 14. Modes evaluation in testbed #3. (a) [24]. (b) GCM. (c) BCM. (d) CCM.
Drones 07 00399 g014
Table 1. Overview of the related work.
MethodReal-World ROISupport NGZsGeo-Fenced Path(s)Complete Coverage
[14]N/E *
[15]N/AN/A
[17]N/E
[18]N/E **
[19]N/E **
[20]✓ ***N/E
[21]N/E **
[22]N/E
[23]✓ ****N/E **
[24]
* Not explicitly mentioned, but the presented methodology seems to achieve complete coverage. ** Complete coverage is claimed, but no quantitative evaluation is performed to prove it. *** The ROI in this case is a remote sensing image and not a polygon shape over a map. **** The presented NGZ examples conveniently conveniently coincide with entire grid’s cells.
Table 2. Features of the separate coverage modes.
FeaturesGCMBCMCCM
Geo-fenced Trajectories
90 Turns
Non-Overlapping Trajectories
Complete Coverage
Table 3. Evaluation metrics.
ShortMetricUnit
PoCPercentage of Coverage (Scans 1 )%
PoOCPercentage of Overlapping Coverage (Scans 2 )%
TurnsNumber of Turns/Waypoints-
N-TurnsNormalized Number of Turns T u r n s 1000 m 2
LengthPath Lengthkm
N-LengthNormalized Path Length m 1000 m 2
TimeEstimated execution time (3 m/s speed & 1 s delay/turn)min
Table 4. Simulated evaluation average results.
Metrics[24]GCMBCMCCM
PoC95.92%95.79%98.95%99.97%
PoOC51.90%52.23%53.28%59.67%
Turns75.3575.6579.65103.50
N-Turns0.100.100.120.18
Length21,799.9621,799.9533,895.9626,753.30
N-Length23.6923.6639.1730.86
Time122.37122.37189.64150.35
Table 5. Simulated evaluation results—testbed #2.
Metrics[24]GCMBCMCCM
PoC94.19%95.24%97.33%100.00%
PoOC49.68%48.63%50.07%87.30%
Turns881225
N-Turns0.210.210.320.67
Length800.00799.991119.991744.89
N-Length21.4421.4430.0246.77
Time4.584.586.4210.11
Table 6. Simulated evaluation results—testbed #3.
Metrics[24]GCMBCMCCM
PoC95.71%95.85%99.32%99.98%
PoOC53.44%53.51%54.19%60.26%
Turns63647283
N-Turns0.110.110.120.14
Length13,759.9913,759.9816,159.9818,044.70
N-Length23.8723.8728.0331.30
Time77.4977.5190.98101.63
Disclaimer/Publisher’s Note: The statements, opinions and data contained in all publications are solely those of the individual author(s) and contributor(s) and not of MDPI and/or the editor(s). MDPI and/or the editor(s) disclaim responsibility for any injury to people or property resulting from any ideas, methods, instructions or products referred to in the content.