1. Introduction
The determination of vegetation surface energy exchange is an important component in most studies aiming to understand how ecosystems interact with the atmosphere and the climate system [
1]. The convective energy fluxes are typically measured using eddy covariance, ground heat fluxes are measured using flux plates or a combination of temperature and moisture sensors, canopy storage is measured using temperature sensors and radiation fluxes are measured using short- and longwave sensors, e.g., [
2]. Ideally, the sum of the convective energy fluxes, the ground heat flux and the canopy heat storage should equal the net radiation flux on top of the canopy so-called energy balance closure, but this situation is rarely met, and most flux sites underestimate the energy balance, e.g., [
3]. The problem of the lack of energy balance closure at flux sites has been discussed for a long time, pointing mainly at the errors in the eddy covariance measurements [
4] as well as in the net radiation measurements [
5].
Foken [
6] made a thorough review of the energy balance closure problem and he hypothesized that it was most likely related to large scale eddies that were not captured in the eddy covariance measurements, and that the problem could only be solved at the landscape level. In a later follow-up review of the problem, Mauder et al. [
7] ruled out instrumental errors as the cause and came to the same conclusion as Foken [
6] did, namely, that it is mesoscale transport issues that are responsible for the non-closure. However, Mauder et al. [
7] never discussed the potential error in the net radiation measurements caused by spatial variability. The radiation components in flux studies are typically measured at one point in space with the instruments mounted on the same tower as the eddy covariance instruments. However homogeneous a flux site may be, the location of the tower is always disturbed to some degree, and this might bias the especially outgoing radiation fluxes and thus, also the net radiation.
The largest variation of outgoing short- and longwave radiation can probably be expected in sparsely vegetated ecosystems with a low fractional canopy cover where upwelling radiation from the soil can penetrate the atmosphere above the ecosystem. However, dense tree canopies consisting of species mixtures, especially mixtures of conifers and deciduous trees, can presumably also show a large variation in reflectance properties. An example of the former case was shown by Anthoni et al. [
8], which analyzed the variation in the net radiation in a juniper–sagebrush ecosystem. They measured the shortwave reflectance and the surface temperature of the soil at different locations within the footprint of a flux tower and used geometrical models of the canopy to estimate how much of the upwelling short- and longwave radiation would reach the net radiometers placed at random locations above the canopy. They found a spatial variability in the longwave upwelling radiation of 20 Wm
−2, and 10 Wm
−2 in the shortwave radiation. They concluded that such a variation was too small to explain the lack of energy balance closure which was in the order of 200–250 Wm
−2 in their flux measurements.
From a practical perspective, the vegetation height is a strong constraint on the kind of method that can be used to measure the spatial variation of the radiation above ecosystems. Although the trees in the juniper–sagebrush study by Anthoni et al. [
8] had a relatively modest height of about 7 m, they chose to make ground-based measurements which required quite complex geometric calculations to obtain the surface values of the upper canopy. Droppo and Hamilton [
9] measured the vertical profiles of the net radiation within and above an 18 m high mixed deciduous stand, which they characterized as “relatively uniform” using three towers located in a triangular pattern about 15 m apart. They found a variation in the net radiation above the canopy in the order of 10–13% over midday which corresponds to 40–50 Wm
−2 during clear sky conditions. Federer [
10] measured the net radiation above a mixed deciduous (hardwood) canopy using six towers about 15 m apart and he found a range of about 20 Wm
−2 during clear sky conditions, but on some occasions, the range could be up to 50 Wm
−2.
Remote sensing methods have also been used, but mainly for analyses at larger scales; Fausto et al. [
11] used Landsat TM5 (30 m resolution) to analyze the spatial variation of the net radiation in a heterogeneous savanna landscape in Paraguay, Bisht et al. [
12] used Terra-Modis (km resolution) for analyses of the Southern Great Plains in the US and Wang et al. [
13] also used Terra-Modis to estimate and compare the net radiation with the ground measurements of the Surface Radiation Budget Network [
14]. Neither of these methods have sufficient resolution to assess the spatial variation of the net radiation with the footprints of eddy covariance flux sites.
A new era of detailed reflectance measurements at patch, ecosystem or even landscape scale has emerged with the rapid development of unmanned aerial vehicles (UAVs), carrying cameras for imagine analyses, e.g., [
15,
16] or radiation sensors for the direct measurement of reflectance, e.g., [
17]. In the latter case, the incoming radiation had to be measured at some reference location near the flight path in order to obtain the albedo. Most studies use helicopter types of UAVs because of the time response of the sensors which might require that the measurements are recorded during hovering. More recently, fixed-wing UAV systems for complete eddy covariance measurements also including radiation balance have been developed [
18].
The aim of this study is to develop a UAV surface radiation balance system that can be used to independently measure georeferenced incoming and outgoing shortwave radiation, net radiation and surface temperature for the spatial analyses of different ecosystems. Commercial radiation sensors and an infrared thermometer were mounted on a quadcopter equipped with a specially built data logger. The radiation sensors were compared to a reference four-component radiometer while attached to the same fixed mast, then also compared to the same reference when attached to the UAV under hovering conditions. Finally, an application study was performed at a five-year-old forest plantation where eddy covariance flux measurements are performed.
2. Material and Methods
2.1. Instrumentation and Measurements
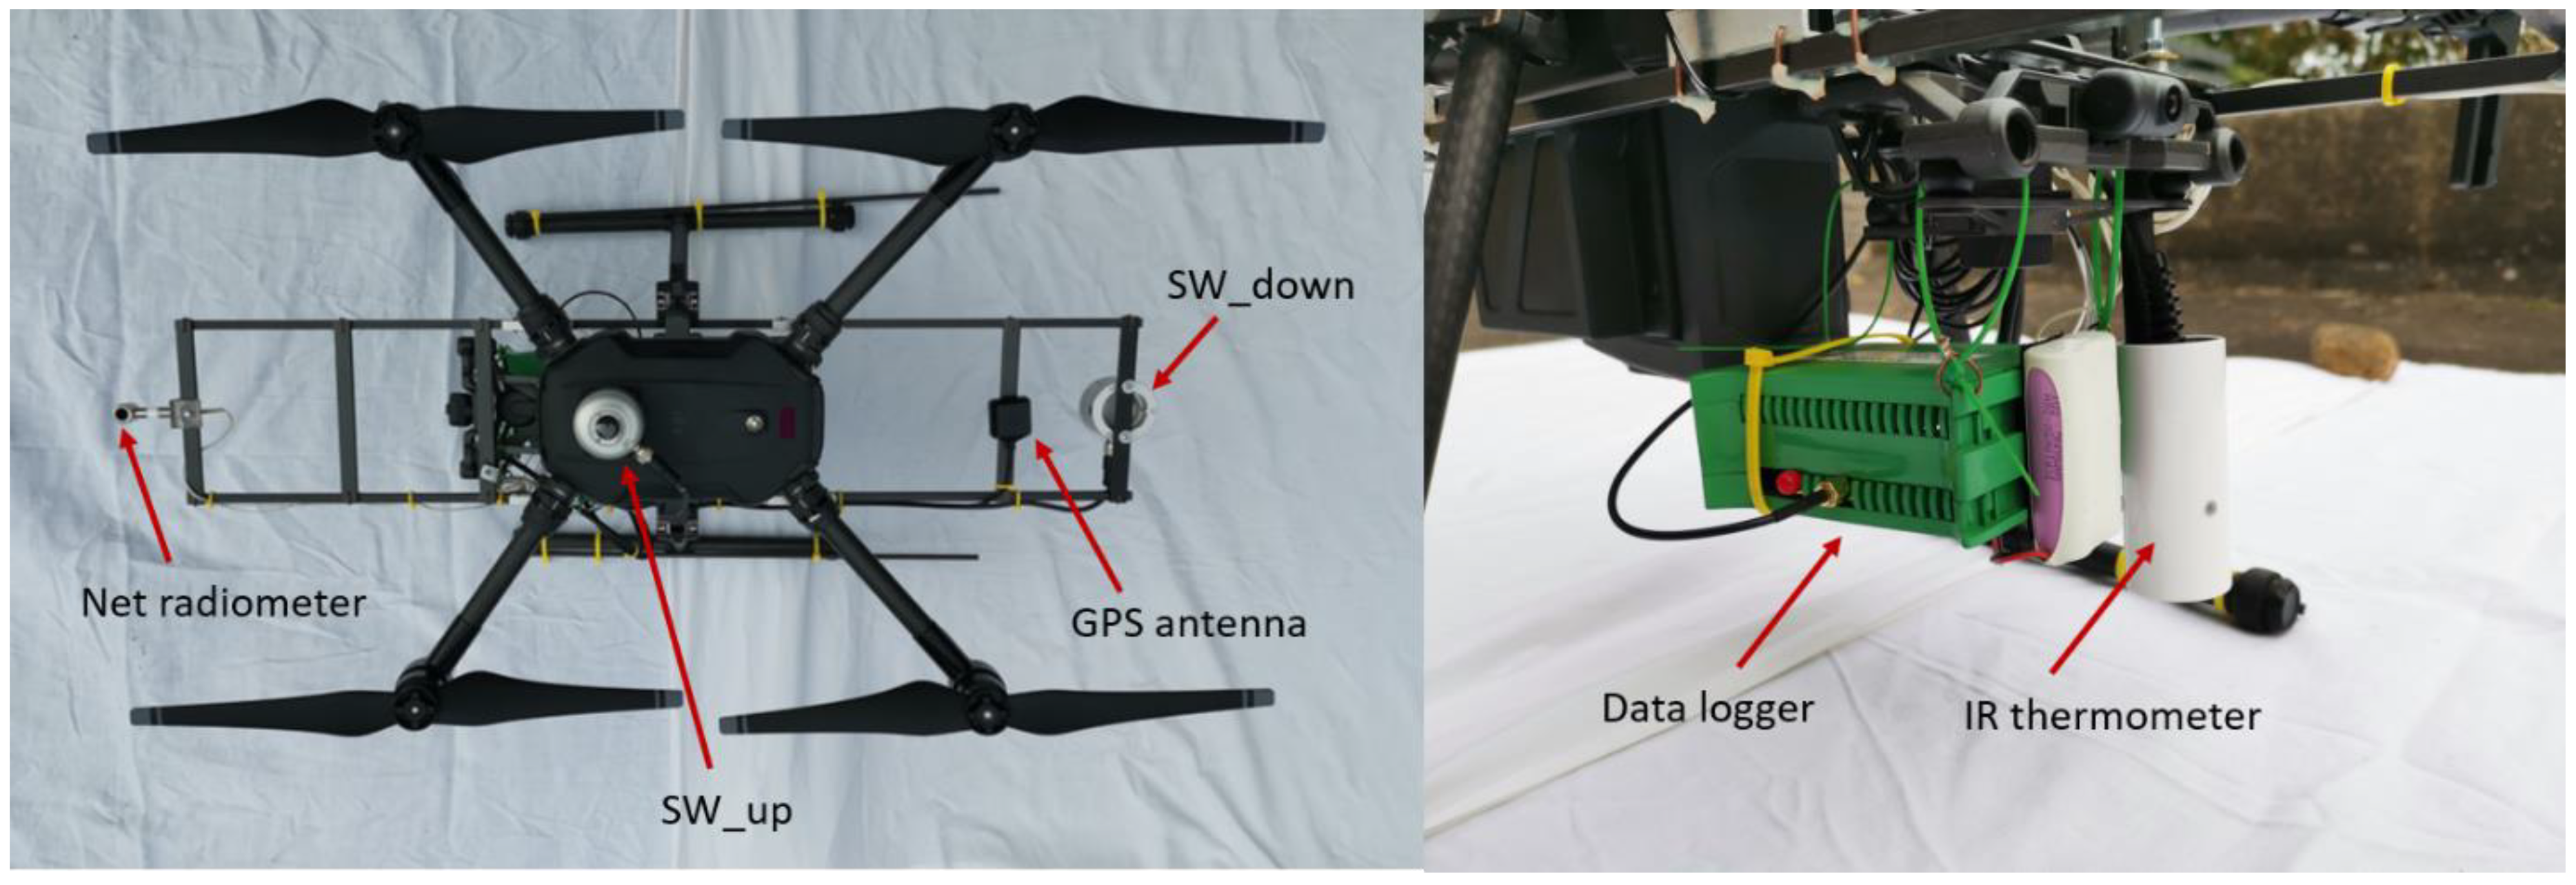
The UAV used in this study is a quadcopter Matrice 200 v2 (DJI, Shenzhen, China) that has a maximum payload of 1.45 kg. A specially designed rig was built to hold the downward-looking shortwave radiation sensor, the net radiation sensor, the infrared thermometer and the external GPS antenna of the data logger (see
Figure 1). The upward-looking shortwave radiation sensor was mounted on a flat surface on top of the UAV and the data logger was mounted where the camera was normally located (
Figure 1). The sensor specifications are presented in
Table 1. The net radiometer designed by J.M. Reemann, Tartu, Estonia consists of a small cylinder 19 mm in diameter and 19 mm in length, supported with a 50 mm horizontal arm. The radiation receiving upper and lower surfaces consists of black-coated cavities shaped to give correct cosine response. The cavities do not have any protection against wind or rain.
The downward-looking shortwave sensor and the net radiometer were carefully adjusted to be located in the same plane as the upward-looking shortwave sensor. Then, the UAV was calibrated for center of gravity, and after calibration and during hovering, it was visually checked that the upward-looking shortwave sensor was in a horizontal position. Since no inclinometer was available, we had to assume that all sensors were in a horizontal position during hovering. This assumption was tested by orienting the UAV in different directions during the inter-comparison campaign (see below).
The lightweight data logger was specially built for this purpose (EMS, Brno, Czech Republic). It has two channels reserved for the IR thermometer and four differential channels ± 40 mV. It is powered with a 2.1 Ah Li-Ion battery, and it has a continuous operational period of 30 h. The accuracy of the voltage measurements is ±0.15% of full scale. It has a built-in GPS (GPS + GLONASS) that provides date, time (UTC), latitude and longitude. The accuracy of the positioning system GPS + GLONASS is approx. 2–3 m which we consider sufficient for the type of mapping made here. The sampling interval is 2 s and the data are stored on a 16 GB microSD card. More information about data logger and radiation sensors is found in the
Supplementary Materials.
The comparison between the UAV sensors and a recently factory-calibrated reference four-component net radiometer, CNR4 (Kipp&Zonen, Delft, The Netherlands), was performed on an open field over a recently cut fallow near Hjärup, Sweden 6–12 August 2022. The shortwave sensors on the UAV were new from factory, and thus, factory-calibrated before use in the field. The CNR4 was logged using a CR1000X (Campbell Scientific, Logan, UT, USA) with a sampling frequency of 1 s and the UAV sensors were recorded with the UAV logger with a sampling frequency of 2 s. The CNR4 was mounted on a tripod crossarm with a height of 2 m above ground together with the UAV radiation rig (
Figure 2).
In the next step, the radiation rig was mounted on the UAV and a number of comparisons were made with the UAV hovering at the same height as the CNR4 and with a 1–2 m horizontal separation (
Figure 3).
After positioning the UAV beside the reference instrument, the measurements were made with the UAV heading south for 1 min, then the UAV was rotated 180° for another measurement period of 1 min. This was repeated 3 times during each measurement occasion, which took place once per hour from 09:00 to 14:00 UTC, resulting in a total of 38 comparisons. During one measurement occasion, the net radiometer was pointing east/west in addition to the south/north directions. This rotation of the UAV in different directions was made to check for the possible impact of deviations from the horizontal plane on the radiation measurements. The wind speed ranged between 3.4 and 5.2 m s−1 during these measurements.
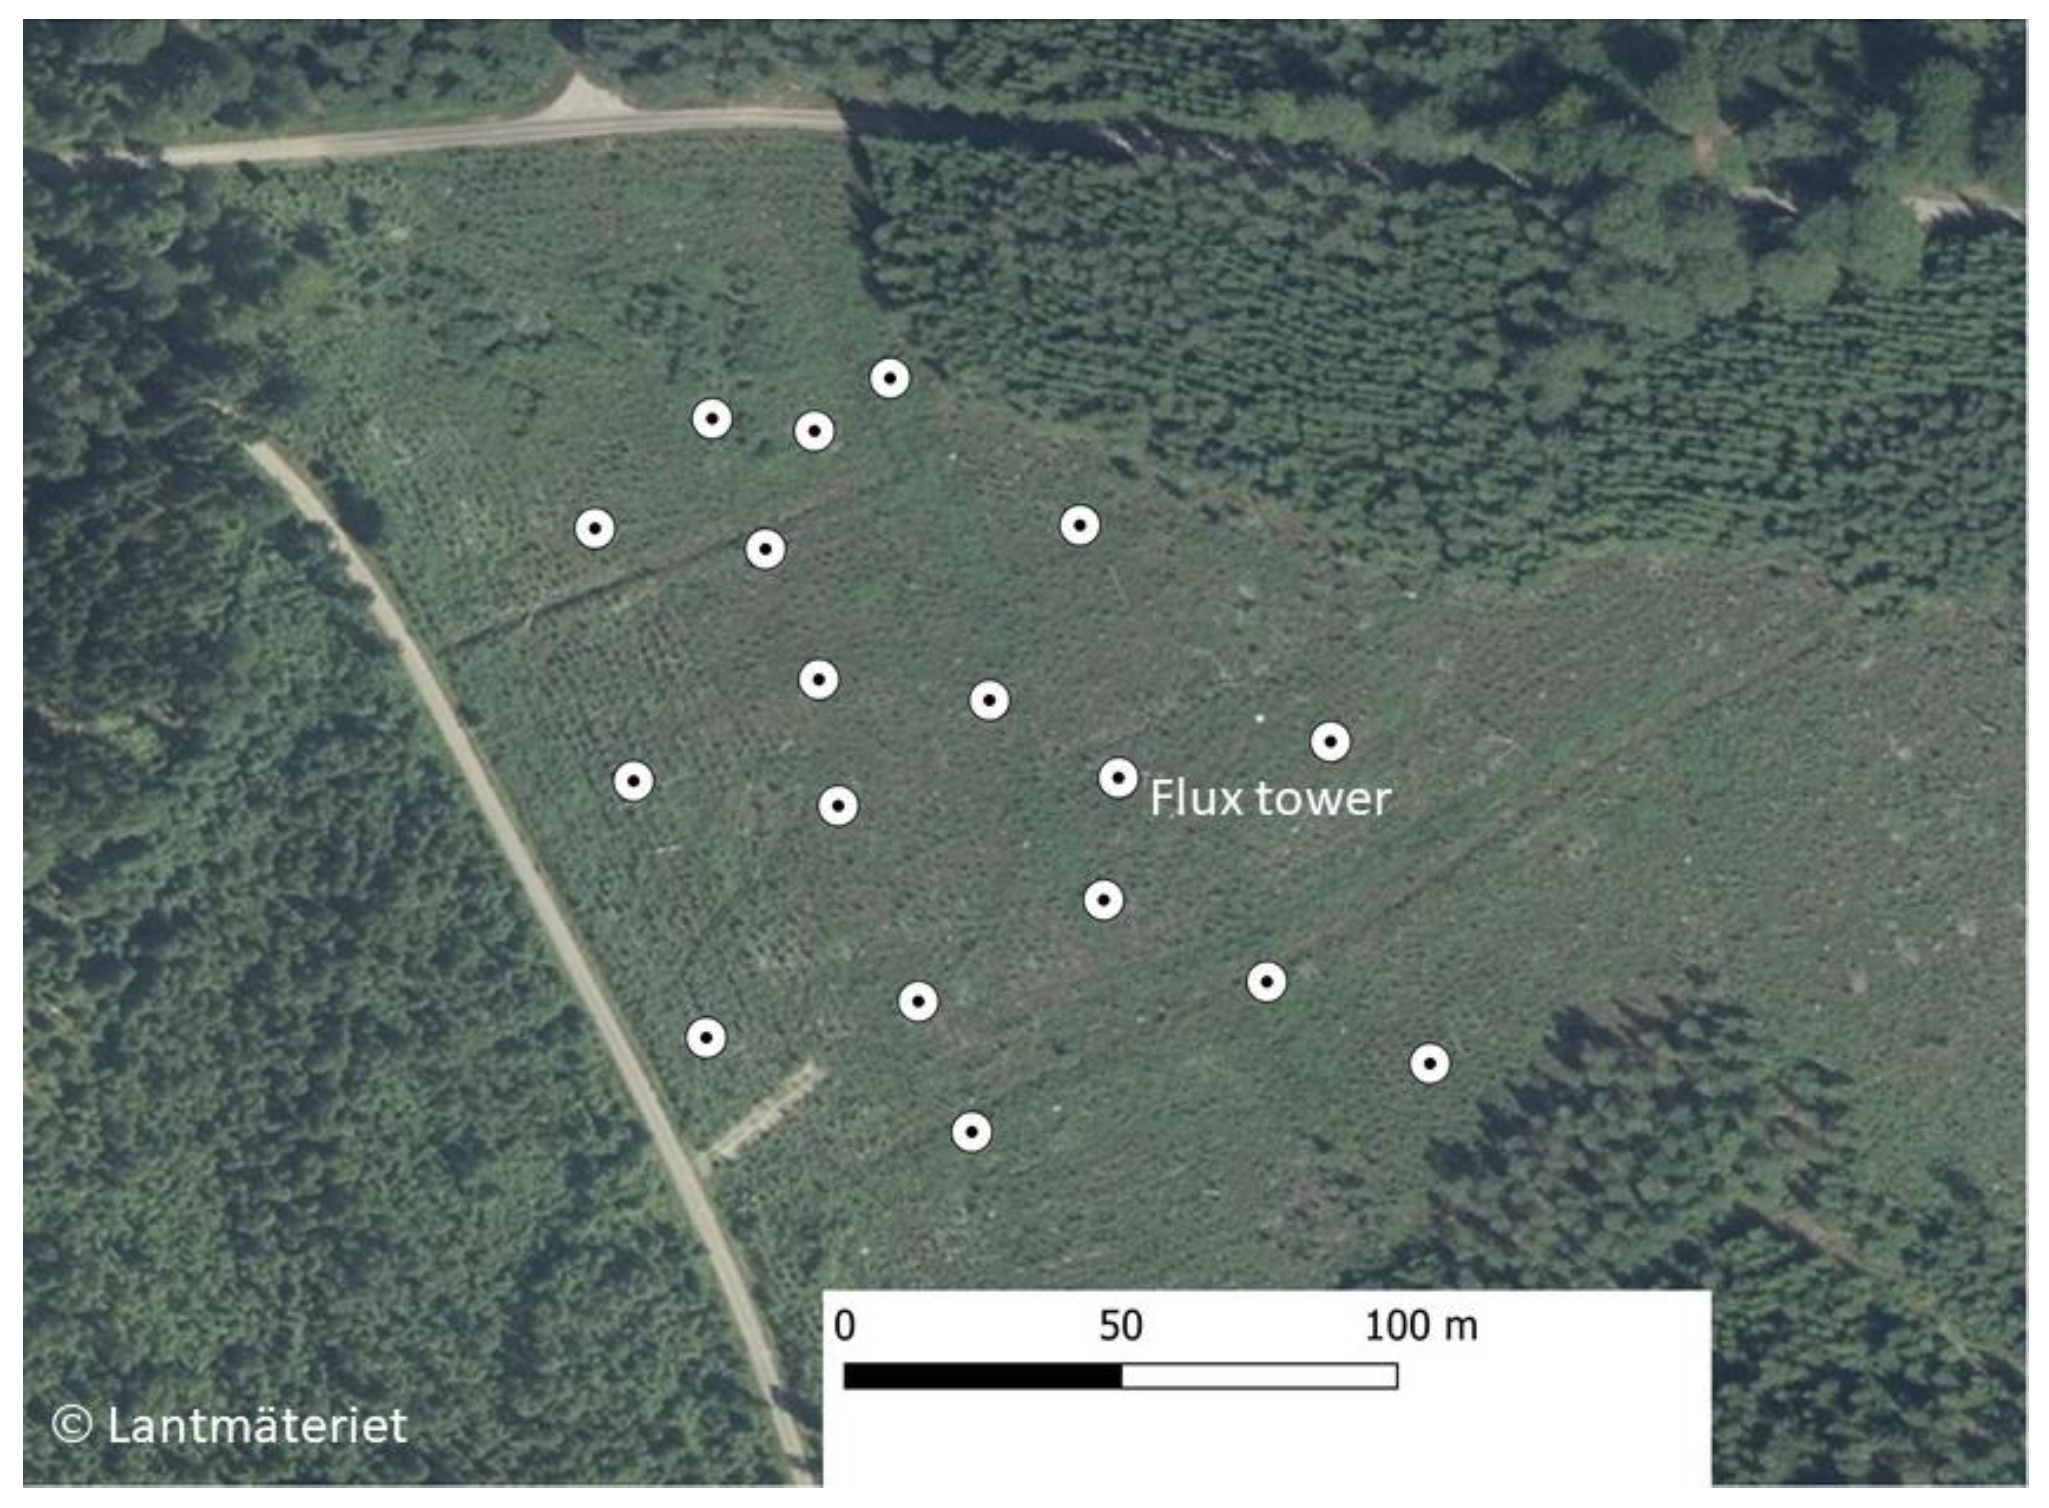
The application study took place on a five-year-old forest stand near the Hyltemossa ICOS station during noon 14 August 2020. The site was clear-cut in December 2013 and planted with Norway spruce in 2014. The eddy covariance flux tower was established in April 2015. The average tree height was about 1.8 m when the UAV mission took place. Before the mission, the geographic positions of some few remaining and standing dead trees were determined in order to avoid those during the flight. The flight was planned, and the mission was performed using the UgCS software [
19]. Eighteen waypoints (
Figure 4) were selected for the measurements which were made during 2 min at each waypoint with the UAV hovering at a 10 m height above ground. The UAV was always oriented in the same direction during the measurement at each waypoint, and since it was hovering, it was kept in a horizontal position.
2.2. Data Analyses
Before the measurements started, the clocks of both data loggers were synchronized. During the first part of the comparison, when the UAV radiation sensors were in a fixed position near the reference sensor, 10 min mean values were calculated for regression analyses. During the second part of the comparison, the last 20 s of each minute were used to calculate the mean values from the reference and the UAV sensors. This was carried out in order to allow the UAV sensors to adapt to new conditions after a 180° rotation.
During the application study at the young forest site, the last 10 s of each 2 min hovering period were used for the estimation of mean values. The reason for using only the last 10 s was to make sure that the sensors had adapted to the new conditions after moving from one waypoint to another. The following parameters were then calculated from the UAV sensors:
where
α is albedo (%),
SWout is outgoing shortwave radiation (Wm
−2) and
SWin is incoming shortwave radiation (Wm
−2). The net radiation was calculated as:
where
LWin and
LWout are incoming and outgoing longwave radiation (Wm
−2), respectively.
LWin was calculated as:
where
Ta is air temperature (K) and
ε is atmospheric clear sky emissivity calculated as [
20]:
where
ea is vapor pressure (hPa).
Ta and
ea were obtained from the flux station.
LWout was calculated as:
where
Tsk is surface temperature (K) from IR thermometer. The mission was performed over midday with the aim of having the conditions as constant as possible. However, the weather data from the flux station showed that the net radiation increased by 0.17 W m
−2 min
−1 and the air temperature increased by 0.023 °C min
−1 during the time of the flight. Therefore, the UAV-estimated net radiation and surface temperature were detrended using this information. Such detrending was not necessary for the estimation of albedo since albedo is a biophysical property of the surface. The wind speed ranged between 2.5 and 2.9 m s
−1 during the mission.
All statistical analyses and plots were made with SigmaPlot 12.5 Systat Software Inc., San Jose, CA, USA). An inverse distance interpolation method was used to produce the filled contour plots (see below).
4. Discussion
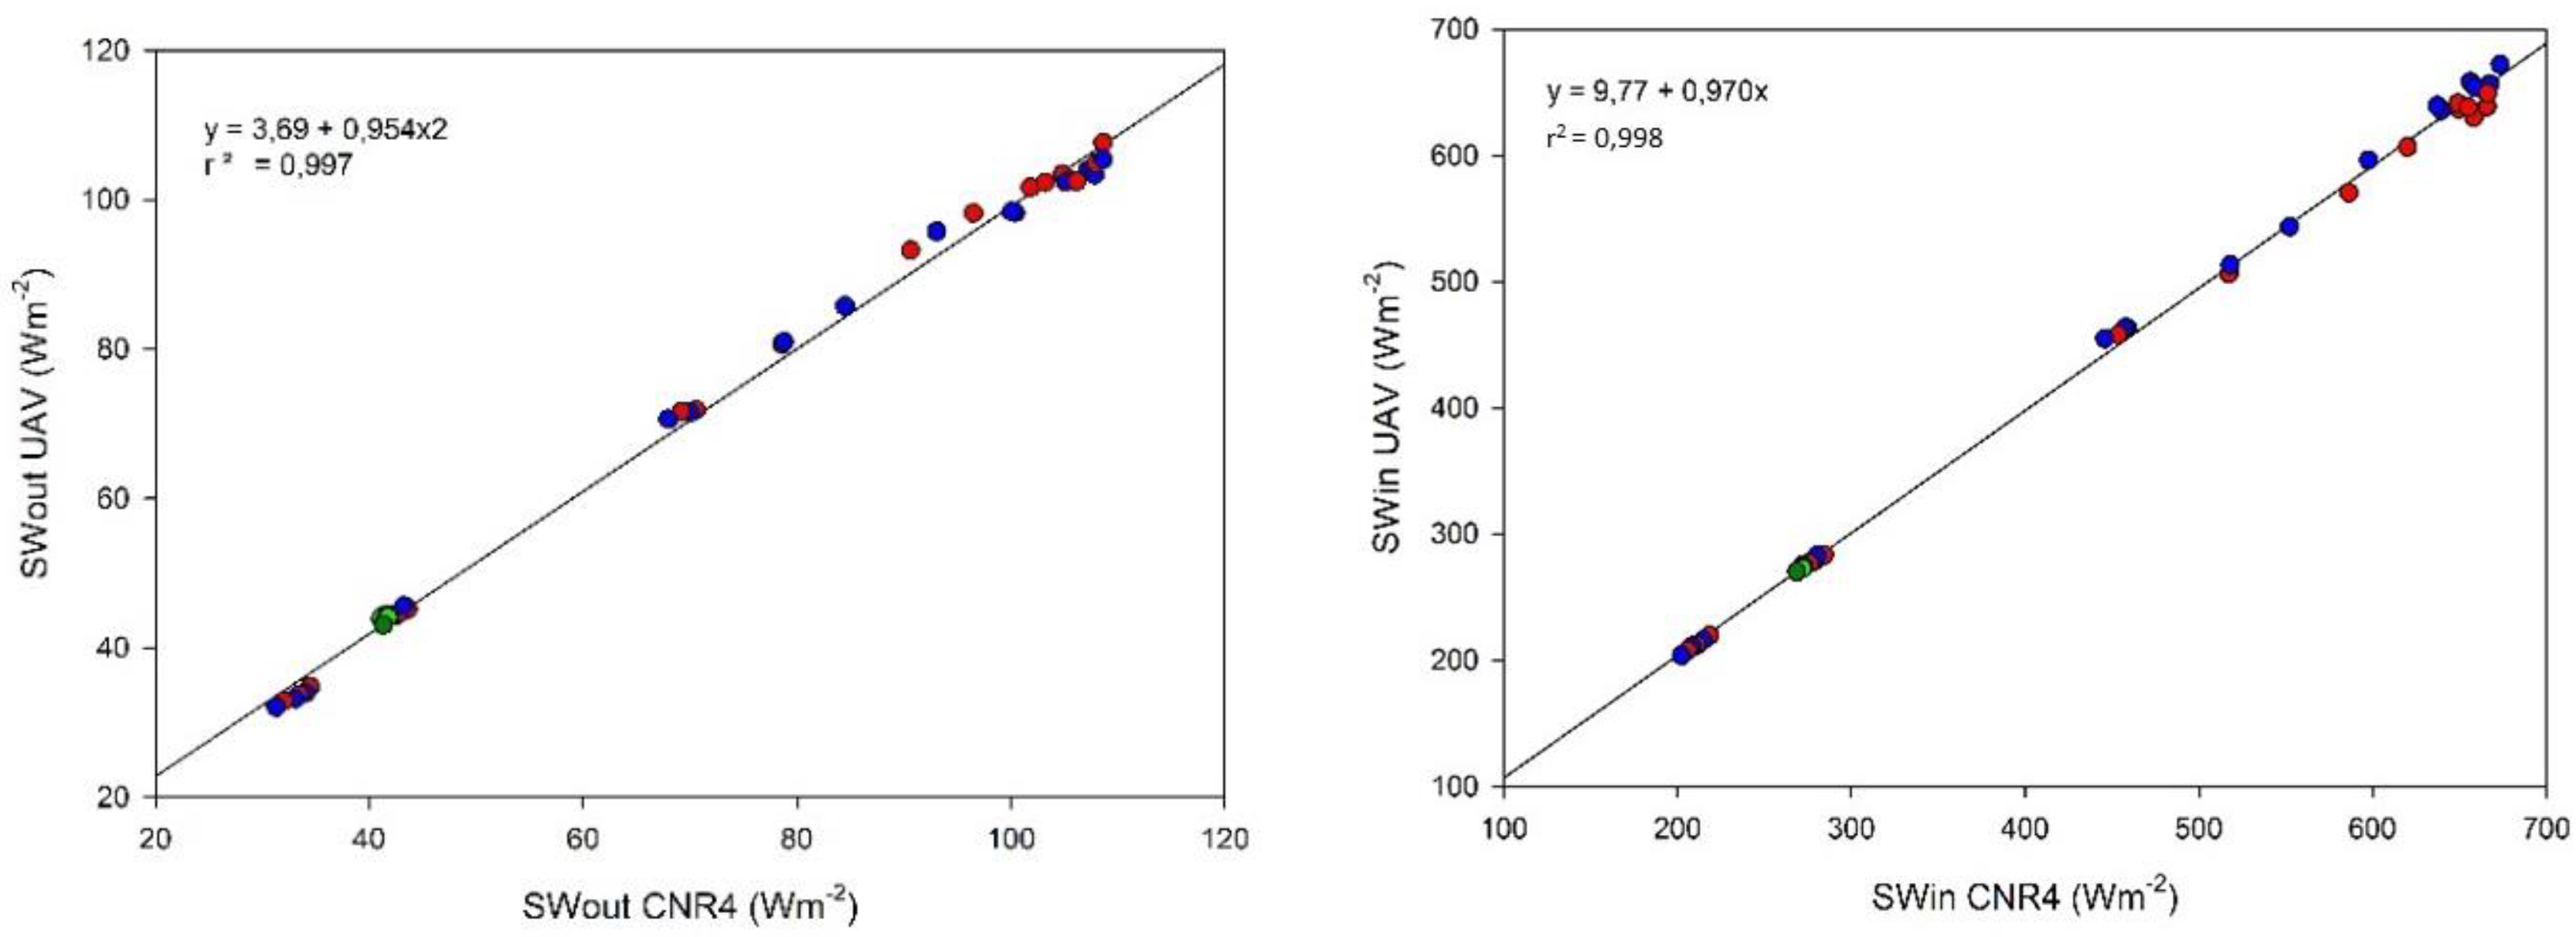
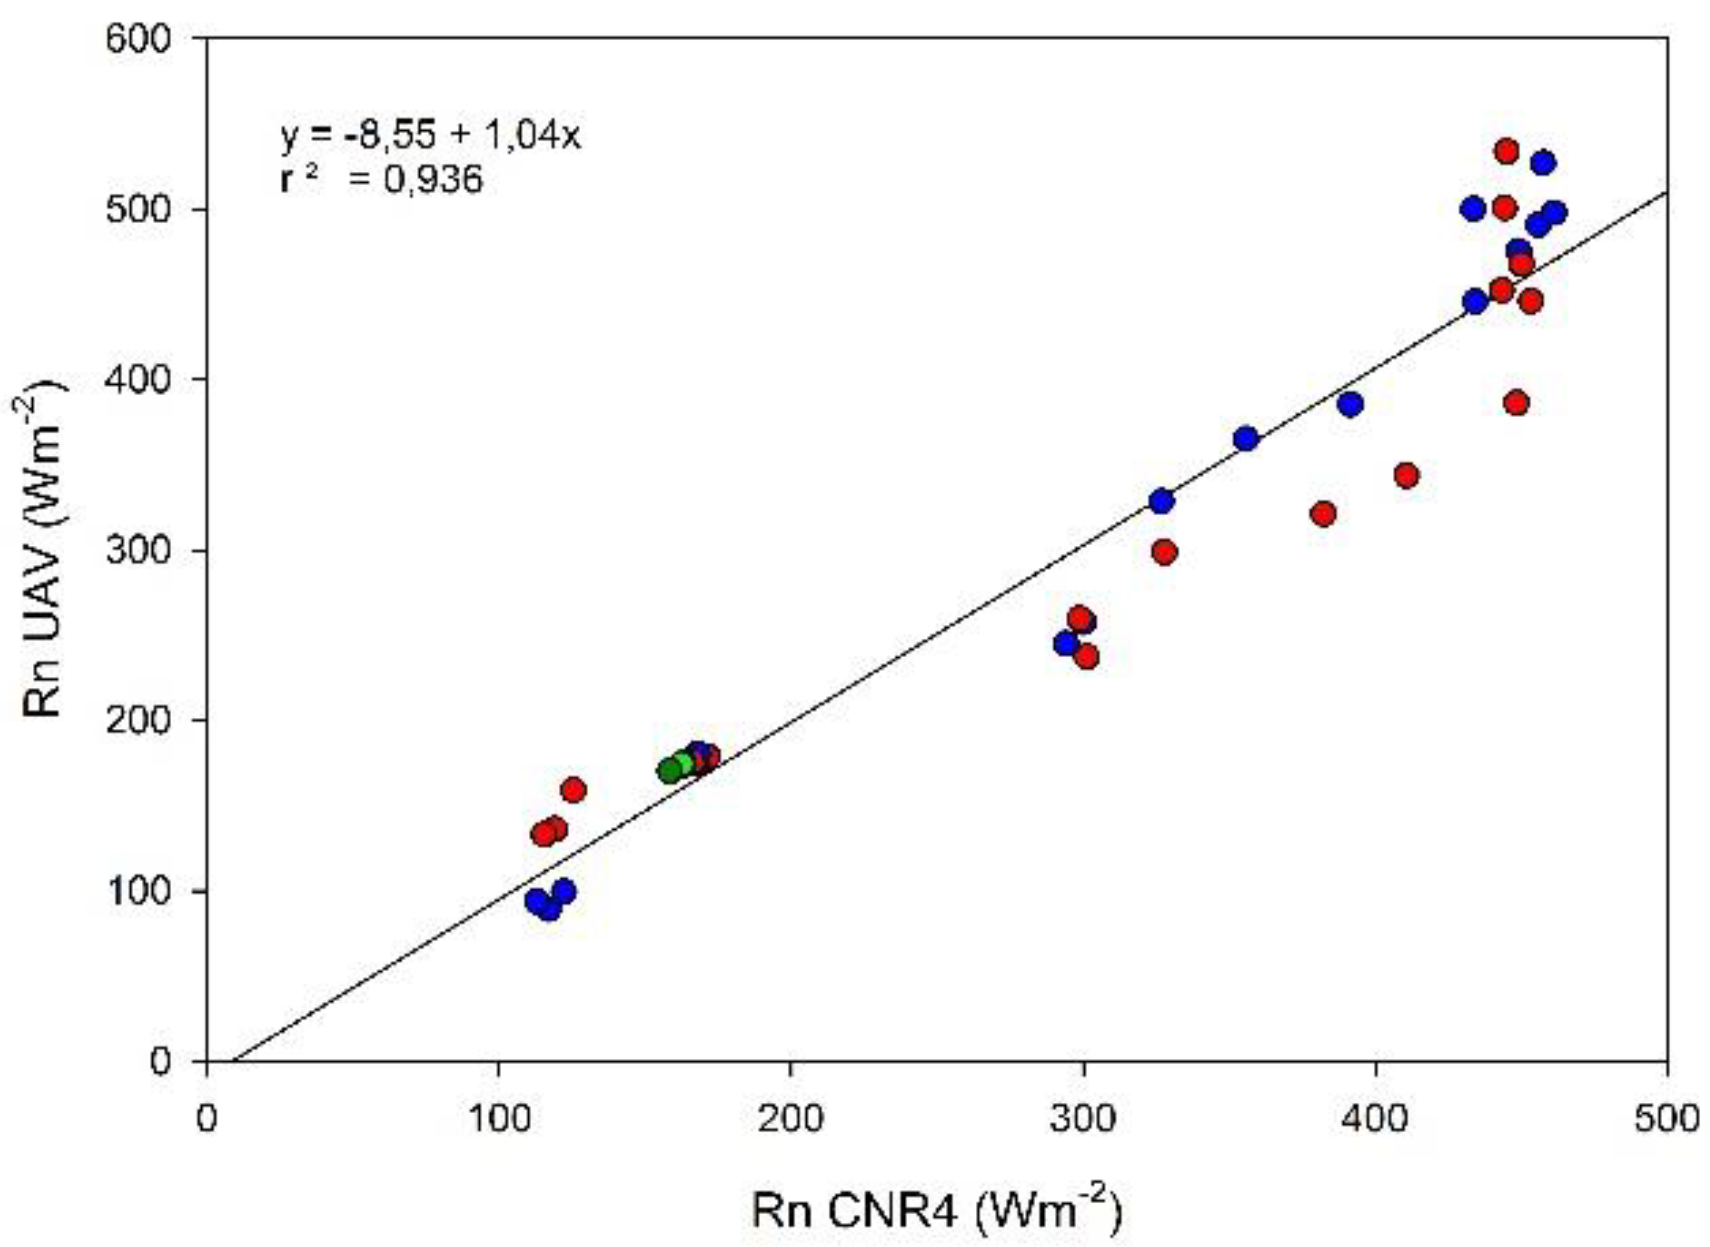
Our comparison between a fixed radiometer and the radiometers mounted on a hovering UAV provided satisfactory results concerning incoming and outgoing shortwave radiation. The results concerning the net radiometer were not satisfactory and the instrument either needs to be modified or another type of net radiometer should be used. However, the measurement of the surface temperature using an infrared thermometer, together with the air temperature and the relative humidity from a weather station, made it possible to calculate the net longwave radiation. We consider this calculation to be accurate enough since the measurements were taken at noon during clear sky conditions and, thus, with only small changes in the incoming longwave radiation.
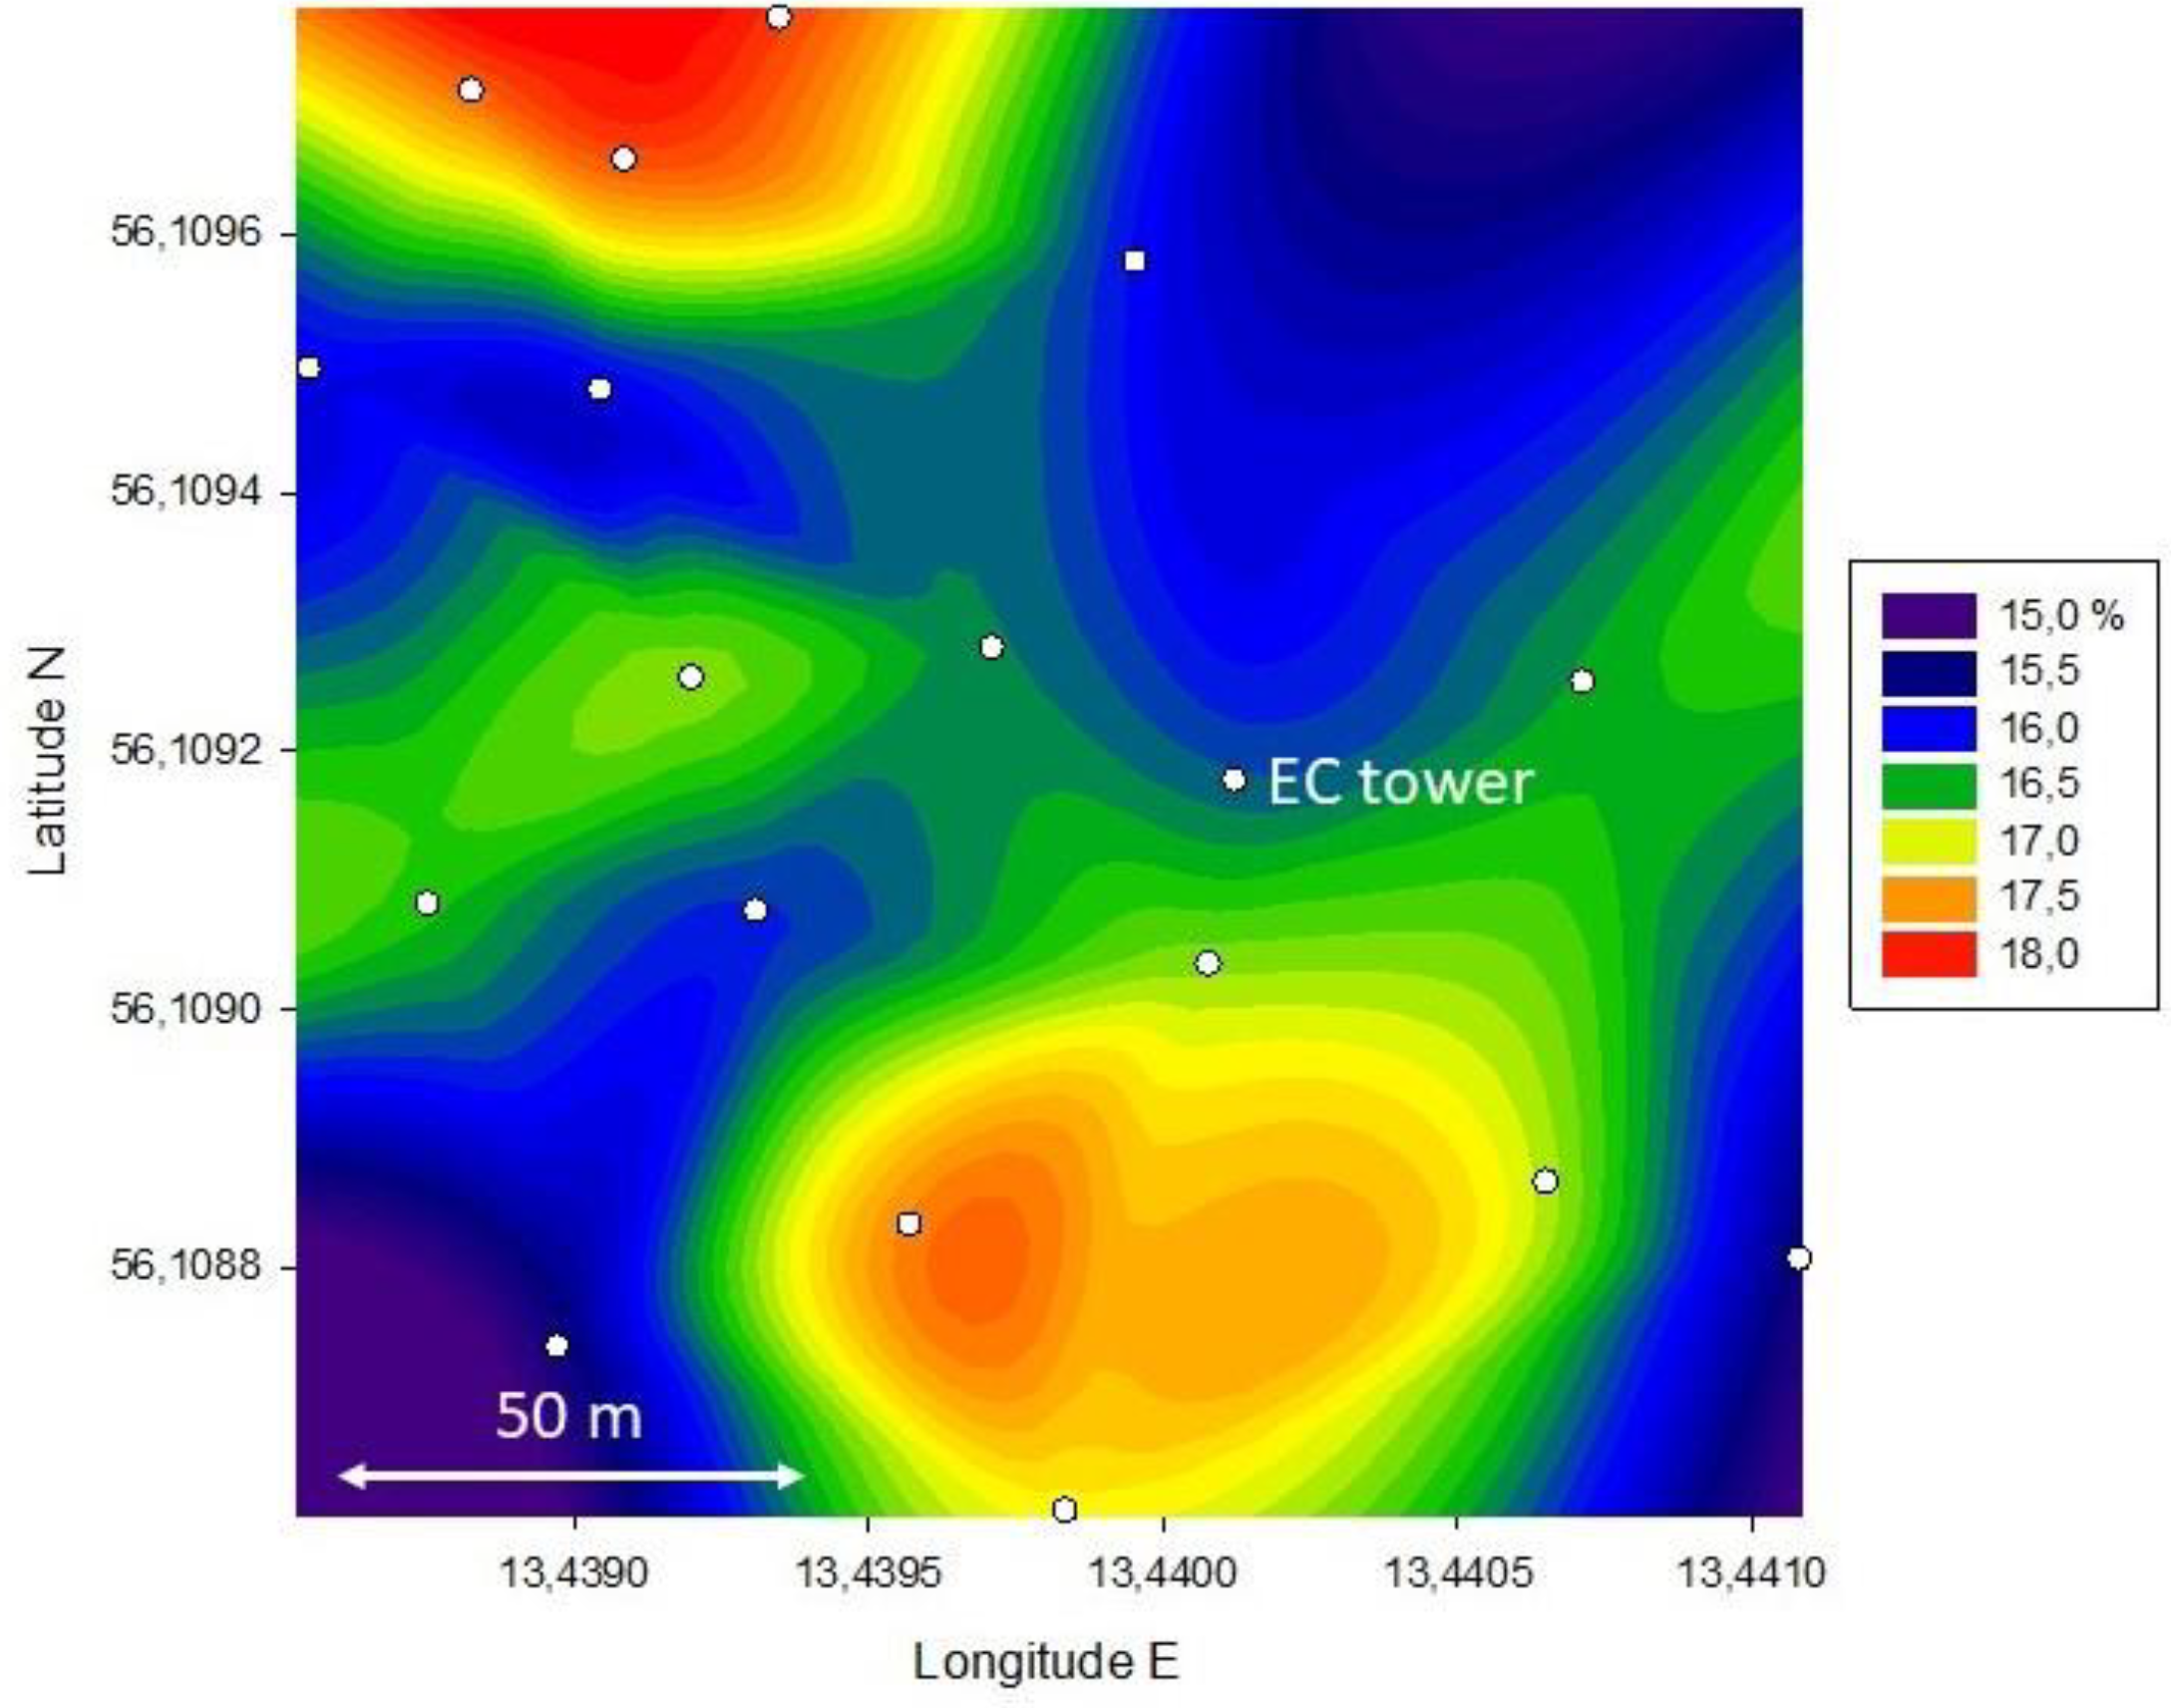
The measured albedo with a range of 15.3–17.9% is high compared to what closed mature coniferous forests typically show with values around 10%, e.g., [
20]. The reason for the higher albedo is because after a clear-cut, there is normally an abundance of forest floor vegetation consisting of grasses and bushes which dominate the cover during the first years after plantation, and such species have much higher albedo than conifers. We can expect that the variation in albedo will diminish with time as the canopy closes more and more.
The surface temperature also showed quite a large variation, most likely because of the variation in the canopy coverage and shading of the soil, and because of the variation in soil moisture. Since outgoing longwave radiation is proportional to the fourth power of absolute temperature, this has a direct impact on the variation in the net radiation, which had a span of 50 Wm
−2. This is similar to the variation in the net radiation reported by Droppo and Hamilton [
9] and Federer [
10] for deciduous stands.
Stoy et al. [
21] analyzed the energy balance closure of 173 Fluxnet sites and they found a mean closure of 0.84 ± 0.20 for all sites. The best closure was found in the evergreen broadleaf forests with 0.94 ± 0.16, and the worst was found in the crops and wetlands with a closure of about 0.76–0.78. The evergreen needleleaf forests had an average closure of 0.88 ± 0.23. An imbalance of 10–15% would, in our case, correspond to an energy deficit of 35–53 Wm
−2, which could be explained by the observed spatial variability of the net radiation (see
Figure 9) depending on the location of the flux footprint. Stoy et al. [
21] did not find a single factor that could explain the imbalances, but they suggested that future research should focus on the link between energy balance closure and landscape heterogeneity in addition to the consequences of mesoscale flow patterns for surface exchange processes. Our results indicate that heterogeneity on a local scale is also of considerable importance.
5. Conclusions
With the current set up of the UAV radiation sensors, we can conclude that we did not meet the aim of developing a fully independent surface radiation balance system in all its components since the used net radiometer was not suitable for this application. However, we have shown that incoming and outgoing shortwave radiation can be measured using pyranometers with a high accuracy, which can then provide spatial measurements of albedo on a scale relevant for flux footprints. With the aid of supplementary measurements of the air temperature and the relative humidity from a weather station, we were also able to estimate the spatial variation of the net radiation. For this particular application, a five-year-old plantation after a clear-cut, we can conclude that the spatial variation in the net radiation was of such magnitude that it could potentially explain a significant amount of energy imbalance.
A drawback of using thermal sensors is that the measurements take a relatively long time, since time for sensor adjustment must be allowed at each waypoint. This issue is not critical for the measurement of albedo since this is an inherent property of the vegetation, and because the changes in the sun elevation have little impact on the results, at least for elevations > 20° [
22]. In the future, we believe that fast multispectral sensors can be used instead, providing much faster surveys. Finally, we recommend that the spatial variability of the radiation regime over flux sites should be given greater attention in the future.


